


Languages
Pages
Legal

Economy Overview
Mesa County, CO
Mesa County Workforce Center
512 29 1/2 Road
Grand Junction, Colorado 81504
970.248.7562

2018 Data Set
Mesa County, CO has a very active community and our recreation industry and
sunny weather continue to be a draw for a lot of individuals. Mesa County has
seen a slight increase in its population since 2010. The overall economy has
started to see significant gains in labor force, lower unemployment rates, increase
in job orders, and steady increases in wages.
The purpose of this document is to supplement Mesa County’s local plan; as well as
provide you with economic projections and demographic information of Mesa
County.

Emsi Q2 2018 Data Set | www.economicmodeling.com
2017 Jan. Feb. March Apr. May June July Aug. Sept. Oct. Nov. Dec.
Unemployment Rate 5.8 5.3 3.8 3.2 3.3 3.6 3.6 3 3 3.4 3.7 4.3
Total Labor Force 70,288 71,294 71,232 71,18
7 71,94
2 71,74
9 72,21
3 72,26
3 72,28
6 72,87
4 73,16
7 73,03
6
Total Unemployed 4,057 3,767 2,714 2,259 2,350 2,583 2,618 2,199 2,200 2,457 2,728 3,151
Job Orders 408 537 563 625 675 762 817 747 669 607 643 585
Cumulative job orders 408 945 1,508 2,133 2,808 3,568 4387 5134 5,863 6,425 7,068 7,653
2018 January February March
Unemployment Rate 4.8 4.6 4
Total Labor Force 74,198 74,822 74,999
Total Unemployed 3,545 3,449 2,993
Job Orders 665 688 803
Cumulative job orders 665 1,353 2,156
Mesa County experienced lower unemployment rates, increased labor force, and increased job orders over the course of 2017 and through the first quarter of 2018. As our local economic conditions improve it is imperative that the Mesa County Workforce Center and the Workforce Development Board leverage available resources and partnerships to create and support talent pipelines to ensure we are supporting
the needs of local employers while providing the right services at the right time to our clients.
The below tables demonstrate the growth in labor force and job orders. Our job orders are up over 40%
YTD and we saw our unemployment rate hit a ten year low at 3% in August and September of 2017.

Emsi Q2 2018 Data Set | www.economicmodeling.com
Economy Overview
150,726 67,900 $50.1K
Population (2017) Jobs (2017) Median Household Income (2016)
Population grew by 3,257 over
the last 5 years and is projected
to grow by 4,156 over the next 5
years.
Jobs grew by 2,445 over the last
5 years and are projected to grow
by 3,524 over the next 5 years.
Median household income is
$5.3K below the national median
household income of $55.3K.
As of 2017 the region's population increased by 2.2%
since 2012, growing by 3,257. Population is expected
to increase by 2.8% between 2017 and 2022, adding
4,156.
From 2012 to 2017, jobs increased by 3.7% in Mesa
County, CO from 65,455 to 67,900. This change fell
short of the national growth rate of 7.9% by 4.2%. As
the number of jobs increased, the labor force
participation rate decreased from 62.5% to 59.5%
between 2012 and 2017.
Concerning educational attainment, 18.0% of Mesa
County, CO residents possess a Bachelor's Degree
(0.4% below the national average), and 8.5% hold an
Associate's Degree (0.6% above the national average).
The top three industries in 2017 are Restaurants and
Other Eating Places, General Medical and Surgical
Hospitals, and Education and Hospitals (Local
Government).

Emsi Q2 2018 Data Set | www.economicmodeling.com
Economy Overview - Cont.
Population Labor Force Cost of (2017) (2017) Jobs (2017) Living GRP Imports Exports
Region 150,726 73,036 67,900 103.8 $5.98B $6.65B $6.46B
Nation 325,401,909 159,887,109 160,157,543 100.0 $19.09T $0 $8.52T

Emsi Q2 2018 Data Set | www.economicmodeling.com
Economy Overview - Cont. 2017 Labor Force Breakdown
Population
A Total Working Age Population 122,826
A Not in Labor Force (15+) 49,790
A Labor Force 73,036
A Employed 69,885
A Unemployed 3,151
A Under 15 27,900
Educational Attainment
Concerning educational attainment, 18.0% of Mesa County, CO residents possess a Bachelor's Degree (0.4% below the
national average), and 8.5% hold an Associate's Degree (0.6% above the national average).
% of Population Population
A Less Than 9th Grade 4.5% 4,666
A 9th Grade to 12th Grade 6.4% 6,542
A High School Diploma 28.7% 29,545
A Some College 25.0% 25,708
A Associate's Degree 8.5% 8,773
A Bachelor's Degree 18.0% 18,473
A Graduate Degree and Higher 8.8% 9,092
150,726
Population

Emsi Q2 2018 Data Set | www.economicmodeling.com
Historic & Projected Trends Population Trends
As of 2017 the region's population increased by 2.2% since 2012, growing by 3,257. Population is expected to increase by
2.8% between 2017 and 2022, adding 4,156.
Timeframe Population
2012 147,469
2013 147,370
2014 147,501
2015 148,399
2016 150,081
2017 150,726
2018 151,704
2019 152,603
2020 153,430
2021 154,189
2022 154,881

Emsi Q2 2018 Data Set | www.economicmodeling.com
Historic & Projected Trends - Cont. Job Trends
From 2012 to 2017, jobs increased by 3.7% in Mesa County, CO from 65,455 to 67,900. This change fell short of the national
growth rate of 7.9% by 4.2%.
Timeframe Jobs
2012 65,455
2013 65,339
2014 67,039
2015 66,910
2016 66,866
2017 67,900
2018 68,778
2019 69,554
2020 70,259
2021 70,928
2022 71,424

Emsi Q2 2018 Data Set | www.economicmodeling.com
Historic & Projected Trends - Cont. Labor Force Participation Rate Trends
Timeframe Labor Force Participation Rate
2013 61.78%
2014 61.31%
2015 59.58%
2016 58.75%
January - October 2017 58.50%
November 2017 59.51%
December 2017 59.46%
January 2018 60.09%

Emsi Q2 2018 Data Set | www.economicmodeling.com
Historic & Projected Trends - Cont. Unemployment Rate Trends
Mesa County, CO had a January 2018 unemployment rate of 4.78%, decreasing from 8.73% 5 years before.
Timeframe Unemployment Rate
2013 8.73%
2014 6.23%
2015 5.56%
2016 5.40%
January - October 2017 3.79%
November 2017 3.73%
December 2017 4.31%
January 2018 4.78%

Emsi Q2 2018 Data Set | www.economicmodeling.com
Population Characteristics
Millennials Retiring Soon Racial Diversity
Mesa County, CO has 29,915
millennials (ages 20-34). The
national average for an area this
size is 31,146.
Retirement risk is high in Mesa
County, CO. The national average
for an area this size is 22,872
people 65 or older, while there are
26,869 here.
Racial diversity is low in Mesa
County, CO. The national average
for an area this size is 58,131
racially diverse people, while there
are 27,538 here.
Veterans Violent Crime Property Crime
Mesa County, CO has 12,179
veterans. The national average for
an area this size is 8,708.
Mesa County, CO has 3.27 violent
crimes per 1,000 people. The
national rate is 3.75 per 1,000
people.
Mesa County, CO has 28.34
property crimes per 1,000 people.
The national rate is 24.22 per
1,000 people.
28.34/1,000
3.27/1,000
12,179
29,915
26,869
27,538

Emsi Q2 2018 Data Set | www.economicmodeling.com
Population Characteristics - Cont. Place of Work vs Place of Residence
Understanding where talent in Mesa County, CO currently works compared to where talent lives can help you optimize site
decisions. For example, the #1 ranked ZIP for employment ranks #2 for resident workers. The top ZIP for resident workers is
81504.
Workers
High Inbound Commuters
High Outbound Commuters
Where Talent Works Where Talent Lives
ZIP
Name
2017 Employment
ZIP
Name
2017
81501 Grand Junction, CO (in… 25,621 81504 Grand Junction, CO (in… 13,452
81505 Grand Junction, CO (in… 15,388 81501 Grand Junction, CO (in… 9,614
81506 Grand Junction, CO (in… 6,621 81521 Fruita, CO (in Mesa co… 7,338
81504 Grand Junction, CO (in… 4,601 81503 Grand Junction, CO (in… 7,045
81521 Fruita, CO (in Mesa co… 3,852 81507 Grand Junction, CO (in… 6,874

Emsi Q2 2018 Data Set | www.economicmodeling.com
Industry Characteristics Largest Industries
Industry Jobs National Average
Health Care and Social Assistance
Government
Retail Trade
Accommodation and Food Services
Construction
Administrative and Support and Waste Management and Remediation Services
Other Services (except Public Administration)
Manufacturing
Professional, Scientific, and Technical Services
Wholesale Trade
Transportation and Warehousing
Mining, Quarrying, and Oil and Gas Extraction
Finance and Insurance
Real Estate and Rental and Leasing
Arts, Entertainment, and Recreation
Educational Services
Agriculture, Forestry, Fishing and Hunting
Information
Utilities
Management of Companies and Enterprises
0 2,000 4,000 6,000 8,000 10,000

Emsi Q2 2018 Data Set | www.economicmodeling.com
Industry Characteristics - Cont. Top Growing Industries
Industry Jobs Growth
Health Care and Social Assistance
Construction
Government
Accommodation and Food Services
Retail Trade
Manufacturing
Educational Services
Finance and Insurance
Other Services (except Public Administration)
Wholesale Trade
Arts, Entertainment, and Recreation
Real Estate and Rental and Leasing
Management of Companies and Enterprises
Utilities
0 200 400 600 800 1,000 1,200 1,400

Emsi Q2 2018 Data Set | www.economicmodeling.com
Industry Characteristics - Cont. Top Industry LQ
Industry LQ
Mining, Quarrying, and Oil and Gas Extraction
Construction
Health Care and Social Assistance
Real Estate and Rental and Leasing
Retail Trade
Accommodation and Food Services
Transportation and Warehousing
Government
Arts, Entertainment, and Recreation
Other Services (except Public Administration)
Wholesale Trade
Utilities
Agriculture, Forestry, Fishing and Hunting
Finance and Insurance
d Support and Waste Management and Remediation Services
Professional, Scientific, and Technical Services
Manufacturing
Information
Educational Services
Management of Companies and Enterprises
0.00 2.00 4.00 6.00 8.00

Emsi Q2 2018 Data Set | www.economicmodeling.com
Industry Characteristics - Cont. Top Industry GRP
2017 Gross Regional Product
Government
Health Care and Social Assistance
Mining, Quarrying, and Oil and Gas Extraction
Retail Trade
Finance and Insurance
Construction
Wholesale Trade
Manufacturing
Real Estate and Rental and Leasing
Transportation and Warehousing
Professional, Scientific, and Technical Services
Accommodation and Food Services
d Support and Waste Management and Remediation Services
Other Services (except Public Administration)
Information
Agriculture, Forestry, Fishing and Hunting
Utilities
Arts, Entertainment, and Recreation
Educational Services
Management of Companies and Enterprises
$0.000 $200.0M $400.0M $600.0M

Emsi Q2 2018 Data Set | www.economicmodeling.com
Industry Characteristics - Cont. Top Industry Earnings
2017 Earnings Per Worker
Utilities
Management of Companies and Enterprises
Mining, Quarrying, and Oil and Gas Extraction
Finance and Insurance
Wholesale Trade
Transportation and Warehousing
Professional, Scientific, and Technical Services
Government
Health Care and Social Assistance
Construction
Information
Manufacturing
Real Estate and Rental and Leasing
d Support and Waste Management and Remediation Services
Retail Trade
Agriculture, Forestry, Fishing and Hunting
Other Services (except Public Administration)
Educational Services
Accommodation and Food Services
Arts, Entertainment, and Recreation
$0 $20,000 $40,000 $60,000 $80,000 $100,000

Emsi Q2 2018 Data Set | www.economicmodeling.com
Industry Characteristics - Cont.
2012
2017
%
Change
2017
2017 Earnings
Administration)
Technical Services
Extraction
Industry Jobs Jobs Change in Jobs in Jobs LQ Per Worker 2017 GRP
Health Care and Social Assistance 9,307 10,724 1,417 +15% 1.25 $55,434 $671.95M
Government 9,940 10,544 604 +6% 1.02 $57,978 $709.73M
Retail Trade 8,076 8,482 406 +5% 1.21 $33,429 $482.60M
Accommodation and Food Services 6,286 6,715 429 +7% 1.15 $20,716 $216.64M
Construction 4,376 5,065 689 +16% 1.37 $54,458 $418.41M
Administrative and Support and
Waste Management and 3,400
Remediation Services
3,368
-32
-1%
0.80
$35,135
$161.80M
Other Services (except Public 2,974
3,098
124
+4%
0.95
$27,002
$115.76M
Manufacturing 2,737 3,086 349 +13% 0.58 $51,390 $310.78M
Professional, Scientific, and 2,727
2,604
-123
-5%
0.60
$58,447
$224.30M
Wholesale Trade 2,349 2,421 72 +3% 0.95 $62,887 $323.18M
Transportation and Warehousing 2,743 2,414 -329 -12% 1.02 $60,594 $229.65M
Mining, Quarrying, and Oil and Gas 3,588
2,176
-1,412
-39%
8.19
$92,399
$499.58M
Finance and Insurance 1,982 2,137 155 +8% 0.81 $76,333 $421.30M
Real Estate and Rental and Leasing 1,327 1,375 48 +4% 1.21 $42,296 $278.61M
Arts, Entertainment, and Recreation 1,064 1,125 61 +6% 0.96 $18,094 $34.79M

Emsi Q2 2018 Data Set | www.economicmodeling.com
Industry Characteristics - Cont.
2012
2017
% Change
2017
2017 Earnings
and Hunting
and Enterprises
Industry Jobs Jobs Change in Jobs in Jobs LQ Per Worker 2017 GRP
Educational Services 523 772 249 +48% 0.44 $26,374 $22.93M
Agriculture, Forestry, Fishing 880
719
-161
-18%
0.88
$28,242
$96.95M
Information 845 706 -139 -16% 0.56 $54,073 $110.04M
Utilities 197 210 13 +7% 0.89 $104,141 $72.35M
Management of Companies 128
152
24
+19%
0.16
$102,999
$18.77M

Emsi Q2 2018 Data Set | www.economicmodeling.com
Business Characteristics 15,299 Companies Employ Your Workers
Online profiles for your workers mention 15,299 companies as employers, with the top 10 appearing below. In the last 12
months, 1,368 companies in Mesa County, CO posted job postings, with the top 10 appearing below.
Top Companies Profiles Top Companies Posting Unique Postings
Mesa County Valley School Dis… 568
Scl Health System 920
Colorado Mesa University 508
Soliant Health, Inc 848
Kbr, Inc. 214
Mesa County Valley School Dis… 716
County of Mesa 198
Department of Veterans Affairs 715
Colorado House of Representa … 192
Comphealth Associates, Inc 639
Rocky Mountain Health Plans F… 178
Lyft, Inc. 563
City of Grand Junction 170
C.R. England, Inc. 540
Startek, Inc. 142
Pizza Hut, Inc. 464
St. Mary's Hospital, Inc. 137
Blitz Media, Inc. 376
Aspen Skiing Company, L.L.C. 133
Contract Freighters, Inc. 343

Emsi Q2 2018 Data Set | www.economicmodeling.com
Business Characteristics - Cont. Business Size
Percentage
Business Count
A 1 to 4 employees 48.9% 3,217
A 5 to 9 employees 23.1% 1,520
A 10 to 19 employees 14.7% 964
A 20 to 49 employees 8.9% 588
A 50 to 99 employees 3.0% 198
A 100 to 249 employees 0.9% 59
A 250 to 499 employees 0.3% 21
A 500+ employees 0.2% 12
*Business Data by DatabaseUSA.com is third-party data provided by Emsi to its customers as a convenience, and Emsi does not endorse or warrant its
accuracy or consistency with other published Emsi data. In most cases, the Business Count will not match total companies with profiles on the summary tab.
Emsi Q2 2018 Data Set | www.economicmodeling.com
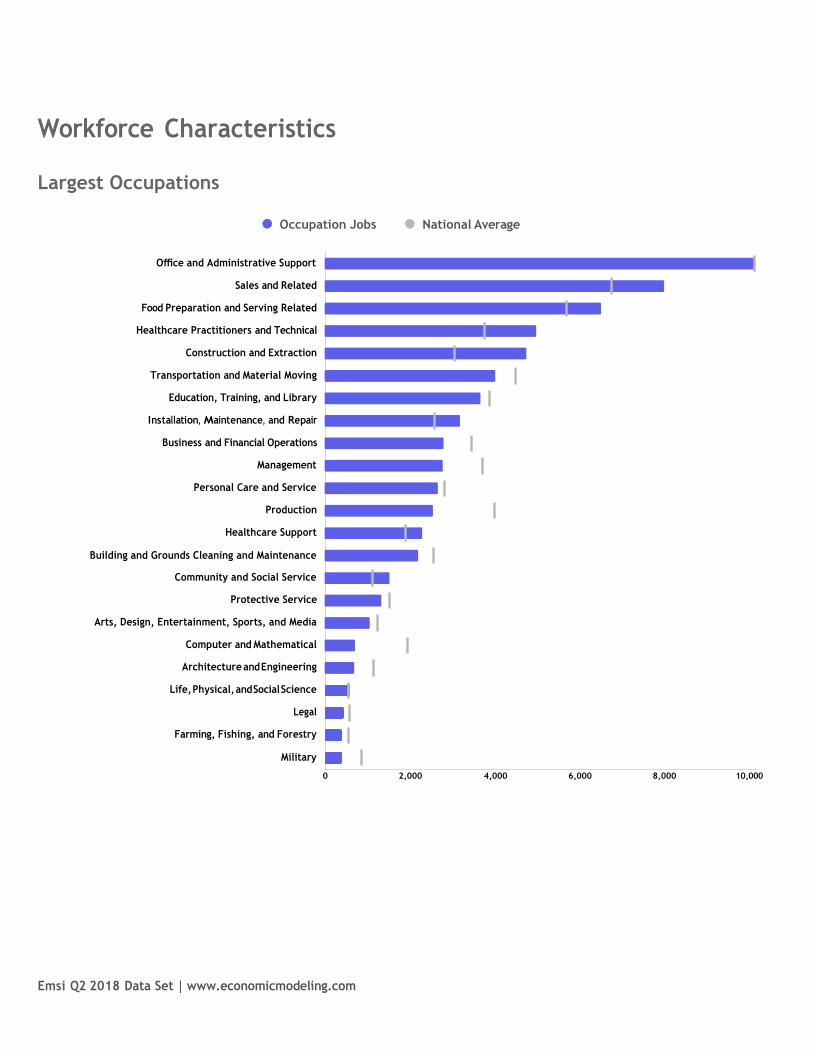
Workforce Characteristics Largest Occupations
Occupation Jobs National Average
Office and Administrative Support
Sales and Related
Food Preparation and Serving Related
Healthcare Practitioners and Technical
Construction and Extraction
Transportation and Material Moving
Education, Training, and Library
Installation, Maintenance, and Repair
Business and Financial Operations
Management
Personal Care and Service
Production
Healthcare Support
Building and Grounds Cleaning and Maintenance
Community and Social Service
Protective Service
Arts, Design, Entertainment, Sports, and Media
Computer and Mathematical
Architecture and Engineering
Life, Physical, and Social Science
Legal
Farming, Fishing, and Forestry
Military
0 2,000 4,000 6,000 8,000 10,000

Emsi Q2 2018 Data Set | www.economicmodeling.com
Workforce Characteristics - Cont. Top Growing Occupations
Occupation Jobs Growth
Healthcare Practitioners and Technical
Office and Administrative Support
Food Preparation and Serving Related
Education, Training, and Library
Healthcare Support
Community and Social Service
Sales and Related
Building and Grounds Cleaning and Maintenance
Personal Care and Service
Business and Financial Operations
Production
Protective Service
Computer and Mathematical
Military
Arts, Design, Entertainment, Sports, and Media
Installation, Maintenance, and Repair
0 100 200 300 400 500 600

Emsi Q2 2018 Data Set | www.economicmodeling.com
Workforce Characteristics - Cont. Top Occupation LQ
Occupation LQ
Construction and Extraction
Community and Social Service
Healthcare Practitioners and Technical
Installation, Maintenance, and Repair
Healthcare Support
Sales and Related
Food Preparation and Serving Related
Life, Physical, and Social Science
Office and Administrative Support
Education, Training, and Library
Personal Care and Service
Transportation and Material Moving
Protective Service
Arts, Design, Entertainment, Sports, and Media
Building and Grounds Cleaning and Maintenance
Legal
Business and Financial Operations
Farming, Fishing, and Forestry
Management
Production
Architecture and Engineering
Military
Computer and Mathematical
0.00 0.20 0.40 0.60 0.80 1.00 1.20 1.40

Emsi Q2 2018 Data Set | www.economicmodeling.com
Workforce Characteristics - Cont. Top Occupation Earnings
2016 Avg. Hourly Earnings
Management
Healthcare Practitioners and Technical
Architecture and Engineering
Computer and Mathematical
Legal
Life, Physical, and Social Science
Business and Financial Operations
Protective Service
Installation, Maintenance, and Repair
Education, Training, and Library
Construction and Extraction
Community and Social Service
Sales and Related
Transportation and Material Moving
Production
Arts, Design, Entertainment, Sports, and Media
Military
Office and Administrative Support
Healthcare Support
Farming, Fishing, and Forestry
Building and Grounds Cleaning and Maintenance
Personal Care and Service
Food Preparation and Serving Related
$0.00 $10.00 $20.00 $30.00 $40.00

Emsi Q2 2018 Data Set | www.economicmodeling.com
Workforce Characteristics - Cont. Top Posted Occupations
Unique Average Monthly Postings
Healthcare Practitioners and Technical
Transportation and Material Moving
Sales and Related
Office and Administrative Support
Food Preparation and Serving Related
Management
Installation, Maintenance, and Repair
Healthcare Support
Business and Financial Operations
Arts, Design, Entertainment, Sports, and Media
Education, Training, and Library
Community and Social Service
Construction and Extraction
Life, Physical, and Social Science
Computer and Mathematical
Personal Care and Service
Protective Service
Building and Grounds Cleaning and Maintenance
Production
Architecture and Engineering
Legal
Military
0 200 400 600

Emsi Q2 2018 Data Set | www.economicmodeling.com
Office and
Food Preparation and
Healthcare Practitioners
Construction and
Transportation and
Education, Training, and
Business and Financial
Personal Care and
Community and Social
Workforce Characteristics - Cont.
Occupation
2012 Jobs
2017 Jobs Change in Jobs
%
Change in Jobs
2017 LQ
2016 Avg.
Hourly Earnings
Mar 2017 - Feb 2018
Unique Average Monthly Postings
Administrative Support 9,625 10,159 534 +6% 1.00 $16.43 262
Sales and Related 7,804 8,005 201 +3% 1.19 $18.95 524
Serving Related 6,005 6,512 507 +8% 1.14 $10.68 261
and Technical 4,351 5,001 650 +15% 1.34 $39.51 774
Extraction 5,065 4,760 -305 -6% 1.57 $21.09 48
Material Moving 4,439 4,029 -410 -9% 0.90 $17.71 758
Library 3,332 3,682 350 +11% 0.95 $21.59 52
Installation,
Maintenance, and
Repair
3,194 3,199 5 +0% 1.24 $21.66 124
Operations 2,705 2,808 103 +4% 0.82 $30.74 54
Management 2,854 2,795 -59 -2% 0.76 $40.29 138
Service 2,516 2,667 151 +6% 0.95 $11.10 36
Production 2,473 2,558 85 +3% 0.64 $17.65 28
Healthcare Support 2,024 2,301 277 +14% 1.23 $14.22 69
Building and Grounds
Cleaning and
Maintenance
2,001 2,199 198 +10% 0.87 $13.12 36
Service 1,285 1,519 234 +18% 1.37 $20.96 52
Emsi Q2 2018 Data Set | www.economicmodeling.com
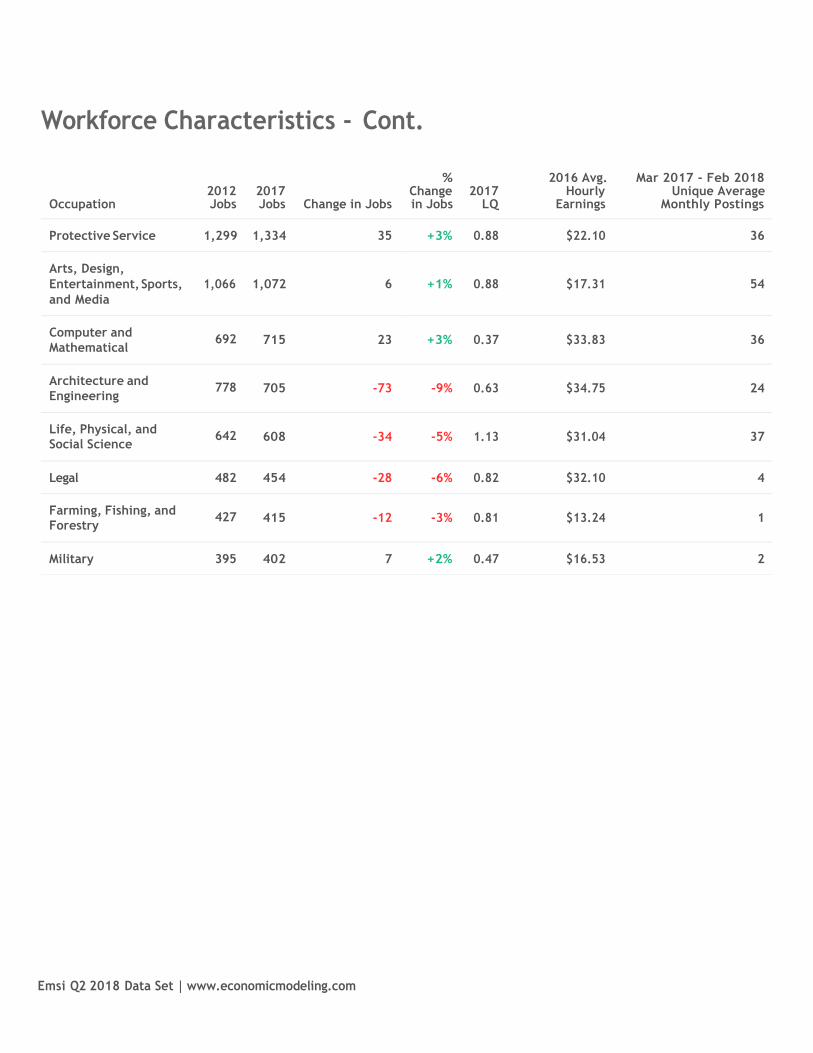
Workforce Characteristics - Cont.
2012
2017
Change
2017
Hourly
Unique Average
Mathematical
Engineering
Social Science
Forestry
% 2016 Avg. Mar 2017 - Feb 2018
Occupation Jobs Jobs Change in Jobs in Jobs LQ Earnings Monthly Postings
Protective Service 1,299 1,334 35 +3% 0.88 $22.10 36
Arts, Design,
Entertainment, Sports, 1,066
and Media
1,072
6
+1%
0.88
$17.31
54
Computer and 692
715
23
+3%
0.37
$33.83
36
Architecture and 778
705
-73
-9%
0.63
$34.75
24
Life, Physical, and 642
608
-34
-5%
1.13
$31.04
37
Legal 482 454 -28 -6% 0.82 $32.10 4
Farming, Fishing, and 427
415
-12
-3%
0.81
$13.24
1
Military 395 402 7 +2% 0.47 $16.53 2
Emsi Q2 2018 Data Set | www.economicmodeling.com
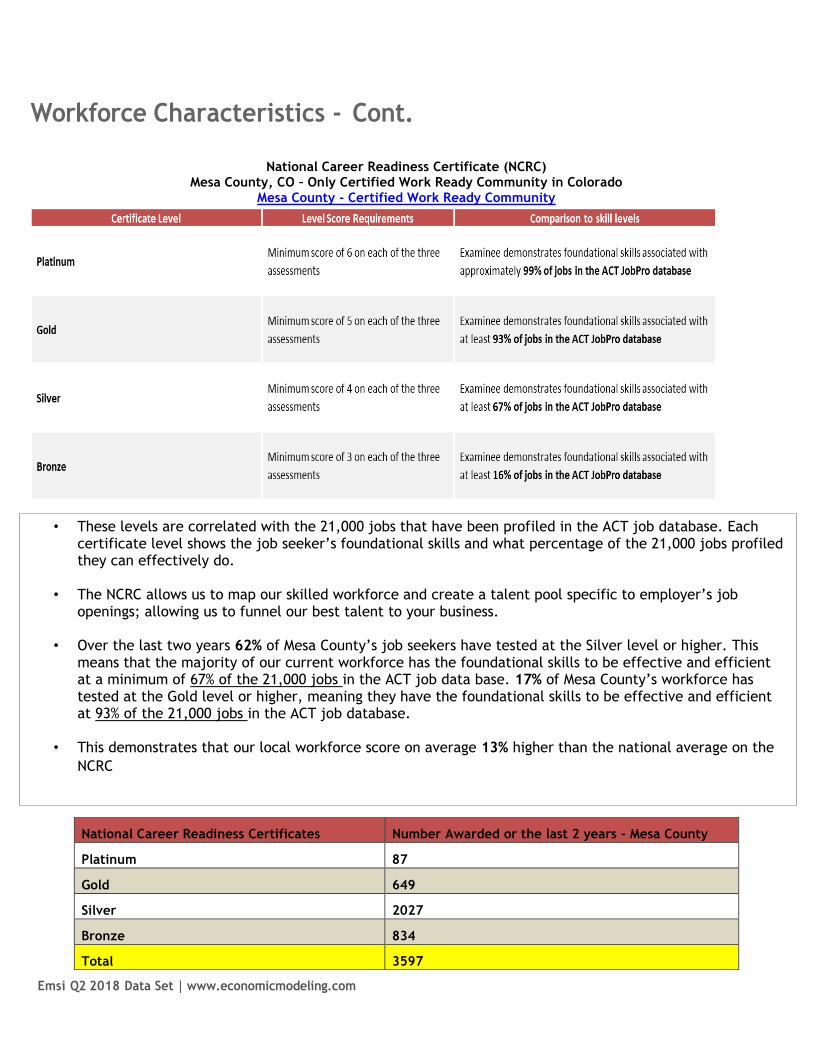
Workforce Characteristics - Cont.
National Career Readiness Certificate (NCRC) Mesa County, CO – Only Certified Work Ready Community in Colorado
Mesa County - Certified Work Ready Community
National Career Readiness Certificates Number Awarded or the last 2 years – Mesa County
Platinum 87
Gold 649
Silver 2027
Bronze 834
Total 3597
• These levels are correlated with the 21,000 jobs that have been profiled in the ACT job database. Each certificate level shows the job seeker’s foundational skills and what percentage of the 21,000 jobs profiled they can effectively do.
• The NCRC allows us to map our skilled workforce and create a talent pool specific to employer’s job
openings; allowing us to funnel our best talent to your business.
• Over the last two years 62% of Mesa County’s job seekers have tested at the Silver level or higher. This means that the majority of our current workforce has the foundational skills to be effective and efficient at a minimum of 67% of the 21,000 jobs in the ACT job data base. 17% of Mesa County’s workforce has tested at the Gold level or higher, meaning they have the foundational skills to be effective and efficient at 93% of the 21,000 jobs in the ACT job database.
• This demonstrates that our local workforce score on average 13% higher than the national average on the
NCRC

Emsi Q2 2018 Data Set | www.economicmodeling.com
Educational Pipeline
In 2016, there were 2,154 graduates in Mesa County, CO. This pipeline has grown by 31% over the last 5 years. The highest
share of these graduates come from Medical/Clinical Assistant, "Business/Commerce, General", and Kinesiology and Exercise
Science.
School
Total Graduates (2016)
Graduate Trend (2012 - 2016)
Colorado Mesa University 1,789
Intellitec College-Grand Junction 309
The Salon Professional Academy-Grand
Junction
Certificate Associate's Bachelor's Master's or Higher
56

Emsi Q2 2018 Data Set | www.economicmodeling.com
Appendix A - Data Sources and Calculations
Industry Data
Emsi industry data have various sources depending on the class of worker. (1) For QCEW Employees, Emsi primarily uses
the QCEW (Quarterly Census of Employment and Wages), with supplemental estimates from County Business Patterns. (2)
Non-QCEW employees data are based on a number of sources including QCEW, Current Employment Statistics, County
Business Patterns, BEA State and Local Personal Income reports, the National Industry-Occupation Employment Matrix
(NIOEM), the American Community Survey, and Railroad Retirement Board statistics. (3) Self-Employed and Extended
Proprietor classes of worker data are primarily based on the American Community Survey, Nonemployer Statistics, and BEA
State and Local Personal Income Reports. Projections for QCEW and Non-QCEW Employees are informed by NIOEM and
long-term industry projections published by individual states.
State Data Sources
This report uses state data from the following agencies: Colorado Department of Labor and Employment
Work Ready Community Data
https://www.workreadycommunities.org/
Top Related