

Languages
Pages
Legal

Education in the Middle East& North Africa: A Strategy Towards
Learning for Development
Human Development SectorMiddle East & North Africa Region

HUMAN DEVELOPMENT NETWORK 1
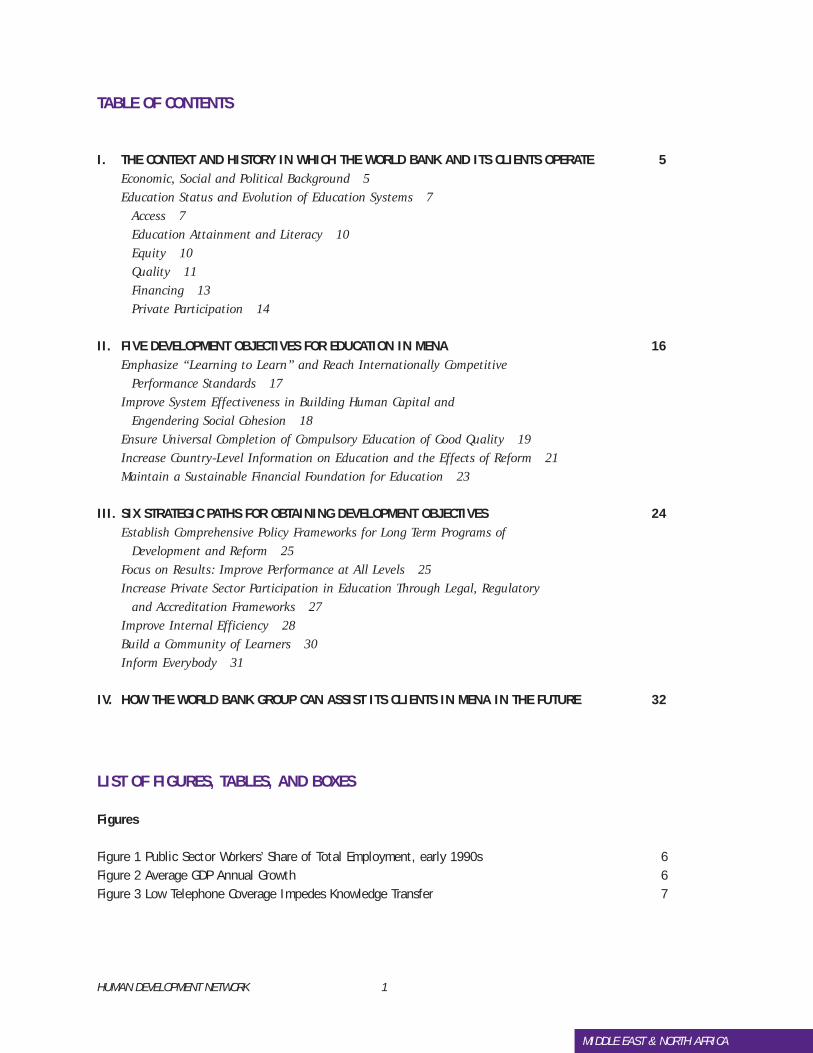
TABLE OF CONTENTS
I. THE CONTEXT AND HISTORY IN WHICH THE WORLD BANK AND ITS CLIENTS OPERATE 5Economic, Social and Political Background 5Education Status and Evolution of Education Systems 7
Access 7Education Attainment and Literacy 10Equity 10Quality 11Financing 13Private Participation 14
II. FIVE DEVELOPMENT OBJECTIVES FOR EDUCATION IN MENA 16Emphasize “Learning to Learn” and Reach Internationally Competitive
Performance Standards 17Improve System Effectiveness in Building Human Capital and
Engendering Social Cohesion 18Ensure Universal Completion of Compulsory Education of Good Quality 19Increase Country-Level Information on Education and the Effects of Reform 21Maintain a Sustainable Financial Foundation for Education 23
III. SIX STRATEGIC PATHS FOR OBTAINING DEVELOPMENT OBJECTIVES 24Establish Comprehensive Policy Frameworks for Long Term Programs of
Development and Reform 25Focus on Results: Improve Performance at All Levels 25Increase Private Sector Participation in Education Through Legal, Regulatory
and Accreditation Frameworks 27Improve Internal Efficiency 28Build a Community of Learners 30Inform Everybody 31
IV. HOW THE WORLD BANK GROUP CAN ASSIST ITS CLIENTS IN MENA IN THE FUTURE 32
LIST OF FIGURES, TABLES, AND BOXES
Figures
Figure 1 Public Sector Workers’ Share of Total Employment, early 1990s 6Figure 2 Average GDP Annual Growth 6Figure 3 Low Telephone Coverage Impedes Knowledge Transfer 7
MIDDLE EAST & NORTH AFRICA
2 HUMAN DEVELOPMENT NETWORK
Figure 4 Demographic Trends: Ages 5–14 (000s) 9Figure 5 Adults’ Average Year of Schooling—various years 9Figure 6 Urbanization and Literacy Rates, 1995 10Figure 7 Children Age 6-10 Out of School 11Figure 8 School Attendance by Income Level 12Figure 9 Number of Girls Enrolled for Every 10 Boys Enrolled 12Figure 10 School Leaving Examinations for Mathematics in the Region Emphasize Rote Learning 13Figure 11 Public Education Expenditures as a Share of GNP, 1980–1995 14Figure 12 Per Student Current Expenditure in Primary and Secondary (US$), mid-1990s 15Figure 13 Private Sector Share of Total Enrollments, early 1990s 16Figure 14 Policy Distortion, Education, and GDP Growth in Sixty Developing Countries, 1965–87 19Figure 15 Unemployment Rates: Total and Among Workers with at Least Secondary Education,
early 1990s 20Figure 16 Share of Children Aged 7–12 Enrolled in School by Expenditure Quintile,
Gender and Locale, Morocco, 1990–91 21Figure 17 Public Education Expenditure as Share of GDP, mid-1990s 24Figure 18 Public Education Spending as Share of GDP: Slow GDP Growth
and High Unit Cost Scenario, 2010 25Figure 19 MENA Education Lending, FY87–00 32Figure 20 MENA Education Lending by Subsector (US$), FY90–98 33
Tables
Table 1 Education Indicators 8Table 2 Key Objectives and Strategic Paths: How They Relate 31
Boxes
Box 1 Emphasizing Relevance in Tertiary Technical Education Through Link with Enterprises 15Box 2 Systematic Reform Effort Reinforces Itself Through Information and Evaluation 22Box 3 Strong Willingness to Pay for Education Throughout the Region 24Box 4 Strategic Framework for Long Term Sector Planning in Egypt 26Box 5 Public-Private Partnership to Improve Technical Training 29
MIDDLE EAST & NORTH AFRICA
HUMAN DEVELOPMENT NETWORK 3
MIDDLE EAST & NORTH AFRICA
FOREWORD
Education is a cornerstone of development, thefoundation on which much of economic and socialwell being is built. It is key to increasing econom-ic productivity and social cohesion. By increasingthe value and efficiency of their labor, it helps toraise the poor from poverty; by increasing theoverall productivity and intellectual flexibility ofthe labor force, it helps to ensure that a country iscompetitive in world markets characterized bychanging technologies and production methods; byincreasing a child’s integration with disparatesocial or ethnic groups early in life, it contributessignificantly to nation building and interpersonaltolerance.
The past decades have seen remarkable expansionsin access to basic education throughout the MiddleEast and North Africa. Many countries are nowpoised to further increase access to secondary andhigher education and to effect dramatic improve-ments in the quality of education offered at all lev-els. But countries in the Middle East and NorthAfrica face an unusual set of challenges that thisreport discusses.
One challenge facing countries in the Middle Eastand North Africa is born of the region’s successover the past decades. In most countries, centralgovernments made great efforts to extend accessto basic education to all children while also dra-matically expanding tuition-free post–basic educa-tion. As increasing numbers of students completebasic education, their demand for higher levels issimilarly increasing. Public expenditures for educa-tion are rising exponentially and will soon beunsustainable. Creative solutions to the problemspresented by the financing challenge will be need-ed, including allowing a greater role for the privatesector, relying more on local communities forschool management, and using technological solu-tions for delivery of higher education.
A second challenge is increasing the educationalattainment of girls and women, particularly amongthe poor. Girls’ education is probably the singlemost effective investment a developing countrycan make, whether or not women work outside thehome. It creates a host of positive benefits forfamilies including better family health and nutri-tion, improved birth spacing, lower infant andchild mortality and morbidity, and enhanced edu-cational attainment of children.
Countries in the Middle East and North Africa areincreasingly integrated in world markets for manu-factured goods. Their ability to compete in thesemarkets and in globalizing service markets willdepend on the quality of human capital they bringto the competition. Ensuring that all citizens areliterate and numerate, that many possess a widerange of problem solving skills beyond that basiclevel, and that some have world class professionalskills will require new curricula, improved teachertraining programs, and pedagogic methods thatencourage higher order cognitive skills. Thesedemanding education reforms are crucial but oftendifficult to implement.
Building on the achievements of the past threedecades, all countries in the Middle East and NorthAfrica can use their education systems to continuedeveloping internationally competitive human cap-ital, extending social cohesion, and catalyzing fur-ther improvements in all aspects of social wellbeing. This report will serve as a valuable resourceto countries as they identify strategies in educa-tional development to meet the challenges ahead.
Kemal DervisVice President
Middle East & North Africa RegionThe World Bank
~
4 HUMAN DEVELOPMENT NETWORK
MIDDLE EAST & NORTH AFRICA
ACKNOWLEDGEMENTS
This regional Education Sector Strategy Note is one of six regional notes prepared as background for the Bankwide1998 Education Sector Strategy Paper. It was prepared by the Education Team of the Middle East and North AfricaRegion's Human Development Group: Marlaine Lockheed (Sector Leader), Jon Avins (Human Resources Economist), MaeChu Chang (Principal Education Specialist), Bill Darnell (Education Management Specialist), Vasilios Demetriou (SeniorImplementation Specialist), Mourad Ezzine (Senior Human Resources Specialist), Patricia Maughan (OperationsOfficer), Beniot Millot (Principal Operations Officer), Meskerem Mulatu (Human Resources Specialist), Mari Parker(Consultant), Dung-Kim Pham (Operations Analyst), Francis Steier (Senior Education Economist), Takako Yuki(Consultant). Jane Schubert (Consultant) and Willem van Eeghen (Senior Economist, MNSED) made significant con-tributions, and Sue Berryman (ECSHD) and Stephen Heyneman (ECSHD) provided valuable comments. Karine Pezzaniformatted the tables, graphs and many draft versions of the paper.
A draft of this paper was discussed at a regional meeting of UNICEF education officers and other experts in Muscat,Oman on May 18, 1998 and at a regional consultation meeting organized by UNESCO in Beirut, Lebanon on July 2–4,1998. Special thanks are due to Frank Dall, Regional Advisor for UNICEF in Amman and Victor Billeh, Regional Directorfor UNESCO in Beirut. A revised draft version was distributed and discussed at the Mediterranean Development ForumII meeting in Marrakech, Morocco, September 3–6, 1998.
HUMAN DEVELOPMENT NETWORK 5
I. THE CONTEXT AND HISTORY IN WHICH THE WORLD BANK AND ITSCLIENTS OPERATE
Economic, Social and Political Background
The Middle East and North Africa (MENA) regionof the World Bank comprises 19 countries1 thatabut and control key access routes to theMediterranean, the Red Sea and Suez Canal, andthe Gulf. Just 5 percent of the region’s land isarable,2 and water resources are limited. Over halfof the countries in the region have significant oilreserves, with the region accounting for 31 per-cent of world oil production in 1997. Despite ageneral commonality of Islam and Arabic,3 itsconstituent countries are diverse in ethnic com-position, political orientation and levels of eco-nomic and social development. In the long run,given the exhaustibility of oil resources and thelow and variable returns to agricultural and otherraw commodities,4 countries in the region willneed to rely on strong human capital for socialdevelopment and income growth.
Rising oil prices in the 1970s fueled a majorincome boost for the oil exporters of the region.Oil wealth was used to rapidly expand social ser-vices and infrastructure, and improvements insocial indicators followed. Non-oil producingcountries such as Jordan, Morocco and Tunisiaalso benefited, chiefly by exporting skilled andsemi-skilled labor to the oil producers, whileEgypt and Algeria derived income from bothsources. Income grew faster in MENA than in anyregion other than East Asia during the quartercentury which began in 1960, but the boom didnot benefit all and intra-regional disparities are
great. Yemen’s per capita income is among thelowest in the world while those of the Gulf oilproducers are among the highest. The others,from Morocco on Africa’s northwest corner toIran at the gateway to central Asia, fall in thelower middle income (LMI) range. This paperfocuses on the low income and LMI countries ofthe region.5
Central governments in the region have assumeda preeminent role in economic activity and socialdevelopment since the early 1960s. Public rev-enues, expenditures and central governmentwages as a share of GDP are far in excess of thosein other low and LMI countries — and economiccompetitors — such as Indonesia and Thailand.6
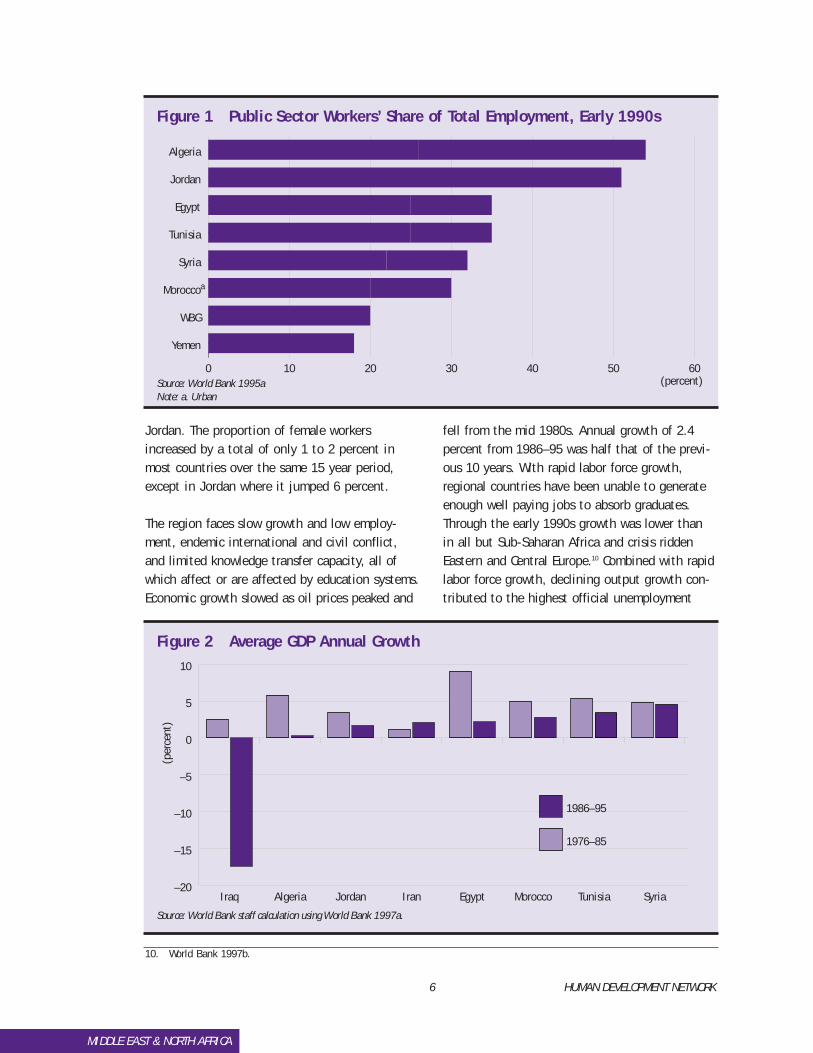
Until recently, the public sector absorbed a largeshare of new secondary and higher educationgraduates, and total public employment rangedfrom 20 percent in Yemen to 55 percent in Algeriain the early 1990s. Parallel to their role in eco-nomic activity, Governments also assumed a dom-inant role in providing education services withoutdirect costs to the recipients. This resulted incrowding out of private delivery through a lack ofdemand, and some consequent ossification ineducational development.
The share of total private employment is consid-erable: while employment in the private formalsector7 is typically smaller than in the public sec-tor,8 private informal sector employment is large,accounting for 30 percent of non-farm employ-ment in Algeria, 40 percent in Egypt, 63 percentin Morocco, and 35 percent in Tunisia in the late1980s.9 Annual labor force growth of 3 to 4 per-cent from 1980 to 1995 in most countriesexceeded population growth everywhere but
MIDDLE EAST & NORTH AFRICA
1. Countries included in the World Bank MENA region are: Algeria, Bahrain, Egypt, Iran, Iraq, Jordan, Kuwait, Lebanon, Libya,Malta, Morocco, Oman, Qatar, Saudi Arabia, Syria, Tunisia, the United Arab Emirates, Yemen and West Bank–Gaza.
2. Excluding the GCC countries, just over 7% of the region’s land is arable, compared with 20% in the U.S., 22% in WesternEurope and 38% in Eastern Europe.
3. Farsi Iran is an exception in terms of language.4. E.g., phosphates in Morocco and Jordan and natural gas in Algeria.5. These are: Algeria, Egypt, Iran, Iraq, Jordan, Lebanon, Libya, Morocco, Syria, Tunisia, Yemen and West Bank–Gaza. 6. World Bank 1997a.7. Usually defined as an enterprise with at least ten workers.8. Richards and Waterbury 1996. 9. World Bank 1995a.
6 HUMAN DEVELOPMENT NETWORK
Jordan. The proportion of female workersincreased by a total of only 1 to 2 percent inmost countries over the same 15 year period,except in Jordan where it jumped 6 percent.
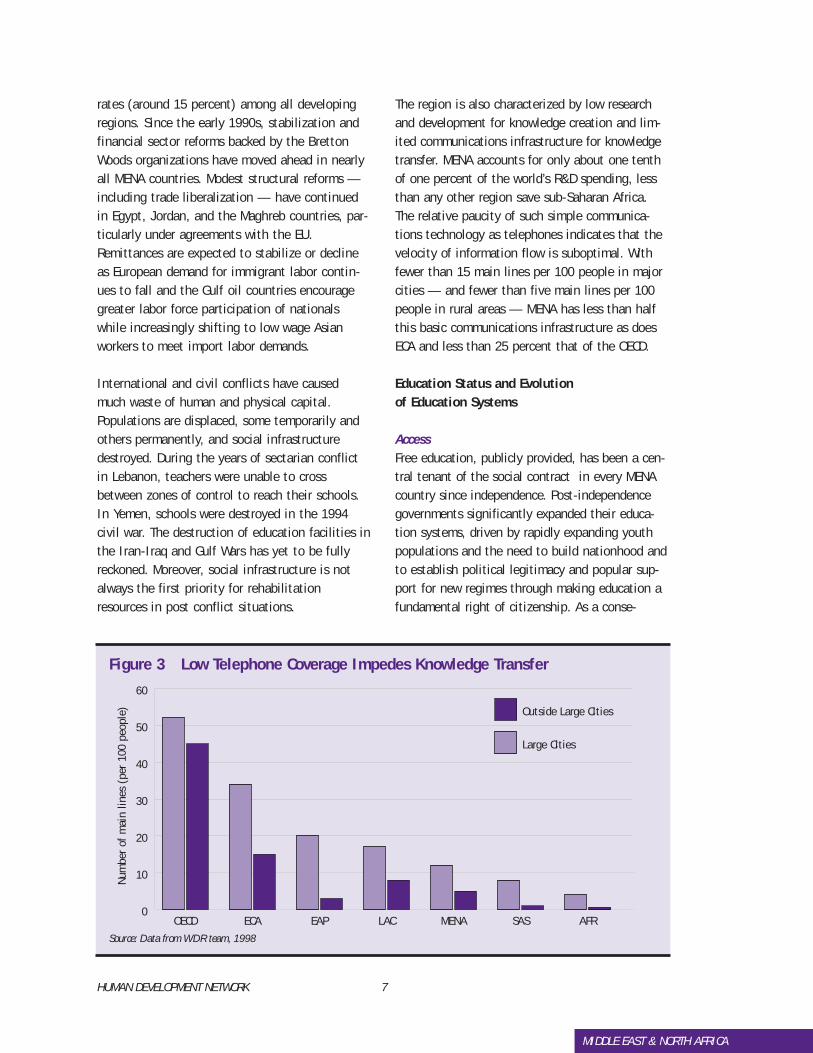
The region faces slow growth and low employ-ment, endemic international and civil conflict,and limited knowledge transfer capacity, all ofwhich affect or are affected by education systems.Economic growth slowed as oil prices peaked and
fell from the mid 1980s. Annual growth of 2.4percent from 1986–95 was half that of the previ-ous 10 years. With rapid labor force growth,regional countries have been unable to generateenough well paying jobs to absorb graduates.Through the early 1990s growth was lower thanin all but Sub-Saharan Africa and crisis riddenEastern and Central Europe.10 Combined with rapidlabor force growth, declining output growth con-tributed to the highest official unemployment
MIDDLE EAST & NORTH AFRICA
0 10 20 30 40 50 60
Yemen
WBG
Morocco
Syria
Tunisia
Egypt
Jordan
Algeria
(percent)
a
Figure 1 Public Sector Workers’ Share of Total Employment, Early 1990s
Source: World Bank 1995aNote: a. Urban
10. World Bank 1997b.
–20
–15
–10
–5
0
5
10
SyriaTunisiaMoroccoEgyptIranJordanAlgeriaIraq
1986–95
1976–85
(per
cent
)
Figure 2 Average GDP Annual Growth
Source: World Bank staff calculation using World Bank 1997a.
HUMAN DEVELOPMENT NETWORK 7
rates (around 15 percent) among all developingregions. Since the early 1990s, stabilization andfinancial sector reforms backed by the BrettonWoods organizations have moved ahead in nearlyall MENA countries. Modest structural reforms —including trade liberalization — have continuedin Egypt, Jordan, and the Maghreb countries, par-ticularly under agreements with the EU.Remittances are expected to stabilize or declineas European demand for immigrant labor contin-ues to fall and the Gulf oil countries encouragegreater labor force participation of nationalswhile increasingly shifting to low wage Asianworkers to meet import labor demands.
International and civil conflicts have causedmuch waste of human and physical capital.Populations are displaced, some temporarily andothers permanently, and social infrastructuredestroyed. During the years of sectarian conflictin Lebanon, teachers were unable to crossbetween zones of control to reach their schools.In Yemen, schools were destroyed in the 1994civil war. The destruction of education facilities inthe Iran-Iraq and Gulf Wars has yet to be fullyreckoned. Moreover, social infrastructure is notalways the first priority for rehabilitationresources in post conflict situations.
The region is also characterized by low researchand development for knowledge creation and lim-ited communications infrastructure for knowledgetransfer. MENA accounts for only about one tenthof one percent of the world’s R&D spending, lessthan any other region save sub-Saharan Africa.The relative paucity of such simple communica-tions technology as telephones indicates that thevelocity of information flow is suboptimal. Withfewer than 15 main lines per 100 people in majorcities — and fewer than five main lines per 100people in rural areas — MENA has less than halfthis basic communications infrastructure as doesECA and less than 25 percent that of the OECD.
Education Status and Evolution of Education Systems
AccessFree education, publicly provided, has been a cen-tral tenant of the social contract in every MENAcountry since independence. Post-independencegovernments significantly expanded their educa-tion systems, driven by rapidly expanding youthpopulations and the need to build nationhood andto establish political legitimacy and popular sup-port for new regimes through making education afundamental right of citizenship. As a conse-
MIDDLE EAST & NORTH AFRICA
0
10
20
30
40
50
60
AFRSASMENALACEAPECAOECD
Outside Large Cities
Large Cities
Num
ber
of m
ain
lines
(pe
r 10
0 pe
ople
)
Figure 3 Low Telephone Coverage Impedes Knowledge Transfer
Source: Data from WDR team, 1998
8 HUMAN DEVELOPMENT NETWORK
quence, education systems in the region, with fewexceptions, now provide basic education to mostchildren and opportunities for upper secondary,vocational training and tertiary education tomany. Education is compulsory through the prima-ry level everywhere except Tunisia, and throughlower secondary in six countries. Most countrieshave achieved universal primary enrollment andsignificant secondary enrollment rate increases.Growth in tertiary enrollment rates has been lessdramatic and a few countries even saw slightdeclines between 1975 and 1995. However, givenexpanding tertiary cohorts, even a constant rateimplies a large increase in students.
Education is largely publicly provided and financedin all countries other than Lebanon, even thoughonly one country in the region — Algeria — bansprivate education. Education is also largely man-aged centrally, but most Governments support sep-arate Ministries for each major educationsubsector (i.e., basic, higher and vocational).These ministries lack incentives to coordinatetheir activities, so that investment and current
spending, teacher deployment and other resourceuse issues are rarely considered on a sector widebasis. As a result, potential tradeoffs andeconomies of scale and scope are lost. Non-educa-tion Ministries in sectors with substantial trainingneeds (e.g., Health) also operate substantial pro-grams (e.g., all of medical education), furtherfragmenting planning and resource use.
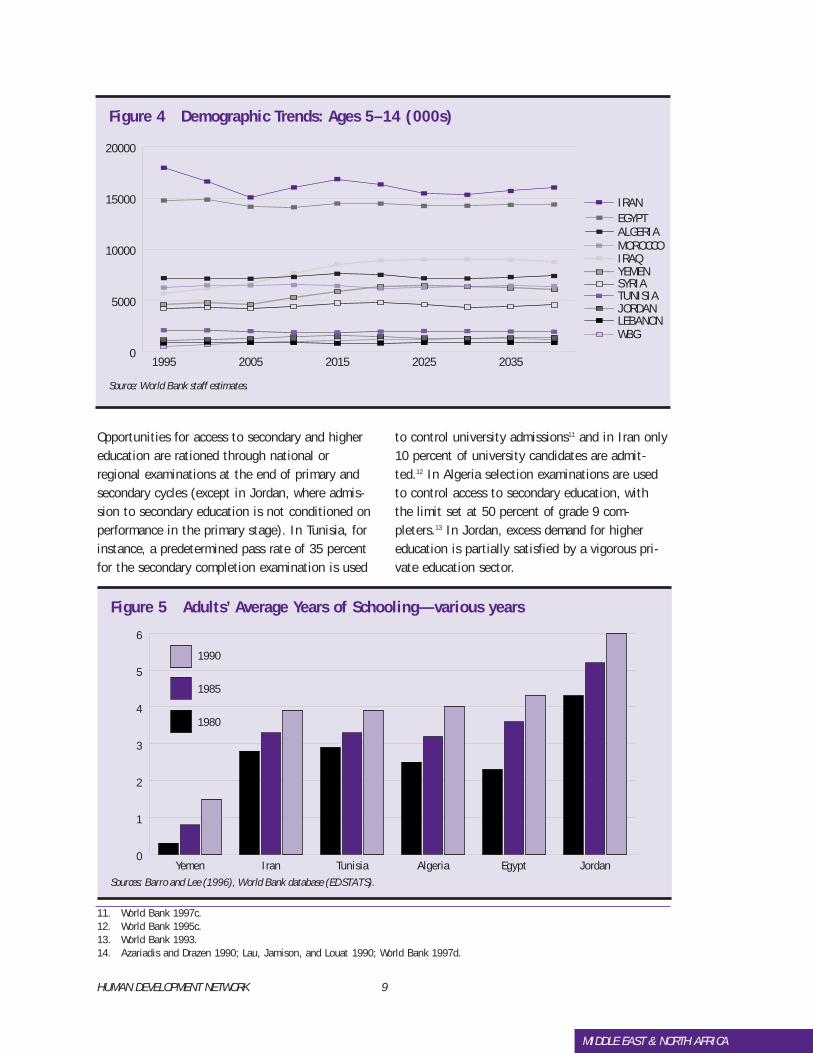
The era of demographically driven investment ineducation is over for basic education in manyMENA countries. School-age cohorts (roughly ages5–14) will begin to shrink around 2015, and thepresent teacher corps and classroom stock will besufficient for the demands of the 21st century inmost of the region. In Jordan, Iraq, WestBank–Gaza and Yemen however, the size of theschool age cohort will continue to grow for atleast 15 years (25 to 30 years in West Bank–Gazaand Yemen). Moreover, the need for post-basiceducation opportunities will continue to grow inall countries, as few have reached the participa-tion levels in secondary, vocational or tertiaryeducation to which they aspire.
MIDDLE EAST & NORTH AFRICA
Percent of Adults’ MeanMinistries with Years of Children 6–10 Years of
education compulsory in school, Schooling, Primary Secondary Tertiaryauthority* education mid-1990s 1990 GER, 1995 GER, 1995 GER, 1995
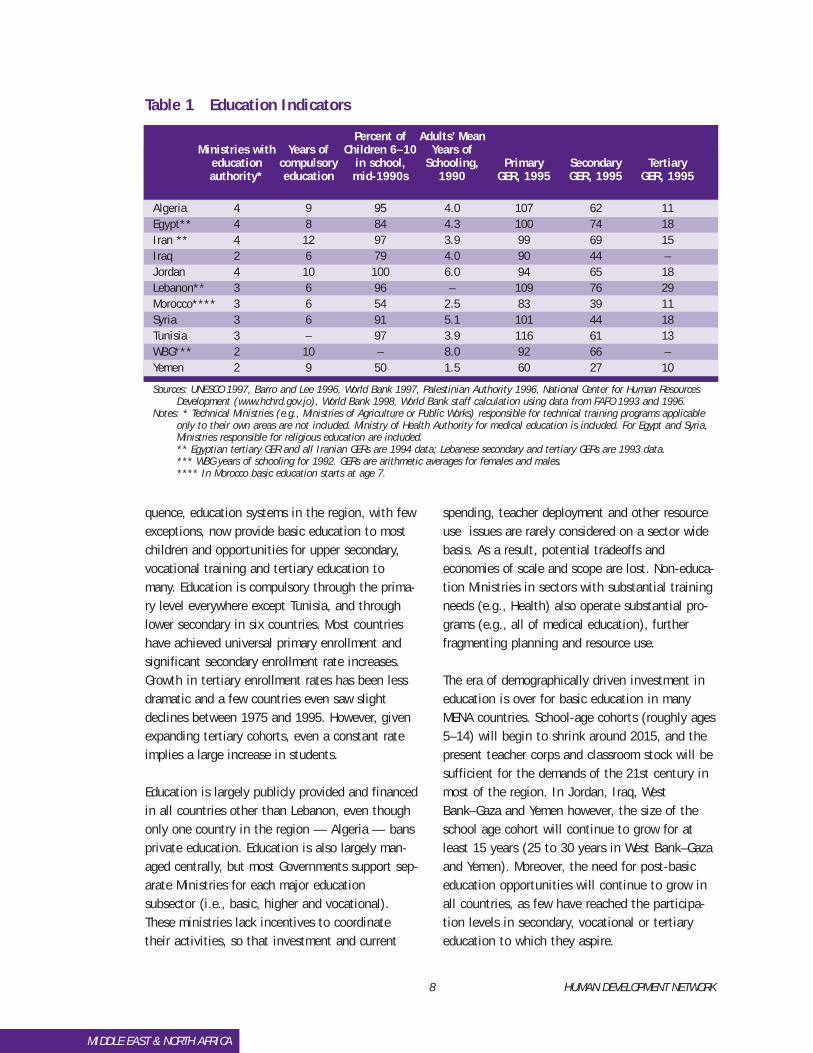
Algeria 4 9 95 4.0 107 62 11Egypt** 4 8 84 4.3 100 74 18Iran ** 4 12 97 3.9 99 69 15Iraq 2 6 79 4.0 90 44 –Jordan 4 10 100 6.0 94 65 18Lebanon** 3 6 96 – 109 76 29Morocco**** 3 6 54 2.5 83 39 11Syria 3 6 91 5.1 101 44 18Tunisia 3 – 97 3.9 116 61 13WBG*** 2 10 – 8.0 92 66 –Yemen 2 9 50 1.5 60 27 10
Sources: UNESCO 1997, Barro and Lee 1996, World Bank 1997, Palestinian Authority 1996, National Center for Human ResourcesDevelopment (www.hchrd.gov.jo), World Bank 1998, World Bank staff calculation using data from FAFO 1993 and 1996.
Notes: * Technical Ministries (e.g., Ministries of Agriculture or Public Works) responsible for technical training programs applicableonly to their own areas are not included. Ministry of Health Authority for medical education is included. For Egypt and Syria,Ministries responsible for religious education are included.** Egyptian tertiary GER and all Iranian GERs are 1994 data; Lebanese secondary and tertiary GERs are 1993 data.*** WBG years of schooling for 1992. GERs are arithmetic averages for females and males.**** In Morocco basic education starts at age 7.
Table 1 Education Indicators
HUMAN DEVELOPMENT NETWORK 9
Opportunities for access to secondary and highereducation are rationed through national orregional examinations at the end of primary andsecondary cycles (except in Jordan, where admis-sion to secondary education is not conditioned onperformance in the primary stage). In Tunisia, forinstance, a predetermined pass rate of 35 percentfor the secondary completion examination is used
to control university admissions11 and in Iran only10 percent of university candidates are admit-ted.12 In Algeria selection examinations are usedto control access to secondary education, withthe limit set at 50 percent of grade 9 com-pleters.13 In Jordan, excess demand for highereducation is partially satisfied by a vigorous pri-vate education sector.
MIDDLE EAST & NORTH AFRICA
0
5000
10000
15000
20000
20352025201520051995
WBG
SYRIA
LEBANONJORDAN
IRAQ
IRAN
YEMEN
TUNISIA
MOROCCO
EGYPTALGERIA
Figure 4 Demographic Trends: Ages 5–14 (000s)
Source: World Bank staff estimates.
11. World Bank 1997c.12. World Bank 1995c.13. World Bank 1993.14. Azariadis and Drazen 1990; Lau, Jamison, and Louat 1990; World Bank 1997d.
0
1
2
3
4
5
6
JordanEgyptAlgeriaTunisiaIranYemen
1990
1985
1980
Figure 5 Adults’ Average Years of Schooling—various years
Sources: Barro and Lee (1996), World Bank database (EDSTATS).
10 HUMAN DEVELOPMENT NETWORK
Education Attainment and LiteracyOne consequence of government investment ineducation has been a significant increase in theaverage educational attainment of the labor force.During the 1980s the mean years of schoolingamong adults increased significantly, so that by1990 it was at or above four years in most coun-tries. In conjunction with some research capacityand higher education attainment, this level repre-sents an approximate “takeoff” point, a thresholdof education in the workforce where increasingreturns to scale for human capital begin toaccrue.14 When this minimum average attainmentis present, the quality of labor attains a criticalmass allowing greater overall productivity. Whilenot a final system goal, it is thus an importantnational achievement.
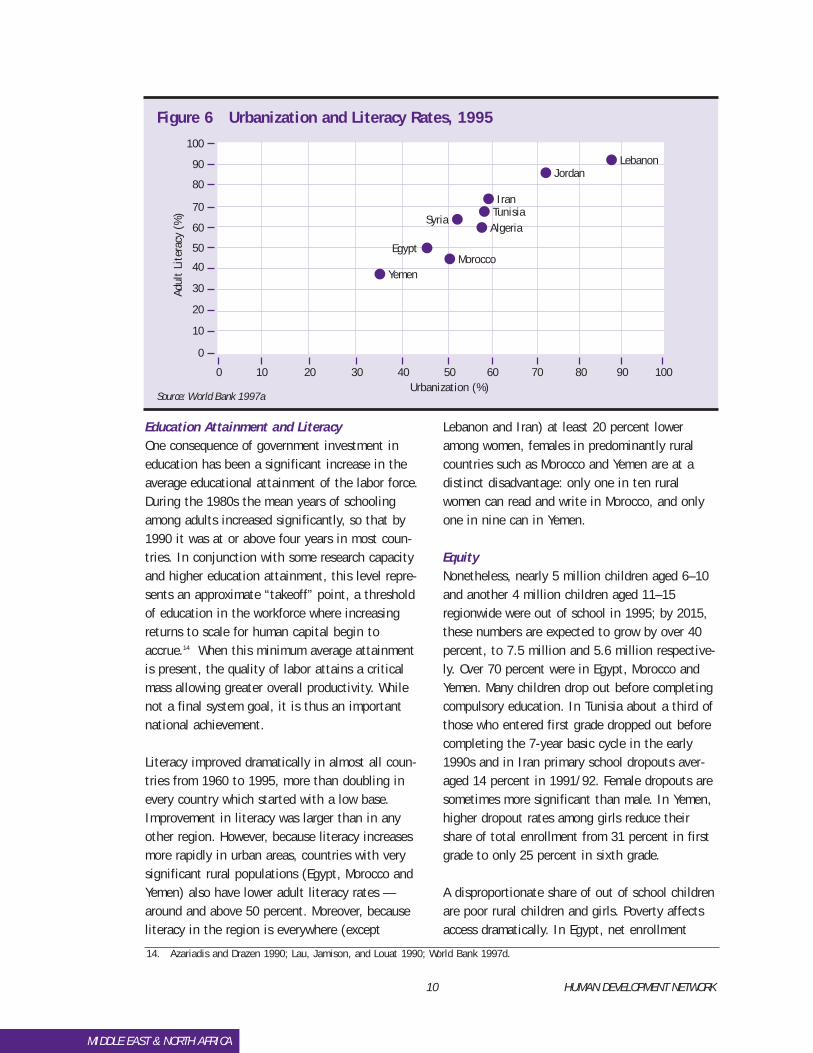
Literacy improved dramatically in almost all coun-tries from 1960 to 1995, more than doubling inevery country which started with a low base.Improvement in literacy was larger than in anyother region. However, because literacy increasesmore rapidly in urban areas, countries with verysignificant rural populations (Egypt, Morocco andYemen) also have lower adult literacy rates —around and above 50 percent. Moreover, becauseliteracy in the region is everywhere (except
Lebanon and Iran) at least 20 percent loweramong women, females in predominantly ruralcountries such as Morocco and Yemen are at adistinct disadvantage: only one in ten ruralwomen can read and write in Morocco, and onlyone in nine can in Yemen.
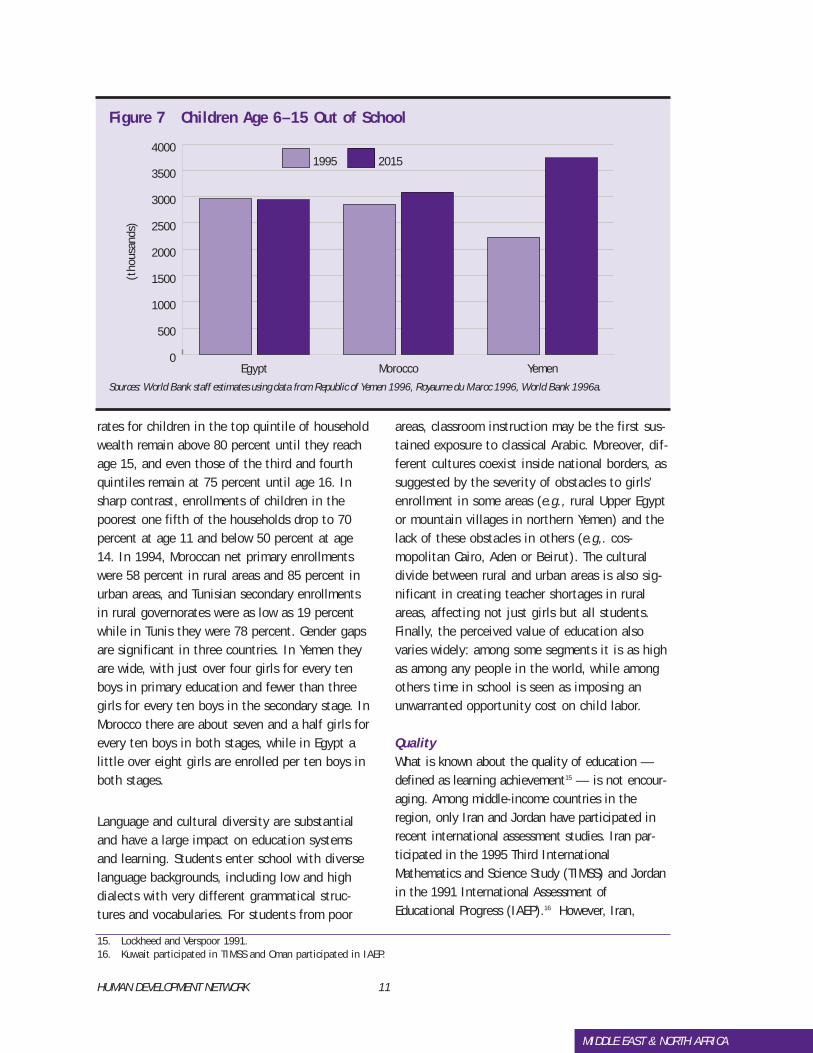
EquityNonetheless, nearly 5 million children aged 6–10and another 4 million children aged 11–15regionwide were out of school in 1995; by 2015,these numbers are expected to grow by over 40percent, to 7.5 million and 5.6 million respective-ly. Over 70 percent were in Egypt, Morocco andYemen. Many children drop out before completingcompulsory education. In Tunisia about a third ofthose who entered first grade dropped out beforecompleting the 7-year basic cycle in the early1990s and in Iran primary school dropouts aver-aged 14 percent in 1991/92. Female dropouts aresometimes more significant than male. In Yemen,higher dropout rates among girls reduce theirshare of total enrollment from 31 percent in firstgrade to only 25 percent in sixth grade.
A disproportionate share of out of school childrenare poor rural children and girls. Poverty affectsaccess dramatically. In Egypt, net enrollment
MIDDLE EAST & NORTH AFRICA
70
60
50
40
30
20
10
0
0 10 20 30 40 50 60 70 80 90 100
100
90
80Ad
ult
Lite
racy
(%
)
Urbanization (%)
YemenMorocco
Egypt
SyriaTunisiaAlgeria
Iran
JordanLebanon
Figure 6 Urbanization and Literacy Rates, 1995
Source: World Bank 1997a
14. Azariadis and Drazen 1990; Lau, Jamison, and Louat 1990; World Bank 1997d.
HUMAN DEVELOPMENT NETWORK 11
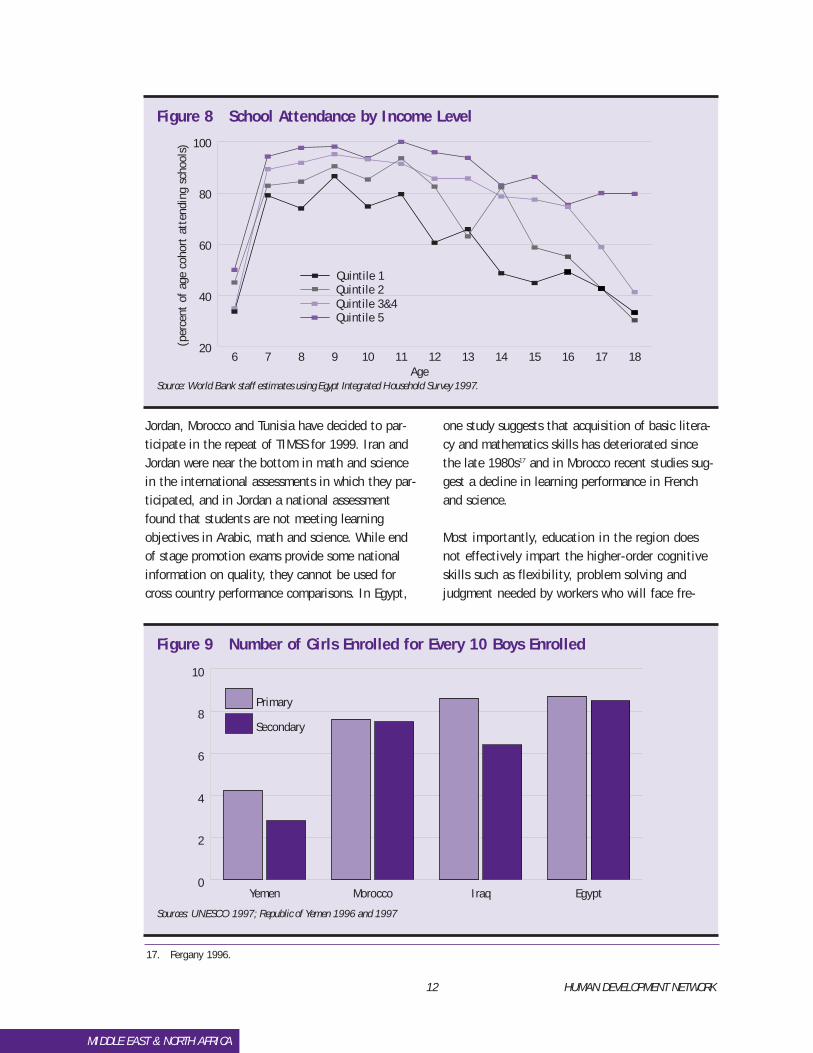
rates for children in the top quintile of householdwealth remain above 80 percent until they reachage 15, and even those of the third and fourthquintiles remain at 75 percent until age 16. Insharp contrast, enrollments of children in thepoorest one fifth of the households drop to 70percent at age 11 and below 50 percent at age14. In 1994, Moroccan net primary enrollmentswere 58 percent in rural areas and 85 percent inurban areas, and Tunisian secondary enrollmentsin rural governorates were as low as 19 percentwhile in Tunis they were 78 percent. Gender gapsare significant in three countries. In Yemen theyare wide, with just over four girls for every tenboys in primary education and fewer than threegirls for every ten boys in the secondary stage. InMorocco there are about seven and a half girls forevery ten boys in both stages, while in Egypt alittle over eight girls are enrolled per ten boys inboth stages.
Language and cultural diversity are substantialand have a large impact on education systemsand learning. Students enter school with diverselanguage backgrounds, including low and highdialects with very different grammatical struc-tures and vocabularies. For students from poor
areas, classroom instruction may be the first sus-tained exposure to classical Arabic. Moreover, dif-ferent cultures coexist inside national borders, assuggested by the severity of obstacles to girls’enrollment in some areas (e.g., rural Upper Egyptor mountain villages in northern Yemen) and thelack of these obstacles in others (e.g,. cos-mopolitan Cairo, Aden or Beirut). The culturaldivide between rural and urban areas is also sig-nificant in creating teacher shortages in ruralareas, affecting not just girls but all students.Finally, the perceived value of education alsovaries widely: among some segments it is as highas among any people in the world, while amongothers time in school is seen as imposing anunwarranted opportunity cost on child labor.
QualityWhat is known about the quality of education —defined as learning achievement15 — is not encour-aging. Among middle-income countries in theregion, only Iran and Jordan have participated inrecent international assessment studies. Iran par-ticipated in the 1995 Third InternationalMathematics and Science Study (TIMSS) and Jordanin the 1991 International Assessment ofEducational Progress (IAEP).16 However, Iran,
MIDDLE EAST & NORTH AFRICA
0
500
1000
1500
2000
2500
3000
3500
400020151995
YemenMoroccoEgypt
(tho
usan
ds)
Figure 7 Children Age 6–15 Out of School
Sources: World Bank staff estimates using data from Republic of Yemen 1996, Royaume du Maroc 1996, World Bank 1996a.
15. Lockheed and Verspoor 1991.16. Kuwait participated in TIMSS and Oman participated in IAEP.
12 HUMAN DEVELOPMENT NETWORK
Jordan, Morocco and Tunisia have decided to par-ticipate in the repeat of TIMSS for 1999. Iran andJordan were near the bottom in math and sciencein the international assessments in which they par-ticipated, and in Jordan a national assessmentfound that students are not meeting learningobjectives in Arabic, math and science. While endof stage promotion exams provide some nationalinformation on quality, they cannot be used forcross country performance comparisons. In Egypt,
one study suggests that acquisition of basic litera-cy and mathematics skills has deteriorated sincethe late 1980s17 and in Morocco recent studies sug-gest a decline in learning performance in Frenchand science.
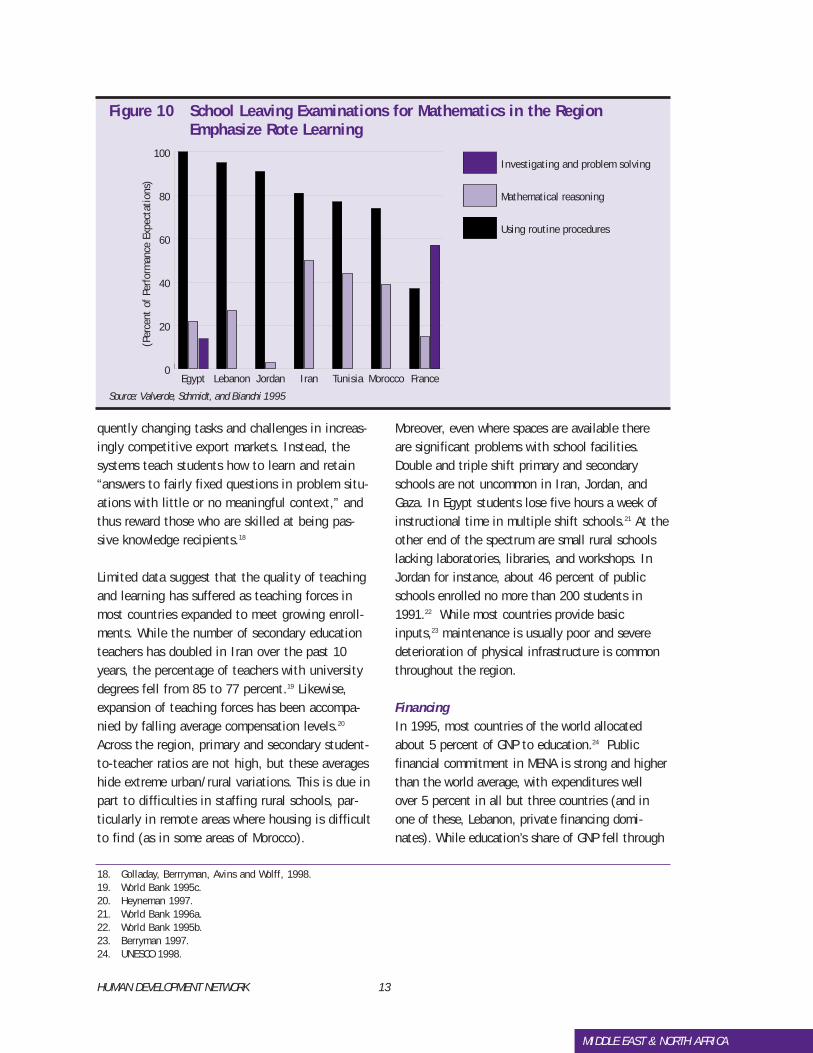
Most importantly, education in the region doesnot effectively impart the higher-order cognitiveskills such as flexibility, problem solving andjudgment needed by workers who will face fre-
MIDDLE EAST & NORTH AFRICA
20
40
60
80
100
1817161514131211109876
Quintile 5Quintile 3&4Quintile 2Quintile 1
(per
cent
of
age
coho
rt a
tten
ding
sch
ools
)
Age
Figure 8 School Attendance by Income Level
Source: World Bank staff estimates using Egypt Integrated Household Survey 1997.
0
2
4
6
8
10
Secondary
Primary
EgyptIraqMoroccoYemen
Figure 9 Number of Girls Enrolled for Every 10 Boys Enrolled
Sources: UNESCO 1997; Republic of Yemen 1996 and 1997
17. Fergany 1996.
HUMAN DEVELOPMENT NETWORK 13
quently changing tasks and challenges in increas-ingly competitive export markets. Instead, thesystems teach students how to learn and retain“answers to fairly fixed questions in problem situ-ations with little or no meaningful context,” andthus reward those who are skilled at being pas-sive knowledge recipients.18
Limited data suggest that the quality of teachingand learning has suffered as teaching forces inmost countries expanded to meet growing enroll-ments. While the number of secondary educationteachers has doubled in Iran over the past 10years, the percentage of teachers with universitydegrees fell from 85 to 77 percent.19 Likewise,expansion of teaching forces has been accompa-nied by falling average compensation levels.20
Across the region, primary and secondary student-to-teacher ratios are not high, but these averageshide extreme urban/rural variations. This is due inpart to difficulties in staffing rural schools, par-ticularly in remote areas where housing is difficultto find (as in some areas of Morocco).
Moreover, even where spaces are available thereare significant problems with school facilities.Double and triple shift primary and secondaryschools are not uncommon in Iran, Jordan, andGaza. In Egypt students lose five hours a week ofinstructional time in multiple shift schools.21 At theother end of the spectrum are small rural schoolslacking laboratories, libraries, and workshops. InJordan for instance, about 46 percent of publicschools enrolled no more than 200 students in1991.22 While most countries provide basicinputs,23 maintenance is usually poor and severedeterioration of physical infrastructure is commonthroughout the region.
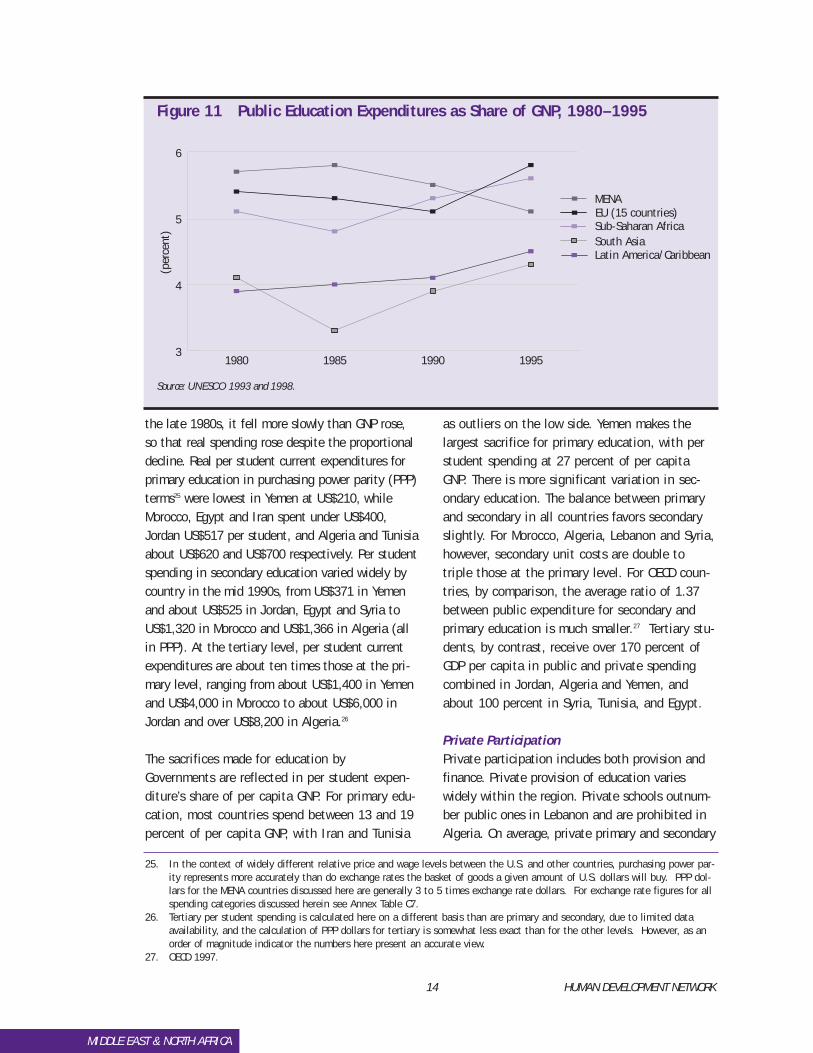
FinancingIn 1995, most countries of the world allocatedabout 5 percent of GNP to education.24 Publicfinancial commitment in MENA is strong and higherthan the world average, with expenditures wellover 5 percent in all but three countries (and inone of these, Lebanon, private financing domi-nates). While education’s share of GNP fell through
MIDDLE EAST & NORTH AFRICA
18. Golladay, Berrryman, Avins and Wolff, 1998.19. World Bank 1995c.20. Heyneman 1997.21. World Bank 1996a.22. World Bank 1995b.23. Berryman 1997.24. UNESCO 1998.
0
20
40
60
80
100Investigating and problem solving
Mathematical reasoning
Using routine procedures
FranceMoroccoTunisiaIranJordanLebanonEgypt
(Per
cent
of
Perf
orm
ance
Exp
ecta
tion
s)
Figure 10 School Leaving Examinations for Mathematics in the Region Emphasize Rote Learning
Source: Valverde, Schmidt, and Bianchi 1995
14 HUMAN DEVELOPMENT NETWORK
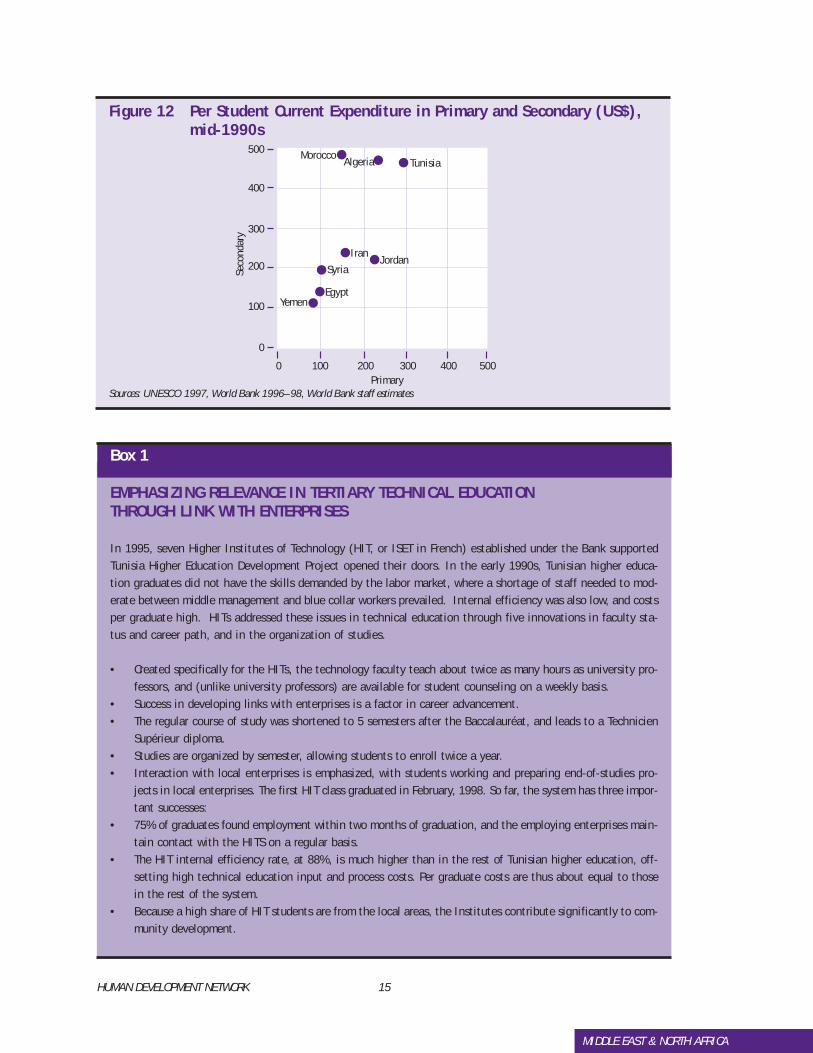
the late 1980s, it fell more slowly than GNP rose,so that real spending rose despite the proportionaldecline. Real per student current expenditures forprimary education in purchasing power parity (PPP)terms25 were lowest in Yemen at US$210, whileMorocco, Egypt and Iran spent under US$400,Jordan US$517 per student, and Algeria and Tunisiaabout US$620 and US$700 respectively. Per studentspending in secondary education varied widely bycountry in the mid 1990s, from US$371 in Yemenand about US$525 in Jordan, Egypt and Syria toUS$1,320 in Morocco and US$1,366 in Algeria (allin PPP). At the tertiary level, per student currentexpenditures are about ten times those at the pri-mary level, ranging from about US$1,400 in Yemenand US$4,000 in Morocco to about US$6,000 inJordan and over US$8,200 in Algeria.26
The sacrifices made for education byGovernments are reflected in per student expen-diture’s share of per capita GNP. For primary edu-cation, most countries spend between 13 and 19percent of per capita GNP, with Iran and Tunisia
as outliers on the low side. Yemen makes thelargest sacrifice for primary education, with perstudent spending at 27 percent of per capitaGNP. There is more significant variation in sec-ondary education. The balance between primaryand secondary in all countries favors secondaryslightly. For Morocco, Algeria, Lebanon and Syria,however, secondary unit costs are double totriple those at the primary level. For OECD coun-tries, by comparison, the average ratio of 1.37between public expenditure for secondary andprimary education is much smaller.27 Tertiary stu-dents, by contrast, receive over 170 percent ofGDP per capita in public and private spendingcombined in Jordan, Algeria and Yemen, andabout 100 percent in Syria, Tunisia, and Egypt.
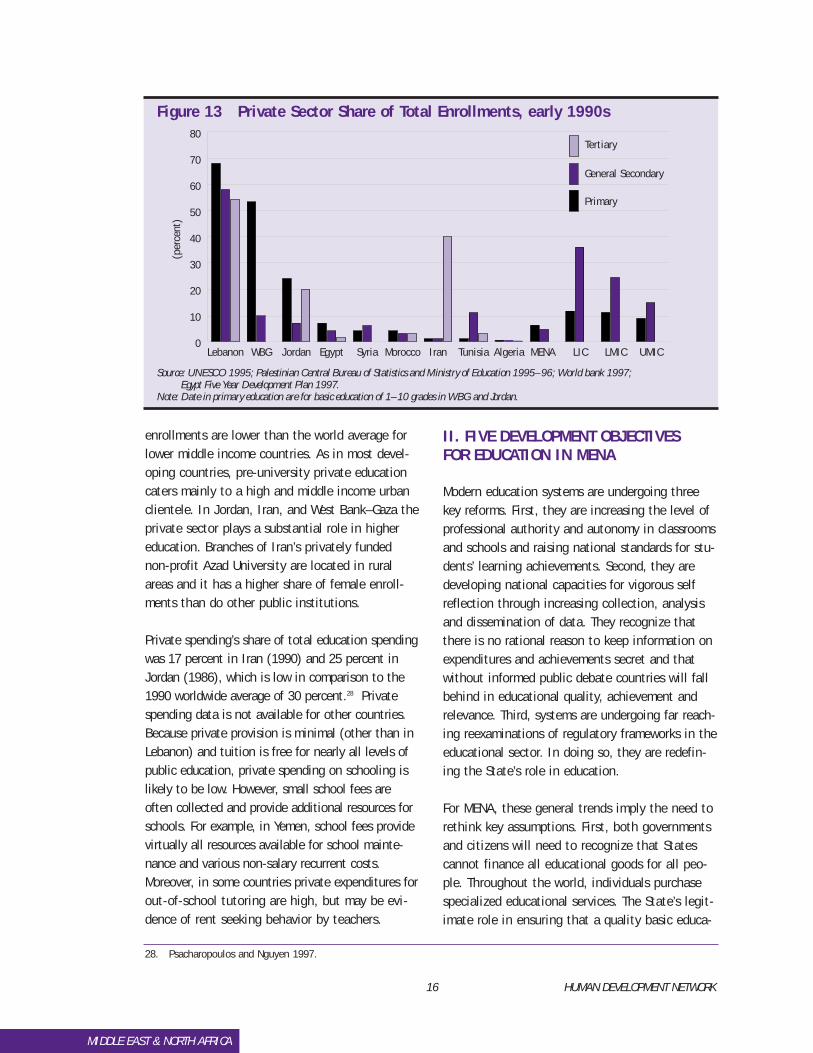
Private ParticipationPrivate participation includes both provision andfinance. Private provision of education varieswidely within the region. Private schools outnum-ber public ones in Lebanon and are prohibited inAlgeria. On average, private primary and secondary
MIDDLE EAST & NORTH AFRICA
25. In the context of widely different relative price and wage levels between the U.S. and other countries, purchasing power par-ity represents more accurately than do exchange rates the basket of goods a given amount of U.S. dollars will buy. PPP dol-lars for the MENA countries discussed here are generally 3 to 5 times exchange rate dollars. For exchange rate figures for allspending categories discussed herein see Annex Table C7.
26. Tertiary per student spending is calculated here on a different basis than are primary and secondary, due to limited dataavailability, and the calculation of PPP dollars for tertiary is somewhat less exact than for the other levels. However, as anorder of magnitude indicator the numbers here present an accurate view.
27. OECD 1997.
3
4
5
6
1995199019851980
South AsiaLatin America/Caribbean
Sub-Saharan Africa
MENA EU (15 countries)
(per
cent
)
Figure 11 Public Education Expenditures as Share of GNP, 1980–1995
Source: UNESCO 1993 and 1998.
HUMAN DEVELOPMENT NETWORK 15
MIDDLE EAST & NORTH AFRICA
300
200
100
0
0 100 200 300 400 500
500
400
Seco
ndar
y
Primary
Yemen
Morocco
Egypt
Syria
TunisiaAlgeria
IranJordan
Figure 12 Per Student Current Expenditure in Primary and Secondary (US$), mid-1990s
Sources: UNESCO 1997, World Bank 1996–98, World Bank staff estimates
Box 1
EMPHASIZING RELEVANCE IN TERTIARY TECHNICAL EDUCATION THROUGH LINK WITH ENTERPRISES
In 1995, seven Higher Institutes of Technology (HIT, or ISET in French) established under the Bank supportedTunisia Higher Education Development Project opened their doors. In the early 1990s, Tunisian higher educa-tion graduates did not have the skills demanded by the labor market, where a shortage of staff needed to mod-erate between middle management and blue collar workers prevailed. Internal efficiency was also low, and costsper graduate high. HITs addressed these issues in technical education through five innovations in faculty sta-tus and career path, and in the organization of studies.
• Created specifically for the HITs, the technology faculty teach about twice as many hours as university pro-fessors, and (unlike university professors) are available for student counseling on a weekly basis.
• Success in developing links with enterprises is a factor in career advancement.• The regular course of study was shortened to 5 semesters after the Baccalauréat, and leads to a Technicien
Supérieur diploma.• Studies are organized by semester, allowing students to enroll twice a year.• Interaction with local enterprises is emphasized, with students working and preparing end-of-studies pro-
jects in local enterprises. The first HIT class graduated in February, 1998. So far, the system has three impor-tant successes:
• 75% of graduates found employment within two months of graduation, and the employing enterprises main-tain contact with the HITS on a regular basis.
• The HIT internal efficiency rate, at 88%, is much higher than in the rest of Tunisian higher education, off-setting high technical education input and process costs. Per graduate costs are thus about equal to thosein the rest of the system.
• Because a high share of HIT students are from the local areas, the Institutes contribute significantly to com-munity development.
16 HUMAN DEVELOPMENT NETWORK
enrollments are lower than the world average forlower middle income countries. As in most devel-oping countries, pre-university private educationcaters mainly to a high and middle income urbanclientele. In Jordan, Iran, and West Bank–Gaza theprivate sector plays a substantial role in highereducation. Branches of Iran’s privately fundednon-profit Azad University are located in ruralareas and it has a higher share of female enroll-ments than do other public institutions.
Private spending’s share of total education spendingwas 17 percent in Iran (1990) and 25 percent inJordan (1986), which is low in comparison to the1990 worldwide average of 30 percent.28 Privatespending data is not available for other countries.Because private provision is minimal (other than inLebanon) and tuition is free for nearly all levels ofpublic education, private spending on schooling islikely to be low. However, small school fees areoften collected and provide additional resources forschools. For example, in Yemen, school fees providevirtually all resources available for school mainte-nance and various non-salary recurrent costs.Moreover, in some countries private expenditures forout-of-school tutoring are high, but may be evi-dence of rent seeking behavior by teachers.
II. FIVE DEVELOPMENT OBJECTIVES FOR EDUCATION IN MENA
Modern education systems are undergoing threekey reforms. First, they are increasing the level ofprofessional authority and autonomy in classroomsand schools and raising national standards for stu-dents’ learning achievements. Second, they aredeveloping national capacities for vigorous selfreflection through increasing collection, analysisand dissemination of data. They recognize thatthere is no rational reason to keep information onexpenditures and achievements secret and thatwithout informed public debate countries will fallbehind in educational quality, achievement andrelevance. Third, systems are undergoing far reach-ing reexaminations of regulatory frameworks in theeducational sector. In doing so, they are redefin-ing the State’s role in education.
For MENA, these general trends imply the need torethink key assumptions. First, both governmentsand citizens will need to recognize that Statescannot finance all educational goods for all peo-ple. Throughout the world, individuals purchasespecialized educational services. The State’s legit-imate role in ensuring that a quality basic educa-
MIDDLE EAST & NORTH AFRICA
0
10
20
30
40
50
60
70
80
UMICLMICLICMENA AlgeriaTunisiaIranMoroccoSyriaEgyptJordanWBGLebanon
Tertiary
General Secondary
Primary
(per
cent
)
Figure 13 Private Sector Share of Total Enrollments, early 1990s
Source: UNESCO 1995; Palestinian Central Bureau of Statistics and Ministry of Education 1995–96; World bank 1997; Egypt Five Year Development Plan 1997.
Note: Date in primary education are for basic education of 1–10 grades in WBG and Jordan.
28. Psacharopoulos and Nguyen 1997.
HUMAN DEVELOPMENT NETWORK 17
tion is available to all citizens will be compro-mised if it attempts to also finance higher ser-vices for everybody. Second, governments cannotensure through minute regulation that everyoneis equal in educational opportunity. While deter-mination, provision and enforcement of a mini-mum level of standards (in basic, secondary andtertiary levels) and access (through basic) isessential, over-determination cripples public andprivate actors and ensures only that all studentsreceive a subpar education.
Rebalancing regulatory frameworks in MENA coun-tries will require addressing the degree of controlthe State exercises as well as what it controls. Inmany instances, the wrong areas are regulated. InEgypt, regulation of private higher education pre-vents development of that sector; throughoutNorth Africa, mandatory specialization in uppersecondary is used to ration access to tertiary lev-els. Where some control is needed, it is often toostringent or too lax. Many systems are rule–dri-ven, with a command and control managementculture preventing the school and classroom ini-tiative needed to foster learning. Decisions asessential as the language in which to teach aredetermined by regulation. While areas such asthese are over-determined, the regulatory frame-works and accreditation mechanisms needed toensure quality and equity if systems are tobecome open to private provision and financingare largely lacking.
Rethinking key assumptions and rebalancing regu-latory frameworks is important for the mission ofMENA education systems: engendering social cohe-sion in spite of difficult internal circumstanceswhile responding to changing external constraints.MENA’s competitors for Western Europe’s commodi-ty markets, the countries of Eastern and CentralEurope, are closer to their customers not just ingeography but in learning achievements. To avoidfalling wages, the ability to meet constantly shift-ing demands for quality goods and services mustrise. This in turn depends on a labor force whichcan continuously adapt and learn as it works.
Policymakers and donors need to remember thatthe best long run hope for improving and extend-ing public education services lies in economicgrowth. Public sector revenues and the expendi-tures which depend on them are very sensitive tooutput levels and are more important than foreigngrants or borrowing. As long as GDP expands,negotiations among competing Ministries overbudget resources are easier and outcomes moreacceptable. With a constant level of resources,increasing education’s share of total spendingwhile reducing those of other Ministries is diffi-cult; when the total resource envelope grows, thisbecomes much easier because growth in educa-tion spending does not require a real reduction inother sectors.
Building on the achievements of the past threedecades, all MENA countries can focus on usingeducation systems to continue to develop aninternationally competitive human capital base,extend and solidify social cohesion and spur fur-ther improvement in all aspects of social develop-ment. The countries in the region differ greatlywith respect to educational development, shortand medium term priorities and economic envi-ronments and prospects. As a result, the strate-gies appropriate to particular nationalenvironments will differ. Countries lacking signifi-cant natural resources that center their economicstrategies on human capital will select differenteducation strategies than countries for whichagriculture or extraction industries remain central.For both education will be important, but theirspecific objectives will vary. In the long termhorizon relevant to education planning however, anumber of common key objectives emerge. In thissection, each is discussed in turn.
Emphasize “Learning to Learn” and Reach Internationally CompetitivePerformance Standards
Twenty first century production processes and eco-nomic competition will demand learning achieve-ments beyond simple memorization and repetition.
MIDDLE EAST & NORTH AFRICA
18 HUMAN DEVELOPMENT NETWORK
MIDDLE EAST & NORTH AFRICA
An indispensable starting point for this — a sinequa non of twenty first century education — issolid achievement in the core competencies of lit-eracy and numeracy. Beyond this, workers willneed to respond to ever changing tasks so thatproblem solving will be the next century’s primaryworker virtue, in contrast to the assembly lineworker’s ability to endlessly carry out rote tasks.Education will need to impart skills enabling work-ers to be flexible, to analyze problems and to syn-thesize information gained in different contexts.This requires focusing students on the process oflearning — on learning how to learn — as well ason particular subject content.
By all indications, education systems in MENA donot reward these skills. Countries that focus onraising relevant achievement will develop nationalcapacity to compete in international markets.While each country will need to determine its ownparticular needs, all will need to focus on learningoutcomes which, when achieved, enable workersto continually learn. Lifelong learning will be anecessity to accommodate the fast changing needsof modern society. With accurate measures of stu-dent and system performance, educators at all lev-els can also identify needed system changes.Moreover, information about learning outcomescan be used by national planners to modify educa-tion programs and interventions.
Improve System Effectiveness in Building Human Capital and Engendering Social Cohesion
The ordering and structure of economic life inMENA is changing. Countries are shifting fromclosed, protected systems to more open environ-ments encouraging new investment, expandedtrade and increased reliance on the market todirect production, trade and distribution ofnational incomes.29 Within this environment,
education systems can contribute to economicgrowth by providing appropriately skilled labor.Education systems will face rising demand fromboth the private business sector and individualsto provide the skills which make each competi-tive. To meet this demand, the gap betweenschool leavers’ skills and market demands needsto be reduced. Skills for increased productivitywill be needed at all levels, from electricians tocomputer programmers to accounting clerks tofinancial managers.30 This in turn will require apopulation skilled in numerical and logical prob-lem solving and in complex literacy skills. All lev-els of education will be affected — basic,secondary, vocational and technical, and tertiary.
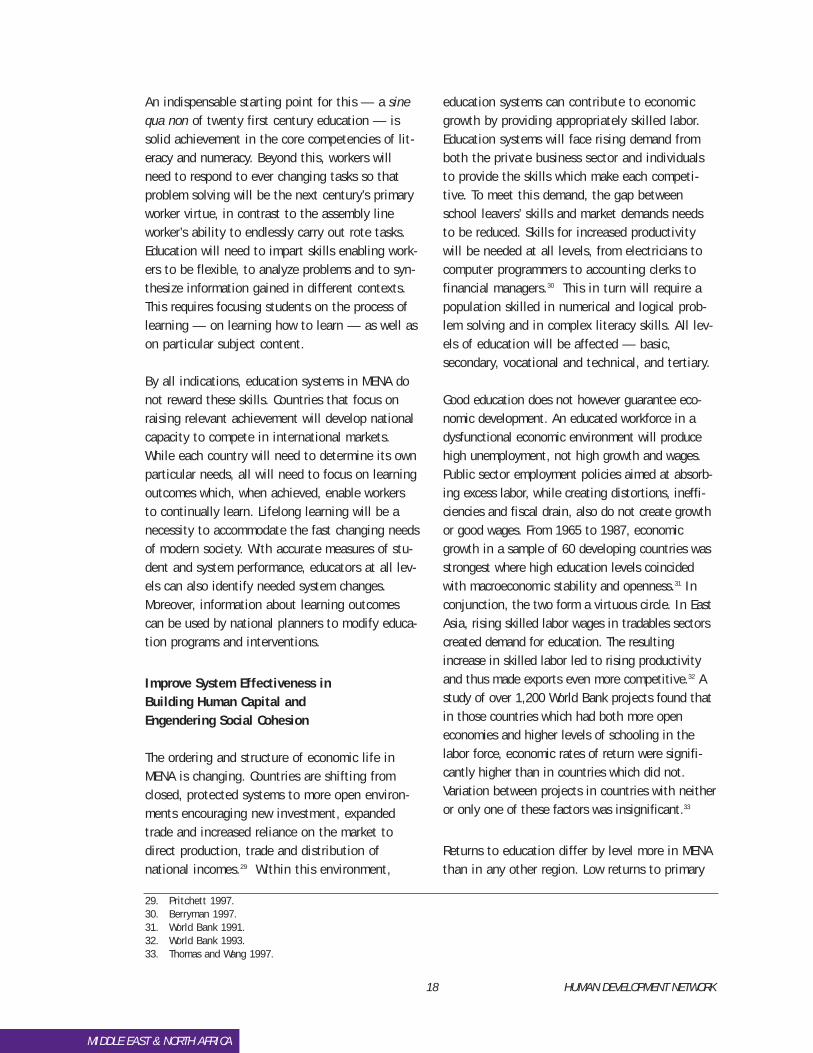
Good education does not however guarantee eco-nomic development. An educated workforce in adysfunctional economic environment will producehigh unemployment, not high growth and wages.Public sector employment policies aimed at absorb-ing excess labor, while creating distortions, ineffi-ciencies and fiscal drain, also do not create growthor good wages. From 1965 to 1987, economicgrowth in a sample of 60 developing countries wasstrongest where high education levels coincidedwith macroeconomic stability and openness.31 Inconjunction, the two form a virtuous circle. In EastAsia, rising skilled labor wages in tradables sectorscreated demand for education. The resultingincrease in skilled labor led to rising productivityand thus made exports even more competitive.32 Astudy of over 1,200 World Bank projects found thatin those countries which had both more openeconomies and higher levels of schooling in thelabor force, economic rates of return were signifi-cantly higher than in countries which did not.Variation between projects in countries with neitheror only one of these factors was insignificant.33
Returns to education differ by level more in MENAthan in any other region. Low returns to primary
29. Pritchett 1997.30. Berryman 1997.31. World Bank 1991.32. World Bank 1993.33. Thomas and Wang 1997.
HUMAN DEVELOPMENT NETWORK 19
education are driven by factors related to educa-tion quality and labor demand.34 Returns to sec-ondary and tertiary education are high in partbecause graduates have captured rent wages inthe public sector for four decades. With structuraleconomic reform, this situation is gradually chang-ing and unemployment among workers with sec-ondary and higher education has increased. As thestructure of labor demand becomes increasinglydetermined by private employers, the mismatchbetween the skills imparted by education systemsand those needed by graduates will, in theabsence of significant change, become more pro-nounced. This mismatch is due to the historicalwidespread guarantee of public sector employ-ment, poor quality vocational and technical educa-tion and training which fails to teach the skillsrequired in private production and service indus-tries, and to systems which emphasize rote learn-ing over reasoning, adaptability and initiative.35
All countries need more than a competitive laborforce to survive and prosper. They also need thesocial resilience which allows a nation to con-front difficult times and to peacefully distributethe fruits of easier times. In MENA as in all mod-
ern societies, education is crucial in preventingsocial conflict and fragmentation by giving stu-dents a firm understanding of the content ofsocial contracts, that complex web of relationsamong actors in society. Through introduction tothe unifying society of the school, studentsthroughout the world learn how to fulfill theirroles in society and how to peaceably repair thesocial fabric of relations when it breaks down. Inlarge part education accomplishes these tasks byintroducing children to society through themicrocosm of the school, where they first take ona structured role and confront expectations, styl-ized behaviors, responsibilities and conse-quences. As students, children and young adultsin MENA thus meet types of people they havenever encountered before, and learn to seestrangers with different backgrounds as fellowcitizens in a broad society.
Ensure Universal Completion of CompulsoryEducation of Good Quality
While basic education36 is everywhere a rightrather than a privilege in MENA, universal partici-pation and completion of the basic cycle is not
MIDDLE EAST & NORTH AFRICA
34. Gillespie 1997.35. Gillespie 1997.36. Basic education comprises the primary and lower secondary stages (approximately grades 1-9) in most MENA countries.
0
1
2
3
4
5
6
Low distortionHigh education
Low distortionLow education
High distortionHigh education
High distortionLow education
GDP
Grow
th (
perc
ent)
Figure 14 Policy Distortion, Education, and GDP Growth in Sixty Developing Countries, 1965–87
Source: World Bank 1991.Note: High distortion reflects a foreign exchange premium of more than 30 percent; low distortion, a premium of 30 percent or less.
Education is measured by the average years of schooling, excluding post secondary schooling, of the population age 15 to 64. High education is defined as more than 3.5 years; low education, 3.5 years or less.
20 HUMAN DEVELOPMENT NETWORK
everywhere an accomplished fact. In Tunisia andMorocco, where the first nine years of educationare not compulsory, GERs are 52 percent and 45percent respectively. Where the opportunity costof child schooling is significant, such as in Yemenand Egypt, this can contribute to decreasingupper basic enrollments; however even wherechild labor is not an important factor, as inJordan and Algeria, upper basic GERs are onlyabout 75 percent.
Focusing on basic education does not imply thatsecondary enrollments are unimportant; indeedthe lower secondary stage is part of the basiccycle. In many countries, secondary education isimportant to raising enrollments in lower levels.In Yemen, there are not enough female secondarygraduates to train as female primary teachers,with the effect that girls’ primary enrollment suf-fers. In Egypt, the possibility of progressingthrough the secondary stage to higher educationprovides an important incentive for participationeven in basic schooling. Geographic and gendergaps in higher levels will decline with increasingfemale and rural candidates for those levelsresulting from universal completion of basic edu-cation. More concentrated attention to closinggaps in higher levels also becomes feasible as thecompletion agenda is closed in the basic cycle.
Significant obstacles to participation come fromboth the demand and supply sides. Direct and indi-rect costs of education (e.g, transport and supplycosts, and the opportunity cost of child labor,respectively), as well as the reluctance to exposegirls to the public world all dampen demand. Eachof these factors normally play a larger role in ruralareas where distances can be longer, child agricul-tural labor more important, social attitudes moreconservative and people, in general, poorer.Moreover, if quality is low enough, parents canmake an entirely sensible decision not to partakeof the service provided. At the same time, variousmechanisms used to ration limited spaces andmaintain quality impose supply obstacles to partic-ipation (e.g, repetition and up-or-out, age cali-brated promotion rules). These demand and supplyobstacles interact in various combinations with dif-fering effects on different populations. Poor stu-dents are more severely affected by direct costs,rural students by opportunity cost factors, and girlsmore by distance and social conservatism. As thesegroups overlap, the obstacles increase: poor, ruralgirls are at a distinct disadvantage.
Universal completion of compulsory educationwould create higher levels of literacy and numeracyin society and wider dissemination of individuallife skills for national social development.
MIDDLE EAST & NORTH AFRICA
0
10
20
30
40
50
60
SyriaIranEgyptMoroccoYemenWBGTunisiaJordanAlgeria
Labor force with at least secondary education
Total labor force
(per
cent
)
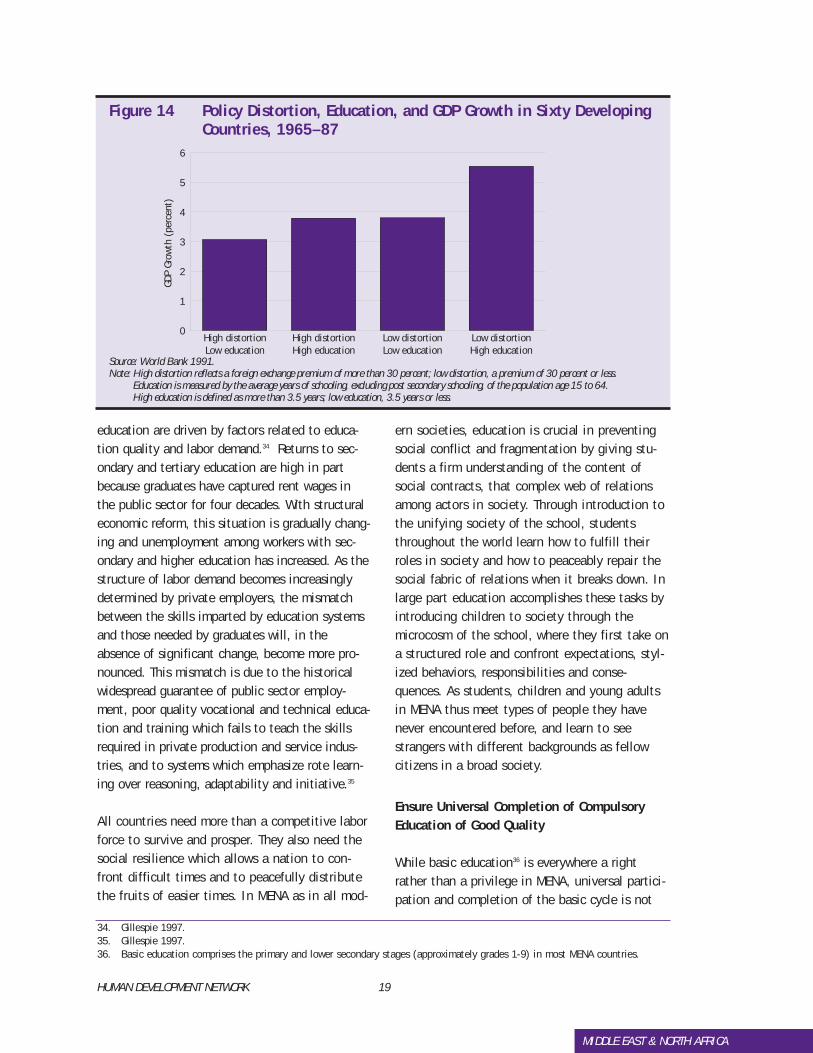
Figure 15 Unemployment Rates: Total and Among Workers with at Least Secondary Education, early 1990s
Source: World Bank 1995a
HUMAN DEVELOPMENT NETWORK 21
Increasing female completion of compulsory educa-tion would yield improvements in health and nutri-tion status for women and children and would raisewomen’s stature in society. Increasing the generallevel of literacy and numeracy would provide coun-tries with workforces capable of quickly learningnew technologies and adapting to new productionprocesses and demands, and with larger numbers ofsecondary and tertiary school candidates. It wouldnarrow the gap between national standards andstudent achievement. In the long run, it wouldhelp Yemen reach an adult mean of four years ofeducation, the approximate threshold or "takeoff"point for productivity gains. Universal participationwill also impose burdens. Demand for materials,facilities and human resources would rise, as wouldthe need for personnel training and for manage-ment and planning capacity. However, failure tocontinue moving toward universal participation inbasic schooling will halt progress in social develop-ment and make economic competitiveness withnations in Eastern Europe and Asia unrealistic.
Increase Country-Level Information onEducation and the Effects of Reform
Effective education systems produce studentswhose academic achievement meets clearly
defined standards. Systems must thus be able toidentify weaknesses which impede the ability toeither define standards or enable students tomeet them, so that reforms can target areaswhere change is needed. Broad indicator informa-tion — e.g., school enrollment data, wastagerates, numbers of graduates — is not alone suffi-cient to illuminate system performance and targetreforms. Information which reveals the more inti-mate processes and characteristics of schools andclassrooms is crucial: how teachers and pupils usetextbooks and other materials, the matchbetween the language of instruction and the lan-guage pupils speak at home, the structures andpatterns of interaction between and among pupilsand teachers, the suitability of the learning envi-ronment to learning. In MENA, none of this isexamined routinely or systematically. Without it,the target of education policy — school andclassroom practice — is portrayed by varioustechnical and political actors in conflicting ways,each of which can imply a different policyresponse. Such inescapably misinformed policyresponses run a high risk of being misdirected.
Three types of information, discussed below, areneeded to identify problems in the educationsystem, to design appropriate technical reforms
MIDDLE EAST & NORTH AFRICA
0
20
40
60
80
100
54321
Rural FemaleRural MaleUrban FemaleUrban Male
(per
cent
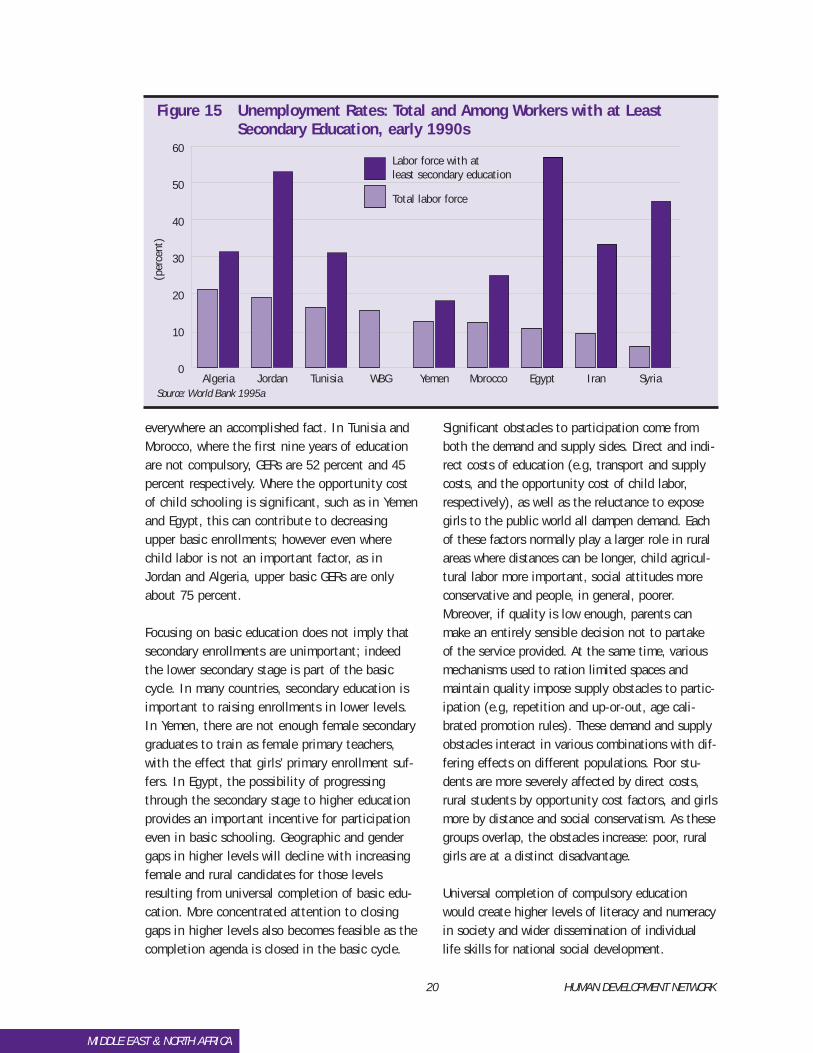
)Figure 16 Share of Children aged 7–12 enrolled in school by expenditure
quintile, gender and locale, Morocco, 1990–91
Source: World Bank 1994a
22 HUMAN DEVELOPMENT NETWORK
and policy responses and to generate supportfor reform.
Management information on the procedures andpatterns of resource allocation. This includes
inputs such as textbook availability and numberand type of trained teachers by school, and basicbroad indicators such as repetition and teacherabsenteeism. This information provides teachers,trainers, curriculum and materials producers,administrators and Ministers with the tools tosuccessfully perform their responsibilities. It isneeded to broadly identify needed system changes.It permits increasingly effective use of resourcesthrough increasingly strategic allocation and pro-motes accountability by increasing the trans-parency of performance.
Rigorous, regular assessments of what studentsare learning at different levels of the system andwithin subject areas, compared with goals forstudent learning. Assessments can be carried outon many levels, and can measure cognitiveachievement, values, attitudes and skills. Theycan be developed through national and interna-tional standardized and norm-referenced assess-ments, through curriculum-based measures andthrough criterion-referenced tests reflectingnational standards and priorities. They provideinformation to policy makers about the extent towhich individual schools, school clusters and theentire education system impart the skills stu-dents need to meet established standards. Thisknowledge enables policy makers to identifywhere and what about service delivery and educa-tional processes needs to be improved. Resultscan also be shared with private and publicemployers, who will find the information it pro-vides about the emerging labor pool valuable. Thisin turn will create incentives among system man-agers and political leaders to maintain andimprove the quality of education.
Process effectiveness information can be gatheredthrough pilots and monitoring of ongoing activi-ties. This information can help gauge the appro-priateness of grade level materials or specifictechnologies, the match between pre- and in-ser-vice teacher training activities and classroomneeds, the adequacy of instructional time on taskand the impact of family and community support.
MIDDLE EAST & NORTH AFRICA
Box 2
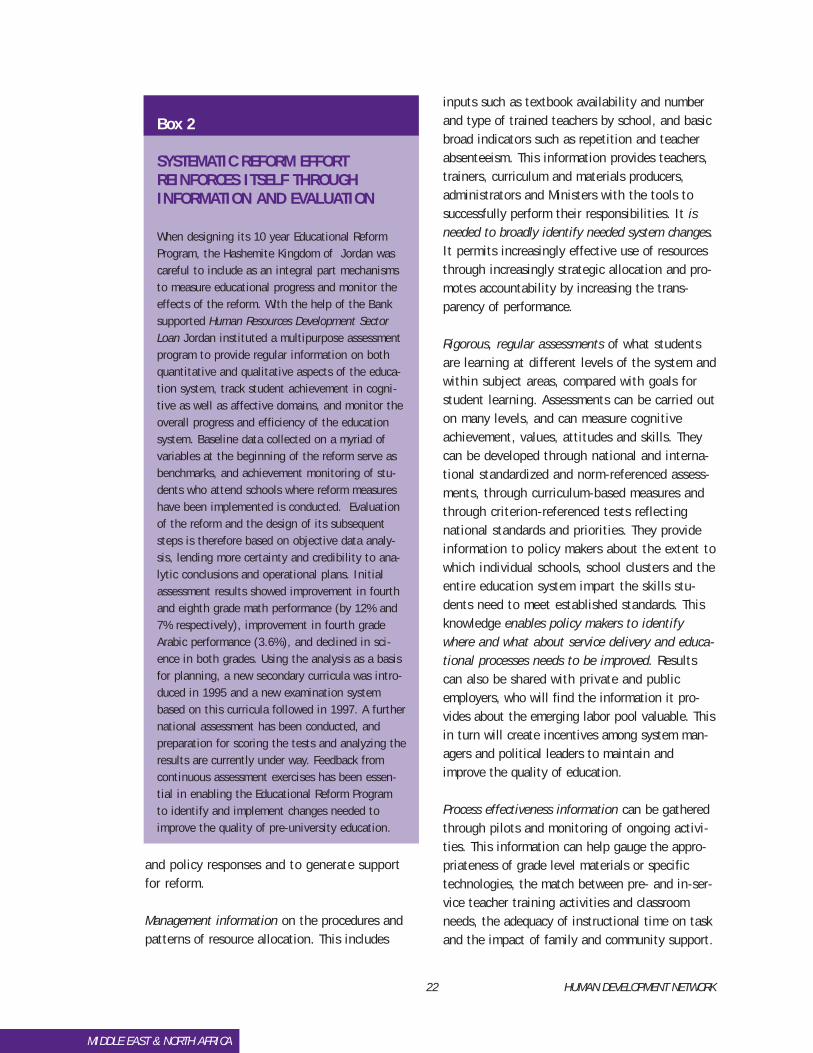
SYSTEMATIC REFORM EFFORTREINFORCES ITSELF THROUGHINFORMATION AND EVALUATION
When designing its 10 year Educational ReformProgram, the Hashemite Kingdom of Jordan wascareful to include as an integral part mechanismsto measure educational progress and monitor theeffects of the reform. With the help of the Banksupported Human Resources Development SectorLoan Jordan instituted a multipurpose assessmentprogram to provide regular information on bothquantitative and qualitative aspects of the educa-tion system, track student achievement in cogni-tive as well as affective domains, and monitor theoverall progress and efficiency of the educationsystem. Baseline data collected on a myriad ofvariables at the beginning of the reform serve asbenchmarks, and achievement monitoring of stu-dents who attend schools where reform measureshave been implemented is conducted. Evaluationof the reform and the design of its subsequentsteps is therefore based on objective data analy-sis, lending more certainty and credibility to ana-lytic conclusions and operational plans. Initialassessment results showed improvement in fourthand eighth grade math performance (by 12% and7% respectively), improvement in fourth gradeArabic performance (3.6%), and declined in sci-ence in both grades. Using the analysis as a basisfor planning, a new secondary curricula was intro-duced in 1995 and a new examination systembased on this curricula followed in 1997. A furthernational assessment has been conducted, andpreparation for scoring the tests and analyzing theresults are currently under way. Feedback fromcontinuous assessment exercises has been essen-tial in enabling the Educational Reform Programto identify and implement changes needed toimprove the quality of pre-university education.
HUMAN DEVELOPMENT NETWORK 23
MIDDLE EAST & NORTH AFRICA
Policymakers, headmasters, teachers and parentcommittee members can use this information todetermine how best to change areas that needimprovement. It is this information which givessubstance to reforms indicated by managementand learning acquisition information (above) andwhich gives them the highest likelihood ofimpacting learning.
Education reform is a long term process. Its suc-cess depends on the knowledge that systemactors and the public have about the system, andthis in turn depends on routine and systematicdata gathering and examination of other, lessquantifiable, information. When such process isused to learn how the system functions, all par-ticipants — officials, employees, students andparents — benefit from the improvements thatbecome possible. Wide dissemination of informa-tion on the system is key, and national media canfocus public attention on education issues andgenerate support for solutions.
Without mechanisms to inform policy makers andpractitioners, attempts at educational reform willbe futile. Reforms — from teacher training over-hauls, to curriculum and textbook revision todecentralization of financing sources and budget-ing — will be decreed, designed, adopted anddiscarded without anyone knowing what, how orindeed whether anything was accomplished at all.In such a context policymakers, teachers and par-ents would stand powerless to halt a process oflearning decline and resource waste.
Maintain a Sustainable FinancialFoundation for Education
Spending on education by MENA countries, typi-cally about 5 percent to 6 percent of GDP, is inline with the rest of the world. Costs, largelyassumed by the public sector, have been steadilydriven upward by population growth and risingenrollment rates. Even though the momentum ofpopulation growth is about to stop for basic andsecondary school age populations, which are
expected to remain stable in most MENA coun-tries, spending on education is projected to growsignificantly. Spending growth in higher educationis already exponential and will soon becomeunsustainable. In addition, financial pressure inprimary and secondary will also remain intense.Completion of universal access to compulsory edu-cation, reductions in dropout rates, higher com-pletion rates, and internationally competitivelearning achievements will require continuedstrong public sector commitment.
Given Governments’ commitment to education, itsshare in the public budget is likely to increase.However, when competing demands exceedgrowth in total public funds, each increase ineducation’s share implies a decrease in otherareas. While there are opportunities for budgetaryrestructuring (e.g, the share spent on defense ison average higher than in other developing coun-tries), for all practical purposes there are limits tocross sectoral adjustments. How then can theabove objectives be financed?
The first principle is to spend public resourcesfor public goods. Basic education is a publicgood, and should receive public funding. Higherlevels of education have a higher share of pri-vate value, and should therefore be financed inpartnership with families and the private sector.On average in MENA, one student in higher edu-cation costs the government about as much as10 students in primary education. Despite high-er private returns to higher levels of educationin the region, there are huge social pay-offs tobasic education. It thus seems difficult to justifysignificant public subsidies for higher educationas long as compulsory education is not univer-sal, as in Egypt, Morocco and Yemen. Highereducation may be needed, but public sector pri-orities will have to be chosen within the avail-able budgetary envelope. The range of optionsfor higher education funding should not berestricted to the public sector. From an equityperspective, there are strong grounds to increasefees for those who can afford it and to consider
24 HUMAN DEVELOPMENT NETWORK
student loans where establishing repaymentmechanisms is feasible.
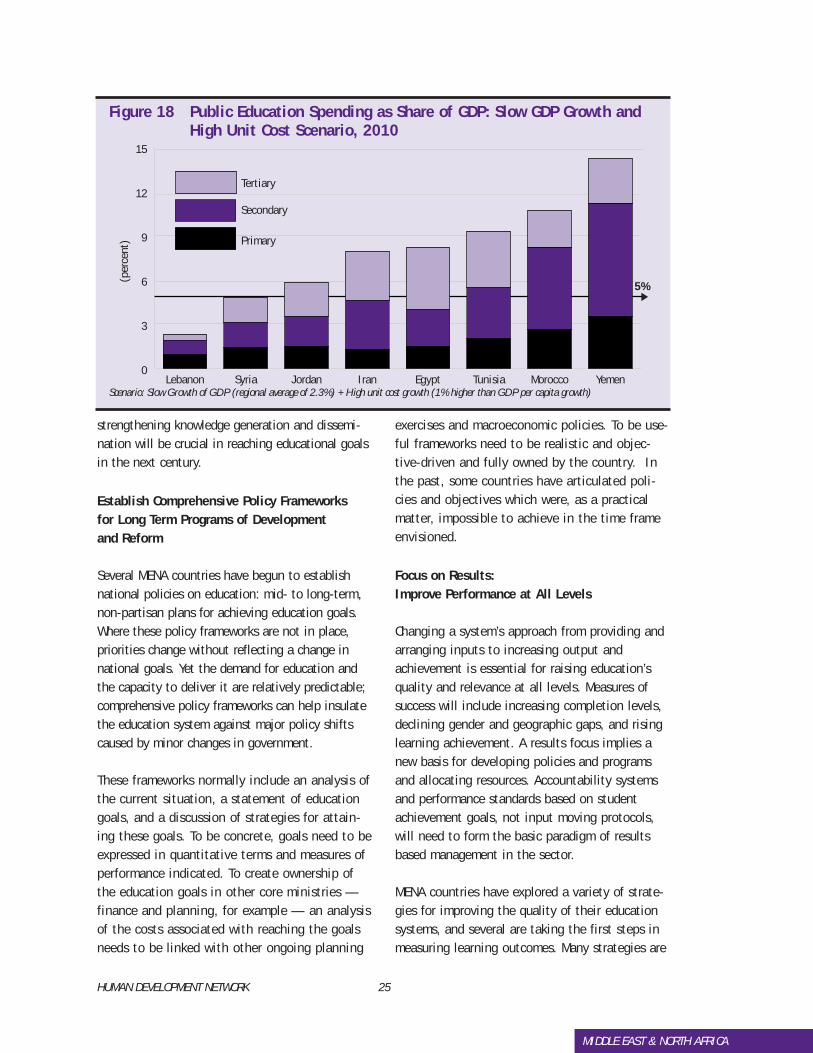
Cost projections for education that assume mod-est GDP growth of 2.3 percent and a somewhatgenerous growth in unit costs demonstrate that 5percent of GDP would be adequate to support uni-versal primary in all countries, 75 percent sec-ondary enrollment rates in some countries andeven 25 percent tertiary enrollments in Syria andLebanon. Jordan, Iran, and Egypt will havefinancing gaps in tertiary education only, andshortfalls will be greatest in Tunisia, Yemen andMorocco where even secondary education couldnot be fully funded under this scenario.
III. SIX STRATEGIC PATHS FOR OBTAIN-ING DEVELOPMENT OBJECTIVES
The strategies identified below will be useful tocountries in pursuing the objectives discussedabove. Both organizational changes and changinginstitutional norms can be effective in improvingthe system performance. Using comprehensive poli-cy frameworks to plan and guide development,improving system performance at all levels, facili-tating private finance and provision in post-com-pulsory stages, improving internal efficiency, and
MIDDLE EAST & NORTH AFRICA
Box 3
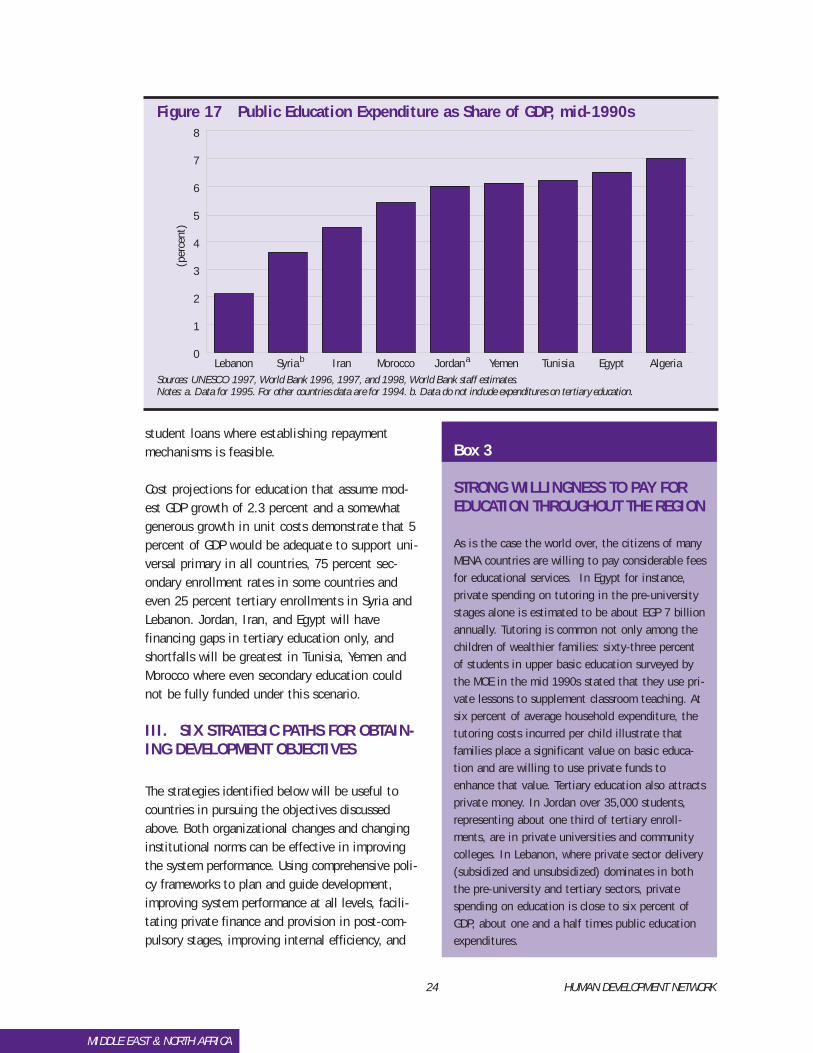
STRONG WILLINGNESS TO PAY FOREDUCATION THROUGHOUT THE REGION
As is the case the world over, the citizens of manyMENA countries are willing to pay considerable feesfor educational services. In Egypt for instance,private spending on tutoring in the pre-universitystages alone is estimated to be about EGP 7 billionannually. Tutoring is common not only among thechildren of wealthier families: sixty-three percentof students in upper basic education surveyed bythe MOE in the mid 1990s stated that they use pri-vate lessons to supplement classroom teaching. Atsix percent of average household expenditure, thetutoring costs incurred per child illustrate thatfamilies place a significant value on basic educa-tion and are willing to use private funds toenhance that value. Tertiary education also attractsprivate money. In Jordan over 35,000 students,representing about one third of tertiary enroll-ments, are in private universities and communitycolleges. In Lebanon, where private sector delivery(subsidized and unsubsidized) dominates in boththe pre-university and tertiary sectors, privatespending on education is close to six percent ofGDP, about one and a half times public educationexpenditures.
0
1
2
3
4
5
6
7
8
AlgeriaEgyptTunisiaYemenJordanMoroccoIranSyriaLebanon b a
(per
cent
)
Figure 17 Public Education Expenditure as Share of GDP, mid-1990s
Sources: UNESCO 1997, World Bank 1996, 1997, and 1998, World Bank staff estimates.Notes: a. Data for 1995. For other countries data are for 1994. b. Data do not include expenditures on tertiary education.
HUMAN DEVELOPMENT NETWORK 25
strengthening knowledge generation and dissemi-nation will be crucial in reaching educational goalsin the next century.
Establish Comprehensive Policy Frameworks for Long Term Programs of Development and Reform
Several MENA countries have begun to establishnational policies on education: mid- to long-term,non-partisan plans for achieving education goals.Where these policy frameworks are not in place,priorities change without reflecting a change innational goals. Yet the demand for education andthe capacity to deliver it are relatively predictable;comprehensive policy frameworks can help insulatethe education system against major policy shiftscaused by minor changes in government.
These frameworks normally include an analysis ofthe current situation, a statement of educationgoals, and a discussion of strategies for attain-ing these goals. To be concrete, goals need to beexpressed in quantitative terms and measures ofperformance indicated. To create ownership ofthe education goals in other core ministries —finance and planning, for example — an analysisof the costs associated with reaching the goalsneeds to be linked with other ongoing planning
exercises and macroeconomic policies. To be use-ful frameworks need to be realistic and objec-tive-driven and fully owned by the country. Inthe past, some countries have articulated poli-cies and objectives which were, as a practicalmatter, impossible to achieve in the time frameenvisioned.
Focus on Results: Improve Performance at All Levels
Changing a system’s approach from providing andarranging inputs to increasing output andachievement is essential for raising education’squality and relevance at all levels. Measures ofsuccess will include increasing completion levels,declining gender and geographic gaps, and risinglearning achievement. A results focus implies anew basis for developing policies and programsand allocating resources. Accountability systemsand performance standards based on studentachievement goals, not input moving protocols,will need to form the basic paradigm of resultsbased management in the sector.
MENA countries have explored a variety of strate-gies for improving the quality of their educationsystems, and several are taking the first steps inmeasuring learning outcomes. Many strategies are
MIDDLE EAST & NORTH AFRICA
0
3
6
9
12
15
YemenMoroccoTunisiaEgyptIranJordanSyriaLebanon
Tertiary
Secondary
Primary
5%
(per
cent
)Figure 18 Public Education Spending as Share of GDP: Slow GDP Growth and
High Unit Cost Scenario, 2010
Scenario: Slow Growth of GDP (regional average of 2.3%) + High unit cost growth (1% higher than GDP per capita growth)
26 HUMAN DEVELOPMENT NETWORK
available to pursue these goals; four areas areparticularly important.
First, simplifying system management. Most MENAeducation systems are managed by at least threeministries, and often others also have someperipheral involvement. This creates competitionfor resources and limits consensus on system-wideapproaches for improving performance.Consolidating ministries and focusing their atten-tion on standards and results rather than deliveryprocess is the administrative analog to a pedagog-ic focus on learning rather than input delivery.
Second, decentralization, in part through increas-ing school autonomy over teaching methods, lan-guage of instruction,37 allocation of resourceswithin the school and school schedules canincrease efficiency and the effectiveness of class-room processes. Increasing school autonomy canbe accompanied by heightened community partic-ipation, as in Yemen where involving Fathers’Councils in school management is effective inmobilizing community support for education.
Third, aligning curriculum (including textbooks andinstructional materials), teacher training, instruc-tion and assessment. When these four key educa-tional elements are not aligned within levels,they cannot work together to create a well per-forming system. Curriculum and learning skillsacquisition also need to be coherently sequencedbetween levels — from basic and secondary,including VTE, through tertiary — to ensure thatthe system functions as a whole rather than as aseries of unrelated stages. Alignment is particu-larly important for basic and secondary level edu-cation. In addition, teachers need to learnstrategies that accommodate differing learningstyles among students.
Fourth, professionalizing the teaching cadre at alllevels, especially basic and secondary. Improvingthe quality and performance of the education sys-tem will inevitably require improving the quality
MIDDLE EAST & NORTH AFRICA
Box 4
STRATEGIC FRAMEWORK FOR LONGTERM SECTOR PLANNING IN EGYPT
To pursue the Government’s goals for compulsoryeducation, Egypt developed a long–term StrategicFramework defining 13 objectives and the inter-ventions needed to achieve these goals. Whileaffording the flexibility needed to respond toevolving requirements of educational change at thecentral and local levels, the Framework will guideplanning and activities over the 15 to 20 year lifeof Egypt’s multi–phase Education EnhancementProgram (EEP). Activities are included in an annualwork plan (AWP) designed each year through aniterative process involving the central Ministry,local Governorate bodies, international donors, anda Planning, Programming and Monitoring Unitestablished for the EEP. Each year’s work planincorporates priority activities needed to imple-ment interventions identified in the StrategicFramework. To ensure that interventions are consis-tent with local needs, Governorate-level units andthe MOE discuss proposals in planning each AWP.Annual indicators measure outputs, and showprogress toward annual and long–term objectives.
The benefits of this system have been consider-able. Previously weak efforts in distance education,school management, and Education ManagementInformation Systems (EMIS) improvement havebeen rejuvenated. Distance education and EMISactivities had been focused simply on hardwarerequirements; by being incorporated in an overallFramework, the use to which hardware is put hasbecome the prime concern. As a result, distanceeducation materials are now directly linked toimproving classroom learning, and EMIS activitiesare increasingly oriented towards the use of infor-mation rather than simply its production. In addi-tion, by providing a long term and coherentFramework for activity planning, Egypt makes bet-ter use of donor inputs, and donors achieve moreimpact for the assistance they provide.
37. In many cases, language of instruction is a political rather than pedagogical issue; when this is the case, schools may not beauthorized to choose the language of instruction.

HUMAN DEVELOPMENT NETWORK 27
MIDDLE EAST & NORTH AFRICA
38. President’s Committee of Advisors on Science and Technology 1997.39. Becker 1993.
of the teaching cadre. This can be accomplishedin part through focusing preservice and inservicetraining on what teachers need to know and do,rather than on credentials. Improving the incen-tive structures for teachers, recruiting into theteaching cadre students from more selectivestreams of education and training, and increasingthe share of secondary and university teachingstaff with teaching degrees are all importantsteps as well.
A fifth strategy may be appropriate for somecountries: “leapfrogging” through the use of tech-nology. Evidence that technology can improve thequality of teaching and learning is growing, atleast for OECD countries.38 Research has demon-strated that students using traditional computer-based systems outperformed those taught withoutthe use of such systems, and there is beginningevidence that computers can be effective indeveloping the active learning strategies consid-ered crucial for innovation. However, caution iswarranted; one 1993 estimate placed the annualcost per student for an optimal package of hard-ware, software and maintenance at US$556 pluspersonnel costs (estimated at US$1,375 in theU.S. but undoubtedly less in the MENA region).39
Increase Private Sector Participation inEducation Through Legal, Regulatory andAccreditation Frameworks
Most private sector participation in educationprovision and finance in the Middle East andNorth Africa involves private for-profit enterpris-es. Not-for-profit education institutions are con-strained by the lack of facilitating legal,regulatory and accreditation frameworks, particu-larly for post-compulsory education. While theState has, in most cases, the responsibility toguarantee access to high quality basic educationfor all and standards in post basic levels, publicfinance and provision at all levels is not afford-able without a serious deterioration of quality.
Private financing is thus a priority area for devel-opment, through both cost recovery in publicinstitutions and expansion of private (for-profitor not-for-profit) delivery systems.
Regulatory frameworks that create demand andsupply incentives and provide sufficient autono-my to operate independent institutions will beneeded. To enable the market to move past pro-vision of the low quality training which meetssimple credentialling demand, the financial abili-ty to establish expensive facilities and theopportunity to borrow for tuition against futureearnings are needed.
Limited public subsidies can be used to enable not-for-profit institutions to compete on quality or cre-ate incentives for profit making institutions to doso. In Hungary, incentives are created by provisionsfor support based on efficiency and performancestandards. Providing limited, targeted support tospur development of both types of private institu-tions may be a more cost effective means of meet-ing social demand for higher education than directpublic financing and provision. Development ofIran’s private Islamic Azad University was encour-aged in this way, through subsidization of theinitial capital investment costs.
Governments will need to choose the point alonga spectrum of control ranging from full institu-tional independence to full State authority overprovision. Regulation which tightly controls manyaspects of provision eliminates sufficient autono-my to make private operations feasible andimpedes private provision. On the other end ofthe spectrum, significant absence of public con-trol over crucial aspects of provision would leadto substandard quality in some instances. Themost important areas for regulatory attention areteachers, curriculum and facilities. In Jordan, thegrowing for-profit schools sector is subject toregulations mandating use of national textbooks,exams and teacher qualification standards. These
28 HUMAN DEVELOPMENT NETWORK
MIDDLE EAST & NORTH AFRICA
requirements are not felt to be overly onerous byschool proprietors.
Issues relevant to regulation of teachers in for-profit and not-for profit educational institutionsinclude the terms of employment, includingsalary, tenure and termination rights, certifica-tion, and mandatory teacher qualifications. Whilediscretion may remain with school managementover individual hiring and firing decisions, rulesdelineating the extent of that discretion areneeded to ensure some uniformity of qualitythroughout the system and to give administra-tors, teachers and parents a reliable baseline ofexpectations on which they can depend.
All private educational institutions will likewiseneed a clearly defined sphere of authority overcurriculum and materials choice. Regulation whichso closely controls curricular choice as to mandatesubjects, sequencing and hours by subject wouldeliminate a significant potential for the differenti-ation which can drive demand for and growth ofnon-public provision. In Morocco, when privateschools using the French curriculum became oblig-ed to teach the national curriculum, they choseinstead to use both curricula to maintain the dif-ferentiation which supports the demand for theirservices. At the same time, the absence of qualityensuring regulation can create a bifurcated marketin which well-to-do students enjoy very high qual-ity and everybody else suffers from a “race to thebottom” among providers.
Ownership of, and liability for, facilities needs tobe placed on the spectrum between private andpublic responsibility. Governments may choose toassume start-up costs but then transfer owner-ship to private actors (the inverse of a Build-Transfer-Operate infrastructure contract) whowould incur expansion and maintenance obliga-tions in return for the initial subsidy. Both profitmaking and not-for-profit private institutionsbenefiting from this type of start-up subsidycould be required to accept a set percentage oftuition free students.
Governments may wish to establish independentaccreditation boards with authority over theaspects of quality control discussed above todevelop and monitor standards in private educa-tion. Independent accreditation boards can con-tain a mix of public and private representativesand should have a clearly defined scope ofauthority. From a systemic perspective, they con-stitute a mechanism for coordinating private withpublic provision. They thus need to be integratedin long term sector planning exercises.Accreditation boards independent of universitycontrol are planned by Jordan as a way to equal-ize the regulatory environment in public and pri-vate higher education.
Improve Internal Efficiency
Most MENA countries devote a large share of theirnational budgets to education. But both investmentand recurrent resources are often not used efficient-ly. There is enough money in most cases for basiceducation, but it is often used to pay the salariesof more teachers than those who actually teach, tofinance construction of schools located withoutregard to student habitations and, ultimately, toproduce students who do not learn math and sci-ence at international standards, and who possiblydo not learn how to learn. High repetition levelsadd to the resource burden. The problems multiplywith streaming and tracking systems in secondarythat limit flexibility and with excessive numbers oftertiary institutions and programs.
Most countries in the region, having achievedhigh basic education participation, now need torespond to increasing demand for secondary andhigher education. Weak sectoral managementoften leads to inefficient use of existingresources. Cost data on categories of expenditureand actual disbursements sufficient to monitorinternal efficiency is frequently absent. Civil ser-vice lines of authority and regulations impedeeducation managers ability to set policies andprocedures regarding employment, hiring, promo-tion, remuneration and termination standards,
HUMAN DEVELOPMENT NETWORK 29
MIDDLE EAST & NORTH AFRICA
severely limiting the system’s prospects for effi-cient operation, as 90 percent of recurrent fundsare normally spent on staff.
Creation of independent teaching corps not gov-erned by civil service regulations would fostergreater accountability, flexibility and effective-ness. Developing professional associations of edu-cators would be an important step in thisdirection. These associations could set profession-al standards, enforce codes of conduct, work toimprove the condition of educators and advance-ment of the profession, and introduce a licensingregime using teaching permits, periodic renewalrequirements and retraining.
Controlling and managing unit costs will also becritical. Because 90 percent of unit costs consistof salaries, which will typically rise as GDP rises,unit costs will also increase as output and income
increase. With such a high proportion of unitcosts sensitive to GDP growth, the budgetaryadvantages created by GDP growth would disap-pear if the total salary bill grows faster than doesGDP. In such a scenario, no funds would remainfor expanding access or ensuring internationallycompetitive learning standards.
Although differences among countries are large,the region is characterized by high levels of non-teaching to teaching staff, declining student-to-teacher ratios, and high repetition rates. Thissuggests that there is room for more internal effi-ciency and more budgetary savings. However, thetrade-off is sharp: declining student-to-teacherratios in MENA are often due to the opening ofschools in remote villages where the number ofstudents is low (e.g., in Jordan, Egypt andMorocco) in order to increase access. Similarly,high repetition rates are at times linked to a
Box 5
PUBLIC-PRIVATE PARTNERSHIPS TO IMPROVE TECHNICAL TRAINING
In Tunisia, the Government is redefining how technical training programs are designed and delivered, mov-ing the focus from public training centers to enterprises in need of skilled workers. In the past, pre-serviceindustrial training was designed and delivered entirely by public institutions. Now, with support from aFund set up under the Bank supported Second Training and Employment Project, a dual system providingtraining in enterprises and centers has been established. Financing criteria ensure that training respondsto enterprise needs. Centers submit feasibility studies demonstrating a clear economic justification for thetraining to be delivered: evidence that rates of return are positive and that labor market demand for work-ers with the skills in question is strong. Centers also obtain commitments — signed contracts — withenterprises, arranging for training delivery in the enterprise. This is the key to ensuring the dual nature ofthe system. Crucial inputs to ensure successful operation of the dual system are also supported by the pro-ject. Traditional curricula are adapted to specific enterprise needs, and selected enterprise workers aregiven teaching methods instruction so they can effectively deliver training in-house.
For in-service training in small and medium sized enterprises (SMEs — businesses with fewer than 100employees), Tunisia has also moved the design and initiative for training closer to employers and employ-ees. Using a survey of registered SMEs to identify skill needs in the sector, the Government contracts withtraining centers to provide short courses (about a week or less) addressing the needs of these businesses.Training centers advertise in the local media, and any employee of a registered SME is eligible to take thecourse free of charge. Costs are recovered with funds raised through the Vocational Training Tax paid byregistered firms. By defining courses according to enterprise identified skill needs and depending onemployee initiative to pursue training, the program structure ensures greater relevance and efficiency thantraditionally prevails in public sector, institution-focused training schemes.
30 HUMAN DEVELOPMENT NETWORK
deliberate pursuit of quality and budgetary sav-ings (e.g., in Tunisia).
Considering alternative forms of education delivery,particularly at the secondary and tertiary level,deserves attention. Two important possibilities areincreasing linkages with the private sector anddistance education (e.g., Arab Open University).Public-private partnerships can be very importantfor increasing efficiency, for instance through con-tracting out to the private sector for provision ofessential goods and services such as textbooksand building maintenance, or through establishingpairing relationships between enterprises andhigher vocational and technical education toensure that training resources and student timeare well targeted.
With completion rates in the primary and lowersecondary stages nearing universal levels, demandfor places in higher secondary and tertiary educa-tion will grow beyond the capacity of availablepublic funds. Because students at these levelshave the ability to learn independently, distanceeducation delivery methods can provide access toupper levels at much lower per student costswhile maintaining high quality standards. If atelevised lecture reaches 10,000 students, itcould be affordably delivered by a Nobel Laureate.There is not much experience with these methodsin the region, but some examples illustrate thatthe prospects of success with distance educationare high; costs depend largely on the number ofstudents enrolled and the modality of instruction.Two distance education institutions are presentlyoperating in the region, and a third — the ArabOpen University — is planned.
Al-Quds Open University (AOU) is a national insti-tution for higher education operated by thePalestinian Authority. The mode of instruction isprint-based, and therefore low cost. It operatesnine study centers in the major cities in WestBank–Gaza, as well as two study centers in theUnited Arab Emirates, and enrolled 10,500 studentsin 1998. It has a presence on the World Wide Web
at http://www.palestine-net.com/education/qou.AOU accepts students holding a general secondaryschool certificate or its equivalent and offers pro-grams of study in education, management andentrepreneurship, technology and applied sciences,social and family development and continuing edu-cation. Fees are lower than those of conventionaluniversities in West Bank–Gaza, amounting toabout US$16 per credit hour.
The University of Tourism and Culture for Peace isa not-for-profit institution based in Marseilles,France, that offers, in cooperation with theUniversity of Rabat, University of Bethlehem andUniversity of Ben Gourion, a program of study ontourism management sponsored in part by ClubMed. The mode of instruction is two-way telecon-ferencing, and therefore high cost. Studentsenroll in courses at their own universities andare taught by a team of professors from the par-ticipating universities. Courses are taught inFrench and English, with translation into Arabicas needed. Approximately 80 students at fouruniversities were enrolled in 1998. Unit costs arehigh due to the high cost of satellite time(US$40/hour), capital costs for the speciallyequipped classrooms (US$300,000 per site forclassrooms, engineering and antennas) and oper-ating costs (US$400,000 per year).
Distance education is also being used to help asignificant portion of the Yemeni teaching cadreto upgrade their skills. Since late 1993 over 10percent of Yemen’s basic education teachers havetaken part in a World Bank supported programwhich uses field libraries and televised lectures.Training is delivered to grade 1–4 teachers whoare just two years removed from secondary schoolgraduation. It allows teachers to continue work-ing in schools while improving their subject mat-ter knowledge and teaching skills.
Build a Community of Learners
Designing and implementing results based strate-gies requires a community of learners willing to
MIDDLE EAST & NORTH AFRICA
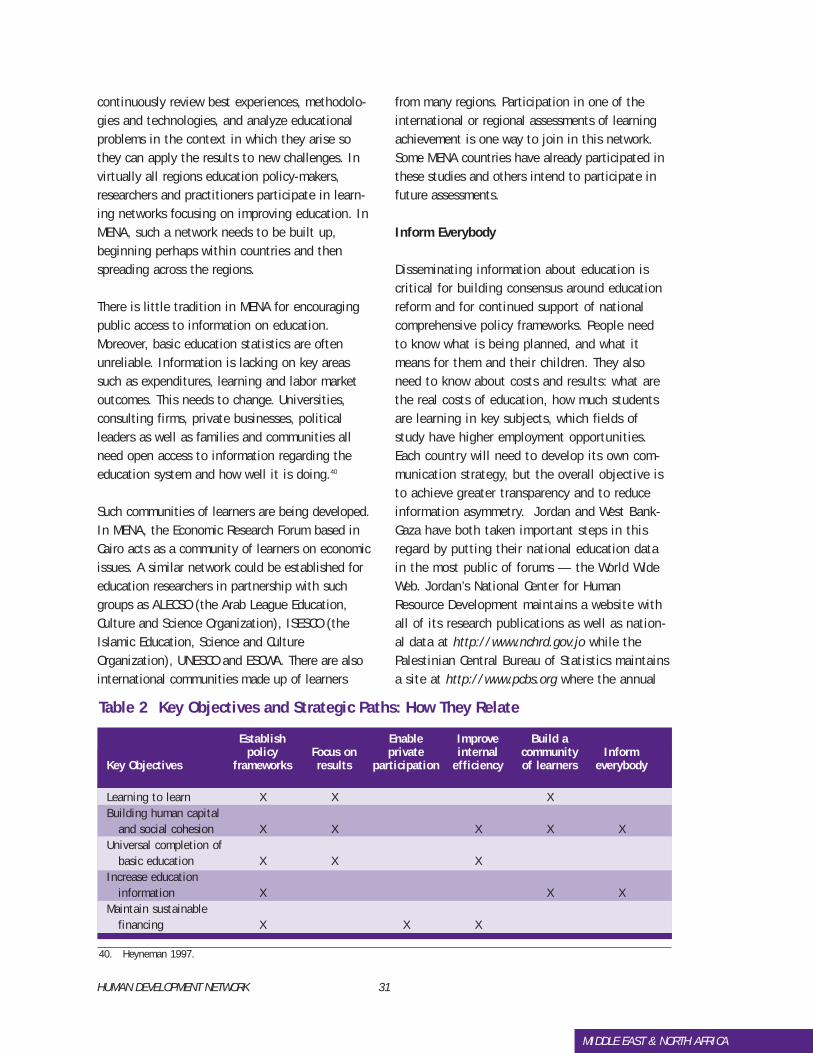
HUMAN DEVELOPMENT NETWORK 31
MIDDLE EAST & NORTH AFRICA
continuously review best experiences, methodolo-gies and technologies, and analyze educationalproblems in the context in which they arise sothey can apply the results to new challenges. Invirtually all regions education policy-makers,researchers and practitioners participate in learn-ing networks focusing on improving education. InMENA, such a network needs to be built up,beginning perhaps within countries and thenspreading across the regions.
There is little tradition in MENA for encouragingpublic access to information on education.Moreover, basic education statistics are oftenunreliable. Information is lacking on key areassuch as expenditures, learning and labor marketoutcomes. This needs to change. Universities,consulting firms, private businesses, politicalleaders as well as families and communities allneed open access to information regarding theeducation system and how well it is doing.40
Such communities of learners are being developed.In MENA, the Economic Research Forum based inCairo acts as a community of learners on economicissues. A similar network could be established foreducation researchers in partnership with suchgroups as ALECSO (the Arab League Education,Culture and Science Organization), ISESCO (theIslamic Education, Science and CultureOrganization), UNESCO and ESCWA. There are alsointernational communities made up of learners
from many regions. Participation in one of theinternational or regional assessments of learningachievement is one way to join in this network.Some MENA countries have already participated inthese studies and others intend to participate infuture assessments.
Inform Everybody
Disseminating information about education iscritical for building consensus around educationreform and for continued support of nationalcomprehensive policy frameworks. People needto know what is being planned, and what itmeans for them and their children. They alsoneed to know about costs and results: what arethe real costs of education, how much studentsare learning in key subjects, which fields ofstudy have higher employment opportunities.Each country will need to develop its own com-munication strategy, but the overall objective isto achieve greater transparency and to reduceinformation asymmetry. Jordan and West Bank-Gaza have both taken important steps in thisregard by putting their national education datain the most public of forums — the World WideWeb. Jordan’s National Center for HumanResource Development maintains a website withall of its research publications as well as nation-al data at http://www.nchrd.gov.jo while thePalestinian Central Bureau of Statistics maintainsa site at http://www.pcbs.org where the annual
40. Heyneman 1997.
Establish Enable Improve Build apolicy Focus on private internal community Inform
Key Objectives frameworks results participation efficiency of learners everybody
Learning to learn X X XBuilding human capital
and social cohesion X X X X XUniversal completion of
basic education X X XIncrease education
information X X XMaintain sustainable
financing X X X
Table 2 Key Objectives and Strategic Paths: How They Relate
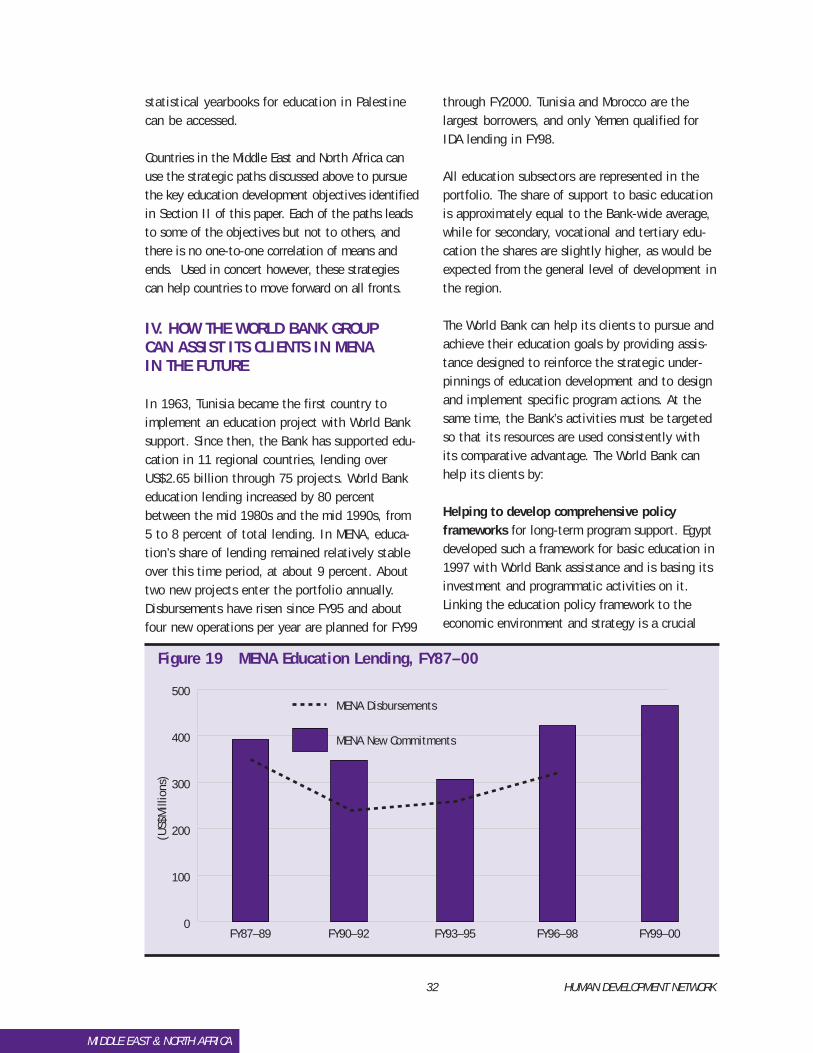
32 HUMAN DEVELOPMENT NETWORK
MIDDLE EAST & NORTH AFRICA
statistical yearbooks for education in Palestinecan be accessed.
Countries in the Middle East and North Africa canuse the strategic paths discussed above to pursuethe key education development objectives identifiedin Section II of this paper. Each of the paths leadsto some of the objectives but not to others, andthere is no one-to-one correlation of means andends. Used in concert however, these strategiescan help countries to move forward on all fronts.
IV. HOW THE WORLD BANK GROUP CAN ASSIST ITS CLIENTS IN MENA IN THE FUTURE
In 1963, Tunisia became the first country toimplement an education project with World Banksupport. Since then, the Bank has supported edu-cation in 11 regional countries, lending overUS$2.65 billion through 75 projects. World Bankeducation lending increased by 80 percentbetween the mid 1980s and the mid 1990s, from5 to 8 percent of total lending. In MENA, educa-tion’s share of lending remained relatively stableover this time period, at about 9 percent. Abouttwo new projects enter the portfolio annually.Disbursements have risen since FY95 and aboutfour new operations per year are planned for FY99
through FY2000. Tunisia and Morocco are thelargest borrowers, and only Yemen qualified forIDA lending in FY98.
All education subsectors are represented in theportfolio. The share of support to basic educationis approximately equal to the Bank-wide average,while for secondary, vocational and tertiary edu-cation the shares are slightly higher, as would beexpected from the general level of development inthe region.
The World Bank can help its clients to pursue andachieve their education goals by providing assis-tance designed to reinforce the strategic under-pinnings of education development and to designand implement specific program actions. At thesame time, the Bank’s activities must be targetedso that its resources are used consistently withits comparative advantage. The World Bank canhelp its clients by:
Helping to develop comprehensive policyframeworks for long-term program support. Egyptdeveloped such a framework for basic education in1997 with World Bank assistance and is basing itsinvestment and programmatic activities on it.Linking the education policy framework to theeconomic environment and strategy is a crucial
0
100
200
300
400
500
FY99–00FY96–98FY93–95FY90–92FY87–89
MENA Disbursements
MENA New Commitments
(US$
Mill
ions
)
Figure 19 MENA Education Lending, FY87–00
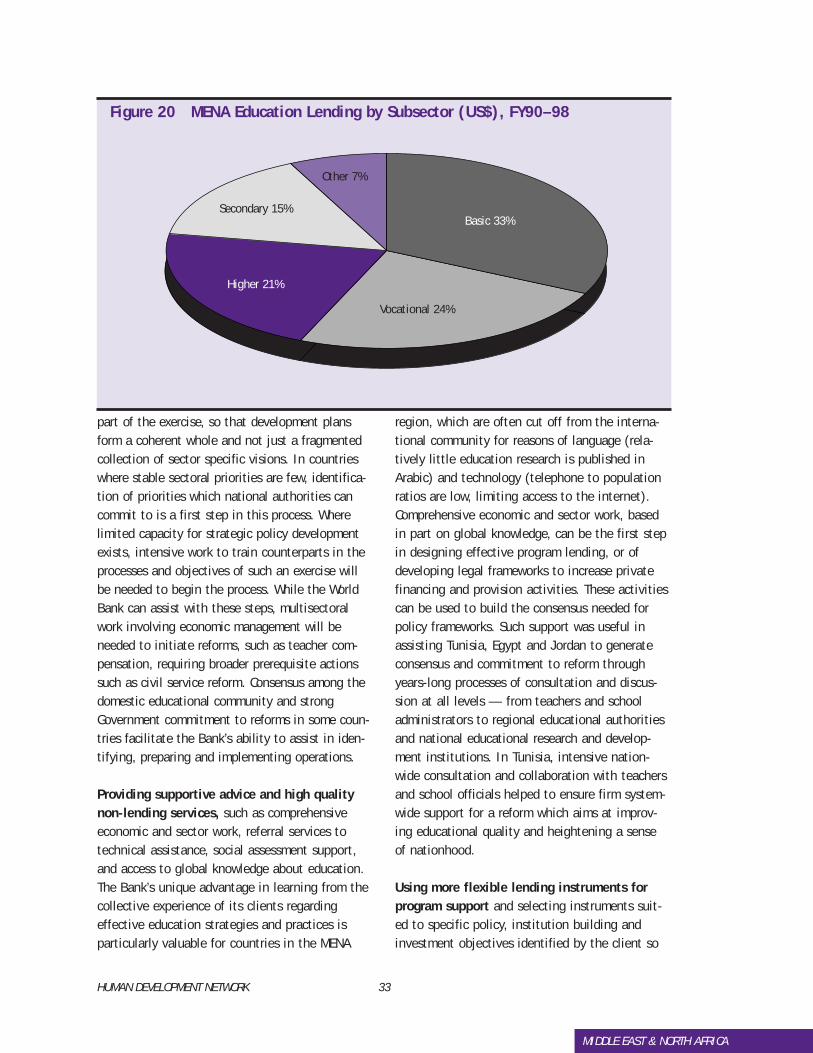
HUMAN DEVELOPMENT NETWORK 33
part of the exercise, so that development plansform a coherent whole and not just a fragmentedcollection of sector specific visions. In countrieswhere stable sectoral priorities are few, identifica-tion of priorities which national authorities cancommit to is a first step in this process. Wherelimited capacity for strategic policy developmentexists, intensive work to train counterparts in theprocesses and objectives of such an exercise willbe needed to begin the process. While the WorldBank can assist with these steps, multisectoralwork involving economic management will beneeded to initiate reforms, such as teacher com-pensation, requiring broader prerequisite actionssuch as civil service reform. Consensus among thedomestic educational community and strongGovernment commitment to reforms in some coun-tries facilitate the Bank’s ability to assist in iden-tifying, preparing and implementing operations.
Providing supportive advice and high qualitynon-lending services, such as comprehensiveeconomic and sector work, referral services totechnical assistance, social assessment support,and access to global knowledge about education.The Bank’s unique advantage in learning from thecollective experience of its clients regardingeffective education strategies and practices isparticularly valuable for countries in the MENA
region, which are often cut off from the interna-tional community for reasons of language (rela-tively little education research is published inArabic) and technology (telephone to populationratios are low, limiting access to the internet).Comprehensive economic and sector work, basedin part on global knowledge, can be the first stepin designing effective program lending, or ofdeveloping legal frameworks to increase privatefinancing and provision activities. These activitiescan be used to build the consensus needed forpolicy frameworks. Such support was useful inassisting Tunisia, Egypt and Jordan to generateconsensus and commitment to reform throughyears-long processes of consultation and discus-sion at all levels — from teachers and schooladministrators to regional educational authoritiesand national educational research and develop-ment institutions. In Tunisia, intensive nation-wide consultation and collaboration with teachersand school officials helped to ensure firm system-wide support for a reform which aims at improv-ing educational quality and heightening a senseof nationhood.
Using more flexible lending instruments forprogram support and selecting instruments suit-ed to specific policy, institution building andinvestment objectives identified by the client so
MIDDLE EAST & NORTH AFRICA
Other 7%
Vocational 24%
Higher 21%
Secondary 15%Basic 33%
Figure 20 MENA Education Lending by Subsector (US$), FY90–98
34 HUMAN DEVELOPMENT NETWORK
that lending is demand driven. Program lendingincreases the opportunities for partnership withother donors and thus the World Bank’s leveragein policy discussions (such as in the design of theEgypt strategic framework) where adherence toBank supported policy reform is the key to sub-stantial concessionary co-financing. New loantypes (the Learning and Innovation Loan) canalso be used where experimentation is needed todetermine the best long term course of action, orto assess national implementation capacity. Thesehave not yet been used in education in MENA,but may become applicable with clients whoresume cooperation with the Bank after long peri-ods. To the extent however that new lendinginstruments call for short, fast, highly focusedsector work, their utility in program lending willbe constrained by the need for sector work con-ducted in full partnership with the client toensure ownership. Tradeoffs between these goals— speed, client participation and comprehensive-ness of sector work — will be necessary whereearly stage program lending requires substantialup front investment costs.
Facilitating greater public-private partnershipsand non-public participation in financing and pro-viding education. Part of the challenge will involvecreating demand among clients for private sectorinstitutional development lending. Jordan’s experi-ence with engaging enterprises in vocational train-ing can be used to demonstrate the beneficialeffects of these activities. Caution will be neededwhere legal frameworks are absent in the non-profitsector, as this can impede non-profit operation aseffectively as a hostile regulatory environment.
Serving as a catalyst of dialogue betweenMinistries and a coordinator of donor efforts.This increases the Government’s incentive toinvolve the Bank in its development activities in anumber of ways. First, by integrating all relevantMinistries in planning exercises, the Bank can helpits clients ensure that development planning iscoherent and coordinated from a national perspec-tive, not just within the education sector. For
instance, the Bank routinely helps to ensure thatthe long term recurrent costs generated by capitalinvestment are taken into account as part of thedecision to invest. Second, the Bank serves tocoordinate and rationalize donor efforts within anoverall framework. By ensuring that the multitudeof direct assistance sources are planned so as tocomplement one another, the effectiveness of thisassistance is increased, as in Jordan, West Bank-Gaza, Yemen and Egypt. There is also great poten-tial for cooperation with Arab donors, such as theArab Fund for Social and Economic Development.Third, in a few cases the World Bank’s "Stamp ofApproval" is required by the European Union tocontinue discussion with Governments on inclusionin the Mediterranean Initiative on trade, and inreturn for the EU’s substantial funding of technicalassistance for human resource development.
Using evaluation research programs to learnfrom experience in partnership with clients.These programs should monitor and measure thedevelopment impact of World Bank lending andESW activities, as Bank operations in Jordan havedone. These activities can also be used to providemore support for participation in internationalassessments and development of internationallycomparable statistics. Jordan’s experience inestablishing an institution to perform high qualityresearch and analysis on the sector is instructive.With strong support from the highest levels ofnational authority, the National Center for HumanResource Development (NCHRD) has played a cat-alytic role in improving the quality of educationdelivered in Jordan and now provides analytic ser-vices to other regional countries. Such high leveltechnical expertise also contributes to goodimplementation capacity.
The World Bank can best help its clients byemphasizing selectivity in making choices, sothat both governments and the Bank investcredibility and resources in only those undertak-ings that can make a significant developmentimpact. Where broad issues not susceptible tointervention through the education sector alone
MIDDLE EAST & NORTH AFRICA

HUMAN DEVELOPMENT NETWORK 35
MIDDLE EAST & NORTH AFRICA
(e.g., civil service reform) would constrain theeffectiveness of World Bank activities in educa-tion, substantial caution in committingresources is warranted. Where constraints toeffectiveness such as the lack of commitment toreforms, severely limited implementation capaci-ty or non-additionality of funds due to nationalbudgeting procedures are present (i.e., wherethere is no incremental effect of lending), theBank should look closely to see that develop-ment resources are not squandered.
Focusing on capacity building for planning,analysis and management during projectimplementation through allocating more Bankresources to impact and progress monitoring.Continuing to place social sector experts in resi-dent missions to increase the substance of theBank’s partnership with its clients — as it isdoing in Egypt, Yemen and Morocco — can be animportant positive step in this regard. In addi-tion, Bank site visits and missions to Mashreqcountries should include Arabic speakers.
36 HUMAN DEVELOPMENT NETWORK
MIDDLE EAST & NORTH AFRICA
LIST OF ANNEX TABLES
ANNEX A—Education System and StructureTable A1 Compulsory Education and Number of Years in Each Level of Education 37Table A2 Constitutional and Legal Provisions for Education (most recent available data) 37Table A3 Student Achievement, Assessment and Promotion Systems 38
ANNEX B—Education System and StructureTable B1 Income and Social Indicators, 1970 and circa 1996 39Table B2 Population and Labor Force Indicators, various years 40Table B3 Average Annual Population Growth: Low and Middle Income Countries 40Table B4 Estimates and Projections of School-Age Cohorts (thousands), 1995–2040 41Table B5 Average Annual Growth in GDP & Real Per Capita GDP 42Table B6 Culture and Communication, 1995 42Table B7 Adult Literacy Rates, 1960–1995 and Average Years of Schooling
Among Adults 15 Years and Older 43
ANNEX C—Education StatisticsTable C1 Gross Enrollment Rates, 1995 44Table C2 Net Enrollment Rates in Primary and Secondary Education, circa 1995 45Table C3 Percentage of Children Enrolled in School in 1990s and Estimated Number
of Children Out of School, 1995 45Table C4 Student Flow Indicators, Most Recent Years, Mid 1990s (%) 46Table C5 Primary Repeaters Share in Total Enrollments, 1990–1995 (%) 46Table C6 Compulsory Education and Child Labor 46Table C7 Public Expenditure on Education, Mid 1990s 47Table C8 Primary and Secondary Student-to-Teacher Ratios 48Table C9 Selected Teacher Characterisitics, 1990s 49Table C10 Number of Students and Teachers, Most Recent Years, mid 1990s 49Table C11 Private Enrollment’s Share of Total Enrollment and Regulations
Affecting Private Schools, mid 1990s 50
ANNEX D—World Bank Assistance—Past and FutureTable D1 Non-lending Services for Education in the MENA Region, FY97 and FY98 51Table D2 Staff in the Education Group in the MENA Region 51Table D3 World Bank Lending for Education, MENA Region 51
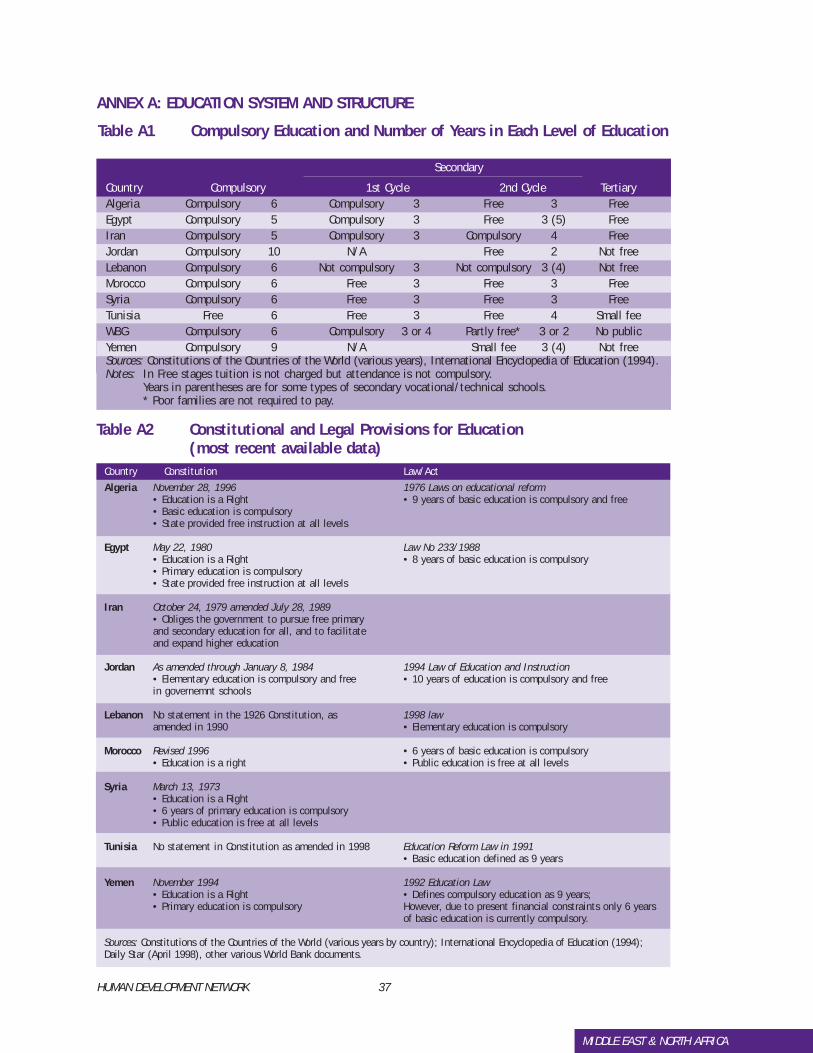
HUMAN DEVELOPMENT NETWORK 37
MIDDLE EAST & NORTH AFRICA
ANNEX A: EDUCATION SYSTEM AND STRUCTURE
Secondary
Country Compulsory 1st Cycle 2nd Cycle TertiaryAlgeria Compulsory 6 Compulsory 3 Free 3 FreeEgypt Compulsory 5 Compulsory 3 Free 3 (5) FreeIran Compulsory 5 Compulsory 3 Compulsory 4 FreeJordan Compulsory 10 N/A Free 2 Not freeLebanon Compulsory 6 Not compulsory 3 Not compulsory 3 (4) Not freeMorocco Compulsory 6 Free 3 Free 3 FreeSyria Compulsory 6 Free 3 Free 3 FreeTunisia Free 6 Free 3 Free 4 Small feeWBG Compulsory 6 Compulsory 3 or 4 Partly free* 3 or 2 No publicYemen Compulsory 9 N/A Small fee 3 (4) Not freeSources: Constitutions of the Countries of the World (various years), International Encyclopedia of Education (1994).Notes: In Free stages tuition is not charged but attendance is not compulsory.
Years in parentheses are for some types of secondary vocational/technical schools.* Poor families are not required to pay.
Table A1 Compulsory Education and Number of Years in Each Level of Education
Country Constitution Law/Act
Algeria November 28, 1996 1976 Laws on educational reform• Education is a Right • 9 years of basic education is compulsory and free• Basic education is compulsory• State provided free instruction at all levels
Egypt May 22, 1980 Law No 233/1988• Education is a Right • 8 years of basic education is compulsory• Primary education is compulsory• State provided free instruction at all levels
Iran October 24, 1979 amended July 28, 1989• Obliges the government to pursue free primary and secondary education for all, and to facilitate and expand higher education
Jordan As amended through January 8, 1984 1994 Law of Education and Instruction• Elementary education is compulsory and free • 10 years of education is compulsory and freein governemnt schools
Lebanon No statement in the 1926 Constitution, as 1998 lawamended in 1990 • Elementary education is compulsory
Morocco Revised 1996 • 6 years of basic education is compulsory• Education is a right • Public education is free at all levels
Syria March 13, 1973• Education is a Right• 6 years of primary education is compulsory• Public education is free at all levels
Tunisia No statement in Constitution as amended in 1998 Education Reform Law in 1991• Basic education defined as 9 years
Yemen November 1994 1992 Education Law• Education is a Right • Defines compulsory education as 9 years;• Primary education is compulsory However, due to present financial constraints only 6 years
of basic education is currently compulsory.
Sources: Constitutions of the Countries of the World (various years by country); International Encyclopedia of Education (1994);Daily Star (April 1998), other various World Bank documents.
Table A2 Constitutional and Legal Provisions for Education(most recent available data)
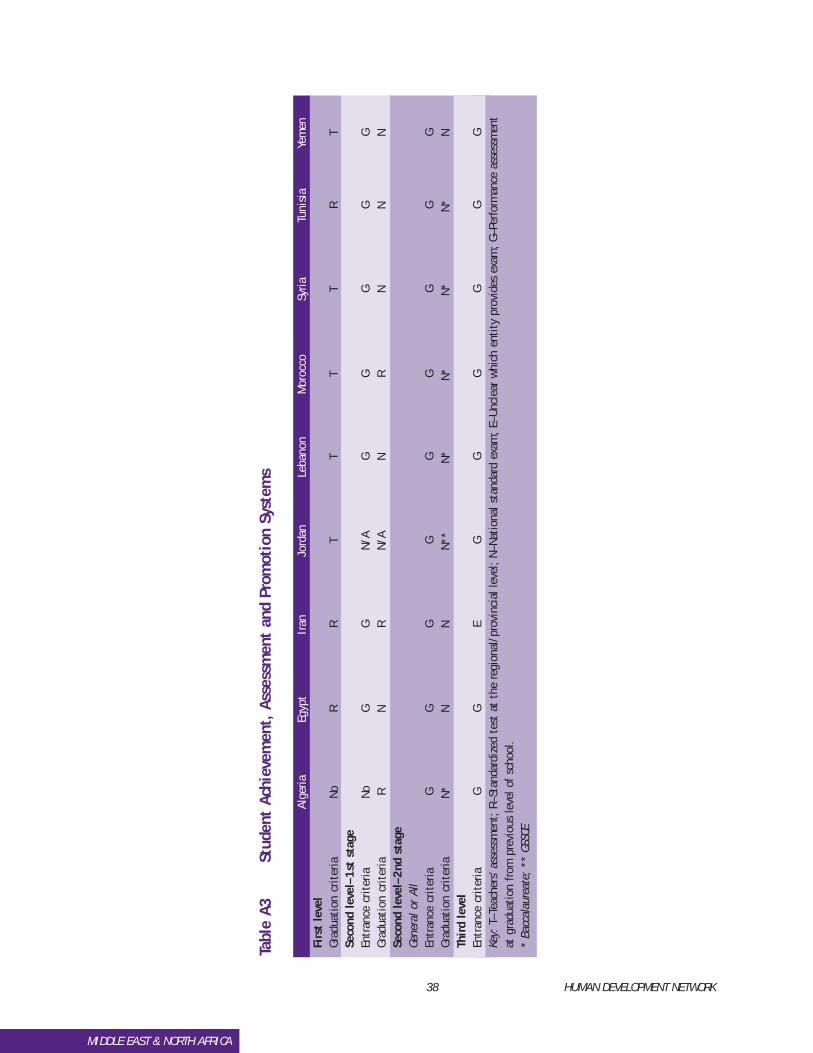
38 HUMAN DEVELOPMENT NETWORK
MIDDLE EAST & NORTH AFRICA
Tabl
e A3
Stud
ent
Achi
evem
ent,
Ass
essm
ent
and
Prom
otio
n Sy
stem
s
Alge
riaEg
ypt
Iran
Jord
anLe
bano
nM
oroc
coSy
riaTu
nisi
aYe
men
Firs
t le
vel
Grad
uati
on c
rite
riaNo
RR
TT
TT
RT
Seco
nd l
evel
–1st
sta
geEn
tran
ce c
rite
riaNo
GG
N/A
GG
GG
GGr
adua
tion
cri
teria
RN
RN/
AN
RN
NN
Seco
nd l
evel
–2nd
sta
geGe
nera
l or
All
Entr
ance
cri
teria
GG
GG
GG
GG
GGr
adua
tion
cri
teria
N*N
NN*
*N*
N*N*
N*N
Thir
d le
vel
Entr
ance
cri
teria
GG
EG
GG
GG
GKe
y:T–
Teac
hers
’ ass
essm
ent;
R–S
tand
ardi
zed
test
at
the
regi
onal
/pro
vinc
ial l
evel
; N–
Nation
al s
tand
ard
exam
; E–
Uncl
ear
whi
ch e
ntit
y pr
ovid
es e
xam
; G–
Perfor
man
ce a
sses
smen
tat
gra
duat
ion
from
pre
viou
s le
vel o
f sc
hool
.*
Bacc
alau
reat
e; *
*GS
SCE
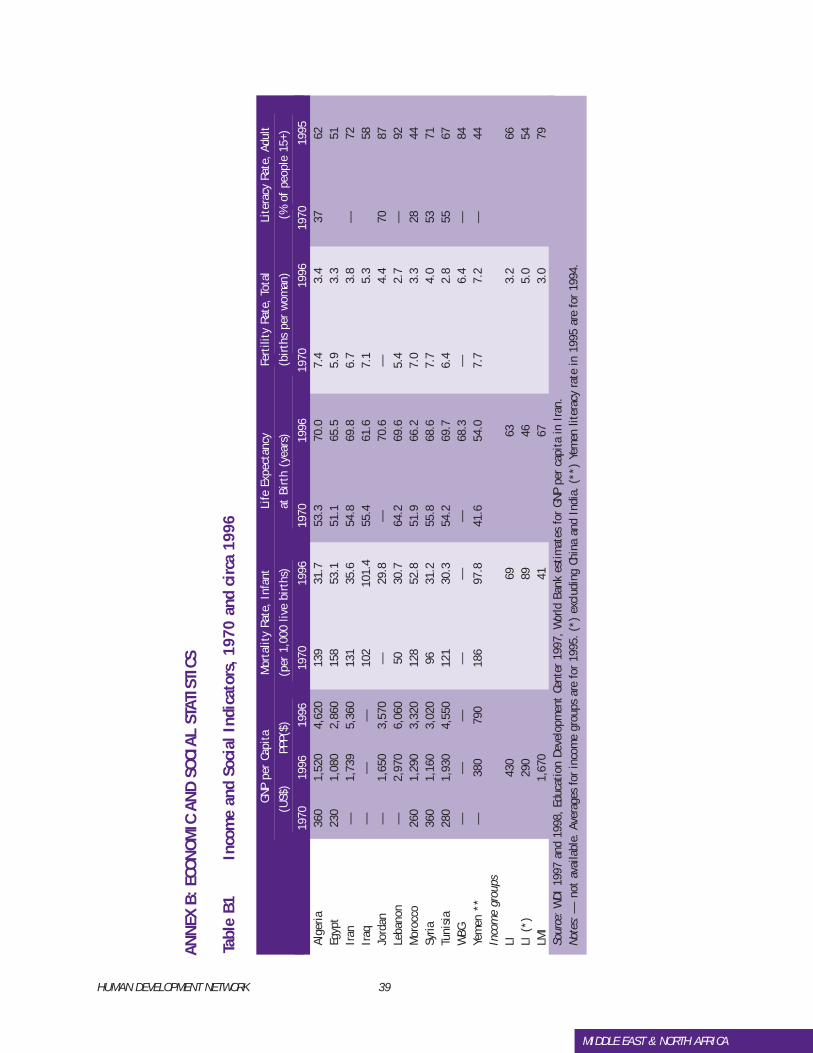
HUMAN DEVELOPMENT NETWORK 39
MIDDLE EAST & NORTH AFRICA
ANN
EXB:
ECO
NOM
ICAN
DSO
CIAL
STA
TIST
ICS
Tabl
e B1
Inco
me
and
Soci
al I
ndic
ator
s, 1
970
and
circ
a 19
96
GNP
per
Capi
taM
orta
lity
Rate
, In
fant
Life
Exp
ecta
ncy
Fert
ility
Rat
e, T
otal
Lite
racy
Rat
e, A
dult
(US$
)
PPP
($)
(per
1,0
00 li
ve b
irth
s)at
Bir
th (
year
s)(b
irth
s pe
r w
oman
)(%
of
peop
le 1
5+)
1970
1996
1996
1970
1996
1970
1996
1970
1996
1970
1995
Alge
ria36
01,
520
4,62
013
931
.753
.370
.07.
43.
437
62Eg
ypt
230
1,08
02,
860
158
53.1
51.1
65.5
5.9
3.3
51Ir
an—
1,73
95,
360
131
35.6
54.8
69.8
6.7
3.8
—72
Iraq
——
—10
210
1.4
55.4
61.6
7.1
5.3
58Jo
rdan
—1,
650
3,57
0—
29.8
—70
.6—
4.4
7087
Leba
non
—2,
970
6,06
050
30.7
64.2
69.6
5.4
2.7
—92
Mor
occo
260
1,29
03,
320
128
52.8
51.9
66.2
7.0
3.3
2844
Syria
360
1,16
03,
020
9631
.255
.868
.67.
74.
053
71Tu
nisi
a28
01,
930
4,55
012
130
.354
.269
.76.
42.
855
67W
BG—
——
——
—68
.3—
6.4
—84
Yem
en *
*—
380
790
186
97.8
41.6
54.0
7.7
7.2
—44
Inco
me
grou
psLI
430
6963
3.2
66LI
(*)
290
8946
5.0
54LM
I1,
670
4167
3.0
79So
urce
:W
DI 1
997
and
1998
, Ed
ucat
ion
Deve
lopm
ent
Cent
er 1
997,
Wor
ld B
ank
esti
mat
es f
or G
NP p
er c
apit
a in
Ira
n.No
tes:
— n
ot a
vaila
ble.
Ave
rage
s fo
r in
com
e gr
oups
are
for
199
5. (
*)ex
clud
ing
Chin
a an
d In
dia.
(**
) Ye
men
lite
racy
rat
e in
199
5 ar
e fo
r 19
94.
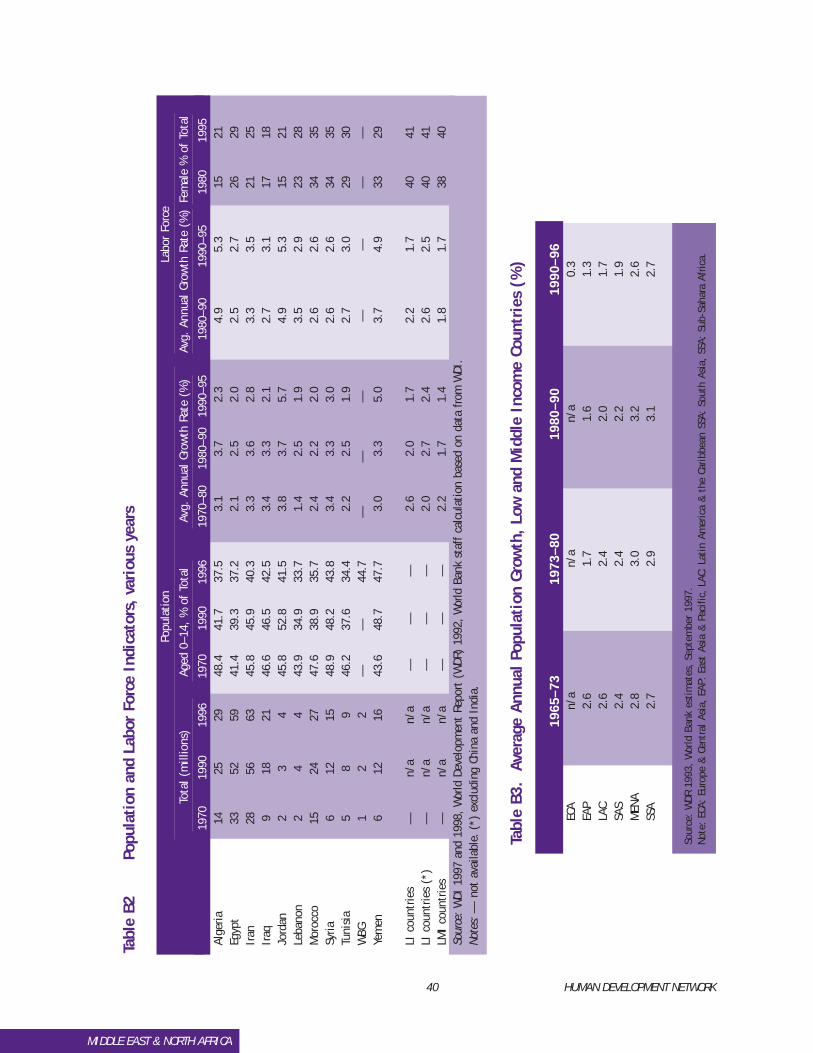
40 HUMAN DEVELOPMENT NETWORK
MIDDLE EAST & NORTH AFRICA
Tabl
e B2
Popu
lati
on a
nd L
abor
For
ce I
ndic
ator
s, v
ario
us y
ears
Popu
lati
onLa
bor
Forc
e
Tota
l (m
illio
ns)
Aged
0–1
4, %
of
Tota
lAv
g. A
nnua
l Gro
wth
Rat
e (%
)Av
g. A
nnua
l Gro
wth
Rat
e (%
)Fe
mal
e %
of
Tota
l
1970
1990
1996
1970
1990
1996
1970
–80
1980
–90
1990
–95
1980
–90
1990
–95
1980
1995
Alge
ria14
2529
48.4
41.7
37.5
3.1
3.7
2.3
4.9
5.3
1521
Egyp
t33
5259
41.4
39.3
37.2
2.1
2.5
2.0
2.5
2.7
2629
Iran
2856
6345
.845
.940
.33.
33.
62.
83.
33.
521
25Ir
aq9
1821
46.6
46.5
42.5
3.4
3.3
2.1
2.7
3.1
1718
Jord
an2
34
45.8
52.8
41.5
3.8
3.7
5.7
4.9
5.3
1521
Leba
non
24
443
.934
.933
.71.
42.
51.
93.
52.
923
28M
oroc
co15
2427
47.6
38.9
35.7
2.4
2.2
2.0
2.6
2.6
3435
Syria
612
1548
.948
.243
.83.
43.
33.
02.
62.
634
35Tu
nisi
a5
89
46.2
37.6
34.4
2.2
2.5
1.9
2.7
3.0
2930
WBG
12
2—
—44
.7—
——
——
——
Yem
en6
1216
43.6
48.7
47.7
3.0
3.3
5.0
3.7
4.9
3329
LIco
untr
ies
—n/
an/
a—
——
2.6
2.0
1.7
2.2
1.7
4041
LIco
untr
ies
(*)
—n/
an/
a—
——
2.0
2.7
2.4
2.6
2.5
4041
LMI
coun
trie
s—
n/a
n/a
——
—2.
21.
71.
41.
81.
738
40So
urce
:W
DI 1
997
and
1998
, W
orld
Dev
elop
men
t Re
port
(W
DR)
1992
, W
orld
Ban
k st
aff
calc
ulat
ion
base
d on
dat
a from
WDI
.No
tes:
— n
ot a
vaila
ble.
(*)
excl
udin
g Ch
ina
and
Indi
a.
Tabl
e B3
. A
vera
ge A
nnua
l Po
pula
tion
Gro
wth
, Lo
w a
nd M
iddl
e In
com
e Co
untr
ies
(%)
1965
–73
1973
–80
1980
–90
1990
–96
ECA
n/a
n/a
n/a
0.3
EAP
2.6
1.7
1.6
1.3
LAC
2.6
2.4
2.0
1.7
SAS
2.4
2.4
2.2
1.9
MEN
A2.
83.
03.
22.
6SS
A2.
72.
93.
12.
7
Sour
ce:
WDR
199
3, W
orld
Ban
k es
tim
ates
, Se
ptem
ber
1997
.No
te:
ECA:
Eur
ope
& C
entr
al A
sia,
EAP
: Ea
st A
sia
& P
acif
ic,
LAC:
Lat
in A
mer
ica
& t
he C
arib
bean
SSA
: So
uth
Asia
, SS
A: S
ub-S
ahar
a Af
rica.
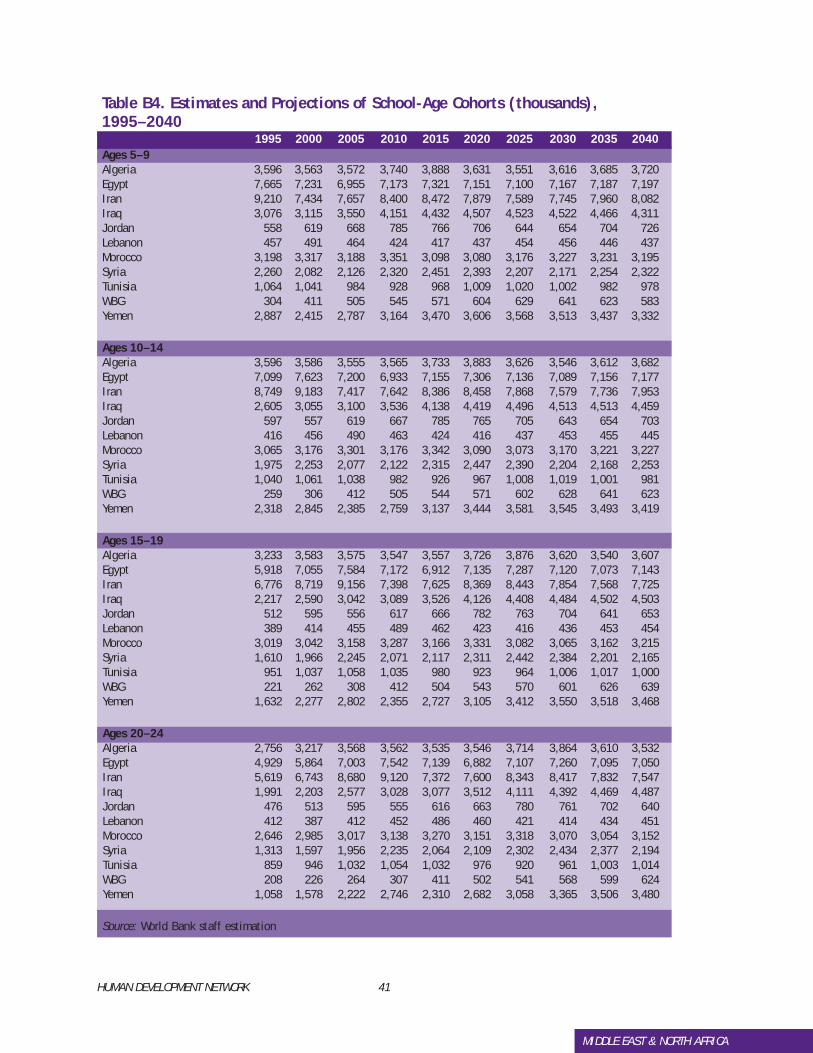
HUMAN DEVELOPMENT NETWORK 41
MIDDLE EAST & NORTH AFRICA
Table B4. Estimates and Projections of School-Age Cohorts (thousands),1995–2040
1995 2000 2005 2010 2015 2020 2025 2030 2035 2040Ages 5–9Algeria 3,596 3,563 3,572 3,740 3,888 3,631 3,551 3,616 3,685 3,720 Egypt 7,665 7,231 6,955 7,173 7,321 7,151 7,100 7,167 7,187 7,197 Iran 9,210 7,434 7,657 8,400 8,472 7,879 7,589 7,745 7,960 8,082 Iraq 3,076 3,115 3,550 4,151 4,432 4,507 4,523 4,522 4,466 4,311 Jordan 558 619 668 785 766 706 644 654 704 726 Lebanon 457 491 464 424 417 437 454 456 446 437 Morocco 3,198 3,317 3,188 3,351 3,098 3,080 3,176 3,227 3,231 3,195 Syria 2,260 2,082 2,126 2,320 2,451 2,393 2,207 2,171 2,254 2,322 Tunisia 1,064 1,041 984 928 968 1,009 1,020 1,002 982 978 WBG 304 411 505 545 571 604 629 641 623 583 Yemen 2,887 2,415 2,787 3,164 3,470 3,606 3,568 3,513 3,437 3,332
Ages 10–14Algeria 3,596 3,586 3,555 3,565 3,733 3,883 3,626 3,546 3,612 3,682 Egypt 7,099 7,623 7,200 6,933 7,155 7,306 7,136 7,089 7,156 7,177 Iran 8,749 9,183 7,417 7,642 8,386 8,458 7,868 7,579 7,736 7,953 Iraq 2,605 3,055 3,100 3,536 4,138 4,419 4,496 4,513 4,513 4,459 Jordan 597 557 619 667 785 765 705 643 654 703 Lebanon 416 456 490 463 424 416 437 453 455 445 Morocco 3,065 3,176 3,301 3,176 3,342 3,090 3,073 3,170 3,221 3,227 Syria 1,975 2,253 2,077 2,122 2,315 2,447 2,390 2,204 2,168 2,253 Tunisia 1,040 1,061 1,038 982 926 967 1,008 1,019 1,001 981 WBG 259 306 412 505 544 571 602 628 641 623 Yemen 2,318 2,845 2,385 2,759 3,137 3,444 3,581 3,545 3,493 3,419
Ages 15–19Algeria 3,233 3,583 3,575 3,547 3,557 3,726 3,876 3,620 3,540 3,607 Egypt 5,918 7,055 7,584 7,172 6,912 7,135 7,287 7,120 7,073 7,143 Iran 6,776 8,719 9,156 7,398 7,625 8,369 8,443 7,854 7,568 7,725 Iraq 2,217 2,590 3,042 3,089 3,526 4,126 4,408 4,484 4,502 4,503 Jordan 512 595 556 617 666 782 763 704 641 653 Lebanon 389 414 455 489 462 423 416 436 453 454 Morocco 3,019 3,042 3,158 3,287 3,166 3,331 3,082 3,065 3,162 3,215 Syria 1,610 1,966 2,245 2,071 2,117 2,311 2,442 2,384 2,201 2,165 Tunisia 951 1,037 1,058 1,035 980 923 964 1,006 1,017 1,000 WBG 221 262 308 412 504 543 570 601 626 639 Yemen 1,632 2,277 2,802 2,355 2,727 3,105 3,412 3,550 3,518 3,468
Ages 20–24Algeria 2,756 3,217 3,568 3,562 3,535 3,546 3,714 3,864 3,610 3,532 Egypt 4,929 5,864 7,003 7,542 7,139 6,882 7,107 7,260 7,095 7,050 Iran 5,619 6,743 8,680 9,120 7,372 7,600 8,343 8,417 7,832 7,547 Iraq 1,991 2,203 2,577 3,028 3,077 3,512 4,111 4,392 4,469 4,487 Jordan 476 513 595 555 616 663 780 761 702 640 Lebanon 412 387 412 452 486 460 421 414 434 451 Morocco 2,646 2,985 3,017 3,138 3,270 3,151 3,318 3,070 3,054 3,152 Syria 1,313 1,597 1,956 2,235 2,064 2,109 2,302 2,434 2,377 2,194 Tunisia 859 946 1,032 1,054 1,032 976 920 961 1,003 1,014 WBG 208 226 264 307 411 502 541 568 599 624 Yemen 1,058 1,578 2,222 2,746 2,310 2,682 3,058 3,365 3,506 3,480
Source: World Bank staff estimation
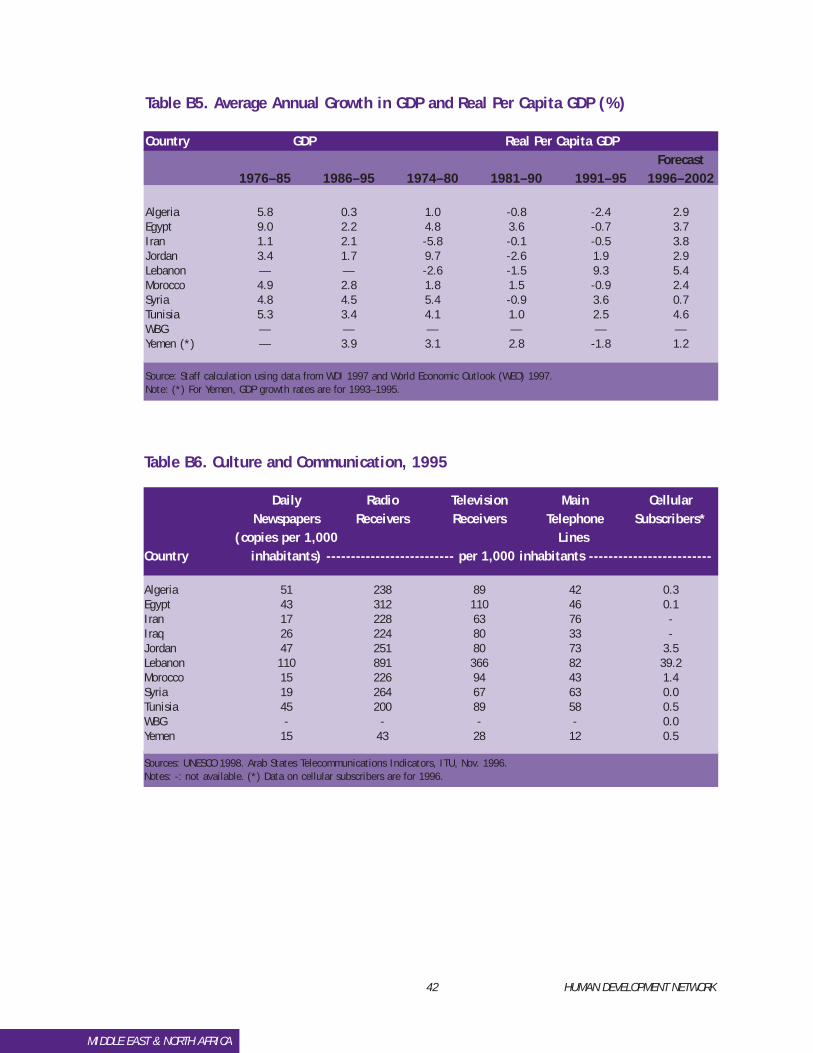
42 HUMAN DEVELOPMENT NETWORK
MIDDLE EAST & NORTH AFRICA
Table B5. Average Annual Growth in GDP and Real Per Capita GDP (%)
Country GDP Real Per Capita GDPForecast
1976–85 1986–95 1974–80 1981–90 1991–95 1996–2002
Algeria 5.8 0.3 1.0 -0.8 -2.4 2.9Egypt 9.0 2.2 4.8 3.6 -0.7 3.7Iran 1.1 2.1 -5.8 -0.1 -0.5 3.8Jordan 3.4 1.7 9.7 -2.6 1.9 2.9Lebanon — — -2.6 -1.5 9.3 5.4Morocco 4.9 2.8 1.8 1.5 -0.9 2.4Syria 4.8 4.5 5.4 -0.9 3.6 0.7Tunisia 5.3 3.4 4.1 1.0 2.5 4.6WBG — — — — — —Yemen (*) — 3.9 3.1 2.8 -1.8 1.2
Source: Staff calculation using data from WDI 1997 and World Economic Outlook (WEO) 1997.Note: (*) For Yemen, GDP growth rates are for 1993–1995.
Table B6. Culture and Communication, 1995
Daily Radio Television Main Cellular Newspapers Receivers Receivers Telephone Subscribers*
(copies per 1,000 LinesCountry inhabitants) -------------------------- per 1,000 inhabitants -------------------------
Algeria 51 238 89 42 0.3Egypt 43 312 110 46 0.1Iran 17 228 63 76 -Iraq 26 224 80 33 -Jordan 47 251 80 73 3.5Lebanon 110 891 366 82 39.2Morocco 15 226 94 43 1.4Syria 19 264 67 63 0.0Tunisia 45 200 89 58 0.5WBG - - - - 0.0Yemen 15 43 28 12 0.5
Sources: UNESCO 1998. Arab States Telecommunications Indicators, ITU, Nov. 1996.Notes: -: not available. (*) Data on cellular subscribers are for 1996.
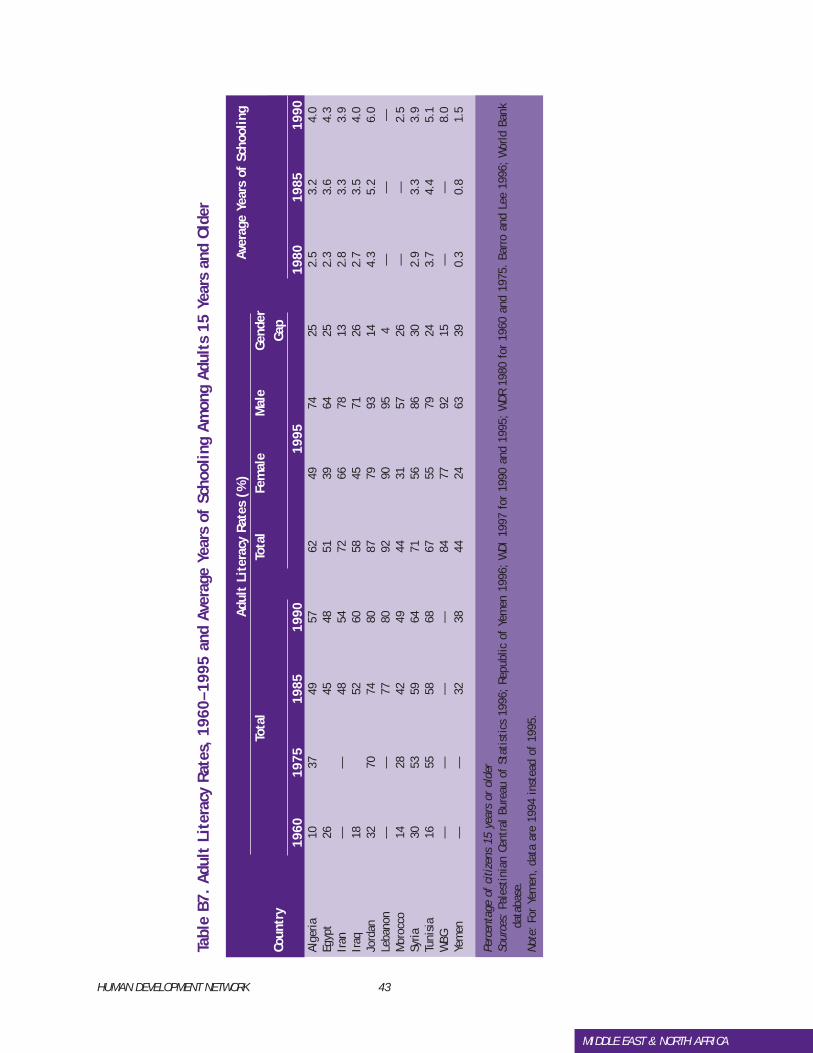
HUMAN DEVELOPMENT NETWORK 43
MIDDLE EAST & NORTH AFRICA
Tabl
e B7
. Ad
ult
Lite
racy
Rat
es,
1960
–199
5 an
d Av
erag
e Ye
ars
of S
choo
ling
Amon
g Ad
ults
15
Year
s an
d Ol
der
Adul
t Li
tera
cy R
ates
(%
)Av
erag
e Ye
ars
of S
choo
ling
Tota
lTo
tal
Fem
ale
Mal
eGe
nder
Co
untr
yGa
p19
6019
7519
8519
9019
9519
8019
8519
90Al
geria
1037
4957
6249
7425
2.5
3.2
4.0
Egyp
t26
4548
5139
6425
2.3
3.6
4.3
Iran
——
4854
7266
7813
2.8
3.3
3.9
Iraq
1852
6058
4571
262.
73.
54.
0Jo
rdan
3270
7480
8779
9314
4.3
5.2
6.0
Leba
non
——
7780
9290
954
——
—M
oroc
co14
2842
4944
3157
26—
—2.
5Sy
ria30
5359
6471
5686
302.
93.
33.
9Tu
nisi
a16
5558
6867
5579
243.
74.
45.
1W
BG—
——
—84
7792
15—
—8.
0Ye
men
——
3238
4424
6339
0.3
0.8
1.5
Perc
enta
ge o
f ci
tize
ns 1
5 ye
ars
or o
lder
Sour
ces:
Pal
esti
nian
Cen
tral
Bur
eau
of S
tati
stic
s 19
96;
Repu
blic
of
Yem
en 1
996;
WDI
199
7 fo
r 19
90 a
nd 1
995;
WDR
198
0 fo
r 19
60 a
nd 1
975.
Bar
ro a
nd L
ee 1
996;
Wor
ld B
ank
data
base
.No
te:
For
Yem
en,
data
are
199
4 in
stea
d of
199
5.
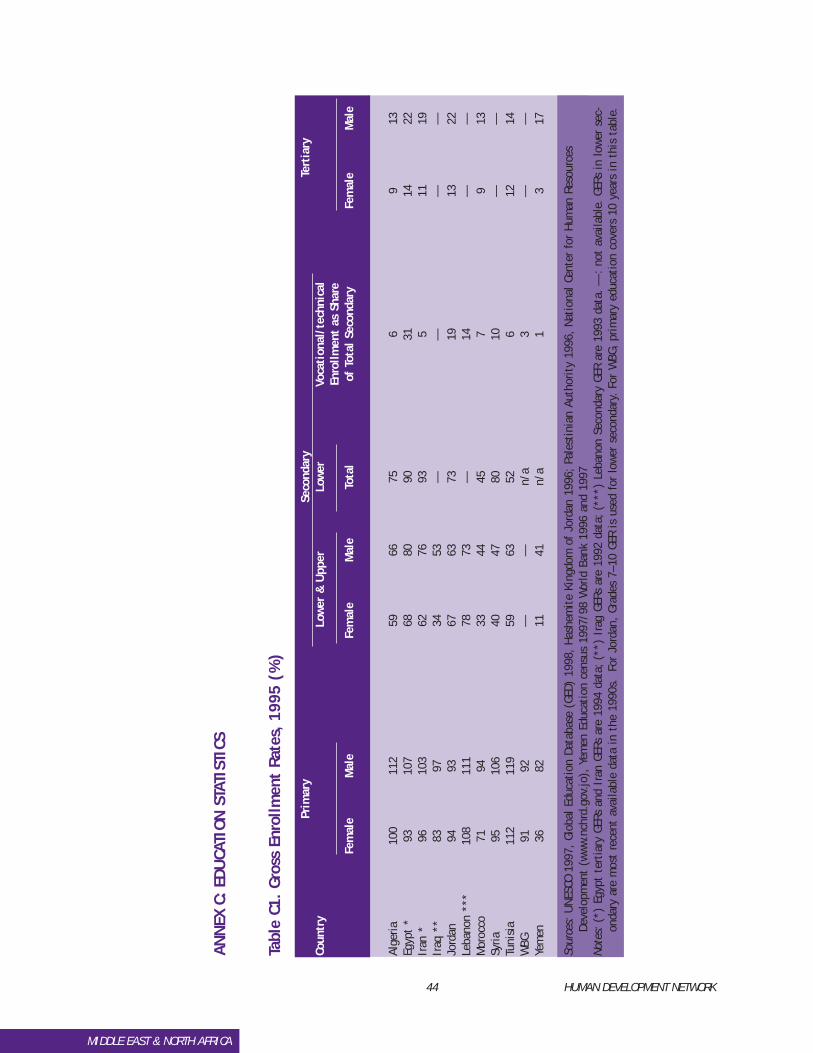
44 HUMAN DEVELOPMENT NETWORK
MIDDLE EAST & NORTH AFRICA
ANN
EXC:
EDU
CATI
ON S
TATI
STIC
S
Tabl
e C1
. Gr
oss
Enro
llmen
t Ra
tes,
199
5 (%
)
Prim
ary
Seco
ndar
yTe
rtia
ryCo
untr
yLo
wer
& U
pper
Lo
wer
Vo
cati
onal
/tec
hnic
al
Enro
llmen
t as
Sha
re
Fem
ale
Mal
eFe
mal
eM
ale
Tota
lof
Tot
al S
econ
dary
Fem
ale
Mal
e
Alge
ria10
011
259
6675
69
13Eg
ypt
*93
107
6880
9031
1422
Iran
*96
103
6276
935
1119
Iraq
**83
9734
53—
——
—Jo
rdan
9493
6763
7319
1322
Leba
non
***
108
111
7873
—14
——
Mor
occo
7194
3344
457
913
Syria
9510
640
4780
10—
—Tu
nisi
a11
211
959
6352
612
14W
BG91
92—
—n/
a3
——
Yem
en36
8211
41n/
a1
317
Sour
ces:
UNE
SCO
1997
, Gl
obal
Edu
cati
on D
atab
ase
(GED
) 19
98,
Has
hem
ite
King
dom
of
Jord
an 1
996;
Pal
esti
nian
Aut
hori
ty 1
996,
Nat
iona
l Cen
ter
for
Hum
an R
esou
rces
Deve
lopm
ent
(ww
w.nc
hrd.
gov.
jo),
Yem
en E
duca
tion
cen
sus
1997
/98
Wor
ld B
ank
1996
and
199
7No
tes:
(*)
Egyp
t te
rtia
ry G
ERs
and
Iran
GER
s ar
e 19
94 d
ata;
(**
) Ir
ag G
ERs
are
1992
dat
a; (
***)
Leb
anon
Sec
onda
ry G
ER a
re 1
993
data
. —
: no
t av
aila
ble.
GER
s in
low
er s
ec-
onda
ry a
re m
ost
rece
nt a
vaila
ble
data
in
the
1990
s.
For
Jord
an,
Grad
es 7
–10
GER
is u
sed
for
low
er s
econ
dary
. Fo
r W
BG,
prim
ary
educ
atio
n co
vers
10
year
s in
thi
s ta
ble.
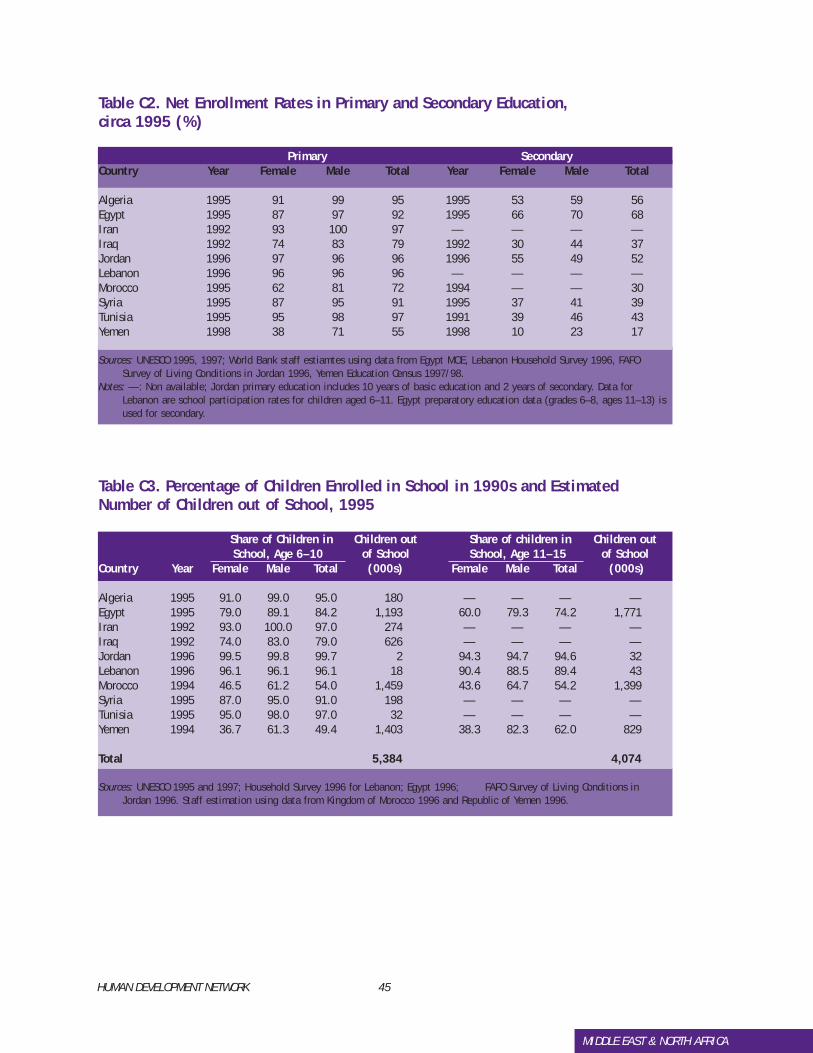
HUMAN DEVELOPMENT NETWORK 45
MIDDLE EAST & NORTH AFRICA
Table C2. Net Enrollment Rates in Primary and Secondary Education, circa 1995 (%)
Primary SecondaryCountry Year Female Male Total Year Female Male Total
Algeria 1995 91 99 95 1995 53 59 56Egypt 1995 87 97 92 1995 66 70 68Iran 1992 93 100 97 — — — —Iraq 1992 74 83 79 1992 30 44 37Jordan 1996 97 96 96 1996 55 49 52Lebanon 1996 96 96 96 — — — —Morocco 1995 62 81 72 1994 — — 30Syria 1995 87 95 91 1995 37 41 39Tunisia 1995 95 98 97 1991 39 46 43Yemen 1998 38 71 55 1998 10 23 17
Sources: UNESCO 1995, 1997; World Bank staff estiamtes using data from Egypt MOE, Lebanon Household Survey 1996, FAFOSurvey of Living Conditions in Jordan 1996, Yemen Education Census 1997/98.
Notes: —: Non available; Jordan primary education includes 10 years of basic education and 2 years of secondary. Data forLebanon are school participation rates for children aged 6–11. Egypt preparatory education data (grades 6–8, ages 11–13) isused for secondary.
Table C3. Percentage of Children Enrolled in School in 1990s and EstimatedNumber of Children out of School, 1995
Share of Children in Children out Share of children in Children outSchool, Age 6–10 of School School, Age 11–15 of School
Country Year Female Male Total (000s) Female Male Total (000s)
Algeria 1995 91.0 99.0 95.0 180 — — — —Egypt 1995 79.0 89.1 84.2 1,193 60.0 79.3 74.2 1,771Iran 1992 93.0 100.0 97.0 274 — — — —Iraq 1992 74.0 83.0 79.0 626 — — — —Jordan 1996 99.5 99.8 99.7 2 94.3 94.7 94.6 32Lebanon 1996 96.1 96.1 96.1 18 90.4 88.5 89.4 43Morocco 1994 46.5 61.2 54.0 1,459 43.6 64.7 54.2 1,399Syria 1995 87.0 95.0 91.0 198 — — — —Tunisia 1995 95.0 98.0 97.0 32 — — — —Yemen 1994 36.7 61.3 49.4 1,403 38.3 82.3 62.0 829
Total 5,384 4,074
Sources: UNESCO 1995 and 1997; Household Survey 1996 for Lebanon; Egypt 1996; FAFO Survey of Living Conditions inJordan 1996. Staff estimation using data from Kingdom of Morocco 1996 and Republic of Yemen 1996.
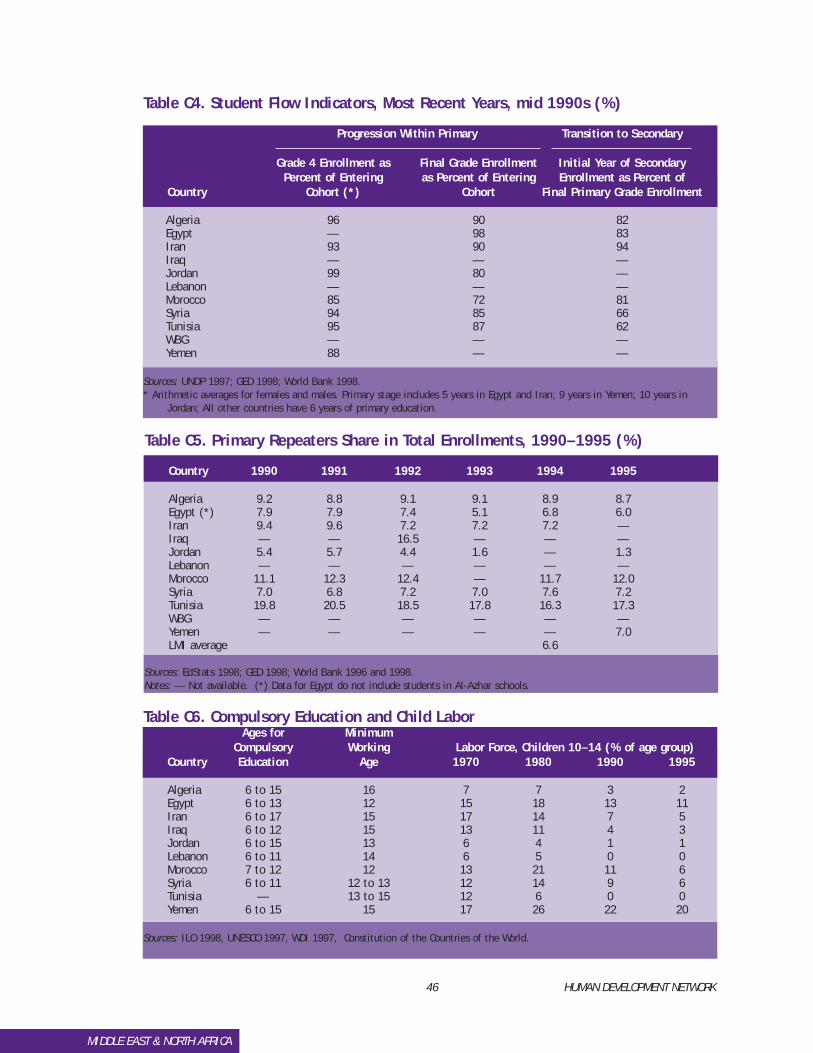
46 HUMAN DEVELOPMENT NETWORK
MIDDLE EAST & NORTH AFRICA
Table C4. Student Flow Indicators, Most Recent Years, mid 1990s (%)
Progression Within Primary Transition to Secondary
Grade 4 Enrollment as Final Grade Enrollment Initial Year of SecondaryPercent of Entering as Percent of Entering Enrollment as Percent of
Country Cohort (*) Cohort Final Primary Grade Enrollment
Algeria 96 90 82Egypt — 98 83Iran 93 90 94Iraq — — —Jordan 99 80 —Lebanon — — —Morocco 85 72 81Syria 94 85 66Tunisia 95 87 62WBG — — —Yemen 88 — —
Sources: UNDP 1997; GED 1998; World Bank 1998.* Arithmetic averages for females and males. Primary stage includes 5 years in Egypt and Iran; 9 years in Yemen; 10 years in
Jordan; All other countries have 6 years of primary education.
Table C5. Primary Repeaters Share in Total Enrollments, 1990–1995 (%)
Country 1990 1991 1992 1993 1994 1995
Algeria 9.2 8.8 9.1 9.1 8.9 8.7Egypt (*) 7.9 7.9 7.4 5.1 6.8 6.0Iran 9.4 9.6 7.2 7.2 7.2 —Iraq — — 16.5 — — —Jordan 5.4 5.7 4.4 1.6 — 1.3Lebanon — — — — — —Morocco 11.1 12.3 12.4 — 11.7 12.0Syria 7.0 6.8 7.2 7.0 7.6 7.2Tunisia 19.8 20.5 18.5 17.8 16.3 17.3WBG — — — — — —Yemen — — — — — 7.0LMI average 6.6
Sources: EdStats 1998; GED 1998; World Bank 1996 and 1998.Notes: — Not available. (*) Data for Egypt do not include students in Al-Azhar schools.
Table C6. Compulsory Education and Child LaborAges for Minimum
Compulsory Working Labor Force, Children 10–14 (% of age group)Country Education Age 1970 1980 1990 1995
Algeria 6 to 15 16 7 7 3 2Egypt 6 to 13 12 15 18 13 11Iran 6 to 17 15 17 14 7 5Iraq 6 to 12 15 13 11 4 3Jordan 6 to 15 13 6 4 1 1Lebanon 6 to 11 14 6 5 0 0Morocco 7 to 12 12 13 21 11 6Syria 6 to 11 12 to 13 12 14 9 6Tunisia — 13 to 15 12 6 0 0Yemen 6 to 15 15 17 26 22 20
Sources: ILO 1998, UNESCO 1997, WDI 1997, Constitution of the Countries of the World.
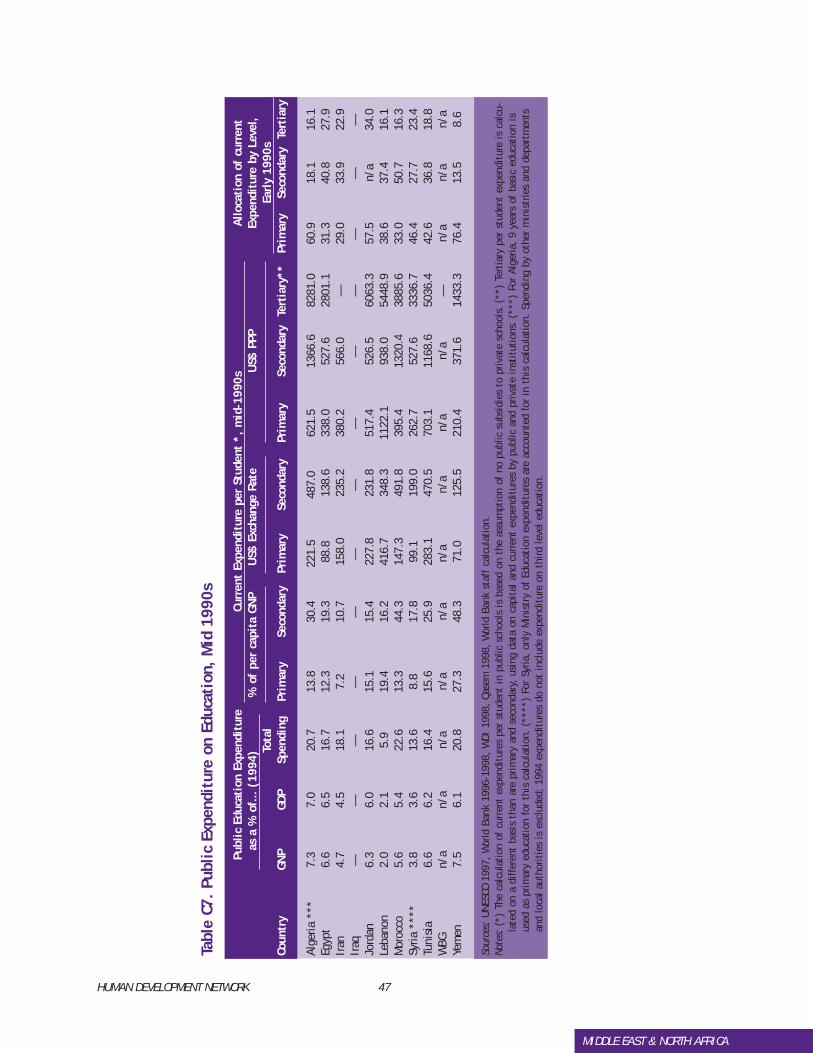
HUMAN DEVELOPMENT NETWORK 47
MIDDLE EAST & NORTH AFRICA
Tabl
e C7
. Pu
blic
Exp
endi
ture
on
Educ
atio
n, M
id 1
990s
Publ
ic E
duca
tion
Exp
endi
ture
Curr
ent
Expe
ndit
ure
per
Stud
ent
*, m
id-1
990s
Allo
cati
on o
f cu
rren
tas
a %
of.
.. (1
994)
% o
f pe
r ca
pita
GN
PU
S$ E
xcha
nge
Rate
US$
PPP
Ex
pend
itur
e by
Lev
el,
Tota
lEa
rly
1990
sCo
untr
yGN
P GD
PSp
endi
ngPr
imar
ySe
cond
ary
Prim
ary
Seco
ndar
yPr
imar
ySe
cond
ary
Tert
iary
**Pr
imar
ySe
cond
ary
Tert
iary
Alge
ria *
**7.
37.
020
.713
.830
.422
1.5
487.
062
1.5
1366
.682
81.0
60.9
18.1
16.1
Egyp
t6.
66.
516
.712
.319
.388
.8
138.
6 33
8.0
527.
628
01.1
31.3
40.8
27.9
Iran
4.7
4.5
18.1
7.2
10.7
158.
0 23
5.2
380.
256
6.0
—29
.033
.922
.9Ir
aq—
——
——
——
——
——
——
Jord
an
6.3
6.0
16.6
15.1
15.4
227.
8 23
1.8
517.
452
6.5
6063
.357
.5n/
a34
.0Le
bano
n2.
02.
15.
919
.416
.241
6.7
348.
3 11
22.1
938.
054
48.9
38.6
37.4
16.1
Mor
occo
5.6
5.4
22.6
13.3
44.3
147.
3 49
1.8
395.
413
20.4
3885
.633
.050
.716
.3Sy
ria *
***
3.8
3.6
13.6
8.8
17.8
99.1
19
9.0
262.
752
7.6
3336
.746
.427
.723
.4Tu
nisi
a6.
66.
216
.415
.625
.928
3.1
470.
5 70
3.1
1168
.650
36.4
42.6
36.8
18.8
WBG
n/a
n/a
n/a
n/a
n/a
n/a
n/a
n/a
n/a
—n/
an/
an/
aYe
men
7.5
6.1
20.8
27.3
48.3
71.0
12
5.5
210.
437
1.6
1433
.376
.413
.58.
6
Sour
ces:
UNE
SCO
1997
, W
orld
Ban
k 19
96-1
998,
WDI
199
8, Q
asem
199
8, W
orld
Ban
k st
aff
calc
ulat
ion.
Note
s:(*
) Th
e ca
lcul
atio
n of
cur
rent
exp
endi
ture
s pe
r st
uden
t in
pub
lic s
choo
ls i
s ba
sed
on t
he a
ssum
ptio
n of
no
publ
ic s
ubsi
dies
to
priv
ate
scho
ols.
(**
) Te
rtia
ry p
er s
tude
nt e
xpen
ditu
re i
s ca
lcu-
late
d on
a d
iffe
rent
bas
is t
han
are
prim
ary
and
seco
ndar
y, u
sing
dat
a on
cap
ital
and
cur
rent
exp
endi
ture
s by
pub
lic a
nd p
riva
te i
nsti
tuti
ons.
(**
*) F
or A
lger
ia,
9 ye
ars
of b
asic
edu
cati
on i
sus
ed a
s pr
imar
y ed
ucat
ion
for
this
cal
cula
tion
. (*
***)
For
Syr
ia,
only
Min
istr
y of
Edu
cati
on e
xpen
ditu
res
are
acco
unte
d fo
r in
thi
s ca
lcul
atio
n. S
pend
ing
by o
ther
min
istr
ies
and
depa
rtm
ents
and
loca
l aut
hori
ties
is
excl
uded
; 19
94 e
xpen
ditu
res
do n
ot i
nclu
de e
xpen
ditu
re o
n th
ird le
vel e
duca
tion
.
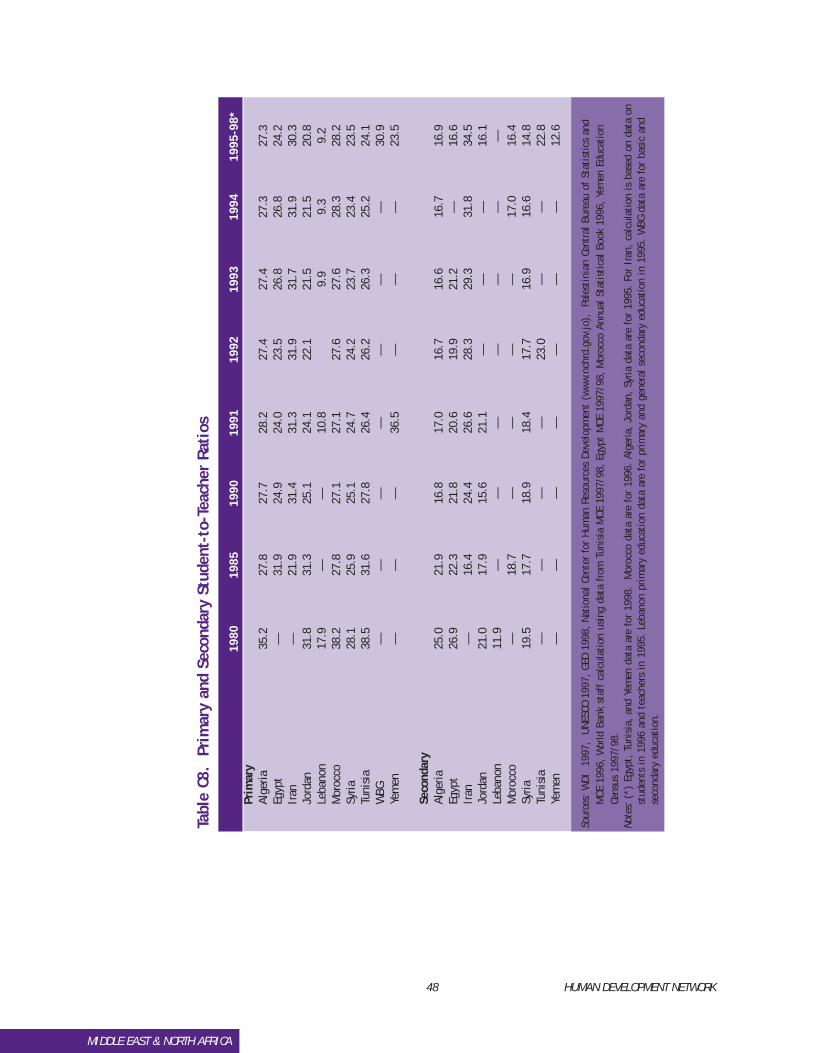
48 HUMAN DEVELOPMENT NETWORK
MIDDLE EAST & NORTH AFRICA
Tabl
e C8
. P
rim
ary
and
Seco
ndar
y St
uden
t-to
-Tea
cher
Rat
ios
1980
1985
1990
1991
1992
1993
1994
1995
-98*
Prim
ary
Alge
ria35
.227
.827
.728
.227
.427
.427
.327
.3Eg
ypt
—31
.924
.924
.023
.526
.826
.824
.2Ir
an—
21.9
31.4
31.3
31.9
31.7
31.9
30.3
Jord
an31
.831
.325
.124
.122
.121
.521
.520
.8Le
bano
n 17
.9—
—10
.89.
99.
39.
2M
oroc
co38
.227
.827
.127
.127
.627
.628
.328
.2Sy
ria28
.125
.925
.124
.724
.223
.723
.423
.5Tu
nisi
a38
.531
.627
.826
.426
.226
.325
.224
.1W
BG—
——
——
——
30.9
Yem
en—
——
36.5
——
—23
.5
Seco
ndar
yAl
geria
25.0
21.9
16.8
17.0
16.7
16.6
16.7
16.9
Egyp
t26
.922
.321
.820
.619
.921
.2—
16.6
Iran
—16
.424
.426
.628
.329
.331
.834
.5Jo
rdan
21.0
17.9
15.6
21.1
——
—16
.1Le
bano
n11
.9—
——
——
——
Mor
occo
—18
.7—
——
—17
.016
.4Sy
ria19
.517
.718
.918
.417
.716
.916
.614
.8Tu
nisi
a—
——
—23
.0—
—22
.8Ye
men
——
——
——
—12
.6
Sour
ces:
WDI
19
97,
UNE
SCO
1997
, GE
D 19
98,
Nati
onal
Cen
ter
for
Hum
an R
esou
rces
Dev
elop
men
t (w
ww.
nchr
d.go
v.jo
),
Pale
stin
ian
Cent
ral B
urea
u of
Sta
tist
ics
and
MOE
199
6, W
orld
Ban
k st
aff
calc
ulat
ion
usin
g da
ta f
rom
Tun
isia
MOE
199
7/98
, Eg
ypt
MOE
199
7/98
, M
oroc
co A
nnua
l Sta
tist
ical
Boo
k 19
96,
Yem
en E
duca
tion
Cens
us 1
997/
98.
Note
s:(*
) Eg
ypt,
Tun
isia
, an
d Ye
men
dat
a ar
e fo
r 19
98.
Mor
occo
dat
a ar
e fo
r 19
96.
Alge
ria,
Jord
an,
Syria
dat
a ar
e fo
r 19
95.
For
Iran
, ca
lcul
atio
n is
bas
ed o
n da
ta o
nst
uden
ts i
n 19
96 a
nd t
each
ers
in 1
995.
Leb
anon
pri
mar
y ed
ucat
ion
data
are
for
pri
mar
y an
d ge
nera
l sec
onda
ry e
duca
tion
in
1995
. W
BG d
ata
are
for
basi
c an
dse
cond
ary
educ
atio
n.
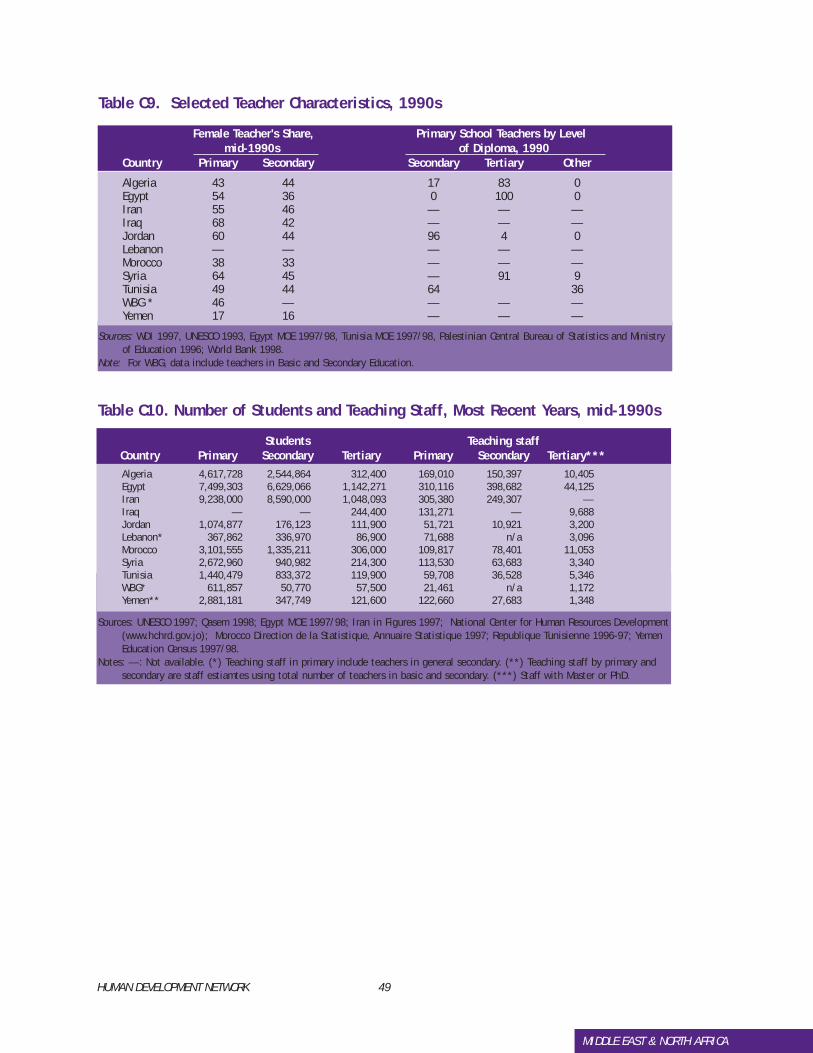
HUMAN DEVELOPMENT NETWORK 49
MIDDLE EAST & NORTH AFRICA
Table C9. Selected Teacher Characteristics, 1990s
Female Teacher's Share, Primary School Teachers by Level mid-1990s of Diploma, 1990
Country Primary Secondary Secondary Tertiary Other
Algeria 43 44 17 83 0Egypt 54 36 0 100 0Iran 55 46 — — —Iraq 68 42 — — —Jordan 60 44 96 4 0Lebanon — — — — —Morocco 38 33 — — —Syria 64 45 — 91 9Tunisia 49 44 64 36WBG * 46 — — — —Yemen 17 16 — — —
Sources: WDI 1997, UNESCO 1993, Egypt MOE 1997/98, Tunisia MOE 1997/98, Palestinian Central Bureau of Statistics and Ministryof Education 1996; World Bank 1998.
Note: For WBG, data include teachers in Basic and Secondary Education.
Table C10. Number of Students and Teaching Staff, Most Recent Years, mid-1990s
Students Teaching staffCountry Primary Secondary Tertiary Primary Secondary Tertiary***
Sources: UNESCO 1997; Qasem 1998; Egypt MOE 1997/98; Iran in Figures 1997; National Center for Human Resources Development(www.hchrd.gov.jo); Morocco Direction de la Statistique, Annuaire Statistique 1997; Republique Tunisienne 1996-97; YemenEducation Census 1997/98.
Notes: —: Not available. (*) Teaching staff in primary include teachers in general secondary. (**) Teaching staff by primary andsecondary are staff estiamtes using total number of teachers in basic and secondary. (***) Staff with Master or PhD.
Algeria 4,617,728 2,544,864 312,400 169,010 150,397 10,405 Egypt 7,499,303 6,629,066 1,142,271 310,116 398,682 44,125 Iran 9,238,000 8,590,000 1,048,093 305,380 249,307 — Iraq — — 244,400 131,271 — 9,688 Jordan 1,074,877 176,123 111,900 51,721 10,921 3,200 Lebanon* 367,862 336,970 86,900 71,688 n/a 3,096 Morocco 3,101,555 1,335,211 306,000 109,817 78,401 11,053 Syria 2,672,960 940,982 214,300 113,530 63,683 3,340 Tunisia 1,440,479 833,372 119,900 59,708 36,528 5,346 WBG* 611,857 50,770 57,500 21,461 n/a 1,172 Yemen** 2,881,181 347,749 121,600 122,660 27,683 1,348
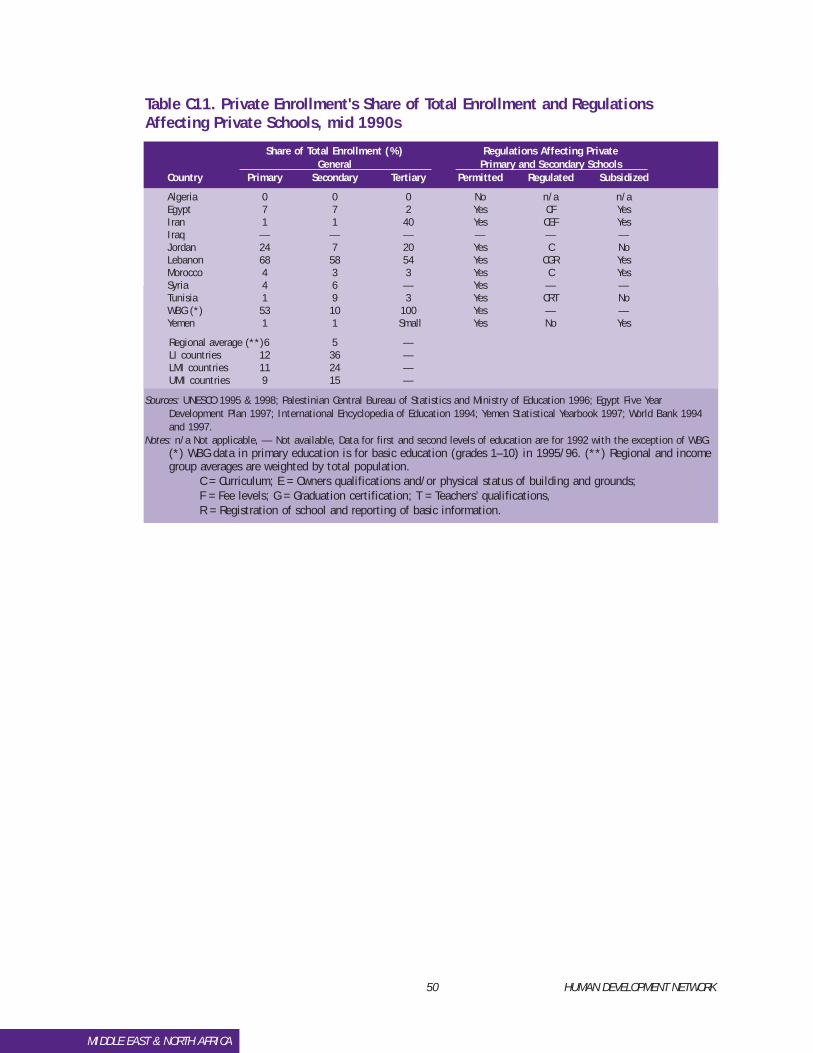
50 HUMAN DEVELOPMENT NETWORK
MIDDLE EAST & NORTH AFRICA
Table C11. Private Enrollment's Share of Total Enrollment and RegulationsAffecting Private Schools, mid 1990s
Share of Total Enrollment (%) Regulations Affecting PrivateGeneral Primary and Secondary Schools
Country Primary Secondary Tertiary Permitted Regulated Subsidized
Algeria 0 0 0 No n/a n/aEgypt 7 7 2 Yes CF YesIran 1 1 40 Yes CEF YesIraq — — — — — —Jordan 24 7 20 Yes C NoLebanon 68 58 54 Yes CGR YesMorocco 4 3 3 Yes C YesSyria 4 6 — Yes — —Tunisia 1 9 3 Yes CRT NoWBG (*) 53 10 100 Yes — —Yemen 1 1 Small Yes No Yes
Regional average (**)6 5 —LI countries 12 36 —LMI countries 11 24 —UMI countries 9 15 —
Sources: UNESCO 1995 & 1998; Palestinian Central Bureau of Statistics and Ministry of Education 1996; Egypt Five YearDevelopment Plan 1997; International Encyclopedia of Education 1994; Yemen Statistical Yearbook 1997; World Bank 1994and 1997.
Notes: n/a Not applicable, — Not available, Data for first and second levels of education are for 1992 with the exception of WBG.(*) WBG data in primary education is for basic education (grades 1–10) in 1995/96. (**) Regional and incomegroup averages are weighted by total population.
C = Curriculum; E = Owners qualifications and/or physical status of building and grounds;F = Fee levels; G = Graduation certification; T = Teachers’ qualifications, R = Registration of school and reporting of basic information.
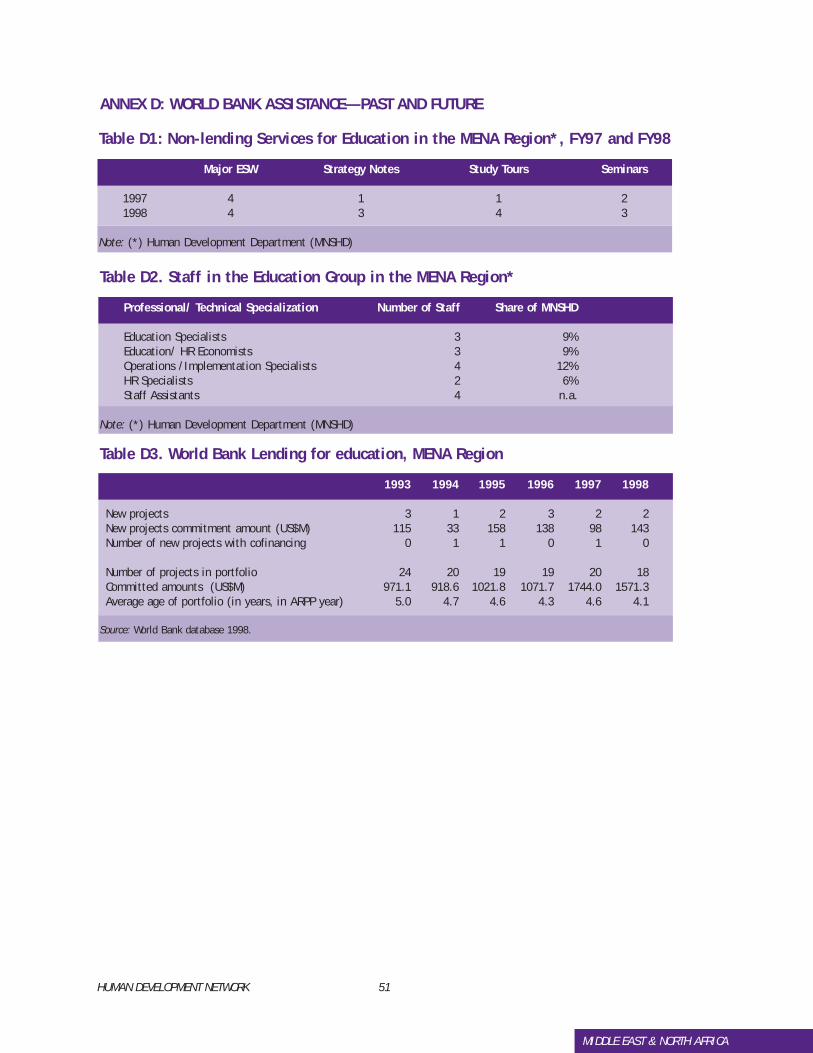
HUMAN DEVELOPMENT NETWORK 51
MIDDLE EAST & NORTH AFRICA
Table D1: Non-lending Services for Education in the MENA Region*, FY97 and FY98
Major ESW Strategy Notes Study Tours Seminars
1997 4 1 1 21998 4 3 4 3
Note: (*) Human Development Department (MNSHD)
Table D2. Staff in the Education Group in the MENA Region*
Professional/ Technical Specialization Number of Staff Share of MNSHD
Education Specialists 3 9%Education/ HR Economists 3 9%Operations /Implementation Specialists 4 12%HR Specialists 2 6%Staff Assistants 4 n.a.
Note: (*) Human Development Department (MNSHD)
Table D3. World Bank Lending for education, MENA Region
1993 1994 1995 1996 1997 1998
New projects 3 1 2 3 2 2New projects commitment amount (US$M) 115 33 158 138 98 143Number of new projects with cofinancing 0 1 1 0 1 0
Number of projects in portfolio 24 20 19 19 20 18Committed amounts (US$M) 971.1 918.6 1021.8 1071.7 1744.0 1571.3Average age of portfolio (in years, in ARPP year) 5.0 4.7 4.6 4.3 4.6 4.1
Source: World Bank database 1998.
ANNEX D: WORLD BANK ASSISTANCE—PAST AND FUTURE
52 HUMAN DEVELOPMENT NETWORK
MIDDLE EAST & NORTH AFRICA
BIBLIOGRAPHYAl-Abbasi, Mutahar, Yahya Y. Almutawakel, and
Abdulkhalek Ba-Alawi. 1997. “Decentralization andEducation Expenditures in Yemen.” Processed.
Al Heeti, Abdul Ghafour and Colin Brock. 1997.“Vocational Education and Development: KeyIssues, with Special Reference to the Arab World.”International Journal of Educational Development.17 (4): 373–389.
Arab Republic of Egypt. Pre-University EducationStatistics 1996/1997.
Arab Republic of Egypt. 1996. Demographic and HealthSurvey 1995. Cairo: National Population Council;Maryland: Macro International Inc.
Assaad, Ragui. 1995. Effects of Public Sector Hiring &Compensation Policies on the Egyptian Labor Market.Working Paper 9517. Economic Research Forum forthe Arab Countries, Iran & Turkey.
Azariadis, Costas, and Allan Drazen. 1990. “ThresholdExternalities in Economic Development.” QuarterlyJournal of Economics. 105 (2): 501–26.
Barnett, Steven, S. Eken, M. Lockheed, and W. vanEeghen. 1998. “Effective Financing of Education:Role of Public and Private Sectors.” Paper present-ed at the 1998 Annual Seminar jointly organized bythe AMF, AFESD, IMF, WB on Human ResourceDevelopment and Economic Growth in the Arabcountries, Abu Dhabi, February 21–22, 1998.
Barro, Robert; and J.W. Lee. 1996. “InternationalMeasures of Schooling Years and Schooling Quality,”American Economic Review Papers and Proceedings,86 (2): 218–223
Becker, Henry. 1993 “A Truly Empowering Technology-Rich Education—How Much Will It Cost?”Educational IRM Quarterly, 3: 31–35.
Berryman, Sue E. 1997. Preparing for the Global Economy:Focus on Quality. Human Resources and SocialDevelopment Division, Middle East and North AfricaRegion, World Bank, Washington, D.C.
Education Development Center. 1997. “Higher Educationin Yemen: Structural Adjustment, QualityImprovement and Labor Force Needs.” Processed.
Elley, Warwick B. 1992. How in the World do StudentsRead? International Association for the Evaluationof Educational Achievement.
Fergany, Nader, Ilham Farmaz, and Christiane Wissa.1996. “Enrollment in Primary Education andCognitive Achievement in Egypt, Change andDeterminants.” Giza: ALMISHKAT (Centre forResearch and Training)
Gillespie, Nancy. 1997. “Explaining Returns to Educationin MENA.” Processed.
Golladay, Fredrick L., Sue E. Berryman, Jon Avins, andLaurence Wolff. 1998. “A Human Capital Strategy for
Competing in World Markets.” In Prospects forMiddle Eastern and North African Economies FromBoom to Bust and Back? Nemat Shafik. ed. London:Macmillan Press LTD; NY: St. Martin’s Press, Inc.
Hashemite Kingdom of Jordan Department of Statistics.1996. Statistical Year Book 1995.
Heiberg, Marianne and Geir Ovensen. 1993. “PalestinianSociety in Gaza, West Bank and Arab Jerusalem A Surveyof Living Conditions.” FAFO-report 151. Oslo: Falch.
Heyneman, Stephen P. 1997. “Quality of Education in theMiddle East and North Africa.” International Journalof Educational Development. 17 (4) : 449–466.
Heyneman, Stephen P. 1998. “From the Party/State toMulti-Ethnic Democracy: Education and ItsInfluence on Social Cohesion in the Europe andCentral Asia Region.” Processed.
ILO. 1998. Child Labour: Targeting the Intolerable.Geneva.
International Monetary Fund. 1997. World EconomicOutlook 1997. Washington, D.C.
Lapointe, Archie E., J. M. Ashew, and N. A. Mead. 1992.Learning Science. New Jersey: IAEP
Lapointe, Archie E., J. M. Ashew, and N. A. Mead. 1992.Learning Mathematics. New Jersey: IAEP
Lau, Lawrence, Dean Jamison, and F.F. Louat. 1990.“Education and Productivity in DevelopingCountries: An Aggregate Production FunctionApproach” Policy Research Working Paper 612. PolicyResearch Department, World Bank, Washington, D.C.
Lockheed, Marlaine, Adriaan Verspoor and Associates.1991. Improving Primary Education in DevelopingCountries. New York: Oxford University Press.
Maeda, Akiko. 1997. “Health, Nutrition, and Populationin the Middle East and North Africa Region.”Background paper for the regional seminar onhealth sector development in the Middle East andNorth Africa, Cairo, June 8–11, 1997.
Mulis, Ina V.S., M. O. Martin, A. E. Beaton, E. J.Gonzalez, D. L. Kelly, and T. A. Smith. 1997a.Mathematics Achievement in the Primary SchoolYears: IEA's Third International Mathematics andScience Study. MA: IEA and TIMSS InternationalStudy Center, Boston College.
Mulis, Ina V.S., M. O. Martin, A. E. Beaton, E. J.Gonzalez, T. A. Smith, and D. L. Kelly. 1997b.Science Achievement in the Primary School Years:IEA's Third International Mathematics and ScienceStudy. MA: IEA and TIMSS International StudyCenter, Boston College.
Mulis, Ina V.S., M. O. Martin, A. E. Beaton, E. J.Gonzalez, D. L. Kelly, and T. A. Smith. 1997c.Mathematics and Science Achievement in the FinalYear of Secondary School. MA: IEA and TIMSSInternational Study Center, Boston College.
HUMAN DEVELOPMENT NETWORK 53
MIDDLE EAST & NORTH AFRICA
Mulis, Ina V.S., M. O. Martin, A. E. Beaton, E. J.Gonzalez, D. L. Kelly, and T. A. Smith. 1997d.Mathematics Achievement in the Middle School Years:IEA's Third International Mathematics and ScienceStudy. MA: IEA and TIMSS International StudyCenter, Boston College.
Mulis, Ina V.S., M. O. Martin, A. E. Beaton, E. J.Gonzalez, D. L. Kelly, and T. A. Smith. 1997f.Science Achievement in the Middle School Years:IEA's Third International Mathematics and ScienceStudy. MA: IEA and TIMSS International StudyCenter, Boston College.
OECD. 1997. Education at a Glance OECD Indicators 1997.Paris: Center for Educational Research andInnovation.
Palestinian Central Bureau of Statistics and Ministry ofEducation. 1996. Education Statistical Yearbook1995/1996. Ramallah.
Palestine Economic Policy Research Institute and WorldBank. 1997. “Development Under Adversity? ThePalestinian Economy in Transition.” Discussion draftfor meeting of the consultative group for the WestBank and Gaza.
President's Committee of Advisors on Science andTechnology Panel on Educational Technology. 1997.Report to the President on the Use of Technology toStrengthen K-12 Education in the United States,March.
Pritchett, Lant. 1997. “Has Education Had a GrowthPayoff in the MENA Region?” Processed. WorldBank, Washington, D.C.
Psacharopoulos, George and Nguyen Xuan Nguyen. 1997.“The Role of Government and the Private Sector inFighting Poverty.” World Bank Technical Paper No.34. Washington D.C.
Qasem, Subhi. 1998. Higher Education System in the ArabStates: Development of Science and TechnologyIndicators 1998. Economic and Social Commissionfor Western Asia and UNESCO Cairo Office.
Republic of Yemen. 1994. Yemen Demographic andMaternal and Child Health Survey 1991/1992.Central Statistical Organization: Sana’a; Pan ArabProject for Child Development: Cairo; and MacroInternational Inc: Maryland.
Republic of Yemen. 1996. Final Results of the Population,Housing and Establishments Census December, 1994General Report. Central Statistical Organization:Sana’a.
Republic of Yemen. 1997. Statistical Yearbook 1996.Ministry of Planning and Development CentralStatistical Organization.
République Tunisienne. 1996–1997. StastistiquesScolaires 1996–1997. 1er Cycle de L’enseignement deBase. Ministére de l’Education, Direction de laProspective et de la Statistique.
République Libanaise. 1995. La Restructuration duSystéme Educatif Libanais.
Richards, Alan. 1992. Higher Education in Egypt. WorldBank Working Papers 862. Washington, D.C.
Richards, Alan and John Waterbury. 1996. PoliticalEconomy of the Middle East. Colorado: Westview Press.
Royaume du Maroc. 1996. Les Caractéristiques Socio-Economiques et Démographiques de la PopulationRecensement 1994. Premier Ministre, Ministre Chargéde la Population, Direction de la Statistique.
Thomas, Vinod and Yan Wang. 1997. “Education, TradeReform and Investment Returns.” World Bank.Washington, D.C.
UNDP 1997. Human Development Report 1997. NY.UNESCO 1993. World Education Report 1993. Paris.UNESCO 1995. World Education Report 1995. Paris.UNESCO 1997. Statistical Yearbook 1997. Paris.UNESCO 1998. World Education Report 1998. Paris.UNICEF 1997. The State of the World’s Children 1997. NY:
Oxford Press.
Van Eeghen, Willem and Miguel Castilla. 1997. “Spendingon Education in Selected MENA Countries.” WorldBank. Washington D.C.
Valverde, G. A., W. H. Schmidt, and L. J. Bianchi. 1995.“An Exploratory Analysis of the Content andExpectations for Student Performance in SelectedMathematics and Biology School-LeavingExaminations from the Middle East and NorthAfrica.” Paper prepared for the World Bank.
World Bank. 1991. World Development Report 1991. NY:Oxford Press.
World Bank. 1993. The East Asian Miracle: EconomicGrowth and Public Policy. A World Bank PolicyResearch Report. New York: Oxford University Press.
World Bank. 1994a. Kingdom of Morocco: Poverty,Adjustment, & Growth. Washington, D.C.
World Bank. 1994b. Kingdom of Morocco Schooling andCognitive Achievements of Children in Morocco. WorldBank Discussion Papers 264. Washington, D.C.
World Bank. 1994c. Hashemite Kingdom of Jordan:Poverty Assessment. Washington, D.C.
World Bank. 1994d. Republic of Tunisia: SecondaryEducation Support Project. Staff Appraisal Report13245-TUN. Washington, D.C.
World Bank. 1994e. Republic of Yemen: Education SectorInvestment Project. Staff Appraisal Report 12461-YEM. Washington, D.C.
World Bank. 1995a. Will Arab Workers Prosper or be LeftOut in the Twenty-First Century? Washington, D.C.
World Bank. 1995b. Hashemite Kingdom of Jordan:Second Human Resources Development SectorInvestment Project. Staff Appraisal Report 13790-JO. Washington, D.C.
World Bank. 1995c. “Islamic Republic of Iran: Education,Training and the Labor Market.” Washington, D.C.
54 HUMAN DEVELOPMENT NETWORK
MIDDLE EAST & NORTH AFRICA
World Bank. 1995d. Claiming the Future-ChoosingProsperity in the Middle East and North Africa.Washington, D.C.
World Bank. 1995e. Republic of Tunisia. PovertyAlleviation: Preserving Progress While Preparing forthe Future. Washington, D.C.
World Bank. 1995f. West Bank and Gaza: Education andHealth Rehabilitation Project. Staff Appraisal Report14280-XO. Washington, D.C.
World Bank. 1995g. Republic of Yemen: VocationalTraining Project. Staff Appraisal Report 14485-YEM.Washington, D.C.
World Bank. 1996a. Arab Republic of Egypt: EducationEnhancement Program. Staff Appraisal Report15750-EGT. Washington, D.C.
World Bank. 1996b. Jordan: Higher EducationDevelopment Study. Washington, D.C.
World Bank. 1996c. Kingdom of Morocco: Social PrioritiesProgram Basic Education Project. Staff AppraisalReport 15074-MOR. Washington, D.C.
World Bank. 1996d. Kingdom of Morocco: Third PrivateSector Development Project (In-Service Training).Staff Appraisal Report 15513-MOR. Washington, D.C.
World Bank. 1996e. Growing Faster, Finding Jobs Choicesfor Morocco. World Bank Middle East and NorthAfrica Economic Studies. Washington, D.C.
World Bank. 1996f. Republic of Tunisia: Second Trainingand Employment Project. Staff Appraisal Report15515-TUN. Washington, D.C.
World Bank. 1996g. Republic of Yemen: PublicExpenditure Review. Washington, D.C.
World Bank. 1997a. World Development Indicators.Washington, D.C.
World Bank. 1997b. Global Economic Prospects and theDeveloping Countries. Washington, D.C.
World Bank. 1997c. Republic of Tunisia: Higher Education:Challenges and Opportunities. Washington, D.C.
World Bank. 1997d. Primary Education in India:Development in Practice. Washington, D.C.
World Bank. 1997e. “Democratic and Popular Republic ofAlgeria. Growth, Employment and PovertyReduction.” Washington, D.C.
World Bank. 1997f. “Quality Education for All: EmbracingChange in the Middle East and North Africa.” Paperprepared for Mediterranean Development ForumMarrakech, Morocco, May 14–17, 1997.
World Bank. 1998a. Lebanese Republic: Vocational andTechnical Education Project. Project AppraisalDocument 17273 LE. Washington, D.C.
World Bank. 1998b. Republic of Tunisia: Higher EducationReform Support Project. Project Appraisal Document17372-TUN. Washington, D.C.
Top Related