


Languages
Pages
Legal

Acta metall, mater. Vol. 40, No. 11, pp. 3035-3049, 1992 0956-7151/92 $5.00 + 0.00 Printed in Great Britain. All rights reserved Copyright © 1992 Pergamon Press Ltd
MECHANISMS OF ISOTHERMAL PHASE TRANSFORMATIONS IN RAPIDLY SOLIDIFIED Ti-24Al-11Nb
L. M. HSIUNG, W. CAI and H. N. G. WADLEY Department of Materials Science and Engineering, University of Virginia, Charlottesville,
VA 22903-2442, U.S.A.
(Received 6 April 1992)
Abstract--Isothermal phase transformations of a rapidly solidified Ti-24AI-I 1Nb alloy at temperatures below 900°C have been studied using electron microscopy (SEM and TEM) and X-ray diffraction (XRD) methods. A supercooled fl phase was found to retain in the alloy as a result of rapid cooling. Subsequent isothermal treatments resulted in a fl ---+ ~2 transition which took place through a complex sequence of phase transitions. Initially it proceeded by ordering transitions fl (disordered b.c.c.)--, B2 (ordered b.c.c.) ---} T (ordered tetragonal) and was then followed by T ~ O (ordered orthorhombic) ---} ~2 (ordered hexagonal) transitions. Plate-like O and a2 phases were found to form at the early stages of both the T ~ O and O---~a 2 transitions. The T/O interface (habit) plane was determined to be {223}r, and the O/~ 2 interface (habit) plane was determined to be {lI0}o. Both the T----} O and O---} ~2 transitions can be explained by a shape deformation mechanism involving a homogeneous lattice distortion and a rigid-body rotation. In addition to the shape deformation, diffusion of Nb away from the O/~ 2 interface also is needed for the O----, ~2 transition to progress.
R~um~--On 6tudie les transformations de phase isothermes d'un alliage Ti-24Al-11Nb, rapidement solidfi6 fi des temperatures infrrieures /t 900°C, par microscopie 61ectronique en transmission et en balayage (MET et MEB) et par diffraction des rayons X. On trouve une phase fl surfondue qui reste dans I'alliage par suite du refroidissement rapide. Des traitements isothermes ultrrieurs provoquent la transition fl ~ ~2 qui se produit fi la suite d'une srquence complexe de transitions de phases: Au drbut, il se produit des transformations d'ordre fl (c.c. drsordonnr)---}B2 (c.c. ordonnr)---}T (quadratique ordonnr), suivies par les transitions T---~O (orthohombique ordonnr)---}~2 (hexagonal ordonnr). On trouve que les phases Oet ~2, en forme de plaquettes, se forment aux premiers stades des transitions T---}O et O--}a 2. Le plan d'interface (plan d'accolement) T/O est {223}r et le plan d'interface O/~ 2 est { 1T0}o. Les deux transitions T--*O et O---}~ 2 peuvent s'expliquer par un m~canisme de drformation de forme qui implique une distorsion homogrne et une rotation rigide du rrseau. En plus de la drformation de forme, la diffusion du Nb hors le l'interface O/~2 est aussi n~.essaire pour que la transformation O---~a2 s'effectue.
Z~-,ammenfassung--Die isothermen Phasenumwandlungen in der rasch erstarrten Legierung Ti-24AI- 11Nb werden bei Temperaturen unterhalb von 900°C elektronenmikroskopisch (Raster- und Durch- strahlungselektronenmikroskopie) und mit Rfntgenbeugungsmethoden untersucht. Als Ergebnis der raschen Erstarrung bleibt eine unterkfihlte fl-Phase in der Legierung zuriick. Nachfolgende isotherme W/irmebehandlung fiihrt zum ~bergang fl---}~2, der fiber eine komplexe Folge von Phaseniiberg/ingen l~iuft: zu Anfang l/iuft sic fiber Ordnungsumwandlungen fl (entordnet k.r.z.)---}B2 (geordnet k.r.z.)--+T (geordnet tetragonal), gefolgt von T---}O (geordnet orthorhombisch)---,a 2 (geordnet hexagonal). Platten- ertige O- und ~2-Phasen bilden sich im frfihen Stadium der Umwandlungen T---}O und O---~a 2. Die T/O-Grenzflfichen-(Habit)-Ebene wird zu {223} bestimmt, die O/~2-Ebene zu {li0}o. Sowohl der Obergang T--,O, wie auch O---*~ 2 krnnen mit einem Form-Deformationsmechanismus, der eine homogene Gitterverzerrung und eine Festkrrperrotation einschlieBt, erkl~irt werden. Zus/itzlich zur Formdeformation wird die Diffusion von Nb weg von der O/a2-Grenzfl/iche ffir den l~bergang O---~:c 2 benrtigt.
I. INTRODUCTION
Ti3Al-base aluminide alloys are candidate materials for high temperature structural applications because of their low density, good elevated temperature strength and creep resistance. Advanced intermetallic- matrix composites (IMCs) that use the Ti3AI aluminide alloys as a matrix can offer even better
performance in stiffness and strength over their monolithic counterparts [1]. Ti3A1 aluminide alloys, however, are difficult to be fabricated into structural components by conventional processing methods due to limited ductility and low toughness, To overcome this, researchers are exploring the use of inductive- coupled plasma-deposition (ICPD) [1, 2] to produce composite unidirectional monotapes followed by hot
3035
3036 HSIUNG eta/.: RAPIDLY SOLIDFIED Ti-24Al-11Nb
isostatic pressing (HIPing) or vacuum hot pressing (VHPing) to make a multilayer net shape component. Before one can control and optimize the matrix microstructures (and thus the IMC's mechanical properties) by controlling the deposition and subse- quent consolidation processes, a full understanding of time-temperature-transformation (TTT) as well as isothermal transformation behavior of the Ti a Al-base aluminide alloys is needed. The TTT behavior of different Ti3Al-base aluminide alloys have been investigated by Weykamp et al. [3], Peters and Bassi [4], Djanarthany et al. [5], and Hsiung et al. [6]. Nevertheless, inconsistency can still be found among their results in terms of transformation sequence. In addition, little has been mentioned about mechanisms, and a systematic study of the TTT behavior of the TiaAl-base aluminide system has yet to be reported.
A candidate Ti3Al-base aluminide system used as the matrix material for fabricating IMCs is Ti3A1 with an addition of Nb. Nb is added to stabilize the fl phase and improve the deformability of the Ti3A1- base aluminide at lower temperatures [7]. Studies of microstructure in quenched (or rapidly solidified) and aged Ti 3 A1 + Nb alloys have revealed the existence of numerous phases [8-14]. These include fl (disordered b.c.c.), B2 (ordered b.c.c.), to-like (ordered h.c.p.),
T (ordered tetragonal), O (ordered orthorhombic) and a2 (ordered h.c.p.) phases. Three different modes of isothermal phase transitions have been recognized in the Ti3A1 + Nb system [4, 6]: (I) fl --, ~2 + fl, (II) f l-- , a2(+O) and (III) fl--* to. For the case of Ti -24Al- l lNb [6], mode (I) was found to occur between 900 and 1150°C, mode (II) below 900°C, and mode (III) was found to be a competition reaction to the mode (II) reaction at temperatures below 650°C. We report here on a detailed study of the mode (II) reaction. The effort has focused upon elucidating the mechanisms of the mode (II) reaction.
2. EXPERIMENTAL
A rapidly-solidified Ti3AI+ Nb aluminide alloy with a nominal composition of Ti -24at .%Al- l l a t .%Nb (Ti-14wt%A1-21 wt%Nb) was chosen for this study. Two forms of this alloy were used: powder and foil. The powder was produced from ingot via the plasma rotary electrode process (PREP) by Nuclear Metals Inc., Concord, Mass. The foil was produced from powder of identical composition via the inductively coupled plasma deposition (ICPD) process at GE Aircraft Engines, Lynn, Mass. [2]. During the ICPD process, powder was melted by
E
P R E P P o w d e r
( b ) X R D
i | I i , , 3 0
110
211
2 0 0
I I i ~ I I I ! I | I ! i I I I a
,40 5 0 6 0 7 0
2 #
Fig. I. (a) SEM micrograph showing microstructure of the as-prepared PREP powder, (b) XRD pattern (Cu K~) showing the existence of the B phase in the as-prepared powder.
HSIUNG et al.: RAPIDLY SOLIDFIED Ti-24AI-I 1Nb 3037
passing it through a plasma. The molten droplets were then immediately deposited onto a preheated mandrel inside a vacuum chamber where they were rapidly quenched to a solid state. This mandrel was preheated to ~ 800°C and held at this temperature during deposition. Thus, during the deposition process the alloy first deposited was cooled to ~800°C, and was held at this temperature until completion of the deposition, and was then cooled to room temperature. The total deposition period lasted approximately 1 h. Therefore the alloy first deposited has already been preaged.
Both the powder and foil were examined in their as- prepared and aged status using X-ray diffractometry (XRD), electron microscopy (SEM and TEM), and energy dispersive X-ray spectrometry (EDS). Prior to aging, specimens were wrapped with tantalum foils and encapsulated in cleaned and evacuated quartz ampoules. Aging was performed for various times in the temperature range 450 to 900°C. Following the heat treatment, Vickers hardness of PREP powders was measured using a MICROMET microhardness
B XRD i~ ° ICPD Foil: As-sprayed
I (a) Side A B
o ~ o B
o 20 I
O0 I ~0 (b)Center =( o o l
~ 0 0 ; k 042 0 431
~12~ 20 ":' (c) Side B
a2
o~' {°9. a, a 2 a~ I "= I l l =o.= ==..o =o'=1
=e 4o so do "Io
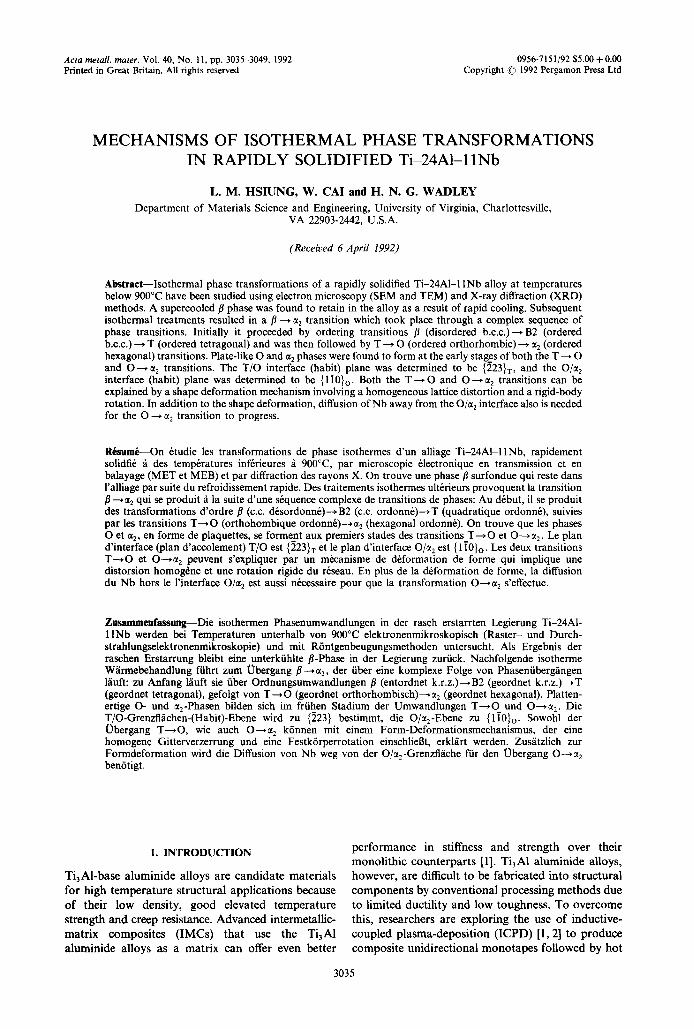
2e Fig. 2. XRD pattern (Cu K=) generated from the as-sprayed ICPD foil, (a) side A (last deposited), (b) center portion and
(c) side B (early deposited).
indentor. TEM specimens were prepared from both the as-prepared and aged ICPD foil. Microstructures were examined using a Philips 400T transmission electron microscope. Selected-area electron diffraction (SAD), microdiffraction (MD) and convergent-beam electron diffraction (CBED) methods were applied to identify and distinguish the different phases.
3. RESULTS
3.1. As-processed microstructures
3.1.1. PREP powder. The microstructure of the as- prepared powder was studied using XRD and SEM. The results are shown in Fig. 1. In contrast to the formation of martensitic microstructures reported for Ti3AI (without a Nb addition) PREP powder [15], a cellular-dendritic microstructure was observed in this alloy [Fig. l(a)]. The XRD result shown in Fig. l(b) indicates that the/7 phase was the only phase to form in the as-prepared powder. Since the Ms temperature of the b.c.c. ~ h.c.p, martensitic trans- formation in the Ti 3 AI + Nb alloys containing more than 5 at.% Nb is known to be well below the room temperature [9], the retention of the /7 phase in the PREP powder prepared by rapid cooling from the stable fl phase regime is to be expected. Similar results have been reported in Jominy end-tested Ti-24AI-I 1Nb specimens [3]. There, the fl phase was found close to the most rapidly-cooled end of the sample.
3.1.2. ICPDfoil . While the fl phase was the only phase found in the as-prepared PREP powder, an initially confusing variety of different phases including ~/B2, T, O and ~t 2, were found to exist in the as- prepared ICPD foil. We have been able to understand this by considering the thermal histories created during the deposition. XRD results generated from different foil depths are shown in Fig. 2. The r/B2 phase was found to exist mainly in a region close to top foil side (side A hereafter) that was the last
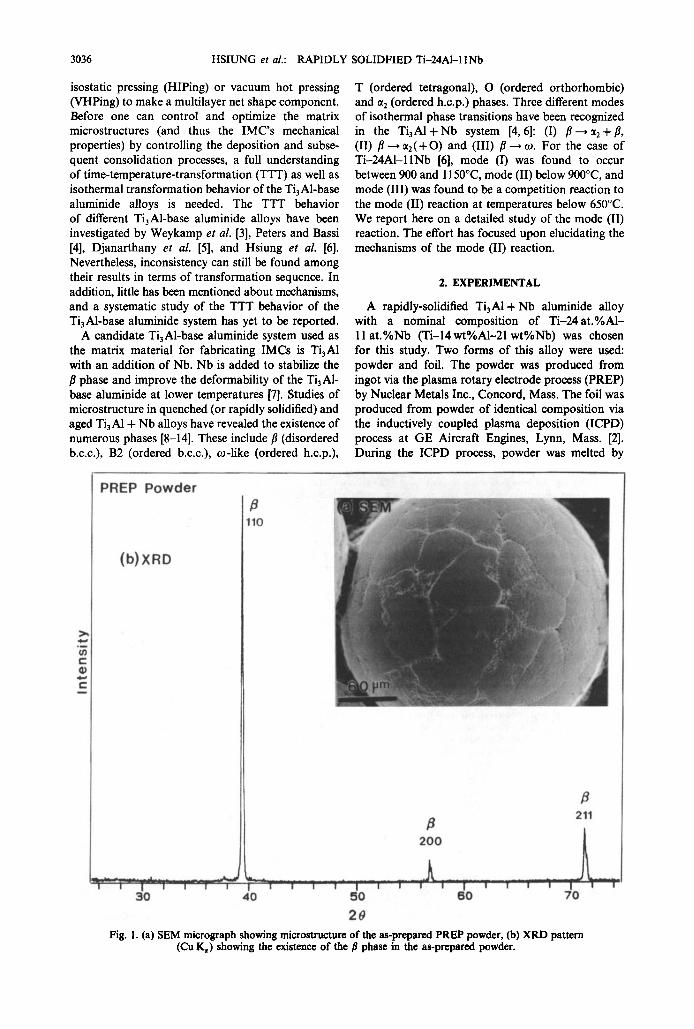
Fig. 3. Dark-field TEM image showing the formation of a network of thermal anti-phase boundaries within a B2 grain,
Z (zone axis) ~[100], g = 001.
3038 HSIUNG et al.: RAPIDLY SOLIDFIED Ti-24A1-11Nb
HSIUNG et al.: RAPIDLY SOLIDFIED Ti-24AI-11Nb 3039
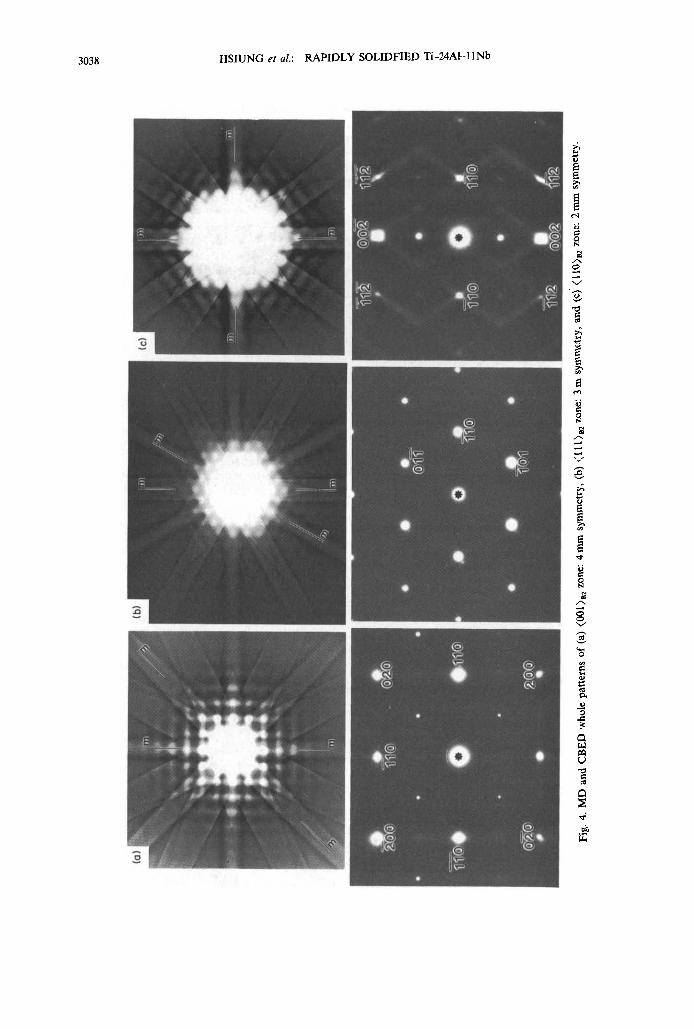
deposited (least preaged), and had been almost immediately cooled after deposition [Fig. 2(a)]. The O phase existed mainly in the center of the foil [Fig. 2(b)], whilst the ~t 2 phase was found as one approached the first deposited side (side B hereafter) of the ICPD foil [Fig. 2(c)]. Note that the deposit on side B was directly attached to the mandrel, and received a substantial amount of preaging at ~ 800°C during deposition. TEM studies of the microstructures for different depths (and therefore different preaging status), within the ICPD foil are shown in Figs 3-5. Figure 3 is a dark-field image (obtained near to side A) showing the formation of a network of thermal anti- phase boundaries (APBs) formed within a B2 grain. The existence of the ordered b.c.c. (B2) phase in this region was confirmed using microdiffraction (MD) and CBED methods• MD and CBED patterns of the <001 >B2, < 111 >s2 and < 110>a 2 zones are shown in Fig. 4. Superlattice reflections of the B2 phase can be found in the MD patterns, and the cubic symmetry of the B2 phase is displayed in the CBED patterns. Thus, a fl --~ B2 ordering reaction clearly occurred on side A during the cooling that followed deposition.
Detailed TEM studies of the T, O and ct2 phases in isothermally aged foils will be demonstrated later. First we consider the morphology of the micro- structures containing the T, O and ct2 phases in the
• ~ _ ~ 0 " ,~"~ ~e" ¢ - . .
• i
j
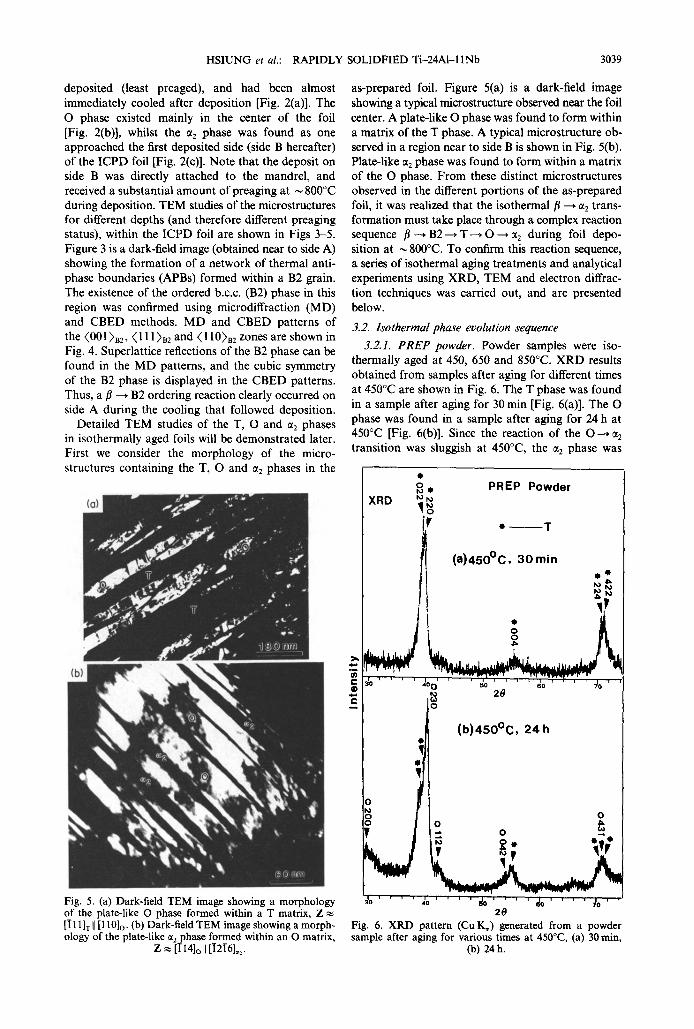
Fig. 5. (a) Dark-field TEM image showing a morphology of the plate-like O phase formed within a T matrix, Z [I 11IT II [110] o. (b) Dark-field TEM image showing a morph- ology of the plate-like ct 2 phase formed within an O matrix,
Z ~ [T14] o II [T216L2.
as-prepared foil. Figure 5(a) is a dark-field image showing a typical microstructure observed near the foil center. A plate-like O phase was found to form within a matrix of the T phase. A typical microstructure ob- served in a region near to side B is shown in Fig. 5(b). Plate-like ct 2 phase was found to form within a matrix of the O phase. From these distinct microstructures observed in the different portions of the as-prepared foil, it was realized that the isothermal/~ ---, ct2 trans- formation must take place through a complex reaction sequence fl --. B2 ~ T---* O ~ ot 2 during foil depo- sition at ~ 800°C. To confirm this reaction sequence, a series of isothermal aging treatments and analytical experiments using XRD, TEM and electron diffrac- tion techniques was carried out, and are presented below.
3.2. Isothermal phase evolution sequence
3.2.1. PREP powder. Powder samples were iso- thermally aged at 450, 650 and 850°C. XRD results obtained from samples after aging for different times at 450°C are shown in Fig. 6. The T phase was found in a sample after aging for 30 min [Fig. 6(a)]. The O phase was found in a sample after aging for 24 h at 450°C [Fig. 6(b)]. Since the reaction of the O--4 ct 2 transition was sluggish at 450°C, the ct 2 phase was
X R D
e o • P R E P P o w d e r
r • T
( a ) 4 5 0 ° C , 3 0 m i n
. . . . 2 0 0 . . . . .o . . . . . . so " ~ ' ' 'o ~ ' o 2 o
e 'I
o
( b ) 4 5 0 ° C , 2 4 h
2# Fig. 6. XRD pattern (CuK~) generated from a powder sample after aging for various times at 450°C, (a) 30 min,
(b) 24h.
3040 HSIUNG et aL: RAPIDLY SOLIDFIED Ti-24Al-11Nb
PREP Powder o
o~ (a) 650oc, lomin
o o V =T .~ ~ T 0 o p'
o
.~ 02
(b) 650°C, 2 h
*g . ~.
~0
Fig. 7. XRD pattern (CuK,) generated from a powder sample after aging for various times at 650°C (a) 10 rain,
(b) 2h.
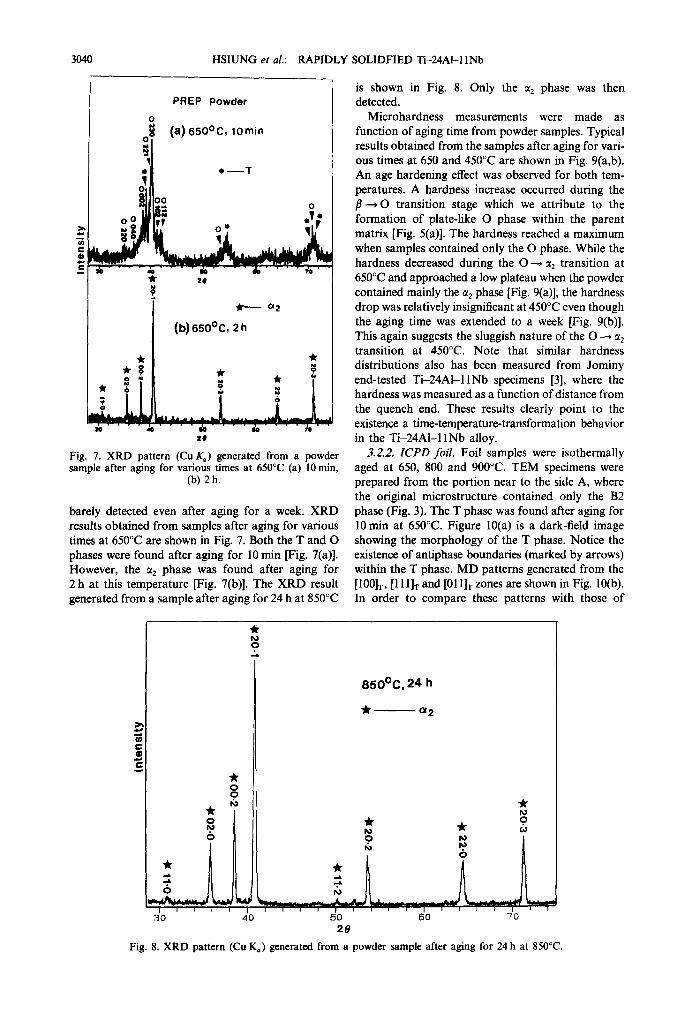
barely detected even after aging for a week. XRD results obtained from samples after aging for various times at 650°C are shown in Fig. 7. Both the T and O phases were found after aging for 10 min [Fig. 7(a)]. However, the ~2 phase was found after aging for 2 h at this temperature [Fig. 7(b)]. The XRD result generated from a sample after aging for 24 h at 850°C
is shown in Fig. 8. Only the ct 2 phase was then detected.
Microhardness measurements were made as function of aging time from powder samples. Typical results obtained from the samples after aging for vari- ous times at 650 and 450°C are shown in Fig. 9(a,b). An age hardening effect was observed for both tem- peratures. A hardness increase occurred during the f l -+ O transition stage which we attribute to the formation of plate-like O phase within the parent matrix [Fig. 5(a)]. The hardness reached a maximum when samples contained only the O phase. While the hardness decreased during the O--~ ~t: transition at 650°C and approached a low plateau when the powder contained mainly the ~q phase [Fig. 9(a)], the hardness drop was relatively insignificant at 450°C even though the aging time was extended to a week [Fig. 9(b)]. This again suggests the sluggish nature of the O --+ ~t 2 transition at 450°C. Note that similar hardness distributions also has been measured from Jominy end-tested Ti-24Al- l lNb specimens [3], where the hardness was measured as a function of distance from the quench end. These results clearly point to the existence a time-temperature-transformation behavior in the Ti-24Al- l lNb alloy.
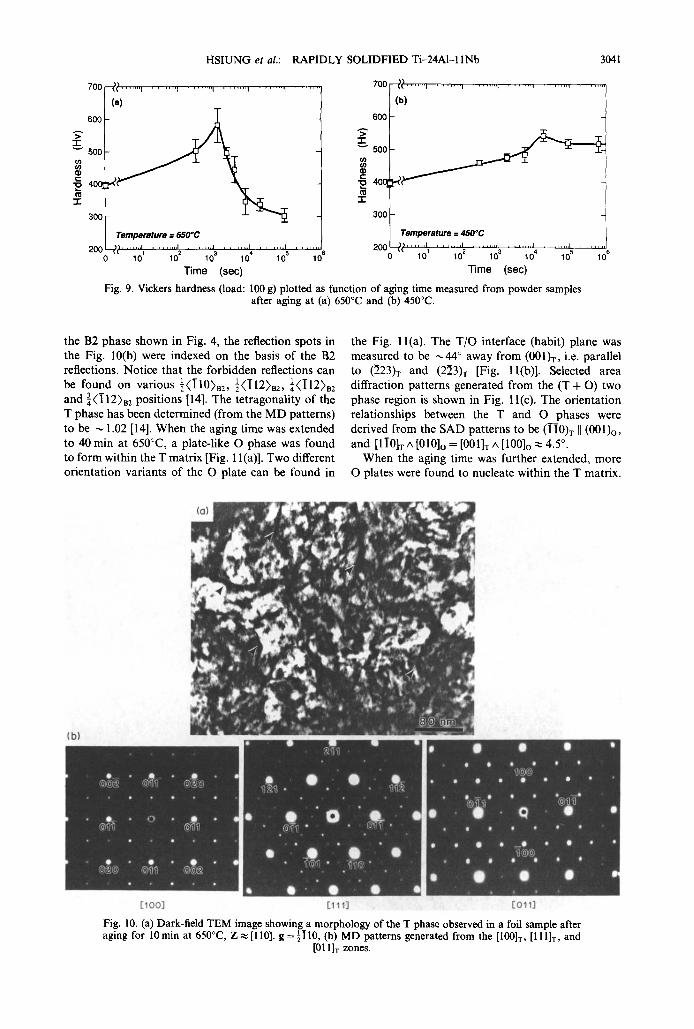
3.2.2. ICPD foil. Foil samples were isothermally aged at 650, 800 and 900°C. TEM specimens were prepared from the portion near to the side A, where the original microstructure contained only the B2 phase (Fig. 3). The T phase was found after aging for l0 min at 650°C. Figure 10(a) is a dark-field image showing the morphology of the T phase. Notice the existence of antiphase boundaries (marked by arrows) within the T phase. MD patterns generated from the [10017, [111]x and [01 lit zones are shown in Fig. lO(b). In order to compare these patterns with those of
o
o o
o 0
A I • •
30 40
8 5 0 O c , 2 4 h
* u2
o
2O Fig. 8. XRD pattern (Cu K~) generated from a powder sample after aging for 24 h at 850°C.
700
600
:~>' 500
40Q
- r
300
200 0
HSIUNG e t al.: RAPIDLY SOLIDFIED Ti-24AI-11Nb 3041
~ . . . . . . . , . . . . . . . . , , . . . . . . . , . . . . . . . . , . . . . . . . . , . . . . . . . 7 0 0 - ~ . . . . . . . , . . . . . . . . , . . . . . . . . , . . . . . . . . , . . . . . . . . , . . . . . . . .
la) (hi
> "r v 500 (/) (/)
t~ -r"
300
Temperature = 650"C Tempera tu re = 450°C
i?? . . . . . . . i . . . . . . . . , . . . . . . . . , . . . . . . . . , . . . . . . . . , . . . . . 2 0 o x ) ~ . . . . . . . ' . . . . . . . . ' . . . . . . . . ' . . . . . . . . ' . . . . . . . ~- . . . . .
101 10 2 10 3 10 4 10 5 10 s 0 101 10 2 10 3 10 4 10 5 10 6
T i m e ( s e c ) T i m e ( s e c )
Fig. 9. Vickers hardness (load: 100 g) plotted as function of aging time measured from powder samples after aging at (a) 650°C and (b) 450°C.
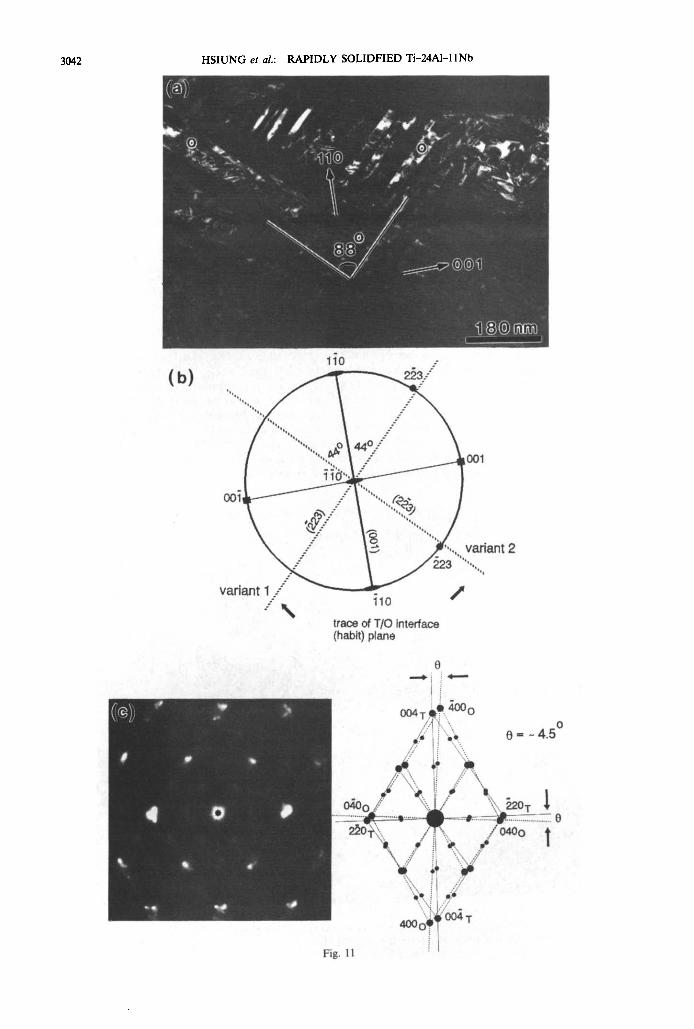
the B2 phase shown in Fig. 4, the reflection spots in the Fig. 10(b) were indexed on the basis of the B2 reflections. Notice that the forbidden reflections can be found on various ½(i10)B2, ½ ( 1 1 2 ) B 2 , ¼(i12),2 and ~(i12)B2 positions [14]. The tetragonality of the T phase has been determined (from the MD patterns) to be ~ 1.02 [14]. When the aging time was extended to 40 min at 650°C, a plate-like O phase was found to form within the T matrix [Fig. 1 l(a)]. Two different orientation variants of the O plate can be found in
the Fig. l l (a) . The T/O interface (habit) plane was measured to be ~44 ° away from (001)r, i.e. parallel to (~23) x and (2~3)T [Fig. l l(b)]. Selected area diffraction patterns generated from the (T + O) two phase region is shown in Fig. 1 l(c). The orientation relationships between the T and O phases were derived from the SAD patterns to be (i]-0)r II (001)o, and [li0]T ^ [010]o = [001]T A [100]O ~ 4.5 °.
When the aging time was further extended, more O plates were found to nucleate within the T matrix.
( b )
e B e w
" " " • 0 I I •
• • • O 0 O O t tlt " •
I • t j I t
[ l o o ] [_111] [ 0 1 1 ]
Fig. 10. (a) Dark-field TEM image showing a morphology of the T phase observed in a foil sample after aging for 10 min at 650°C, Z ~ [110]. g = lI10, (b) MD patterns generated from the [100IT, [111]T, and
[011]T zones.
3042 HSIUNG et al.: RAPIDLY SOLIDFIED Ti-24Al-I 1Nb
/ / ' /
(b) l i 0 --
OOl
variant 2 ~ 52a ...... ,,.,
v ~ t 1 / iio / ...-% trace of T/O interface (habit) plane
0
!
Fig. 11
HSIUNG et al.: RAPIDLY SOLIDFIED Ti-24AI-I1Nb
(a
e • 4) s
• 0 0 •
f e @ #
3043
A
5S.3 °
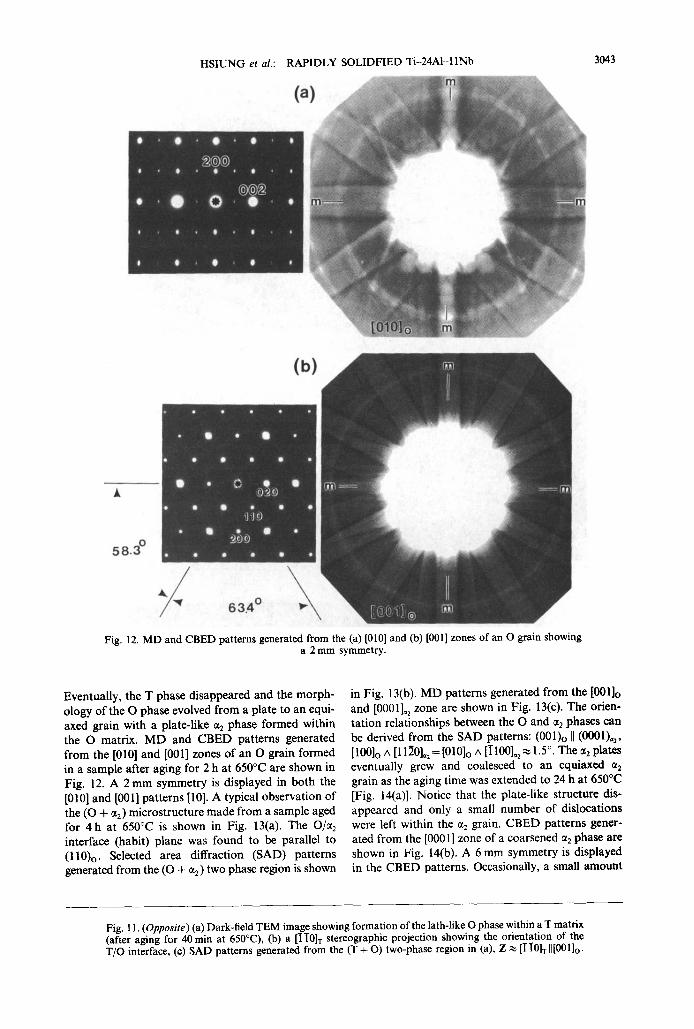
Fig. 12. MD and CBED patterns generated from the (a) [010] and (b) [001] zones of an O grain showing a 2 mm symmetry.
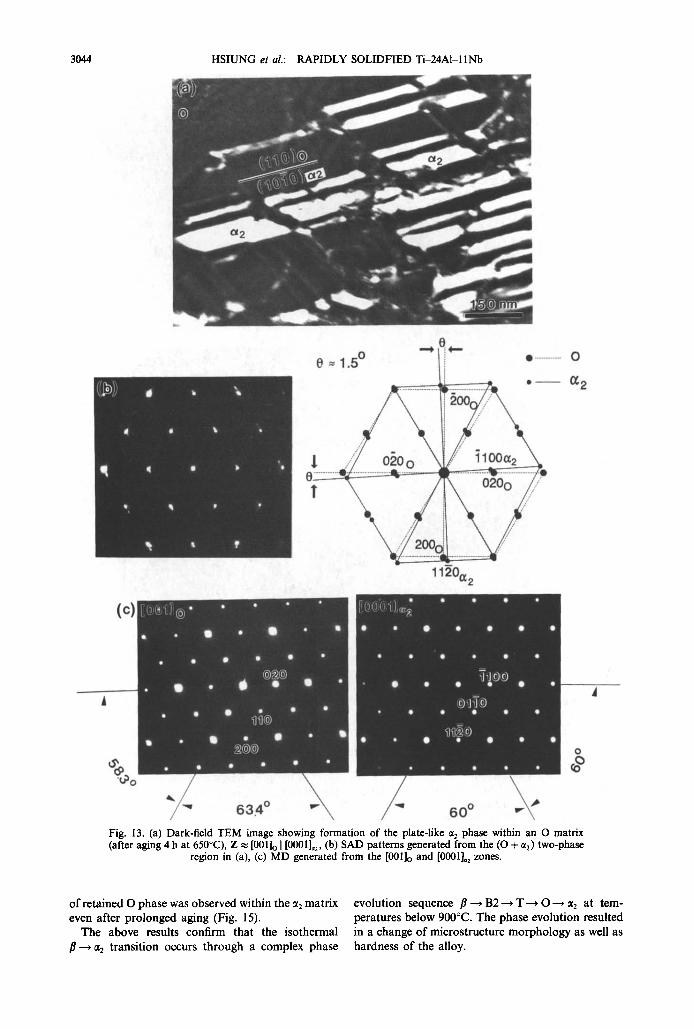
Eventually, the T phase disappeared and the morph- ology of the O phase evolved from a plate to an equi- axed grain with a plate-like ct 2 phase formed within the O matrix. MD and CBED patterns generated from the [010] and [001] zones of an O grain formed in a sample after aging for 2 h at 650°C are shown in Fig. 12. A 2 mm symmetry is displayed in both the [010] and [001] patterns [10]. A typical observation of the (O + ct2) microstructure made from a sample aged for 4 h at 650°C is shown in Fig. 13(a). The O/~t 2 interface (habit) plane was found to be parallel to ( l l0)o. Selected area diffraction (SAD) patterns generated from the (O + ~2) two phase region is shown
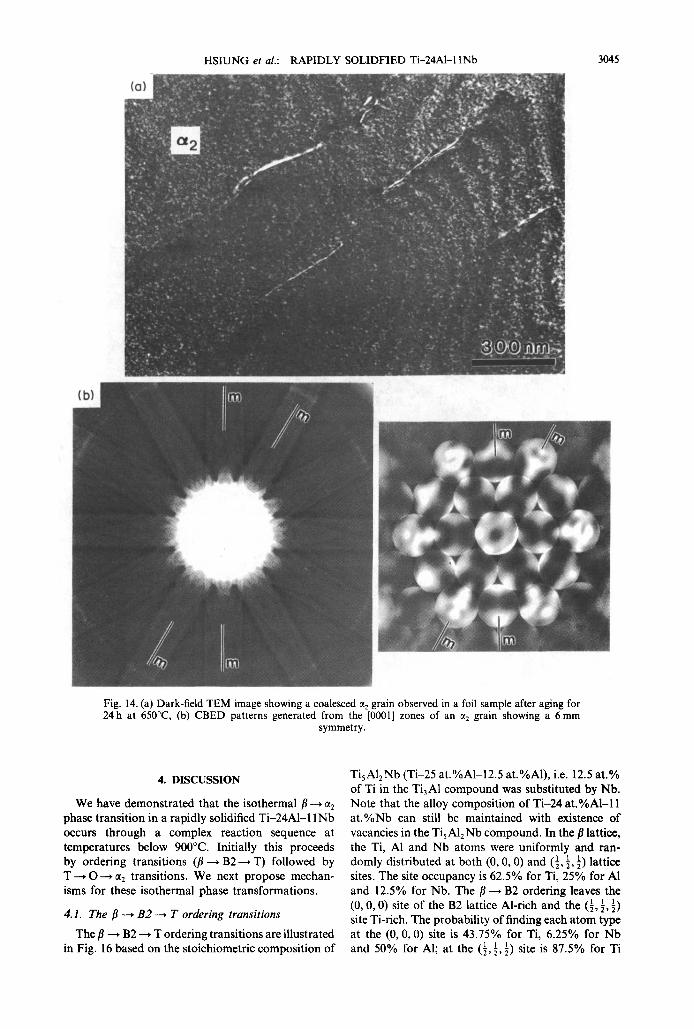
in Fig. 13(b). MD patterns generated from the [001]o and [0001]~ 2 zone are shown in Fig. 13(c). The orien- tation relationships between the O and ~t2 phases can be derived from the SAD patterns: (001)o II (0001)~2, [100] o A [11 ~0]~ 2 = [1310]o A [I 100]~2 ~ 1.5 °. The ~2 plates eventually grew and coalesced to an equiaxed ~t 2 grain as the aging time was extended to 24 h at 650°C [Fig, 14(a)]. Notice that the plate-like structure dis- appeared and only a small number of dislocations were left within the ct 2 grain. CBED patterns gener- ated from the [0001] zone of a coarsened ~t2 phase are shown in Fig. 14(b). A 6 mm symmetry is displayed in the CBED patterns. Occasionally, a small amount
Fig. 1 I. (Opposite) (a) Dark-field TEM image showing formation of the lath-like O phase within a T matrix (after aging for 40 min at 650°C), (b) a [-ll0]r stereographic projection showing the orientation of the T/O interface, (c) SAD patterns generated from the (T + O) two-phase region in (a), Z ~ [II0]T II[001]o.
3044 HSIUNG et al.: RAPIDLY SOLIDFIED Ti-24AI-11Nb
(c)
0
e l.s ° I i " . . . . . . . . . . . . . . .
1 , lii .
e ............. :~ •
1 1 2 0 a e
,, S " Q " •
• • gO • • •
c) 6) • t • 6 • m •
t • • , l ~ f ' • •
t • • • ( ' •
• • • • • • •
• • • t •
• • • • •
• " qD • qt, • •
• • • •
0
G 2
o . - \ / - . 60 °
o
Fig. 13. (a) Dark-field TEM image showing formation of the plate-like ct 2 phase within an O matrix (after aging 4 h at 650°C), Z ~ [001]o II [0001L2, (b) SAD patterns generated from the (O + ~t2) two-phase
region in (a), (c) MD generated from the [001]o and [0001]~2 zones.
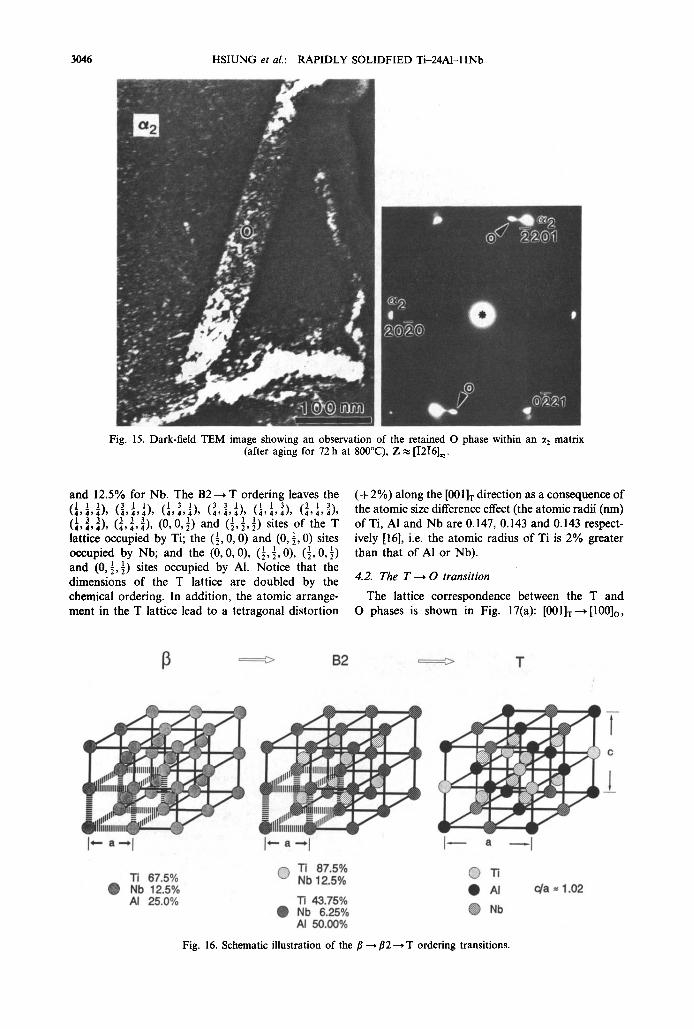
o f retained O phase was observed within the ~t 2 matrix even after prolonged aging (Fig. 15).
The above results confirm that the isothermal fl---, ct~ transition occurs through a complex phase
evolution sequence fl ~ B2 ~ T---* O ~ ~t 2 at tem- peratures below 900°C. The phase evolution resulted in a change of microstructure morphology as well as hardness of the alloy.
HSIUNG et al.: RAPIDLY SOLIDFIED Ti-24Al-11Nb 3045
Fig. 14. (a) Dark-field TEM image showing a coalesced ct 2 grain observed in a foil sample after aging for 24 h at 650°C, (b) CBED patterns generated from the [0001] zones of an ~: grain showing a 6 mm
symmetry.
4. DISCUSSION
We have demonstrated that the isothermal fl--, ~2 phase transition in a rapidly solidified Ti-24Al-I 1Nb occurs through a complex reaction sequence at temperatures below 900°C. Initially this proceeds by ordering transitions (fl--~ B2--, T) followed by T--* O--* ct 2 transitions. We next propose mechan- isms for these isothermal phase transformations.
4.1. The fl --~ B 2 --~ T ordering transitions
The fl ~ B2 ~ T ordering transitions are illustrated in Fig. 16 based on the stoichiometric composition of
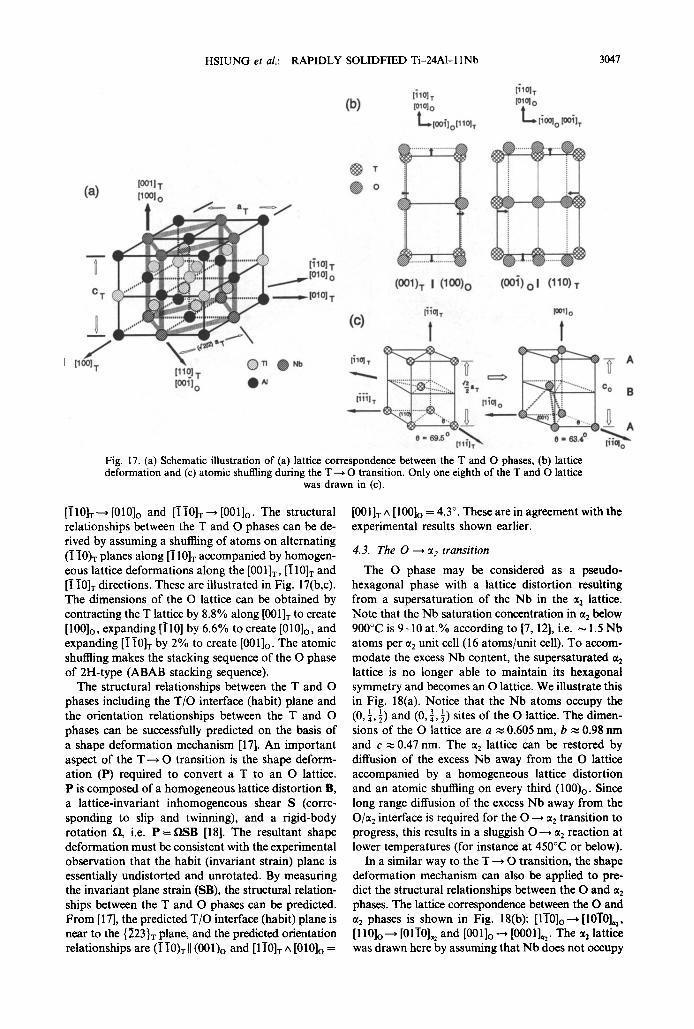
TisA12Nb (Ti-25 at.%Al-12.5 at.%A1), i.e. 12.5 at.% of Ti in the TiaA1 compound was substituted by Nb. Note that the alloy composition of Ti-24 at.%Al-11 at.%Nb can still be maintained with existence of vacancies in the Ti 5 A12 Nb compound. In the fl lattice, the Ti, A1 and Nb atoms were uniformly and ran- domly distributed at both (0, 0, 0) and t! ! !~ lattice '~2' 2~ 2J
sites. The site occupancy is 62.5% for Ti, 25% for A1 and 12.5% for Nb. The fl ~ B2 ordering leaves the (0, 0, 0) site of the B2 lattice Al-rich and the (1, ~,i)1 1 site Ti-rich. The probability of finding each atom type at the (0, 0, 0) site is 43.75% for Ti, 6.25% for Nb and 50% for Al; at the t! ! !~ site is 87.5% for Ti ~-2' 2 , 2, '
3046 HSIUNG et al.: RAPIDLY SOLIDFIED Ti-24AI-11Nb
Fig. 15. Dark-field TEM image showing an observation of the retained O phase within an ~t 2 matrix (after aging for 72 h at 800°C), Z ~ [I2T6]=2.
and 12.5% for Nb. The B2---~ T ordering leaves the 1_ _1 1" I [ 3 ! 13 i-I 3 1~ t (_3 3 1"~ (1 1 33 [3 1 3" I 4 , 4 , 4 . s ' , ~ . 4 , 4 , 4 / , ' . . 4 , 4 , 4 / , ' . 4 , 4 , 4 " , k 4 , 4 , 4 / , " . ] , 4 , . 4 J , 1 3 3, I 3 3 3 l ( 1 _1 1~ 4, 4, 4,, (~, i , ~), (0, 0, 5) and ~2,2, 2, sites of the T
lattice occupied by Ti; the (½, 0, 0) and (0, ½, 0) sites occupied by Nb; and the (0, 0, 0), 1 1 1 (~, ~, 0), (½,0,9 and (0,½,½) sites occupied by Al. Notice that the dimensions of the T lattice are doubled by the chemical ordering. In addition, the atomic arrange- ment in the T lattice lead to a tetragonal distortion
( + 2 % ) along the [001 ]r direction as a consequence of the atomic size difference effect (the atomic radii (nm) ofTi , AI and Nb are 0.147, 0.143 and 0.143 respect- ively [16], i.e. the atomic radius of Ti is 2% greater than that of AI or Nb).
4.2. The T ~ 0 transit ion
The lattice correspondence between the T and O phases is shown in Fig. 17(a): [001]X---~[100]O,
' > B 2 T
[ ~ i t ,,-,,~J
"1i 67.5% Nb 12.5% AI 25.0%
[*" a ' - * I l - a
@ Xi 87.5% @ Ti Nb 12.5%
• AI "11 43.75%
• Nb 6.25% • Nb AI 50.00%
Fig. 16. Schematic illustration of the 1 /~ r2---* T ordering transitions.
LI
c/a = 1.02
HSIUNG et al.: RAPIDLY SOLIDFIED Ti-24AI-I 1Nb 3047
(a)
C T
/ tlOOl T
[oo.q. r [100l o
(b )
°
1110] T [o1o1o
L~loO{]o p 10IT
@o
(001) T I (100) 0
[ilOl,r [ololo
(OOi) o I (110) x
['i'iol.r 1oo11 o
(c) 1 1
I l lO-lz 0 ~
--- c° B [00110 a'r I1
[1lilt O = 63.4, ° [ ] { q o ~
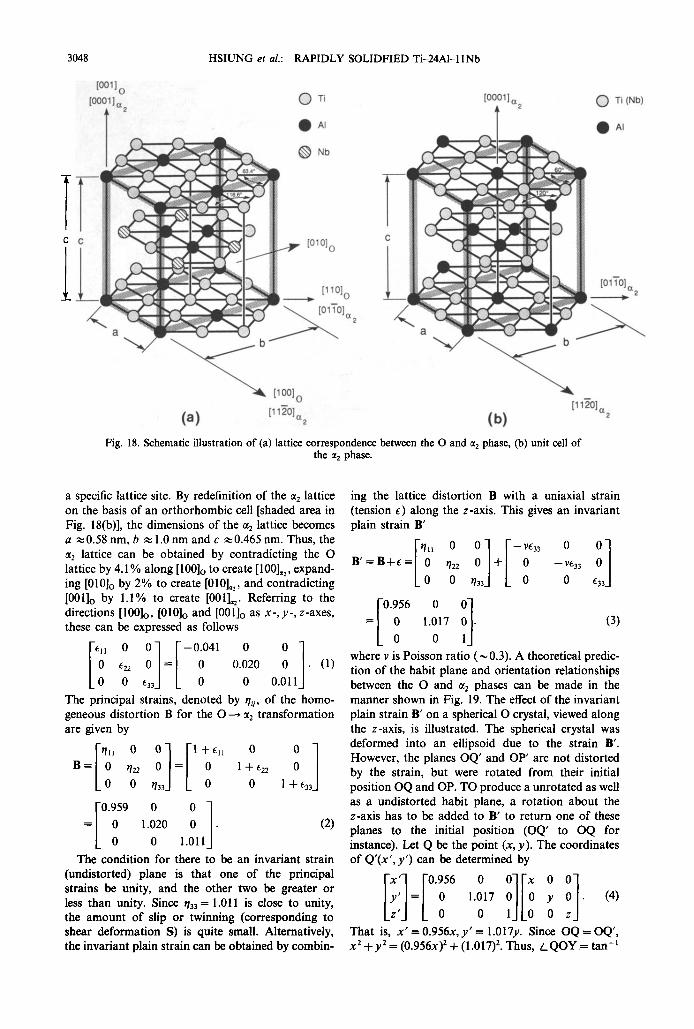
Fig. 17. (a) Schematic illustration of (a) lattice correspondence between the T and O phases, (b) lattice deformation and (c) atomic shuffling during the T ---* O transition. Only one eighth of the T and O lattice
was drawn in (c).
[I 10]T "--* [010]o and [I i0]T---' [001]o. The structural relationships between the T and O phases can be de- rived by assuming a shuffling of atoms on alternating (I I0)T planes along [I 10]T accompanied by homogen- eous lattice deformations along the [ 0 0 l I T , [I10]x and [I I0]T directions. These are illustrated in Fig. 17(b,c). The dimensions of the O lattice can be obtained by contracting the T lattice by 8.8% along [001]T to create [I00]o, expanding [I10] by 6.6% to create [010]o, and expanding tli0IT by 2% to create [001]o. The atomic shuffling makes the stacking sequence of the O phase of 2H-type (ABAB stacking sequence).
The structural relationships between the T and O phases including the T/O interface (habit) plane and the orientation relationships between the T and O phases can be successfully predicted on the basis of a shape deformation mechanism [17]. An important aspect of the T- - , O transition is the shape deform- ation (P) required to convert a T to an O lattice. P is composed of a homogeneous lattice distortion B, a lattice-invariant inhomogeneous shear S (corre- sponding to slip and twinning), and a rigid-body rotation Q, i.e. P = iaSB [18]. The resultant shape deformation must be consistent with the experimental observation that the habit (invariant strain) plane is essentially undistorted and unrotated. By measuring the invariant plane strain (SB), the structural relation- ships between the T and O phases can be predicted. From [17], the predicted T/O interface (habit) plane is near to the {~23}T plane, and the predicted orientation relationships are (I I0)T II (001)O and [II0]T ̂ [010]o =
[001IT ̂ [100]O = 4.3 °. These are in agreement with the experimental results shown earlier.
4.3. The 0 --~ :t: transit ion
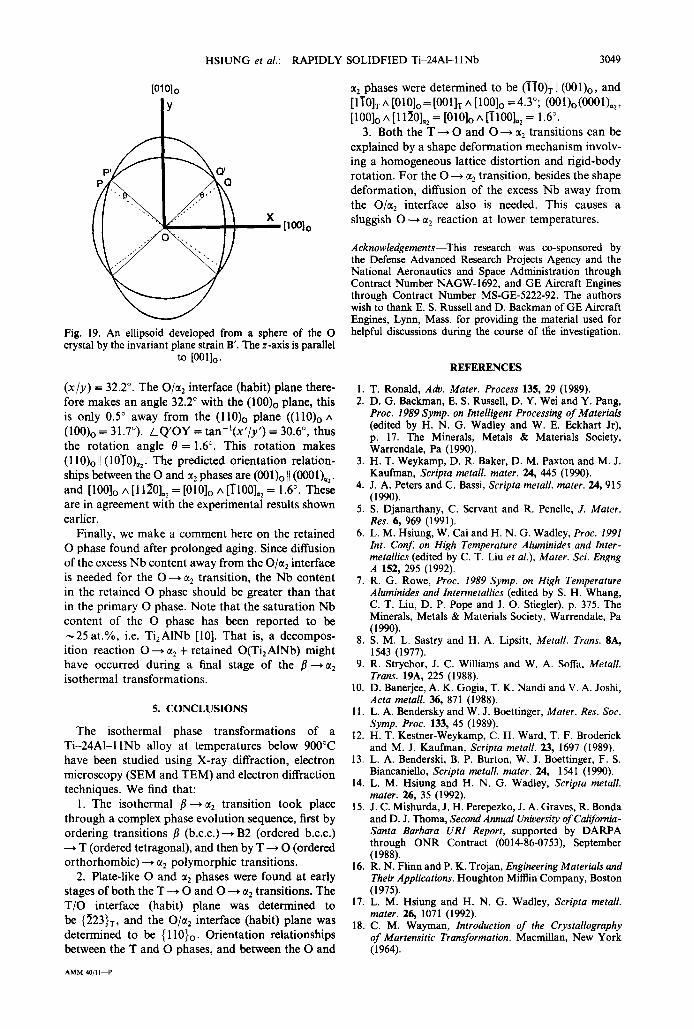
The O phase may be considered as a pseudo- hexagonal phase with a lattice distortion resulting from a supersaturation of the Nb in the ~t 2 lattice. Note that the Nb saturation concentration in ct 2 below 900°C is 9-10 at.% according to [7, 12], i.e. ~ 1.5 Nb atoms per ct 2 unit cell (16 atoms/unit cell). To accom- modate the excess Nb content, the supersaturated ~t 2 lattice is no longer able to maintain its hexagonal symmetry and becomes an O lattice. We illustrate this in Fig. 18(a). Notice that the Nb atoms occupy the (0 ,11 31 (0, ~, ~) ~, ~) and sites of the O lattice. The dimen- sions of the O lattice are a ~ 0.605 nm, b ~ 0.98 nm and c ~ 0.47 nm. The ~2 lattice can be restored by diffusion of the excess Nb away from the O lattice accompanied by a homogeneous lattice distortion and an atomic shuffling on every third (100)o. Since long range diffusion of the excess Nb away from the O/0~ 2 interface is required for the O ~ a2 transition to progress, this results in a sluggish O---, a 2 reaction at lower temperatures (for instance at 450°C or below).
In a similar way to the T --~ O transition, the shape deformation mechanism can also be applied to pre- dict the structural relationships between the O and =2 phases. The lattice correspondence between the O and a 2 phases is shown in Fig. 18(b): [l-f0]o--* [10T0]= 2, [110]o---* [01-1-0]=: and [001]o--~ [0001]=:. The a 2 lattice was drawn here by assuming that Nb does not occupy
3048
Wlo
lccc11,2 4
HSIUNG ef al.: RAPIDLY SOLIDFIED Ti-24Al-11Nb
0 Ti l00011 a
4 * 0 Ti (Nb)
I l A’ I . A’
Fig. 18. Schematic illustration of (a) lattice correspondence between the 0 and a2 phase, (b) unit cell of the t12 phase.
a specific lattice site. By redefinition of the tlz lattice on the basis of an orthorhombic cell [shaded area in Fig. 18(b)], the dimensions of the t~z lattice becomes a ~0.58 nm, b z 1 .O nm and c x0.465 nm. Thus, the tiz lattice can be obtained by contradicting the 0 lattice by 4.1% along [1OO]o to create [loo],, , expand- ing [OlO], by 2% to create [OlO],, , and contradicting [OOl], by 1.1% to create [OOl],, . Referring to the directions [lOO],, [OlO], and [OO1]o as X-,y-, z-axes, these can be expressed as follows
-0.041 0 0
0.020 0 1 ’ (1) 0 0.011
The principal strains, denoted by vii, of the homo- geneous distortion B for the O+ tlz transformation are given by VII 0 0
[ I[ 1+t,i 0 0
B=o qz2 O= 0 1 + $2 0
o 133 0
0 0
=I,59 ]
0 1 + 633
0 1.020 0 . (2) 0 0 1.011
The condition for there to be an invariant strain (undistorted) plane is that one of the principal strains be unity, and the other two be greater or less than unity. Since qJ3 = 1.011 is close to unity, the amount of slip or twinning (corresponding to shear deformation S) is quite small. Alternatively, the invariant plain strain can be obtained by combin-
ing the lattice distortion B with a uniaxial strain (tension 6) along the z-axis. This gives an invariant plain strain B
0.956 0 0
= 0
[ I
1.017 0 . (3) 0 01
where v is Poisson ratio (N 0.3). A theoretical predic- tion of the habit plane and orientation relationships between the 0 and CI~ phases can be made in the manner shown in Fig. 19. The effect of the invariant plain strain B’ on a spherical 0 crystal, viewed along the z-axis, is illustrated. The spherical crystal was deformed into an ellipsoid due to the strain B’. However, the planes OQ’ and OP’ are not distorted by the strain, but were rotated from their initial position OQ and OP. TO produce a unrotated as well as a undistorted habit plane, a rotation about the z-axis has to be added to B’ to return one of these planes to the initial position (OQ’ to OQ for instance). Let Q be the point (x, y). The coordinates of Q’(x’, y’) can be determined by
[;r]=[“%” 1.;17 ;I[! p ;I. (4)
That is, x’ = 0.956x,y’ = 1.017~. Since OQ = OQ’, x2 +y2 = (0.956~)’ + (1.017)‘. Thus, LQOY = tan-’
HSIUNG et al.: RAPIDLY SOLIDFIED Ti-24Al-11Nb 3049
[01010 Y
[mO]o
Fig. 19. An ellipsoid developed from a sphere of the O crystal by the invariant plane strain B'. The z-axis is parallel
to [001]o.
(x /y ) = 32.2 °. The Ot~t 2 interface (habit) plane there- fore makes an angle 32.2 ° with the (100)o plane, this is only 0.5 ° away from the ( l l0 )o plane ((110)o ^ (100)o = 31.7°). / Q ' O Y = tan - l ( x ' / y ') = 30.6 °, thus the rotat ion angle 0 = 1.6 °. This rotation makes (110)o N (10-i'0)~:. The predicted orientation relation- ships between the O and ~t 2 phases are (001)o II (0001)=2. and [100]o ^ [11~0]=2 = [010]o A []'100]= 2 = 1.6 °. These are in agreement with the experimental results shown earlier.
Finally, we make a comment here on the retained O phase found after prolonged aging. Since diffusion of the excess Nb content away from the O/ct 2 interface is needed for the O ~ ct 2 transition, the N b content in the retained O phase should be greater than that in the primary O phase. Note that the saturation Nb content of the O phase has been reported to be ~25 at .%, i.e. Ti2A1Nb [10]. That is, a decompos- ition reaction O---~ ct2 + retained O(Ti2AINb) might have occurred during a final stage of the fl ~ ~2 isothermal transformations.
5. CONCLUSIONS
The isothermal phase transformations of a T i - 2 4 A l - l l N b alloy at temperatures below 900°C have been studied using X-ray diffraction, electron microscopy (SEM and TEM) and electron diffraction techniques. We find that:
1. The isothermal fl ~ ~t 2 transition took place through a complex phase evolution sequence, first by ordering transitions fl ( b . c . c . ) ~ B2 (ordered b.c.c.) --~ T (ordered tetragonal), and then by T ~ O (ordered orthorhombic)---, ct 2 polymorphic transitions.
2. Plate-like O and ~t 2 phases were found at early stages of both the T ~ O and O ~ g2 transitions. The T /O interface (habit) plane was determined to be {~23}T, and the O/~t 2 interface (habit) plane was determined to be {110}o. Orientat ion relationships between the T and O phases, and between the O and
~t 2 phases were determined to be (IT0)T II (001)o, and [II0]T A [010]o=[001]r A [100]o =4.3°; (001)o(0001), 2, [100]o A [11~0]= 2 = [010]o ^ [II00]= 2 = 1.6 °.
3. Both the T--~ O and O ~ ~t2 transitions can be explained by a shape deformation mechanism involv- ing a homogeneous lattice distortion and rigid-body rotation. For the O ~ ct 2 transition, besides the shape deformation, diffusion of the excess Nb away from the O/ct 2 interface also is needed. This causes a sluggish O ~ ct 2 reaction at lower temperatures.
Acknowledgements--This research was co-sponsored by the Defense Advanced Research Projects Agency and the National Aeronautics and Space Administration through Contract Number NAGW-1692, and GE Aircraft Engines through Contract Number MS-GE-5222-92. The authors wish to thank E. S. Russell and D. Backman of GE Aircraft Engines, Lynn, Mass. for providing the material used for helpful discussions during the course of tile investigation.
REFERENCES
1. T. Ronald, Adv. Mater. Process 135, 29 (1989). 2. D. G. Backman, E. S. Russell, D. Y. Wei and Y. Pang,
Proc. 1989 Syrup. on Intelligent Processing of Materials (edited by H. N. G. Wadley and W. E. Eckhart Jr), p. 17. The Minerals, Metals & Materials Society, Warrendale, Pa (1990).
3. H. T. Weykamp, D. R. Baker, D. M. Paxton and M. J. Kaufman, Scripta metall, mater. 24, 445 (1990).
4. J. A. Peters and C. Bassi, Scripta metall, mater. 24, 915 (1990).
5. S. Djanarthany, C. Servant and R. Penelle, J. Mater. Res. 6, 969 (1991).
6. L. M. Hsiung, W, Cai and H. N. G. Wadley, Proc. 1991 Int. Conf. on High Temperature Aluminides and Inter- metallics (edited by C. T. Liu et al.), Mater. Sci. Engng A 152, 295 (1992).
7. R. G. Rowe, Proc. 1989 Syrup. on High Temperature Aluminides and Intermetallics (edited by S. H. Whang, C. T. Liu, D. P. Pope and J. O. Stiegler), p. 375. The Minerals, Metals & Materials Society, Warrendale, Pa (1990).
8. S. M. L. Sastry and H. A. Lipsitt, Metall. Trans. 8A, 1543 (1977).
9. R. Strychor, J. C. Williams and W. A. Sofia, Metall. Trans. 19A, 225 (1988).
10. D. Banerjee, A. K. Gogia, T. K. Nandi and V. A. Joshi, Acta metall. 36, 871 (1988).
11. L. A. Bendersky and W. J. Boettinger, Mater. Res. Soc. Symp. Proc. 133, 45 (1989).
12. H. T. Kestner-Weykamp, C. H. Ward, T. F. Broderick and M. J. Kaufman, Scripta metall. 23, 1697 (1989).
13. L. A. Benderski, B. P. Burton, W. J. Boettinger, F. S. Biancaniello, Scripta metall, mater. 24, 1541 (1990).
14. L. M. Hsiung and H. N. G. Wadley, Scripta metall. mater. 26, 35 (1992).
15. J. C. Mishurda, J. H. Perepezko, J. A. Graves, R. Bonda and D. J. Thoma, Second Annual University of California- Santa Barbara UR1 Report, supported by DARPA through ONR Contract (0014-86-0753), September (1988).
16. R.N. Flinn and P. K. Trojan, Engineering Materials and Their Applications. Houghton Mifflin Company, Boston (1975).
17. L. M. Hsiung and H. N. G. Wadley, Scripta metall. mater. 26, 1071 (1992).
18. C. M. Wayman, Introduction of the Crystallography of Martensitic Transformation. Macmillan, New York (1964).
AMM 40/I I - - P
Top Related