


Languages
Pages
Legal

1971 2014
MEASURING PERSONAL INCOME TAX COMPLEXITY IN CANADA François Vaillancourt, Charles Lammam, Feixue Ren, and Marylène Roy
APRIL 2016

fraserinstitute.org
fraserinstitute.org
Contents
Executive summary / i
Introduction / 1
Background on Measuring Tax Complexity / 4
Personal Income Tax Complexity: Measurement for Canada / 6
Conclusion / 20
Appendix A: Income Floor of Lowest and Highest Personal Income Tax Brackets / 22
Appendix B: Calculating indicators Based on Provincial Tax Forms / 25
References / 27
About the authors / 32
Acknowledgments / 33
Publishing information / 34
Supporting the Fraser Institute / 35
Purpose, funding, and independence / 35
About the Fraser Institute / 36
Editorial Advisory Board / 37

fraserinstitute.org

fraserinstitute.org
Executive summary
Canadian families and businesses incur significant costs com plying with the tax system. Those costs include direct spending on items such as accountants, lawyers, and computer software, as well as the financial cost of the time it takes to compile the materials and complete the forms. Governments also incur costs to administer and collect taxes. These costs are driven in part by the complexity of the tax system.
This study measures the evolution of tax complexity in Canada’s personal income tax system. It uses three broad categories of empirical measurements: tax expenditures, tax legislation, and administrative tax documents. According to various specific indicators, the system has become more complex over time.
For instance, from 1981 to 2014, the number of federal personal income tax expenditures (which are credits, deductions, exemp tions, exclusions, and other preferences) increased from 101 to 128—an increase of 27 percent. The number of tax expenditures was essentially flat up to 2001, after which there was a marked increase. In fact, since 2006, every fed eral budget has included a new tax credit for specific activities or eligible groups.
For perspective, in 2014, the value of these tax expenditures ($165.0 billion) exceeded total federal personal income tax revenue ($135.7 billion). Indeed, tax ex penditures cost the federal government more than it collects in personal income tax revenue.
The study also measures the text area occupied by the Income Tax Act and regulations from 1971 to 2014. The text area is the number of pages multiplied by page size, which measures the area that the legislation would take up were we to lay out all the pages side by side. Over this period, the area of the tax legislation increased 355 percent, from 345,948 cm² to 1,575,537 cm². It is important to meas ure text area because not only did the number of pages in the Income Tax Act increase, but so did page size. Together, both chan ges have the effect of magnifying the growth in text area. In standard letter paper format (8.5x11 inches), the space occupied by the tax code represents an increase from 573 to 2,612 pages over the period.
Finally, an analysis of provincial administrative documents (examining the number of documents, pages, and total lines in the tax forms) also
fraserinstitute.org
ii / Measuring Personal Income Tax Complexity in Canada
points to growing tax complexity. Consider the results for the total number of lines, arguably the most ap propriate indicator of complexity since governments can reduce the number of documents simply by combining them, and cut the number of pages by reorganizing blank spaces, and so on—without reducing the complexity of calculations linked to the personal income tax system. From 2000 to 2015, the average number of total lines in tax forms for the provinces (excluding Quebec) increased from 52 to 172.
While Canada’s personal tax system would benefit from simplification, the country does not have the equivalent of the United Kingdom’s Office of Tax Simplification (either federally or provincially). That means there is no systematic work being done to meas ure, let alone reduce, tax complexity in Canada. This study is part of an ongoing research pro gram at the Fraser Institute that attempts to help fill that void.

fraserinstitute.org
Introduction
The Canadian tax system is often described as complex. For example, the Canadian Council of Chief Executives states that: “The Canadian tax system is complex and costly for business to comply with, mainly due to the complexity of Canadian tax legislation, the number of taxes companies are subject to, and the multijurisdictional tax system” (PwC, 2014: 16). And the Canadian Chamber of Commerce argues that “Canada’s tax system is in urgent need of reform. It has become increasingly complex, multilayered, and a costly challenge for Canadian businesses of all sizes” (CCC, 2015: 1). Even the Certified General Accountants Association of Canada notes “Canada’s income tax system has become increasingly complex and compliance costs have continued to grow at an unsustainable rate” (Clark and Farber, 2011: 4).
Why does tax complexity exist? Vaillancourt and Bird (2016: 74) offer four explanations (see box 1). And why does tax complexity persist? Clark and Farber explain that in Canada, “There have been very few attempts to simplify the tax system…. The reason is very clear. Tax simplification comes at a very high political cost, since any reform will involve choices and tradeoffs, and have both winners and losers” (2011: 5). Whatever the reason, to date neither the federal nor provincial governments have recently reacted to the various pleas for simplicity (or complaints about complexity) in a meaningful way, although many official government reports and documents have paid lip service to the need for more simplicity.1 That said, a recent major reform proposal put forth by the Quebec Taxation Review Committee (2015) did not even mention the issue and in fact recommended making the provincial tax system more complex by increasing the number of income tax brackets.
1 For example, in the 2015 federal Liberal election platform, a noted priority is to conduct “an overdue and wideranging review of the over $100 billion in increasingly complex tax expenditures that now exist” (Liberal Party of Canada, 2015). After tabling the 2016 federal budget, Finance Minister Bill Morneau noted that a review of tax expenditures is likely coming (see Cheadle, 2016, March 25).

fraserinstitute.org
2 / Measuring Personal Income Tax Complexity in Canada
Canada’s tax system would benefit from simplification. The complexity of the tax system (broadly defined) imposes significant costs on Canadian families and businesses as they expend considerable resources and time on compliance. These costs include direct spending on accountants, lawyers, computer software, and the like, as well as the financial cost of the time it takes to compile the materials and complete the forms. The total annual cost to Canadians of complying with income taxes is estimated to be up to $7.0 billion or $501 per household (Speer et al., 2014). Notably, tax compliance costs are borne disproportionately by lowerincome Canadians who pay the highest share of their income to comply with the tax system.
What drives these costs? While the Fraser Institute has published studies on measuring the compliance and administrative costs of taxation in Canada over the years (Speer et al., 2014; Vaillancourt et al., 2013), this study examines the distinct but related issue of tax complexity using empirical indicators identified through a review of the relevant literature. It is the second in a series published by the Fraser Institute. The first study on tax complexity (Vaillancourt et al., 2015) examined tax complexity for
Box 1: Four possible reasons why tax complexity exists
1. Governments need revenue. They not only need to impose taxes—and sometimes to increase them—but also to protect existing revenue by making and enforcing rules to curb tax avoidance and evasion.
2. People want taxes to be fair. In a complex world in which the tax system must accommodate many different situations, the desire for fairness breeds complexity and tends to override the desire for simplicity.
3. People also want certainty. While few people seem to be very certain about their tax position, everyone seems to want more certainty in this area. In a rapidly changing world, however, the search for certainty often leads to frequent changes in tax rules and language, thus giving rise to more uncertainty.
4. Governments want to be elected. To do so they are constantly driven or tempted to use the tax system to achieve a variety of specific objectives, with each new objective requiring new rules to distinguish the activity or entity that benefits from those less favoured—and each such distinction creates a new group of supporters for a particular complexity now entrenched more or less deeply in the tax system.
Vaillancourt and Bird (2016: 74).

fraserinstitute.org
Measuring Personal Income Tax Complexity in Canada / 3
three types of taxes: the personal income tax (PIT), corporate income tax (CIT), and the goods and services tax (GST). This second study focuses exclusively on the PIT system’s complexity.
The study first briefly reviews the literature on measuring tax complexity. It then examines different empirical measurements of tax complexity for Canada to see how those measurements have evolved. It focuses on the personal income tax, the most important source of revenue for both the federal and provincial governments in Canada. The study finds that, according to various empirical measurements, Canada’s federal and provincial personal income tax system has generally become more complex over time.

fraserinstitute.org
Background on Measuring Tax Complexity
The literature on measuring tax complexity was recently summarized by Lugo and Vaillancourt (2015) and Vaillancourt et al. (2015). This section draws upon that work to focus on a review of empirical measurements. The Tax Foundation (see Moody et al., 2005), Slemrod (2005), and the Progressive Policy Institute (see Weinstein, 2014) each use a different measure of tax complexity in the United States. The Tax Foundation measures complexity by the number of words in the US federal tax code and the volume of income tax regulations. The foundation found that, over a 45year period, “the number of words detailing income tax law has grown from 172,000 in 1955 to 1,286,000 in 2005, a staggering 648% increase. Income tax regulations, which provide taxpayers with guidance in calculating taxable income, have grown at an even faster pace. Federal income tax regulations have grown from 547,000 words in 1955 to 5,778,000 words by 2005, an increase of 956%” (Moody et al., 2005: 5). Slemrod (2005) measures tax complexity by the number of lines on the income tax form and the number of pages in the instruction booklet (in both cases, the measures are modified slightly to ensure comparability between states). Meanwhile, the Progressive Policy Institute uses the number of tax expenditures (which includes credits, deductions, exemptions, exclusions, and other tax preferences) by state as an indicator of tax complexity (Weinstein, 2014). For the 43 states for which information is available, this number ranges from 550600 for Washington State to 050 for Alaska, with the most common range being 100150 (11 states).
Results in Vaillancourt et al. (2015) show a strong correlation between three measures for Canada: tax expenditures, tax legislation, and administrative documents. All three point to an increase in federal tax complexity over a 20year period. Further, there is a similar increase in all the indicators in recent years. From 2000 (or 2001 depending on the specific indicator) to 2011 (or 2014), the number of tax expenditures increased 22 percent, the text area of tax legislation (measured in cm²) increased 19 percent, and the size of the federal personal income tax guide increased 25 percent.

fraserinstitute.org
Measuring Personal Income Tax Complexity in Canada / 5
Are these good indicators of tax complexity? Both Slemrod (2005) and TurnbullHall and Thomas (2012) note that longer legislation or text in an information booklet may reduce complexity if, for example, it allows the use of plain English (i.e., simpler language) or covers various possible types of taxpayers. In addition, it is important, where feasible, to carefully distinguish and separate out nontax related aspects from the documents (such as income support delivered through the tax system) to truly gauge tax complexity.
Figure 1 presents the three measures of tax complexity along a continuum from government policy to tax filer. Governments choose to favour a specific behaviour by introducing (or removing) a tax preference in a policy declaration such as a budget speech, which in turn will result in an expected tax expenditure. That tax preference must then be transformed into a law or regulation in order for it to be implemented. Tax filers interact with the law and legal framework through lines in the tax form and instructions in the tax booklet (administrative documents). Their efforts ultimately lead to tax compliance activities which then manifest in the form of tax compliance costs.2 The relationship between these various indicators can be influenced by government decisions that can shift costs between administrative costs and compliance costs.
2 Readers interested in the measurement of tax compliance costs are encouraged to see Speer et al. (2014) and Vaillancourt et al. (2013).
Figure 1: Tax Activity-Complexity Measurement Continuum
Tax Tax Length of Length of Compliance measure: preferences legal texts documents costs
Tax Policy Legal Administrative Compliance activity: Framework document activity
Tax �lerGovernment

fraserinstitute.org
Personal Income Tax Complexity: Measurement for Canada
This section moves away from theory and the conceptual framework to present data for Canada on three broad measures of personal income tax complexity discussed above: tax expenditures, tax legislation, and administrative documents. The first two measures examine indicators at the federal level while the third examines indicators at the provincial level. The section also includes an analysis of the number of tax brackets in provincial personal income tax systems over time.
Federal tax complexity
Tax expenditures
Figures 2, 3, and 4 present a series of data for Canada on federal personal income tax expenditures (which are credits, deductions, exemptions, exclusions, and other preferences) for select years from 1981 to 2014.3
The starting year is dictated by the availability of comparable data on tax expenditures and the number of personal income tax filers.4
Figure 2 shows that, from 1981 to 2014, the number of federal personal income tax expenditures increased from 101 to 128. From 1981 to 2001, the number of tax expenditures was essentially flat but there was a marked increase between 2001 and 2011. In fact, since 2006, every federal budget has included a new tax credit for specific activities or eligible
3 This analysis goes further back into time than the analysis in Vaillancourt et al (2015), the original study upon which this report is based.4 In the 1970s, the number of federal personal income tax filers usually increased by 200,000 to 300,000 each year. The number jumps by 1.7 million from 1977 to 1978. This is the result of replacing family allowances by the refundable child tax credit; this credit is computed using family income and thus requires both adults in twoparent families to file an income tax return even if one of them, usually the mother in 1978, has no taxable income.

fraserinstitute.org
Measuring Personal Income Tax Complexity in Canada / 7
Sources: Department of Finance (various years); calculations by authors. Notes: a) The number of personal income tax expenditures includes every tax expenditures included in the Department of Finance’s annual Tax Expenditures and Evaluations report. It excludes the subexpenditures and the “Supplementary information: presentvalue of taxassisted retirement savings plans.” b) The “Reclassification of flowthrough shares” is considered to be one tax expenditure, even though this tax expenditure is listed as a subcategory of “Deduction of resourcerelated expenditure.” c) Data are based on the latest information available for the estimates of the number and cost of tax expenditures. For data prior to 1990, the Department of Finance’s 1985 report is the source. Data may vary by report.
Figure 2: Number of Federal Personal Income Tax Expenditures in Canada, selected years, 1981-2014
groups (Speer et al., 2014).5 All told, the number of tax expenditures has grown by 27 percent over the 33year period from 1981 to 2014.
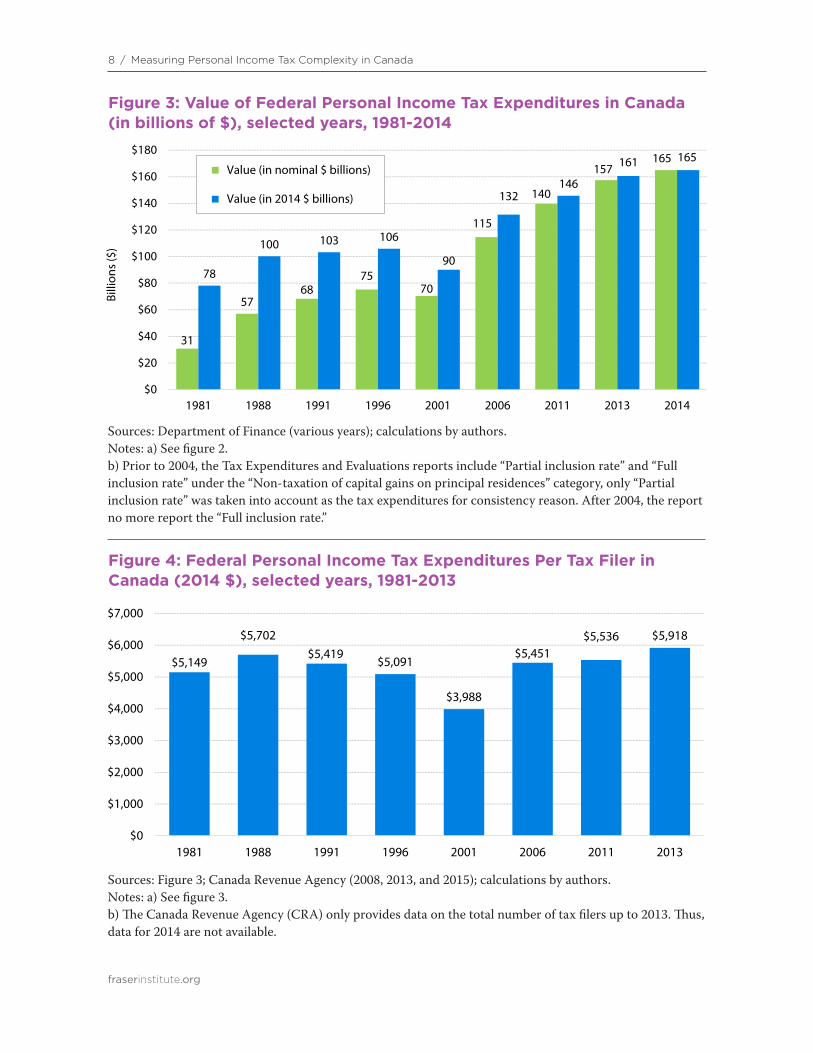
Figure 3 examines the value of federal personal income tax expenditures over the same period, both in nominal terms and after adjusting for inflation. In 33 years, the value of these tax expenditures grew by 434 percent in nominal terms and 111 percent after adjusting for inflation.
Since the value of personal income tax expenditures could increase simply by virtue of a growing number of tax filers, and thus potential tax expenditure users, in figure 4 we present the inflationadjusted value of
5 For example, from 2006 to 2014, the federal government introduced the Canada Employment Credit, FirstTime Home Buyers’ Tax Credit, Children’s Arts Tax Credit, Volunteer Firefighters Tax Credit, and Family Caregiver Tax Credit. In its 2015 budget, the former Conservative government introduced the Home Accessibility Tax Credit for seniors and residents with disabilities. This credit is not reflected in figure 2 which ends in the 2014 tax year.
101 103 104 101 103
113125 126 128
0
20
40
60
80
100
120
140
1981 1988 1991 1996 2001 2006 2011 2013 2014
fraserinstitute.org
8 / Measuring Personal Income Tax Complexity in Canada
Figure 3: Value of Federal Personal Income Tax Expenditures in Canada (in billions of $), selected years, 1981-2014
Sources: Department of Finance (various years); calculations by authors. Notes: a) See figure 2. b) Prior to 2004, the Tax Expenditures and Evaluations reports include “Partial inclusion rate” and “Full inclusion rate” under the “Nontaxation of capital gains on principal residences” category, only “Partial inclusion rate” was taken into account as the tax expenditures for consistency reason. After 2004, the report no more report the “Full inclusion rate.”
Figure 4: Federal Personal Income Tax Expenditures Per Tax Filer in Canada (2014 $), selected years, 1981-2013
Sources: Figure 3; Canada Revenue Agency (2008, 2013, and 2015); calculations by authors. Notes: a) See figure 3. b) The Canada Revenue Agency (CRA) only provides data on the total number of tax filers up to 2013. Thus, data for 2014 are not available.
31
5768
7570
115
140
157165
78
100 103 106
90
132146
161 165
$0
$20
$40
$60
$80
$100
$120
$140
$160
$180
1981 1988 1991 1996 2001 2006 2011 2013 2014
Billi
ons (
$)
Value (in nominal $ billions)
Value (in 2014 $ billions)
$5,149
$5,702$5,419
$5,091
$3,988
$5,451$5,536 $5,918
$0
$1,000
$2,000
$3,000
$4,000
$5,000
$6,000
$7,000
1981 1988 1991 1996 2001 2006 2011 2013
fraserinstitute.org
Measuring Personal Income Tax Complexity in Canada / 9
federal personal income tax expenditures per tax filer from 1981 to 2013 (The Canada Revenue Agency only provides data on the total number of tax filers up to 2013 so data for 2014 are not available.) Over the period, the number of tax filers increased from 15.2 million to 27.1 million. This, and the increase in the total value of tax expenditures, translates into an increase of 15 percent in the inflationadjusted value of personal income tax expenditures per tax filer. Based on basic tax expenditure indicators (their sheer number and two complementary measures), it seems reasonable to conclude that the complexity of the federal personal income tax system has increased from 1981 to 2014.
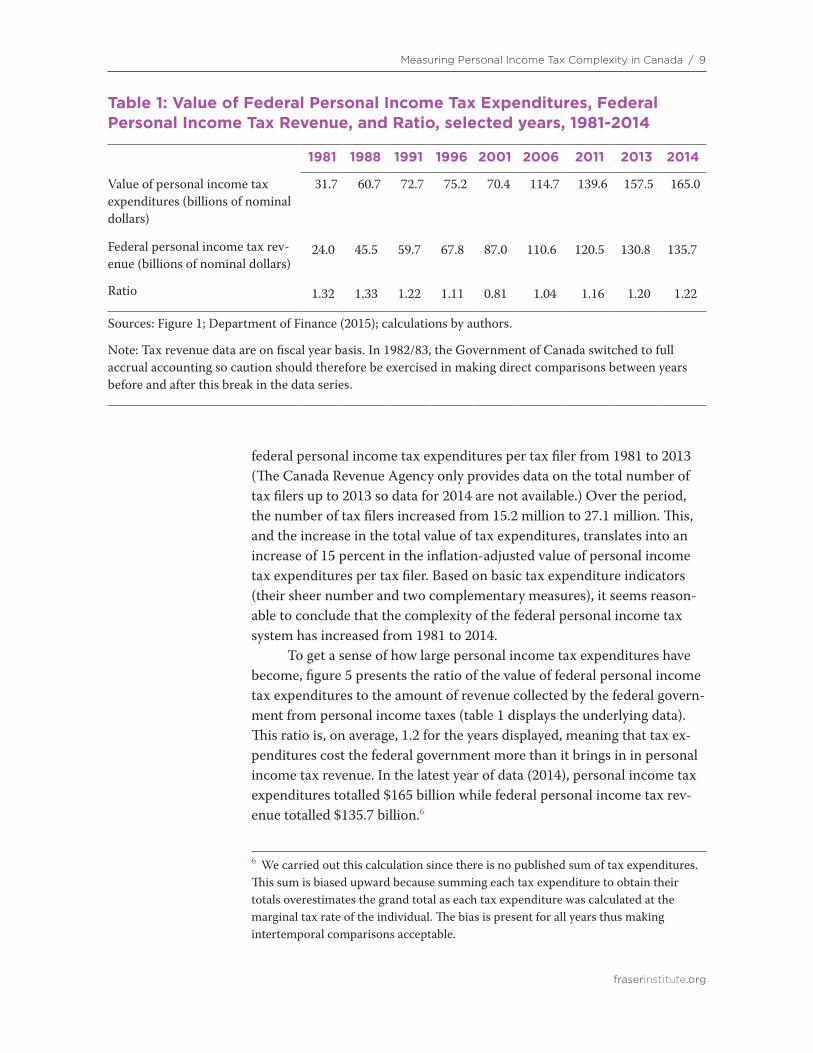
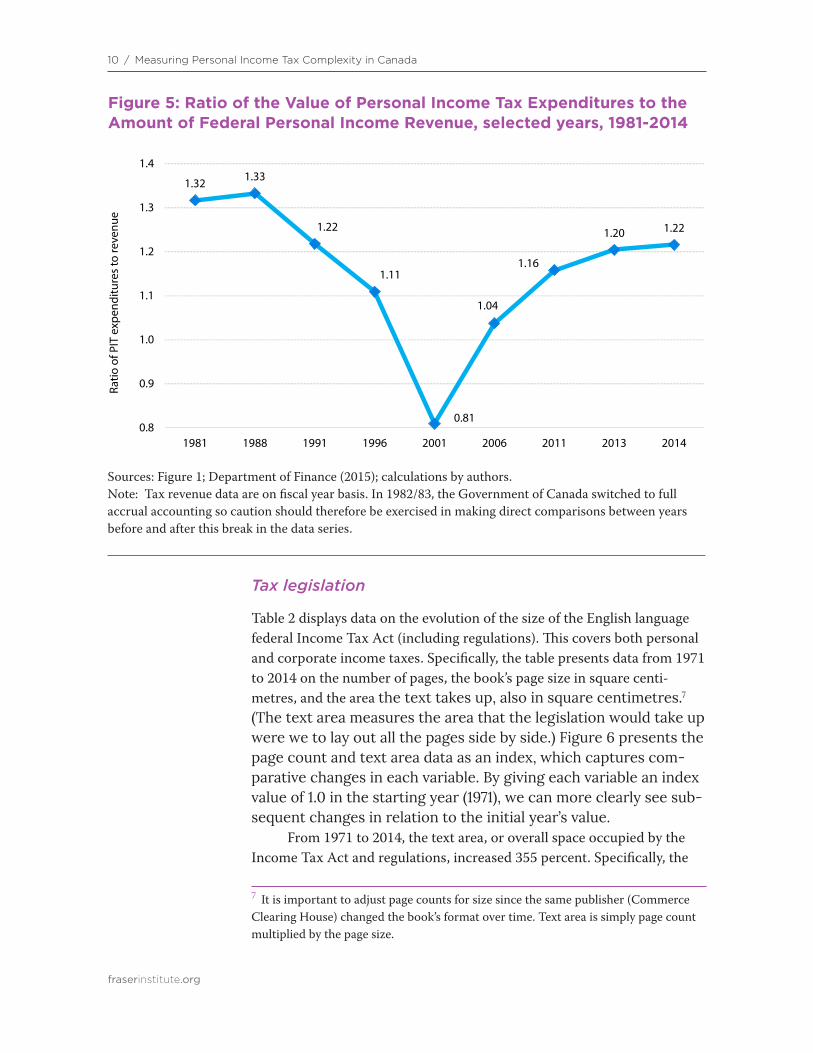
To get a sense of how large personal income tax expenditures have become, figure 5 presents the ratio of the value of federal personal income tax expenditures to the amount of revenue collected by the federal government from personal income taxes (table 1 displays the underlying data). This ratio is, on average, 1.2 for the years displayed, meaning that tax expenditures cost the federal government more than it brings in in personal income tax revenue. In the latest year of data (2014), personal income tax expenditures totalled $165 billion while federal personal income tax revenue totalled $135.7 billion.6
6 We carried out this calculation since there is no published sum of tax expenditures. This sum is biased upward because summing each tax expenditure to obtain their totals overestimates the grand total as each tax expenditure was calculated at the marginal tax rate of the individual. The bias is present for all years thus making intertemporal comparisons acceptable.
Table 1: Value of Federal Personal Income Tax Expenditures, Federal Personal Income Tax Revenue, and Ratio, selected years, 1981-2014
1981 1988 1991 1996 2001 2006 2011 2013 2014
Value of personal income tax expenditures (billions of nominal dollars)
31.7 60.7 72.7 75.2 70.4 114.7 139.6 157.5 165.0
Federal personal income tax revenue (billions of nominal dollars)
24.0 45.5 59.7 67.8 87.0 110.6 120.5 130.8 135.7
Ratio 1.32 1.33 1.22 1.11 0.81 1.04 1.16 1.20 1.22
Sources: Figure 1; Department of Finance (2015); calculations by authors.
Note: Tax revenue data are on fiscal year basis. In 1982/83, the Government of Canada switched to full accrual accounting so caution should therefore be exercised in making direct comparisons between years before and after this break in the data series.
fraserinstitute.org
10 / Measuring Personal Income Tax Complexity in Canada
Tax legislation
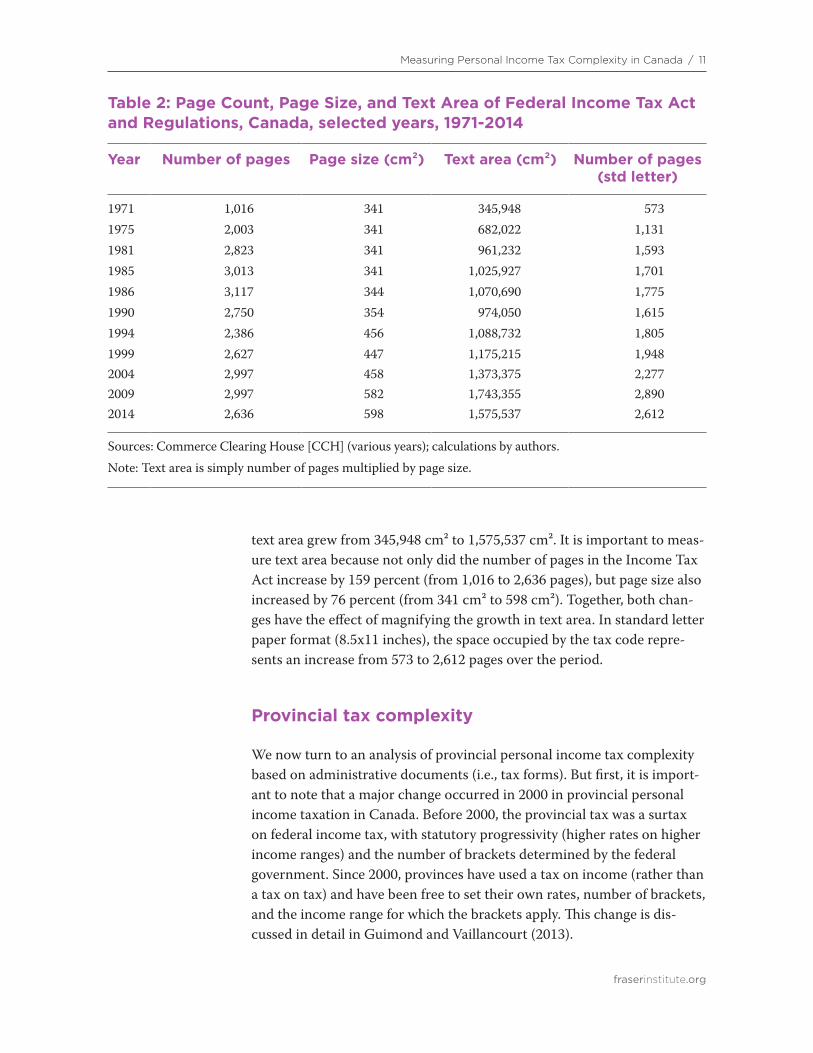
Table 2 displays data on the evolution of the size of the English language federal Income Tax Act (including regulations). This covers both personal and corporate income taxes. Specifi cally, the table presents data from 1971 to 2014 on the number of pages, the book’s page size in square centimetres, and the area the text takes up, also in square centimetres.7
(The text area measures the area that the legis lation would take up were we to lay out all the pages side by side.) Figure 6 presents the page count and text area data as an index, which captures com-parative changes in each variable. By giving each vari able an index value of 1.0 in the starting year (1971), we can more clearly see sub-sequent changes in relation to the initial year’s value.
From 1971 to 2014, the text area, or overall space occupied by the Income Tax Act and regulations, increased 355 percent. Specifically, the
7 It is important to adjust page counts for size since the same publisher (Commerce Clearing House) changed the book’s format over time. Text area is simply page count multiplied by the page size.
Figure 5: Ratio of the Value of Personal Income Tax Expenditures to the Amount of Federal Personal Income Revenue, selected years, 1981-2014
Sources: Figure 1; Department of Finance (2015); calculations by authors. Note: Tax revenue data are on fiscal year basis. In 1982/83, the Government of Canada switched to full accrual accounting so caution should therefore be exercised in making direct comparisons between years before and after this break in the data series.
1.32 1.33
1.22
1.11
0.81
1.04
1.16
1.20 1.22
0.8
0.9
1.0
1.1
1.2
1.3
1.4
1981 1988 1991 1996 2001 2006 2011 2013 2014
Ratio
of P
IT e
xpen
ditu
res
to re
venu
e
fraserinstitute.org
Measuring Personal Income Tax Complexity in Canada / 11
text area grew from 345,948 cm² to 1,575,537 cm². It is important to measure text area because not only did the number of pages in the Income Tax Act increase by 159 percent (from 1,016 to 2,636 pages), but page size also increased by 76 percent (from 341 cm² to 598 cm²). Together, both changes have the effect of magnifying the growth in text area. In standard letter paper format (8.5x11 inches), the space occupied by the tax code represents an increase from 573 to 2,612 pages over the period.
Provincial tax complexity
We now turn to an analysis of provincial personal income tax complexity based on administrative documents (i.e., tax forms). But first, it is important to note that a major change occurred in 2000 in provincial personal income taxation in Canada. Before 2000, the provincial tax was a surtax on federal income tax, with statutory progressivity (higher rates on higher income ranges) and the number of brackets determined by the federal government. Since 2000, provinces have used a tax on income (rather than a tax on tax) and have been free to set their own rates, number of brackets, and the income range for which the brackets apply. This change is discussed in detail in Guimond and Vaillancourt (2013).
Table 2: Page Count, Page Size, and Text Area of Federal Income Tax Act and Regulations, Canada, selected years, 1971-2014
Year Number of pages Page size (cm²) Text area (cm²) Number of pages (std letter)
1971 1,016 341 345,948 5731975 2,003 341 682,022 1,1311981 2,823 341 961,232 1,5931985 3,013 341 1,025,927 1,7011986 3,117 344 1,070,690 1,7751990 2,750 354 974,050 1,6151994 2,386 456 1,088,732 1,8051999 2,627 447 1,175,215 1,9482004 2,997 458 1,373,375 2,2772009 2,997 582 1,743,355 2,8902014 2,636 598 1,575,537 2,612
Sources: Commerce Clearing House [CCH] (various years); calculations by authors.Note: Text area is simply number of pages multiplied by page size.

fraserinstitute.org
12 / Measuring Personal Income Tax Complexity in Canada
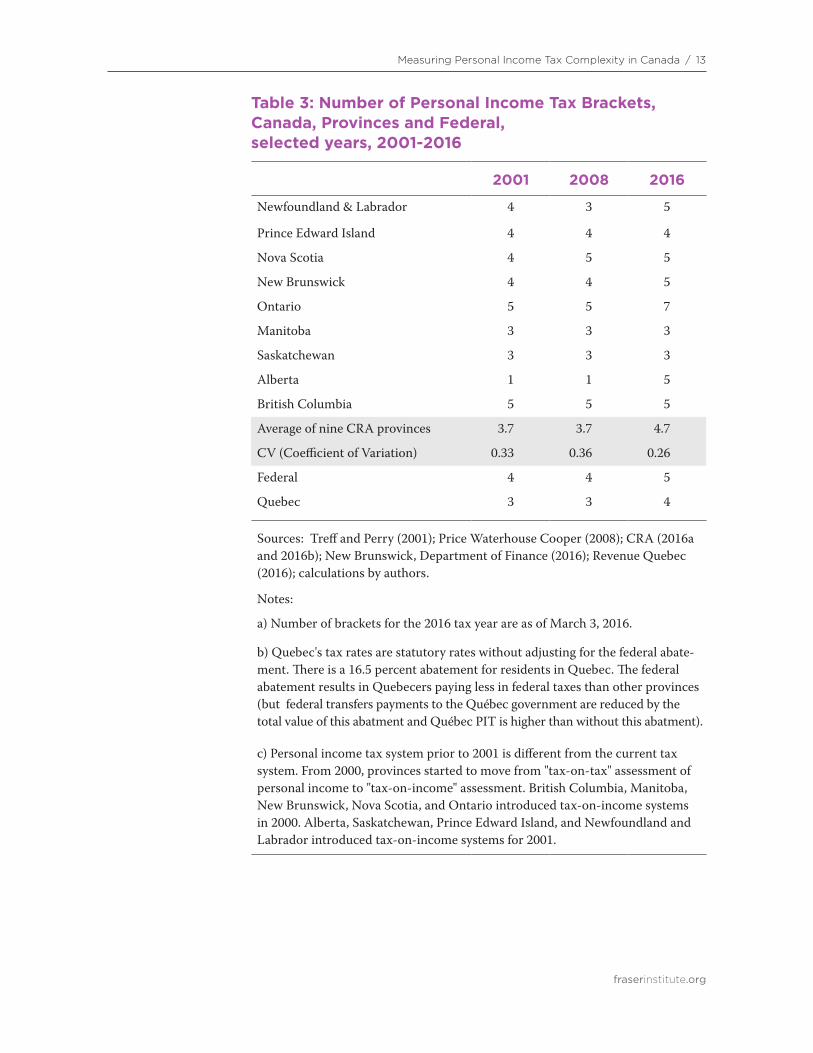
Table 3 presents information on the diversity and complexity of provincial personal income tax systems. The table includes data on the average (mean) and coefficient of variation (CV) for the nine Canadian Revenue Agency (CRA) provinces plus Quebec and the federal government. Quebec collects its own personal income tax and does not use the CRA definition of taxable income so it is not a CRA province. The coefficient of variation (CV) is the standard deviation divided by the mean (average). A larger CV means there is larger variation within the data set (in this case, provinces for a given year and indicator of complexity).
Specifically, table 3 examines the number of personal income tax brackets for the various jurisdictions in 2001, 2008, and 2016.8 A larger number of tax brackets (all things equal) signals a greater degree of tax complexity. The table shows that the average number of tax brackets remained stable from 2001 to 2008 but increased from 2008 to 2016 with notable increases in both Ontario and Alberta. In fact, from 2008 to 2016, five provinces and the federal government increased the number of
8 As noted above, there was a major change in 2000 in the taxation of personal income provincially. Thus comparisons with years before 2000 are less meaningful.
Figure 6: Index of Page Count and Text Area of Federal Income Tax Act and Regulations (where 1.0 = index value in 1971), Canada, selected years, 1971-2014
Sources: Commerce Clearing House [CCH] (various years); calculations by authors.
1.0
2.0
2.83.0 3.1
2.7
2.32.6
2.9 2.92.6
1.0
2.0
2.8 3.0 3.12.8
3.13.4
4.0
5.0
4.6
0.0
1.0
2.0
3.0
4.0
5.0
6.0
1971 1975 1981 1985 1986 1990 1994 1999 2004 2009 2014
Page count
Text area
fraserinstitute.org
Measuring Personal Income Tax Complexity in Canada / 13
Table 3: Number of Personal Income Tax Brackets, Canada, Provinces and Federal, selected years, 2001-2016
2001 2008 2016
Newfoundland & Labrador 4 3 5
Prince Edward Island 4 4 4
Nova Scotia 4 5 5
New Brunswick 4 4 5
Ontario 5 5 7
Manitoba 3 3 3
Saskatchewan 3 3 3
Alberta 1 1 5
British Columbia 5 5 5
Average of nine CRA provinces 3.7 3.7 4.7
CV (Coefficient of Variation) 0.33 0.36 0.26
Federal 4 4 5
Quebec 3 3 4
Sources: Treff and Perry (2001); Price Waterhouse Cooper (2008); CRA (2016a and 2016b); New Brunswick, Department of Finance (2016); Revenue Quebec (2016); calculations by authors.
Notes:
a) Number of brackets for the 2016 tax year are as of March 3, 2016.
b) Quebec's tax rates are statutory rates without adjusting for the federal abatement. There is a 16.5 percent abatement for residents in Quebec. The federal abatement results in Quebecers paying less in federal taxes than other provinces (but federal transfers payments to the Québec government are reduced by the total value of this abatment and Québec PIT is higher than without this abatment).
c) Personal income tax system prior to 2001 is different from the current tax system. From 2000, provinces started to move from "taxontax" assessment of personal income to "taxonincome" assessment. British Columbia, Manitoba, New Brunswick, Nova Scotia, and Ontario introduced taxonincome systems in 2000. Alberta, Saskatchewan, Prince Edward Island, and Newfoundland and Labrador introduced taxonincome systems for 2001.

fraserinstitute.org
14 / Measuring Personal Income Tax Complexity in Canada
personal income tax brackets, signalling an increase in tax complexity on this metric.9
The other aspects of provincial personal income tax systems are presented in Appendix A. Specifically, appendix table 1 examines the floor (minimum) income associated with the lowest and highest bracket while appendix table 2 examines the tax rates applied to those two brackets. In general, we observe increased variation across the provinces on both measures. With more diverse subnational personal income tax systems within a country, mobile workers have to relearn the personal income tax system when they move to a new province, which adds to the tax complexity they face. It may also signal increased tax complexity for employers that operate in multiple provinces.
Administrative documents
Ideally, we would measure provincial personal income tax complexity using tax expenditure data but there is a lack of available and uniform data across the provinces. We thus turn to tax complexity indicators based on administrative documents (i.e. tax forms), which include accessible and comparable data for the provinces.
There are three specific indicators, which are derived from a detailed examination of the tax package associated with each province’s personal income tax system on the Canada Revenue Agency’s website (http://www.craarc.gc.ca/formspubs/t1gnrl/menueng.html). The site has a relevant link for each province. Those links immediately yield the first indicator: the number of documents for each province. Opening up the various documents, one can then count for each the number of pages (the second indicator). The third and final indicator is the total number of lines associated with the tax calculations in the various forms. Examples of the information used to construct these indicators are provided in Appendix B.
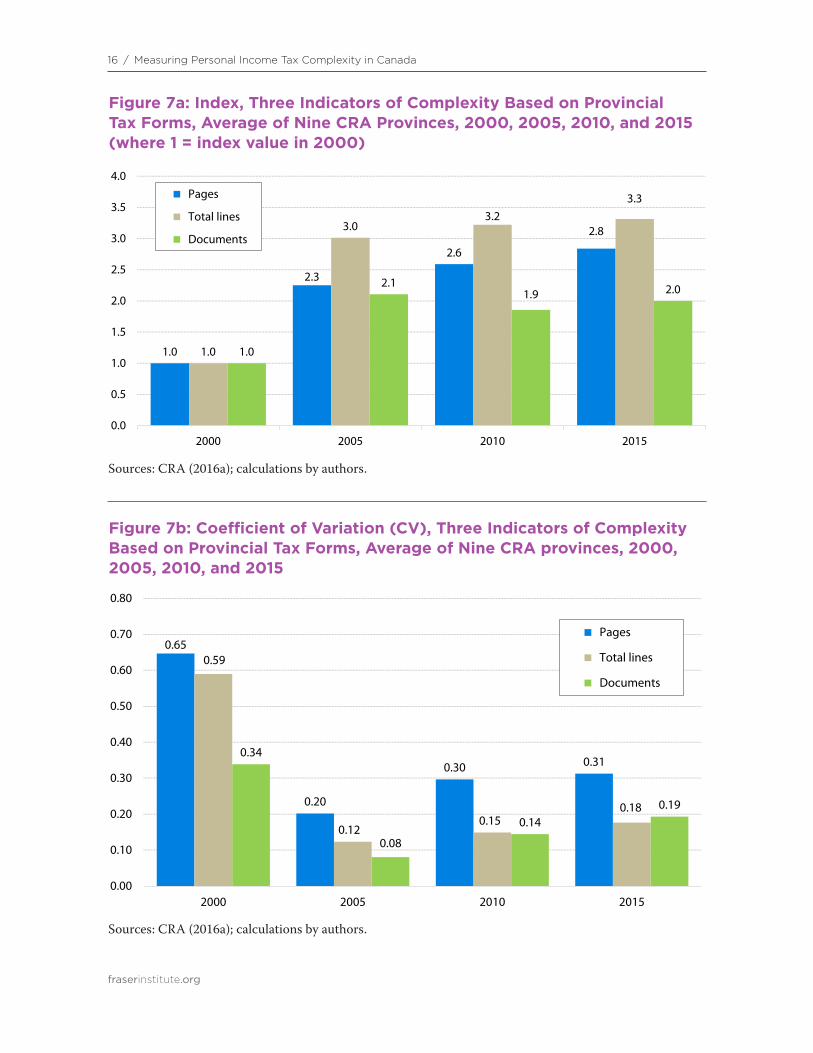
The underlying data for all three indicators are displayed in table 4 for the nine CRA provinces and the average in 2000, 2005, 2010, and 2015. Figure 7a displays, in index form, the nine CRA provincial averages for the three measures of tax complexity in 2000, 2005, 2010, and 2015 (where 1.0 = index value in 2000).10 It shows that from 2000 to 2015,
9 Virtually all of the increases were driven by new tax brackets and higher rates on upper earners (Lammam et al., 2016).10 We start with a common point in the year 2000, before changes were introduced to the provincial personal income tax system. In other words, 2000 is the reference point, so the index value is 1.0.

fraserinstitute.org
Measuring Personal Income Tax Complexity in Canada / 15
the average number of pages and total lines increased, while the average number of documents first increased following the change in the personal income tax system after 2000 and then stabilized. Figure 7b shows that the differences among the three indicators (measured by the coefficient of variation) for the nine CRA provinces first declined dramatically after 2000, but then increased from 2005 to 2015. In other words, following the 2000 change, there is generally more variation over time between the provinces on the three indicators (page count, number of total lines, and number of documents). In both cases (figures 7a and 7b), the data show more complexity for taxpayers.11
11 This increased complexity is the result of giving provinces more freedom in setting their provincial income tax. The increased freedom facilitates provincial choices that match the preferences of the electorate, be it a single rate tax system or one that is more progressive. Thus this complexity can be seen as the price of a better functioning overall federal system. However, one may want to minimize this complexity for a given level of subnational choice.
Table 4: Three Indicators of Complexity Based on Provincial Tax Forms, 2000, 2005, 2010, and 2015
Prov. Number of documents Number of pages Number of total lines
2000 2005 2010 2015 2000 2005 2010 2015 2000 2005 2010 2015
NL 2 7 6 6 3 13 15 15 19 149 162 163
PE 2 6 5 5 3 12 12 13 32 146 156 163
NS 4 7 5 5 8 15 14 14 60 158 152 148
NB 4 6 5 6 4 12 13 16 44 147 156 163
ON 4 7 7 8 12 18 26 27 77 185 194 194
MB 4 7 7 7 13 19 22 25 114 186 219 237
SK 2 6 6 6 3 12 16 15 34 143 168 162
AB 2 6 5 5 3 11 12 12 22 128 137 132
BC 4 7 6 8 7 14 15 22 64 162 157 183
Average of nine CRA provinces
3.1 6.6 5.8 6.2 6.2 14.0 16.1 17.7 51.8 156.0 166.8 171.7
Sources: CRA (2016a); calculations by authors.
Notes: The four indicators include the provincial information sheets and all the tax forms listed under “Provincial information and forms”.
fraserinstitute.org
16 / Measuring Personal Income Tax Complexity in Canada
Figure 7a: Index, Three Indicators of Complexity Based on Provincial Tax Forms, Average of Nine CRA Provinces, 2000, 2005, 2010, and 2015 (where 1 = index value in 2000)
Sources: CRA (2016a); calculations by authors.
Figure 7b: Coefficient of Variation (CV), Three Indicators of Complexity Based on Provincial Tax Forms, Average of Nine CRA provinces, 2000, 2005, 2010, and 2015
Sources: CRA (2016a); calculations by authors.
0.65
0.20
0.30 0.31
0.59
0.120.15
0.18
0.34
0.08
0.140.19
0.00
0.10
0.20
0.30
0.40
0.50
0.60
0.70
0.80
2000 2005 2010 2015
Pages
Total lines
Documents
1.0
2.3
2.6
2.8
1.0
3.03.2
3.3
1.0
2.11.9 2.0
0.0
0.5
1.0
1.5
2.0
2.5
3.0
3.5
4.0
2000 2005 2010 2015
Pages
Total lines
Documents
fraserinstitute.org
Measuring Personal Income Tax Complexity in Canada / 17
Figure 8a: Index, Number of Lines in Personal Income Tax Forms, Atlantic Provinces, selected years, 2000-2015 (where 1.0 = index value in 2000)
Sources: CRA (2016a); calculations by authors. Note: There was marked change in the various provincial personal income tax systems after 2000.
Figure 8b: Index, Number of Lines in Personal Income Tax Forms, Western Provinces, selected years, 2000-2015 (where 1.0 = index value in 2000)
Sources: CRA (2016a); calculations by authors. Note: There was marked change in the various provincial personal income tax systems after 2000.
1.0
7.88.5 8.6
1.0
4.6 4.9 5.1
1.0
2.62.5 2.51.0
3.33.5 3.7
0.0
1.0
2.0
3.0
4.0
5.0
6.0
7.0
8.0
9.0
10.0
2000 2005 2010 2015
PE
NB
NS
NL
1.0 1.6 1.9 2.1
1.0
4.2
4.9 4.8
1.0
5.86.2
6.0
1.0
2.5 2.5
2.9
0.0
1.0
2.0
3.0
4.0
5.0
6.0
7.0
2000 2005 2010 2015
SK
BC
MB
AB

fraserinstitute.org
18 / Measuring Personal Income Tax Complexity in Canada
Figure 8c: Index, Number of Lines in Personal Income Tax Forms, Ontario and Canadian average, selected years, 2000-2015 (where 1.0 = index value in 2000)
Sources: CRA (2016a); calculations by authors. Note: There was marked change in the various provincial personal income tax systems after 2000.
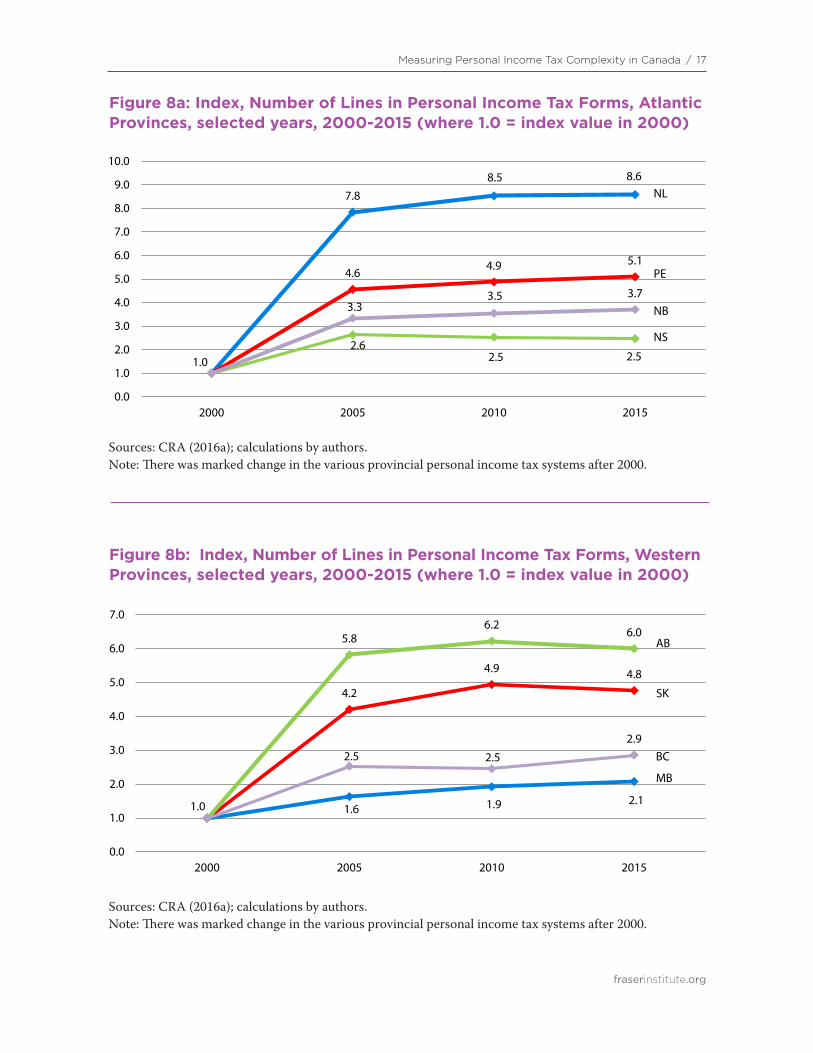
Figures 8a, 8b, and 8c display, again in index form, the total number of lines between 2000 and 2015 for the nine CRA provinces (where 1.0 = index value in 2000). We focus on the total number of lines as the most appropriate indicator of complexity since one can reduce the number of documents simply by combining them, and cut the number of pages by reorganizing blank spaces, and so on, without reducing the complexity of calculations linked to the personal income tax system. But if a government adds (or subtracts) lines of calculations for a credit or for another purpose, that jurisdiction has increased (or decreased) complexity for the relevant subset of taxpayers, and thus for all taxpayers on average. Figure 8a includes all the Atlantic provinces, figure 8b includes the Western provinces, and figure 8c includes Ontario and the Canadian average.12 The number of lines in Newfoundland & Labrador’s tax forms grew the most over the period, followed by Alberta and Prince
12 In results not displayed the authors computed the nine CRA provincial average number of lines weighted by number of provincial tax filers. Not surprisingly, it is fairly similar to the Ontario index as tax fillers from that province account for 50 percent of all CRA provinces personal income tax filers.
1.0
2.42.5 2.5
1.0
3.03.2
3.3
0.0
0.5
1.0
1.5
2.0
2.5
3.0
3.5
2000 2005 2010 2015
ON
Cdn. avg.

fraserinstitute.org
Measuring Personal Income Tax Complexity in Canada / 19
Edward Island. In general, from 2000 to 2015, the number of lines in the tax forms of the nine CRA provinces increased—often quite dramatically when considering the total growth rate. Again, it is important to note that there was a change in the provincial personal income tax system after 2000. This means the system that existed in 2000 is different than that in the other years in the figure. Nonetheless, it is clear that following the system change, tax complexity increased.
Figure 9 displays in graphical form the total number of lines in the various provincial tax forms (excluding Quebec) for 2005 and 2015. At 237, Manitoba has the greatest number of lines in 2015, followed by Ontario (194) and British Columbia (183). At the other extreme, Alberta has the fewest number of lines (132).
Figure 9: Number of Total Lines in Personal Income Tax Forms, Canadian Provinces (excluding Quebec), 2005 and 2015
Sources: CRA (2016a); calculations by authors.
149 146158
147
185 186
143
128
162163 163148
163
194
237
162
132
183
0
50
100
150
200
250
NL PE NS NB ON MB SK AB BC
2005
2015
fraserinstitute.org
Conclusion
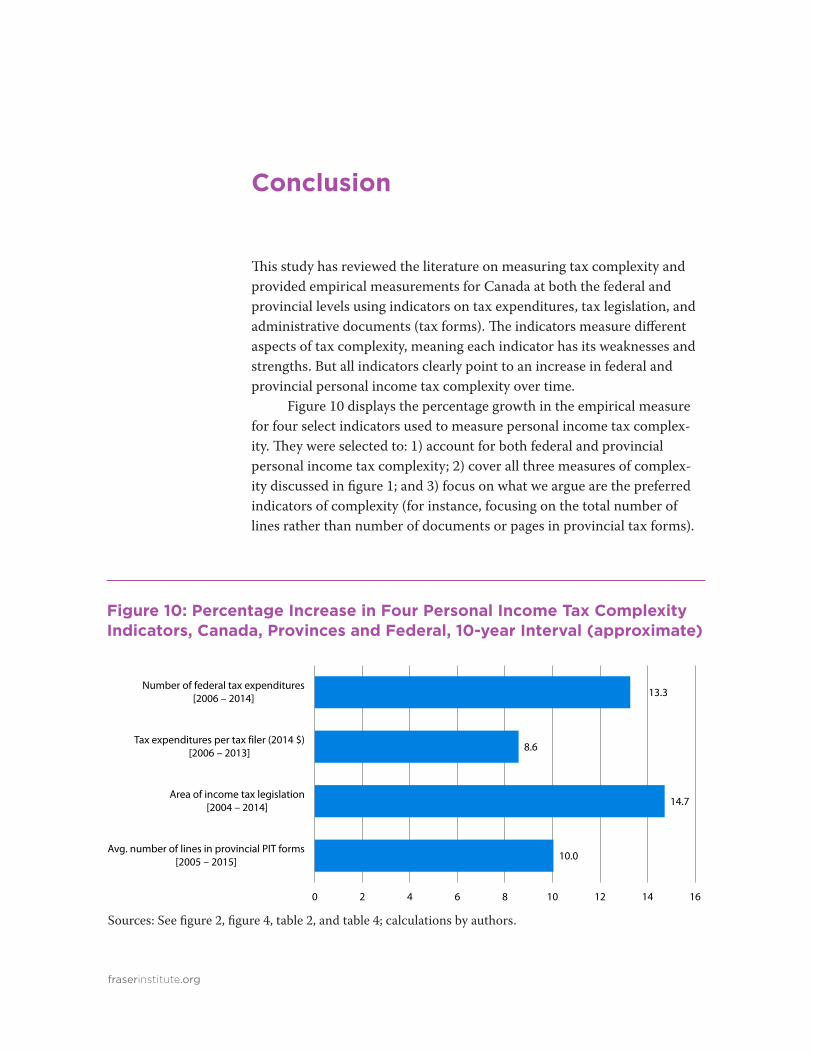
This study has reviewed the literature on measuring tax complexity and provided empirical measurements for Canada at both the federal and provincial levels using indicators on tax expenditures, tax legislation, and administrative documents (tax forms). The indicators measure different aspects of tax complexity, meaning each indicator has its weaknesses and strengths. But all indicators clearly point to an increase in federal and provincial personal income tax complexity over time.
Figure 10 displays the percentage growth in the empirical measure for four select indicators used to measure personal income tax complexity. They were selected to: 1) account for both federal and provincial personal income tax complexity; 2) cover all three measures of complexity discussed in figure 1; and 3) focus on what we argue are the preferred indicators of complexity (for instance, focusing on the total number of lines rather than number of documents or pages in provincial tax forms).
Figure 10: Percentage Increase in Four Personal Income Tax Complexity Indicators, Canada, Provinces and Federal, 10-year Interval (approximate)
Sources: See figure 2, figure 4, table 2, and table 4; calculations by authors.
10.0
14.7
8.6
13.3
0 2 4 6 8 10 12 14 16
Avg. number of lines in provincial PIT forms [2005 – 2015]
Area of income tax legislation [2004 – 2014]
Tax expenditures per tax filer (2014 $) [2006 – 2013]
Number of federal tax expenditures [2006 – 2014]

fraserinstitute.org
Measuring Personal Income Tax Complexity in Canada / 21
The interval is approximately a 10year period (starting in 20042006 and ending in 20132015). Over the period, all indicators signal growing tax complexity with increases ranging from 8.6 to 14.7 percent.
Canada does not have the equivalent of the United Kingdom’s Office of Tax Simplification (either federally or provincially) (United Kingdom, 2015a, 2015b). That means there is no systematic work underway to measure, let alone reduce, tax complexity in Canada, although the new federal government has expressed interest in reviewing federal tax expenditures (Cheadle, 2016, March 25). This paper is part of an ongoing research program at the Fraser Institute that attempts to help fill that void.

fraserinstitute.org
Appendix A: Income Floor and Tax Rates of Lowest and Highest Personal Income Tax Brackets
Appendix table 1 displays the floor (minimum) income associated with the lowest and highest tax brackets for the various jurisdictions in 2001, 2008, and 2016. From 2001 to 2016, there was an increase in the average minimum income for the lowest tax bracket of 34 percent. The increase
Appendix Table 1: Minimum Income (Floor) for Lowest and Highest Tax Bracket (in dollars), Canada, Provinces and Federal, selected years, 2001-2016
Min income for lowest tax bracket
Min income for highest tax bracket
2001 2008 2016 2001 2008 2016
Newfoundland & Labrador 7,410 7,566 8,802 59,180 60,429 175,700
Prince Edward Island 7,412 7,708 7,708 61,509 98,143 98,143
Nova Scotia 7,231 7,731 8,481 79,527 93,000 150,000
New Brunswick 7,412 8,395 9,758 100,000 113,273 150,000
Ontario 7,426 8,681 10,011 63,503 74,721 220,000
Manitoba 7,412 8,034 9,134 61,089 66,000 67,000
Saskatchewan 8,000 8,945 15,843 60,000 111,814 127,430
Alberta 12,900 16,161 18,451 12,900 16,161 300,000
British Columbia 8,000 9,189 10,027 85,000 97,636 106,543
Average of nine CRA provinces
8,134 9,157 10,913 64,745 81,242 154,980
CV (Coefficient of Variation) 0.22 0.29 0.34 0.37 0.38 0.46
Federal 7,412 9,600 11,474 100,000 123,184 200,000
Quebec 5,900 10,215 11,550 52,000 75,000 103,150
Sources: Treff and Perry (2001); Price Waterhouse Cooper (2008); CRA (2016a and 2016b); New Brunswick, Department of Finance (2016); Revenue Quebec (2016); calculations by authors.
Note: See Table 3.

fraserinstitute.org
Measuring Personal Income Tax Complexity in Canada / 23
in the average minimum income for the highest tax bracket is 139 percent. Both increases are greater than the rise in overall prices (29 percent) for the period as measured by the Canadian Consumer Price Index (Statistics Canada, 2016b). The two coefficients of variations increased over the period, indicating greater variation between the nine CRA provinces. The sharp increase in the minimum income for the highest bracket is associated with the introduction of more brackets with higher marginal rates.
Appendix table 2 displays the tax rates applied to the lowest and highest tax brackets for the various jurisdictions in 2001, 2008, and 2016. From 2001 to 2016, there has been a drop in the average rate for the lowest tax bracket, with the average of the nine CRA provinces falling from 9.5 to 8.7 percent. Turning to the highest tax bracket, we see
Appendix Table 2: Tax Rate for the Lowest and Highest Personal Income Tax Brackets, Canada, Provinces and Federal, selected years, 2001-2016
Tax rate for the lowest tax bracket
Tax rate for the highest tax bracket
2001 2008 2016 2001 2008 2016
Newfoundland & Labrador 10.57% 8.20% 7.70% 19.64% 16.00% 15.30%
Prince Edward Island 9.80% 9.80% 9.80% 18.37% 18.37% 18.37%Nova Scotia 9.77% 8.79% 8.79% 18.34% 19.25% 21.00%New Brunswick 9.68% 10.12% 9.68% 17.84% 17.95% 20.30%Ontario 6.16% 6.05% 5.05% 17.41% 17.41% 20.53%Manitoba 10.90% 10.90% 10.80% 17.40% 17.40% 17.40%Saskatchewan 11.50% 11.00% 11.00% 16.00% 15.00% 15.00%Alberta 10.00% 10.00% 10.00% 10.00% 10.00% 15.00%British Columbia 7.30% 5.24% 5.06% 16.70% 14.70% 14.70%
Average of nine CRA provinces
9.52% 8.90% 8.65% 16.86% 16.23% 17.51%
CV (Coefficient of Variation) 0.18 0.23 0.26 0.16 0.17 0.15
Federal 16.00% 15.00% 15.00% 29.00% 29.00% 33.00%Quebec 17.00% 16.00% 16.00% 24.50% 24.00% 25.75%
Sources: Treff and Perry (2001); Price Waterhouse Cooper (2008); CRA (2016a and 2016b); New Brunswick, Department of Finance (2016); Revenue Quebec (2016); calculations by authors.Notes: a) See Table 3.b) Newfoundland & Labrador decreased a personal income tax rate as of July 1, 2008, so an average rate was used for the year.

fraserinstitute.org
24 / Measuring Personal Income Tax Complexity in Canada
relative stability from 2001 to 2008 until an increase in 2016. Variation between provinces increases for the lowest rate, as demonstrated by the coefficient of variation, while for the higher rate it first increases then decreases.

fraserinstitute.org
Appendix B: Calculating indicators Based on Provincial Tax Forms
Appendix B details the three measures of provincial tax complexity based on administrative documents (i.e., tax forms).
Number of documents
The data for each province comes from the YEAR General Income Tax and Benefit package web page. For Ontario, for instance, the 2015 data can be found at http://www.craarc.gc.ca/formspubs/t1gnrl/oneng.html. A physical count of the number of items for each CRA province can be determined under the provincial information and forms headings. For Alberta in 2015, the five items are as follows:
1) Information Sheet—Residents of Alberta2) Provincial Worksheet—Alberta3) Form AB428—Alberta Tax and Credits4) Schedule AB (S2)—Provincial Amounts Transferred from Your
Spouse or CommonLaw Partner5) Schedule AB (S11)—Provincial Tuition and Education Amounts
Number of pages
Once each item is opened as a PDF file, its length in pages is listed at the top of the file. The page counts are then added up for each province. For Nova Scotia in 2010, for example, there are five documents and a total of 14 pages:
• Information Sheet—Residents of Nova Scotia (7 pages); • Provincial Worksheet—Nova Scotia (2 pages); • Form NS428—Nova Scotia Tax and Credits (3 pages); • Schedule NS (S2)—Provincial Amounts Transferred from Your
Spouse or Commonlaw Partner (1 page); and• Schedule NS (S11)—Provincial Tuition and Education Amounts
(1 page).
Identical pages were not double counted.
fraserinstitute.org
26 / Measuring Personal Income Tax Complexity in Canada
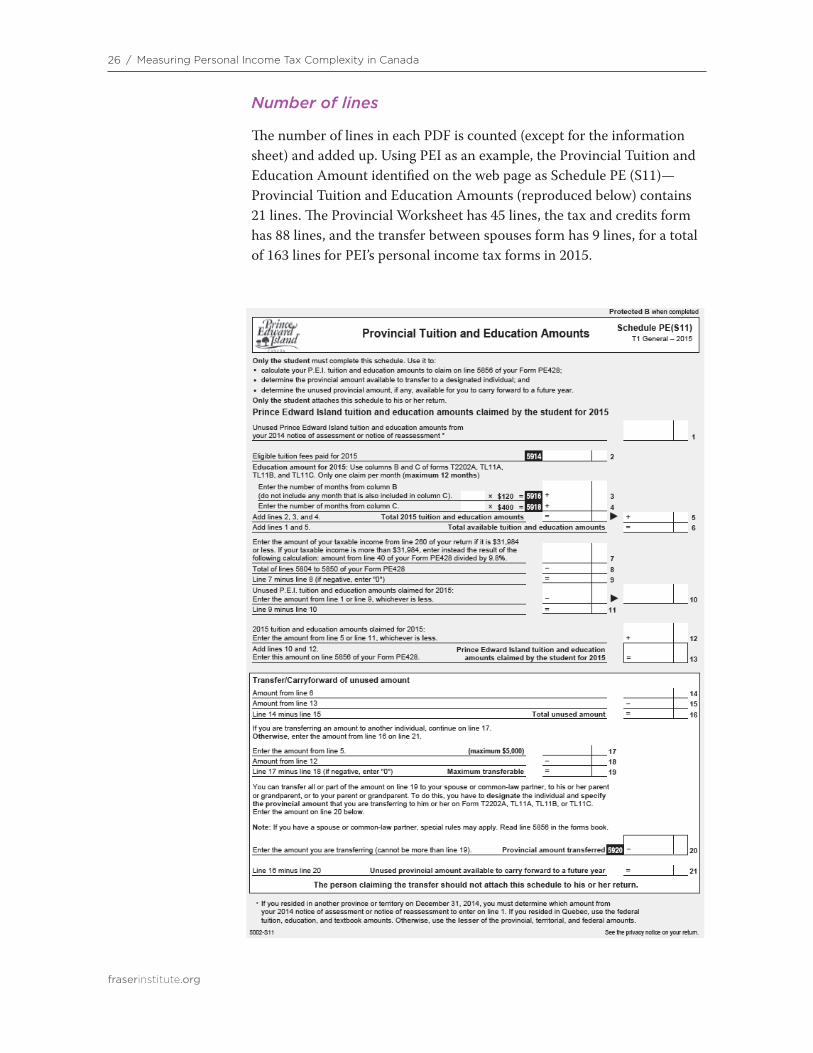
Number of lines
The number of lines in each PDF is counted (except for the information sheet) and added up. Using PEI as an example, the Provincial Tuition and Education Amount identified on the web page as Schedule PE (S11)—Provincial Tuition and Education Amounts (reproduced below) contains 21 lines. The Provincial Worksheet has 45 lines, the tax and credits form has 88 lines, and the transfer between spouses form has 9 lines, for a total of 163 lines for PEI’s personal income tax forms in 2015.
fraserinstitute.org
References
Canada Revenue Agency [CRA] (2016a). Tax packages for all years. Government of Canada. <http://www.craarc.gc.ca/formspubs/t1gnrl/llyrseng.html>, as of April 5, 2016.
Canada Revenue Agency [CRA] (2016b). Canadian income tax rates for individuals—current and previous years. Web page. Government of Canada. <http://www.craarc.gc.ca/tx/ndvdls/fq/txrtseng.html>, as of April 5, 2016.
Canada Revenue Agency [CRA] (2008). Historical Table 1: Tax Years 1968 to 2006. Final Statistics—Sample Data 2008 Edition (2006 tax year). Web table. Government of Canada. <http://www.craarc.gc.ca/gncy/stts/gb06/pst/fnl/pdf/htbl1eng.pdf>, as of April 5, 2016.
Canada Revenue Agency [CRA] (2013). Final Table 1: General statement by province and territory of taxation. Income Statistics 2013 (2011 tax year). Web table. Government of Canada. <http://www.craarc.gc.ca/gncy/stts/gb11/pst/fnl/pdf/tbl1eng.pdf>, as of April 5, 2016.
Canada Revenue Agency [CRA] (2015). Final Table 1: General statement by province and territory of taxation. Income Statistics 2015 (2013 tax year). Web table. Government of Canada. <http://www.craarc.gc.ca/gncy/stts/t1fnl/2013/tbl1eng.pdf>, as of March 7, 2016.
Canadian Chamber of Commerce [CCC] (2015). Barrier 5: Canada’s Tax System is Too Complex and Costly. Top 10 Barriers to Competitiveness. Canadian Chamber of Commerce.
Canadian Tax Foundation (1992). The National Finances. Canadian Tax Foundation.
Clark, C. Scott, and Len Farber (2011). The Need for Tax Simplification—A Challenge and an Opportunity. Issue in Focus. CGA Canada. <http://www.cgacanada.org/enca/ResearchReports/ca_rep_201108_tax_simplification.pdf>, as of March 7, 2016.
fraserinstitute.org
28 / Measuring Personal Income Tax Complexity in Canada
Commerce Clearing House [CCH] (various years). Canadian Income Tax Act with Regulations. Wolters Kluwer.
Canada, Department of Finance (various years). Government of Canada Tax Expenditures. Web page. Government of Canada. <http://www.fin.gc.ca/purl/taxexpeng.asp>, as of March 7, 2016.
Canada, Department of Finance (2015). Fiscal Reference Tables (September 2015). Government of Canada. <http://www.fin.gc.ca/frttrf/2015/frttrf15eng.pdf>, as of April 5, 2016.
Cheadle, Bruce (2016, March 25). Finance Minister Morneau says review of federal tax breaks is coming. CBC News. <http://www.cbc.ca/news/canada/calgary/financeministertaxcodemintzreview1.3507374> as of March 29, 2016.
Guimond, David, and François Vaillancourt (2013). Setting Personal Income Tax Rates: Evidence from Canada and Comparison with the United States of America, 20002010. In (Violeta Ruiz Almendral and François Vaillancourt, eds.). Autonomy in Subnational Income Taxes: Evolving Powers, Existing Practices in Seven Countries (McGillQueen’s University Press): 100120.
Lammam, Charles, Hugh MacIntyre, Feixue Ren, Ben Eisen, and Milagros Palacios (2016). Canada’s Rising Personal Tax Rates and Falling Tax Com-petitiveness. The Fraser Institute. <https://www.fraserinstitute.org/sites/default/files/canadasrisingpersonaltaxratesandfallingtaxcompetitiveness.pdf>, as of March 17, 2016.
Liberal Party of Canada (2015). A New Plan for a Strong Middle Class. Liberal Party of Canada. <https://www.liberal.ca/files/2015/10/Newplanforastrongmiddleclass.pdf>, as of April 5, 2016.
Lugo, Marco, and François Vaillancourt (2015). Measuring Tax Complexity: Analytical Framework and Evidence for Individual Income Tax Preferences for Canada. In C. Evans and R. Krever (eds.). Tax Simplification (Kluwer Law International).
Moody, J. Scott, Wendy P. Warcholik, and Scott A. Hodge (2005). The Rising Cost of Complying with the Federal Income Tax. Special Report 138 (December). Tax Foundation. <http://taxfoundation.org/sites/default/files/docs/sr138.pdf>, as of March 7, 2016.
fraserinstitute.org
Measuring Personal Income Tax Complexity in Canada / 29
New Brunswick, Department of Finance (2016). Budget 2016-2017. Government of New Brunswick. <http://www2.gnb.ca/content/gnb/en/departments/finance/budget/20162017/budget.html>, as of April 5, 2016.
OnPayroll.ca (2016). 2016 Federal and Provincial TD1 Basic Exemptions and forms. Web table. OnPayroll.ca. <http://www.onpayroll.ca/federalandprovincialtd1basicexemptions>, as of March 7, 2015.
Price Waterhouse Cooper [PwC] (2008). Tax facts and figures: Canada 2008. Price Waterhouse Cooper.
Price Waterhouse Cooper [PwC] (2014). Total Tax Contribution: Survey-ing the Canadian Council of Chief Executives. Price Waterhouse Cooper. <http://www.ceocouncil.ca/wpcontent/uploads/2014/04/TTCFinalApril2014.pdf>, as of March 7, 2016.
Quebec Taxation Review Committee (2015). Focusing on Quebec’s Future. Vol 1: Quebec Tax Reform. Quebec Taxation Review Committee. <http://www.examenfiscalite.gouv.qc.ca/uploads/media/Volume1CEFQ_ReportENG.pdf>, as of April 5, 2016.
Revenue Quebec (2016). Income Tax Rates. Web Page. Revenue Quebec. <http://www.revenuquebec.ca/en/citoyen/situation/nouvelarrivant/regimefiscalduquebec/tauximposition.aspx>, as of April 5, 2016.
Sawicky, Max B., Robert S. Mcintyre, and Joseph H. Guttentag (2006). Bridging the Tax Gap: Addressing the Crisis in Tax Administration. Economic Policy Institute.
Slemrod, Joel (2005). The Etiology of Tax Complexity: Evidence from US State Income Tax Systems. Public Finance Review 33 (3): 279299.
Speer, Sean, Milagros Palacios, Marco Lugo, and François Vaillancourt (2014). The Cost to Canadians of Complying with Personal Income Taxes. The Fraser Institute. <https://www.fraserinstitute.org/sites/default/files/costtocanadiansofcomplyingwithpersonalincometaxes.pdf>, as of April 6, 2016.
Statistics Canada (2016a). Table 326-0021: Consumer Price Index (CPI), 2011 basket, annual (2002 = 100). Web table. Statistics Canada. <http://www5.statcan.gc.ca/cansim/a26?lang=eng&id=3260021>, as of April 5, 2016.

fraserinstitute.org
30 / Measuring Personal Income Tax Complexity in Canada
Statistics Canada (2016b). Consumer Price Index, historical summary (1996 to 2015). Web page. Statistics Canada. <http://www.statcan.gc.ca/tablestableaux/sumsom/l01/cst01/econ46aeng.htm>, as of April 5, 2016.
Treff, Karin, and David, B. Perry (2001). Finances of the Nation. Canadian Tax Foundation.
Turnbull-Hall, Caroline, and Richard Thomas (2012). Length of Leg-islation as a Measure of Complexity. Office of Tax Simplification, Government of United Kingdom. <https://www.gov.uk/government/uploads/system/uploads/attachment_data/file/193496/ots_length_legislation_paper.pdf>, as of April 5, 2016.
Ulph, David (2013). Measuring Tax Complexity. Government of United Kingdom. <https://www.gov.uk/government/uploads/system/uploads/attachment_data/file/193497/ots_david_ulph_measuring_tax_complexity.pdf>, as of March 7, 2016.
United Kingdom, HM Treasury, Office of Tax Simplification (2015a). Office of Tax Simplification. Web home page. Government of the United Kingdom. <https://www.gov.uk/government/organisations/officeoftaxsimplification>, as of April 5, 2016.
United Kingdom, HM Treasury, Office of Tax Simplification (2015b). The OTS Complexity Index—version 2. Government of the United Kingdom. <https://www.gov.uk/government/uploads/system/uploads/attachment_data/file/250995/ots_complexity_index_version2.pdf>, as of April 6, 2016.
Vaillancourt, François, Édison Roy-César, and Maria Silvia Barros (2013). The Compliance and Administrative Costs of Taxation in Canada. The Fraser Institute. <https://www.fraserinstitute.org/sites/default/files/compliance-and-administrative-costs-of-taxation-in-can-ada-2013.pdf>, as of April 6, 2016.
Vaillancourt, François, Marylène Roy and Charles Lammam (2015). Measuring Tax Complexity in Canada. Research Bulletin (April). The Fraser Institute. <https://www.fraserinstitute.org/sites/default/files/measuringtaxcomplexityincanada.pdf>, as of April 6, 2016.
Vaillancourt, François, and Richard Bird (2016). Tax Simplifica-tion in Canada: A Journey Not Yet Mapped. In S. James, A. Sawyer,

fraserinstitute.org
Measuring Personal Income Tax Complexity in Canada / 31
and T. Budak (eds.). The Complexity of Tax Simplification (Palgrave Macmillan): 70-94.
Weinstein, Paul, Jr. (2014). The State Tax Complexity Index: A New Tool for Tax Reform and Simplification. Policy Memo. Progressive Policy Institute. <http://www.progressivepolicy.org/wpcontent/uploads/2014/04/2014.04Weinstein_TheStateTaxComplexityIndex_ANewToolForTaxReformandSimplification1.pdf>, as of March 7, 2016.
fraserinstitute.org
32 / Measuring Personal Income Tax Complexity in Canada
About the authors
François VaillancourtFrançois Vaillancourt (PhD, Queen’s University, 1978) is a Fellow at CIRANO and an Emeritus Professor (Economics) at Université de Montréal. He has published extensively in areas of public policy such as fiscal federalism, taxation, and language policy. He has been a Shastri lecturer (1993, India), a Fulbright Scholar (2009, Atlanta), and a visitor at the Federalism Research Centre ANU (1991, Canberra), the Institute for Policy Analysis (1991, Toronto), the Andrew Young School (2007 and 2009, Atlanta), and École Normale Supérieure (2006 and 2008, Cachan). He has done consulting work for bodies in Québec, in Canada, and outside Canada.
Charles LammamCharles Lammam is Director of Fiscal Studies at the Fraser Institute. He holds an MA in public policy and a BA in economics with a minor in business administration from Simon Fraser University. Since joining the Institute, Mr. Lammam has published over 70 studies and 260 original articles on a wide range of economic policy issues including taxation, government finances, pensions, investment, income mobility, labour, entrepreneurship, publicprivate partnerships, and charitable giving. His articles have appeared in every major national and regional newspaper in Canada (including the Globe and Mail and National Post) as well as prominent USbased publications (including Forbes and The American). Mr. Lammam’s career in public policy spans nearly a decade. He regularly gives presentations to various groups, comments in print media, and appears on radio and television broadcasts across the country to discuss the Institute’s research. He has also appeared before committees of the House of Commons as an expert witness.
Feixue RenFeixue Ren is an Economist at the Fraser Institute. She holds a Master’s Degree in Economics from Lakehead University and a B.A. in Statistics from Hunan Normal University in China. Since joining the Institute, she has been the coauthor of more than 20 studies and commentaries on fiscal and labourmarket policy. Notable recent publications are Measuring the Fiscal

fraserinstitute.org
Measuring Personal Income Tax Complexity in Canada / 33
Performance of Canada’s Premiers, 2016; The Cost of Government Debt in Canada, 2016; and Taxes versus the Necessities of Life: The Canadian Consumer Tax Index, 2015 Edition.
Marylène RoyMarylène Roy holds a BSc (Econ) from Université de Montréal and is currently studying for a MSc at HEC Montréal. She is a research assis tant at CIRANO.
AcknowledgmentsThe authors would like to acknowledge the anonymous reviewers for their comments, suggestions, and insights. Any remaining errors or oversights are the sole respon sibility of the authors. As the researchers have worked independently, the views and conclusions expressed in this paper do not necessarily reflect those of the Board of Di rectors of the Fraser Institute, the staff, or supporters.
fraserinstitute.org
34 / Measuring Personal Income Tax Complexity in Canada
Publishing informationDistributionThese publications are available from http://www.fraserinstitute.org in Portable Document Format (PDF) and can be read with Adobe Acrobat® or Adobe Reader®, versions 8 or later. Adobe Reader® DC, the most recent version, is available free of charge from Adobe Systems Inc. at http://get.adobe.com/reader/. Readers having trouble viewing or printing our PDF files using applications from other manufacturers (e.g., Apple’s Preview) should use Reader® or Acrobat®.
Ordering publicationsTo order printed publications from the Fraser Institute, please contact:
• e-mail:[email protected] • telephone:604.688.0221ext.580or,tollfree,1.800.665.3558ext.580 • fax:604.688.8539
MediaFor media enquiries, please contact our communications department at 604.714.4582 or via email at [email protected]. In Toronto, contact our media specialist at416.363.6575,ext.238.
CopyrightCopyright © 2016 by the Fraser Institute. All rights reserved. No part of this publication may be reproduced in any manner whatsoever without written permission except in the case of brief passages quoted in critical articles and reviews.
Date of issue
April 2016
ISBN9780889754027
CitationFrançois Vaillancourt, Charles Lammam, Feixue Ren, and Marylène Roy (2016). Measuring Personal Income Tax Complexity in Canada. Fraser Institute. http://www.fraserinstitute.org.

fraserinstitute.org
Measuring Personal Income Tax Complexity in Canada / 35
Supporting the Fraser InstituteTo learn how to support the Fraser Institute, please contact
•Development Department, Fraser Institute Fourth Floor, 1770 Burrard Street Vancouver, British Columbia, V6J 3G7 Canada
•telephone,toll-free:1.800.665.3558ext.548
•e-mail:[email protected]
•website:http://www.fraserinstitute.org/donate
Purpose, funding, and independenceThe Fraser Institute provides a useful public service. We report objective information about the economic and social effects of current public policies, and we offer evidencebased research and education about policy options that can improve the quality of life.
The Institute is a nonprofit organization. Our activities are funded by charitable donations, unrestricted grants, ticket sales, and sponsorships from events, the licensing of products for public distribution, and the sale of publications.
All research is subject to rigorous review by external experts, and is conducted and published separately from the Institute’s Board of Trustees and its donors.
The opinions expressed by authors are their own, and do not necessarily reflect those of the Institute, its Board of Trustees, its donors and supporters, or its staff. This publication in no way implies that the Fraser Institute, its trustees, or staff are in favour of, or oppose the passage of, any bill; or that they support or oppose any particular political party or candidate.
As a healthy part of public discussion among fellow citizens who desire to improve the lives of people through better public policy, the Institute welcomes evidencefocused scrutiny of the research we publish, including verification of data sources, replication of analytical methods, and intelligent debate about the practical effects of policy recommendations.

fraserinstitute.org
36 / Measuring Personal Income Tax Complexity in Canada
About the Fraser InstituteOur mission is to improve the quality of life for Canadians, their families, and future generations by studying, measuring, and broadly communicating the effects of government policies, entrepreneurship, and choice on their wellbeing.
Notre mission consiste à améliorer la qualité de vie des Canadiens et des générations à venir en étudiant, en mesurant et en diffusant les effets des poli-tiques gouvernementales, de l’entrepreneuriat et des choix sur leur bien-être.
Peer review —validating the accuracy of our research
The Fraser Institute maintains a rigorous peer review process for its research. New research, major research projects, and substantively modified research conducted by the Fraser Institute are reviewed by experts with a recognized expertise in the topic area being addressed. Whenever possible, external review is a blind process. Updates to previously reviewed research or new editions of previously reviewed research are not reviewed unless the update includes substantive or material changes in the methodology.
The review process is overseen by the directors of the Institute’s research departments who are responsible for ensuring all research published by the Institute passes through the appropriate peer review. If a dispute about the recommendations of the reviewers should arise during the Institute’s peer review process, the Institute has an Editorial Advisory Board, a panel of scholars from Canada, the United States, and Europe to whom it can turn for help in resolving the dispute.

fraserinstitute.org
Measuring Personal Income Tax Complexity in Canada / 37
Members
Past members
Editorial Advisory Board
* deceased; † Nobel Laureate
Prof. Terry L. Anderson
Prof. Robert Barro
Prof. Michael Bliss
Prof. JeanPierre Centi
Prof. John Chant
Prof. Bev Dahlby
Prof. Erwin Diewert
Prof. Stephen Easton
Prof. J.C. Herbert Emery
Prof. Jack L. Granatstein
Prof. Herbert G. Grubel
Prof. James Gwartney
Prof. Ronald W. Jones
Dr. Jerry Jordan
Prof. Ross McKitrick
Prof. Michael Parkin
Prof. Friedrich Schneider
Prof. Lawrence B. Smith
Dr. Vito Tanzi
Prof. Armen Alchian*
Prof. James M. Buchanan* †
Prof. Friedrich A. Hayek* †
Prof. H.G. Johnson*
Prof. F.G. Pennance*
Prof. George Stigler* †
Sir Alan Walters*
Prof. Edwin G. West*
Top Related