


Languages
Pages
Legal


8/18/2019 McK on Chemicals Using Microeconomics Guide Investments Petrochemicals
http://slidepdf.com/reader/full/mck-on-chemicals-using-microeconomics-guide-investments-petrochemicals 1/13
Number 4,
Spring 2012
McKinsey on Chemicals
The growing demand
for green
21
Using microeconomics
to guide investments
in petrochemicals
47 An Indian specialty-
chemicals success
story: An interview
with United
Phosphorus Limited’s
Jai Shroff
40 Winning in India:
The specialty-
chemicals opportunity
30
Squaring the circle:
Growth and
value creation
4
The path to improved
returns in materials
commercialization
12
8/18/2019 McK on Chemicals Using Microeconomics Guide Investments Petrochemicals
http://slidepdf.com/reader/full/mck-on-chemicals-using-microeconomics-guide-investments-petrochemicals 2/13
47
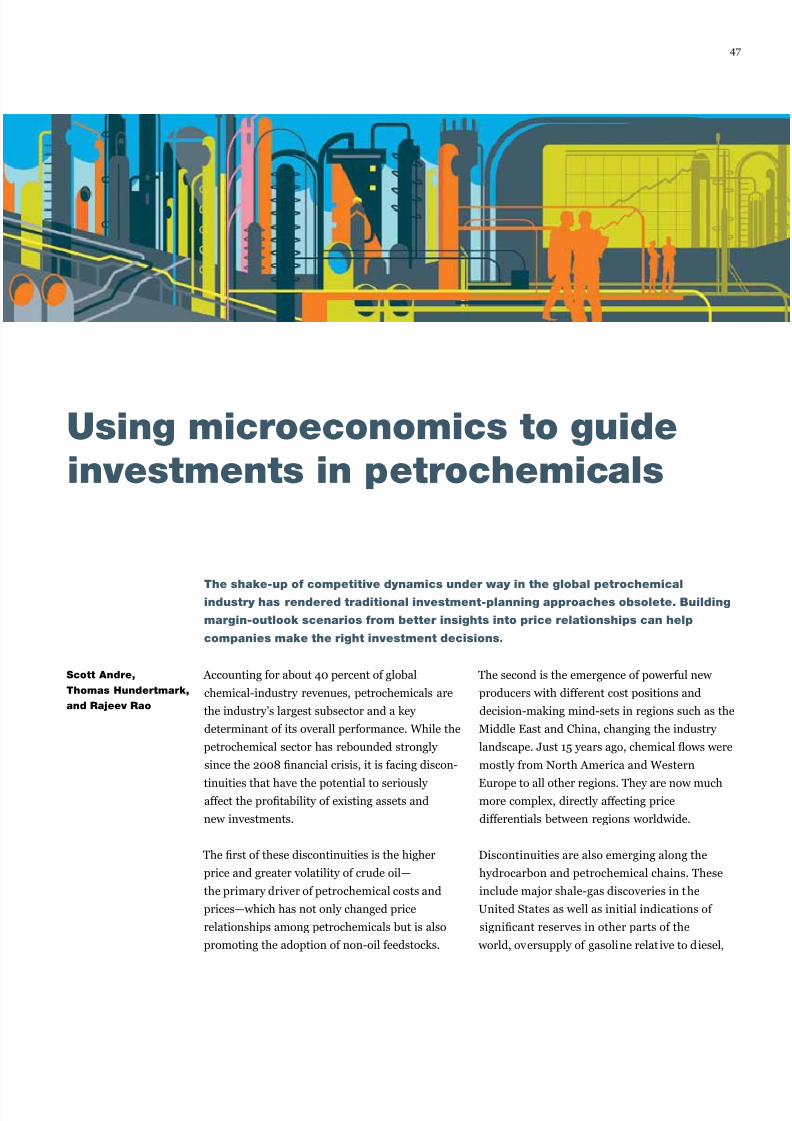
Using microeconomics to guide
investments in petrochemicals
The shake-up of competitive dynamics under way in the global petrochemicalindustry has rendered traditional investment-planning approaches obsolete. Building
margin-outlook scenarios from better insights into price relationships can help
companies make the right investment decisions.
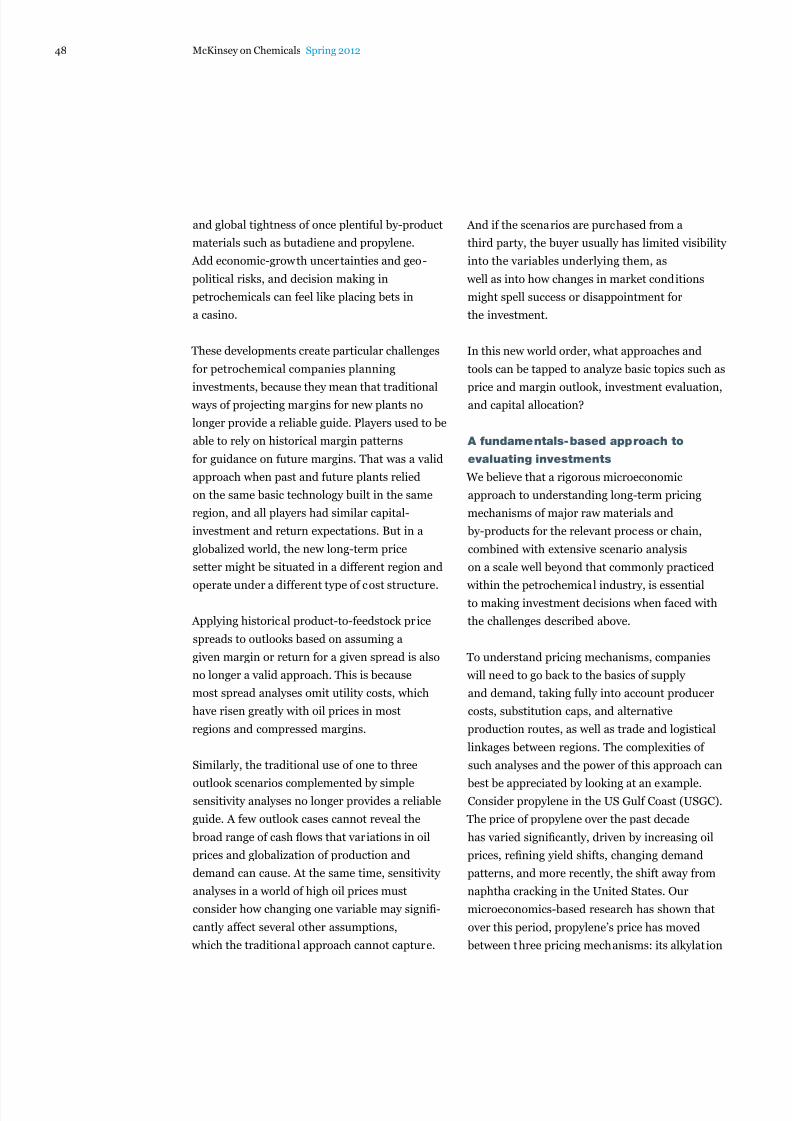
Accounting for about 40 percent of global
chemical-industry revenues, petrochemicals are
the industry’s largest subsector and a key
determinant of its overall performance. While the
petrochemical sector has rebounded strongly
since the 2008 nancial crisis, it is facing discon-
tinuities that have the potential to seriouslyaffect the protability of existing assets and
new investments.
The rst of these discontinuities is the higher
price and greater volatility of crude oil—
the primary driver of petrochemical costs and
prices—which has not only changed price
relationships among petrochemicals but is also
promoting the adoption of non-oil feedstocks.
The second is the emergence of powerful new
producers with different cost positions and
decision-making mind-sets in regions such as the
Middle East and China, changing the industry
landscape. Just 15 years ago, chemical ows were
mostly from North America and Western
Europe to all other regions. They are now muchmore complex, directly affecting price
differentials between regions worldwide.
Discontinuities are also emerging along the
hydrocarbon and petrochemical chains. These
include major shale-gas discoveries in the
United States as well as initial indications of
signicant reserves in other parts of the
world, oversupply of gasoline relat ive to diesel,
Scott Andre,
Thomas Hundertmark,
and Rajeev Rao
8/18/2019 McK on Chemicals Using Microeconomics Guide Investments Petrochemicals
http://slidepdf.com/reader/full/mck-on-chemicals-using-microeconomics-guide-investments-petrochemicals 3/13
48 McKinsey on Chemicals Spring 2012
and global tightness of once plentiful by-product
materials such as butadiene and propylene.
Add economic-growth uncertainties and geo-
political risks, and decision making in
petrochemicals can feel like placing bets in
a casino.
These developments create particular challenges
for petrochemical companies planning
investments, because they mean that traditional ways of projecting margins for new plants no
longer provide a reliable guide. Players used to be
able to rely on historical margin patterns
for guidance on future margins. That was a valid
approach when past and future plants relied
on the same basic technology built in the same
region, and all players had similar capital-
investment and return expectations. But in a
globalized world, the new long-term price
setter might be situated in a different region and
operate under a different type of cost structure.
Applying historical product-to-feedstock price
spreads to outlooks based on assuming a
given margin or return for a given spread is also
no longer a valid approach. This is because
most spread analyses omit utility costs, which
have risen greatly with oil prices in most
regions and compressed margins.
Similarly, the traditional use of one to three
outlook scenarios complemented by simplesensitivity analyses no longer provides a reliable
guide. A few outlook cases cannot reveal the
broad range of cash ows that variations in oil
prices and globalization of production and
demand can cause. At the same time, sensitivity
analyses in a world of high oil prices must
consider how changing one variable may signi-
cantly affect several other assumptions,
which the traditional approach cannot capture.
And if the scenarios are purchased from a
third party, the buyer usually has limited visibility
into the variables underlying them, as
well as into how changes in market conditions
might spell success or disappointment for
the investment.
In this new world order, what approaches and
tools can be tapped to analyze basic topics such as
price and margin outlook, investment evaluation,and capital allocation?
A fundamentals-based approach to
evaluating investments
We believe that a rigorous microeconomic
approach to understanding long-term pricing
mechanisms of major raw materials and
by-products for the relevant process or chain,
combined with extensive scenario analysis
on a scale well beyond that commonly practiced
within the petrochemical industry, is essentialto making investment decisions when faced with
the challenges described above.
To understand pricing mechanisms, companies
will need to go back to the basics of supply
and demand, taking fully into account producer
costs, substitution caps, and alternative
production routes, as well as trade and logistical
linkages between regions. The complexities of
such analyses and the power of this approach can
best be appreciated by looking at an example.Consider propylene in the US Gulf Coast (USGC).
The price of propylene over the past decade
has varied signicantly, driven by increasing oil
prices, rening yield shifts, changing demand
patterns, and more recently, the shift away from
naphtha cracking in the United States. Our
microeconomics-based research has shown that
over this period, propylene’s price has moved
between three pricing mechanisms: its alkylation

8/18/2019 McK on Chemicals Using Microeconomics Guide Investments Petrochemicals
http://slidepdf.com/reader/full/mck-on-chemicals-using-microeconomics-guide-investments-petrochemicals 4/13
49Using microeconomics to guide investments in petrochemicals
value, its netback from polypropylene (PP)
when PP is priced at parity to high-density poly-
ethylene (HDPE), and its netback from PP
when PP is priced at parity to higher-priced resins
like polystyrene (PS).
Two main developments drove the switches
between price mechanisms. Historically,
the USGC propylene price had been linked to its
alkylation value. But when rising oil prices inthe mid 2000s pushed the alkylation value higher,
the propylene price detached from this pricing
mechanism. The marginal use of propylene
instead became PP substituting for HDPE, thus
establishing the new pricing level. By 2010,
the US propylene market had reached a major
tipping point, becoming tight as propylene
demand continued to grow faster than supply. In
the new tight market, propylene moved up the
value ladder to a higher rung, to the point
where its price is being set by PP competing in
certain applications with PS (Exhibit 1).
Looking to the future, all the aforementioned
drivers of propylene supply and demand remain
relevant, and therefore any of these price
mechanisms are possible. In addition, two new
possibilities emerge. New propane dehydro-genation (PDH) units must be built in the United
States to maintain adequate supply, and thus
long-term average propylene prices may settle close
to full cost (cash cost plus reinvestment) of
new US PDH units. Another possibility is that
US propylene prices could end up becoming
linked with Asian propylene prices through PP or
propylene trade—with Asian propylene prices
Exhibit 1
Alkylation value1
PE cap on PP2
PS cap on PP2
1998–2005 average 2006–09 average 2010–11 average
Propylene’s price in the United States has shifted
across various price mechanisms.
1The alkylation value shown here includes purification/transport cost to be comparable with price for polymer-grade propylene.2Maximum price of polymer-grade propylene before polypropylene (PP) cost exceeds polyethylene (PE) or polystyrene (PS) price.These price mechanisms occur when the propylene supply is tight and its price rises to the highest price point where propylenedemand declines to the point where it balances with supply. The PE cap on PP fell below alkylation value after 2005 primarily due tothe microeconomic effects of higher oil prices.
Source: CMAI; McKinsey analysis
Polymer-grade propylene price vs alternative price mechanisms,$ per metric ton of polymer-grade propylene
490
490
590
790
1,160
1,070
1,280
1,280
1,010
1,500
1,060 1,450
Primary price mechanismduring the time period
Price of polymer-grade propylene(net of discounts)

8/18/2019 McK on Chemicals Using Microeconomics Guide Investments Petrochemicals
http://slidepdf.com/reader/full/mck-on-chemicals-using-microeconomics-guide-investments-petrochemicals 5/13
50 McKinsey on Chemicals Spring 2012
set by local mechanisms similar to the ones
described for the United States above.
Therefore, any assessment of future prices
of USGC propylene will have to take all these
factors into account. Simply using historical
price relationships to predict propylene prices
is inadequate and could lead to signi-
cant errors.
Propylene is only one of several examples:
our research suggests that many other
petrochemical chains—for example, chlor-alkali,
methanol, nitrogen, aromatics, and many
thermoplastic polymers—could see dramatic
changes in pricing mechanisms as a result
of various similar discontinuities.
Once the microeconomic building blocks are in
place, scenarios are constructed based on variable
ranges that are microeconomically reason-able even if they have no basis in history. Margin-
outlook “heat maps” are then developed to
understand returns and identify those scenarios
under which there is a substantial risk, so
that the appropriate mitigation actions can be
taken to minimize possible downsides.
It should be stressed that no amount of modeling
is a substitute for sound managerial judgment.
Tools like the heat map can generate a fact base
for a detailed discussion, but the fact base
should only be considered an a id in decision
making, rather than a denitive conclusionor recommendation in itself.
Putting the approach to work:
A case study
The application of the microeconomic approach
is best explained by presenting an example.
We describe here the highly topical case of an
investment analysis for a hypothetical
greeneld ethane-fed ethylene cracker and
polyethylene complex in the United States.
As recently as three years ago, conventional wis-
dom suggested that it was unlikely that a
greeneld world-scale ethylene cracker would

8/18/2019 McK on Chemicals Using Microeconomics Guide Investments Petrochemicals
http://slidepdf.com/reader/full/mck-on-chemicals-using-microeconomics-guide-investments-petrochemicals 6/13
51Using microeconomics to guide investments in petrochemicals
ever be built again in the United States. However,
the discoveries of abundant ethane-containing
shale gas have now made US ethane-fed crackersamong the most cost-competitive in the world
(Exhibit 2).
Not surprisingly, a number of companies have
announced ethane-based cracker projects.
The key question that industry players are asking
is, will this apparent “sure thing” hold up
across the life of the new crackers—a life that
usually lasts longer than 20 years?
The following describes how we used a micro-
economic lens to create scenarios, and then assess
margin outlooks under these scenarios, to aidin making the investment decision.
The price side
We assume that US ethylene prices will be linked
to global ethylene prices via derivative trade ows,
since the United States is expected to have
signicantly more ethylene capacity than demand
as ethane-cracking capacity is added in North
America. What will the long-term average price
Exhibit 2
1,500
1,000
500
0
1,500
1,000
500
0
0 20,000 40,000 60,000 80,000 100,000 120,000 140,000 160,000 180,00
0 20,000 40,000 60,000 80,000 100,000 120,000 140,000 160,000 180,00
Ethylene cash cost curve: $100 per barrel, 2020 capacity, $ per metric ton, plant gate
How US crackers would be positioned with US ethaneat historical naphtha-cracker-arbitrage pricing
Effective capacity, KTA 1
Effective capacity, KTA 1
How US crackers would be positionedwith US ethane at reduced-yields pricing,reflecting excess ethane conditions
Middle East low-price ethane
Middle East low-price ethane
Most US crackers shift lefton the global cost curve
Canada ethane
Canadaethane
Excess ethane conditions in the US dramatically
improve the competitiveness of US ethylene.
1Thousand metric tons per annum.
Middle East/ Africa
GreaterEurope
Asia (excludinChina)
China Americas

8/18/2019 McK on Chemicals Using Microeconomics Guide Investments Petrochemicals
http://slidepdf.com/reader/full/mck-on-chemicals-using-microeconomics-guide-investments-petrochemicals 7/13
52 McKinsey on Chemicals Spring 2012
of ethylene be? By 2020, global demand is likely
to be 45 million metric tons per year higher
than the current demand of 128 million metric
tons per year. New low-cost supply sources
(including new US ethane-fed crackers) will only
cover part of that requirement, and new
naphtha crackers will also be needed to meet
demand. Building in China is the most cost-
effective high-volume option for new naphtha
crackers, positioning these plants as theglobal long-term price setter for ethylene and
derivatives (Exhibit 3).
For investors to be incentivized to build new
naphtha crackers in China, the price of ethylene
has to be high enough for them to be able to
earn their cost of capital and a satisfactory return.
In the long run, therefore, we believe that
the full cost (dened as cash cost plus the margin
required for capital recovery) of building
a new naphtha cracker and derivative plants in
China will set the through-cycle average
price of ethylene and derivatives in China—and by extension, price levels worldwide. The
major drivers of China’s full cost are capital
Exhibit 3
1,500
1,000
500
00 5 10 15 20
920
1,080
1,150
1,170 1,170 1,180
1,470
25 30 35 40 45 50 55 60 65 70 75 80 85 90
Full cost (including capital recovery)for potential new sources of ethylene,$ per metric ton
Cumulative potential new ethylene supply fromvarious sources, million metric tons per year
Approximate new capacity required
to meet demand in 2020
Non-economic/ other
Middle East(ME) ethane
CTO1 China
Russia E/P2
US ethane
ME P/N3 China P/N3
Other non-China P/N3
The ‘full cost’ cost curve suggests that Chinese naphtha crackers
will be required to meet global ethylene demand.
1Coal to olefins.2Ethane/propane.3Propane/naphtha.
Required margin
Cash cost

8/18/2019 McK on Chemicals Using Microeconomics Guide Investments Petrochemicals
http://slidepdf.com/reader/full/mck-on-chemicals-using-microeconomics-guide-investments-petrochemicals 8/13
53Using microeconomics to guide investments in petrochemicals
costs, the price of naphtha (related to oil prices),
and credits from major by-products such as
benzene, propylene, and butadiene, which wenow examine in turn.
Our research suggests that capital costs today
for chemical plants in China can be 10 to
50 percent lower than those for equivalent plants
in the West—the greater the local content, the
greater the savings. Whether China will maintain
its cost advantage over the next 20 years or
lose it as living standards rise is an open question.
But it is one that can be addressed by using
scenarios to ascertain whether this uncertainty isa major factor in the attractiveness of a new
US cracker investment.
The prices of oil, and by extension, naphtha are
also highly uncertain, since they are affected
by macroeconomic and politica l factors as well as
cost. A range of prices can be used for scenario
modeling, taking as a starting point an oil price of
$80 to $100 per barrel,1 which we believe
represents the full cost of new crude-oil volumes.
For by-products, we will focus our discussion
on propylene and butadiene, the price levels of
which can have a major impact on ethylene
pricing. This is because naphtha-based ethylene
crackers generate substantial quantities of
by-products, and the prices the producer receives
for those by-products inuence the price
it needs from ethylene to reach a target return.
Hence, if by-product prices are higher,
the long-term price of ethylene—and thus
polyethylene—can be lower.
As we described in our earlier discussion of
propylene, forecasts suggest that demand
for propylene will outstrip supply from traditional
production routes and is likely to require
on-purpose production in the future, using PDH
plants. The same is true for butadiene, also
using dehydrogenation. In both cases, these could
become pricing mechanisms, and so we have
included them in the margin models for Chinese
and US crackers.
The models also incorporate a second possible
future price mechanism: the potential for prices
of both products to rise substantially, to
substitution-based price levels. For example, in
China, propylene prices have risen to a ceiling
set by polypropylene cost, reaching parity with
polyethylene price while propylene prices are
set as a netback from polypropylene.
The cost side
Moving to the cost side of the equation, we will focus on feedstock costs, specically ethane,
for the purpose of simplicity.
From the late 1980s through 2007, the US ethane
price usually equilibrated at the level where
exible feed (ex) crackers were indif ferent to
using ethane or naphtha at design yields and
throughputs, referred to as the “design yields”
price. With the surplus of ethane from shale
In the long run, the full cost of building a naphtha
cracker in China will set the through-cycle average
price of ethylene worldwide
1 This gure is calculated
in today’s dollars, plus
future ination.
8/18/2019 McK on Chemicals Using Microeconomics Guide Investments Petrochemicals
http://slidepdf.com/reader/full/mck-on-chemicals-using-microeconomics-guide-investments-petrochemicals 9/13
54 McKinsey on Chemicals Spring 2012
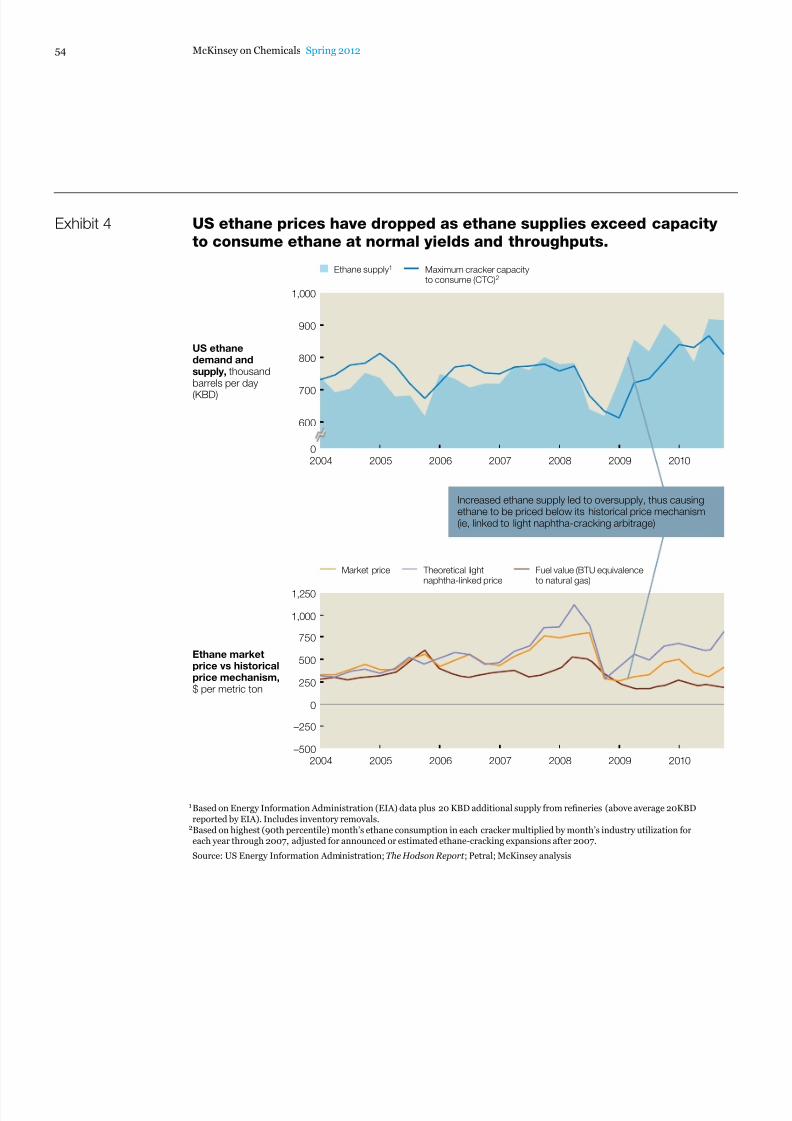
Exhibit 4 US ethane prices have dropped as ethane supplies exceed capacity
to consume ethane at normal yields and throughputs.
1Based on Energy Information Administration (EIA) data plus 20 KBD additional supply from refineries (above average 20KBDreported by EIA). Includes inventory removals.
2Based on highest (90th percentile) month’s ethane consumption in each cracker multiplied by month’s industry utilization foreach year through 2007, adjusted for announced or estimated ethane-cracking expansions after 2007.
Source: US Energy Information Administration; The Hodson Report ; Petral; McKinsey analysis
US ethanedemand andsupply, thousandbarrels per day
(KBD)
Increased ethane supply led to oversupply, thus causingethane to be priced below its historical price mechanism(ie, linked to light naphtha-cracking arbitrage)
Ethane marketprice vs historicalprice mechanism,$ per metric ton
1,000
900
800
700
600
0
1,250
1,000
750
250
500
–250
–500
0
2004 2005 2006 2007 2008 2010
2004 2005 2006 2007 2008 2009 2010
Maximum cracker capacityto consume (CTC)2
Ethane supply1
2009
Market price Theoretical lightnaphtha-linked price
Fuel value (BTU equivalenceto natural gas)
8/18/2019 McK on Chemicals Using Microeconomics Guide Investments Petrochemicals
http://slidepdf.com/reader/full/mck-on-chemicals-using-microeconomics-guide-investments-petrochemicals 10/13
55Using microeconomics to guide investments in petrochemicals
gas, however, ethane supply now exceeds the
capacity to consume it all in crackers at design
conditions (Exhibit 4). As a result, ethane
prices have declined to the point where cracker
operators can justify forcing in the excess
ethane despite seeing lower ethylene yields and
production rates from the ethane, resulting
in the “reduced yields” price. And with the
prospect of additional supplies of ethane arriving
in the market before sufcient new crackercapacity is built to consume them, ethane’s price
could drop further—all the way to a oor set
by fuel value, that is, equivalent to the price of
natural gas on a British-thermal-unit basis.
Eventually, enough cracking capacity could
be built to consume the available ethane supplies,
leading to a rise in ethane prices. But the
price might not return all the way up to the “design
yields” price of ethane competing with naphtha.
With a ll the new ethylene capacity, the United
States will have to continue to export ethylene
derivatives to Asia. Because of this, ethane prices
wil l have to stay at or below the level where
US crackers consuming ethane (both crackers that
consume 100 percent ethane and crackers
that consume a mix of ethane, naphtha, and other
hydrocarbons) can compete in Asia.
Each of these future ethane price levels could
prevail for extended periods of time over the lifeof the project. We have therefore modeled the
three cases described above: rst, at fuel value;
second, at reduced-yield conditions (that is,
at a discount to naphtha-cracking arbitrage); and
third, at Asia netback.
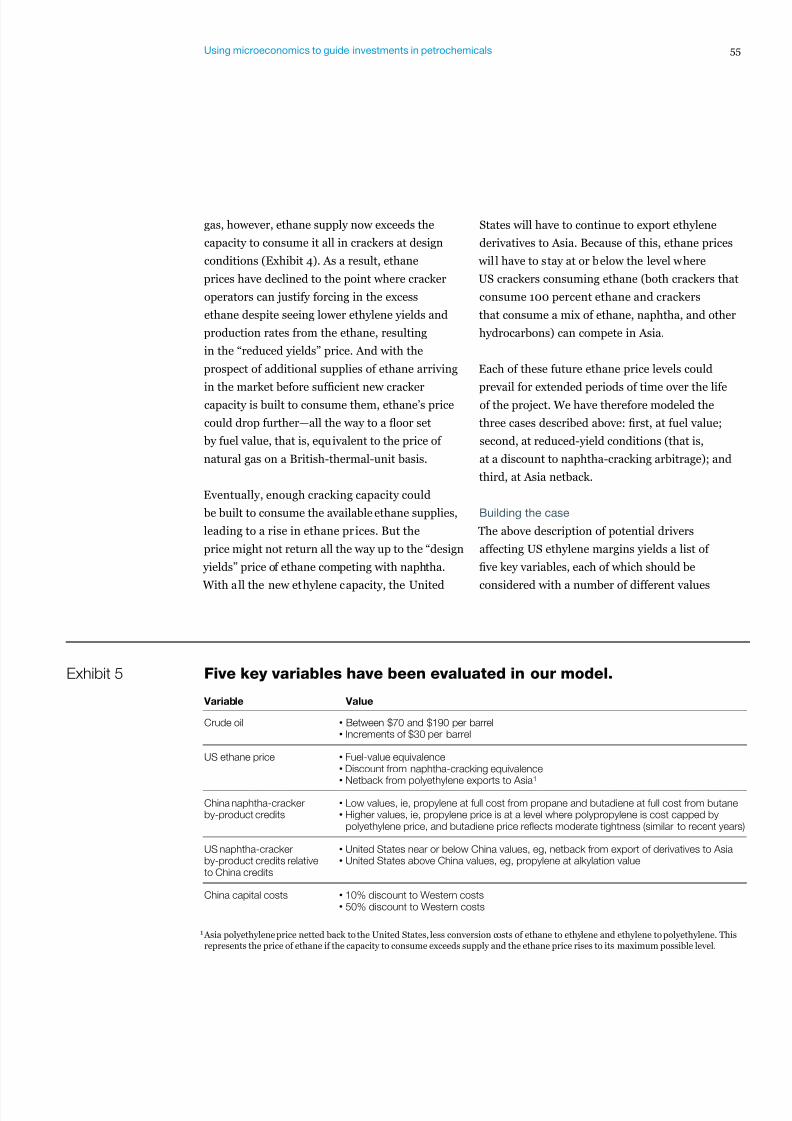
Building the case
The above description of potential drivers
affecting US ethylene margins yields a list of
ve key variables, each of which should be
considered with a number of different values
Exhibit 5
• Between $70 and $190 per barrel• Increments of $30 per barrel
Crude oil
• Fuel-value equivalence• Discount from naphtha-cracking equivalence•
Netback from polyethylene exports to Asia
1
US ethane price
• 10% discount to Western costs• 50% discount to Western costs
China capital costs
• Low values, ie, propylene at full cost from propane and butadiene at full cost from butane• Higher values, ie, propylene price is at a level where polypropylene is cost capped by
polyethylene price, and butadiene price reflects moderate tightness (similar to recent years
China naphtha-crackerby-product credits
• United States near or below China values, eg, netback from export of derivatives to Asia• United States above China values, eg, propylene at alkylation value
US naphtha-crackerby-product credits relativeto China credits
Variable Value
Five key variables have been evaluated in our model.
1 Asia polyethylene price netted back to the United States, less conversion costs of ethane to ethylene and ethylene to polyethylene. Thisrepresents the price of ethane if the capacity to consume exceeds supply and the ethane price rises to its maximum possible level.
8/18/2019 McK on Chemicals Using Microeconomics Guide Investments Petrochemicals
http://slidepdf.com/reader/full/mck-on-chemicals-using-microeconomics-guide-investments-petrochemicals 11/13
56 McKinsey on Chemicals Spring 2012
(Exhibit 5). The analysis can be further expanded
to include additional important variables
such as natural-gas pricing mechanisms, naphtha
pricing mechanisms, or gasoline-pool market
dynamics. It would, however, raise the number of
scenarios to several hundred, too many to
explore in this paper but manageable for a full
project assessment using this approach.
The variables list, in combination with an
approach that generates the consistent
microeconomics-driven prices series, is then
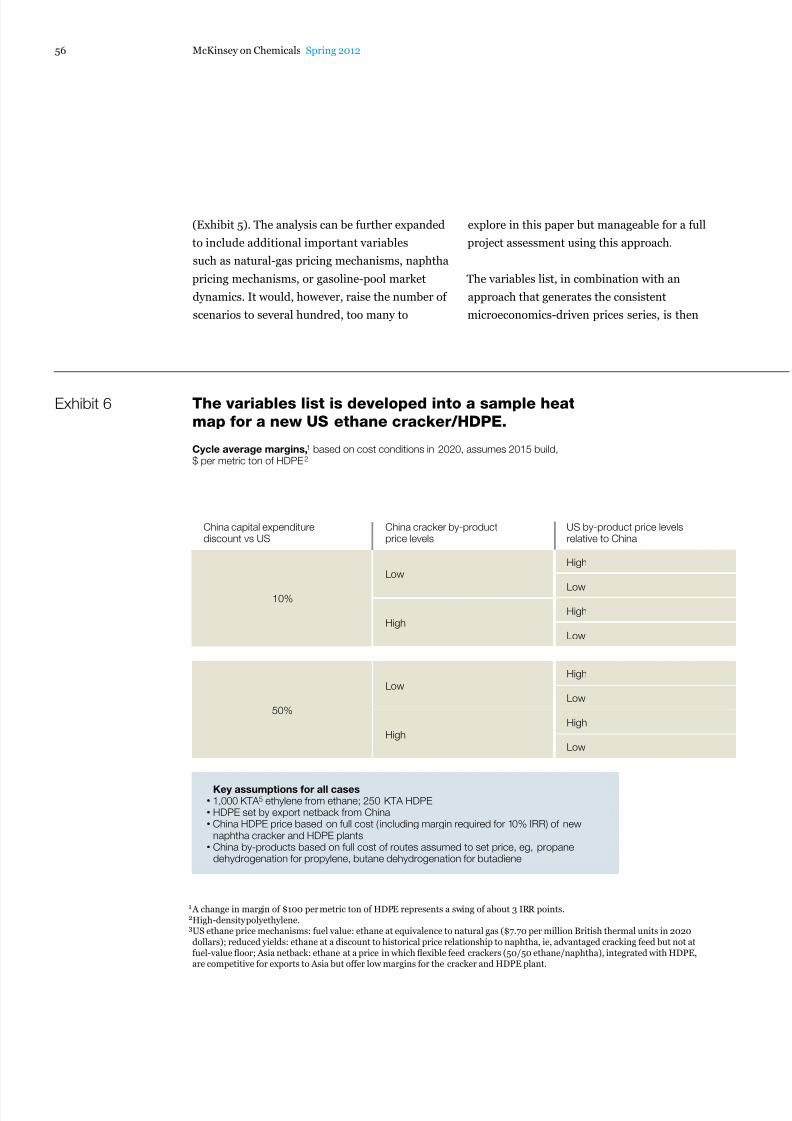
Exhibit 6
50%
Low
High
The variables list is developed into a sample heat
map for a new US ethane cracker/HDPE.
1 A change in margin of $100 per metric ton of HDPE represents a swing of about 3 IRR points.2High-density polyethylene.3US ethane price mechanisms: fuel value: ethane at equivalence to natural gas ($7.70 per million British thermal units in 2020dollars); reduced yields: ethane at a discount to historical price relationship to naphtha, ie, advantaged cracking feed but not atfuel-value floor; Asia netback: ethane at a price in which flexible feed crackers (50/50 ethane/naphtha), integrated with HDPE,are competitive for exports to Asia but offer low margins for the cracker and HDPE plant.
Cycle average margins,1 based on cost conditions in 2020, assumes 2015 build,$ per metric ton of HDPE2
China cracker by-productprice levels
Low
High
Low
High
Low
High
Low
High
US by-product price levelsrelative to China
China capital expenditurediscount vs US
Low
10%
High
Key assumptions for all cases• 1,000 KTA 5 ethylene from ethane; 250 KTA HDPE• HDPE set by export netback from China• China HDPE price based on full cost ( including margin required for 10% IRR) of new
naphtha cracker and HDPE plants• China by-products based on full cost of routes assumed to set price, eg, propane
dehydrogenation for propylene, butane dehydrogenation for butadiene

8/18/2019 McK on Chemicals Using Microeconomics Guide Investments Petrochemicals
http://slidepdf.com/reader/full/mck-on-chemicals-using-microeconomics-guide-investments-petrochemicals 12/13
57Using microeconomics to guide investments in petrochemicals
used to develop margin outlooks, assembled here
as a heat map (Exhibit 6). This more detailed
examination of the project yields important addi-
tional insights that a conventional analysis
would not provide. For example, under a scenario
of oil priced at $100 per barrel and reduced-
yield ethane in the hypothetical case we are
considering, margins on the projected HDPE plant
could vary by over $380 per ton, equivalent
to more than 10 percentage points of the internal
rate of return (IRR), as other variables change.
This makes clear that the impact of the by-products
1,720
1,720
1,383
1,375
1,369
1,369
1,082
1,074
1,018
1,018
780
773471
476
666
667
170
171
314
315
4Internal rate of return, based on using this (nominal dollars, no inflation) for the life of the project.5Thousand metric tons per annum.
US ethane price3
Crude oil (2020 dollars), $ per barrel
Scenario 1: fuel value
70 100
1,910
1,910
1,531
1,519
1,560
1,558
1,228
1,218
1,208
1,206
923
916615
619
854
857
314
315
502
503
130 160 190 70 100
1,187
1,182
930
826
1,025
1,013
795
696
861
841
653
571453
503
670
697
272
274
451
453
130 160 190 70 100
145
154
299
508
122
145
292
466
104
142
291
414349
279
140
88
283
264
136
117
130 160 190
980
980
759
689
819
819
622
557
655
653
488
427310
359
482
491
128
130
262
264
Crude oil (2020 dollars), $ per barrel
Scenario 2: reduced yields
368
368
494
638
345
468
602
327 345
330
435
587493
423
328
311
427
408
324
305
Crude oil (2020 dollars), $ per barrel
Scenario 3: Asia netback
Margins in 2020exceed level neededfor 30% IRR4
Margins in 2020would provide20–30% IRR
Margins in 2020would provide10–20% IRR
Margins in 2020 lessthan level needed for10% IRR
ILLUSTRATIVE

8/18/2019 McK on Chemicals Using Microeconomics Guide Investments Petrochemicals
http://slidepdf.com/reader/full/mck-on-chemicals-using-microeconomics-guide-investments-petrochemicals 13/13
58 McKinsey on Chemicals Spring 2012
and the capital productivity on the overall
project economics could be signicant. Had the
prospective sponsor of a new cracker followed
the traditional project-evaluation approach and
considered only recent and historical through-
cycle ethane-cracking margins or spreads between
US ethane and naphtha, its analysis would have
completely missed the other crucial variables and
produced misleading results.
In light of all these considerations, is the project
still a sure thing? In the illustrative case we are
considering, only if it can move ahead quickly and
outpace competitors. If enough ethane crackers
are built so that ethane demand catches up with
supply, ethane prices are likely to rise to an
Asia-naphtha-linked price mechanism, and IRR
could fall to below 10 percent. To be condent
of longer-term returns in this scenario, investors
must conrm favorable long-term price expec-
tations for propylene and butadiene coproducts in Asia and in the United States. Under a scenario
of Asia-netback-ethane price, oil at $100 per barrel,
and a 10 percent China capital-expenditure
discount, these coproduct factors could drive
differences in margins on the HDPE plant
of as much as $260 per ton, representing an IRR
swing of about seven points.
The heat map and underlying data can be used by
petrochemical companies in several ways. First,
the analysis informs the investor of the conditionsrequired to achieve attractive margins and
forces a debate about whether these conditions
are realistic, rather than blindly using the
off-the-shelf forecasts available in the industry.
Second, the analysis allows the investor to
understand which combinations of variables have
the greatest impact on project economics and
to focus on designing risk-mitigation approaches
accordingly. Finally, the analysis provides a
fundamentals-based price-and-margin-forecast
database under various combinations of input variables. The investor can use this database to
build a cash-ow model in which input vari-
ables (and therefore price and margin forecasts)
are changing over time in a way that more
accurately reects the investor’s view of how the
petrochemicals world will evolve, rather than
using generic forecasts.
Players who have used these tools develop agreater appreciation for the risks they face and
better understand how industry changes will
affect their long-term prospects. We have seen
companies that adopt this approach gain the
condence necessary to make step-out decisions,
such as adopting new production routes or
feedstocks—decisions that represent signicant
changes in direction and that position the
company to be more competitive in the new era
of petrochemicals.
Scott Andre ([email protected]) is a senior practice expert in McKinsey’s Houston office, where Thomas
Hundertmark ([email protected]) is a principal and Rajeev Rao ([email protected]) is
an associate principal. Copyright © 2012 McKinsey & Company. All rights reserved.