


Languages
Pages
Legal


2DBIS
Outline
• Speaker Introduction• Motivation for session modification• Examples I have used it for• Overview of Oracle features relating to session tracing• How to exploit these features - overview• Example/Demo
3DBIS
Speaker Introduction
• Oracle Corp Consultant 1989-1991– Performance tuning
• Co-founder of DBCORP (1991-2002)– DBA products, Remote DBA Services– Performance tuning services
• COGNICASE acquired DBCORP in 2002, CGI acquired COGNICASE in 2003
• Database Information Systems Inc. (April 2004)• Past President of Calgary Oracle Users Group• Current CIPS DBA SIG Lead• Several IOUW/OOW presentations

4DBIS
Motivation
• The Problem is:– Need the ability to pinpoint tracing of a session by some set of
criteria – automatically, often in PRODUCTION– Need to change the Oracle behavior for SOME SPECIFIC sessions
in production– Do it with ease and flexibility, consistent with new and upcoming
Oracle functionality

5DBIS
Motivation
• Compounding The Problem is:– Purchased applications often cannot see, let alone change the
source code– Application (both purchased and in-house) are not instrumented– Three-tier architecture and connection pooling makes in difficult to
determine end-to-end access paths– Production change control often dictates no code changes (but data
changes easier to justify)

6DBIS
For Example –Tracing Focus
• Problem:– Need to trace production job launched by ‘group’ user_name
running production code (may run tonight at 2am local time; only if other stuff happens)
• Solution– Set up automation for that USER and PROGRAM/TERMINAL to
issue ALTER SESSION SET SQL_TRACE=TRUE

7DBIS
For Example – Diagnostics Events
• Problem:– Production look-up using HUGE amount of CPU. Vendor claims
not possible; explain looks ok INDEX RANGE SCAN on Primary Key Index; but LIO >> expected
– Unable to duplicate in Vendor or Test environment
• Solution– Set up automation for that PROGRAM to issue “ALTER SESSION
and SET events ‘10046 trace name context forever, level 12’”– Bind variable data reveals data type mismatch on 3rd column of 7
column PK; range scan scope was 2000 blocks instead of 20– Trace file given to vendor as proof

8DBIS
For Example – Custom Behavior
• Problem:– Production Load batch job needed huge SORT/HASH area size
to optimize (Version 8.1.7), 350 Users online with same Oracle USERNAME; code untouchable
• Solution– Set up automation for that OS user for BATCH to issue
“ALTER SESSION SET SORT_AREA_SIZE=1000000000”

9DBIS
For Example - Custom Behavior
• Problem:– Production SQL statement SQL PLAN needed to change
(index->full table scan) for one ‘class’ of user of a program due to data skew
– Other classes of user and programs need to use the index
• Solution– Used Stored Outlines for that user
• Create outline for SQL with/without HINT• Switch Outlines
– Set up automation for that program to• ALTER SESSION SET USE_STORED_OUTLINES = TRUE;

10DBIS
For Example – Application Instrumentation
• Problem:– For service level management, need to tie Application
Components to specific sessions
• Solutions– Login trigger to query application tables to set MODULE,
ACTION and CLIENT_INFO using DBMS_APPLICATION_INFO
– Poll v$session_longops to tie long running operations with Application components
– Create month-end by component tracking capability

11DBIS
Oracle features supporting tracing
• DBMS_MONITOR – Enable/disable ‘statistics’ for client_id or service/module/action– Enable/disable trace for session, client_id or service/module/action
• DBMS_SESSION– Set identifier (client_id)– Set Context / SQL_TRACE
• DBMS_APPLICATION_INFO– SET<MODULE|ACTION|CLIENT_IDENTIFIER>– OCI_ATTR_<MODULE|ACTION|CLIENT_IDENTIFIER>
• Alter session• Events• Trace Files and Alert Log• Trace Analysis (trcsess)• Database procedures and triggers

12DBIS
DBMS_MONITOR• ‘10g’ way to enable tracing
– oradebug– dbms_system.set_ev(&sid, &serial, 10046, 12, '');– dbms_session.sql_trace– DBMS_SUPPORT.START_TRACE_IN_SESSION( sid , 0, waits=>TRUE,
binds=>TRUE )• Trace Enabling
– Enabled for all instances and persists across restarts– SERV_MOD_ACT is a hierarchy – Session requires session_id and serial#
– <CLIENT_ID|SERV_MOD_ACT|SESSION>_TRACE_<ENABLE|DISABLE>• Statistics Enabling
– New V$CLIENT_STATS, V$SERV_MOD_ACT_STATS views
– <CLIENT_ID|SERV_MOD_ACT|SESSION>_STAT_<ENABLE|DISABLE>

13DBIS
DBMS_MONITOR
• Issues with 10g features of DBMS_MONITORING– SERVICE definition and management
• Default SYS$USERS• Select * from v$services• DBMS_SERVICE used to manage
– CLIENT_ID management• Default NULL, must be set by APPLICATION (OEM sets it)• Set by DBMS_SESSION – any 64-byte string
– Can’t distinguish by these ‘session’ attributes• PROGRAM, TERMINAL, SERVER,MACHINE, OS_USER, CLIENT_INFO
– Are your applications instrumented to use this?

14DBIS
DBMS_SESSION
• Version 8+– dbms_session.set_context(namespace, attribute, value /*10g*/, username, client_id)
• Version 9+– dbms_session.set_identifier(client_id varchar2)
• Used to communicate via context in VPD• Required for statistic aggregation in 10g
DBMS_MONITOR in v$client_stats• Are your applications instrumented to use this?
15DBIS
DBMS_APPLICATION_INFO
• Version 8+– READ_CLIENT_INFO– READ_MODULE– SET_ACTION– SET_CLIENT_INFO– SET_MODULE– SET_SESSION_LONGOPS
• Module - high level application component• Action – lower level procedure/routine• Essential Application Instrumentation
– Tied into v$session; v$sqlarea – Oracle trace files (i.e. event 10046)
• Are you applications instrumented for this?

16DBIS
DBMS_APPLICATION_INFO
• New in Version 10: OCI Attributes– OCI_ATTR_MODULE– OCI_ATTR_ACTION– OCI_ATTR_CLIENT_IDENTIFIER
• Enable OCI programs to include inside database calls (i.e. no additional calls/overhead required)
• Are your applications instrumented for this?

17DBIS
Alter Session
• Used to change characteristics of the current session
ALTER SESSION { ADVISE { COMMIT | ROLLBACK | NOTHING } | CLOSE DATABASE LINK dblink | { ENABLE | DISABLE }
COMMIT IN PROCEDURE | { ENABLE | DISABLE | FORCE } PARALLEL { DML | DDL |
QUERY } [ PARALLEL integer ] | { ENABLE RESUMABLE [ TIMEOUT integer ] [ NAME string ] |
DISABLE RESUMABLE } | alter_session_set_clause } ;

18DBIS
Alter Session
• Set ClauseSET parameter_name = parameter_value
[ parameter_name = parameter_value ]... [ COMMENT = 'text' ]

19DBIS
Alter Session Initialization Parameters – NLS parameters (15 in
10g)– Optimizer options
• OPTIMIZER_DYNAMIC_SAMPLING • OPTIMIZER_FEATURES_ENABLE • OPTIMIZER_INDEX_CACHING • OPTIMIZER_INDEX_COST_ADJ • OPTIMIZER_MODE
– Session behavior• PARALLEL_INSTANCE_GROUP • PARALLEL_MIN_PERCENT • PLSQL_CODE_TYPE • PLSQL_COMPILER_FLAGS • PLSQL_DEBUG • PLSQL_OPTIMIZE_LEVEL • PLSQL_V2_COMPATIBILITY • PLSQL_WARNINGS
• OBJECT_CACHE_MAX_SIZE_PERCENT• OBJECT_CACHE_OPTIMAL_SIZE • QUERY_REWRITE_ENABLED• QUERY_REWRITE_INTEGRITY • STAR_TRANSFORMATION_ENABLED• OLAP_PAGE_POOL_SIZE • OSM_POWER_LIMIT
• REMOTE_DEPENDENCIES_MOD • RESUMABLE_TIMEOUT • SESSION_CACHED_CURSORS• SKIP_UNUSABLE_INDEXES • SORT_AREA_RETAINED_SIZE • SORT_AREA_SIZE• SQL_TRACE • SQLTUNE_CATEGORY • STATISTICS_LEVEL• TIMED_OS_STATISTICS• TIMED_STATISTICS• TRACEFILE_IDENTIFIER• WORKAREA_SIZE_POLICY

20DBIS
Alter Session Options
• Session Options– CONSTRAINTS– ISOLATION LEVEL– STORED_OULTLINES– TIME_ZONE– SKIP_UNUABLE_INDEXES– CURRENT_SCHEMA
• Lots of opportunity to change session behavior and in some cases ALTER SESSION is the only way
21DBIS
Events
• Setting an Event causes Oracle Kernel to do something specific to the event ID
• Usually causes Oracle to log/dump things to a trace file• Can be set for instance (alter system/init.ora/spfile) or
session (alter session)• Complete list can be browsed in the file
$ORACLE_HOME/rdbms/mesg/oraus.msg on Unix – Range 10000-10999 events used

22DBIS
Common Diagnostic Events
• Note: Various ‘levels’ can effect details captured
Event Description
10046,10241 SQL Trace, Remote SQL
10053 Optimizer Trace
10032,10033 Sort Activity
10248, 10249, 10257 MTS tracing
23DBIS
Oracle “Wait” Event 10046
• Oracle V7 instrumented to capture Kernel waits• v$sysstat and v$session_event are summarized views• Event 10046 level >3 causes trace file for each wait• “Idle” waits – not impacting response• “Non-idle” waits – component of response time
Response = Service + Wait
• Please refer to “Optimizing Oracle Performance” by Cary Millsap for an outstanding description of this event and its relevance

24DBIS
Setting Event 10046
• Setting the event– DBMS_MONITOR– DBMS_SUPPORT (see Metalink NOTE: 62294.1)
DBMS_SUPPORT.START_TRACE_IN_SESSION( sid , 0, waits=>TRUE, binds=>TRUE )
– ORADEBUG setorapid|event– DBMS_SYSTEM.SET_EV(sid,serial#,10046,level,’’)– Hotsos SPARKY
• Need to find session/serial# and issue call • Level 4 adds binds, 8 adds waits, 12 adds bothOrALTER SESSION SET EVENTS
'10046 trace name context forever, level 12'

25DBIS
Alert Log
• Alert_log– System wide information kept in background_dump_dest
directory usually called alertORACLE_SID.LOG– Application can write via PL/SQL call:
dbms_system.ksdwrt(2,:text_message)
– Handy for Application system wide messages and testing monitoring and other ‘fun’ stuff (GO_FAST=FALSE)
26DBIS
Trace files
• Trace_files– Process specific information kept in user_dump_directory
(foreground processes) called something like ORACLE_SID_ora_PROCESS#.trc)
– You can change the name of these files using (caution if connection pooling or have set 10046)
ALTER SESSION SET TRACE_IDENTIFIER=‘BRUCE’– You can also write to this file via:
DBMS_SYSTEM.KSDWRT(1,:text_message)

27DBIS
Trace File Analysis
• Background processes also have trace files in background_dump_dest
• Connection pooling effects trace file as many session share a single server process – trace files are marked with sid, serial#. You have to scrape a single session out– HINT: trcsess in Oracle 10g does it for you – even for Version 8i
& 9i trace files• Can be large (max_dumpfile_size)
– Worthwhile looking through and understanding
28DBIS
Trace Analysis Tools
• TKPROF– Summarizes SQL and waits– Lose some information (clock time, hash_value, module/action)
• Report summarizes data (missing wait times)

29DBIS
TKPROF Example********************************************************************************
SQL STATEMENT (OMITED TO PROTECT THE GUILTY)
call count cpu elapsed disk query current rows------- ------ -------- ---------- ---------- ---------- ---------- ----------Parse 1 0.00 0.00 0 0 0 0Execute 80 88.87 4808.33 122899 1837228 0 0Fetch 0 0.00 0.00 0 0 0 0------- ------ -------- ---------- ---------- ---------- ---------- ----------total 81 88.87 4808.33 122899 1837228 0 0
EXPLAIN PLAN
Elapsed times include waiting on following events: Event waited on Times Max. Wait Total Waited ---------------------------------------- Waited ---------- ------------ db file sequential read 122857 1.51 4734.60 latch free 22 0.06 0.09 db file scattered read 12 0.29 0.97 log file switch completion 6 0.46 0.72 log buffer space 4 0.08 0.17********************************************************************************

30DBIS
TKPROF ExampleRows Row Source Operation------- --------------------------------------------------- 0 UPDATE (cr=1837228 r=122899 w=0 time=4629619263 us) 0 TABLE ACCESS BY LOCAL INDEX ROWID TSETTLEMENT (cr=1837228 r=122899 w=0 time=4629618504 us)5226800 NESTED LOOPS (cr=1747539 r=33252 w=0 time=1858427726 us) 475440 VIEW (cr=36769 r=53 w=0 time=7252734 us) 475440 SORT UNIQUE (cr=36769 r=53 w=0 time=6852549 us) 475440 MERGE JOIN (cr=36769 r=53 w=0 time=4981792 us) 15848 SORT JOIN (cr=34289 r=0 w=0 time=565784 us) 15848 TABLE ACCESS BY INDEX ROWID TRETAILER_RUN_SITE_MAP (cr=34289 r=0 w=0 time=456506 us) 31776 NESTED LOOPS (cr=32571 r=0 w=0 time=395094 us) 15848 TABLE ACCESS BY INDEX ROWID TREQUEST_JOB_BATCH_ENTITY (cr=639 r=0 w=0 time=65275 us) 15848 INDEX RANGE SCAN RJBE_IDX01 (cr=381 r=0 w=0 time=23565 us)(object id 56182) 15848 INDEX RANGE SCAN RR_SITE_MAP_IDX01 (cr=31932 r=0 w=0 time=255699 us)(object id 57910) 475440 FILTER (cr=2480 r=53 w=0 time=4222833 us)1933456 SORT JOIN (cr=2480 r=53 w=0 time=3448926 us) 146080 TABLE ACCESS FULL TCALENDAR (cr=2480 r=53 w=0 time=1452529 us)4751280 PARTITION RANGE ITERATOR PARTITION: KEY KEY (cr=1710770 r=33199 w=0 time=1841836133 us)4751280 INDEX RANGE SCAN SETTLEMENT_NEW_LPUDX01 PARTITION: KEY KEY (cr=1710770 r=33199 w=0 time=1835972096
us)(object id 58770)

31DBIS
Trace Analysis Tools
• TRCA (PL/SQL See Metalink Note 22470.1)– Detailed view of trace file by CURSOR– Overhead executing– Report very long, but very detailed information avaiable

32DBIS
TRCA Example*********************************************************************************************T
RCANLZR.sql 115.9 NOTE:224270.1 2004-03-09 15:22:32 Trace Analyzer*********************************************************************************************TRACE_DIRECTORY..........: /ai01/oracle/admin/SETP/udump (ALIAS:UDUMP)TRACE_FILENAME...........: setp_j008_28232.trc (TRACE_ID:2)INCLUDE_SYS_COMMANDS.....: YES
INSTANCE_AND_RELEASE.... : SETP (ON CALDBP08) 9.2.0.4.0 (SUNOS - 64BIT)TRACE_SIZE...............: 30680184 BYTES (IN 432239 LINES)TRACED_INTERVAL..........: STARTED ON 2004-03-05 20:43:16.162, AND LASTED 32072.34 SECS
USER_ELAPSED_TIME........: 32072.34 SECSGAPS_WITH_NO_ACTIVITY....: 39.65EFFECTIVE_TRACED_INTERVAL: 32032.69
ACCOUNTED_CPU_TIME.......: 3887.70 SECS (TOTAL SERVICE TIME)ACCOUNTED_ELAPSED_TIME...: 64087.47 (RECURSIVE AND NON-RECURSIVE)
WAITED_NON-IDLE_TIME.....: 29967.58 SECSWAITED_IDLE_TIME.........: 0.00

33DBIS
TRCA ExampleSUMMARY OF CALLS BY USER (INTERNAL LAST) AND NON-RECURSIVE/RECURSIVE====================================================================
OVERALL TOTALS PER CALL FOR ALL RECURSIVE STATEMENTS FOR USER 26 (UNET_SYSTEM)
call count cpu elapsed disk query current rows misses------- --------- --------- --------- ------------ ------------ ------------ ------------ ---------Parse 40 0.00 3.16 0 0 0 0 3Execute 1016 3855.19 62744.12 774108 89963025 141445428 7081656 0Fetch 355 32.02 1338.04 30398 333318 0 285 0------- --------- --------- --------- ------------ ------------ ------------ ------------ ---------total 1411 3887.21 64085.32 804506 90296343 141445428 7081941 3
UMMARY OF WAITS BY USER (INTERNAL LAST) AND NON-RECURSIVE/RECURSIVE====================================================================Event Times Count Max. Total
Blockswaited on Waited Zero Time Wait Waited
Accessed----------------------------------------------------------------- --------- --------- --------- ---------
---------db file sequential read (single block scan)...................... 401975 0 4.76 23918.04
401975buffer busy waits (reason code 220).............................. 1163 0 3.15 3004.50
255860log file switch (checkpoint incomplete).......................... 2057 0 1.79 2040.79enqueue.......................................................... 168 0 3.01 174.76log buffer space................................................. 495 0 1.01 97.73log file switch completion....................................... 183 0 1.01 67.89
34DBIS
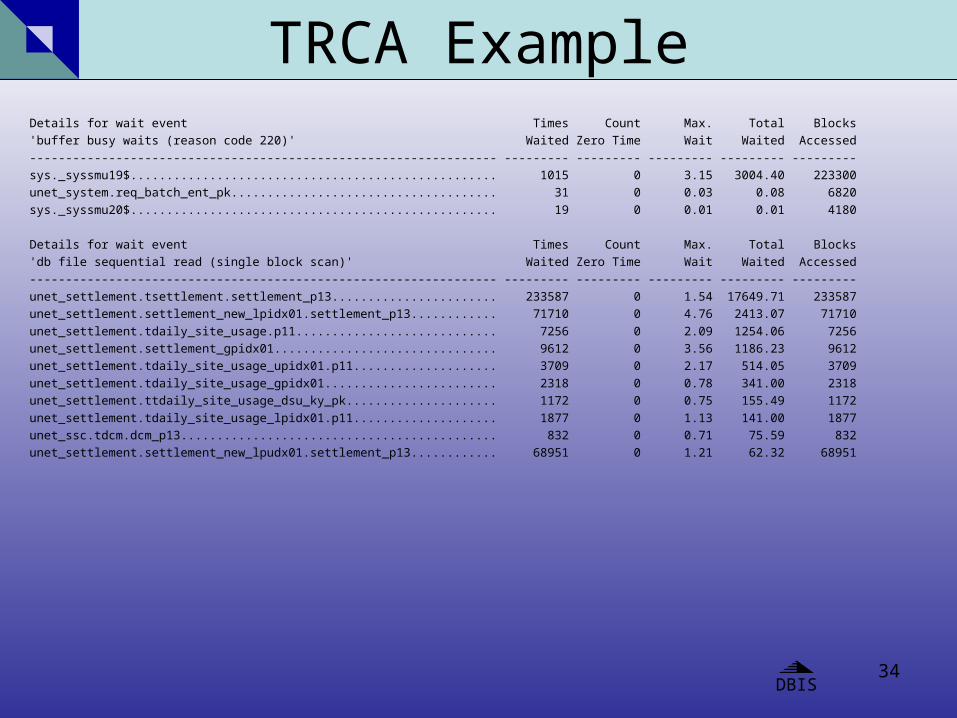
TRCA ExampleDetails for wait event Times Count Max. Total Blocks'buffer busy waits (reason code 220)' Waited Zero Time Wait Waited Accessed----------------------------------------------------------------- --------- --------- --------- --------- ---------sys._syssmu19$................................................... 1015 0 3.15 3004.40 223300unet_system.req_batch_ent_pk..................................... 31 0 0.03 0.08 6820sys._syssmu20$................................................... 19 0 0.01 0.01 4180
Details for wait event Times Count Max. Total Blocks'db file sequential read (single block scan)' Waited Zero Time Wait Waited Accessed----------------------------------------------------------------- --------- --------- --------- --------- ---------unet_settlement.tsettlement.settlement_p13....................... 233587 0 1.54 17649.71 233587unet_settlement.settlement_new_lpidx01.settlement_p13............ 71710 0 4.76 2413.07 71710unet_settlement.tdaily_site_usage.p11............................ 7256 0 2.09 1254.06 7256unet_settlement.settlement_gpidx01............................... 9612 0 3.56 1186.23 9612unet_settlement.tdaily_site_usage_upidx01.p11.................... 3709 0 2.17 514.05 3709unet_settlement.tdaily_site_usage_gpidx01........................ 2318 0 0.78 341.00 2318unet_settlement.ttdaily_site_usage_dsu_ky_pk..................... 1172 0 0.75 155.49 1172unet_settlement.tdaily_site_usage_lpidx01.p11.................... 1877 0 1.13 141.00 1877unet_ssc.tdcm.dcm_p13............................................ 832 0 0.71 75.59 832unet_settlement.settlement_new_lpudx01.settlement_p13............ 68951 0 1.21 62.32 68951

35DBIS
Trace Analysis Tools
• Hotsos Profiler– Done right!

36DBIS
Session Performance Info– V$ views that can be queried in real time
View Description
V$SESSION This view lists session information for each current session.
V$PROCESS This view contains information about the currently active processes
V$SESSION_EVENT This view lists information on waits for an event by a session
V$MYSTAT V$CLIENT_STATS, V$SERV_MOD_ACT_STATS
These view contains statistics on the current session, or aggregated statistics enable with DBMS_MONITOR.

37DBIS
Session Performance Dump
:::::::::::::::::::::::::Oracle User (Sid, Serial)/Status/Type ----> SYS (7,99) / ACTIVE / USERUnix User/ID/Machine (Terminal) --------> JUPITOR\bmccartn / 892 / WINDMILL\JUPITOR /
(JUPITOR)Logon Time -------------------------------> 2004-02-23/15:15:53Running Program --------------------------> sqlplusw.exeMemory Allocated (pga/uga/ttl) -----------> 475812 / 142472 / 618284Memory Ever Used (pga/uga/ttl) -----------> 475812 / 142472 / 618284Buffer Cache Hit Ratio -------------------> 81.17%Sort (Memory/Rows/Disk) ------------------> 23 / 322 / 0Table scans (long/short) -----------------> 0 / 6Table scans Rows/Blocks Retrieved --------> 0 / 0Table fetch By Rowid/Continued Row -------> 135 / 1Physical Reads/Writes --------------------> 90 / 0Consistent Gets/DB Block Gets ------------> 478 / 0Consistent Chgs/DB Block Chgs ------------> 0 / 0SQL*Net Roundtrips Client/Dblink ---------> 18 / 0SQL*Net Bytes Received Client/Dblink -----> 2780 / 0SQL*Net Bytes Sent Client/Dblink ---------> 12275 / 0Redo Size /Entries/Writes/Sycw/Time-------> 0 / 0 / 0 / 0 / 0Session Event Waits Timeouts Time Waited Average WaitSQL*Net message from client 18 0 216,282 12,016.000SQL*Net message to client 18 0 0 .000SQL*Net more data to client 3 0 0 .000control file sequential rea 2 0 2 1.000db file scattered read 1 0 0 .000db file sequential read 85 0 123 1.000
MYDUMPSTATS
38DBIS
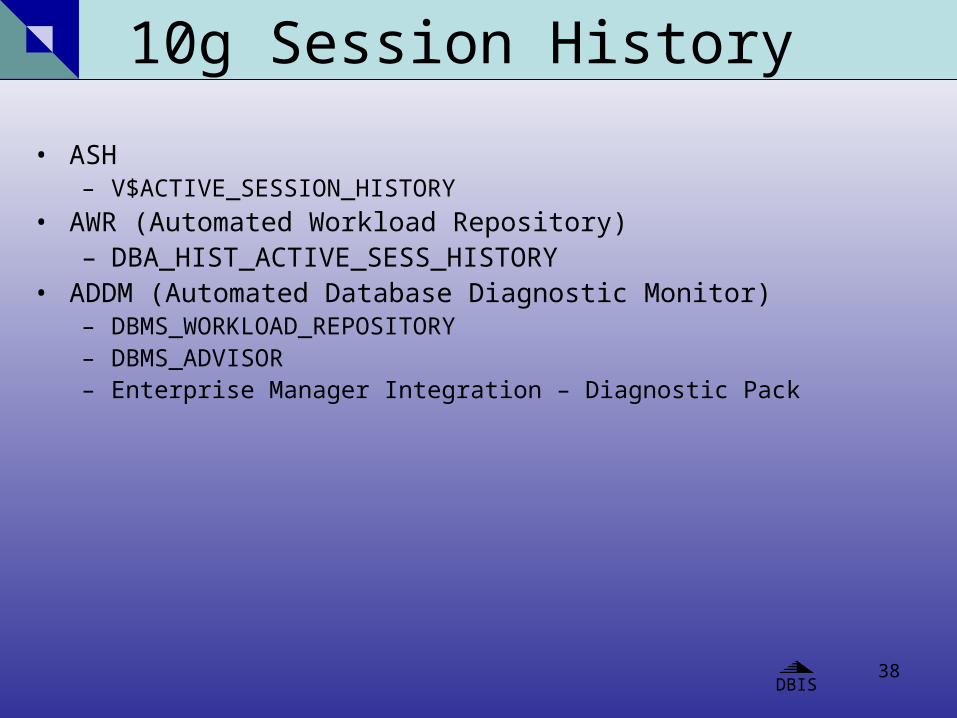
10g Session History
• ASH– V$ACTIVE_SESSION_HISTORY
• AWR (Automated Workload Repository)– DBA_HIST_ACTIVE_SESS_HISTORY
• ADDM (Automated Database Diagnostic Monitor)– DBMS_WORKLOAD_REPOSITORY– DBMS_ADVISOR– Enterprise Manager Integration – Diagnostic Pack
39DBIS
For the GUI-DBA
• Oracle Enterprise Manager “session detail” (Oracle 9)• EM Grid Control Oracle 10• TOAD – session browser• QUEST/EMBARCADERRO/BMC

40DBIS
Database procedures/ triggers
• Procedures– Stored PL/SQL logic
• Triggers– Data change triggers– Database triggers on events:
• SESERVERERROR• LOGON• LOGOFF• STARTUP• SHUTDOWN • SUSPEND

41DBIS
Other opportunities
• v$session_longops – Graphical representation in OEM
– Oracle uses for scans > 10K blks; Sorts and SQL Executions etc– Use DBMS_APPLICATION_INFO to instrument your ‘long’ operations –
batch jobs– Query and sample
select sid, serial#, message, to_char(start_time, 'Mon dd HH24:MI:SS') as Start_Time, (sofar/totalwork)*100 as "% Complete" from v$session_longops where LAST_UPDATE_TIME > sysdate - 1/24 and message like 'Table Scan%' and sofar < totalwork
– Polling table and saving data can provide wealth of information

42DBIS
Exploiting the features
• Basic Concept of Technique– Logon trigger reads table of alter session clauses based upon
session specific attributes matched in the table– Logoff trigger dumps session summary to trace file
• Extensions that are possible– Logon trigger integrates to application to extend instrumentation
via DBMS_APPLICATION_INFO– Trace file ‘mining’ extracts SQL failing services level and notifies
workflow– All kinds of goodies
43DBIS
Making it work
• Some installation objects– Can create a special user or use SYSTEM– Privileges
• MGMT_USER, SELECT_CATALOG_ROLE, RESOURCE• ADMINISTER_DATABASE_TRIGGER, ALTER SESSION• EXECUTE SYS.DBMS_SYSTEM, SELECT on some V_$ tables
– Objects• SESSION_MODIFICATION TABLE• APP_TRACE PACKAGE• LOGINTRIG TRIGGER

44DBIS
Logic flowUser Login
LOGONTRIGGERTRACEON
For Each Matching Row“ALTER SESSION”
Trace File
NORMALPROCESSING
LOGOFF DUMPSTATS
45DBIS
Installation
• Script download from www.dbinfosystems.com/news.htm
• Connects as SYS for grants• Create objects as any user

46DBIS
LOGINTRIGCREATE OR REPLACE TRIGGER LOGINTRIG AFTER LOGON ON DATABASE Begin
app_trace.session_mod;End;
• Notes – Invalidation causes login prevention– Alter trigger LOGINTRIG disable;– Need ADMINISTER DATABASE TRIGGER privilege or SYSDBA

47DBIS
SESSION_MODIFICATIONCREATE TABLE "SESSION_MODIFICATION"("USERNAME" VARCHAR2(30 BYTE), "SERVER" VARCHAR2(9 BYTE), "OSUSER" VARCHAR2(30 BYTE),"PROCESS" VARCHAR2(9 BYTE), "MACHINE" VARCHAR2(64 BYTE),"TERMINAL" VARCHAR2(30 BYTE), "PROGRAM" VARCHAR2(48 BYTE),"MODULE" VARCHAR2(48 BYTE), "CLIENT_INFO" VARCHAR2(64 BYTE),"CLIENT_IDENTIFIER" VARCHAR2(64 BYTE), "SERVICE_NAME" VARCHAR2(64 BYTE)"SET_CLAUSE" VARCHAR2(1024 BYTE), )
• Notes – Need USERNAME populated– SET_CLAUSE column applied to matching rows
INSERT INTO SESSION_MODIFICATION ( USERNAME, SERVER, OSUSER, PROCESS, MACHINE, TERMINAL,
PROGRAM, MODULE, CLIENT_INFO,CLIENT_IDENTIFIER, SERVICE_NAME, SET_CLAUSE ) VALUES ( 'SYSTEM', NULL, 'bmccartn', NULL, NULL, 'MOKEEFE', NULL, NULL, NULL,
NULL, NULL, 'SORT_AREA_SIZE=120000000');

48DBIS
PACKAGE APP_TRACEPROCEDURE MYDUMPSTATS /* called by LOGOFF TRIGGER - dumps to session trace */PROCEDURE SESSION_MOD /* called by LOGON TRIGGER - alter session commands*/PROCEDURE SET_TRACE /* turn on/off 10046 event */PROCEDURE TRACE_OUT /* debug trace file output */ Argument Name Type In/Out Default? ------------------------------ ----------------------- ------ -------- ITEXT VARCHAR2 IN IFLUSH BOOLEAN IN DEFAULT
• Notes – Use for application instrumentation
• Manages Trace output• DBMS_APPLICATION_INFO

49DBIS
Driving QuerySELECT m.USERNAME m_USERNAME, m.SERVER m_SERVER, m.OSUSER m_OSUSER, m.PROCESS m_PROCESS, m.MACHINE m_MACHINE, m.TERMINAL m_TERMINAL, m.PROGRAM m_PROGRAM, m.MODULE m_MODULE, m.CLIENT_INFO m_CLIENT_INFO, m.SET_CLAUSE m_SET_CLAUSE , m.SERVICE_NAME m_SERVICE_NAME , m.CLIENT_IDENTIFIER m_CLIENT_IDENTIFIER , s.USERNAME s_USERNAME, s.SERVER s_SERVER, s.OSUSER s_OSUSER, s.PROCESS s_PROCESS, s.MACHINE s_MACHINE, s.TERMINAL s_TERMINAL, s.PROGRAM s_PROGRAM, s.MODULE s_MODULE, s.CLIENT_INFO s_CLIENT_INFO, s.SERVICE_NAME s_SERVICE_NAME , s.CLIENT_IDENTIFIER s_CLIENT_IDENTIFIERfrom session_modification m, select username, server,osuser,process, machine,terminal,program,module,client_info, client_identifier,service_name from v$session where sid=USERENV('SID')) swhere m.username = user and m.username=s.username and (m.osuser = s.osuser OR m.osuser is NULL) and (m.CLIENT_INFO = s.CLIENT_INFO OR m.CLIENT_INFO is NULL) and (m.MODULE = s.MODULE OR m.MODULE is NULL) and (m.PROGRAM = s.PROGRAM OR m.PROGRAM is NULL) and (m.TERMINAL = s.TERMINAL OR m.TERMINAL is NULL) and (m.MACHINE = s.MACHINE OR m.MACHINE is NULL) and (m.PROCESS = s.PROCESS OR m.PROCESS is NULL) and (m.SERVICE_NAME = s.SERVICE_NAME OR m.SERVICE_NAME is NULL) and (m.CLIENT_IDENTIFIER = s.CLIENT_IDENTIFIER OR m.CLIENT_IDENTIFIER is NULL) and (m.SERVER = s.SERVER OR m.SERVER is NULL);

50DBIS
Demonstration
• Questions?
• References/Credits on PL/SQL:– asktom.oracle.com (Tom Kyte : instrumentation and using dbms_%) – www.minmaxplsql.com (Steven Feuerstein capture/trace PL/SQL)– http://www.jlcomp.demon.co.uk/faq/utlfiledebug.html (Jonathan Lewis)
Top Related