


Languages
Pages
Legal


MathematicsFunctions: Logarithms
Science and Mathematics Education Research Group
Supported by UBC Teaching and Learning Enhancement Fund 2012-2014
Department of Curriculum and Pedagogy
FACULTY OF EDUCATIONa place of mind

Log Functions

Review of Inverse Functions
This question set expects students to be comfortable with transformations and finding the inverse of functions. Students should also know the basic properties of logarithms and exponents.
xy
Review: Reflect a graph in the line y = x to find the graph of the inverse.
The inverse of an equation in the form
can be found by interchanging x and y, then solving the equation for y.
)(xfy

Log Functions I
We are given the function y = ax.
What is the equation of its inverse?
inversean havenot doesfunction TheE.
logD.
logC.
B.
A.
xy
ay
ay
xy
a
x
x
a
Press for hint
Solve for y: x = ay

Solution
Answer: D
Justification: We find the inverse of the function by interchanging x and y values, then solving for y:
Recall the definition of logarithms:
xy
ax
ay
a
y
x
log
interchange x and y
loga x = y
x = ay

Log Functions II
What is the graph of the function y = ax if a > 1.
A. B.
C. D.

Solution
Answer: A
Justification: This is one of the basic graphs you should know how to quickly sketch.
If a > 1, all functions in the form y = ax cross the y-axis at the point (0, 1).
As x goes to positive infinity, the graph grows exponentially.
As x goes to negative infinity, the graph is still positive but decays exponentially to y = 0.

Log Functions III
The function y = logax is
the inverse of the function y = ax.
What is the graph of the function y = logax when
a > 1?
A. B.
C. D.

Solution
Answer: C
Justification: To find the graph of y = logax, reflect the graph y = ax across the line y = x because the two are inverses of each other.
ay xlog
xay
Graph B is incorrect because negative exponents are never returned by the log function.
Graph D is incorrect because the log function should be able to return values when x is between 0 and 1.
Graph A is the graph of y = logax
when 0 < a < 1. What does y = ax look like when 0 < a < 1?

Log Functions IV
What are the domain and range of f (x) = log2(x)?
Domain Range
x > 0 y ≥ 0
x > 0 All real numbers
x ≥ 0 y ≥ 0
x ≥ 0 All real numbers
All real numbers All real numbersE.
D.
C.
B.
A.
Press for hint
)(log)( 2 xxf
Solution
Answer: B
Justification: The domain of the log function is the range of an exponential function since these two functions are inverses. Notice that we do not include 0 in the domain because exponential functions do not return the value 0.
)(log)( 2 xxf The range of the log function is the domain of the exponential function. There are no restrictions on the exponent on a number, so the log function can return any number.
Domain: x > 0
Range: All real numbers

Log Functions V
What point exists on all graphs in the form y = logax, where a > 0?
existspoint such NoE.
),1(D.
)1,1(C.
)0,1(B.
)1,0(A.
a
Solution
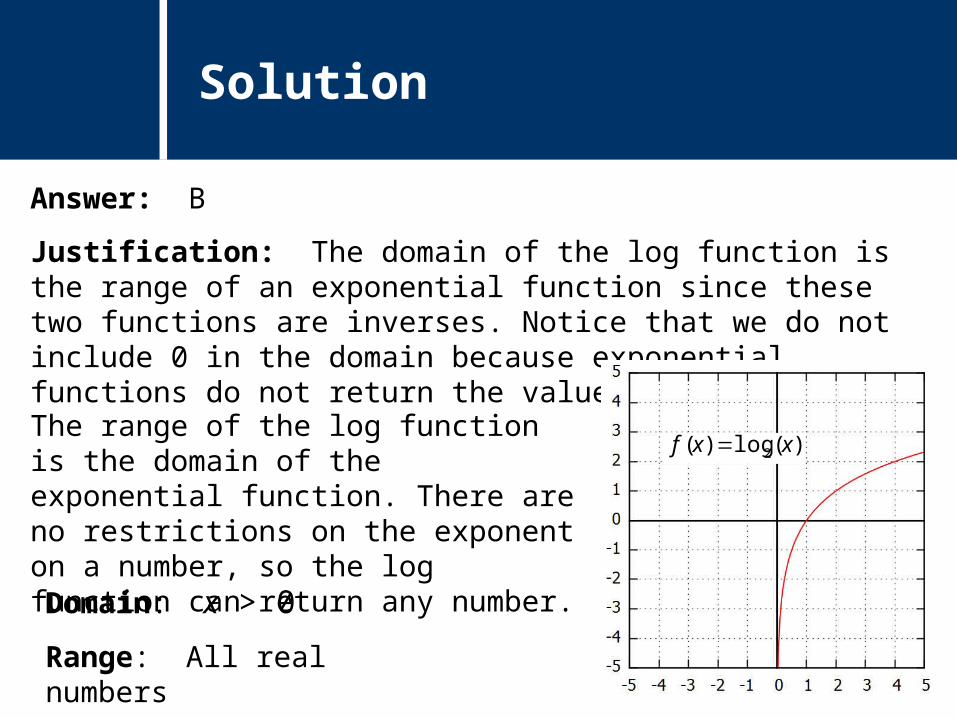
Answer: B
Justification: The graph of y = logax must pass through the point
(1, 0). This is because loga1 = 0 for all a > 0.
)0,1(
This is similar to the rule that the graph y = ax always passes through the point (0, 1), because a0 = 1.
Notice how the point (0, 1) on the exponential function is the inverse of the point on the logarithmic function, (1, 0).
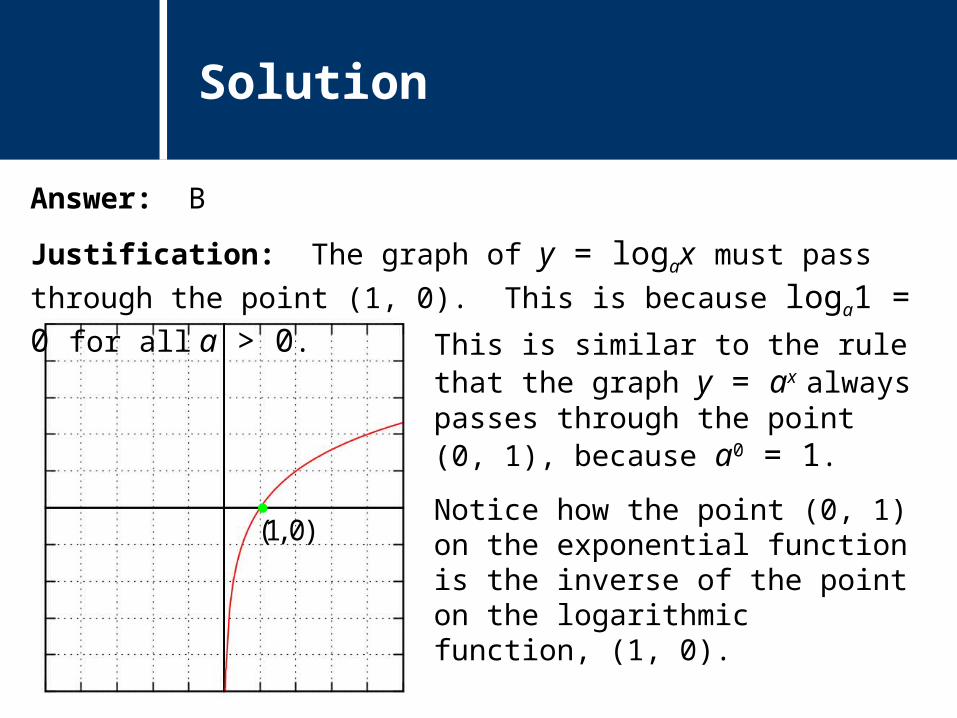
Log Functions VI
The graph shown to the right is in the form y = logax.
What is the value of a.
determined beCannot E.
4D.2
3C.
2B.
1A.

Solution
Answer: C
Justification: Use the property that logaa = 1. This means that all
graphs in the form y = logax pass through the point (a, 1).
Look at the graph and find where it crosses the line y = 1. The x-value of this point is the base of the log function.
In this question, the graph crosses the line y = 1 at (1.5, 1). The equation of the graph is therefore:
)1,5.1(
xy 5.1logxy 5.1log

Log Functions VII
The graph shown to the right is in the form y = logax.
What is the value of a.
determined beCannot E.
2D.2
1C.
2
1B.
2A.

Solution
Answer: C
Justification: Use the same technique explained in the previous question to find the value of a.
Look at the graph and find where it crosses the line y = 1. The x-value of this point is the base of the log function.
In this question, the graph crosses the line y = 1 at (0.5, 1). The equation of the graph is therefore:
)1,5.0(
xy 5.0logxy 5.0log

Log Functions VIII
What is the correct graph of the following function?
A. B.
C. D.
)(log2)( 3 xxf
Solution
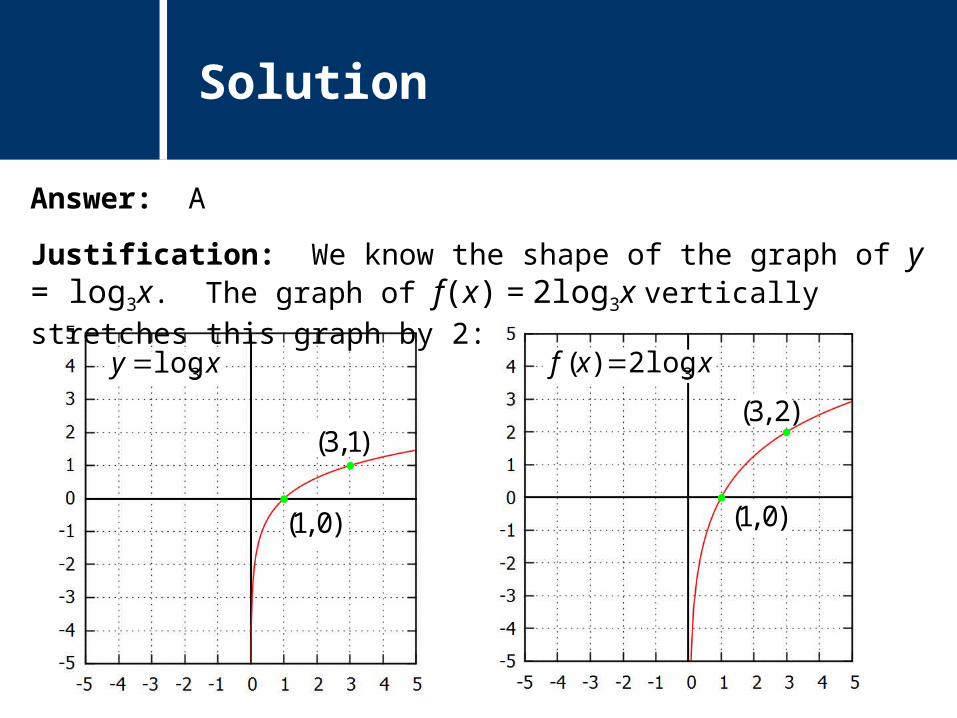
Answer: A
Justification: We know the shape of the graph of y = log3x. The
graph of f(x) = 2log3x vertically stretches this graph by 2:
)1,3(
)0,1(
)2,3(
)0,1(
xy 3log xxf 3log2)(

Log Functions IX
What is the correct graph of the following function?
A. B.
C. D.
)(log)( 23 xxf
Solution
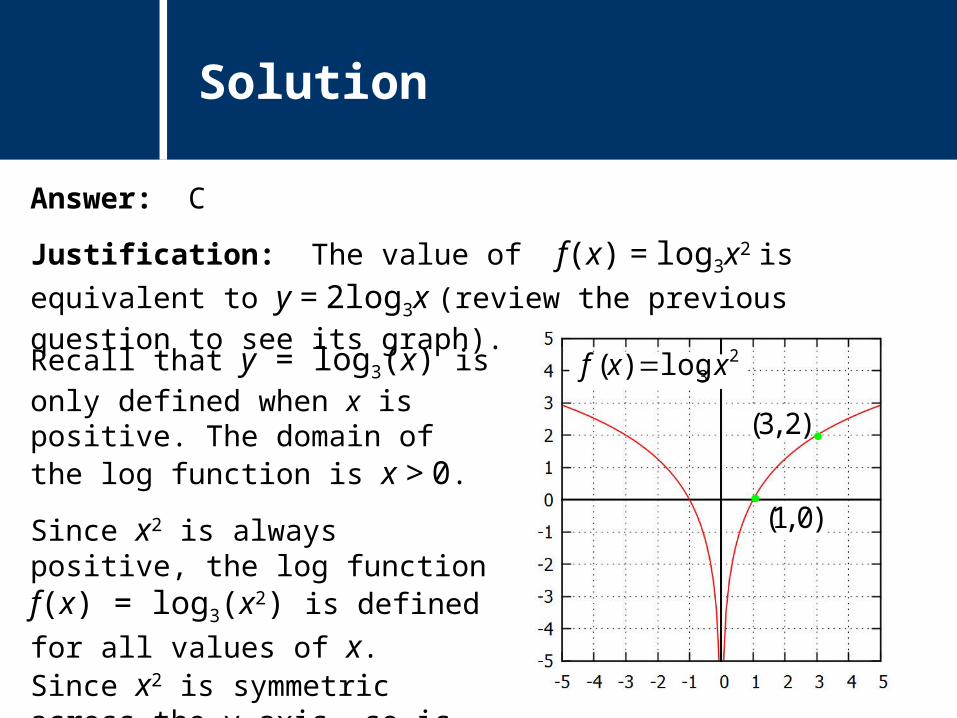
Answer: C
Justification: The value of f(x) = log3x2 is equivalent to y = 2log3x (review the previous question to see its graph).
)2,3(
)0,1(
23log)( xxf Recall that y = log3(x) is only
defined when x is positive. The domain of the log function is x > 0.
Since x2 is always positive, the log function f(x) = log3(x2) is defined
for all values of x. Since x2 is symmetric across the y-axis, so is f(x) = log3x2.

Log Functions X
Given the graph y = log2(x2), how many solutions does the following equation have?
)(log 22 xx
determined beCannot E.
3D.
2C.
1B.
0A.
)(log 22 xy

Solution
Answer: C
Justification: The equation given is hard to solve by working only with equations. Since the graph of y = log2(x2) is given, find the
number of points where y = x intersects this graph:
)2,2(
)4,4( There are two integer solutions at x = 2 and x = 4. The third solution is between 0 and -1.
We do not expect the graph to cross the line y = x more times when x > 5 since the log function increases much more slowly than y = x.

Log Functions XI
The graph of y = logbx is
given below. What is the graph of ?
A. B.
C. D.
)(log 1 xyb
)(log xy b
Solution
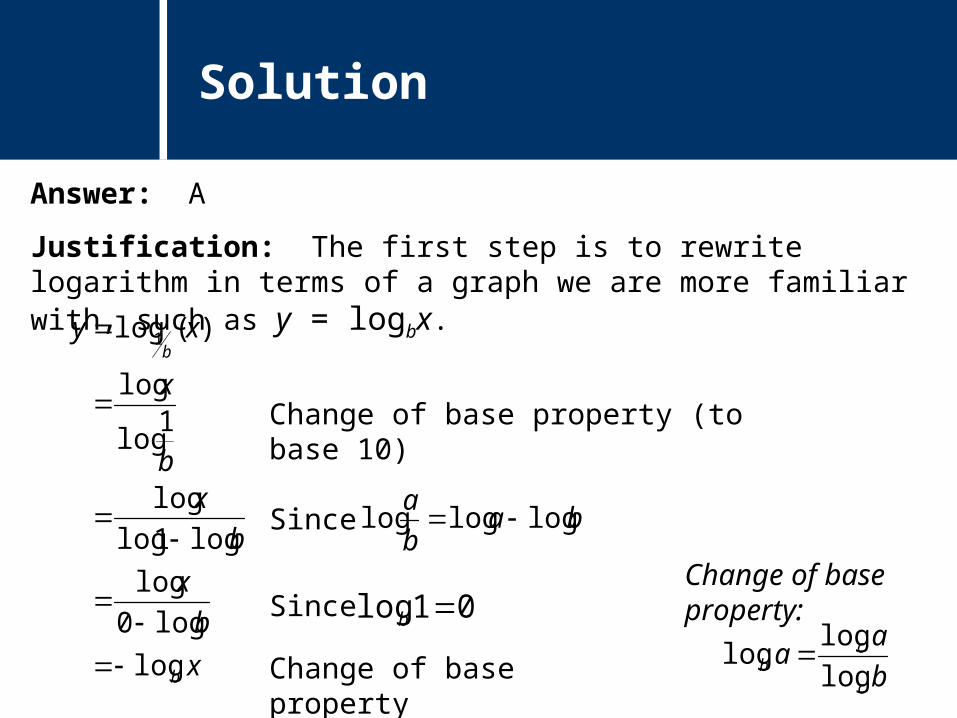
Answer: A
Justification: The first step is to rewrite logarithm in terms of a graph we are more familiar with, such as y = logbx.
x
b
x
b
xb
x
xy
b
b
log
log0
log
log1log
log
1log
log
)(log 1
Change of base property (to base 10)
Since
Change of base property
bab
alogloglog Since
01log b
b
aa
c
cb log
loglog
Change of base property:

Solution Continued
This is a reflection of the graph y = logbx across the x-axis.
xxy bb
log)(log 1
)(log xy b
)(log 1 xyb
Reflect in x-axis
Recall that negative exponents takes the reciprocal of its base. This explains the change in sign of the exponent returned by the log function.
yy
bb
1
Top Related