


Languages
Pages
Legal


Geothermal Energy and GeofluidsMartin Saar ([email protected])Martin Saar ([email protected])
POWER 24/7
TerraCOH Inc.Advanced Geothermal Energies
©AllRightsReservedbyTerraCOHInc.
1
www.terracoh-age.com
Prof. Martin Saar, Ph.D.
Geothermische Energie& Geofluide, ETH Zürich
Unkonventionelle Geothermie für die Schweiz: Petrothermie und Alternativen
H2020:- DESTRESS- Elegancy
Geothermie-Forum in Frauenfeld: 20. Juni, 2017
And: Jimmy Randolph, Ben Adams, NagasreeGarapati, Jeff Bielicki, Tom Kuehn, Tom Buscheck, Steve Taff, Ellen Longmire, Raphael Allstadt, Justin Ezekiel, Anozie Ebigbo, Daniel Vogler, Allan Leal, Ben Tutolo, Andrew Luhmann, Bill Seyfried, ....
POWER 24/7
TerraCOH Inc.Advanced Geothermal Energies
©AllRightsReservedbyTerraCOHInc.
1
www.terracoh-age.com
BFE
Geothermal Energy and GeofluidsMartin Saar ([email protected])
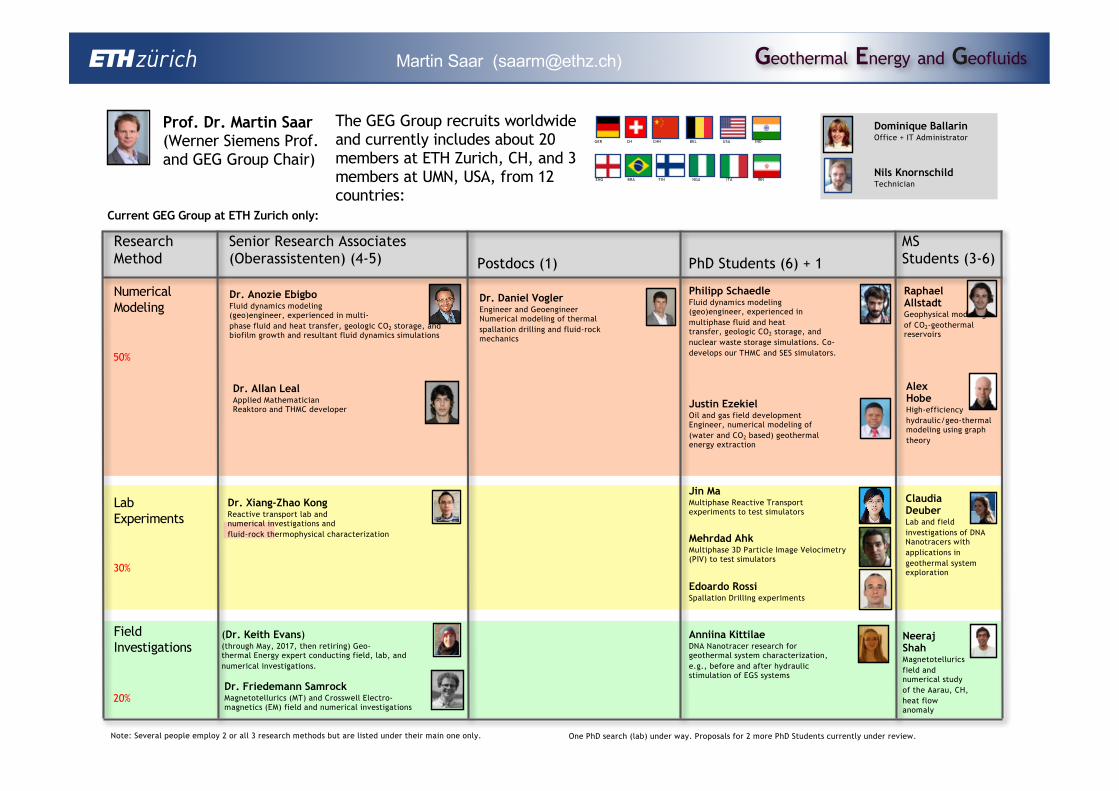
Prof. Dr. Martin Saar (Werner Siemens Prof. and GEG Group Chair)
Dominique BallarinOffice + IT Administrator
Nils KnornschildTechnician
The GEG Group recruits worldwide and currently includes about 20 members at ETH Zurich, CH, and 3 members at UMN, USA, from 12 countries:
GER CH CHN BEL USA IND
ENG BRA FIN ITA IRNNGA
Dr. Xiang-Zhao KongReactive transport lab andnumerical investigations andfluid-rock thermophysical characterization
(Dr. Keith Evans)(through May, 2017, then retiring) Geo-thermal Energy expert conducting field, lab, and numerical investigations.
Senior Research Associates (Oberassistenten) (4-5) Postdocs (1) PhD Students (6) + 1
MS Students (3-6)
Dr. Anozie EbigboFluid dynamics modeling (geo)engineer, experienced in multi-phase fluid and heat transfer, geologic CO2 storage, and biofilm growth and resultant fluid dynamics simulations
Dr. Allan LealApplied MathematicianReaktoro and THMC developer
Dr. Friedemann SamrockMagnetotellurics (MT) and Crosswell Electro-magnetics (EM) field and numerical investigations
Anniina KittilaeDNA Nanotracer research for geothermal system characterization, e.g., before and after hydraulic stimulation of EGS systems
Philipp SchaedleFluid dynamics modeling (geo)engineer, experienced in multiphase fluid and heat transfer, geologic CO2 storage, and nuclear waste storage simulations. Co-develops our THMC and SES simulators.
Jin MaMultiphase Reactive Transport experiments to test simulators
NeerajShahMagnetotelluricsfield and numerical study of the Aarau, CH, heat flow anomaly
RaphaelAllstadtGeophysical modeling of CO2-geothermal reservoirs
Claudia DeuberLab and field investigations of DNA Nanotracers with applications in geothermal system exploration
Mehrdad AhkMultiphase 3D Particle Image Velocimetry(PIV) to test simulators
Edoardo RossiSpallation Drilling experiments
Dr. Daniel VoglerEngineer and GeoengineerNumerical modeling of thermal spallation drilling and fluid-rock mechanics
NumericalModeling
LabExperiments
Field Investigations
Justin EzekielOil and gas field development Engineer, numerical modeling of (water and CO2 based) geothermal energy extraction
MA Jin
Address: 04-10# Suite @ Paya Lebar, 418 Upper Paya Lebar Road, 534996 Singapore Tel: 0065 83115640 Email: [email protected] Date of birth: 04/07/1988
Working experience
2014-2015 Geophysicist, CGG Services Seismic processing (for marine data) in Subsurface Imaging Department of CGG Singapore
Education
2011-2014 Master, Department of Thermal Engineering, Tsinghua University Major: Energy, Power System and Automation
2007-2011 Bachelor, Department of Thermal Engineering, Tsinghua University Major: Power Engineering and Engineering Thermo-physics
Research Subject: CO2 and water two phase flow in porous media under CO2 storage conditions 9 Experimental research of CO2/water two phase flow mechanism
- Performed experiments on relative permeability and capillary curves on different rock samples in Tsinghua University (2010-2013).
9 Experimental research of permeability change due to CO2 exsolution. - Performed experiments on permeability change due to CO2 exsolution triggered by pressure drop in
Tsinghua University (2013.02-06). 9 Experimental research of rock property change due to calcite dissolution and precipitation.
- Performed experiments on porosity and permeability change due to calcite dissolution and precipitation in the School of Earth and Environment, University of Leeds, UK (2013.06-08).
9 Numerical simulations of two phase flow in core and field scale. - Studied key parameters for experiment fitting by TOUGH2 simulation in BRGM (Bureau de
Recherches Géologiques et Minières), France (2012.05-06). - Performed field scale simulations by TOUGH2 and established methodology to estimate CO2 stroage
capacity in Tsinghua University (2011-2013) 9 Experimental research of NMR (Nuclear Magnetic Resonance)
- Performed a series of experiments on MR in Numag research center (2012.07-08).
Curriculum Vitae
Anozie Ebigbo
Address
4 Acuba House Acuba RoadSW18 4QS LondonUnited KingdomPhone: +44 (0)784 996-5413E-mail: [email protected]
Personal Details
Surname: EbigboGiven names: Anozie Daniel ObiefunaGender: MaleDate of birth: 12th February 1980Place of birth: Enugu, NigeriaCitizenships: Nigerian and German
Education
1987–1997 Primary and secondary school education:
University of Nigeria Primary and Secondary School, Enugu
2000–2005 Higher education (“Diplom-Ingenieur”):
Civil Engineering, University of Stuttgart
Specialisation: Fluid Mechanics, Solid Mechanics, Hydraulic Engineering, and Hydrology
Thesis: Thermal effects of carbon dioxide sequestration in the subsurface
2005–2009 Higher education (Ph.D.):
Faculty of Civil and Environmental Engineering, University of Stuttgart
Thesis: Modelling of biofilm growth and its effect on CO2 and water (two-phase) flow in porousmedia
Examination committee:Prof. R. Helmig (University of Stuttgart)Prof. A. B. Cunningham (Montana State University)Dr. K. Pruess (University of California, Berkeley/Lawrence Berkeley National Laboratory)
Languages
Native: English, German, Igbo (Nigerian language)
Proficient: French
1
Note: Several people employ 2 or all 3 research methods but are listed under their main one only.
ResearchMethod
Current GEG Group at ETH Zurich only:
50%
30%
20%
One PhD search (lab) under way. Proposals for 2 more PhD Students currently under review.
Alex HobeHigh-efficiency hydraulic/geo-thermal modeling using graph theory

Geothermal Energy and GeofluidsMartin Saar ([email protected])Martin Saar ([email protected])
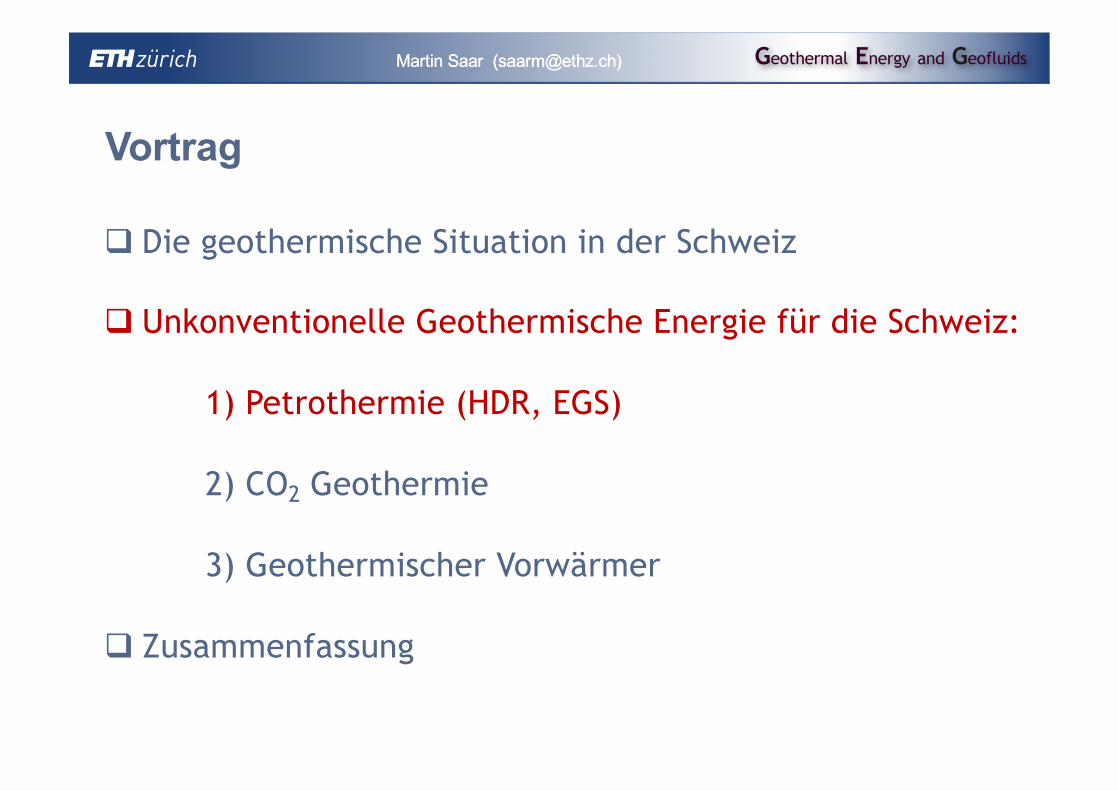
Vortrag
3
q Die geothermische Situation in der Schweiz
q Unkonventionelle Geothermische Energie für die Schweiz:
1) Petrothermie (HDR, EGS)
2) CO2 Geothermie
3) Geothermischer Vorwärmer
q Zusammenfassung
Geothermal Energy and GeofluidsMartin Saar ([email protected])Martin Saar ([email protected])
Vortrag
4
q Die geothermische Situation in der Schweiz
q Unkonventionelle Geothermische Energie für die Schweiz:
1) Petrothermie (HDR, EGS)
2) CO2 Geothermie
3) Geothermischer Vorwärmer
q Zusammenfassung
Geothermal Energy and GeofluidsMartin Saar ([email protected])
Hydrothermale Geothermie
Saar et al. (2013)
energypathways.org
Geothermal Energy and GeofluidsMartin Saar ([email protected])
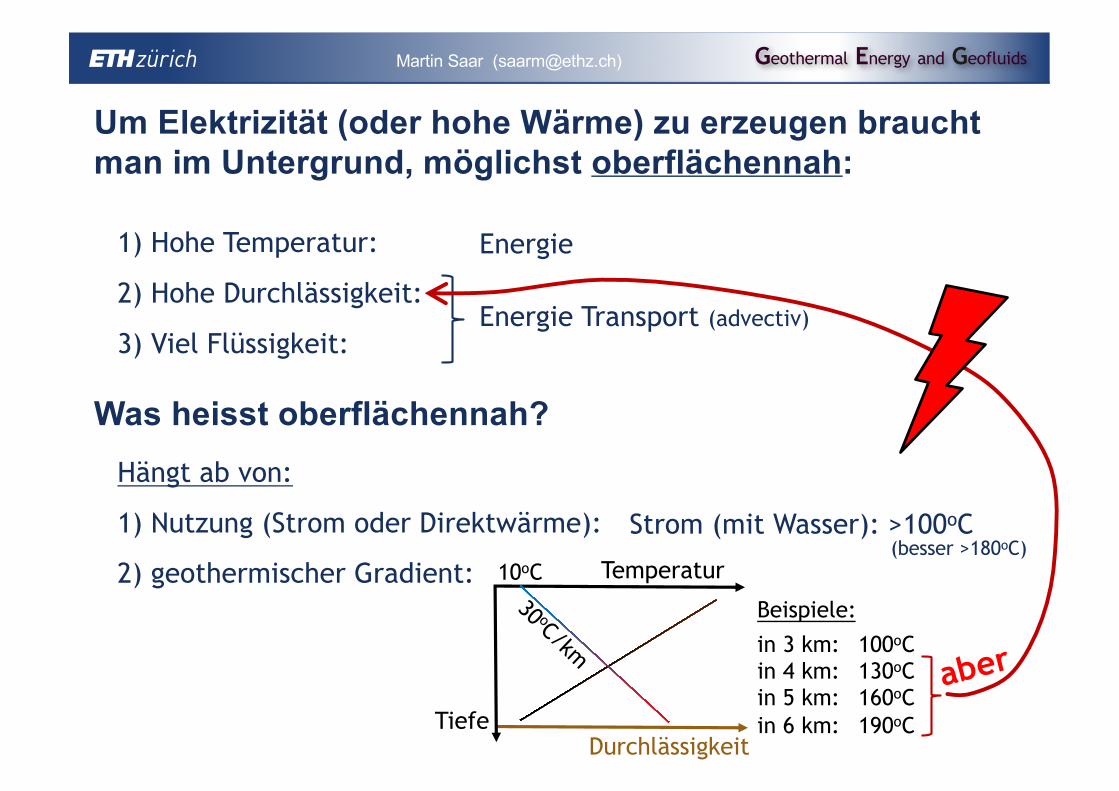
Um Elektrizität (oder hohe Wärme) zu erzeugen braucht man im Untergrund, möglichst oberflächennah:
1) Hohe Temperatur:
2) Hohe Durchlässigkeit:
3) Viel Flüssigkeit:
Energie
Energie Transport (advectiv)
Was heisst oberflächennah?Hängt ab von:
1) Nutzung (Strom oder Direktwärme): Strom (mit Wasser): >100oC(besser >180oC)
DurchlässigkeitTiefe
Temperatur10oC
Beispiele:
in 3 km: 100oCin 4 km: 130oCin 5 km: 160oCin 6 km: 190oC
2) geothermischer Gradient:
Geothermal Energy and GeofluidsMartin Saar ([email protected])
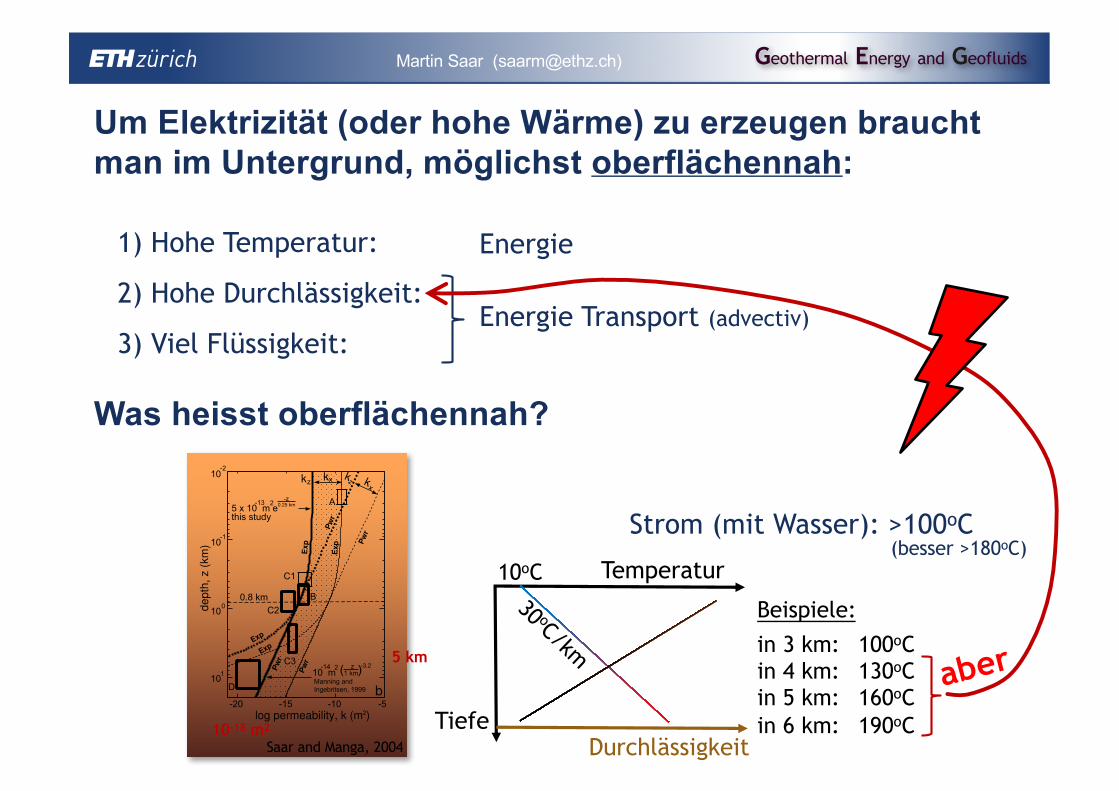
Um Elektrizität (oder hohe Wärme) zu erzeugen braucht man im Untergrund, möglichst oberflächennah:
1) Hohe Temperatur:
2) Hohe Durchlässigkeit:
3) Viel Flüssigkeit:
Energie
Energie Transport (advectiv)
Was heisst oberflächennah?
Strom (mit Wasser): >100oC(besser >180oC)
Tiefe
Temperatur10oC
Beispiele:
in 3 km: 100oCin 4 km: 130oCin 5 km: 160oCin 6 km: 190oC
DurchlässigkeitSaar and Manga, 2004
water can flow primarily through the (about parallel andhorizontal) pathways of highest permeability. Thus themean horizontal permeability is given by the arithmeticmean [Maasland, 1957]
kx ¼1
b
X
N
i¼1
kxibi; ð42Þ
where the subscript i denotes the ith layer or pathway, bi isthe thickness of layer i, and b is the total thickness of alllayers.[44] In contrast, vertical groundwater flow across hori-
zontal lava flows (or aquifers) is passing through sections ofvarying permeability in series, so that mean vertical per-meabilities are typically determined by the harmonic mean[Maasland, 1957]:
kz ¼ bX
N
i¼1
bikzi
!$1
; ð43Þ
where kz is dominated by the lowest permeabilities alongthat path. Hence in volcanic or sedimentary settings, whereslope-parallel, and thus approximately horizontal, layers,
pathways, and aquifers are common, typically 10 % kx/kz %1000, at least near the surface [e.g., Deming, 1993] and inthe absence of near-vertical fractures.[45] A further consequence of kz being determined by the
harmonic mean (equation (43)) and kz(z) generally decreas-ing with depth is that our results for kz from section 2apply predominantly toward the lower portions of theconsidered depth ranges where the lowest permeabilitiesare encountered. Replacing the discrete layer formulation inequation (43) with the definite integral from zero to b of thecontinuous functions, equations (39) and (40), results in theharmonic mean vertical permeabilities
kz ¼bkzs
d eb=d $ 1ð Þð44Þ
and
kz ¼ kzdD
b
! "l
lþ 1ð Þ; ð45Þ
suggested for 0 % z % 0.8 km and z > 0.8 km, respect-ively. Setting equation (39) equal to equation (44) andequation (40) equal to equation (45) provides the depths
zz ¼ $d lnb
d eb=d $ 1ð Þ
# $
ð46Þ
Figure 11. (a) Approximate (near-surface) range ofpermeability values [after Freeze and Cherry, 1979]. The(Oregon) Cascades primarily consist of basalt and basalticandesite, where the youngest (<2.3 Ma) rock units of theHigh Cascades show high near-surface permeabilities of k '10$14 m2 [Ingebritsen et al., 1992, 1994], consistent withthe k range indicated for permeable basalts. (b) Perme-ability, k, as a function of depth, z. Shown are our results forstudy regions A, B, C, and D (Figure 1 and Table 4) forhorizontal, x (thin boxes), and vertical, z (bold boxes),permeabilities. The depth ranges are determined asdescribed in the main text and in the caption to Table 4.Box widths and heights reflect approximate variations inpermeability and applicable depth ranges, respectively,calculated from uncertainties in input parameters asdescribed in section 4.1 and Table 4. Superimposed is theexponential profile of equation (39), denoted Exp, with d =0.25 km and kzs = 5 ( 10$13 m2 for vertical (bold curve)and kxs = 5 ( 10$10 m2 for horizontal (thin curve)permeabilities. Also shown is the power law profile ofequation (40), denoted Pwr, with l = 3.2 and kzd = 10$14 m2
at d = 1 km, as suggested by Manning and Ingebritsen[1999] for vertical (bold line) permeabilities. kzd = 10$11 m2
is used for horizontal (thin line) permeabilities. Solid linesindicate the permeability-depth curves suggested with atransition from exponential to power law profile at a depthof 0.8 km (dashed horizontal line). The dotted area indicatesthe expected range between vertical and horizontal perme-ability. At depth, this range may be expected to reduce dueto compaction resulting in kx ! kz, which is not shown asthe width of the dotted area remains constant. However, ourresults at z ' 0.5 km suggest similar vertical (study regionB) and horizontal (study region C1) permeabilities.
B04204 SAAR AND MANGA: DEPTH DEPENDENCE OF PERMEABILITY
13 of 19
B04204
5 km
10-18 m2
Geothermal Energy and GeofluidsMartin Saar ([email protected])
Um Elektrizität (oder hohe Wärme) zu erzeugen braucht man im Untergrund, möglichst oberflächennah:
1) Hohe Temperatur:
2) Hohe Durchlässigkeit:
3) Viel Flüssigkeit:
Was heisst oberflächennah?
Strom (mit Wasser): >100oC(besser >180oC)
Tiefe
Temperatur10oC
Beispiele:
in 3 km: 100oCin 4 km: 130oCin 5 km: 160oCin 6 km: 190oC
DurchlässigkeitSaar and Manga, 2004
water can flow primarily through the (about parallel andhorizontal) pathways of highest permeability. Thus themean horizontal permeability is given by the arithmeticmean [Maasland, 1957]
kx ¼1
b
X
N
i¼1
kxibi; ð42Þ
where the subscript i denotes the ith layer or pathway, bi isthe thickness of layer i, and b is the total thickness of alllayers.[44] In contrast, vertical groundwater flow across hori-
zontal lava flows (or aquifers) is passing through sections ofvarying permeability in series, so that mean vertical per-meabilities are typically determined by the harmonic mean[Maasland, 1957]:
kz ¼ bX
N
i¼1
bikzi
!$1
; ð43Þ
where kz is dominated by the lowest permeabilities alongthat path. Hence in volcanic or sedimentary settings, whereslope-parallel, and thus approximately horizontal, layers,
pathways, and aquifers are common, typically 10 % kx/kz %1000, at least near the surface [e.g., Deming, 1993] and inthe absence of near-vertical fractures.[45] A further consequence of kz being determined by the
harmonic mean (equation (43)) and kz(z) generally decreas-ing with depth is that our results for kz from section 2apply predominantly toward the lower portions of theconsidered depth ranges where the lowest permeabilitiesare encountered. Replacing the discrete layer formulation inequation (43) with the definite integral from zero to b of thecontinuous functions, equations (39) and (40), results in theharmonic mean vertical permeabilities
kz ¼bkzs
d eb=d $ 1ð Þð44Þ
and
kz ¼ kzdD
b
! "l
lþ 1ð Þ; ð45Þ
suggested for 0 % z % 0.8 km and z > 0.8 km, respect-ively. Setting equation (39) equal to equation (44) andequation (40) equal to equation (45) provides the depths
zz ¼ $d lnb
d eb=d $ 1ð Þ
# $
ð46Þ
Figure 11. (a) Approximate (near-surface) range ofpermeability values [after Freeze and Cherry, 1979]. The(Oregon) Cascades primarily consist of basalt and basalticandesite, where the youngest (<2.3 Ma) rock units of theHigh Cascades show high near-surface permeabilities of k '10$14 m2 [Ingebritsen et al., 1992, 1994], consistent withthe k range indicated for permeable basalts. (b) Perme-ability, k, as a function of depth, z. Shown are our results forstudy regions A, B, C, and D (Figure 1 and Table 4) forhorizontal, x (thin boxes), and vertical, z (bold boxes),permeabilities. The depth ranges are determined asdescribed in the main text and in the caption to Table 4.Box widths and heights reflect approximate variations inpermeability and applicable depth ranges, respectively,calculated from uncertainties in input parameters asdescribed in section 4.1 and Table 4. Superimposed is theexponential profile of equation (39), denoted Exp, with d =0.25 km and kzs = 5 ( 10$13 m2 for vertical (bold curve)and kxs = 5 ( 10$10 m2 for horizontal (thin curve)permeabilities. Also shown is the power law profile ofequation (40), denoted Pwr, with l = 3.2 and kzd = 10$14 m2
at d = 1 km, as suggested by Manning and Ingebritsen[1999] for vertical (bold line) permeabilities. kzd = 10$11 m2
is used for horizontal (thin line) permeabilities. Solid linesindicate the permeability-depth curves suggested with atransition from exponential to power law profile at a depthof 0.8 km (dashed horizontal line). The dotted area indicatesthe expected range between vertical and horizontal perme-ability. At depth, this range may be expected to reduce dueto compaction resulting in kx ! kz, which is not shown asthe width of the dotted area remains constant. However, ourresults at z ' 0.5 km suggest similar vertical (study regionB) and horizontal (study region C1) permeabilities.
B04204 SAAR AND MANGA: DEPTH DEPENDENCE OF PERMEABILITY
13 of 19
B04204
5 km
10-18 m2
Geothermal Energy and Geofluids
PPeettrrootthheerrmmaall ssyysstteemmss are reservoirs that are developed in
rocks that have low porosity and little water in-place.
PPeettrrootthheerrmmaall ((EEGGSS)) ggeeootthheerrmmaall ssyysstteemmss
3
TThhee tteecchhnnoollooggyy iiss nnoott yyeett mmaattuurree:: tthhee pprriinncciippaall ddiiffffiiccuullttiieess
ttoo bbuuiillddiinngg ssuucchh ssyysstteemmss aarree::
• These systems require that a reservoir is engineered by
creating or enhancing the permeability of the rock mass
between holes so that fluid can be circulated in a loop.
• The attraction of these systems lies in the fact that low-
porosity rocks at temperatures of 180-200°C underlie
large areas at Europe at depths of 5 km, mostly in
crystalline rock.
• Thus, they could be built in large numbers, and produce
electricity.
• As such, they have the potential to make a significant
contribution to the Swiss and European energy mix.
• Reservoir creation: how to develop the hydraulic linkage
between the boreholes >500 m apart to form a heat
exchanger with satisfactory characteristics (e.g. low
impedance to minimise pumping energy, large swept
area to give system longevity).
• Avoid damaging seismic events triggered by the hydraulic injections.
Geothermal Energy and Geofluids
EEuurrooppeeaann ppeettrrootthheerrmmaall ((EEGGSS)) rreessoouurrcceess
4
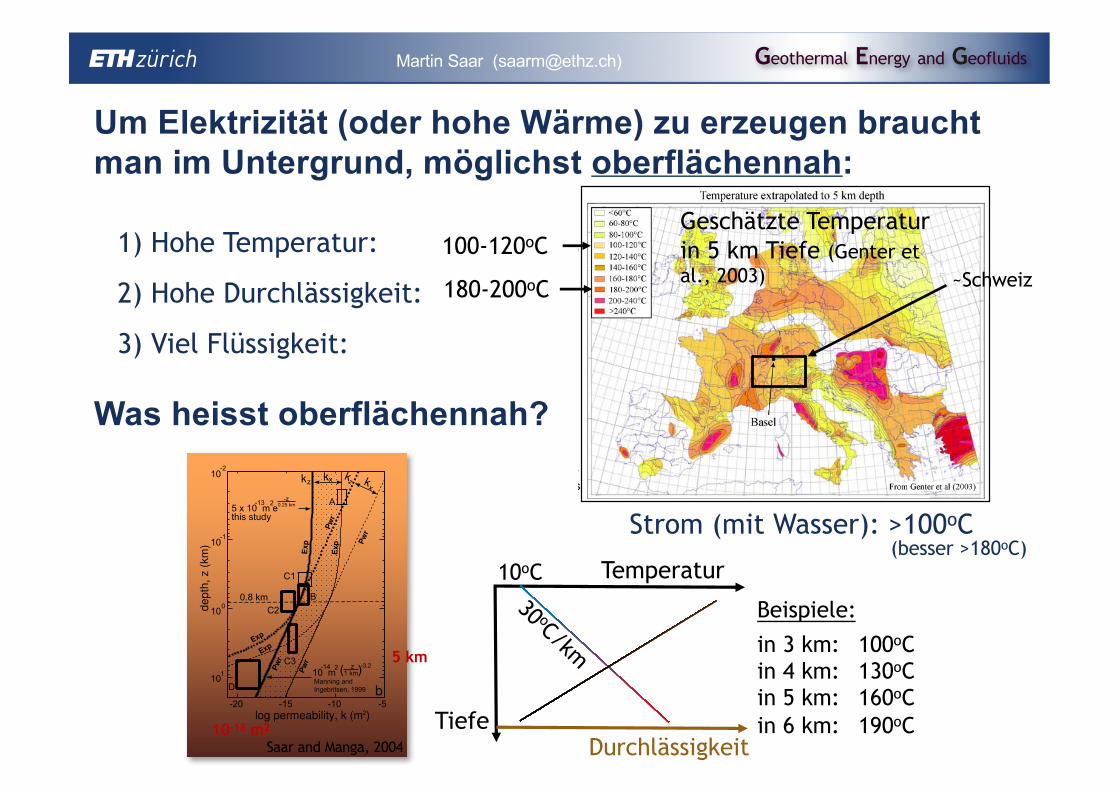
Map of the estimated temperature at 5 km depth for Europe.
It is based on data from 25,000 wells, but only 125 are deeper than 3.5 km – so for many areas it is highly provisional. Temperatures >180°C are found in Tertiary rift basins (Rhine Graben, Limagne, Provence, Bulgaria). Temperatures >200°C are found in regions of Tertiary volcanism (Upper Rhine Graben, Massif Central, , Catalonia, Tuscany-Latium, Pannonian basin, Turkey).
Note the northern Swiss foreland is significantly hotter than shown, with temperatures ≥190°C at 5 km.
Geschätzte Temperaturin 5 km Tiefe (Genter et al., 2003)
100-120oC
180-200oC ~Schweiz
Geothermal Energy and GeofluidsMartin Saar ([email protected])
Um Elektrizität (oder hohe Wärme) zu erzeugen braucht man im Untergrund, möglichst oberflächennah:
1) Hohe Temperatur:
2) Hohe Durchlässigkeit:
3) Viel Flüssigkeit:
Was heisst oberflächennah?
Strom (mit Wasser): >100oC(besser >180oC)
Tiefe
Temperatur10oC
Beispiele:
in 3 km: 100oCin 4 km: 130oCin 5 km: 160oCin 6 km: 190oC
DurchlässigkeitSaar and Manga, 2004
water can flow primarily through the (about parallel andhorizontal) pathways of highest permeability. Thus themean horizontal permeability is given by the arithmeticmean [Maasland, 1957]
kx ¼1
b
X
N
i¼1
kxibi; ð42Þ
where the subscript i denotes the ith layer or pathway, bi isthe thickness of layer i, and b is the total thickness of alllayers.[44] In contrast, vertical groundwater flow across hori-
zontal lava flows (or aquifers) is passing through sections ofvarying permeability in series, so that mean vertical per-meabilities are typically determined by the harmonic mean[Maasland, 1957]:
kz ¼ bX
N
i¼1
bikzi
!$1
; ð43Þ
where kz is dominated by the lowest permeabilities alongthat path. Hence in volcanic or sedimentary settings, whereslope-parallel, and thus approximately horizontal, layers,
pathways, and aquifers are common, typically 10 % kx/kz %1000, at least near the surface [e.g., Deming, 1993] and inthe absence of near-vertical fractures.[45] A further consequence of kz being determined by the
harmonic mean (equation (43)) and kz(z) generally decreas-ing with depth is that our results for kz from section 2apply predominantly toward the lower portions of theconsidered depth ranges where the lowest permeabilitiesare encountered. Replacing the discrete layer formulation inequation (43) with the definite integral from zero to b of thecontinuous functions, equations (39) and (40), results in theharmonic mean vertical permeabilities
kz ¼bkzs
d eb=d $ 1ð Þð44Þ
and
kz ¼ kzdD
b
! "l
lþ 1ð Þ; ð45Þ
suggested for 0 % z % 0.8 km and z > 0.8 km, respect-ively. Setting equation (39) equal to equation (44) andequation (40) equal to equation (45) provides the depths
zz ¼ $d lnb
d eb=d $ 1ð Þ
# $
ð46Þ
Figure 11. (a) Approximate (near-surface) range ofpermeability values [after Freeze and Cherry, 1979]. The(Oregon) Cascades primarily consist of basalt and basalticandesite, where the youngest (<2.3 Ma) rock units of theHigh Cascades show high near-surface permeabilities of k '10$14 m2 [Ingebritsen et al., 1992, 1994], consistent withthe k range indicated for permeable basalts. (b) Perme-ability, k, as a function of depth, z. Shown are our results forstudy regions A, B, C, and D (Figure 1 and Table 4) forhorizontal, x (thin boxes), and vertical, z (bold boxes),permeabilities. The depth ranges are determined asdescribed in the main text and in the caption to Table 4.Box widths and heights reflect approximate variations inpermeability and applicable depth ranges, respectively,calculated from uncertainties in input parameters asdescribed in section 4.1 and Table 4. Superimposed is theexponential profile of equation (39), denoted Exp, with d =0.25 km and kzs = 5 ( 10$13 m2 for vertical (bold curve)and kxs = 5 ( 10$10 m2 for horizontal (thin curve)permeabilities. Also shown is the power law profile ofequation (40), denoted Pwr, with l = 3.2 and kzd = 10$14 m2
at d = 1 km, as suggested by Manning and Ingebritsen[1999] for vertical (bold line) permeabilities. kzd = 10$11 m2
is used for horizontal (thin line) permeabilities. Solid linesindicate the permeability-depth curves suggested with atransition from exponential to power law profile at a depthof 0.8 km (dashed horizontal line). The dotted area indicatesthe expected range between vertical and horizontal perme-ability. At depth, this range may be expected to reduce dueto compaction resulting in kx ! kz, which is not shown asthe width of the dotted area remains constant. However, ourresults at z ' 0.5 km suggest similar vertical (study regionB) and horizontal (study region C1) permeabilities.
B04204 SAAR AND MANGA: DEPTH DEPENDENCE OF PERMEABILITY
13 of 19
B04204
5 km
10-18 m2
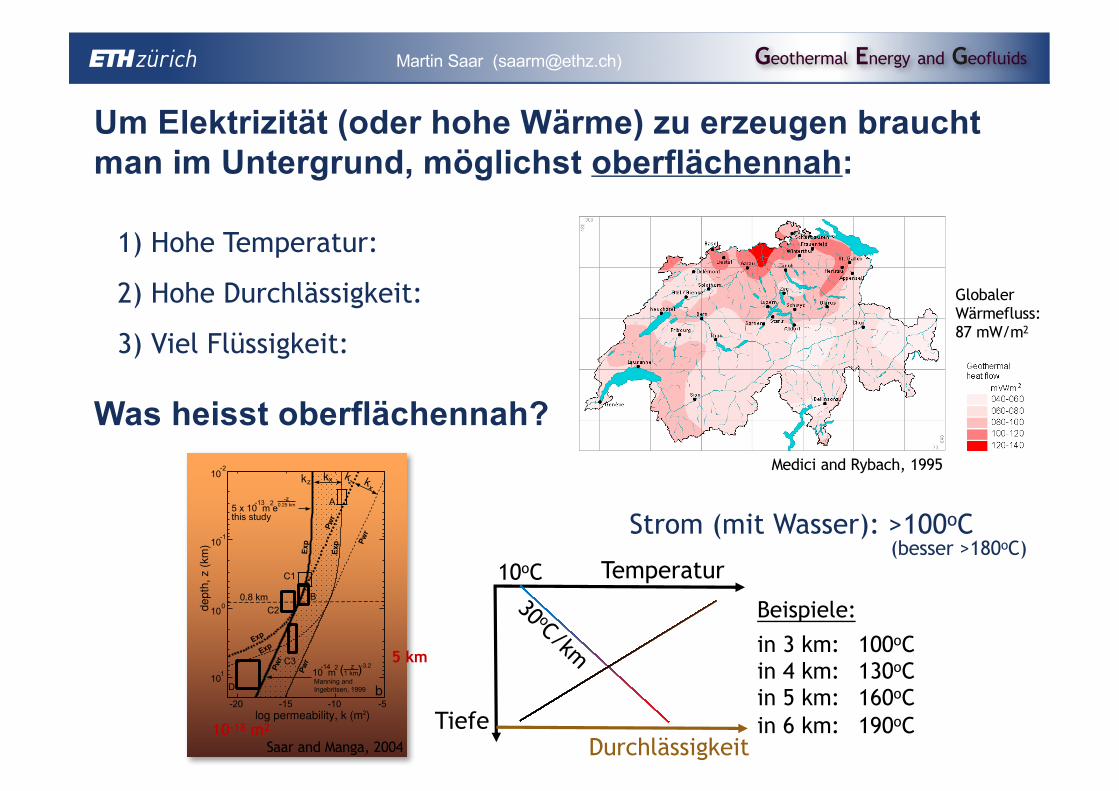
Medici and Rybach, 1995
GlobalerWärmefluss: 87 mW/m2
Geothermal Energy and GeofluidsMartin Saar ([email protected])
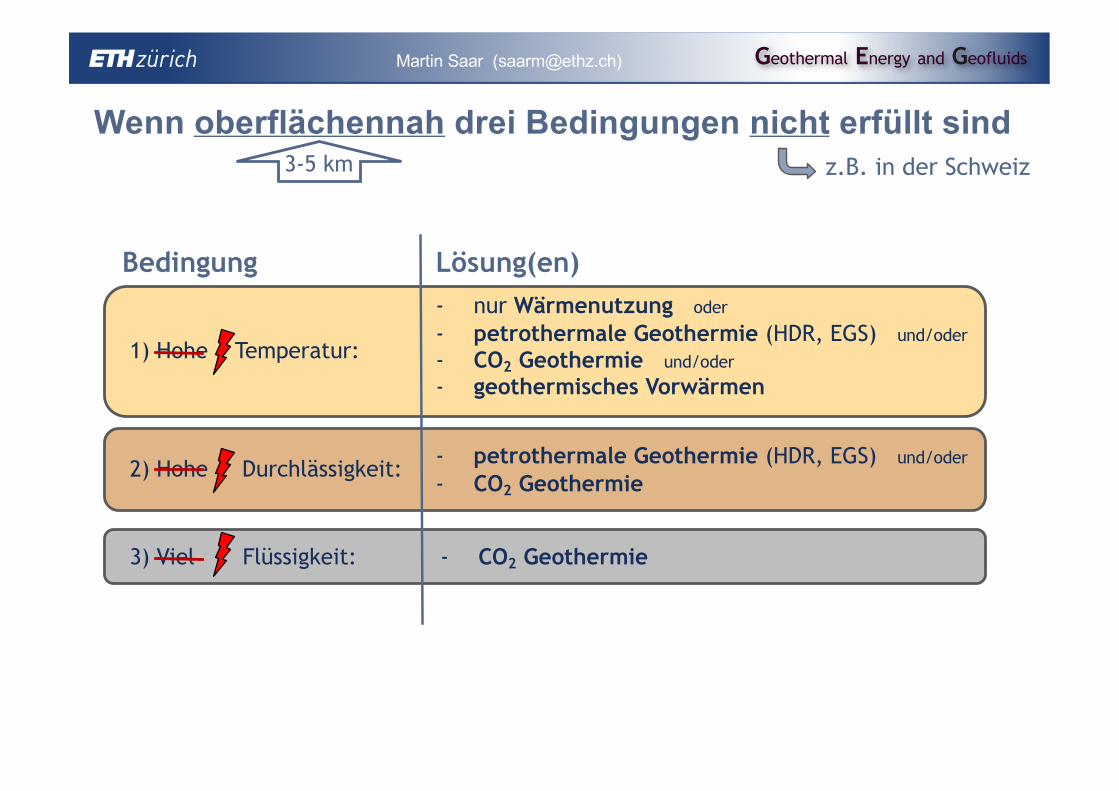
Wenn oberflächennah drei Bedingungen nicht erfüllt sind
- nur Wärmenutzung oder
- petrothermale Geothermie (HDR, EGS) und/oder
- CO2 Geothermie und/oder
- geothermisches Vorwärmen
1) Hohe Temperatur:
- petrothermale Geothermie (HDR, EGS) und/oder
- CO2 Geothermie2) Hohe Durchlässigkeit:
- CO2 Geothermie3) Viel Flüssigkeit:
Bedingung Lösung(en)
3-5 km z.B. in der Schweiz
Geothermal Energy and GeofluidsMartin Saar ([email protected])
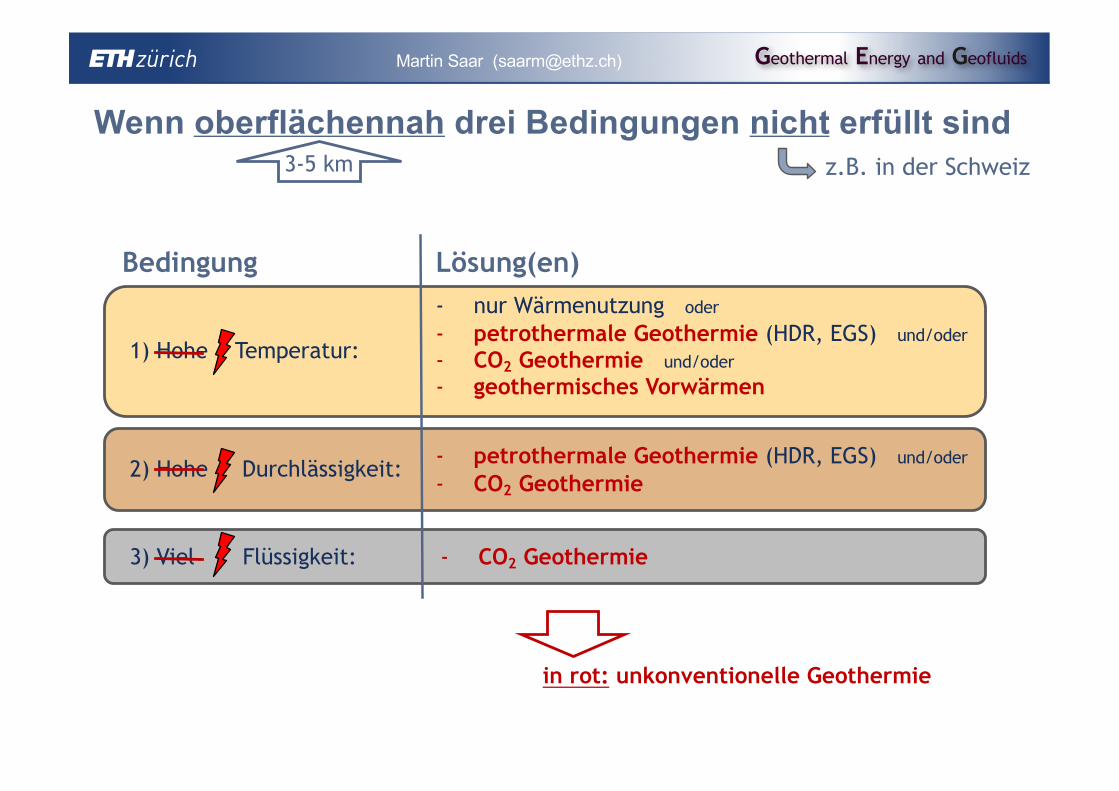
Wenn oberflächennah drei Bedingungen nicht erfüllt sind
- nur Wärmenutzung oder
- petrothermale Geothermie (HDR, EGS) und/oder
- CO2 Geothermie und/oder
- geothermisches Vorwärmen
1) Hohe Temperatur:
- petrothermale Geothermie (HDR, EGS) und/oder
- CO2 Geothermie2) Hohe Durchlässigkeit:
- CO2 Geothermie3) Viel Flüssigkeit:
Bedingung Lösung(en)
3-5 km
in rot: unkonventionelle Geothermie
z.B. in der Schweiz
Geothermal Energy and GeofluidsMartin Saar ([email protected])Martin Saar ([email protected])
Vortrag
12
q Die geothermische Situation in der Schweiz
q Unkonventionelle Geothermische Energie für die Schweiz:
1) Petrothermie (HDR, EGS)
2) CO2 Geothermie
3) Geothermischer Vorwärmer
q Zusammenfassung
Geothermal Energy and GeofluidsMartin Saar ([email protected])
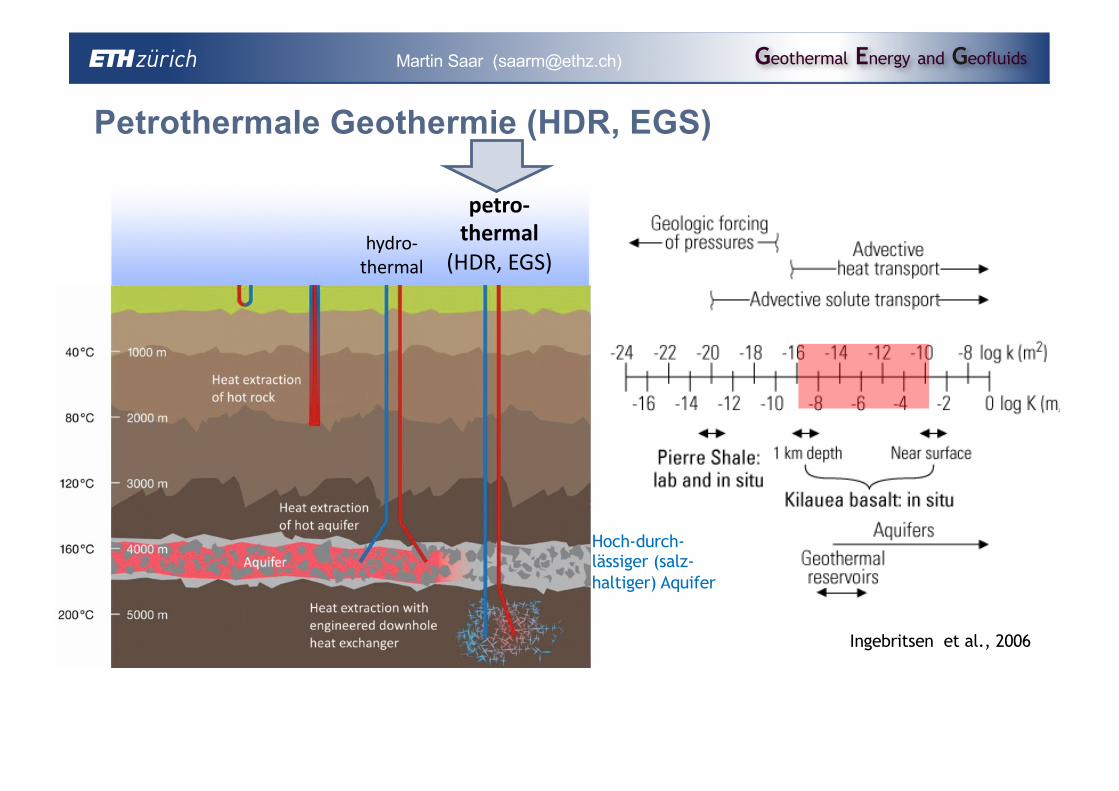
Petrothermale Geothermie (HDR, EGS)
Ingebritsen et al., 2006
hydro-thermal
petro-thermal
(HDR,EGS)
Hoch-durch-lässiger (salz-haltiger) Aquifer
Geothermal Energy and GeofluidsMartin Saar ([email protected])
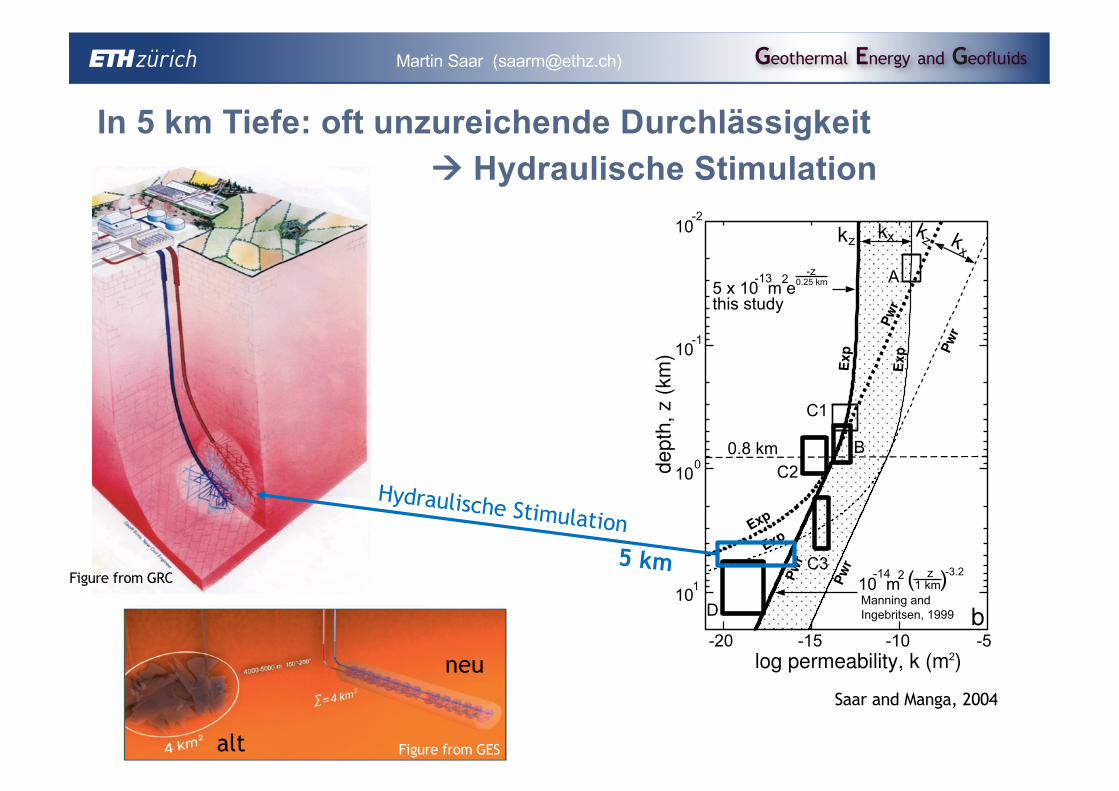
In 5 km Tiefe: oft unzureichende Durchlässigkeit
Saar and Manga, 2004
water can flow primarily through the (about parallel andhorizontal) pathways of highest permeability. Thus themean horizontal permeability is given by the arithmeticmean [Maasland, 1957]
kx ¼1
b
X
N
i¼1
kxibi; ð42Þ
where the subscript i denotes the ith layer or pathway, bi isthe thickness of layer i, and b is the total thickness of alllayers.[44] In contrast, vertical groundwater flow across hori-
zontal lava flows (or aquifers) is passing through sections ofvarying permeability in series, so that mean vertical per-meabilities are typically determined by the harmonic mean[Maasland, 1957]:
kz ¼ bX
N
i¼1
bikzi
!$1
; ð43Þ
where kz is dominated by the lowest permeabilities alongthat path. Hence in volcanic or sedimentary settings, whereslope-parallel, and thus approximately horizontal, layers,
pathways, and aquifers are common, typically 10 % kx/kz %1000, at least near the surface [e.g., Deming, 1993] and inthe absence of near-vertical fractures.[45] A further consequence of kz being determined by the
harmonic mean (equation (43)) and kz(z) generally decreas-ing with depth is that our results for kz from section 2apply predominantly toward the lower portions of theconsidered depth ranges where the lowest permeabilitiesare encountered. Replacing the discrete layer formulation inequation (43) with the definite integral from zero to b of thecontinuous functions, equations (39) and (40), results in theharmonic mean vertical permeabilities
kz ¼bkzs
d eb=d $ 1ð Þð44Þ
and
kz ¼ kzdD
b
! "l
lþ 1ð Þ; ð45Þ
suggested for 0 % z % 0.8 km and z > 0.8 km, respect-ively. Setting equation (39) equal to equation (44) andequation (40) equal to equation (45) provides the depths
zz ¼ $d lnb
d eb=d $ 1ð Þ
# $
ð46Þ
Figure 11. (a) Approximate (near-surface) range ofpermeability values [after Freeze and Cherry, 1979]. The(Oregon) Cascades primarily consist of basalt and basalticandesite, where the youngest (<2.3 Ma) rock units of theHigh Cascades show high near-surface permeabilities of k '10$14 m2 [Ingebritsen et al., 1992, 1994], consistent withthe k range indicated for permeable basalts. (b) Perme-ability, k, as a function of depth, z. Shown are our results forstudy regions A, B, C, and D (Figure 1 and Table 4) forhorizontal, x (thin boxes), and vertical, z (bold boxes),permeabilities. The depth ranges are determined asdescribed in the main text and in the caption to Table 4.Box widths and heights reflect approximate variations inpermeability and applicable depth ranges, respectively,calculated from uncertainties in input parameters asdescribed in section 4.1 and Table 4. Superimposed is theexponential profile of equation (39), denoted Exp, with d =0.25 km and kzs = 5 ( 10$13 m2 for vertical (bold curve)and kxs = 5 ( 10$10 m2 for horizontal (thin curve)permeabilities. Also shown is the power law profile ofequation (40), denoted Pwr, with l = 3.2 and kzd = 10$14 m2
at d = 1 km, as suggested by Manning and Ingebritsen[1999] for vertical (bold line) permeabilities. kzd = 10$11 m2
is used for horizontal (thin line) permeabilities. Solid linesindicate the permeability-depth curves suggested with atransition from exponential to power law profile at a depthof 0.8 km (dashed horizontal line). The dotted area indicatesthe expected range between vertical and horizontal perme-ability. At depth, this range may be expected to reduce dueto compaction resulting in kx ! kz, which is not shown asthe width of the dotted area remains constant. However, ourresults at z ' 0.5 km suggest similar vertical (study regionB) and horizontal (study region C1) permeabilities.
B04204 SAAR AND MANGA: DEPTH DEPENDENCE OF PERMEABILITY
13 of 19
B04204
Figure from GRC
à Hydraulische Stimulation
Figure from GESalt
neu
Geothermal Energy and GeofluidsMartin Saar ([email protected])Martin Saar ([email protected])
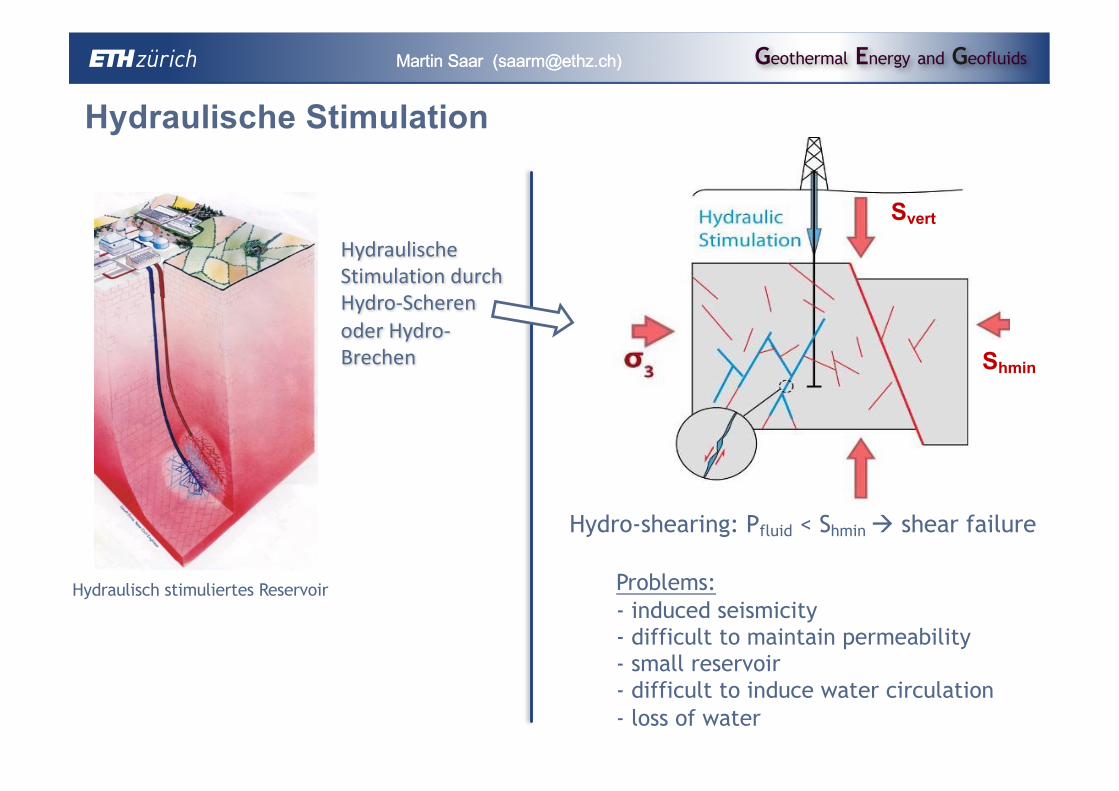
Hydraulisch stimuliertes Reservoir
HydraulischeStimulationdurchHydro-Scherenoder Hydro-Brechen
Svert
Shmin
Problems:- induced seismicity- difficult to maintain permeability- small reservoir- difficult to induce water circulation- loss of water
Hydro-shearing: Pfluid < Shmin à shear failure
Hydraulische Stimulation
Geothermal Energy and GeofluidsMartin Saar ([email protected])Martin Saar ([email protected])
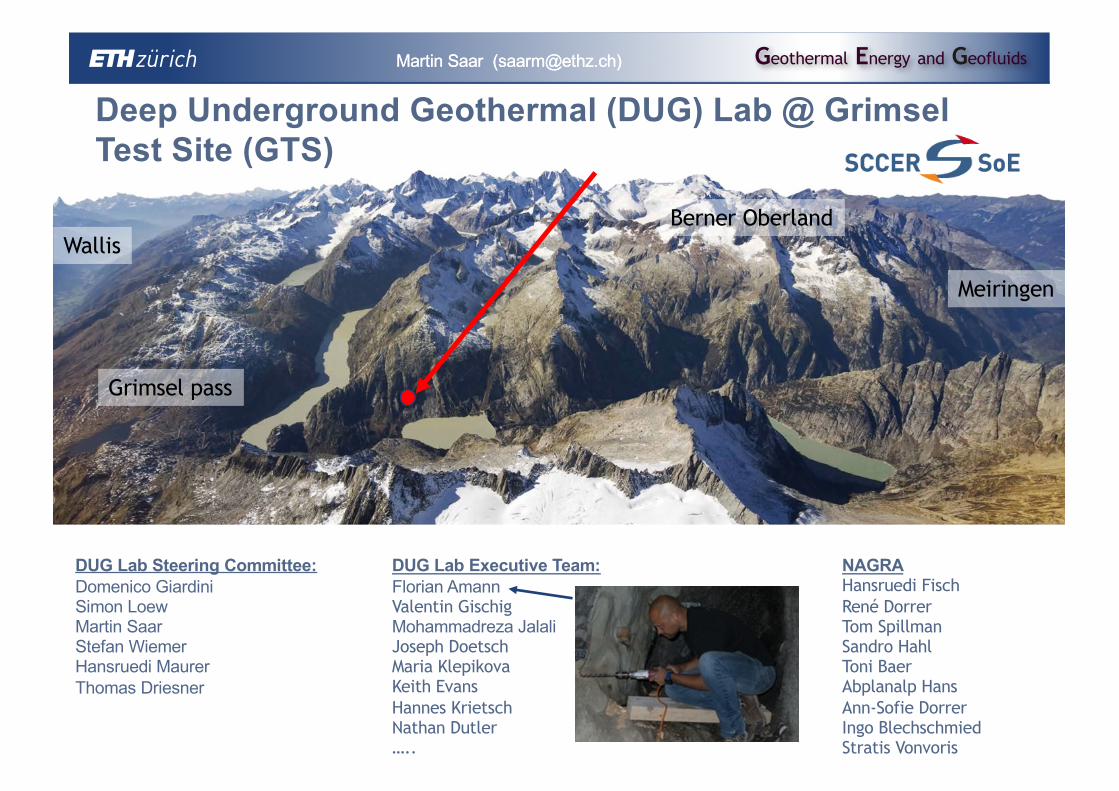
Grimsel pass
Wallis
Meiringen
Berner Oberland
DUG Lab Steering Committee:Domenico GiardiniSimon LoewMartin SaarStefan WiemerHansruedi MaurerThomas Driesner
DUG Lab Executive Team:Florian Amann Valentin GischigMohammadreza JalaliJoseph DoetschMaria KlepikovaKeith EvansHannes KrietschNathan Dutler…..
NAGRAHansruedi FischRené DorrerTom SpillmanSandro HahlToni BaerAbplanalp HansAnn-Sofie DorrerIngo BlechschmiedStratis Vonvoris
Deep Underground Geothermal (DUG) Lab @ Grimsel Test Site (GTS)
Geothermal Energy and GeofluidsMartin Saar ([email protected])Martin Saar ([email protected])
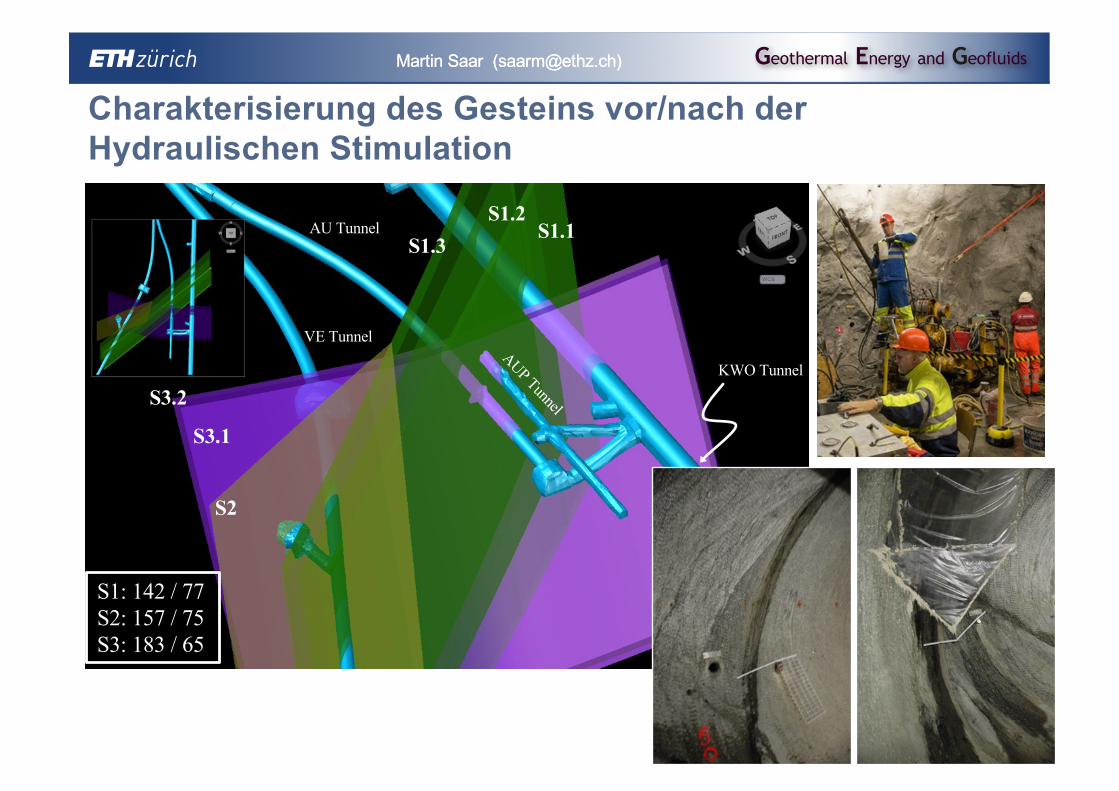
Charakterisierung des Gesteins vor/nach der Hydraulischen Stimulation
S2
S3.1
S3.2
S1.1S1.2
S1.3
S1: 142 / 77S2: 157 / 75S3: 183 / 65
KWO Tunnel
AU Tunnel
VE Tunnel
Geothermal Energy and GeofluidsMartin Saar ([email protected])Martin Saar ([email protected])
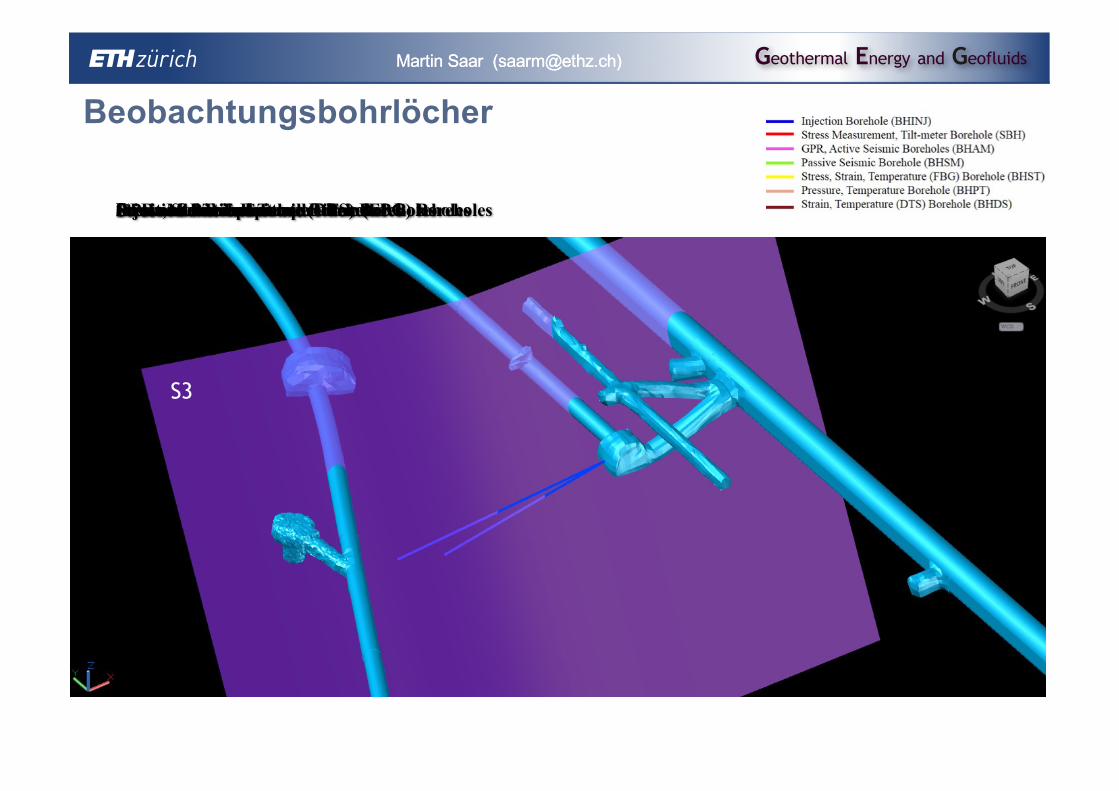
Beobachtungsbohrlöcher
Injection BoreholesStress Measurement and Tilt-meter BoreholesGPR and Active Seismic BoreholesPassive Seismic BoreholeStress, Strain and Temperature (FBG) BoreholesPressure and Temperature BoreholesStrain and Temperature (DTS) Boreholes
S3
Geothermal Energy and GeofluidsMartin Saar ([email protected])Martin Saar ([email protected])
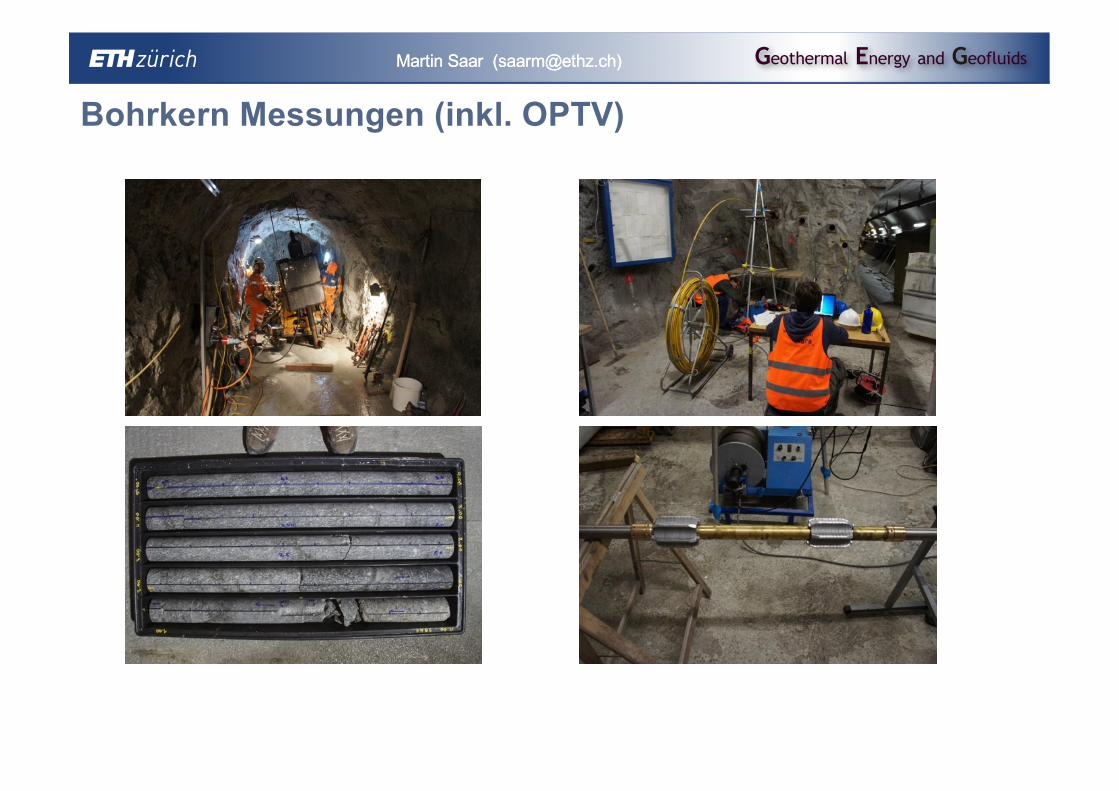
Bohrkern Messungen (inkl. OPTV)
Geothermal Energy and GeofluidsMartin Saar ([email protected])Martin Saar ([email protected])
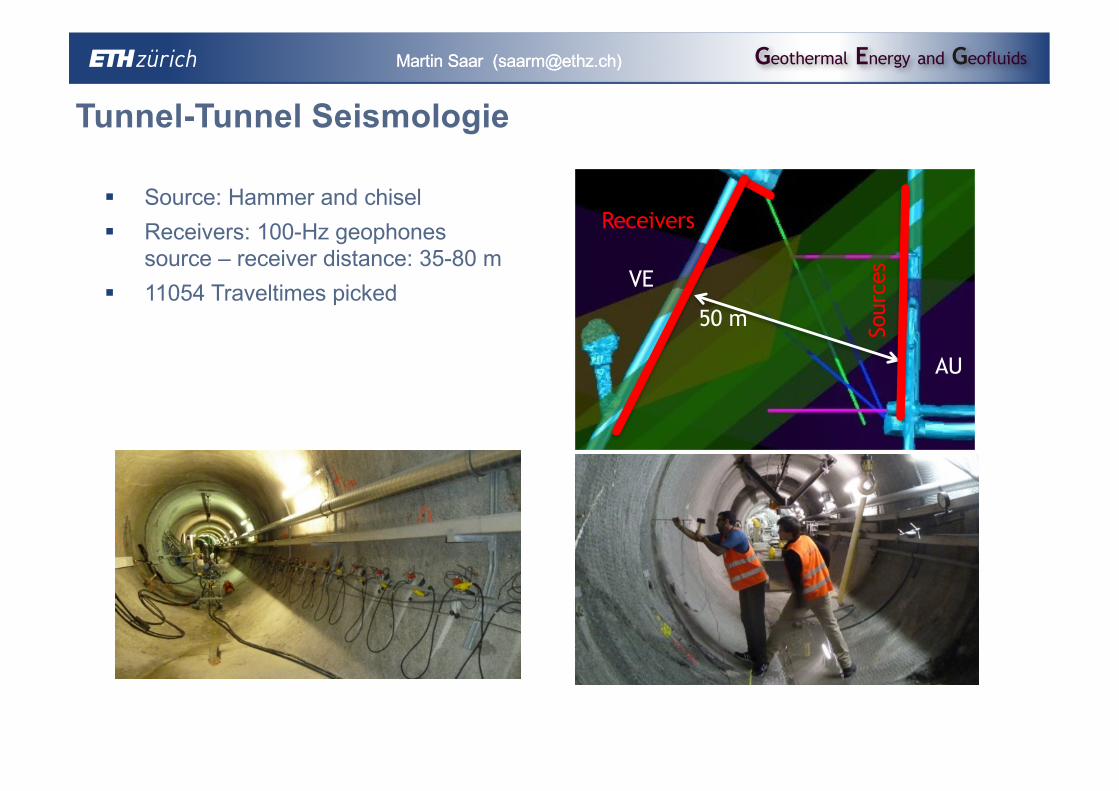
Tunnel-Tunnel Seismologie
§ Source: Hammer and chisel§ Receivers: 100-Hz geophones
source – receiver distance: 35-80 m§ 11054 Traveltimes picked
50 m
Receivers
Sour
ces
AU
VE
Geothermal Energy and GeofluidsMartin Saar ([email protected])Martin Saar ([email protected])
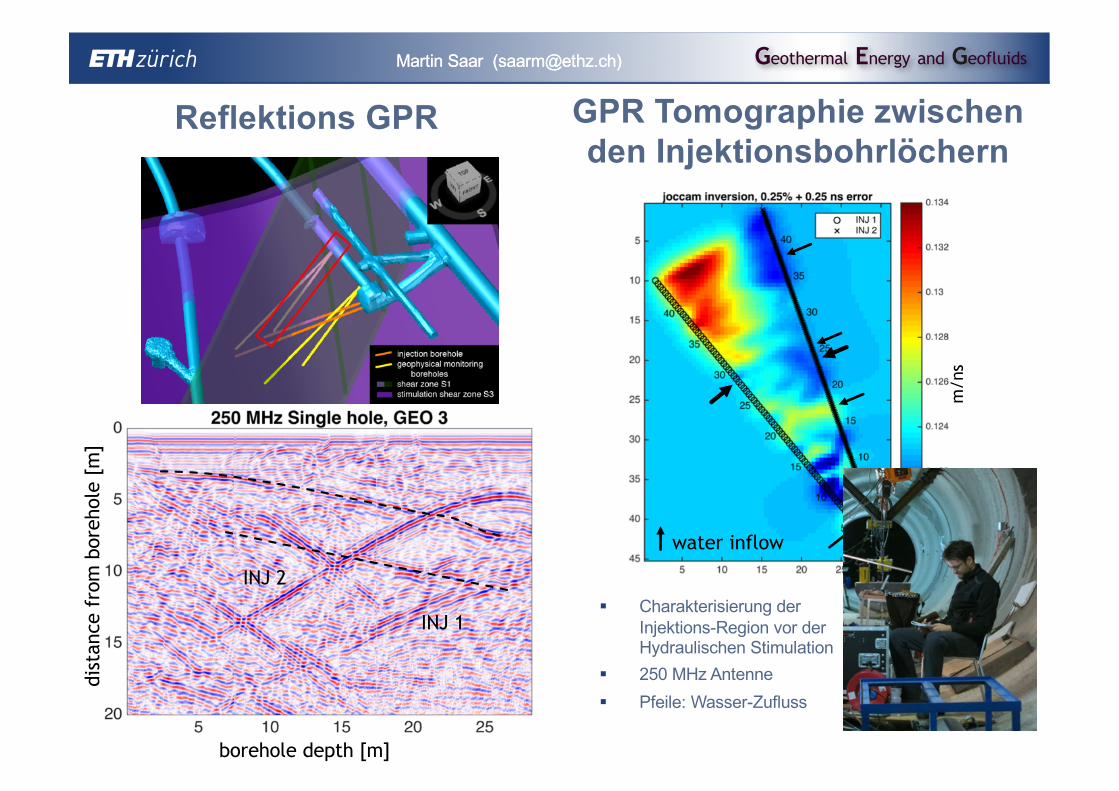
Reflektions GPR
INJ 2
INJ 1
dist
ance
from
bore
hole
[m]
borehole depth [m]
GPR Tomographie zwischen den Injektionsbohrlöchern
§ Charakterisierung der Injektions-Region vor der Hydraulischen Stimulation
§ 250 MHz Antenne§ Pfeile: Wasser-Zufluss
m/n
s
water inflow
Geothermal Energy and GeofluidsMartin Saar ([email protected])Martin Saar ([email protected])
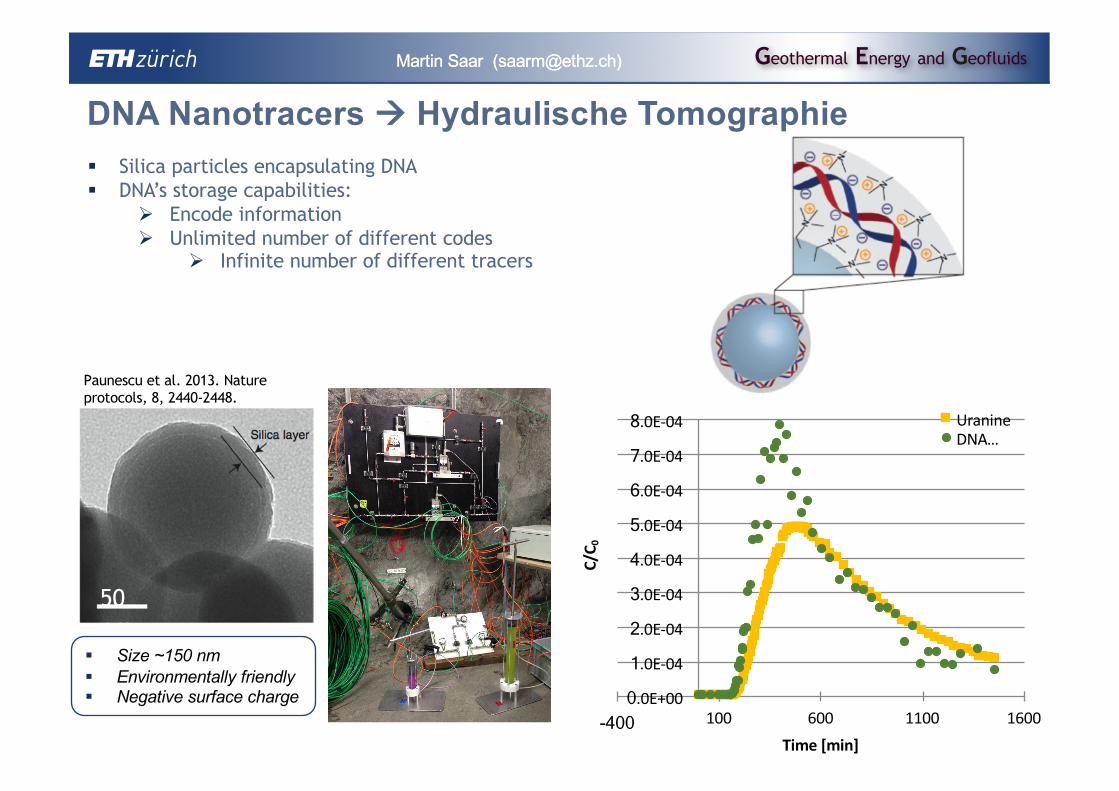
§ Silica particles encapsulating DNA§ DNA’s storage capabilities:
Ø Encode informationØ Unlimited number of different codes
Ø Infinite number of different tracers
50 nm
Paunescu et al. 2013. Nature protocols, 8, 2440-2448.
§ Size ~150 nm§ Environmentally friendly§ Negative surface charge
DNA Nanotracers à Hydraulische Tomographie
0.0E+00
1.0E-04
2.0E-04
3.0E-04
4.0E-04
5.0E-04
6.0E-04
7.0E-04
8.0E-04
-400 100 600 1100 1600
C/C 0
Time[min]
UranineDNA…

Geothermal Energy and GeofluidsMartin Saar ([email protected])Martin Saar ([email protected])
Vortrag
23
q Die geothermische Situation in der Schweiz
q Unkonventionelle Geothermische Energie für die Schweiz:
1) Petrothermie (HDR, EGS)
2) CO2 Geothermie
3) Geothermischer Vorwärmer
q Zusammenfassung
Geothermal Energy and GeofluidsMartin Saar ([email protected])
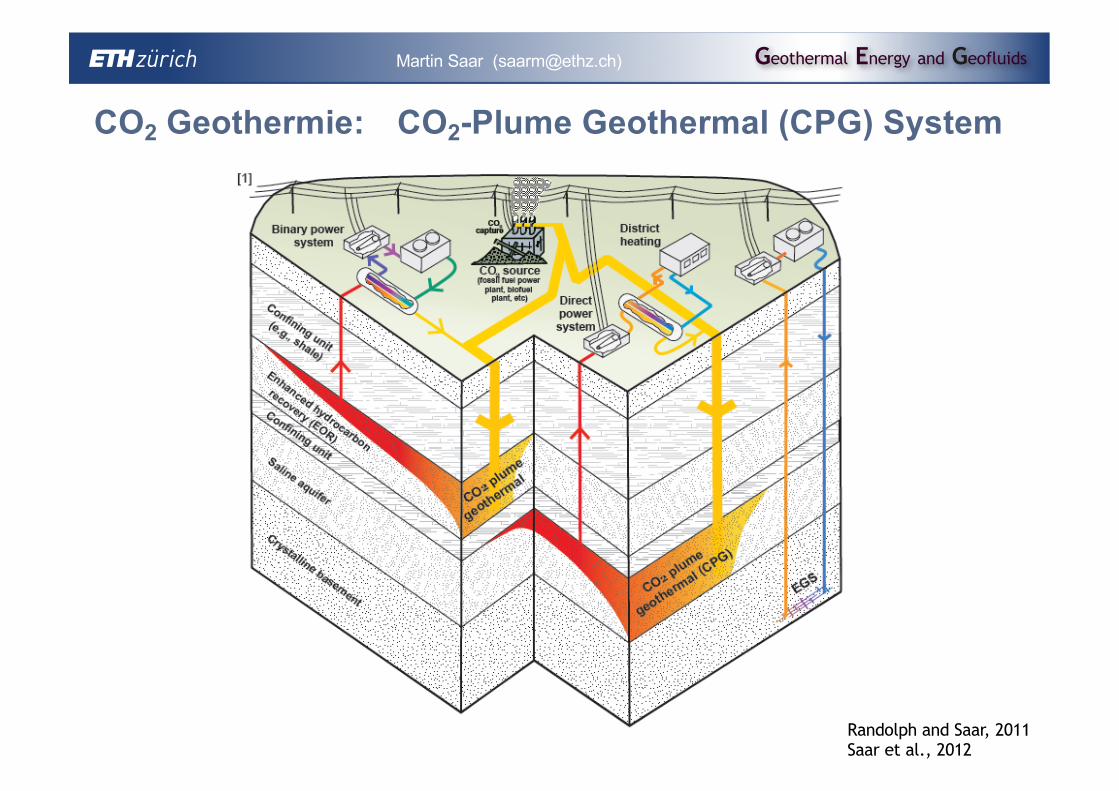
Randolph and Saar, 2011Saar et al., 2012
CO2 Geothermie: CO2-Plume Geothermal (CPG) System
Geothermal Energy and GeofluidsMartin Saar ([email protected])
Randolph and Saar, 2011Saar et al., 2012
Saar et al. (2013)
CO2 Geothermie: CO2-Plume Geothermal (CPG) Systemenergypathways.org
Geothermal Energy and GeofluidsMartin Saar ([email protected])
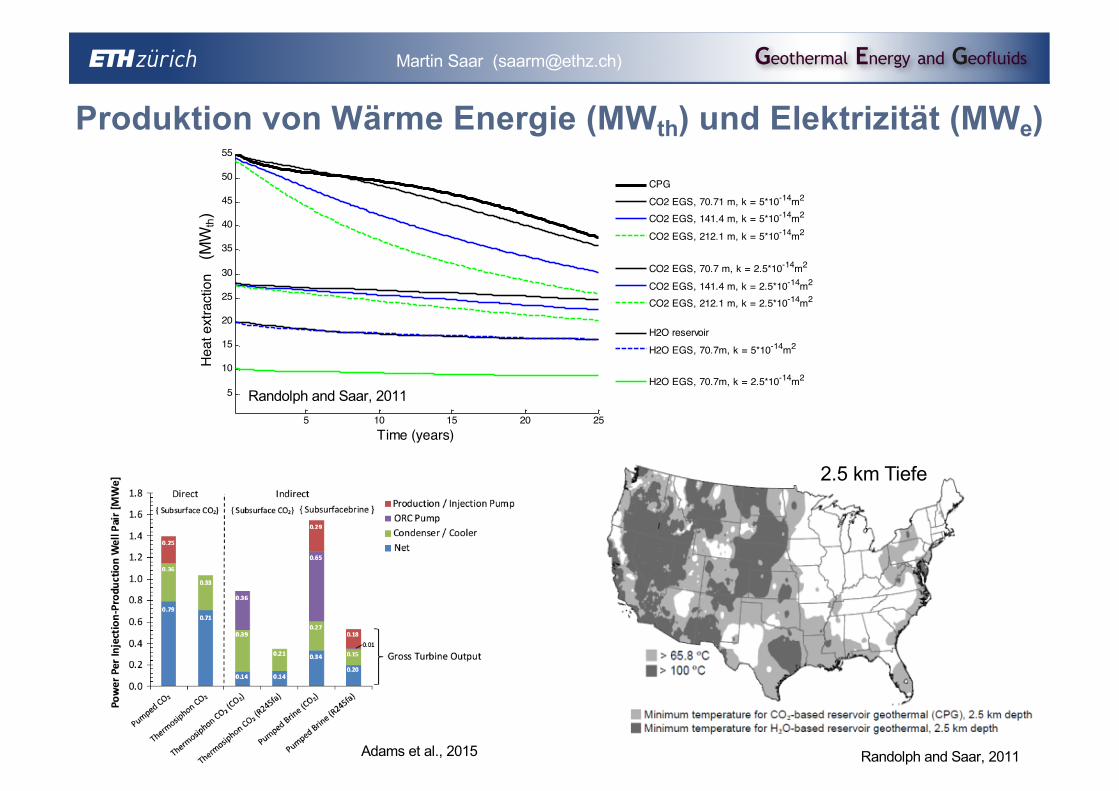
Produktion von Wärme Energie (MWth) und Elektrizität (MWe)
5 10 15 20 25
5
10
15
20
25
30
35
40
45
50
55
Time (years)
Hea
t ext
ract
ion
rate
s (M
W)
CPGCO2 EGS, 70.71 m, k = 5*10-14m2
CO2 EGS, 141.4 m, k = 5*10-14m2
CO2 EGS, 212.1 m, k = 5*10-14m2
CO2 EGS, 70.7 m, k = 2.5*10-14m2
CO2 EGS, 141.4 m, k = 2.5*10-14m2
CO2 EGS, 212.1 m, k = 2.5*10-14m2
H2O reservoirH2O EGS, 70.7m, k = 5*10-14m2
H2O EGS, 70.7m, k = 2.5*10-14m2
Randolph and Saar, 2011
(MW
th)
Adams et al., 2015
2.5 km Tiefe
Randolph and Saar, 2011
Geothermal Energy and GeofluidsMartin Saar ([email protected])
Research Paper
2Buscheck et al. | Multifluid geo-energy systemsGEOSPHERE | Volume 12 | Number 3
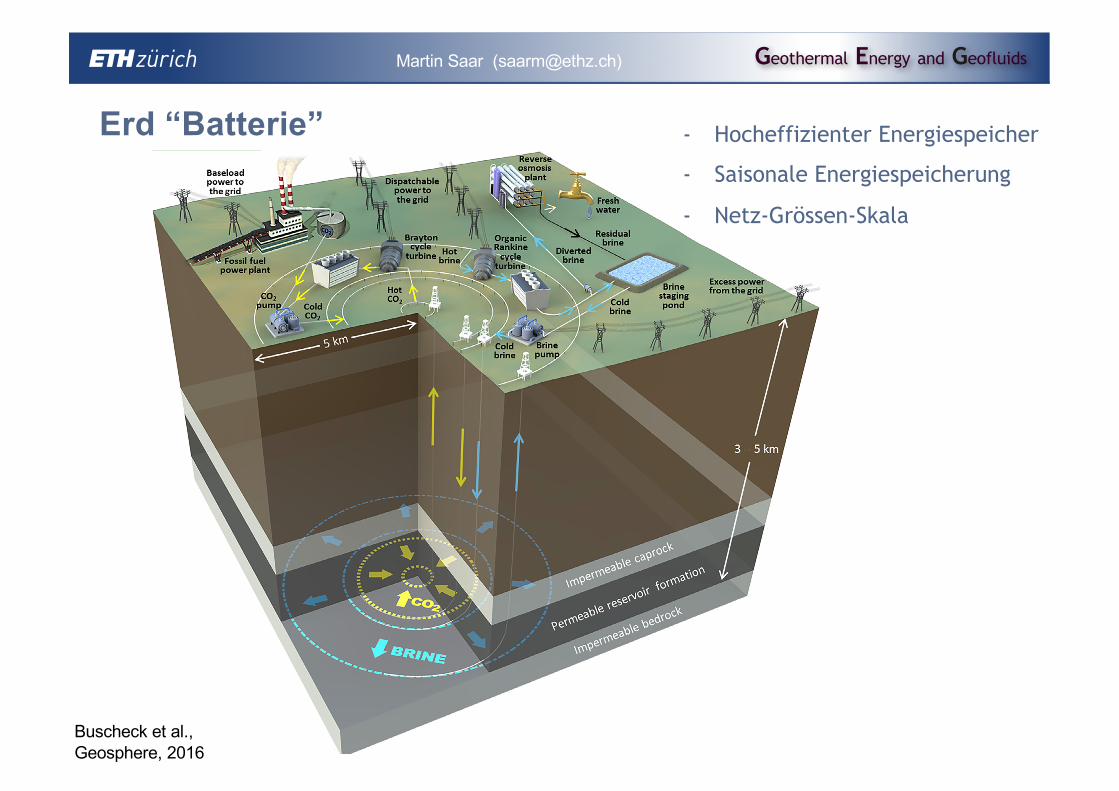
Figure 1. Components of a multifluid geo-energy system, including four rings of horizontal injection and production wells. Supercritical CO2 from a fossil fuel power plant is pressurized for injection in the sec-ond ring of wells, which displaces brine produced at the inner ring. Grad ually, the inner ring produces CO2, which is sent through a Brayton cycle turbine and pres-surized for injection in the second ring. Brine produced at the inner and outer well rings is sent through a power plant, such as an organic Rankine cycle turbine, stored in a staging pond, and pressurized for in-jection in the third well ring, using excess power from the grid. To manage pressure, some of the produced brine is diverted for consumptive use, such as in a reverse osmosis plant. The production of pressur-ized CO2 and brine can be varied to provide dispatchable power to the grid. Although not shown in this figure, each well ring in-cludes multiple hori zontal wells. Also not shown in this figure are field multi fluid separators that separate produced brine from the CO2 produced from the inner ring of wells.
Erd “Batterie”
Buscheck et al., Geosphere, 2016
- Hocheffizienter Energiespeicher
- Saisonale Energiespeicherung
- Netz-Grössen-Skala
Geothermal Energy and GeofluidsMartin Saar ([email protected])Martin Saar ([email protected])
Vortrag
28
q Die geothermische Situation in der Schweiz
q Unkonventionelle Geothermische Energie für die Schweiz:
1) Petrothermie (HDR, EGS)
2) CO2 Geothermie
3) Geothermischer Vorwärmer
q Zusammenfassung
Geothermal Energy and GeofluidsMartin Saar ([email protected])
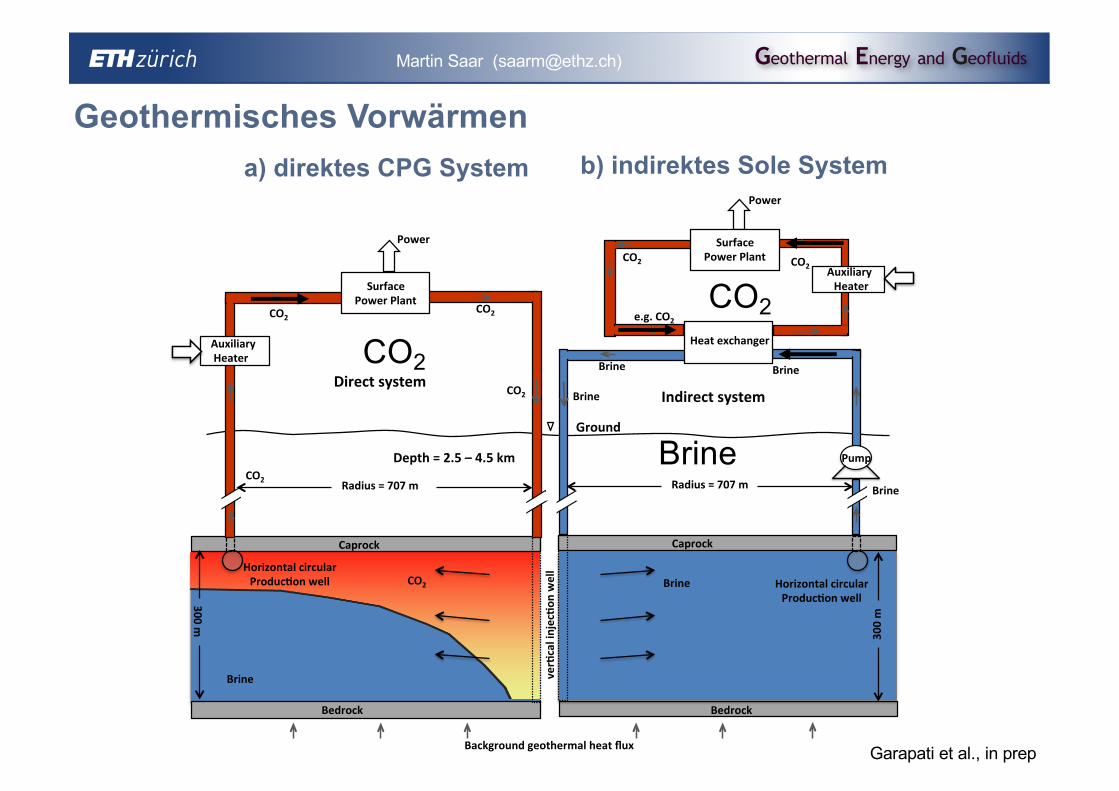
Garapati et al., in prep
Geothermisches Vorwärmen
!!
Bedrock!Bedrock!
Background!geothermal!heat!flux!!
Caprock!Caprock!
Horizontal!circular!Produc9on!well!
Brine!
CO2!
300!m!
Brine!
300!m!
Ground!
Power!
Power!
Indirect!system!
Heat!exchanger!
e.g.!CO2!
Brine!
Brine!
Brine!Direct!system!
CO2!
Brine!
CO2!
CO2!
CO2!
Radius!=!707!m! Radius!=!707!m!
Depth!=!2.5!–!4.5!km!
Horizontal!circular!Produc9on!well!
ver9cal!injec9o
n!well!
CO2! Auxiliary!!Heater!
CO2!
Auxiliary!!Heater!
Surface!!Power!Plant!
Surface!!Power!Plant!
Pump!
CO2
CO2
Brine
a) direktes CPG System b) indirektes Sole System
Geothermal Energy and GeofluidsMartin Saar ([email protected])Martin Saar ([email protected])
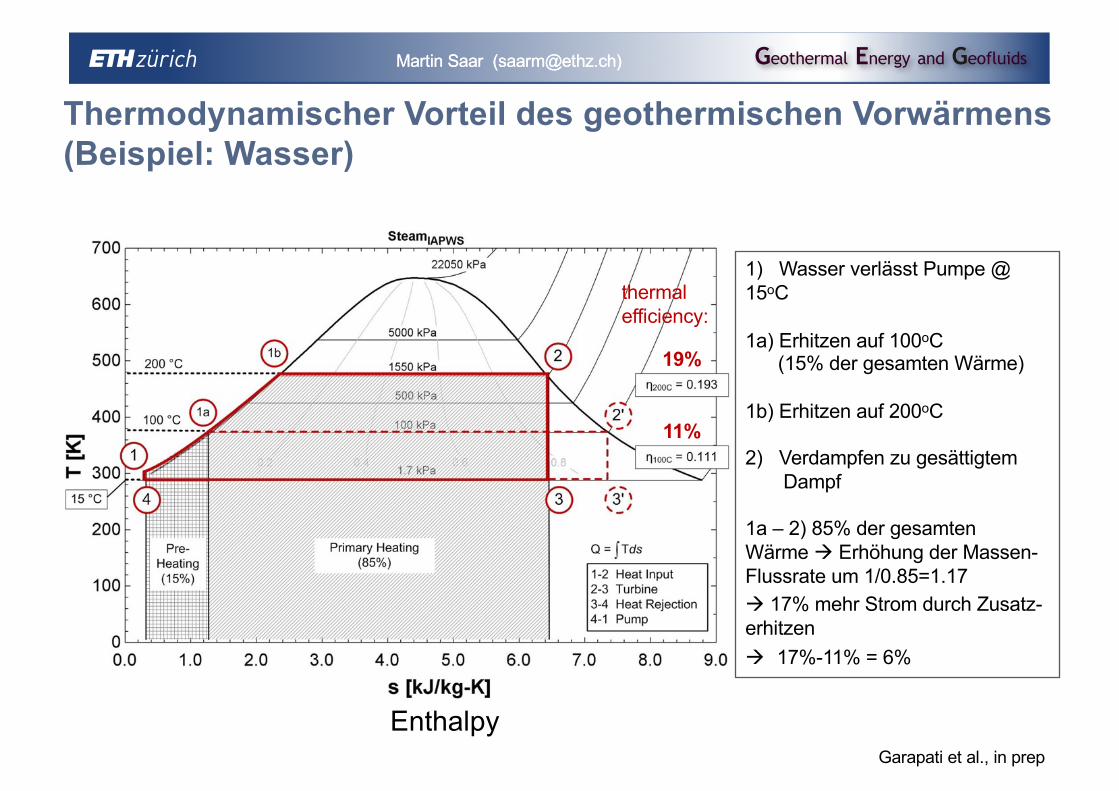
Thermodynamischer Vorteil des geothermischen Vorwärmens(Beispiel: Wasser)
Garapati et al., in prep
19%
11%
thermalefficiency:
1) Wasser verlässt Pumpe @ 15oC
1a) Erhitzen auf 100oC(15% der gesamten Wärme)
1b) Erhitzen auf 200oC
2) Verdampfen zu gesättigtem Dampf
1a – 2) 85% der gesamten Wärme à Erhöhung der Massen-Flussrate um 1/0.85=1.17à 17% mehr Strom durch Zusatz-erhitzen à 17%-11% = 6%
Enthalpy
Geothermal Energy and GeofluidsMartin Saar ([email protected])Martin Saar ([email protected])
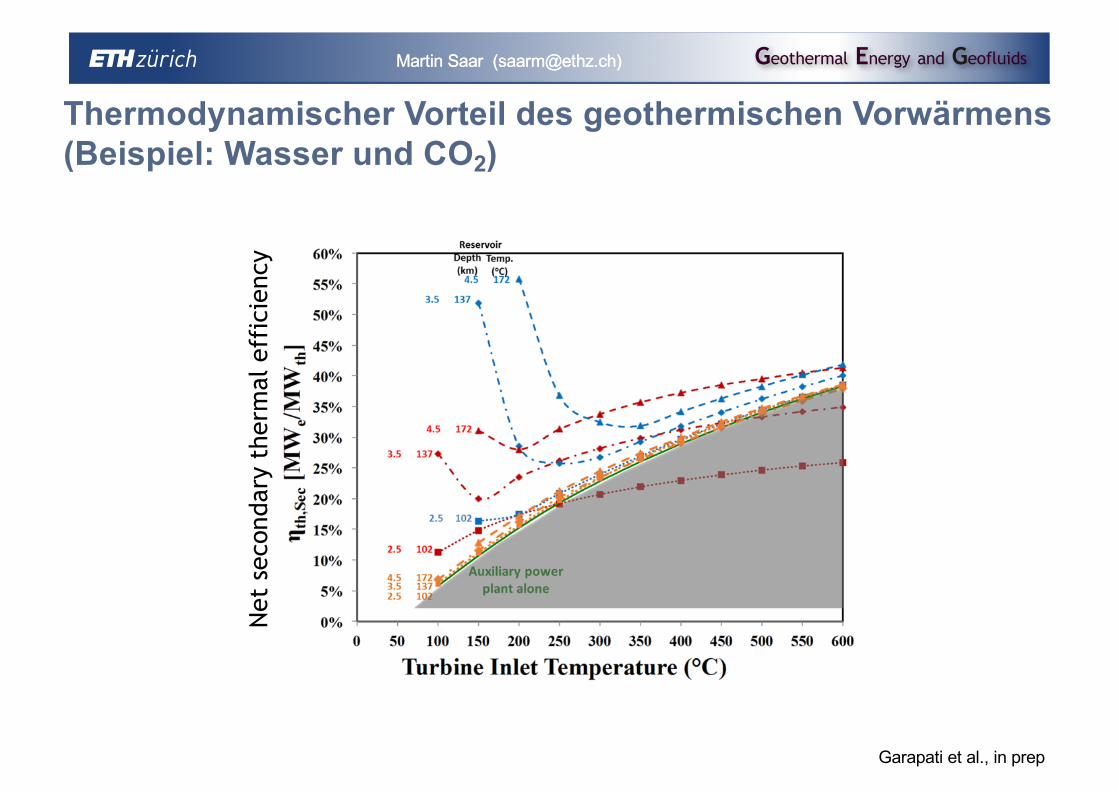
Garapati et al., in prep
Net
sec
onda
ry t
herm
al e
ffic
ienc
y
Thermodynamischer Vorteil des geothermischen Vorwärmens(Beispiel: Wasser und CO2)
Geothermal Energy and GeofluidsMartin Saar ([email protected])Martin Saar ([email protected])
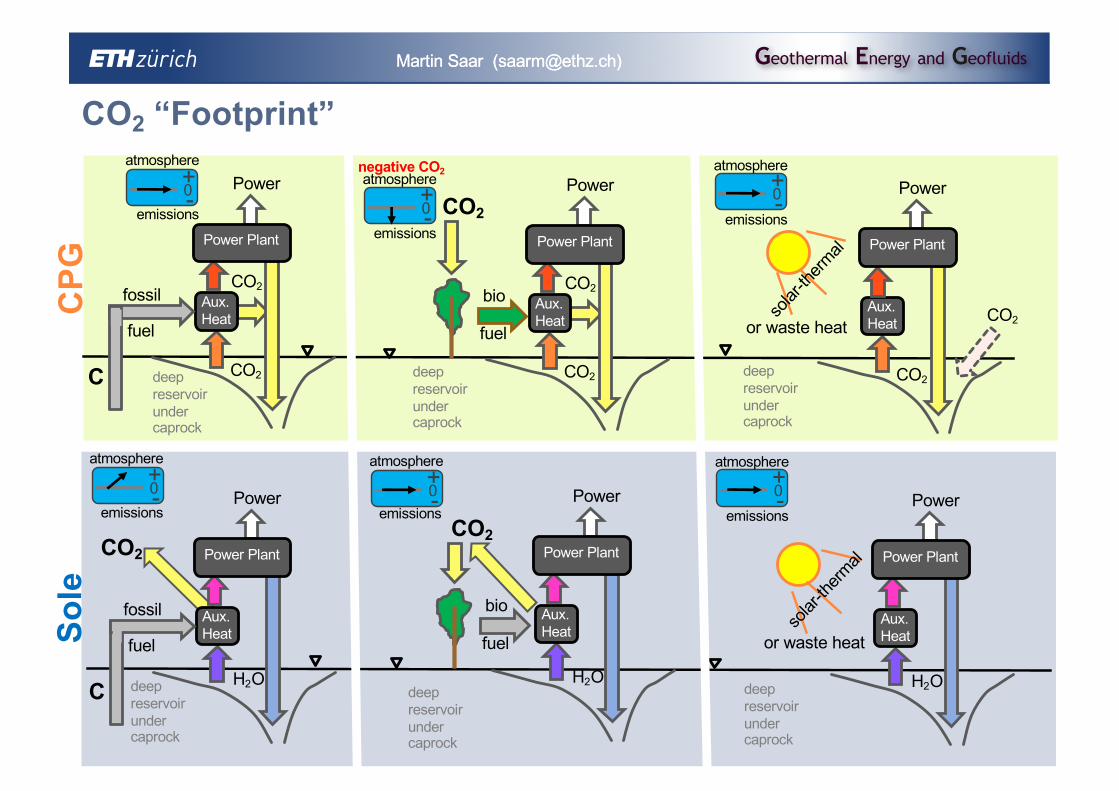
CO2 “Footprint”
Aux. Heat
Power
Power Plant
fossil
fuel
CO2
CO2
Aux. Heat
Power
Power Plant
CO2
bio
fuel
CO2
CO2
CO2
Aux. Heat
Power
Power Plant
CO2
CO2or waste heat
C
Aux. Heat
Power
Power Plant
fossil
fuel
H2OC
Aux. Heat
Power
Power Plant
H2O
bio
fuel
CO2
Aux. Heat
Power
Power Plant
H2O
or waste heat
+-0 +
-0+-0
+-0
+-0
+-0
CPG
Sole
atmosphere
emissions
atmosphere
emissions
atmosphere
emissions
atmosphere
emissions
atmosphere
emissions
atmosphere
emissions
deep reservoir under caprock
deep reservoir under caprock
deep reservoir under caprock
deep reservoir under caprock
deep reservoir under caprock
deep reservoir under caprock
negative CO2
Geothermal Energy and GeofluidsMartin Saar ([email protected])Martin Saar ([email protected])
Vortrag
33
q Die geothermische Situation in der Schweiz
q Unkonventionelle Geothermische Energie für die Schweiz:
1) Petrothermie (HDR, EGS)
2) CO2 Geothermie
3) Geothermischer Vorwärmer
q Zusammenfassung
Geothermal Energy and GeofluidsMartin Saar ([email protected])Martin Saar ([email protected])
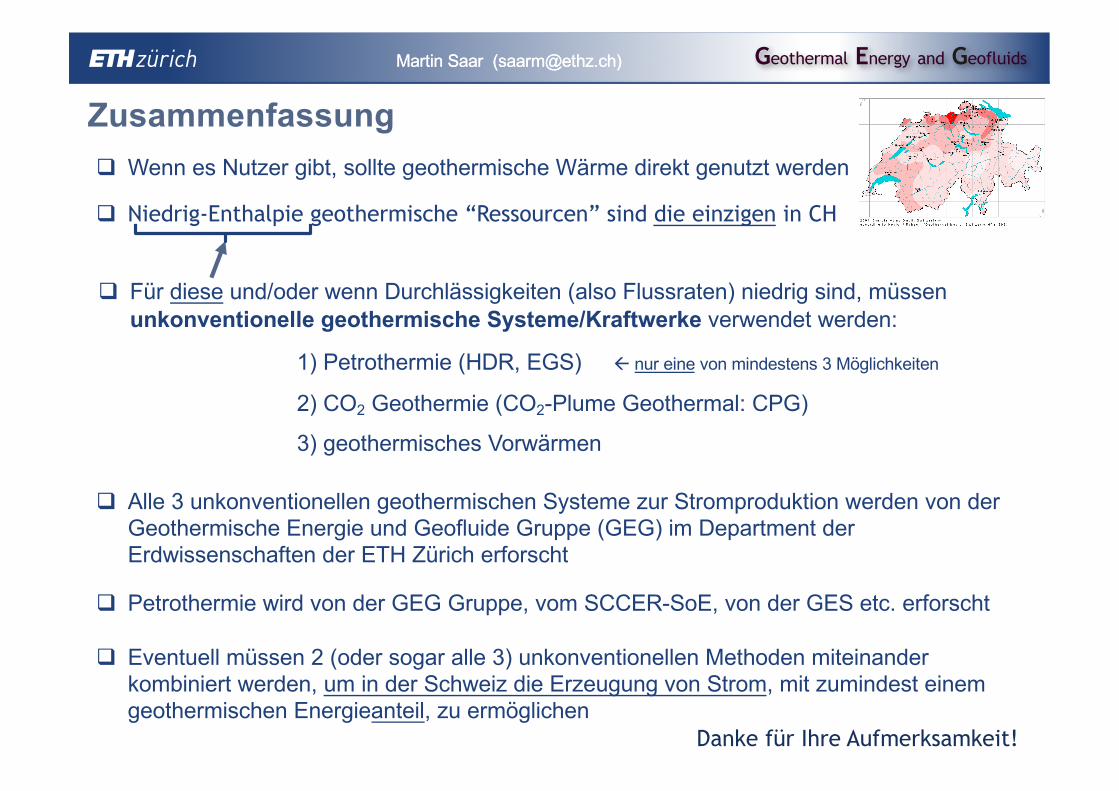
Zusammenfassungq Wenn es Nutzer gibt, sollte geothermische Wärme direkt genutzt werden
q Für diese und/oder wenn Durchlässigkeiten (also Flussraten) niedrig sind, müssen unkonventionelle geothermische Systeme/Kraftwerke verwendet werden:
q Alle 3 unkonventionellen geothermischen Systeme zur Stromproduktion werden von der Geothermische Energie und Geofluide Gruppe (GEG) im Department der Erdwissenschaften der ETH Zürich erforscht
q Niedrig-Enthalpie geothermische “Ressourcen” sind die einzigen in CH
1) Petrothermie (HDR, EGS) ß nur eine von mindestens 3 Möglichkeiten
2) CO2 Geothermie (CO2-Plume Geothermal: CPG)
3) geothermisches Vorwärmen
q Petrothermie wird von der GEG Gruppe, vom SCCER-SoE, von der GES etc. erforscht
q Eventuell müssen 2 (oder sogar alle 3) unkonventionellen Methoden miteinander kombiniert werden, um in der Schweiz die Erzeugung von Strom, mit zumindest einem geothermischen Energieanteil, zu ermöglichen
Danke für Ihre Aufmerksamkeit!
Top Related