


Languages
Pages
Legal


ENVIRONMENTAL IMPACT ASSESSMENT STUDY For the Expansion of Chemical Unit
(Manufacture of Technical grade pesticide
and intermediates)
Plot No A�4/1-2,
SIPCOT Industrial Complex
S.F. Nos: Old No: 173/3, New No: 54
PachayanKuppam village
Cuddalore Taluk
Cuddalore District
By
I S O 9 0 0 1 : 2 0 0 0 Cer t i f i e d Co m p an y
43, 2nd Street Harvey Nagar
Madurai � 625 016.

TABLE OF CONTENTS
Chapter#
Title
Page#
1.0 INTRODUCTION .................................................................................... 1
1.1 Background ........................................................................................ 1
1.2 Need of EIA ........................................................................................ 1
1.3 Objectives of EIA-EMP ......................................................................... 2
1.4 Methodology for EIA-EMP ..................................................................... 2 1.4.1 Assessment of Existing Environmental Quality ......................................................................... 3
2.0 PLANT, PROCESS & POLLUTANTS .......................................................... 4
2.1 Plant Location ..................................................................................... 4
2.2 Products and Production Capacity .......................................................... 9
2.3 By products ........................................................................................ 9
2.4 Raw Materials ................................................................................... 10
2.5 Manufacturing Process ....................................................................... 22
2.6 Plant Layout and list of machineries: ................................................... 42
2.8 Work Force .......................................................................................... 51
2.9 Power Generation and Consumption ........................................................ 51 2.9.1 Raw Water Source................................................................................................................................. 53
2.10 Waste Generation ............................................................................... 53 2.10.1 Wastewater .................................................................................................................................................... 53 2.10.2 Solid Waste ........................................................................................................................................... 54
3.0 BASELINE ENVIRONMENTAL STATUS .................................................. 55
3.1 Introduction ..................................................................................... 55
3.2 Micrometeorology.............................................................................. 55 3.2.1 Temperature ......................................................................................................................................... 55 3.2.2 Rainfall ..................................................................................................................................................... 56 3.2.3 Relative Humidity ................................................................................................................................ 57 3.2.4 Wind Direction ...................................................................................................................................... 57 3.2.5 Wind Speed ........................................................................................................................................... 57
3.3 Soil Quality ...................................................................................... 71
3.4 Water Quality ................................................................................... 71
3.5 Ambient Air Quality ........................................................................... 75 3.5.1 Frequency and Parameters for Sampling................................................................................... 75

3.6 Noise Environment ............................................................................ 80
3.7 Land use Studies ............................................................................... 83 3.7.1 Objectives .............................................................................................................................................. 83 3.7.2 Methodology .......................................................................................................................................... 83
3.8 Biological Environment....................................................................... 83 3.8.1 Vegetation & Wildlife Impact Analysis ........................................................................................ 83
3.9 Socio-Economic Environment .............................................................. 87 3.9.1 Reconnaissance ................................................................................................................................... 87 3.9.2 Population .............................................................................................................................................. 87 3.9.3 Power and Energy ............................................................................................................................... 87 3.9.4 Agriculture ............................................................................................................................................. 88 3.9.5 Occupation ............................................................................................................................................. 88 3.9.6 Workers .................................................................................................................................................. 88 3.9.7 Others ...................................................................................................................................................... 88 3.9.8 Marginal Workers ................................................................................................................................ 89 3.9.9 Education and Literacy ...................................................................................................................... 89 3.9.10 Transport and Communication ...................................................................................................... 89
4.0 IMPACT ANALYSIS .............................................................................. 91
4.1 Preamble ......................................................................................... 91
4.2 Construction Phase ............................................................................ 91 4.2.1 Land Transportation and Construction ....................................................................................... 92 4.2.2 Land Use ................................................................................................................................................. 92 4.2.3 Water Resources ................................................................................................................................. 92 4.2.4 Air Quality .............................................................................................................................................. 92 4.2.5 Service System .................................................................................................................................... 93 4.2.6 Biological Conditions .......................................................................................................................... 93 4.2.7 Transportation System ........................................................................................................................ 93 4.2.8 Noise ........................................................................................................................................................ 93 4.2.9 Aesthetics ............................................................................................................................................... 93 4.2.10 Community Structure ........................................................................................................................ 93 4.2.11 Accident Risk ........................................................................................................................................ 93 4.2.12 Resources ............................................................................................................................................... 94
4.3 Operational Phase ............................................................................. 94 4.3.1 Land Transportation and Construction ....................................................................................... 94 4.3.2 Land Use ................................................................................................................................................. 94 4.3.3 Water Resources ................................................................................................................................. 96 4.3.4 Water Impact ........................................................................................................................................ 96 4.3.5 Air Environment ................................................................................................................................... 97 4.3.6 Service System .................................................................................................................................... 97 4.3.7 Biological Conditions .......................................................................................................................... 97 4.3.8 Transportation System ..................................................................................................................... 98 4.3.9 Noise Impact ........................................................................................................................................... 98 4.3.10 Aesthetics .............................................................................................................................................. 98 4.3.11 Community Structure ........................................................................................................................ 98 4.3.12 Hazardous .............................................................................................................................................. 99 4.3.13 Resources ............................................................................................................................................... 99

5.0 ENVIRONMENTAL MANAGEMENT PLAN ............................................. 100
5.1 Waste Minimization ......................................................................... 100 5.1.1 Management Commitment ............................................................................................................ 100 5.1.2 Raw Material Selection .................................................................................................................... 101
5.2 AIR Environment ................................................................................ 101
5.3 Noise Environment .......................................................................... 102
5.4 Water Environment ......................................................................... 102
5.5 Solid Waste Management ................................................................. 108
5.6 Land Environment ........................................................................... 109
5.7 Socio-Economic Environment ............................................................ 109
5.8 Post-Project Environment Monitoring ................................................. 109
5.9 Control Measures for Safety & Occupational Health ............................. 109
5.10 Greenbelt Development ................................................................. 112 5.10.1 Objectives ............................................................................................................................................ 112 5.10.2 Greenbelt Design .............................................................................................................................. 112
6.0 ENVIRONMENTAL IMPACT STATEMENT ............................................. 115
6.1 Noise Environment .......................................................................... 115
6.2 Water Environment ......................................................................... 115
6.3 Land Environment ........................................................................... 115
6.4 Socio-Economic Environment ............................................................ 115

LIST OF TABLES
Table 3.1 � Meteorological Data ............................................................................... 56
Table 3.2 � Relations among stability classification schemes ....................................... 61
Table 3.3 � AVERAGE MINIMUM TEMPERATURE (oC) FOR DIFFERENT MONTH ............... 62
Table 3.4 � AVERAGE MAXIMUM TEMPERATURE (oC) FOR DIFFERENT MONTHS ............. 63
Table 3.5 � MONTHLY RAINFALL DATA ..................................................................... 64
Table 3.6 � MONTHLY MEAN RELATIVE HUMIDITY (%) AT 0830 HOUR ......................... 65
Table 3.7 � MONTHLY MEAN RELATIVE HUMIDITY (%) AT 1730 HOURS ....................... 66
Table 3.8 � MONTHLY AVERAGE WIND SPEED, 24 HRS (KMPH) ................................... 67
Table 3.9 � Soil Quality .......................................................................................... 72
Table 3.10 � Characteristics of Water ....................................................................... 73
Table 3.11�Ambient Air Quality Status (SPM) � April and June 2008 ............................ 76
Table 3.12 �Ambient Air Quality Status (RPM)�April to June 2008................................ 77
Table 3.13�Ambient Air Quality Status (SO2) � April and June 2008 ............................. 77
Table 3.14�Ambient Air Quality Status (NOx) � April and June 2008 ............................. 78
Table 3.15 � Equivalent Day-Night Noise Level Details ............................................... 81
Table 3.16 � Details of Population ............................................................................ 90

Tagros Chemicals India Limited
Chapter I 1
1.0 INTRODUCTION
1.1 Background
M/s. Tagros Chemicals India Limited (TCIL), located at the
SIPCOT Industrial estate,Pachayankuppam village, Cuddalore district
in the TamilNadu State is a leading manufacturer of technical grade
pesticides and intermediates. TCIL is having the consent of the
TamilNadu Pollution Control Board (TNPCB) for the production of D.V.
Acid Chloride, Quinopyramine Sulphate, Cypermethrine / Permethrin /
Alphacypermethrin / Deltamethrin, Oxyclozanide, Hexaconazole /
Propiconazole / Dicamba / Tricyclazole and Metaphenoxy benzyl
alcohol at the rate of 145.75 T/Month. They also have the consent to
produce 2545 T/Month of by products such as hydrochloric acid, spent
sulphuric acid, sodium sulphite solution, sodium sulphite powder,
hydrogen bromide solution and aluminium chloride solution.
The gross assets value of the project cost is 20 crores.
1.2 Need of EIA
Rapid urbanization and industrialization particularly in developing
countries have resulted in a considerable impact on the environment.
During the last few decades there has been a growing realization that
development cannot be sustained unless the environment is
preserved. Hence, Government is making it mandatory that industrial
and other development projects be taken up only after conducting
Environmental Impact Assessment Study of the same. So that, the
quality of the environment is not only preserved but could also be
enhanced. According to the procedures laid down, Tamil Nadu Pollution
Control Board (TNPCB) and Ministry of Environment and Forests
(MoEF), New Delhi is empowered to scrutinize proposals for industrial
projects only if they are accompanied by EIA report. Unless the report
on a proposed project is cleared, the project cannot be implemented.

Tagros Chemicals India Limited
Chapter I 2
1.3 Objectives of EIA-EMP
The basic objective of EIA-EMP exercise is to minimize adverse impacts
of any development on the environment. Besides fulfilling the legal
requirement for getting environmental clearance from concerned
authorities, the specific objectives of the EIA-EMP are as follows.
To review the current environmental status of the plant site and its
surrounding area and to estimate the pollution that would occur
after the expansion of the plant and its impact on the surrounding
environment.
To suggest EMP including pollution control methods to ensure that
the pollution will be well within the limits prescribed by the CPCB
and TNPCB, and to minimize the adverse environmental impacts of
the plant, so that the quality of environment is not only preserved
but also be enhanced.
To propose a post-project environment-monitoring plan to ensure
that the EMP achieves it�s desired objectives.
1.4 Methodology for EIA-EMP
The methodology is based on existing guidelines and has the following
distinct features.
The existing environmental quality in the project area has to be
assessed.
Potential sources of pollution have to be identified.
Potential environmental impacts have to be identified and assessed
qualitatively. The changes in the quality of environment have to be
identified.
An EMP has to be drawn up to maintain and enhance the
environmental quality around the proposed project area.

Tagros Chemicals India Limited
Chapter I 3
A post-project environment-monitoring plan has to be suggested to
monitor the changes in environmental quality after the
implementation of the project.
Potential benefits of EIA-EMP have to be discussed.
1.4.1 Assessment of Existing Environmental Quality
In the case of an industrial project almost all components such as air,
water, land, soil, noise, etc., get equally affected. Hence, the existing
quality of environment viz. air, water, land, soil and socio-economics
of the people in the area have been assessed.
Tagros Chemicals India Limited
Chapter II 4
2.0 PLANT, PROCESS & POLLUTANTS
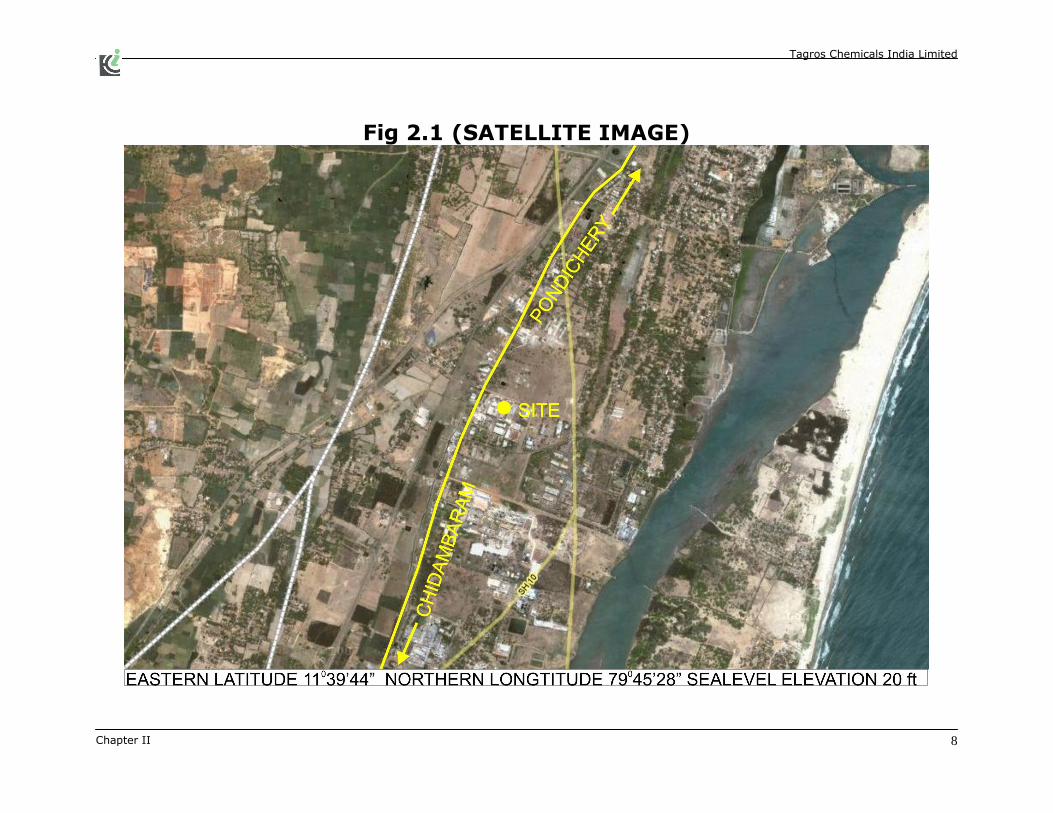
2.1 Plant Location
The Plant is located at Plot No.A-4/1-2, SIPCOT Industrial Complex, SF
Nos: OldNo: 173/3, New No: 54. Pachayankuppam Village, Cuddalore
Taluk, Cuddalore District, TamilNadu. The site is located about 2 km
away from Cuddalore Old Town and it is in-between the road
connecting Chidambaram and Pondichery. The site is located East
direction of this road. The nearest railway station is Cuddalore. The
location of the site is shown in Fig. 2.1.
Following are the details regarding the proposed site.
a) Archaeological monuments
The location does not have any archaeological monuments in
nearby 10 km radius.
b) Biological resources
It was found during study period that the location is devoid of
any endangered flora and fauna in 10 km radius.
c) Cultural Monuments
This Expansion unit does not have cultural monuments in
nearby 10km radius.
d) Defence
There is no defence installation located within 10 km radius.
e) Employment Generation
This expansion unit generates the employment in the immediate
surroundings of the people who are depending mainly on rain
fed agriculture.

Tagros Chemicals India Limited
Chapter II 5
f) Highway
The nearest highway is Chidambaram � Pondichery highway.
The setting up of this unit will not harm the traffic and unwanted
settlement in the vicinity of highway.
g) Geography
The location is geographically suitable for setting up of proposed
expansion unit, as the unit will not be disturbed by climatic and
other geographical condition.
h) Transportation facilities
The Industrial site is well connected by road. The important
townships falling within 60 km radius are Cuddalore,
Chidambaram, Pondichery and Pantruti. The nearest railway
station is Cuddalore and airport is Trichy.
i) Socio-economic
This expansion unit will improve the economy at state/national
level.
j) Land use and availability
The plant will be erected in the land already in possession of the
company
k) Meteorology
Both micro and macro meteorology is found to be suitable for
this proposed unit.
l) Natural disaster
The area is devoid of natural disasters like earthquake, cyclone,
landslides etc.

Tagros Chemicals India Limited
Chapter II 6
m) On-site and off-site emergency buffering capacity
The unit will not use any hazardous substance. Hence the only
disaster of minor nature can be expected, which will be handled
by the work force of the unit without much difficulty.
n) Power
The industry draws power of 1475 KVA from TNEB grid for its
process and non-process usage for the existing purpose. After
expansion the power requirement will be 2700 KVA.
o) Raw material
Raw material is easily available in Cuddalore where many similar
units are already in operation.
p) Sensitive area
The location does not have any sensitive area as identified by
MoEF in 25 km radius.
q) Topography
The topography is plain and will not lead to disaster by
accumulation of air pollutants.

Tagros Chemicals India Limited
Chapter II 7
Tagros Chemicals India Limited
Chapter II 8
Fig 2.1 (SATELLITE IMAGE)

Tagros chemicals India Limited
Chapter II 9
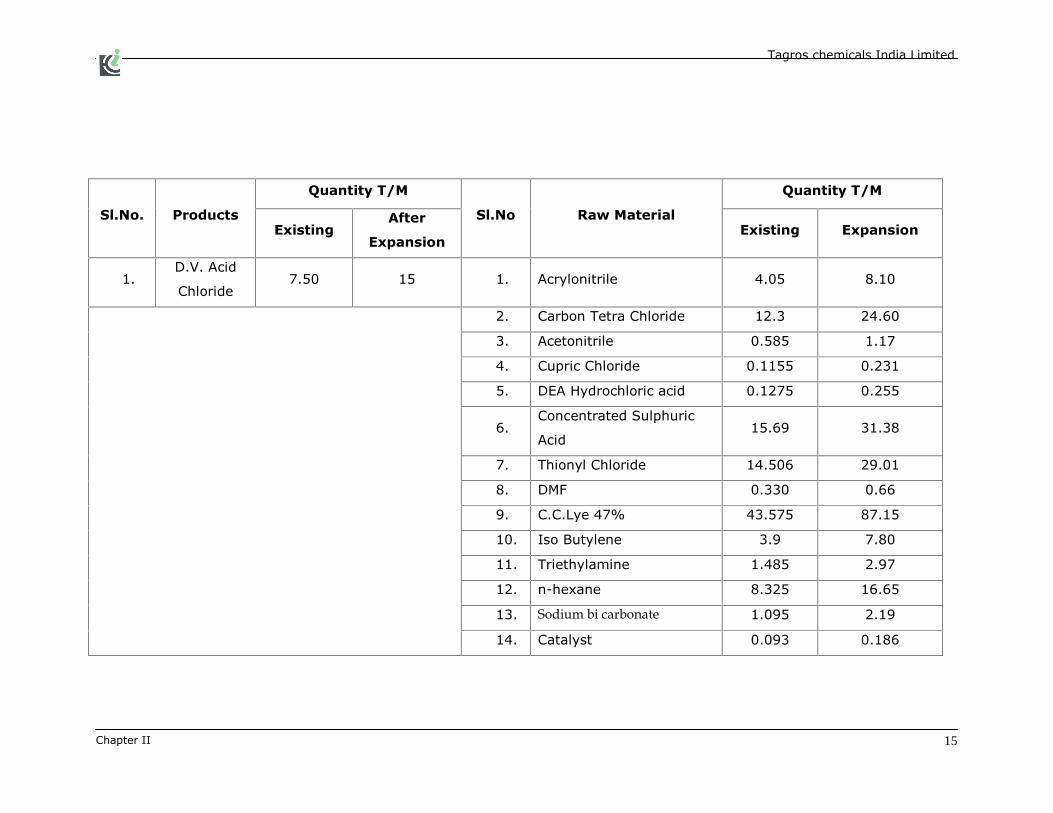
2.2 Products and Production Capacity
Sl.No. Products Quantity T/M
Existing After Expansion
1. D.V. Acid Chloride 7.50 15
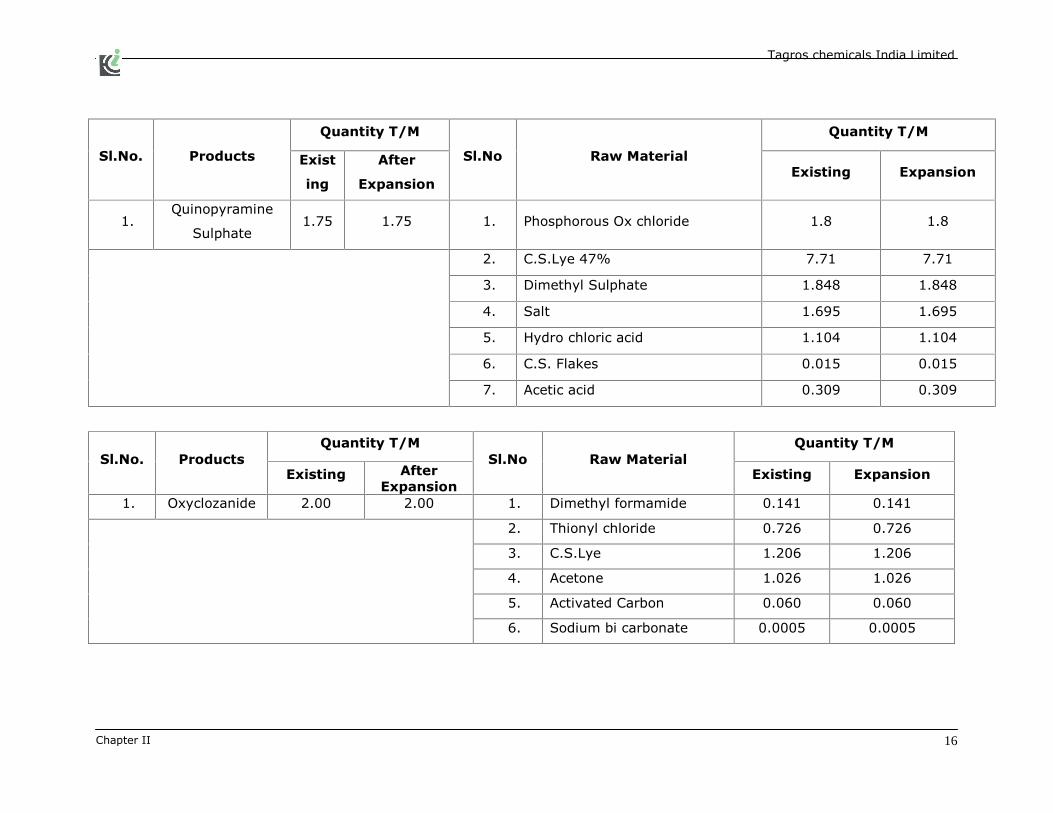
2. Quinopyramine sulphate 1.75 1.75
3. Alphacypermethrin / Cypermethrin /
Permethrin 100.00 175
4. Deltamethrin 7.50 20
5. Oxyclozanide 2.00 2.00
6. Hexaconazole / Propiconazole/
Dicamba / Tricyclazole 7.00 20.00
7. Metaphenoxy Benzyle Alcohol 20.00 40.00
Total 145.75 273.75
2.3 By products
Sl.No. Byproducts Quantity T/M
Existing After Expansion
1. Hydrochloric Acid 239.52 475
2. Spent sulphuric Acid Nil Nil
3. Sodium Sulphite solution 743.39 1350
4. Sodium Sulphite Powder 103.00 200
5. Hydrogen Bromide Solution Nil Nil
6. Aluminium Chloride Solution 23.55 330
7. Ammonium chloride 190.64 125
8. Mixture of Ortho and Para bromo
Toluene Nil 95
9. Iso PropoylAlcohol and EDC Nil 30
10. 2,2,2 � Tricholoroethyl 3,3 Dimethyl
-4- Chloro cyclo butanone Nil 40
Total 1300.10 2645.00

Tagros chemicals India Limited
Chapter II 10
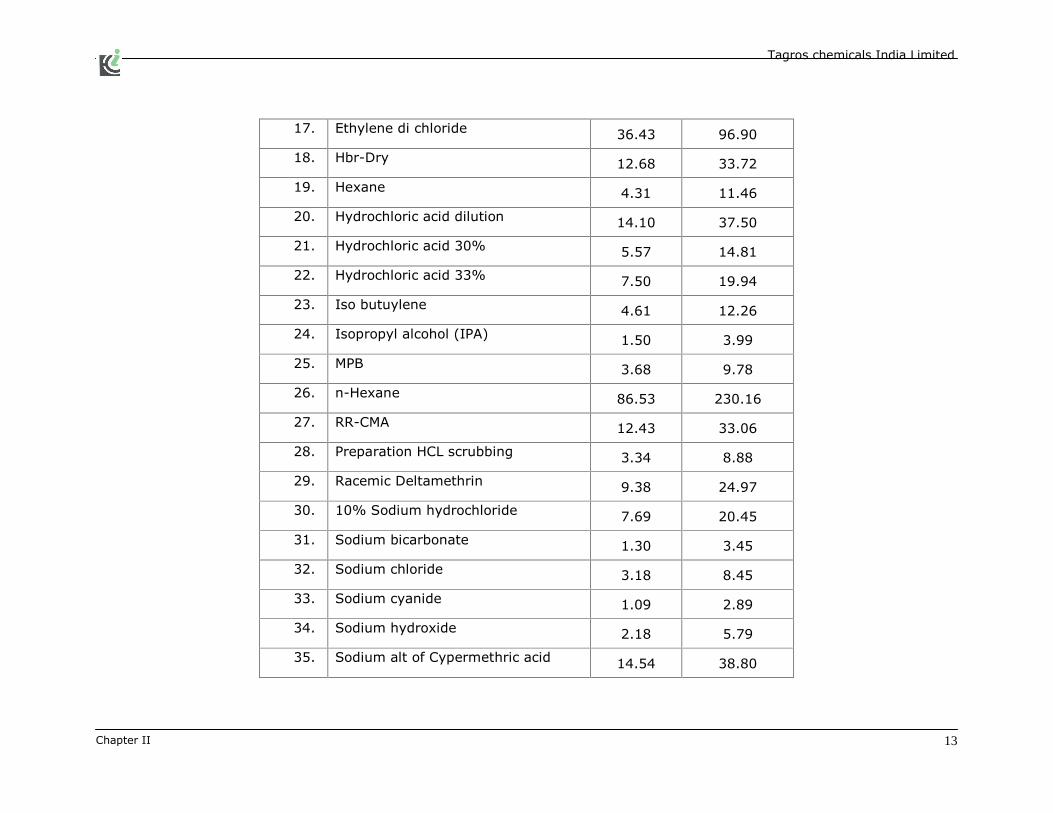
2.4 Raw Materials
Sl.No.
Raw Material For
Alphacypermethrin /
Cypermethrin / Permethrin
Quantity(T/M)
Existing
100 T/M
After
Expansion
175 T/M
1. Aceto nitrile 14.77 25.84
2. Acrylonitrile 31.60 55.30
3. C S Lye 47% 205.77 360.05
4. Carbon tetra chloride 96.00 168.00
5. Catalyst 1.47 2.57
6. 2-Chloro cyclobutanone 95.80 167.64
7. Conc.Sulphuric acid 130.67 228.67
8. Cupric chloride 0.90 1.57
9. Cypermethhric acid 60.7 106.22
10. DEA 0.03 0.05
11. DEA hydrochloric acid 1.00 1.75
12. Dimethyl formamide 2.60 4.55
13. D.V.acid chloride 117.30 205.27
14. Iso butylenes 30.73 53.77
15. Meta- phenoxy-benzaldehyde 98.77 172.84

Tagros chemicals India Limited
Chapter II 11
16. n-hexane 893.97 1564.54
17. Sodium bi-carbonate 8.70 15.25
18. Sodium chloride 21.27 37.22
19. Sodim hydroxide 11.43 20.00
20. Sodium hydroxide (100%) 3.10 5.42
21. Sodium hypo chloride 100 175.00
22. Sodium salt of cypermetric acid 97.07 169.87
23. Sodium cyanide 14.10 24.67
24. TEBAC-Catalyst 1.40 2.45
25. Tetrachlorobutyronitrile 106.63 186.60
26. Tetrachlorobutyronitrile acid 123.17 215.14
27. Tetrachlorobutyronitrile acid
chloride 123.17 215.14
28. Thionyl chloride 113.07 197.87
29. Tri-n-butylamine 1.23 2.15
30. Water 1789.13 3130.97

Tagros chemicals India Limited
Chapter II 12
S.No Raw Material For Deltamethrin
Quantity (T/M)
Existing
7.5 T/M
After
Expansion
20 T/M
1. Acetonitrile 2.21 5.87
2. Acrylonitrile 4.75 12.63
3. Aluminium Chloride 7.05 18.75
4. Becisthemic acid Crude 18.93 50.35
5. C. S. lye 47% 26.66 70.91
6. Carbon tetra chloride 14.41 38.33
7. Catalyst 0.22 0.58
8. Caustic lye 2.44 6.49
9. Caustic soda 1.74 4.62
10. 2-chloride cyclobutanone 14.35 38.17
11. Cis-CMA 9.09 24.17
12. Concentrated Sulphuric acid 18.64 49.58
13. Cupric chloride 0.12 0.31
14. Diethyl amine hydrochloride 0.15 0.39
15. DMF 0.02 0.05
16. Dissolve DMA 15.34 40.80
Tagros chemicals India Limited
Chapter II 13
17. Ethylene di chloride 36.43 96.90
18. Hbr-Dry 12.68 33.72
19. Hexane 4.31 11.46
20. Hydrochloric acid dilution 14.10 37.50
21. Hydrochloric acid 30% 5.57 14.81
22. Hydrochloric acid 33% 7.50 19.94
23. Iso butuylene 4.61 12.26
24. Isopropyl alcohol (IPA) 1.50 3.99
25. MPB 3.68 9.78
26. n-Hexane 86.53 230.16
27. RR-CMA 12.43 33.06
28. Preparation HCL scrubbing 3.34 8.88
29. Racemic Deltamethrin 9.38 24.97
30. 10% Sodium hydrochloride 7.69 20.45
31. Sodium bicarbonate 1.30 3.45
32. Sodium chloride 3.18 8.45
33. Sodium cyanide 1.09 2.89
34. Sodium hydroxide 2.18 5.79
35. Sodium alt of Cypermethric acid 14.54 38.80
Tagros chemicals India Limited
Chapter II 14
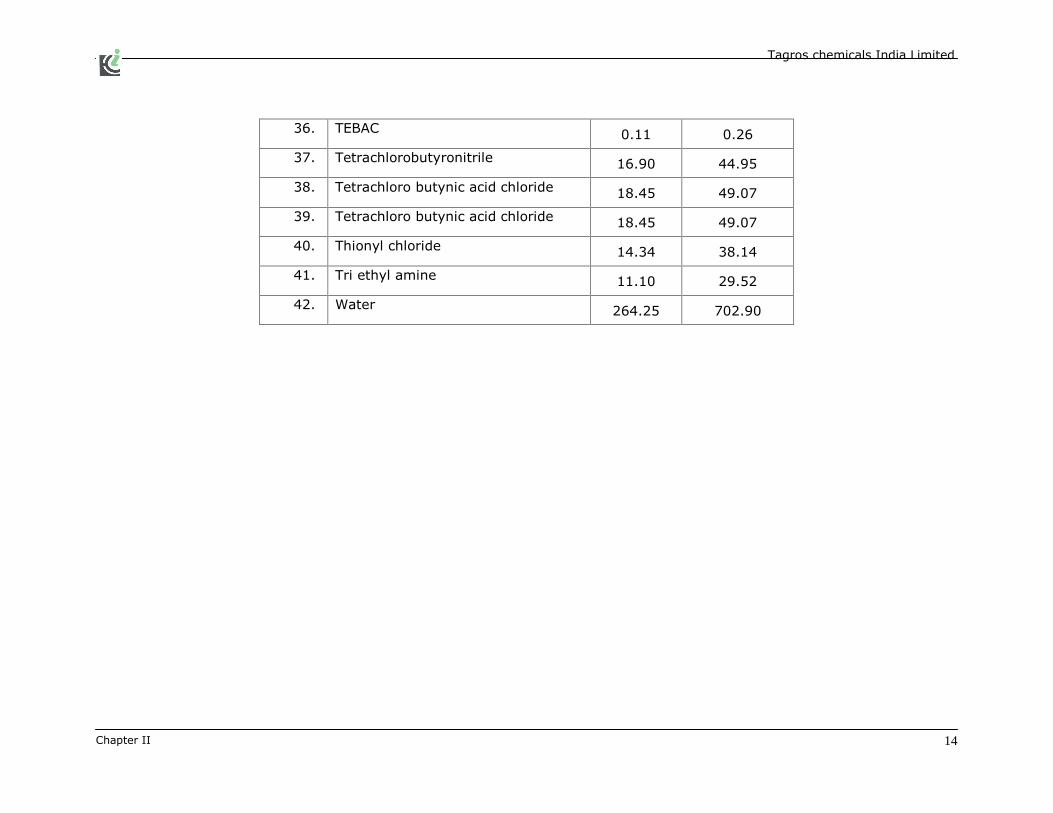
36. TEBAC 0.11 0.26
37. Tetrachlorobutyronitrile 16.90 44.95
38. Tetrachloro butynic acid chloride 18.45 49.07
39. Tetrachloro butynic acid chloride 18.45 49.07
40. Thionyl chloride 14.34 38.14
41. Tri ethyl amine 11.10 29.52
42. Water 264.25 702.90
Tagros chemicals India Limited
Chapter II 15
Sl.No. Products
Quantity T/M
Sl.No Raw Material
Quantity T/M
Existing After
Expansion Existing Expansion
1. D.V. Acid
Chloride 7.50 15 1. Acrylonitrile 4.05 8.10
2. Carbon Tetra Chloride 12.3 24.60
3. Acetonitrile 0.585 1.17
4. Cupric Chloride 0.1155 0.231
5. DEA Hydrochloric acid 0.1275 0.255
6. Concentrated Sulphuric
Acid 15.69 31.38
7. Thionyl Chloride 14.506 29.01
8. DMF 0.330 0.66
9. C.C.Lye 47% 43.575 87.15
10. Iso Butylene 3.9 7.80
11. Triethylamine 1.485 2.97
12. n-hexane 8.325 16.65
13. Sodium bi carbonate 1.095 2.19
14. Catalyst 0.093 0.186
Tagros chemicals India Limited
Chapter II 16
Sl.No. Products
Quantity T/M
Sl.No Raw Material
Quantity T/M
Exist
ing
After
Expansion Existing Expansion
1. Quinopyramine
Sulphate 1.75 1.75 1. Phosphorous Ox chloride 1.8 1.8
2. C.S.Lye 47% 7.71 7.71
3. Dimethyl Sulphate 1.848 1.848
4. Salt 1.695 1.695
5. Hydro chloric acid 1.104 1.104
6. C.S. Flakes 0.015 0.015
7. Acetic acid 0.309 0.309
Sl.No. Products
Quantity T/M
Sl.No Raw Material
Quantity T/M
Existing After
Expansion Existing Expansion
1. Oxyclozanide 2.00 2.00 1. Dimethyl formamide 0.141 0.141
2. Thionyl chloride 0.726 0.726
3. C.S.Lye 1.206 1.206
4. Acetone 1.026 1.026
5. Activated Carbon 0.060 0.060
6. Sodium bi carbonate 0.0005 0.0005

Tagros chemicals India Limited
Chapter II 17
Sl.No. Products
Quantity T/M
Sl.No Raw Material
Quantity T/M
Existing After
Expansion Existing Expansion
1. Hexaconazole 7.00 20.00 1. N-Butyl Bromide 5.43 5.43
2. Sodium cyanide 2.73 2.73
3. TEBA Catalyst 90.06 90.06
4. Sulphuric Acid 98% conc. 22.41 22.41
5. Thionyl Chloride 4.20 4.20
6. Anhydrous Aluminium
Chloride 6.03 6.03
7. Dimethyl Sulphate 14.73 14.73
8. Anhydrous Potassium
Carbonate 9.27 9.27
9. Dimethyl Formamide 3.93 3.93
10. Potassium Hydroxide 5.49 5.49
11. Dimethyl Sulphate 3.36 3.36
12. 1,2,4 �Triazole 4.65 4.65
13. N-Hexane 0.72 0.72

Tagros chemicals India Limited
Chapter II 18
Sl.No. Products
Quantity T/M
Sl.No Raw Material
Quantity T/M
Existing After
Expansion Existing Expansion
1. DICAMBA 7.00 20.00
1. 2,4 Dichloro Aniline 10.17 28.98
2. Sodium Nitrite 4.38 12.48
3. 98% Sulphuric Acid 23.50 66.97
4. Sulfamic Acid 0.30 0.85
5. Potasium Hydroxide 3.20 9.12
6. Xylene 3.40 9.69
7. Carbon �di-oxide 5.10 14.53
8. 30% Hydrochloric Acid 10.02 28.55
9. Soium Hydroxide 4.90 13.96
10. Dimethyl sulphate 10.90 31.06

Tagros chemicals India Limited
Chapter II 19
Sl.No. Products
Quantity T/M
Sl.No Raw Material
Quantity T/M
Existing After
Expansion Existing Expansion
1. Propiconazole 7.00 20.00 1. Meta dichlorobenzene 31.50 89.77
2. Aluminium Chloride,
Anhydrous 25.50 72.67
3. Acetyl Chloride 10.20 29.07
4. 1,2 � Pentane Diol 12.60 35.91
5. Bromine 17.10 48.73
6. Carbon Tetra Chloride 3.80 10.83
7. 1,2,4-Triazole 13.50 38.47
8. Potassium Carbonate,
Anhydrous 27.00 76.95
9. Dimethyl formamide 18.30 52.15

Tagros chemicals India Limited
Chapter II 20
Sl.No. Products
Quantity T/M
Sl.No Raw Material
Quantity T/M
Existing After
Expansion Existing Expansion
1. Tricyclazole 7.00 20.00 1. Ammonium Tricyanide 3.72 10.60
2. Methyl chloroformate 4.63 13.19
3. Ortho toluidine 5.18 14.76
4. Caustic Lye 1.39 3.96
5. Acetic Acid 5.45 15.53
6. Bromine 13.74 39.15
7. Hydrazine Hydrate 6.85 19.52
8. Ethylene Glycol 3.49 9.94
9. Xylene 6.99 19.92
10. Formic Acid 16.77 47.79
11. Aq.Ammonia Solution 6.01 17.12

Tagros chemicals India Limited
Chapter II 21
Sl.No. Products
Quantity T/M
Sl.No Raw Material
Quantity T/M
Existing After
Expansion Existing Expansion
1. Metaphenoxy
Benzyl alcohol 20.00 40.00 1.
Meta Phenoxy
Benzaldehyde 15.19 30.38
2. Hydrogen 0.189 0.378
3. Raney nickel 0.75 1.50
4. Iso propylAlcohol 17.25 34.50

Tagros chemicals India Limited
Chapter II 22
2.5 Manufacturing Process
Common Production Steps
Alphamethrin / Cypermethrin / Permethrin and Deltamethrin are
manufactured starting from acrylonitrile and carbon tetrachloride. The
Manufacturing process is described in the following parts.
First acrylonitrile is condensed with carbon tetrachloride in the
presence of cupric chloride as catalyst and acetonitrile solvent. The
reaction product is distilled to get pure tetrachloro butyronitrile (CBN).
CBN is then hydrolysed by dilute sulphuric acid to get
tetrachlorobutyric acid (CBA). The spent acid produced in this process
is separated and sent to storage tank for sale to authorized dealers.
Tetrachloro butyric acid thus obtained in the third stage is reacted with
thionyl chloride to produce tetrachloro butyric acid chloride (CBC). The
off gas is scrubbed in water and then with caustic lye. The resulting
hydrochloric acid and sodium sulphite solution are stored in 30 KL
Storage tank and 45 KL Storage tank Respectively and are sold to
authorized dealers.
Tetrachloro butyric acid chloride (CBC) is condensed with isobutylene
to get a cyclic compound 2-chlorocyclobutanone (2-CB). This product
is separated and is crystallized.2-CB is isomerised to 4-
chlorocyclobutanone 4-CB) and is reacted with caustic solution and
finally neutralized to get cypermethric acid (CMA) in hexane. Cis-CMA
is isolated from CMA solution by selective crystallization. The aqueous
is separated and is sent for cypermethrin production. The process floe
diagram is shown in fig 1.The chemical reaction diagram is shown in
fig 2.The flow of the master plan in all the reactors is shown in fig 3.
Pure CIS �CMA Obtained as above is racemised to IR CIS-CMA isomer
using an optically active amine via its salt. Salt is neutralized and

Tagros chemicals India Limited
Chapter II 23
purified to obtain pure (+)-IR Cis permethric Acid having high purity
and matching the reported specific rotation IR CIS CMA is treated with
HBr in presence of a catalyst to obtain becisthermic acid (C3-
(DIBROMOVINYL)-2.2.-Dimethyl Cyclopropoane carboxylic acid. It is
purified by selective crystallization in MDC solvent.
Becisthermic acid is treated with SOCl2 in a solvent get Becisthermic
acid chloride. Becisthermic acid chloride is condensed with NaCN AND
m-phenoxy benzaldehyde in a solvent to isolate racethemic
deltamethrin in good yield.
Racemic deltamethrin produced as discussed is epimerized in a solvent
to isolate IR-CIS-α -S epimer, this is further crystallized to get pure
deltamethrin.
Preparation of Cypermethrin
Solution of D.V.Acid chloride and metaphenoxy �benzaldehyde in
hexane reacts with Solution of sodium cyanide in water in the
presence of triethyl benzyl ammonium chloride as catalyst at 30°C to
give Cypermethrin in hexane solution.
The solution is given water wash to remove traces of sodium cyanide
and hexane distilled out of obtains cypermethrin.
The water washes contain sodium cyanide and it is treated with
sodium hypochloride solution to destroy sodium cyanide.
The purities of reactants to be used viz., cypermethric acid chloride,
metaphenoxy benzaldehyde and sodium cyanide will be above 99%.

Tagros chemicals India Limited
Chapter II 24
The purity of cypermethrin obtained will be minimum 92% pure and
the likely associated impurities are listed at the end of the
manufacturing process.
Preparation of Alphamethrin
The cypermethrin prepared using the above mentioned method is
subjected to epimerization at 25°C in the presence of triethylamine in
solvent hexane to obtain alphamethrin. Then it is filtered, dried under
vacuum. Hexane and tea are recovered and recycled.
The purity of Alphamethrin obtained will be minimum 95% pure and
the likely associated impurities are listed at the manufacturing
process.
Preparation of Permethrin
It is prepared by the reaction of D.V.Acid chloride and Phenoxy Benzyl
Alcohol at 45 to 50°C using hexane as the solvent medium. HCl vapour
generated is absorbed in water and sold as by product.
Proposed
At present the hydrolysis of CBN to CBA conversion is done using
concentrated sulfuric acid. It is proposed to replace this with spent HCl
as established based on pilot plant studies. This will completely
eliminate the generation of spent sulfuric acid. Spent ammonium
chloride formed as the by-product is proposed to be processed to get
ammonium chloride by neutralizing the excess HCl by ammonia
followed by distillation.
Tagros chemicals India Limited
Chapter II 25

Tagros chemicals India Limited
Chapter II 26

Tagros chemicals India Limited
Chapter II 27

Tagros chemicals India Limited
Chapter II 28
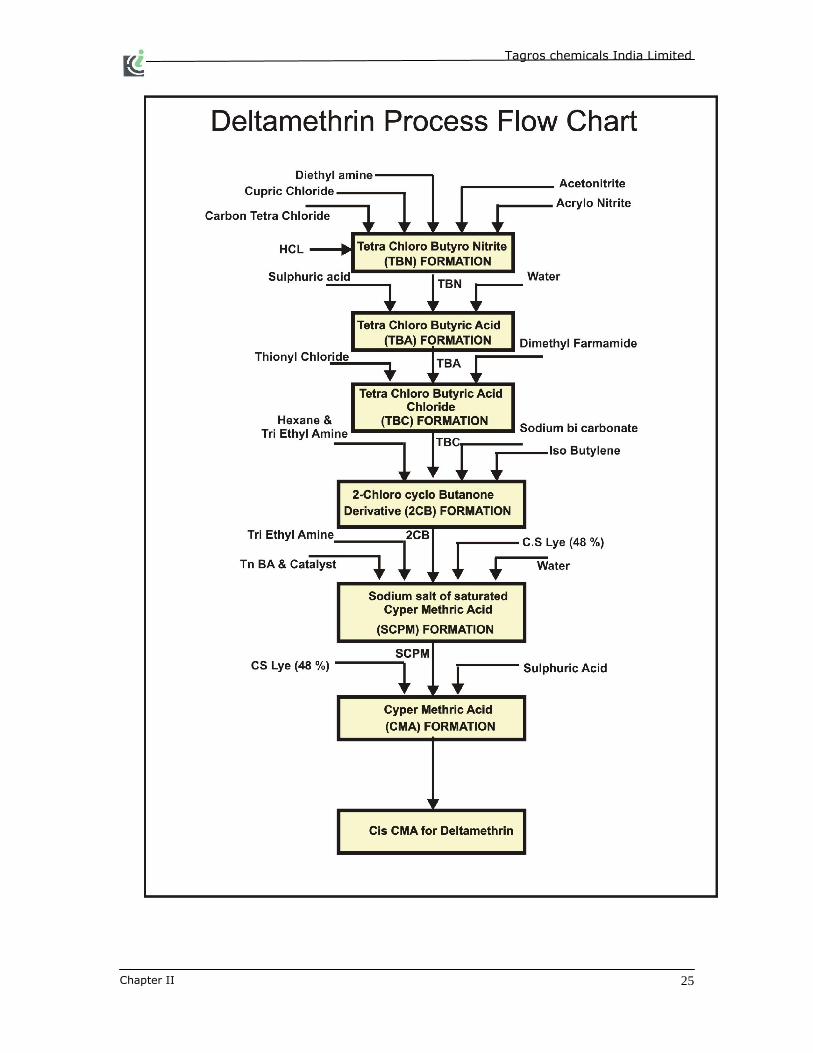
Manufacturing Process of D.V. Acid Chloride (CMAC)
CMAC is manufactured staring from acrylonitrile and carbon
tetrachloride. The manufacturing process is described in the following
parts.
Tagros chemicals India Limited
Chapter II 29
First acrylonitrile is condensed with carbon tetrachloride in the
presence of cupric chloride as catalyst and acetonotrile solvent. The
reaction produces a product and the product is distilled to get pure
tetrachlorobutyronitrile (CBN). CBN is then hydrolysed by dilute
sulphuric acid to get tetra chlorobutyric acid (CBA). The spent acid
produced in this process is separated and sent to storage tank. This
being a normal chemical widely used in the chemical industry is sold to
authorized dealers.
Tetrachlorobutyric acid this obtained in the stage, will be recated with
thionylchloride to produce tetrachlorobutyric acid chloride (CBC). The
off gas is scrubbed in water and then with caustic lye. The resulting
Hydrochloric acid and sodium sulphite respectively and are solid to
authorized dealers.
Tetrachlorobutyric acid chloride (CBC) is condensed with isobutylene to
get a cyclc compound 2 chlorocyclobutanone (2-CB). The product is
separated and is crystallized. 2 � CB is isomerised to 4 �
chlorocyclobutanone (4-CB) and is reacted with caustic solution and
finally neutralized to get Cypermethric Acid (CMA). The aqueous is
separated and is sent to ETP.
The CMA is then reacted with thronyl chloride to get crude CMAC,
which is distilled to get pure CMAC.

Tagros chemicals India Limited
Chapter II 30

Tagros chemicals India Limited
Chapter II 31
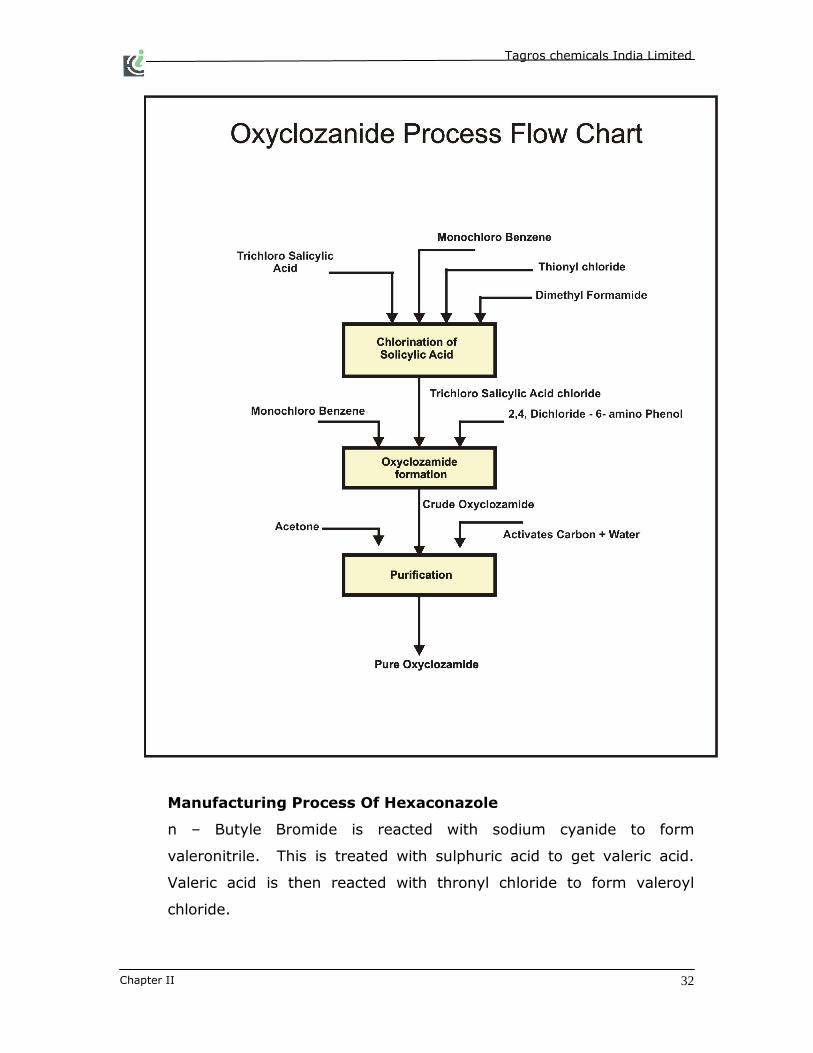
Manufacturing Process of Oxyclozanide
Oxyclozandie is a vetianary drug used the treatment of liver flukcide
for cattle. It is preposed to manufacture Oxyclozandile from the
intermediates by doing the condensation reaction. The intermediates
required viz., 2,4 � Dichloro � 6 �Amino phenol and Tri-chloro
Salicyclic Acid are freely available.
Tri Chloro Salicylic acid is first converted to corresponding acid chloride
by reacting with Thionly Chloride in presence of DMF and a suitable
solvent.
Tri Chloro Salicylic acid chloride is then condensed with 2,4 � Di Chloro
� 6 � Amino phenol to get Oxyclozandie. Oxycloznide is crystallized in
solvent acetone to obtain pure material.
Tagros chemicals India Limited
Chapter II 32
Manufacturing Process Of Hexaconazole
n � Butyle Bromide is reacted with sodium cyanide to form
valeronitrile. This is treated with sulphuric acid to get valeric acid.
Valeric acid is then reacted with thronyl chloride to form valeroyl
chloride.
Tagros chemicals India Limited
Chapter II 33
Valeroyl chloride is then mixed with meta dichlorobenzene and reacted
with aluminium chloride to get valerponphenone. This is further
reacted with dimethy; sulphide and dimethyl sulphate to form Oxirane.
Oxirane isfurther recated with 1, 2, 4 � triazole, potassium carbonate
& Dimethyl Formamide to get Hexaconazole.

Tagros chemicals India Limited
Chapter II 34

Tagros chemicals India Limited
Chapter II 35
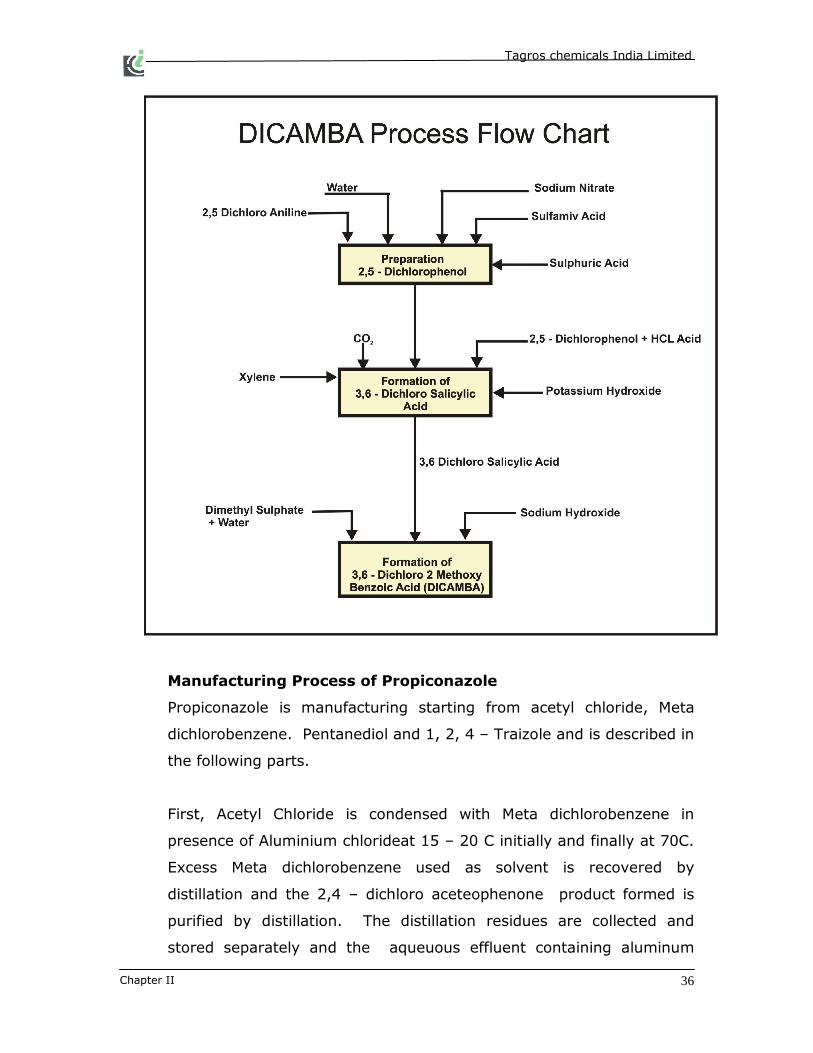
Manufacturing Process of DICAMBA
DICAMBA (2 � Methoxy � 3,6 � dichloro benzoic acid) is manufacturing
starting from 2,5 � dichlorcaniline.
In the first step. The 2, 5 � dichloroaniline is diazotized in Sulphuric
Acid medium with adeqeous solution of sodium Nitrile at 5 � 6 C. The
diazonium sulphate so fornued is not isolated but by steam distillation.
The 2, 5 � dichlorophenol acid. First 2, 5 � dichlorophenol is treated
with aqueous solution o Potassium Hydroxide to form in potassium salt
which is dehydrated by potassium salt is then treated with Carbon-di-
oxide at 130 � 140 C in Xylene solution under a pressure of 35
kg/Cm2. The potassium salt of acid formed is neutralized with
hydrochloric acid to recover the benzoic acid derivative. The
unconverted phenol is recovered from Xylene solution.
In the last step, the 2-hydroxy-3,6 � chloror benzoic acid is
methylatedf with dimethyl sulphate and adueous sodium hydroxide to
give 2 � Methoxy � 3, 6 � dichloride � benzoic acid (DICAMBA). The
product is isolated after neutralization with aqueous Hydrochloric acid
and extraction with solvent toluene. The toluene extract is washed
with water and the product is recovered by distillation of toluene.
Tagros chemicals India Limited
Chapter II 36
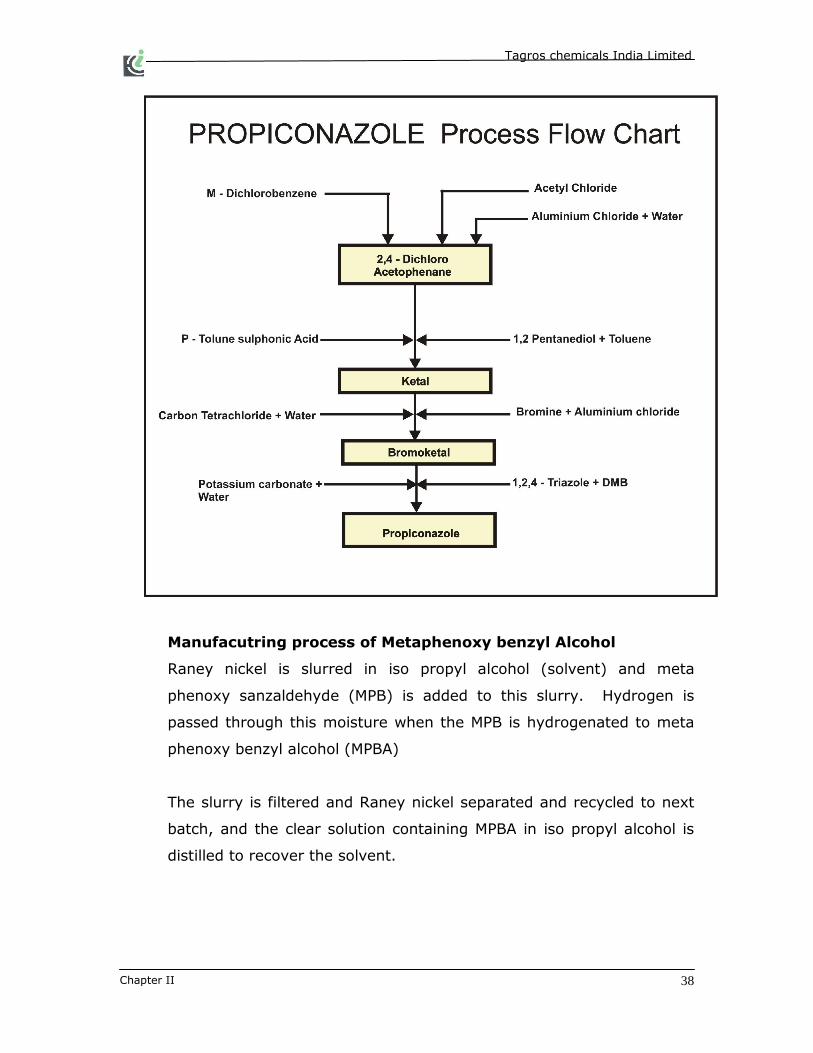
Manufacturing Process of Propiconazole
Propiconazole is manufacturing starting from acetyl chloride, Meta
dichlorobenzene. Pentanediol and 1, 2, 4 � Traizole and is described in
the following parts.
First, Acetyl Chloride is condensed with Meta dichlorobenzene in
presence of Aluminium chlorideat 15 � 20 C initially and finally at 70C.
Excess Meta dichlorobenzene used as solvent is recovered by
distillation and the 2,4 � dichloro aceteophenone product formed is
purified by distillation. The distillation residues are collected and
stored separately and the aqueuous effluent containing aluminum

Tagros chemicals India Limited
Chapter II 37
chloride is ent for recovery. The liberated hydrogen chloride gas is
scrubbed in dichloroacetopjenone is obtained in a priity of above 98%
and small amount of meta di-chloro benzene remains as and impurity.
In the second step, the 2, 4 � dichoroacetophenone is reacted with 1,
2 � pentanediol in solvent toluene at 110C using small amount of Para
Toluene Sulphuric Acid as Catalyst.
The Ketal thus formed is recovered by washing with water to remove
Para toluene sulphonic acid and solvent distilled out. The Ketal in not
purified and used as such in the next step. The purity of ketal
obtained is about 95% and above.
In the third step, the ketal is dissolved is Carbon tetrachloride to which
bromine in carbon tetra chloride is added. A small amount of
aluminum chloride is used as a catalyst. The Hydrogen bromide gas
formed in the reaction is scrubbed with aqueous sodium hydroxide, the
sodium bromide formed is sent for recovery. The Carbon tetra
chloride layer containing the bromoketal is washed with water to
remove catalyst and dissolved hydrogen bromide and the product is
recovered by solvent removal. The bromoketal obtained is not purified
and is used as such in the next step.
In the fourth step, the bromoketal is condensed with potassium salt of
1,2, 4 - triazole ion solevent formamide. The potassium salt of traizole
is formed by the reaction of 1, 2, 4 � triazole with potassium
carbonate at 140C. The product is recovered by distillation of dimethyl
formamide and extracted with solvent ethylene chloride. The Ethylene
chloride extract is washed to remove all inorganic with water and
distilled to give propiconazole technical. The purity of this product
above 90% and contains small amount and moisture as impurity.
Tagros chemicals India Limited
Chapter II 38
Manufacutring process of Metaphenoxy benzyl Alcohol
Raney nickel is slurred in iso propyl alcohol (solvent) and meta
phenoxy sanzaldehyde (MPB) is added to this slurry. Hydrogen is
passed through this moisture when the MPB is hydrogenated to meta
phenoxy benzyl alcohol (MPBA)
The slurry is filtered and Raney nickel separated and recycled to next
batch, and the clear solution containing MPBA in iso propyl alcohol is
distilled to recover the solvent.

Tagros chemicals India Limited
Chapter II 39
Manufacturing Process of Tricyclazole
Tricyclazole is manufactured starting from Ortho Toluidine and is
described as follows.
First methyl Chloroformate is condensed with Ammonim Thiocyanalte
using water as a solvent. The reaction produces a complex and
Ammonium Chloride is obtained as a sode product. The complex thus
formed is not isolated and is further reacted with ortho Toluidirine and
the product orthotoluyl thio urea is obtained after treatment with
caustic lye. The reaction product orthotouyl thio urea is used as such
in the next step without any further purification. The byproduct
Ammonium Chloride is sold to parties for recovery. The spent caustic
lye obtained is sent to storage tank and is sold to authorized parties
for recovery of caustic lye.
The toly thio urea obtained is treated with bromine in acetic acid. The
liberated Hydrogen Bromine gas is assorted in caustic and sodium
bromide is recovered. The aqueous stream containing acetic acid is
sent for acetic and recovery. The reaction product amino

Tagros chemicals India Limited
Chapter II 40
benyothiazole thus obtained is used as such in next step without any
purification.
In the third step the amino benyothiazole is recated with hydrazine
hydrate in ethylene glycol as solvent. After the reaction layers are
sepatered and product is recovered as assuspension in Xylene. The
aqueous stream containing ethylene glycol and hydranzine is stored
separately and sent for recovery of ethylene glycol and hydrazine. The
product formed in the dydrazine benzothiazole is not isolated and
obtained as suspension in xylane which is used the next step.
In the final step, the hydrazine benzothiazole is refluxed with excess
formic acid to give the product tncyclazole. The unreacted formic acid
is recovered and recycled. The aqueous stream containing traces of
formic acid is neutralized and sent for treatment.
The Tricyclazole thus obtained is in a pure form with a purity of 98% -
99% and is sold as such.

Tagros chemicals India Limited
Chapter II 41

Tagros chemicals India Limited
Chapter II 42
2.6 Plant Layout and list of machineries:
Facility for CBN
Sl.No Eqpt. No. Description Capacity,KL MOC Remarks
1. R 201 Reactor for CBN Formation 3.00 MSGL F
2. R 201A Reactor for CBN Formation 3.00 MSGL F
3. R 201B
Reactor for CBN Catalyst
Preparation 1.00 MSGL
4. R 202 Reactor for CBN Distillation 8.00 SS
5. T 102 Tank for CTC Addition - CNB 1.00 SS
6. T 101 Tank for Acrylo Storage - CNB 1.00 SS
7. T 103 Tank for CBN Crude Storage 3.50 MSLB
8. T 103 A Tank for CBN Crude Storage 4.00 MSLB
9. T 103 C Tank for CBN Crude Storage 3.00 MSLB
10. T 103 B Tank for CBN Crude Storage 1.00 SS
11. T 205 Tank for CBN F/C Collection 1.50 MSLB
12. T 202 Tank for CBN I/C Collection 0.10 SS
13. T 203 Tank for CBN M/C Collection 1.50 SS
14. T 201 Tank for CBN F/C Storage 2.50 SS
15. T 204 Tank for CBN M/C Storage 3.00 SS
16. -
Catchpot for R 202 in Vacuum
line -CBN 0.075 SS
17. E 202 Condensor for R 202 -CBN 15 m2 SS
18. E 202 A Condensor for R 202 Vent -CBN 12 m2 SS
19. E 201
Condensor for R 201 / R 201 A
vent-CBN 3 m2 SS
20. E 201A
Condensor spare for R 202 (
Tube )-CBN 15 m2 Graphite
21. P 204 Pump for CBN M/C Transfer - CP PVDF
22. P 201 Pump for CBN F/C Transfer - CP SS
23. - Pump for CBN Crude transfer SS
24. -
Pump-Metering for Acrylo
Transfer-CBN 140 LPH SS
25. -
Pump-Metering for CTC
Transfer-CBN 140 LPH SS
26. -
Pump-Standby for CTC Transfer
- CBN 140 LPH SS
27. -
Tank for collection from R 201 /
R 201A -CBN 0.050 SS
28. - Tank for Hotwater - CIP - CBN 1.000 MS
29. -
Pump for Hotwater - CIP (Multi
CP)-CBN MS
30.
E - 3
Ejector for R 201-CBN Graphite

Tagros chemicals India Limited
Chapter II 43
Facility for CBA
S.No Eqpt. No. Description Capacity,KL MOC Remarks
31. R203 Reactor for CBA Formation 8.0 MSGL
32. R203A Reactor CBA Dehydration 4.0 MSGL
33. T302 A
Tank for DM Water Storage for
CBA 5.0 MS
34. T 302
Tank for Fresh H2SO4 Storage-
CBA 5.0 MS
35.
Tank for Spent Acid Storage -
CBA 5.0 MSRL
36. T 306
Tank for Dehydr WaterCollection
- CBA 0.5 MSGL
37. T 304 Tank for Wet CBA Storage 5.0 PP FRP
38. T 305 Tank for Dry CBA Storage 4.0 PP FRP
39. E 203 A Condensor for R 203 A-CBA 2 m2 Graphite
40. P 203
Pump for Spent Acid Transfer -
CBA MS
41. P 203 C Pump for Wet CBA Transfer PVDF
42. P 203 B Pump for Dry CBA Transfer Graphite
43. P 203 D
Pump for Raw water Transfer -
CBA MS
44. T 301 Tank for CBN addition-CBA 4.0 SS
45. T 301 Tank for CBA aqueous settling 2.0 HDPE
46. V1 Venturi for addition-CBA Graphite
47. E4 Ejector for CBA Dehydration Graphite
Facility for CBC
Sl.No Eqpt. No. Description Capacity,KL MOC Remarks
48. R204 Reactor for CBC Formation 4.0 MSGL
49. R 205 Reactor for CBC Distillation 4.0 MSGL
50. T 403 Tank for CBC F/C Recieving 1.0 SS
51. T 404 Tank for CBC M/C Receiving 1.0 SS
52. T 405 Tank for CBC M/C Storage 4.0 PP FRP
53. T 305 Tank for CBC M/C Storage 3.0 PP FRP
54. -
Tank for TC Collection of R 204
-CBC 0.1 SS
55. T 701 A Tank for TC Addition-CBC 2.0 MSLB
56. - Catchpot for R 205-CBC 0.1 SS
57. E 204
Condensor for R 204 (Block)-
CBC 8 m2 Graphite
58. E 205 Condensor for R 205-CBC 6 m2 Graphite
59. E 205 A Condensor for R 205 A-CBC 10 m2 Graphite
60. -
Pump for CBC M/C Transfer to
Plant-III PVDF
61. V2 Venturi for CBC Formation Graphite
62.
E5 Ejector for CBC Formation /
Distillation Graphite

Tagros chemicals India Limited
Chapter II 44
Facility for 2 CB
Sl.No Eqpt. No. Description Capacity,KL MOC Remarks
63. R206 Reactor for 2 CB formation 12.5 SS
64. R206A Reactor for 2 CB Formation 12.5 SS
65. R208
Reactor for2 CB distillation &
Workup 9.0 SS
66. R209 Reactor for 2 CB Crystalisation 4.0 SS
67. R 217 Reactor for 2 CB ML Recovery 3.0 SS
68. R801
Reactor for Wet TEA Recovery -
2CB 6.0 SS
69. R802
Reactor for Dry TEA Recovery-
2CB 6.0 SS
70. ANF 202
Filter-ANF 2 CB Cake Filtration,
4m2 3.5 SS
71. NF 202 Filter-NF 2CB 2nd Crop Filtration 2.0 SS
72. T 508 A Tank for IB Storage - 2CB 1.0 SS
73. T 802 Tank for Dry TEA Storage -2CB 3.0 SS
74. T 801 Tank for TEA HCl Storage-2CB 5.0 PPFRP
75. R 504 A Reactor for 2 CB Samples 1.0 SS
76. T 506
Tank for 2 CB Recovered
Hexane 4.0 SS
77. T 506 A
Tank for 2 CB Recovered
Hexane 4.0 SS
78. T 507 Tank for Water -2CB 4.0 MS
79. R 507 A
Reactor for SBC Preparation -
2CB 4.0 MS
80. T 501 Tank for CBC Addition -2CB 1.5 FRP
81. T 502 Tank for TEA Addition -2CB 1.5 SS
82. T 509
Tank for R 217 Rec Hexane
Collection-2CB 0.5 SS
83. E 207 A
Condensor for R 207 A with
Column-2CB 5 m2 SS
84. E 208 Condensor for R 208-2CB 12 m2 SS
85. E 801 Condensor for R 801-2CB 12 m2 SS
86. E 802 Condensor for R 802-2CB 12 m2 SS
87. E 217 Condensor for R 217-2CB 5 m2 SS
88. P 217 Pump for 2 CB ML Pumping- CP SS
89. P 208
Pump for 2 CB Mass Pumping -
CP SS
90. P 801
Pump for TEA HCL Pumping -CP-
2CB SS
91. -
Pump for SBC Sol Transfer - CP-
2CB SS
92. -
Pump - Metering for CBC
Addtion-2CB SS
93. -
Pump - Metering for TEA
Addtion-2CB SS

Tagros chemicals India Limited
Chapter II 45
94. T 804
Tank for Lye Storage - Wet TEA-
2CB 1.0 SS
95. E 206
Condensor for R 206 / R 206 A-
2CB 12 m2 SS
96. - Pump - Water ring Vacuum-2CB SS
Facility 4 CB, SCPM,CPM
Sl.No Eqpt. No. Description Capacity,KL MOC Remarks
97. R 210 Reactor for 4 CB Formation 4.0 MSGL
98. R 211 Reactor for SCPM Formation 9.0 SS
99. R 212 Reactor for CPM Formation 12.0 SS
100. R 213 Reactor for CMA Formation 15.0 SS
101. R 213 E
Reactor for Lye Preparation for
R 213 2.0 SS
102. R 217 A
Reactor for SCPM Hex - Rec for
R 212 1.0 SS
103. R 803
Reactor for Acid Preparation for
R 212 / R 213 1.0 MSGL
104. T 603 Tank for Lye Storage for R 212 1.2 FRP
105. T 601 Tank for Lye Storage for R 211 1.5 MS
106. T 607 C Tank for CMA Organic Storage 4 SS
107. T 615 Tank for SCPM Organic Storage 3.5 MS
108. T 611 Tank for Cis-CPM Storage 3.5 SS
109. T 611 A Tank for Cis-CPM Storage 3 SS
110. T 611 B Tank for Cis-CPM Storage 2 MS
111. T 210 Tank for4 CB Storage Tank 3 SS
112. T 805
Tank for Caustic Lye Storage for
R 213 1 MS
113. T 507 A Tank for Water Tank 5 MS
114. -
Tank for Hotwater - CIP for R
213 2 MS
115. -
Tank for CMA Aqueous Settling
for R 213 3 SS
116. T 604 Tank for Fresh H2SO4 Storage 0.5 MS
117. E 210 Condensor for R 210 5 m2 SS
118. E 217 A Condensor for R 217 A 2 m2 SS
119. P 212
Pump for SCPM Transfer from R
211 to R 212 - CP SS
120. P 213 Pump for Cis CPM transfer - CP SS
121. -
Tank for Dil H2SO4 Addition in R
212 0.05 Glass
122. -
Tank for PMT Spent SBC
Storage 2 HDPE
Facility for Cis CMA
Sl.No Eqpt. No. Description Capacity,KL MOC Remarks
123. R 213 B Reactor for Cis CMA Isolation 4.0 SS
124. R 213 B Reactor for Cis CMA Isolation 2.5 SS
125. ANF 201 Filter - ANF for Cis CMA 4.5 SS

Tagros chemicals India Limited
Chapter II 46
126. ANF 201 Filter - ANF for Cis CMA 2.5 SS
127. R 804 Reactor for Acid Preparation 1.0 MSGL
128. T 612 Tank for Cis CMA ML Storage 3.0 SS
129. T 613 Tank for Cis CMA ML Storage 4.0 SS
130. T 613 A Tank for Cis CMA ML Storage 4.0 SS
131. - Pump for ML transfer SS
132. R 213 C Reactor for Tail CMA Extraction 8.0 SS
133. R 213 C Reactor for Tail CMA Extraction 6.0 SS
134. T 233
Tank for Tail CMA Organic
Storage 4.0 SS
135. T 233 A
Tank for Tail CMA Organic
Storage 3.0 SS
136. R 801
Reactor For dilute H2SO4
preparation 1.0 MSGL
137. T 801
Tank for Dil H2SO4 Addition in R
213 C 2.0 FRP
138. -
Pump for Dilute H2SO4 transfer
to R213C MS
Facility for Cis CMAC
Sl.No Eqpt. No. Description Capacity,KL MOC Remarks
139. R214 Reactor for Cis CMAC Formation 2.0 MSGL
140. R218 Reactor for Cis-CMAC Formation 2.0 MSGL
141. T 401 Tank for TC Batch (R 214) 1.0 MSLB
142. T 218 Tank for TC Addition - R 218 0.5 MSLB
143. T 218 B Tank for Cis-CMAC Storage 1.5 PPFRP
144. E 214 Condensor for R 214 (Block) 6 m2 Graphite
145. E 218 Condensor for R 218(Block) 6 m2 Graphite
146. P
218B/215C Pump for Cis-CMAC Transfer SS
147. F 218
Filter-Bag -Cis CMAC Filter for R
218 0.1 SS
148. V5 Venturi for 218 / R 214 Graphite
149. E -10 Ejector for R 218 / R 214 Graphite
Facility for N CMAC
Sl.No Eqpt. No. Description Capacity,KL MOC Remarks
150. R214A Reactor for CMAC Formation 4.5 MSGL
151. R215 Reactor for CMAC Distillation 3.0 SS
152. T 701 Tank for TC Batch (R 214A) 1.0 MSLB
153. T 703 B
Tank for CMAC M/C Collection
for R 215 1.0 SS
154. T 703 A
Tank for CMAC F/C Collection for
R 215 0.5 SS
155. - Catchpot for R 215 0.1 SS
156. T 215 C Tank for 50-Cis CMAC Storage 1.5 PPFRP
157. T 215 A Tank for 25-Cis CMAC Storage 1.0 PPFRP
158. E 214 A Condensor for R 214 A (Block) 6m2 Graphite
159. E 215 Condensor for R 215- Standby 10m2 SS
Tagros chemicals India Limited
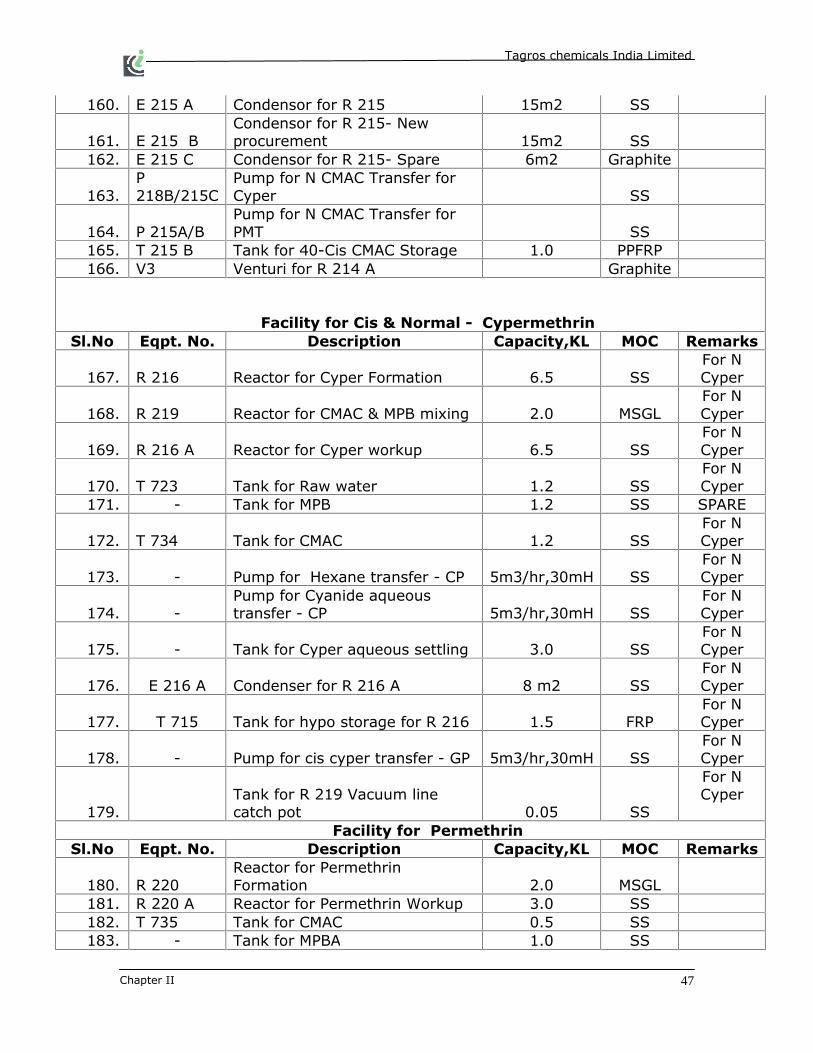
Chapter II 47
160. E 215 A Condensor for R 215 15m2 SS
161. E 215 B
Condensor for R 215- New
procurement 15m2 SS
162. E 215 C Condensor for R 215- Spare 6m2 Graphite
163. P
218B/215C
Pump for N CMAC Transfer for
Cyper SS
164. P 215A/B
Pump for N CMAC Transfer for
PMT SS
165. T 215 B Tank for 40-Cis CMAC Storage 1.0 PPFRP
166. V3 Venturi for R 214 A Graphite
Facility for Cis & Normal - Cypermethrin
Sl.No Eqpt. No. Description Capacity,KL MOC Remarks
167. R 216 Reactor for Cyper Formation 6.5 SS
For N
Cyper
168. R 219 Reactor for CMAC & MPB mixing 2.0 MSGL
For N
Cyper
169. R 216 A Reactor for Cyper workup 6.5 SS
For N
Cyper
170. T 723 Tank for Raw water 1.2 SS
For N
Cyper
171. - Tank for MPB 1.2 SS SPARE
172. T 734 Tank for CMAC 1.2 SS
For N
Cyper
173. - Pump for Hexane transfer - CP 5m3/hr,30mH SS
For N
Cyper
174. -
Pump for Cyanide aqueous
transfer - CP 5m3/hr,30mH SS
For N
Cyper
175. - Tank for Cyper aqueous settling 3.0 SS
For N
Cyper
176. E 216 A Condenser for R 216 A 8 m2 SS
For N
Cyper
177. T 715 Tank for hypo storage for R 216 1.5 FRP
For N
Cyper
178. - Pump for cis cyper transfer - GP 5m3/hr,30mH SS
For N
Cyper
179.
Tank for R 219 Vacuum line
catch pot 0.05 SS
For N
Cyper
Facility for Permethrin
Sl.No Eqpt. No. Description Capacity,KL MOC Remarks
180. R 220
Reactor for Permethrin
Formation 2.0 MSGL
181. R 220 A Reactor for Permethrin Workup 3.0 SS
182. T 735 Tank for CMAC 0.5 SS
183. - Tank for MPBA 1.0 SS
Tagros chemicals India Limited
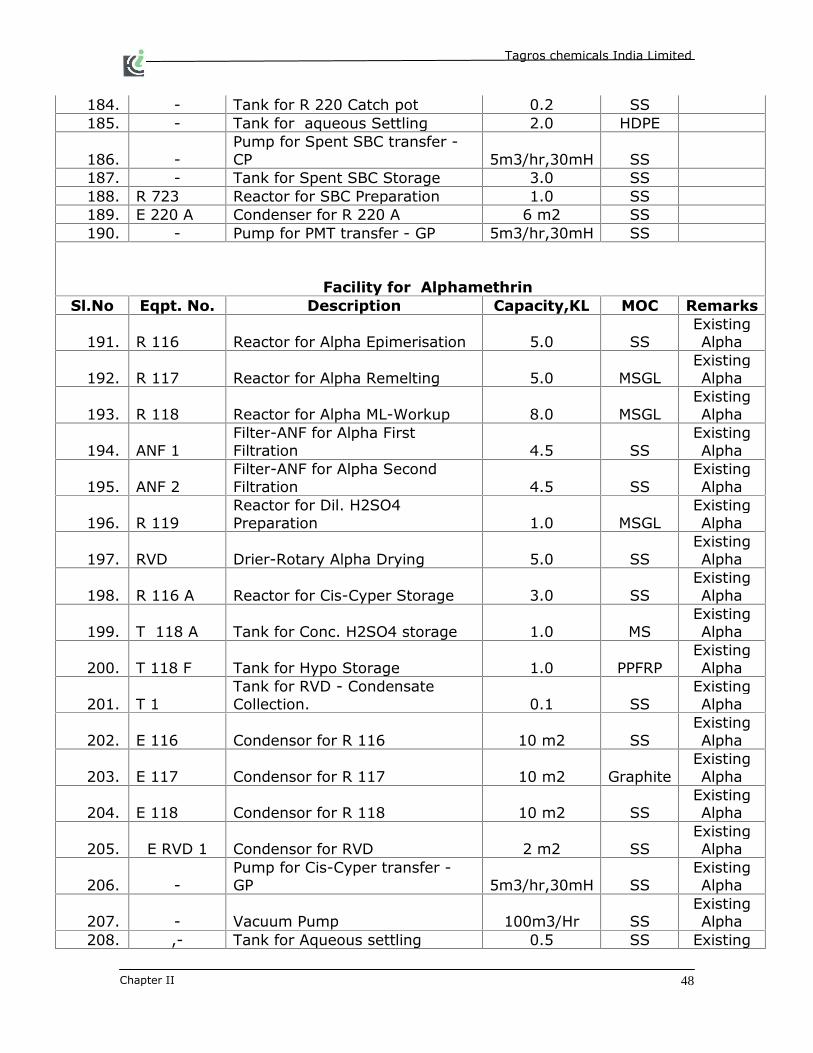
Chapter II 48
184. - Tank for R 220 Catch pot 0.2 SS
185. - Tank for aqueous Settling 2.0 HDPE
186. -
Pump for Spent SBC transfer -
CP 5m3/hr,30mH SS
187. - Tank for Spent SBC Storage 3.0 SS
188. R 723 Reactor for SBC Preparation 1.0 SS
189. E 220 A Condenser for R 220 A 6 m2 SS
190. - Pump for PMT transfer - GP 5m3/hr,30mH SS
Facility for Alphamethrin
Sl.No Eqpt. No. Description Capacity,KL MOC Remarks
191. R 116 Reactor for Alpha Epimerisation 5.0 SS
Existing
Alpha
192. R 117 Reactor for Alpha Remelting 5.0 MSGL
Existing
Alpha
193. R 118 Reactor for Alpha ML-Workup 8.0 MSGL
Existing
Alpha
194. ANF 1
Filter-ANF for Alpha First
Filtration 4.5 SS
Existing
Alpha
195. ANF 2
Filter-ANF for Alpha Second
Filtration 4.5 SS
Existing
Alpha
196. R 119
Reactor for Dil. H2SO4
Preparation 1.0 MSGL
Existing
Alpha
197. RVD Drier-Rotary Alpha Drying 5.0 SS
Existing
Alpha
198. R 116 A Reactor for Cis-Cyper Storage 3.0 SS
Existing
Alpha
199. T 118 A Tank for Conc. H2SO4 storage 1.0 MS
Existing
Alpha
200. T 118 F Tank for Hypo Storage 1.0 PPFRP
Existing
Alpha
201. T 1
Tank for RVD - Condensate
Collection. 0.1 SS
Existing
Alpha
202. E 116 Condensor for R 116 10 m2 SS
Existing
Alpha
203. E 117 Condensor for R 117 10 m2 Graphite
Existing
Alpha
204. E 118 Condensor for R 118 10 m2 SS
Existing
Alpha
205. E RVD 1 Condensor for RVD 2 m2 SS
Existing
Alpha
206. -
Pump for Cis-Cyper transfer -
GP 5m3/hr,30mH SS
Existing
Alpha
207. - Vacuum Pump 100m3/Hr SS
Existing
Alpha
208. ,- Tank for Aqueous settling 0.5 SS Existing

Tagros chemicals India Limited
Chapter II 49
Alpha
Facility for Hexaconazole
Sl.No Eqpt. No. Description Capacity,KL MOC Remarks
209. R 301
Reactor for Valero Nitrile
Formation 0.75 SS
210. R 302
Reactor for Valeric Acid
Formation 0.5 MSGL
211. R 303
Reactor for Valeric Acid Chloride
Formation 0.25 MSGL
212. T 302 B Tank 0.25 SS
213. T 302 D Tank 0.5 SS
214. T 302 C Tank 0.2 SS
215. E 302 Condensor for R 302 4 m2 SS
216. T 301A Tank 0.2 SS
217. T 304 C Tank 0.5 SS
218. T 304 Tank 0.5 SS
219. T 301 B Tank 0.5 SS
220. T 301 C Tank 0.5 SS
221. E 303 Condensor for R 303 1 m2 Glass
222. R 304 Reactor for V.P Formation 1.0 MSGL
223. R 308
Reactor for V.P Distillation/DMS
Formation 1.0 MSGL
224. R 306 Reactor for Oxirane Formation 4.0 SS
225. R 307
Reactor for Hexaconazole
Formation 2.0 SS
226. V 305 Vat for V.P Workup 1.5 MSTL
227. NF 307 Filter for Hexaconazole Filtration 3.0 SS
228. T 304 A Tank for V. C Acid Addition 0.25 SS
229. T 304 B Tank for Sol- D Addition 0.25 SS
230. T 305 A Tank for V.P Aqueous -Resol B 1.0 SS
231. T 308 A Tank for DMS A Addition 0.25 SS
232. T 306 A Tank for DMS Addition (Jacket) 2.0 SS
233. T 306 C
Tank for Rec - DMS collection
(Jacket) 0.5 SS
234. T 306 D Tank for Oxirane - Organic 1.5 SS
235. T 306 E Tank for Oxirane - Aqueous 3.0 SS
236. T 307A Tank for Oxirane Addition 0.5 SS
237. T 307 B Tank for Hot water 1.5 SS
238. T 307 C Tank for R 307 Collection pot 0.1 SS
239. T 307 D Tank for Rec - DMF 2.0 SS
240. RVD 02 Drier for Hexaconazole 0.5 SS
241. -
Tank -collection from R 304
glass condensor 0.05 Glass
242. E 304 Condenser for R 304 2 m2 Glass
243. E 308 Condenser for R 308 4 m2 SS
244. E 306 Condenser for R 306 10 m2 SS
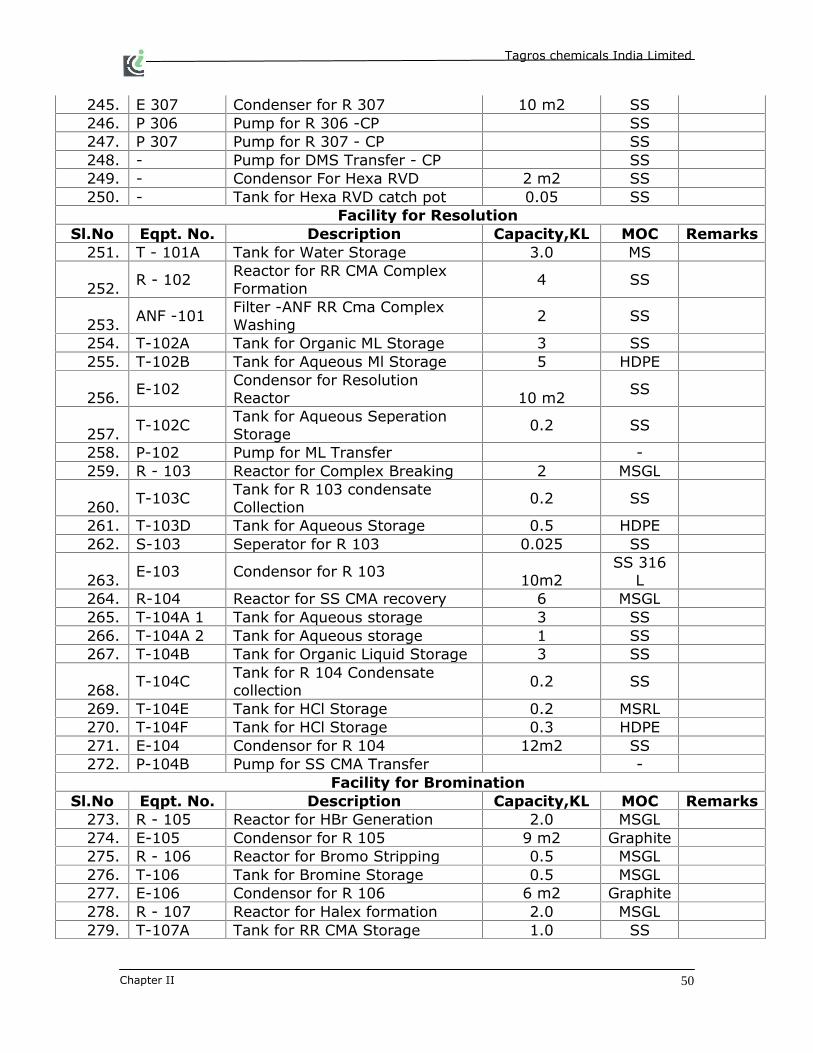
Tagros chemicals India Limited
Chapter II 50
245. E 307 Condenser for R 307 10 m2 SS
246. P 306 Pump for R 306 -CP SS
247. P 307 Pump for R 307 - CP SS
248. - Pump for DMS Transfer - CP SS
249. - Condensor For Hexa RVD 2 m2 SS
250. - Tank for Hexa RVD catch pot 0.05 SS
Facility for Resolution
Sl.No Eqpt. No. Description Capacity,KL MOC Remarks
251. T - 101A Tank for Water Storage 3.0 MS
252. R - 102
Reactor for RR CMA Complex
Formation 4 SS
253. ANF -101
Filter -ANF RR Cma Complex
Washing 2 SS
254. T-102A Tank for Organic ML Storage 3 SS
255. T-102B Tank for Aqueous Ml Storage 5 HDPE
256. E-102
Condensor for Resolution
Reactor 10 m2 SS
257. T-102C
Tank for Aqueous Seperation
Storage 0.2 SS
258. P-102 Pump for ML Transfer -
259. R - 103 Reactor for Complex Breaking 2 MSGL
260. T-103C
Tank for R 103 condensate
Collection 0.2 SS
261. T-103D Tank for Aqueous Storage 0.5 HDPE
262. S-103 Seperator for R 103 0.025 SS
263. E-103 Condensor for R 103
10m2
SS 316
L
264. R-104 Reactor for SS CMA recovery 6 MSGL
265. T-104A 1 Tank for Aqueous storage 3 SS
266. T-104A 2 Tank for Aqueous storage 1 SS
267. T-104B Tank for Organic Liquid Storage 3 SS
268. T-104C
Tank for R 104 Condensate
collection 0.2 SS
269. T-104E Tank for HCl Storage 0.2 MSRL
270. T-104F Tank for HCl Storage 0.3 HDPE
271. E-104 Condensor for R 104 12m2 SS
272. P-104B Pump for SS CMA Transfer -
Facility for Bromination
Sl.No Eqpt. No. Description Capacity,KL MOC Remarks
273. R - 105 Reactor for HBr Generation 2.0 MSGL
274. E-105 Condensor for R 105 9 m2 Graphite
275. R - 106 Reactor for Bromo Stripping 0.5 MSGL
276. T-106 Tank for Bromine Storage 0.5 MSGL
277. E-106 Condensor for R 106 6 m2 Graphite
278. R - 107 Reactor for Halex formation 2.0 MSGL
279. T-107A Tank for RR CMA Storage 1.0 SS
Tagros chemicals India Limited
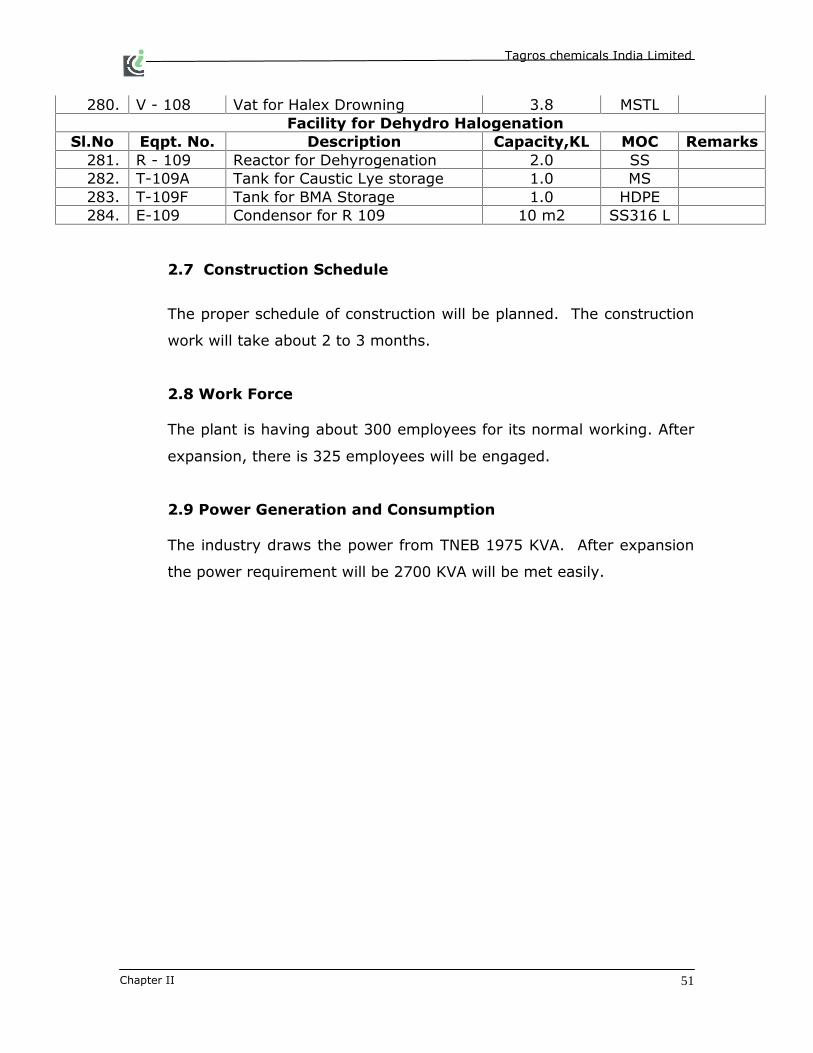
Chapter II 51
280. V - 108 Vat for Halex Drowning 3.8 MSTL
Facility for Dehydro Halogenation
Sl.No Eqpt. No. Description Capacity,KL MOC Remarks
281. R - 109 Reactor for Dehyrogenation 2.0 SS
282. T-109A Tank for Caustic Lye storage 1.0 MS
283. T-109F Tank for BMA Storage 1.0 HDPE
284. E-109 Condensor for R 109 10 m2 SS316 L
2.7 Construction Schedule
The proper schedule of construction will be planned. The construction
work will take about 2 to 3 months.
2.8 Work Force
The plant is having about 300 employees for its normal working. After
expansion, there is 325 employees will be engaged.
2.9 Power Generation and Consumption
The industry draws the power from TNEB 1975 KVA. After expansion
the power requirement will be 2700 KVA will be met easily.

Tagros chemicals India Limited
Chapter II 52
Raw water
472 m3/ day
Process
scrubber
20 m3/day
Utilities 428
m3/day
Gardening
20 m3/day
Domestic
use 24
m3/day
Domestic
waste water
19 m3/day
Sewage
treatment
plant
Cusecs
Domestic
use 19
m3/day
Boiler
scrubber
2 m3/day
Cooling
tower
makeup
water
37m3/day
Ejector
pump
makeup
water
4m3/day
Floor
washing
3m3/day
DM plant
134m3/day
DM plant
113 m3/day
Acid
recover
15 m3/day
Scrubber
bleed
water
5 m3/day
Evapora
tion &
drift
loss 33
m3/day
Cooling
tower
blow
down 4
m3/day
Bleed off
water 4
m3/day
Regenerat
ion
&washing
15 m3/day
Soft
water
213m3/
day
Softener
plant
228m3/da
y
Regeneration
&washing
21 m3/day
Process
water 113
m3/day
Scrubber
bleed water
2 m3/day
Boiler 192m3/
day
Boiler blow down
21m3/ day
Process water
97 m3/day
Teade
effluent
97
m3/day
Multiple
Effect
evapora
tor
Trade Effluent 75 m3/day
Zero discharge
WATER BALANCE

Tagros chemicals India Limited
Chapter II 53
2.9.1 Raw Water Source
Raw water requirement for this distillery is drawn from SIPCOT
Industrial Complex.
Raw Water Requirement
Category
Average Daily Water
Requirement (m3/day)
Existing
Average Daily Water
Requirement (m3/day)
Expansion
Cooling water makeup 10 37
Process 89 113
DM Water 14 134
Domestic purpose 10 24
Greenbelt 7 20
Others 85 144
Total raw water requirement 215 472
2.10 Waste Generation
2.10.1 Wastewater
Sl.No.
Waste
Water
Details
Quantity per Day
Method of Disposal Existing
m3/Day
After
Expansion
m3/Day
1. Sewage 9.0 19.0
Marine Disposal through
M/s.Cusecs Conveyance
Main
2. Trade Effluent 110.0 172.0
Neutralized and
evaporated by Multiple
Effect Evaporator
Detailed wastewater management plan is described in Chapter V

Tagros chemicals India Limited
Chapter II 54
2.10.2 Solid Waste
The solid waste will be generated from this unit is as follows.
Sl.No. Wastes Quantity
Method of Disposal Existing Expansion
Hazardous Solid Waste
1. Process 2.21T/M, ---- T/M Stored in
HDPE barrels over
impervious platform
under closed shed
2. Salt from
Evaporator 1.3 T/M 3.0 T/M
3. Sludge from ETP 0.5 T/M ---- T/M
4.
Discarded
containers / barrels
/ liners used for
hazardous waste /
Chemicals
3.75 T/M ---- T/M
Cut in to sheets and sold
out to authorized
vendors.
5.
Chemical
containing residue
from
decontamination
2.91KL/M ---- KL/M Treated in the MEEP
6. Used / Spent Oil 83.33 L/M ----- L/M Sold to authorized re -
refiner
7. Spent solvents 3 KL/M --- KL/M Sold to
Non Hazardous Solid Waste
8. Fly Ash from
Boiler 1.8 T/M 3.0 T/M Used for Brick work.
9. Sludge from
STP 0.5 T/M 1.0 T/M Used as Manure.

Tagros chemicals India Limited
Chapter III 55
3.0 BASELINE ENVIRONMENTAL STATUS
3.1 INTRODUCTION
This chapter illustrates the description of the existing environmental
status of the study area with reference to the prominent
environmental attributes. The core area of the study covers 10km
radius around the distillery unit.
The existing environmental setting is considered to adjudge the
baseline environmental conditions, which are described with respect to
climate, hydro geological aspects, atmospheric conditions, water
quality, soil quality, vegetation pattern, ecology, socio-economic
profile and land use.
The report incorporates the baseline data monitored starting from April
to June 2008, covering North-east monsoon season and secondary
data collected from various Government, Semi-Government and Public
sector organizations.
3.2 MICROMETEOROLOGY
Meteorological conditions play a vital role in planning orientation of
stacks, operation and maintenance of distillery unit and also on the
environmental impact.
The summary of micrometeorological data of the region pertaining to
the years 2004 - 2007 is presented in Table 3.1.
3.2.1 Temperature
June is the hottest month with maximum temperature of 37.90 C.
January is the coolest month with minimum temperature of 200 C and
the graph showing yearly average max & min temperature in Fig 3.1.

Tagros chemicals India Limited
Chapter III 56
Table 3.1 � Meteorological Data
Station: Cuddalore Period: 2004 - 2007
Year Jan Feb Mar Apr May June July Aug Sept Oct Nov
Dec
I. MONTHLY AVERAGE WIND SPEED, 24 HRS, (KMPH)
2004 04 04 05 06 05 07 06 06 04 03 04 05
2005 04 04 05 06 05 07 06 06 04 03 04 05
2006 03 03 04 03 03 05 06 05 05 04 04 06
2007 5 5 4 6 7 6 6 4 7 4 4 6
II. MONTHLY MEAN RH AT 0830 HRS IST (%)
2004 85 80 79 74 78 72 71 66 86 82 91 86
2005 85 85 81 84 77 66 68 69 67 80 84 85
2006 83 83 77 74 73 70 71 68 72 70 78 88
2007 86 83 83 77 69 68 73 78 79 84 85 95
III. MONTHLY MEAN RH AT 1730 HRS IST (%)
2004 71 66 72 75 76 64 65 62 78 79 74 70
2005 63 61 63 79 74 62 63 64 67 73 76 75
2006 69 67 69 69 68 69 61 63 66 66 75 76
2007 72 70 69 73 71 63 61 71 74 79 79 82
IV. MONTHLY TOTAL RAINFALL (mm)
2004 20.8 0.0 0.0 0.7 345.7 93.1 10.9 70.4 260.8 534.5 428.6 67.6
2005 2.6 15.2 3.2 160.4 65.7 1.8 12.1 100.0 145.5 159.4 825.4 306.9
2006 11.4 0.0 25.8 17.8 37.9 103.4 61.8 12.3 54.0 530.8 310.9 231.8
2007 0.0 49.8 0.0 13.6 36.9 5.1 76.9 181.5 97.2 432.7 162.8 303.4
V. MONTHLY MEAN MAX. TEMP (0C)
2005 30.3 31.5 33.0 32.9 36.4 37.9 36.8 36.6 34.6 32.1 28.8 29.0
2006 29.8 30.8 32.5 35.0 36.4 35.9 36.1 36.4 34.4 31.7 29.8 29.2
2007 30.5 31.0 31.0 33.9 38.3 36.1 36.0 34.0 33.9 32.2 30.7 29.2
VI. MONTHLY MEAN MIN. TEMP (0C)
2005 20.5 20.7 23.5 25.7 26.7 27.0 25.8 25.6 24.9 24.2 22.1 21.5
2006 20.0 20.1 23.2 24.9 25.4 24.5 23.9 23.9 25.2 24.1 23.4 21.3
2007 20.6 21.0 22.3 24.9 26.2 25.9 25.1 24.1 25.2 24.1 21.7 21.4
3.2.2 Rainfall

Tagros chemicals India Limited
Chapter III 57
The rainfall data collected for the period from 2004 - 2007 are
presented in Table 3.1. While the predominant rainy season is the
northeast monsoon (Oct-Dec). The region is also influenced to some
extent by southwest monsoon (Jun-Sep). While maximum rainfall of
825.4 mm is received during the month of November 2005, the
minimum of traces is received during February. Monthly Average Rain
fall is shown in Fig. 3.2.
3.2.3 Relative Humidity
The minimum and maximum relative humidity observed in this area
during the year February 2007 & November 2007 is 61% and 91%
respectively.
3.2.4 Wind Direction
The predominant wind direction observed was southwest followed by
South in the month of May and June. The wind rose diagrams are
shown in Fig - 3.3 & 3.4.
3.2.5 Wind Speed
The minimum average wind speed was 4 km/h and the maximum
average wind speed was 18 km/h. The Pasquill stability class for wind
speed is as follows.
Pasquill Stability Class
Surface Wind
Speed (m/s)
(at 10m)
Day Night
Incoming Solar Radiation
Strong Moderate Slight
Thinly overcast
or ≥4/8 low
cloud
≤ 3/8
cloud
< 2 A A-B B E F
2-3 A-B B C E F
3-5 B B-C C D E
5-6 C C-D D D D
> 6 C D D D D

Tagros chemicals India Limited
Chapter III 58
Fig 3.1 - Yearly Rainfall (mm) - IMD Station, Cuddalore
500.00
700.00
900.00
1100.00
1300.00
1500.00
1700.00
1900.00
2004 2005 2006 2007
2003-2006
Rai
nfa
ll (
mm
)
Total Rainfall Average
Fig 3.2 - Monthly Average Rainfall (mm) - IMD Station, Cuddalore
0
50
100
150
200
250
300
350
400
450
500
Jan Feb Mar Apr May Jun Jul Aug Sep Oct Nov Dec
2004-2007
Rai
nfa
ll (
mm
)
Monthly Average Rainfall

Tagros chemicals India Limited
Chapter III 59
Fig. 3.3

Tagros chemicals India Limited
Chapter III 60
Fig. 3.4
Note: A = extremely unstable, B = moderately unstable, C = slightly
unstable, D = neutral, E = slightly stable, F = moderately stable.

Tagros chemicals India Limited
Chapter III 61
Neutral class D should be assumed for overcast conditions during day
or night.
Table 3.2 � Relations among stability classification schemes
Description Pasquill Turner
(degrees) Brookhaven Ri(2m)
Very unstable A 1 B2 - 0.9 25
Moderately
unstable B 2 B1 - 0.5 20
Slightly unstable C 3 B1 - 0.15 15
Neutral D 4 C 0 10
Moderately stable E 6 - 0.04 5
Very stable F 7 D 0.08 2.5
Note: A = extremely unstable, B = moderately unstable, C = slightly
unstable, D = neutral, E = slightly stable, F = moderately stable.
Neutral class D should be assumed for overcast conditions during day
or night.

Tagros Chemicals India Limited
Chapter III 62
Table 3.3 � AVERAGE MINIMUM TEMPERATURE (oC) FOR DIFFERENT MONTH
(2004-2007) FROM IMD STATION CUDDALORE
Month 2004 2005 2006 2007 Average
January 20.4 20.5 20 20.6 20.37
February 20.2 20.7 20.1 21.0 20.50
March 23.3 23.5 23.2 22.3 23.07
April 26.5 25.7 24.9 24.9 25.50
May 25.8 26.7 25.4 26.2 26.02
June 25.7 27 24.5 25.9 25.77
July 25.7 25.8 23.9 25.1 25.12
August 26.5 25.6 23.9 24.1 25.02
September 24.3 24.9 25.2 25.2 24.9
October 23.9 24.2 24.1 24.1 24.07
November 22.6 22.1 23.4 21.7 22.45
December 20.8 21.5 21.3 21.4 21.25
Average 23.8 24.0 23.3 23.54 23.67
NOTE : The average temperatures have been calculated on the basis of data available
Source : Indian Meteorological Department

Tagros Chemicals India Limited
Chapter III 63
Table 3.4 � AVERAGE MAXIMUM TEMPERATURE (oC) FOR DIFFERENT MONTHS
(2004-2007) FROM IMD STATION CUDDALORE
Month 2004 2005 2006 2007 Average
January 29.8 30.3 29.8 30.5 30.1
February 30.7 31.5 30.8 31.0 31.0
March 32.4 33 32.5 31.0 32.22
April 34.9 32.9 35 33.9 34.17
May 34.5 36.4 36.4 38.3 36.4
June 35.6 37.9 35.9 36.1 36.37
July 35.1 36.8 36.1 36.0 36.00
August 37.1 36.6 36.4 34.0 36.02
September 32.6 34.6 34.4 33.9 33.87
October 31.7 32.1 31.7 32.2 31.92
November 29.6 28.8 29.8 30.7 29.72
December 29.8 29 29.2 29.2 29.30
Average 32.8 33.3 33.2 33.06 33.09
NOTE : The average temperatures have been calculated on the basis of data available
Source : Indian Meteorological Department

Tagros Chemicals India Limited
Chapter III 64
Table 3.5 � MONTHLY RAINFALL DATA
(2004 - 2007) FROM IMD STATION CUDDALORE
Month 2004 2005 2006 2007 Average
January 20.80 2.60 11.40 0.0 8.7
February 0.00 15.20 0.00 49.8 16.25
March 0.00 3.20 25.80 0.0 7.25
April 0.70 160.40 17.80 13.6 48.125
May 345.70 65.70 37.90 36.9 121.55
June 93.10 1.80 103.40 5.1 50./85
July 10.90 12.10 61.80 76.9 40.42
August 70.40 100.00 12.30 181.5 91.05
September 260.80 145.50 54.00 97.2 139.37
October 534.50 159.40 530.80 432.7 414.35
November 428.60 825.40 310.90 162.8 431.92
December 67.60 306.90 231.80 303.4 227.42
Total 1833.10 1798.20 1397.90 113.32 1285.63
NOTE : The average rainfall have been calculated on the basis of data available
Source : Indian Meteorological Department

Tagros Chemicals India Limited
Chapter III 65
Table 3.6 � MONTHLY MEAN RELATIVE HUMIDITY (%) AT 0830 HOUR
(2004-2007) FROM IMD STATION CUDDALORE
Month 2004 2005 2006 2007 Average
January 85 85 83 86 84.75
February 80 85 83 83 82.75
March 79 81 77 83 80.00
April 74 84 74 77 77.25
May 78 77 73 69 74.25
June 72 66 70 68 69.00
July 71 68 71 73 70.75
August 66 69 68 78 70.25
September 86 67 72 79 76.00
October 82 80 70 84 79.00
November 91 84 78 85 84.50
December 86 85 88 95 88.50
Average 79.2 77.6 75.6 80 78.10
NOTE : The average relative humidity have been calculated on the basis of data available
Source : Indian Meteorological Department
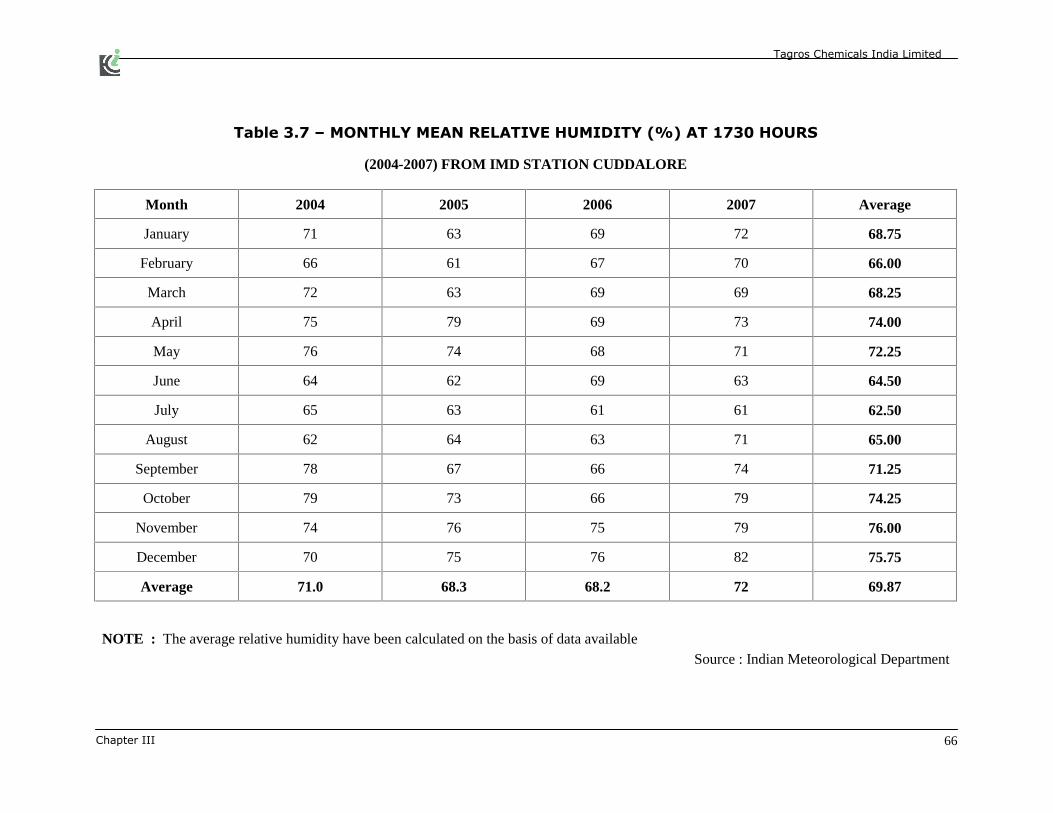
Tagros Chemicals India Limited
Chapter III 66
Table 3.7 � MONTHLY MEAN RELATIVE HUMIDITY (%) AT 1730 HOURS
(2004-2007) FROM IMD STATION CUDDALORE
Month 2004 2005 2006 2007 Average
January 71 63 69 72 68.75
February 66 61 67 70 66.00
March 72 63 69 69 68.25
April 75 79 69 73 74.00
May 76 74 68 71 72.25
June 64 62 69 63 64.50
July 65 63 61 61 62.50
August 62 64 63 71 65.00
September 78 67 66 74 71.25
October 79 73 66 79 74.25
November 74 76 75 79 76.00
December 70 75 76 82 75.75
Average 71.0 68.3 68.2 72 69.87
NOTE : The average relative humidity have been calculated on the basis of data available
Source : Indian Meteorological Department

Tagros Chemicals India Limited
Chapter III 67
Table 3.8 � MONTHLY AVERAGE WIND SPEED, 24 HRS (KMPH)
(2004-2007) FROM IMD STATION CUDDALORE
Month 2004 2005 2006 2007 Average
January 4.00 3.00 5.00 5.00 4.25
February 4.00 3.00 5.00 5.00 4.25
March 5.00 4.00 4.00 5.00 4.50
April 6.00 3.00 6.00 6.00 5.25
May 5.00 3.00 7.00 7.00 5.50
June 7.00 5.00 6.00 9.00 6.75
July 6.00 6.00 6.00 6.00 6.00
August 6.00 5.00 4.00 6.00 5.25
September 4.00 5.00 7.00 6.00 5.50
October 3.00 4.00 4.00 5.00 4.00
November 4.00 4.00 4.00 4.00 4.00
December 5.00 6.00 6.00 5.00 5.50
Average 4.92 4.25 5.33 5.75 5.06
NOTE : The average temperatures have been calculated on the basis of data available
Source : Indian Meteorological Department

Tagros Chemicals India Limited
Chapter III 68
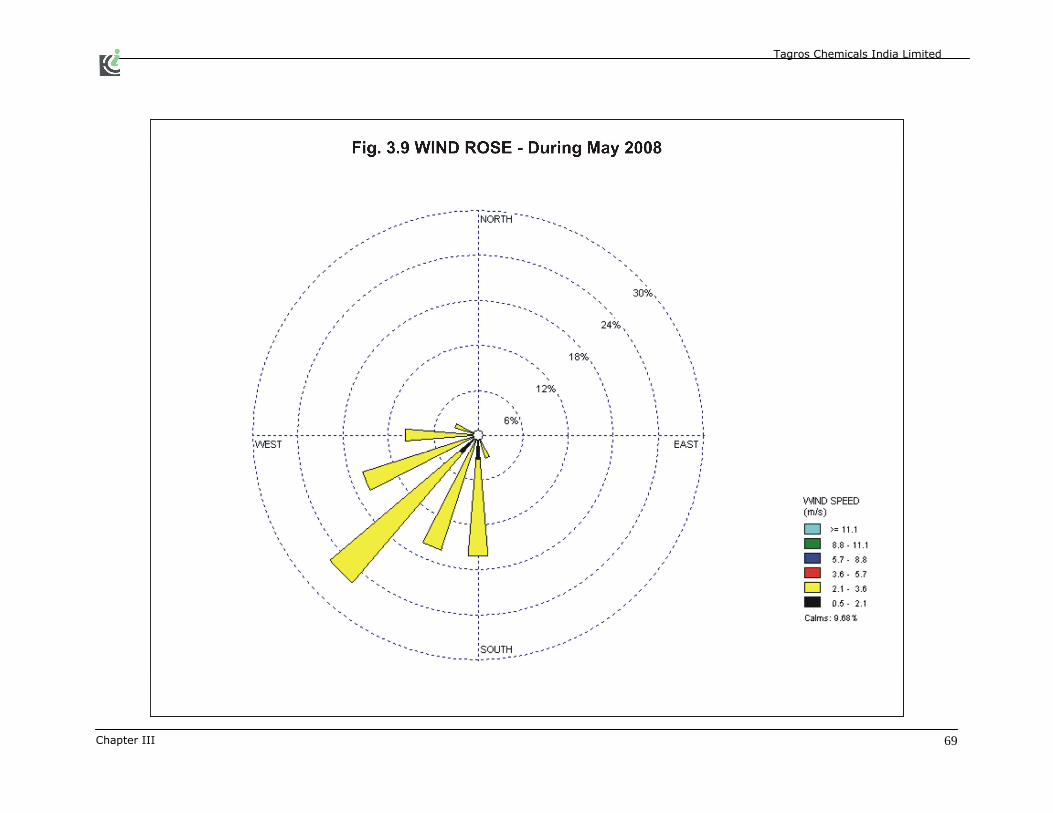
Tagros Chemicals India Limited
Chapter III 69
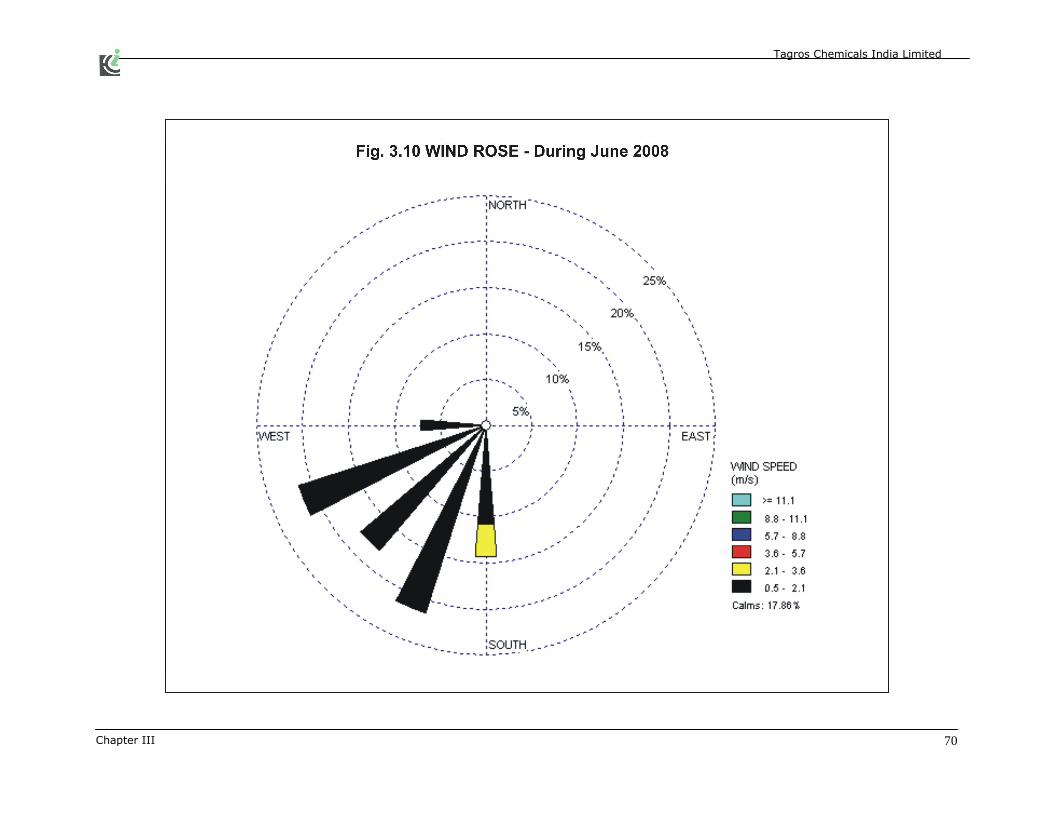
Tagros Chemicals India Limited
Chapter III 70

Tagros Chemicals India Limited
Chapter III 71
3.3 SOIL QUALITY
In order to assess the base line status of soil quality within the project
site for the purpose of greenbelt development, five sampling stations
were selected. At each location, samples were collected according to
their layers and analyzed for various parameters. The results are
summarized in Table 3.2 and the sampling locations are shown in
Fig3.5.
3.4 WATER QUALITY
Selected water quality parameters of ground water and surface
resources within 10 km radius of the study area has been studied for
assessing the water environment and evaluate anticipated impact of
the proposed distillery unit. Understanding the water quality is
essential in preparation of Environmental Impact Assessment and to
identify critical issues with a view to suggest appropriate mitigation
measures for implementation.
The purpose of this study is to:
Assess the water quality characteristics for critical parameters
Evaluate the impacts on agricultural productivity, habitat
conditions, recreational resources and aesthetics in the vicinity
and
Prediction of impact on water quality by this project and related
activities.
The summaries of analytical results of water quality of the five
sampling stations are presented in Table 3.3 and the sampling
locations are shown in Fig 3.6.

Tagros Chemicals India Limited
Chapter III 72
Table 3.9 � Soil Quality
Parameters Sampling Locations
SS1 SS2 SS3 SS4 SS5 SS6 SS7 SS8
pH 6.3 6.9 6.8 6.3 6.7 6.8 6.7 6.5
EC Decisiements / mmhos / cm
19.0 13.0 11.0 12.0 13.0 9.0 16.0 8.0
Mac
ro
Nut
rien
t (K
g/ac
re) N 127 108 99 126 96 88 121 89
P 5.9 6.1 4.7 6.9 5.5 4.6 7.3 5.4
K 46 49.6 39 54 62 49 68 60
Mic
ro N
utri
ent
ppm
Zn 1.3 1.2 0.8 1.2 1.0 0.8 1.2 1.0
Cu 1.0 1.4 0.9 1.3 1.0 0.9 1.3 1.3
Mn 1.8 1.6 1.5 2.2 1.9 1.8 3.3 1.0
Fe 3.4 3.1 2.7 2.5 2.8 2.6 2.1 1.8
Natural Moisture Content (%)
1.4 5.6 0.90 1.1 0.8 1.7 3.7 2.7
Grain Size Distribution
Gravel (%) 1 - 2 - - 1 - 1
Sand (%) 31 32 23 26 37 21 24 33
Slit (%) 47 42 42 46 39 45 50 47
Clay (%) 20 26 33 28 24 33 26 19
Textural Class Silty Loam
Silty Clay Loam
Sandy Silty Loam
Silty Loam
Sandy Silty
Sandy Loam
Silty Silty Loam
SS1 - Factory site SS5 - Kudikkadu
SS2 - Karaikadu SS6 - Tondamankuppam
SS3 - Annavalli SS7 - Mavadippalaiyam
SS4 - Sedappalaiyam SS8 - Karaiyervittakuppam

Tagros Chemicals India Limited
Chapter III 73
Table 3.10 � Characteristics of Water
S. No. Parameters SW1 SW2 SW3 SW4 SW5 SW6 SW7 SW8
1. pH 6.6 6.4 6.8 6.3 6.9 6.1 6.8 7.6
2. Colour (Visual) Colourless
3. Odour Odourless
4. Turbidity (NTU) 2 1 2 NIL 3 NIL NIL 3
5. Total Suspended
Solids BDL BDL BDL BDL BDL BDL BDL BDL
6. Total alkalinity (CaCo3) 19 23 48 98 123 84 102 93
7. Total hardness
(CaCo3) 137 152 191 83 162 89 44 69
8. Calcium (Ca) 38 46 56 20 57 31 10 21
9. Magnesium (Mg) 10 46 20 6 28 12 3 7
10. Iron (Fe) BDL BDL BDL BDL BDL BDL BDL BDL
11. Chlorides (Cl) 84 106 130 56 104 62 28 57
12. Sulphates (SO4) 36 43 31 13 36 30 11 12
13. Fluorides (F) BDL BDL BDL BDL BDL BDL BDL BDL
14. Nitrates (NO3) BDL BDL BDL BDL BDL BDL BDL BDL
15. Total dissolved solids 296 301 283 150 293 191 71 143
Source Bore
well
Bore
well Bore
well Bore
well Bore
well Bore
well Bore
well Bore
well
Except items (1) and (5) all values are expressed in mg/l.
BDL - Below Detectable Limit
SS1 - Factory site SS5 - Kudikkadu
SS2 - Karaikadu SS6 - Tondamankuppam
SS3 - Annavalli SS7 - Mavadippalaiyam
SS4 - Sedappalaiyam SS8 - Karaiyervittakuppam

Tagros Chemicals India Limited
Chapter III 74
Tagros Chemicals India Limited
Chapter III 75
3.5 AMBIENT AIR QUALITY
The ambient air quality with respect to the study zone of 10 km radius
around the proposed distillery site forms the baseline information. The
various sources of all air pollution on the region are found to be very
low. The prime objective of the baseline air quality study was to
assess the existing air quality of the area. This will also be useful for
assessing the conformity to standards of the ambient air quality during
the operation of the proposed distillery unit. The study area
represents mostly rural environment.
The analysis of air quality data including 98th percentile, arithmetic
mean, standard deviation of SPM, SO2 & NOx are presented in Tables
3.4 to 3.6 and the sampling location are shown in Fig 3.7.
3.5.1 Frequency and Parameters for Sampling
Frequency of Monitoring
The following frequency has been adopted for sampling:
Ambient air quality monitoring has been carried out with a
frequency of two days per week at eight locations.
Parameters
The baseline data of air environment is generated for the following
parameters:
Total Suspended Particulate Matter (TSPM);
Sulphur dioxide (SO2) and
Oxides of Nitrogen (NOx)

Tagros Chemicals India Limited
Chapter III 76
Duration of Sampling
The sampling duration for Suspended Particulate Matter (SPM), SO2
and NOx is twenty four hourly continuous samples per day.
Method of Analysis
The air samples are analyzed as per standard methods specified by
Central Pollution Control Board (CPCB), IS: 5184 and American Public
Health Organization (APHA).
Table 3.11�Ambient Air Quality Status (SPM) � April and June 2008
Averaging Time: 24 Hrs Unit : microg/m3
SA.
No. Sampling Station
Bearing
*
Distance
* (KM) Max Min
Arithmetic
Mean
Standard
Deviation
98th
Percentile
SA1 Factory Area -- -- 147 117 135.83 8.52 147
SA2 Pachayankuppam NE 1.6 142 104 126.37 8.28 142
SA3 Ponniyankuppam NW 4.0 135 110 127.16 6.08 135
SA4 Karaikadu SW 4.8 138 118 127.20 6.37 138
SA5 Karaikadu SW 4.4 139 114 126.66 6.76 139
SA6 Kudikkadu S 4.5 128 101 121.70 6.28 128
SA7 Karayervittakuppm NW 3.0 118 106 108.91 3.22 118
SA8 Sedappalaiyam SW 7.7 115 98 109.91 5.46 115
* With respect to project site
Permissible limit of SPM for industrial area = 500 microg/m3
Permissible limit of SPM for residential & Rural area = 200 microg/m3

Tagros Chemicals India Limited
Chapter III 77
Table 3.12 �Ambient Air Quality Status (RPM)�April to June 2008
Averaging Time: 24 Hrs Unit: microg/m3
SA.
No. Sampling Station
Bearing
*
Distance
* (KM) Max Min
Arithmeti
c Mean
Standard
Deviation
98th
Percentile
SA1 Factory Area -- -- 58 46 51.29 3.43 58
SA2 Pachayankuppam NE 1.6 53 41 45.75 2.57 53
SA3 Ponniyankuppam NW 4.0 49 43 44.58 2.22 49
SA4 Karaikadu SW 4.8 51 40 42.95 3.23 51
SA5 Karaikadu SW 4.4 45 38 38.83 1.73 45
SA6 Kudikkadu S 4.5 41 34 38.25 3.20 41
SA7 Karayervittakuppm NW 3.0 43 31 36.58 3.26 43
SA8 Sedappalaiyam SW 7.7 47 37 39.04 2.25 47
* With respect to project site
Permissible limit of RPM for industrial area = 150 microg/m3
Permissible limit of RPM for residential & Rural area = 100 micro g/m3
Table 3.13�Ambient Air Quality Status (SO2) � April and June 2008
Averaging time: 24 hrs. Unit: microg/m3
SA.
No. Sampling Station
Bearing
*
Distance*
(KM) Max Min
Arithmet
ic Mean
Standard
Deviation
98th
Percentile
SA1 Factory Area -- -- 17 12 13.83 1.68 17
SA2 Pachayankuppam NE 1.6 13 8 10.33 1.49 13
SA3 Ponniyankuppam NW 4.0 10 7 8.79 1.14 10
SA4 Karaikadu SW 4.8 14 9 11.54 1.88 14
SA5 Karaikadu SW 4.4 15 11 13.16 1.46 15
SA6 Kudikkadu S 4.5 12 7 8.95 1.48 12
SA7 Karayervittakuppm NW 3.0 18 13 15.62 1.68 18
SA8 Sedappalaiyam SW 7.7 16 10 13.04 1.92 16
* With respect to project site
Permissible limit of SO2 for industrial area = 120 micro g/m3
Permissible limit of SO2 for residential & Rural area = 80 micro g/m3

Tagros Chemicals India Limited
Chapter III 78
Table 3.14�Ambient Air Quality Status (NOx) � April and June 2008
Averaging Time : 24 hrs. Unit : microg/m3
SA.
No. Sampling Station
Bearing
*
Distance*
(KM) Max Min
Arithmetic
Mean
Standard
Deviation
98th
Percentile
SA1 Factory Area -- -- 30 21 25.20 2.87 30
SA2 Pachayankuppam NE 1.6 20 17 18.29 1.08 20
SA3 Ponniyankuppam NW 4.0 16 13 14.79 1.14 16
SA4 Karaikadu SW 4.8 21 15 18.79 1.97 21
SA5 Karaikadu SW 4.4 24 17 20.66 2.25 24
SA6 Kudikkadu S 4.5 18 14 16.20 1.47 18
SA7 Karayervittakuppm NW 3.0 31 23 27.37 2.51 31
SA8 Sedappalaiyam SW 7.7 28 18 23.5 3.27 28
* With respect to project site
Permissible limit of NOX for Industrial area = 120 microg/m3
Permissible limit of NOX for residential & Rural area = 80 microg/m3

Tagros Chemicals India Limited
Chapter III 79

Tagros Chemicals India Limited
Chapter III 80
3.6 NOISE ENVIRONMENT
The physical description of sound concerns its loudness as a function
of frequency. Noise in general is sound, which is composed of many
frequency components of various loudness, distributed over the
audible frequency range. Various noise scales have been introduced to
describe, in a single number, the response of an average human to a
complex sound made up of various frequencies at different loudness
levels. The most common and universally accepted scale is the A
weighted Scale which is measured as dB (A). This is more suitable for
audible range of 20 to 20,000 Hz. The scale has been designed to
weigh various components of noise according to the response of a
human ear. The impact of noise sources on surrounding community
depends on:
Characteristics of noise sources (instantaneous, intermittent or
continuous in nature). It can be observed that steady noise is
not as annoying as one, which is continuously varying in
loudness;
The time of day at which noise occurs, for example high noise
levels at night in residential areas are not acceptable because of
sleep disturbance; and
The location of the noise source, with respect to noise sensitive
landuse, which determines the loudness and period of exposure.
The environmental impact of noise can have several effects varying
from Noise Induced Hearing Loss (NIHL) to annoyance depending on
loudness of noise. The environmental impact assessment of noise from
construction activity, vehicular traffic can be undertaken by taking into
consideration various factors like potential damage to hearing,
physiological responses, annoyance and general community responses.

Tagros Chemicals India Limited
Chapter III 81
Noise survey has been conducted in the study area while covering
zones viz., residential, industrial and commercial. Noise monitoring
has been undertaken for 24 hr at each location.
The main objective of noise monitoring in the study area is to establish
the baseline noise levels and assess the impact of the total noise
generated by the operation of the proposed distillery unit activities
around it.
The details of sampling locations with respect to the plant site and the
equivalent day night levels are tabulated in Table 3.7 and the sampling
stations are shown in Fig 3.8.
Table 3.15 � Equivalent Day-Night Noise Level Details
SA.
No. Village Bearing *
Distance
(km)
Equivalent Levels dB(A)
Day Night
SN1. Factory Area -- -- 62 55
SN2. Karaikadu NE 1.6 58 51
SN3. Annavalli NW 4.0 55 48
SN4. Sedappalaiyam SW 4.8 58 51
SN5. Kudikkadu SW 4.4 60 53
SN6 Tondamankuppam S 4.5 57 49
SN7 Mavadippalaiyam NW 3.0 51 44
SN8 Karaiyervittakuppam SW 7.7 52 48
* With respect to project site
Day Night
Permissible limit for Industrial Area - 75 70
Permissible limit for Rural Area - 55 45
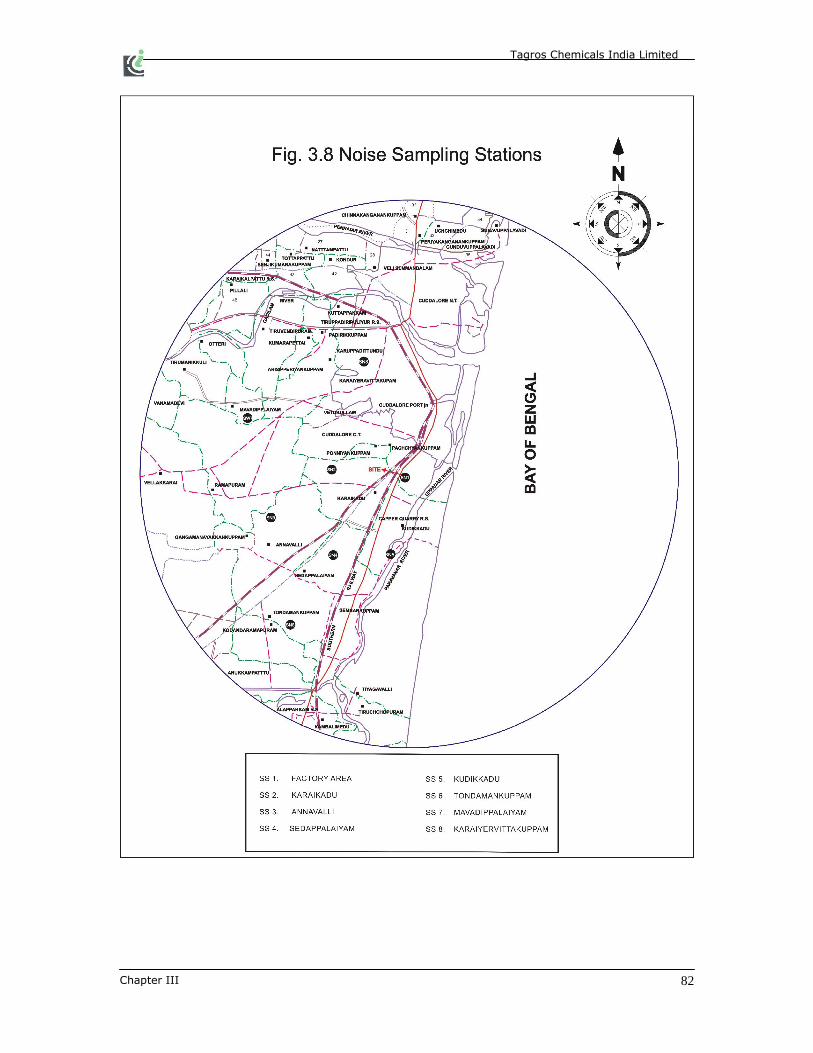
Tagros Chemicals India Limited
Chapter III 82

Tagros Chemicals India Limited
Chapter III 83
3.7 LAND USE STUDIES
Studies on land use aspects of eco-system plays an important role in
identifying sensitive issues and to take appropriate action by
maintaining �Ecological Homeostasis� in the past and present
development of the region.
3.7.1 Objectives
The objectives of land use studies are:
To determine the present land use pattern
To determine the temporal changes in land use pattern over a
period of ten years or so
To analyze the impacts on land use due to proposed distillery
unit activities in the study area and
To give recommendations for optimizing the future land use
pattern vis-à-vis growth of plant activities in the study area and
its associated impacts.
3.7.2 Methodology
For the study of land use, of secondary data like census data hand
book, regional maps regarding topography, zoning settlement,
industry, forest etc., was referred. The data was collected from
various sources like District census hand book, Revenue records, State
and Central Government offices and Survey of India (SOI) Toposheets,
and also through primary field surveys.
3.8 BIOLOGICAL ENVIRONMENT
3.8.1 Vegetation & Wildlife Impact Analysis
Vegetation & Wildlife are important features of the Environment, and
they present special problems in environmental assessment. Living
things are adapted to their setting and they organized into natural

Tagros Chemicals India Limited
Chapter III 84
groupings or communities, with mutual dependencies among their
members, and they show various responses and sensitivity to outside
influence. The countless life cycle modes, forms and activities of plants
and animals are very important for considering in their assessment.
Most organisms are native to the area in which they are found, but
some may be alien. Retention or removal of natural communities and
their replacement with domestic forms have numerous implications
that must be considered both ecologically and economically.
Biological Environment Assessment
A habitat or an area comprises of different kinds of plants and animals
within its boundary. The distribution of flora and fauna in the given
area represents the biological environment. The biological portion of
the environment includes, what is present in the study area, its values,
its responses to impacts description of community uniqueness, the
dominant species, and an evaluation of rare or endangered species.
Study Area - an Outline
The study area covers a radius of 10 km around factory site. The
entire study area has been divided into 2-circles of 5 km radius and 10
km radius.
Field Monitoring Stations
The field monitoring stations were installed in four different locations
in 5km radius area and another four locations were installed in 5 to 10
km radius area. The bio-diversity studies were carried out in
seventeen transacts points of 10 km radius.
Analysis of Vegetation in 5 km Radius
The study sites falling under the 5km radius are villages (9 sites)
except the site. The vegetation recorded in this radius shows a

Tagros Chemicals India Limited
Chapter III 85
dominance of prosopis Juliflora, Cassia auriculata, Azadirachra indica
and Cocos nucifera.
Analysis of Vegetation in 10 km Radius
In the 10km radius, the vegetation analysis was carried out in 8-study
site.
The vegetation in this area shows dominance of Mangifera
indica,Anacardium occidentale,Delonix regia, Casuaraina equisetifolia,
ficus bengaliensis, Eucalyptuslaceolatus, Tamarindus indicus, Borassus
flaellifer, Cocos nucifera, Acacia nilotica, Prosophis juliaflora, Polyalthia
longifolia,Pongamia pinnata, Cassia occidentalis,Achyranthus aspera,
Calotrophis gigatean, Cassia auntrculata, Datura metal, Fuphorbia
antiquorium, Oryza sativa,Arachis hypozia, Hibiscus rosa sinensis,
Tribulus terrestris and few species of grasses like Cyprus sps.
Fauna Assessment
The animal life (fauna) of an area is dependent upon the vegetation,
and there are countless relationships between the species composing
of an animal community. Fauna assessment involves more problems
than flora assessment by virtue of the greater variety animal types,
their mobility and behavior. Fauna assessment provides a basis for
determining relative abundance and evaluating commonness or rarity
of each species encountered.
In the study area, the animal survey was conducted in all the sampling
sites along with the plants. The study includes survey of the animal
communities such as insects, Lesser sardines, Perches, Leiagnathus,
squirrel, dogs, cats, goats, mollusks, fishes, reptiles, birds and
mammals.

Tagros Chemicals India Limited
Chapter III 86
Insects
Totally 47 species of insects are recorded in the study area belonging
to 14 order and 34-families. The broadly come under the categories
are flies, stone - flies, dragon and damsel flies, grass hopper, and
crickets, cockroaches, mantids, white ants, bugs, beetles, wasps, ants,
butter flies, moths, mosquitoes and common house flies.
The environmental interactions of these insects reveal that, they are
interrelated and majority of them are useful insects, however natural
and harmful insects are also found in the list. There are no rare and
endangered species recorded in the study area.
Mollusca
The phylum mollusca includes the animal like mussel, snail, oyesters
etc. The following molluscs were identified in study area.
1. Pila globosa
2. Fresh water mussel
3. Ariophanta
The Pila globosa (apple snail) was commonly found in ponds, tanks
and paddy fields. The ariophanta was found near a water body. The
fresh water mussel was found at the bottom of the lakes and ponds
partly buried in the mud.
Snakes
The snakes recorded in the study area include four species viz., rat
snake, cobra, sussels viper and saw scaled viper.
Birds
In the study area totally 40-bird species were identified. The
occurrence of birds in various locations largely depends on site

Tagros Chemicals India Limited
Chapter III 87
characteristics. The presence of birds at different study sites reveal
that there is very good relationship between the birds and its habitat
along with the vegetation. The maintenance of ecological balance could
be seen among study area.
3.9 SOCIO-ECONOMIC ENVIRONMENT
Any development activity will have impact on the socio-economic
conditions of the population in the region and thereby on the quality of
life. Socio-economic survey plays an important role in the preparation
of Environmental Impact Assessment statement to get the idea of
changes on social, economical and cultural status. Baseline data for
demographic characteristics, occupational status and health amenities
existing in the study area were collected.
3.9.1 Reconnaissance
Detailed socio-economic survey was carried out within 10 km radius of
the proposed plant to assess the socio-economic status of the
population. Information of Socio-Economic profile of the villages were
collected from Panchayat union office and Statistical Department.
3.9.2 Population
Total population of the 7 villages within 10 km radius from the project
site is 23115. The male to female ratio is 100:99. The detail of
population is given in Table 3.8
3.9.3 Power and Energy
Almost all the villages in the study area are electrified. Firewood and
cooking gas (LPG) are the chief sources of cooking fuels.

Tagros Chemicals India Limited
Chapter III 88
3.9.4 Agriculture
The area is having two main cropping seasons Viz, Kharif (June-
September), and Rabi (October-March). Due to insufficient irrigation
facilities, the productivity of land is moderate. Irrigation is mainly
dependent on ground water and rain. The major crops include cotton
and other rain fed food grains.
3.9.5 Occupation
"Work" has been defined as participation in any economically
productive activity. Such participation may be physical or mental.
Persons on leave and training are also treated as workers. However
rent receivers and pensioners were not treated as workers.
3.9.6 Workers
Main workers are those, who work for a major part of the year. Main
activity of a person who was engaged in more than one activity are
reckoned in terms of time disposition.
Main workers are classified into 3 categories viz., Cultivators,
Agricultural Labourers, and Other Workers. The worker details are
given in Table 3.9.
The person who is engaged either as employer, single worker or family
worker in cultivation of land owned is termed as cultivators.
Persons working in other�s land for wages or share in the yield have
been treated as "Agricultural Labourers".
3.9.7 Others
All workers i.e. those who have engaged in some economic activity
during the last one year, who are not cultivators or agricultural
Labours are other workers. This type of workers that come under this

Tagros Chemicals India Limited
Chapter III 89
category include foundry workers, plantation workers, those in trades,
commerce, business, transport, mining, construction, political or social
works, all government servants, municipal employees, teachers,
priests, entertainment artists etc.
3.9.8 Marginal Workers
Marginal workers are those who have worked at any time in the year
preceding the enumeration but have not worked for a major part of
the year.
Non-workers constitute households, students, dependents, retired
persons etc.
3.9.9 Education and Literacy
A person who can both read and write with understanding in any one
of the languages will be treated as "Literate".
3.9.10 Transport and Communication
Transport facilities are quite good in the study area. All the villages in
the area are linked either by pucca or kutcha roads. The state highway
connecting Chidambaram � Pondichery passes in the western direction
.
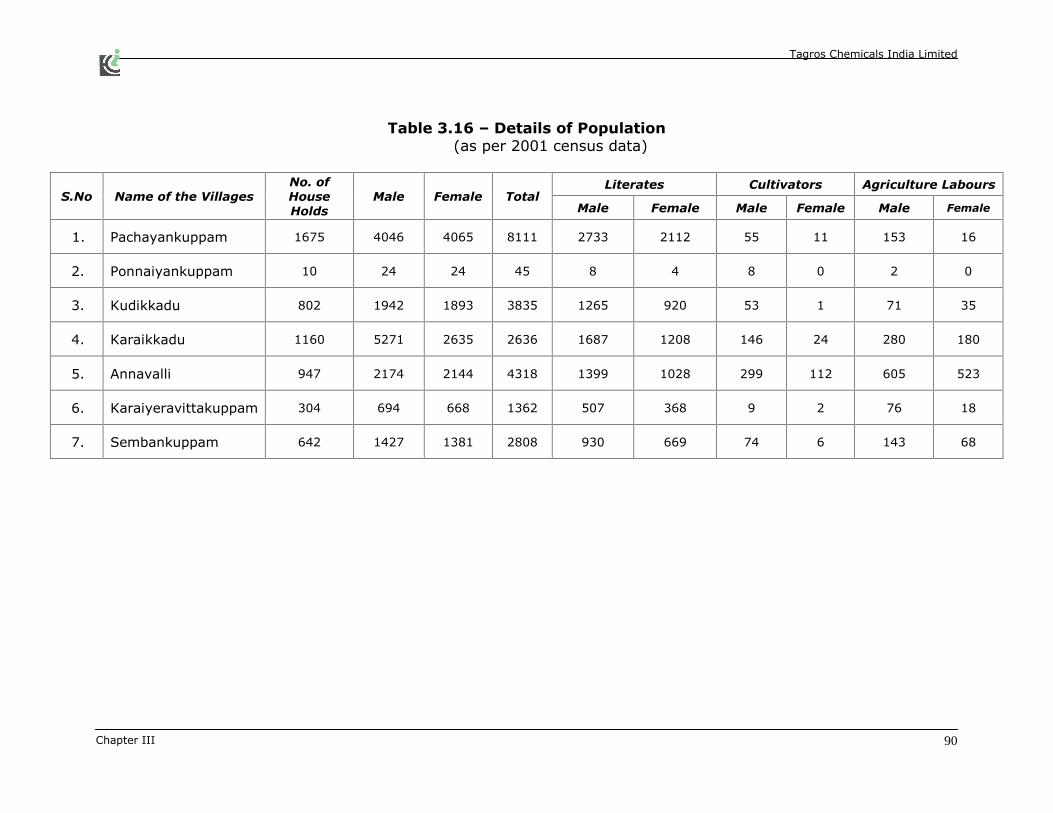
Tagros Chemicals India Limited
Chapter III 90
Table 3.16 � Details of Population
(as per 2001 census data)
S.No Name of the Villages
No. of
House
Holds
Male Female Total Literates Cultivators Agriculture Labours
Male Female Male Female Male Female
1. Pachayankuppam 1675 4046 4065 8111 2733 2112 55 11 153 16
2. Ponnaiyankuppam 10 24 24 45 8 4 8 0 2 0
3. Kudikkadu 802 1942 1893 3835 1265 920 53 1 71 35
4. Karaikkadu 1160 5271 2635 2636 1687 1208 146 24 280 180
5. Annavalli 947 2174 2144 4318 1399 1028 299 112 605 523
6. Karaiyeravittakuppam 304 694 668 1362 507 368 9 2 76 18
7. Sembankuppam 642 1427 1381 2808 930 669 74 6 143 68

Tagros Chemicals India Limited
Chapter IV 91
4.0 IMPACT ANALYSIS
4.1 PREAMBLE
The predictions of worst possible impact scenario along with baseline
status of environment helps in identification of appropriate mitigate
measures in the planning stage to minimize environmental damage.
It is therefore necessary to identify the critical likely impacts due to
setting up of this unit for various attributes of environment, if no
pollution control measures are adopted.
Proposed project would create impacts on the environment in two
distinct phases.
1. During construction phase which may be regarded as temporary
or short term.
2. The other during the operational phase, which would have long-
term effects.
The environmental impacts in this study have, as such, been discussed
separately for the construction phase and operational phase of the
industry.
4.2 CONSTRUCTION PHASE
The construction phase impacts are expected to be minimal, as for as
construction of the main units are concerned.
During the construction phase, the following activities among others
are considered to be important towards development of impact.
a) Site preparation
b) Excavation and back filling
c) Piling, cutting and drilling
d) Mixing of concrete and mortar

Tagros Chemicals India Limited
Chapter IV 92
e) Concrete construction
f) Erection of steel structures
g) Road construction
h) Painting and finishing
i) Cleanup operations
j) Landscaping and afforestation
In our industry proper planning work of construction will be engaged,
so that the impact due to construction phase will be very low.
4.2.1 Land Transportation and Construction
Construction does not involve any heavy construction equipment.
Transportation of raw material through trucks may not affect traffic in
the main roads.
4.2.2 Land Use
Presently land is not used for agriculture or any other use. The land
was once used for rain fed agriculture, which has been stopped
permanently for past few years.
4.2.3 Water Resources
Any construction activity will need water for mixing cement mortar and
concrete. The demand at present case will vary from 10 to 20 cubic
metre per day depending on the day to day activity. Average demand
shall be 15 cubic metre per day.
The construction shall take place for two to three months.
4.2.4 Air Quality
Air quality will be disturbed by erosion of soil during earthwork and
masonry work. To avoid unnecessary inconvenience, water will be
sprayed on soil heap.
Tagros Chemicals India Limited
Chapter IV 93
4.2.5 Service System
No service system will be disturbed even if it intends to ship out the
materials in peak hours.
4.2.6 Biological Conditions
The present site is devoid of trees and shrubs. The only vegetation
covered on the land is grass, which will be disturbed and some part
will be lost in construction activity. This could lead to soil erosion.
Hence site without structures will be covered with vegetation.
4.2.7 Transportation System
It may not affect traffic as discussed earlier even if it intends to ship
out the materials in peak hours.
4.2.8 Noise
Noise will be created in the site due to construction activity. Reducing
the activities from 5pm to 9am so as to avoid noise in the evening and
night period will give pleasant feelings to everybody.
4.2.9 Aesthetics
Scenery will be disturbed due to construction activity. This is of less
concern to public as there is no settlement in and around the site.
4.2.10 Community Structure
Community structure will be benefited by generation of employment.
Around 100 jobs will be created for three months during the
construction.
4.2.11 Accident Risk
Accidents may occur during construction which could be avoided with
proper supervision and hiring skilled labour along with proper
planning.

Tagros Chemicals India Limited
Chapter IV 94
4.2.12 Resources
Fuel resource will meet by trucks during construction period.
Purchasing the raw material in nearest place and proper planning of
routes could minimize this. Water resources are conserved by
adopting new techniques with new materials like concrete blocks
instead of bricks, which needs less water compared with later.
The proper schedule of construction will be planned. The
construction work will take about 3 to 4 months.
4.3 OPERATIONAL PHASE
In the operational phase, the important activities contributing to
environmental impacts, either adverse or beneficial are as follows.
a) Material Handling
b) Consumption of Water
c) Consumption of Power
d) Wastewater Discharge and Control
e) Atmosphere Emission
f) Air Pollution Control Measures
g) Employment of Personnel
4.3.1 Land Transportation and Construction
Implementation of the project will improve erodability and soil stability
with revegetation.
4.3.2 Land Use
The proposed activity needs the land, which is inside the same
premises due to the nature of product.
Land Environment will be deteriorated with

Tagros Chemicals India Limited
Chapter IV 95
a) Production of solid waste
The solid waste will be generated from this unit is as follows.
Sl.No. Wastes Quantity
Method of Disposal Existing Expansion
Hazardous Solid Waste
1. Process 2.21T/M, ---- T/M Stored in
HDPE barrels over
impervious platform
under closed shed
2. Salt from
Evaporator 1.3 T/M 3.0 T/M
3. Sludge from ETP 0.5 T/M ---- T/M
4.
Discarded
containers / barrels
/ liners used for
hazardous waste /
Chemicals
3.75 T/M ---- T/M
Cut in to sheets and sold
out to authorized
vendors.
5.
Chemical
containing residue
from
decontamination
2.91KL/M ---- KL/M Treated in the MEEP
6. Used / Spent Oil 83.33 L/M ----- L/M Sold to authorized re -
refiner
7. Spent solvents 3 KL/M --- KL/M Sold to
Non Hazardous Solid Waste
8. Fly Ash from
Boiler 1.8 T/M 3.0 T/M Used for Brick work.
9. Sludge from
STP 0.5 T/M 1.0 T/M Used as Manure.

Tagros Chemicals India Limited
Chapter IV 96
b) Change in surface permittivity and grading
Construction of plant and roads will change the natural
characteristic of the surface. Addition of impervious surface could
add to marginal increase in runoff, which in turn could lead to soil
erosion in case that soil is improperly vegetated.
c) Aesthetics
Developing greenbelt inside and outside the industry will give
aesthetics value. The greater lawn in the vacant space will also
give pleasant aesthetics value.
4.3.3 Water Resources
An average of around 472 cu. meter of raw water will be needed per
day. Hence 472 cu.m per day x 30 day per month = 14160
cu.m/month will be consumed. This will be met by water from SIPCOT
Water Supply.
4.3.4 Water Impact
Sl.No. Waste Water
Details
Quantity per Day
Method of Disposal Existing
m3/Day
After
Expansion
m3/Day
1. Sewage 9.0 19.0
Marine Disposal
through M/s.Cusecs
Conveyance Main
2. Trade Effluent 110.0 172.0
Neutralized and
evaporated by Multiple
Effect Evaporator
Detailed wastewater management plan is described in Chapter V.

Tagros Chemicals India Limited
Chapter IV 97
4.3.5 Air Environment
S.No. Description Air Pollution control Measures
Existing
1. 8 MT FBC Imported coal
fire boiler 30 m height 550mm dia of common
stack has been provided. 2. Boiler (6 T )
3. Boiler (6 T & 4T) 30 m height 550mm dia of common
stack has been provided.
4. DG Set (725 KVA) 6 m height 350mm dia of twinstack with
acoustic measures has been provided.
5. DG Set (500 KVA) 6 m height 350mm dia of stack with
acoustic measures has been provided.
6. DG Set (625 KVA) 6 m height 350mm dia of stack with
acoustic measures has been provided.
7. Storage tank and
Transfer Points
5 m height 75mm dia of stack has been
provided.
8.
Vents of process reactors
in DV Acid chloride /
PMT/ CMT/ DMT
manufacturing section.
6.5 m height 75mm dia of stack has
been provided.
Expansion
9. DG Set (1750 KVA) 10 m height of stack with acoustic
measures will be provided.
10. Storage tank and
Transfer Points 10 m height of stack will be provided.
4.3.6 Service System
Service system including transportation will be unaffected even in peak
hours.
4.3.7 Biological Conditions
Emission of particulate matter along with oxides will affect vegetation
around the unit. The effects may vary from bleaching of leaves,
reduction in effective leaf area for photosynthesis to adverse damage
like death. This could be overcome by following proper environment
management plan.

Tagros Chemicals India Limited
Chapter IV 98
4.3.8 Transportation System
This unit may not affect traffic as discussed earlier, if it intends to ship
out the materials even in peak hours.
a) The common traffic density in the Highway is as follows:
Heavy Vehicles - 28 nos. / hr.
(Bus, Lorry, Trucks)
Light Vehicles - 16 nos. / hr.
(Jeep, Car)
Two Wheelers - 27 nos. / hr.
The traffic density due to transportation of raw materials and products
will be very low, by means of lorries and truckers 75-125 times per
month.
Raw material Transportation
Raw material is easily available in Cuddalore where many similar units
are already in operation.
4.3.9 Noise Impact
In this process, there will be no chance for generating any noise inside
the process area.
Adequate greenbelt cover is provided in and around the Industry to
maintain the prescribed noise level. So the impact on noise
environment will be minimum.
4.3.10 Aesthetics
Any structure built in the centre of plain area will look aesthetically
unpleasant. To overcome this, a green screen of tall trees will be
added which will also help in several other ways.
4.3.11 Community Structure
Socio-economic environment will be benefited by following ways.

Tagros Chemicals India Limited
Chapter IV 99
Due to the proposed project, indirect employment to the extent of 50
will be generated. The Government revenue from the project will
increase by way of direct and indirect taxes, duties, etc. It will also
increase availability in the local market of steel castings of high
quality. The infrastructure development will get an impetus with this
industrial growth. Communications, transport, schools, hospitals,
trade and commerce will indirectly get an impetus.
a) Generation of employment
The proposed project on implementation will generate 300 potential
jobs directly, and will also generate many indirect job
opportunities.
4.3.12 Hazardous
The unit will handle the hazardous material by proper planning and
safety aspects. Hence the community shall not have any danger on
the unit.
4.3.13 Resources
The industry draws the power from TNEB 1975 KVA. After expansion
the power requirement will be 2700 KVA will be met easily.
Tagros Chemicals India Limited
Chapter V 100
5.0 ENVIRONMENTAL MANAGEMENT PLAN
A comprehensive Environmental Management Plan is suggested to
minimize pollution load on air, water, land and socio-economic
environment.
5.1 WASTE MINIMIZATION
The waste minimization forms a part of the Environmental
Management Plan to minimize waste load. The management
commitment is one of the important factors deciding waste
management plan.
5.1.1 Management Commitment
Management initiative, commitment and involvement are key elements
in any waste reduction programme and include activities such as:
Employee awareness and participation
Improved operating procedures
Employee training
Improved scheduling of processes
Employee training, awareness and participation are critically important
and can be problematic aspects of waste minimization programmes.
Total commitment and support of management and employees are
needed for any waste minimization programme to succeed. This
includes the evaluation, implementation and maintenance of
techniques and technologies to minimize waste. It is advised to use
mass balances around the facilities and processes to identify areas
where waste is occurring, perhaps unknowingly. The use of good
process is also recommended.
The technical personnel should continuously educate themselves to
keep abreast of improved waste-reducing, pollution preventing
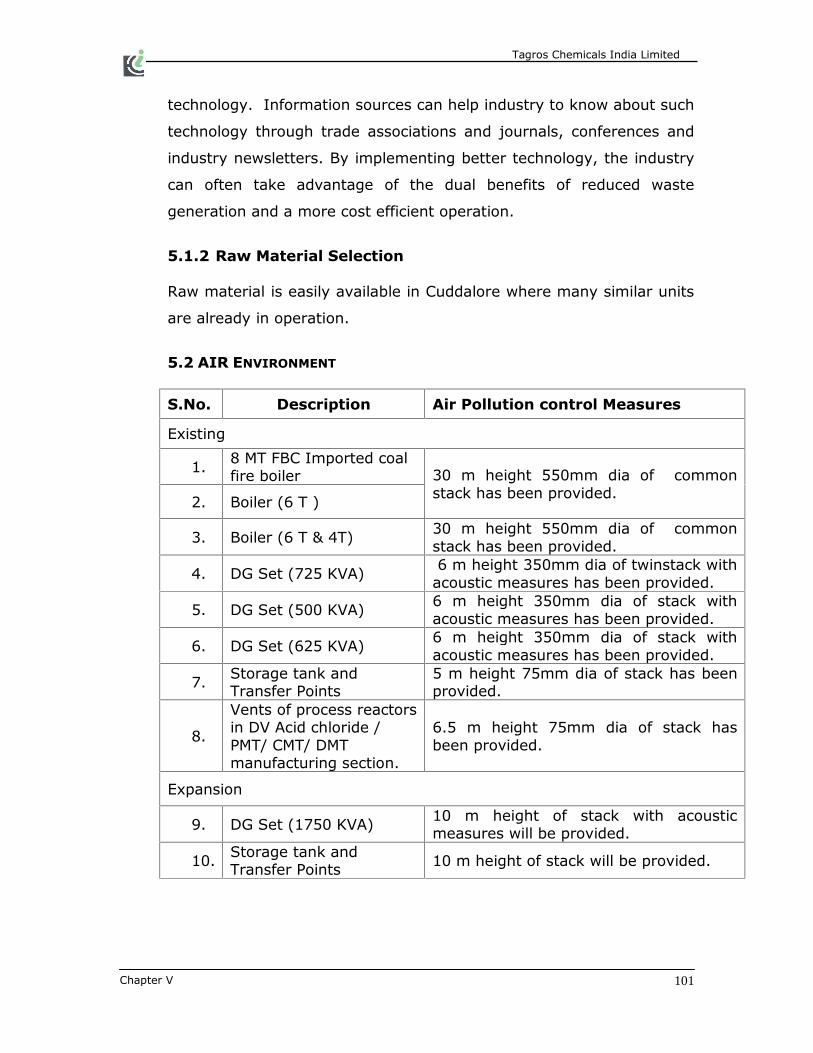
Tagros Chemicals India Limited
Chapter V 101
technology. Information sources can help industry to know about such
technology through trade associations and journals, conferences and
industry newsletters. By implementing better technology, the industry
can often take advantage of the dual benefits of reduced waste
generation and a more cost efficient operation.
5.1.2 Raw Material Selection
Raw material is easily available in Cuddalore where many similar units
are already in operation.
5.2 AIR ENVIRONMENT
S.No. Description Air Pollution control Measures
Existing
1. 8 MT FBC Imported coal
fire boiler 30 m height 550mm dia of common
stack has been provided. 2. Boiler (6 T )
3. Boiler (6 T & 4T) 30 m height 550mm dia of common
stack has been provided.
4. DG Set (725 KVA) 6 m height 350mm dia of twinstack with
acoustic measures has been provided.
5. DG Set (500 KVA) 6 m height 350mm dia of stack with
acoustic measures has been provided.
6. DG Set (625 KVA) 6 m height 350mm dia of stack with
acoustic measures has been provided.
7. Storage tank and
Transfer Points
5 m height 75mm dia of stack has been
provided.
8.
Vents of process reactors
in DV Acid chloride /
PMT/ CMT/ DMT
manufacturing section.
6.5 m height 75mm dia of stack has
been provided.
Expansion
9. DG Set (1750 KVA) 10 m height of stack with acoustic
measures will be provided.
10. Storage tank and
Transfer Points 10 m height of stack will be provided.
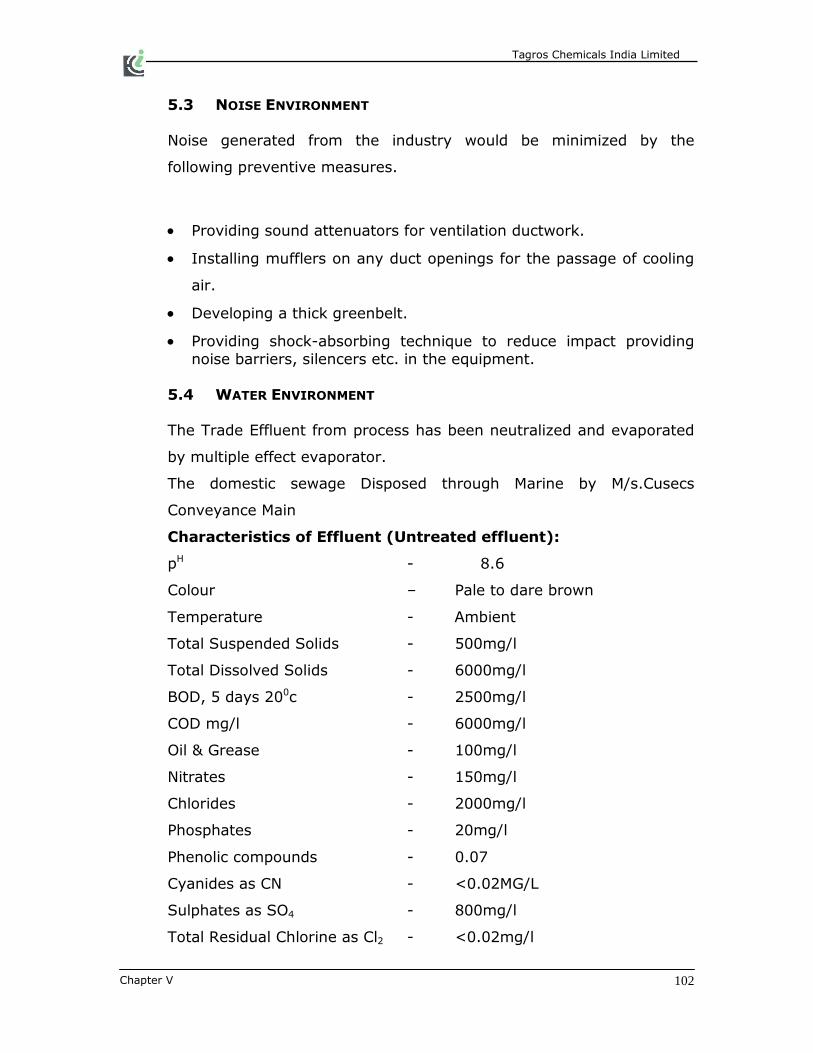
Tagros Chemicals India Limited
Chapter V 102
5.3 NOISE ENVIRONMENT
Noise generated from the industry would be minimized by the
following preventive measures.
Providing sound attenuators for ventilation ductwork.
Installing mufflers on any duct openings for the passage of cooling
air.
Developing a thick greenbelt.
Providing shock-absorbing technique to reduce impact providing
noise barriers, silencers etc. in the equipment.
5.4 WATER ENVIRONMENT
The Trade Effluent from process has been neutralized and evaporated
by multiple effect evaporator.
The domestic sewage Disposed through Marine by M/s.Cusecs
Conveyance Main
Characteristics of Effluent (Untreated effluent):
pH - 8.6
Colour � Pale to dare brown
Temperature - Ambient
Total Suspended Solids - 500mg/l
Total Dissolved Solids - 6000mg/l
BOD, 5 days 200c - 2500mg/l
COD mg/l - 6000mg/l
Oil & Grease - 100mg/l
Nitrates - 150mg/l
Chlorides - 2000mg/l
Phosphates - 20mg/l
Phenolic compounds - 0.07
Cyanides as CN - <0.02MG/L
Sulphates as SO4 - 800mg/l
Total Residual Chlorine as Cl2 - <0.02mg/l

Tagros Chemicals India Limited
Chapter V 103
Lead as Pb - 22.0 mg/l
5.4.1 Effluent Treatment Plant
a) Treatment Flow Chart

Tagros Chemicals India Limited
Chapter V 104
b) Effuent Treatment Plant Design Details
EFFLUENT TREATMENT PLANT
Dimension in Meters
(i)
Oil Skimming & Collection
Sump (3 Nos) :
Size of the tank 4.65m x 3m x 2.5m
Size of the tank : 4.0mx4.0mx2.0m
Size of the tank : 3.5mx1.5mx2m
(ii) Holding Tank (2 Nos)
Big Tank : 13m x 6m x 3m
Small Tank : 1.6m x 3.0m x 1.80m
(iii) Equalization Tank
Size of the tank : 13.0mx6.0mx2.5(LD)+0.5FB
Free Board : 0.3 m
(iv)
Neutralization Tank
(2 Nos)
Size of the Tank : 3mx2.0mx3m
Size of the Tank : 3mx2.0mx3m
(v) Chemical Dosing Tank
Capacity : 1 KL capacity
No. of tanks : 1 No. (PVC) / 1 No. (MS)
(vi) Evaporator Feed Tank
Size of the tank : 10mx4.5mx3m
(vii) Multiple Effect Evaporator (Five Effect)
Effluent Input Capacity : 9 KL/hr
Concentrate Output Capacity : 0.6 KL/hr
Condensate Output Capacity : 8.4 KL/hr
Feed Pump : 10 hp
Concentrate Pump (7 Nos.) : 3 hp
Circulation Pump : 30 hp
Mother liquor Pump : 1.1 hp
Vaccum Pump (2 Nos.) : 15 hp
Vaccum Seal waterPump : 5 hp
Centrifuge Motor :
10 hp

Tagros Chemicals India Limited
Chapter V 105
Detention period : 24 hrs
(viii)
Sodium Cyanide bearing
collection Tank (2 Nos
HDPE Tanks)
Size of the tank : 8 Kl capcity HDPE tank
Size of the tank : 8 Kl capcity HDPE tank
c) Effluent Treatment Plant Process Description:
1. The effluent from various process plants and utility plant is collected in
the collection sump
2. The effluent from collection sump is pumped through oil skimmer, in
which it removes oil and grease substances mixed with effluent
3. Then the effluent from collection sump is transferred to equalization
tank, in this tank various types of effluents get mixed and to form a
uniform composition
4. In neutralization tank the effluents taken from equalization tank by
gravity, by opening the over flow valve up to around 250cm liquid
height
5. Effluents stirred for 15 minutes and sampled to check PH
6. If the pH is acidic that is < 7. Then lye or lime solution is added till PH
is 9. Then add alum or acid solution till PH is 7to7.5.
7. If the PH is alkaline that is PH>7. Then acid or solution is added to it
till PH is 7to 7.5.
8. After adjusting PH 7 to 7.5, the effluent is pumped to evaporator balance tank.

Tagros Chemicals India Limited
Chapter V 106
5.4.2 Sewage Treatment Plant

Tagros Chemicals India Limited
Chapter V 107
a) Sewage Treatment Plant Design Details:
(i) Septic Tank (2 Nos)
Size of the tank : 3.7m x2.0m x 2.0m
Size of the tank : 1.9m x1.35m x1.75m
(ii) Aeration Tank
Size of the tank : 15.5mx4mx3.5m
(iii) Settling Tank (3 Nos)
Size of the tank : 4.0mx1.0mx3.5m
Size of the tank 4.0mx1.0mx3.5m
Size of the tank 4.0mx1.0mx3.5m
(iv) Pressure sand Filter
Size of the Filter : 1.5 m dia x 2.0m HOS
(v)
Activated Carbon
Filter
Size of the filter : 1.5 m dia x 2.0m HOS
(vi) Guard Pond (2 Nos)
Size of the tank : 2.0 x 2.0 x 2.0 m
Size of the tank : 3.0 x 2.5 x 2.0 m
(viii) Sludge Drying Bed
Size of the bed (2 Nos.) : 5.0m x5.0m x 1.0 TH
b) Sewage Treatment Process Description:
Sewage Effluent collection and equalization:
1. The Sewage effluent from Toilet and canteen Are collected in the
separate pit
2. In this Sewage effluents are pumping to the Aeration system
Aeration system:
1. In aerator the overflow from the aerator goes to the primarily settler
and than secondary settler
2. Over flow from secondary settler the treated sewage Effluent are
collected in separate tank.

Tagros Chemicals India Limited
Chapter V 108
Sand filter/Activated carbon filter:
The treated sewage effluent is pumped via sand filter and activated
carbon filter from the collection sump and then pumped to Guard
pond.
Discharge of treated sewage effluent:
1. From the guard pond treated sewage effluents are pumped CUSECS
common sump.
2. During the time of pumping the following parameters are recorded
online with data logger.
3. The on line data logger parameters are displayed in the board
5.5 SOLID WASTE MANAGEMENT
The solid waste will be generated from this unit is as follows.
Sl.No. Wastes Quantity
Method of Disposal Existing Expansion
Hazardous Solid Waste
1. Process 2.21T/M, ---- T/M Stored in
HDPE barrels over
impervious platform
under closed shed
2. Salt from
Evaporator 1.3 T/M 3.0 T/M
3. Sludge from ETP 0.5 T/M ---- T/M
4.
Discarded
containers / barrels
/ liners used for
hazardous waste /
Chemicals
3.75 T/M ---- T/M
Cut in to sheets and sold
out to authorized
vendors.
5.
Chemical
containing residue
from
decontamination
2.91KL/M ---- KL/M Treated in the MEEP
6. Used / Spent Oil 83.33 L/M ----- L/M Sold to authorized re -
refiner
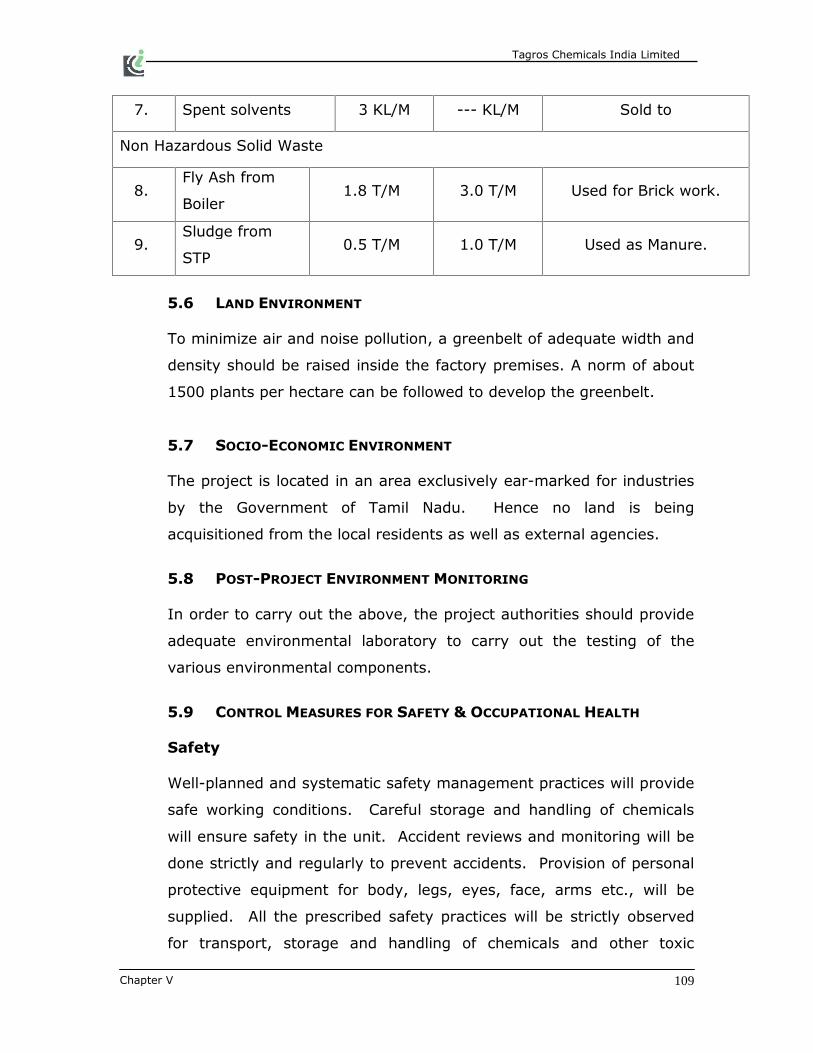
Tagros Chemicals India Limited
Chapter V 109
7. Spent solvents 3 KL/M --- KL/M Sold to
Non Hazardous Solid Waste
8. Fly Ash from
Boiler 1.8 T/M 3.0 T/M Used for Brick work.
9. Sludge from
STP 0.5 T/M 1.0 T/M Used as Manure.
5.6 LAND ENVIRONMENT
To minimize air and noise pollution, a greenbelt of adequate width and
density should be raised inside the factory premises. A norm of about
1500 plants per hectare can be followed to develop the greenbelt.
5.7 SOCIO-ECONOMIC ENVIRONMENT
The project is located in an area exclusively ear-marked for industries
by the Government of Tamil Nadu. Hence no land is being
acquisitioned from the local residents as well as external agencies.
5.8 POST-PROJECT ENVIRONMENT MONITORING
In order to carry out the above, the project authorities should provide
adequate environmental laboratory to carry out the testing of the
various environmental components.
5.9 CONTROL MEASURES FOR SAFETY & OCCUPATIONAL HEALTH
Safety
Well-planned and systematic safety management practices will provide
safe working conditions. Careful storage and handling of chemicals
will ensure safety in the unit. Accident reviews and monitoring will be
done strictly and regularly to prevent accidents. Provision of personal
protective equipment for body, legs, eyes, face, arms etc., will be
supplied. All the prescribed safety practices will be strictly observed
for transport, storage and handling of chemicals and other toxic

Tagros Chemicals India Limited
Chapter V 110
materials. Periodic checking, with standing tests will be done for
electrolytic bath, rectifier etc.
Safety reviews and meetings will be held periodically and accident
reviews and safe practices will be conducted. Safety training will be
imparted to staff frequently. Safety officer will be appointed to
oversee and be responsible for safe status of operations and
equipment. From point of view of safety, all the materials will be
transported in covered manner.
Systems & Procedures
The following guidelines will be followed for ensuring safety:
1. Issuance of standing instructions of safety;
2. Hazardous materials information and control;
3. Preparation and issuance of material safety data sheet and safety
manuals
4. Regular inspection of all aspects of safety;
5. Conducting regular safety audits;
6. Reporting of accidents, failures and �near-misses�;
7. Database and documentation of all safety related information;
8. Inspection of storage, transport and handling of hazardous
materials and safety measures;
9. Inspection and maintenance of all safety equipment including
personnel protection gear and especially that relating to fire
fighting;
10. Identification of personnel who will co-ordinate and take charge
during an emergency;
11. Risk analysis preparation to identify possible risk prone areas and
processes;
12. Identify personnel to co-ordinate and take charge of various
functions and train them in safety measures required in the event
of disaster;
Tagros Chemicals India Limited
Chapter V 111
13. Identify and establish communication lines with local and state
authorities to meet the challenges of disaster;
14. Ensure that the necessary equipment such as boots, ear muffs
helmets, protective overalls, gloves, goggles etc are readily
available;
15. Maintain adequate inventory of first aid kits and essential drugs;
16. Display posters, indicating action plan in case of disaster;
17. Immediate reaction to disaster shall be evacuation of all persons
except those equipped with safety appliances, from the place of
disaster;
18. Take precautionary measures such as providing wet towels and
respirators.
Occupational Health
As adequate protective measures for pollution abatement will be
taken, as described earlier, no occupational health problems are
envisaged. However, periodic monitoring, for prompt detection of any
problem in this regard, will be regularly carried out.
Periodical checks for workers and staff will be done to detect and
occupational health problems and corrective measures will be taken
promptly. Protective devices such as Boots, Helmets, Hand Gloves,
Safety Marks, Goggles, Masks, Aprons Ear Plugs and Ear Muffs etc.,
will be provided to workers to avoid exposure in hazardous areas.
Besides in order to reduce occurrence of epidemics like Malaria, Deng
Fever etc., fumigation practices will be adopted, as necessary, in the
area. Publicity campaigns and medical camps will also be organized in
nearby villages to create awareness about the importance of hygiene
and cleanliness for preventing occurrence of epidemic diseases.
Medical dispensation to local villagers will also be done periodically as
a prophylactic measure to prevent contract of such diseases.

Tagros Chemicals India Limited
Chapter V 112
The following additional facilities will also be provided to the staff.
First Aid Centre
Health camp with professionally qualified doctors will be organized
suitably. Physical body checkup to direct occupational problems
will be done once in every 6 months.
5.10 GREENBELT DEVELOPMENT
5.10.1 Objectives
Greenbelt is a set of rows of trees planted in such a fashion, to create
effective barrier between the plant and the surroundings. The
greenbelt helps to capture the mist emissions and attenuate the noise
levels in the plant and simultaneously improving aesthetics of the plant
site.
5.10.2 Greenbelt Design
The greenbelt development contribute remarkable advantages
especially in pollution abatement process like arresting various
pollution sources like control of mist, fume, noise etc., an increasing
the ecological and aesthetic characteristics of the area. Forests help to
intercept incoming and outgoing radiation. Besides, it helps to block
the harmful effects of heavy precipitation due to soil washout etc.
The filtering capacity of trees for dust is 32 to 80 T/Ha. Noise level
abatement to the tune of about 20-30 dB(A) can be achieved by a
Greenbelt barrier of 50m wide. The project authorities will plant trees
to greenbelt development in peripheral portions and inside vacant
plots of the plant for afforestation. The selection of appropriate plant
species for this purpose is based upon the following criteria.
The plant should be fast growing.
The plant should have thick canopy cover.
Tagros Chemicals India Limited
Chapter V 113
Preferably perennial and evergreen.
Having large leaf area index.
Resistance to specific air pollutant.
Should have maximum height.
Indigenous and should maintain ecological, land and hydrological
balance of the region.
The greenbelt development plan for the particular industry depends on
the following.
Nature and extent of pollution.
Sink capacity of the eco-system.
Climatic factors.
Soil and water quality.
Specific site background.
In any greenbelt development, monoculture is not advisable due to its
climatic factor and other environmental constraints. Greenbelt with
varieties of species is preferred to maintain species diversity, rational
utilization and for maintaining health of the trees.
Well-developed greenbelt will develop a favorable micro-climatic to
support different microorganisms in the soil as a result of which soil
quality will be improved further. In greenbelt bird�s nest may be
introduced to encourage more birds in those areas.
In this unit greenbelt development will be undertaken in all available
areas and also in the earmarked affectation zone, and also along the
roads around the plant and plant infrastructure, etc.
Tall and leafy trees like Azadirachta Indica, Polyalthia, Longifolia,
Pongamia galbrae, etc., will be developed in these areas. Around
administrative office, ornamental varieties like Gulmohar,
Peltaphorum, Jacarandah will be planted with the backdrops of lawns.

Tagros Chemicals India Limited
Chapter V 114
As far as possible the following guidelines will be considered in
greenbelt development. Shrubs and trees will be planted in encircling
rows within the plant site.
The short trees (10 m height) will be planted in the first two rows and
the tall trees (>10 m) in the outer rows around the purview of the
project site.
Planting of trees in each row will be in staggered pattern.
In the front row, shrubs consisting of Alibizia sp. Peltoforum etc will be
grown.
Since the trunks of the tall trees are generally devoid of foliage, it will
be useful to have shrubs in front of the trees so as to give coverage to
this portion.
Spacing between the trees will be slightly maintained facilitating
effective height of greenbelt.

Dha Tagros Chemicals India Limited
Chapter VI 115
6.0 ENVIRONMENTAL IMPACT STATEMENT
The impact statement focuses on the study area, viz., 10 kms around
the unit.
The four basic environmental components likely to be affected are air
environment, water environment, land environment and socio-
economic environment. For each of the above components the impacts
are identified, predicted and evaluated through Battle Environmental
Evaluation System using value function graphs, to classify the adverse
and beneficial impacts.
6.1 NOISE ENVIRONMENT
The impact of noise generated from this unit on the general population
is expected to be insignificant.
6.2 WATER ENVIRONMENT
The Effluent from the process is Neutralized and evaporated by
Multiple Effect Evaporator to achieve zero discharge system.
6.3 LAND ENVIRONMENT
There would be a slightly positive impact, as the proposal would
involve expansion of the greenbelt thus improving the land use and
soil chemistry.
6.4 SOCIO-ECONOMIC ENVIRONMENT
The impact of the project would be more on the positive side than
negative. Positive impacts are felt due to increase in employment
opportunities and economic benefits.
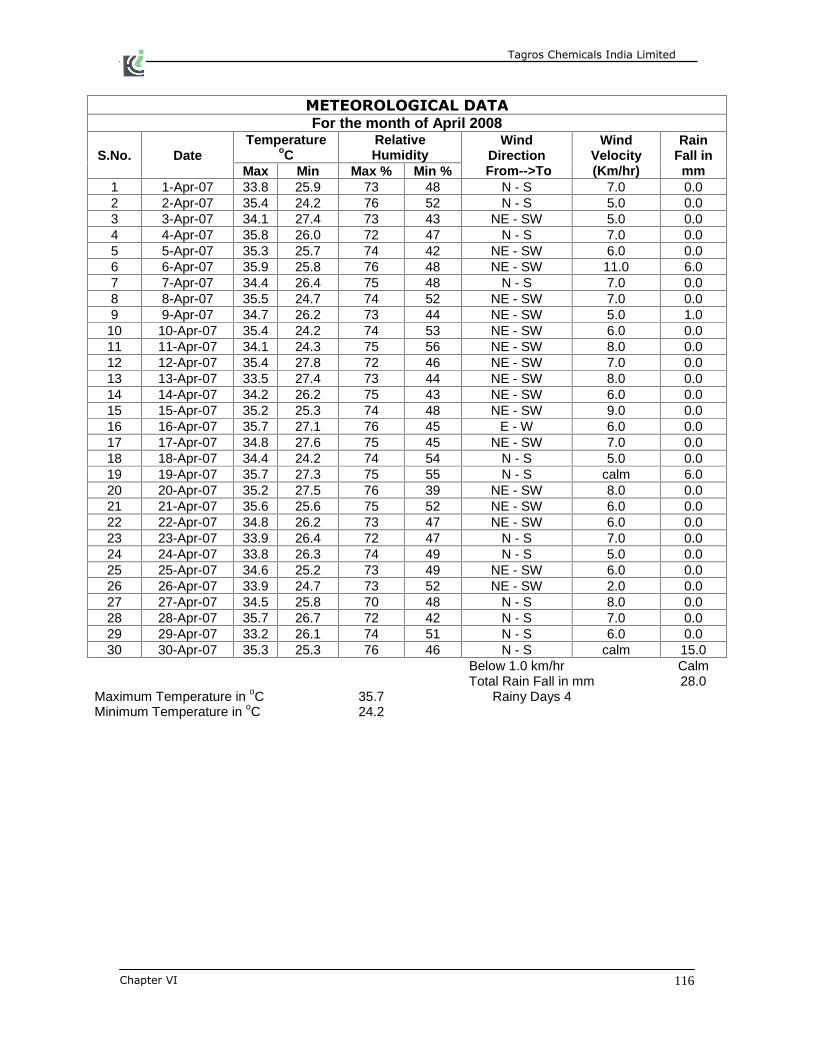
Dha Tagros Chemicals India Limited
Chapter VI 116
METEOROLOGICAL DATA For the month of April 2008
S.No. Date Temperature
oC Relative Humidity
Wind Direction
From-->To
Wind Velocity (Km/hr)
Rain Fall in mm Max Min Max % Min %
1 1-Apr-07 33.8 25.9 73 48 N - S 7.0 0.0 2 2-Apr-07 35.4 24.2 76 52 N - S 5.0 0.0 3 3-Apr-07 34.1 27.4 73 43 NE - SW 5.0 0.0 4 4-Apr-07 35.8 26.0 72 47 N - S 7.0 0.0 5 5-Apr-07 35.3 25.7 74 42 NE - SW 6.0 0.0 6 6-Apr-07 35.9 25.8 76 48 NE - SW 11.0 6.0 7 7-Apr-07 34.4 26.4 75 48 N - S 7.0 0.0 8 8-Apr-07 35.5 24.7 74 52 NE - SW 7.0 0.0 9 9-Apr-07 34.7 26.2 73 44 NE - SW 5.0 1.0
10 10-Apr-07 35.4 24.2 74 53 NE - SW 6.0 0.0 11 11-Apr-07 34.1 24.3 75 56 NE - SW 8.0 0.0 12 12-Apr-07 35.4 27.8 72 46 NE - SW 7.0 0.0 13 13-Apr-07 33.5 27.4 73 44 NE - SW 8.0 0.0 14 14-Apr-07 34.2 26.2 75 43 NE - SW 6.0 0.0 15 15-Apr-07 35.2 25.3 74 48 NE - SW 9.0 0.0 16 16-Apr-07 35.7 27.1 76 45 E - W 6.0 0.0 17 17-Apr-07 34.8 27.6 75 45 NE - SW 7.0 0.0 18 18-Apr-07 34.4 24.2 74 54 N - S 5.0 0.0 19 19-Apr-07 35.7 27.3 75 55 N - S calm 6.0 20 20-Apr-07 35.2 27.5 76 39 NE - SW 8.0 0.0 21 21-Apr-07 35.6 25.6 75 52 NE - SW 6.0 0.0 22 22-Apr-07 34.8 26.2 73 47 NE - SW 6.0 0.0 23 23-Apr-07 33.9 26.4 72 47 N - S 7.0 0.0 24 24-Apr-07 33.8 26.3 74 49 N - S 5.0 0.0 25 25-Apr-07 34.6 25.2 73 49 NE - SW 6.0 0.0 26 26-Apr-07 33.9 24.7 73 52 NE - SW 2.0 0.0 27 27-Apr-07 34.5 25.8 70 48 N - S 8.0 0.0 28 28-Apr-07 35.7 26.7 72 42 N - S 7.0 0.0 29 29-Apr-07 33.2 26.1 74 51 N - S 6.0 0.0 30 30-Apr-07 35.3 25.3 76 46 N - S calm 15.0
Below 1.0 km/hr Calm Total Rain Fall in mm 28.0
Maximum Temperature in oC 35.7 Rainy Days 4 Minimum Temperature in oC 24.2

Dha Tagros Chemicals India Limited
Chapter VI 117
Meteorological Data For the month of May 2008
S.No. Date Temperature oC Relative Humidity Wind
Direction From-->To
Wind Velocity (Km/hr)
Rain Fall in mm Max Min Max % Min %
1 1-May-07 34.9 26.0 71 50 S - N calm 0.0
2 2-May-07 34.6 24.7 68 53 S - N 11.0 3.0
3 3-May-07 35.7 25.2 70 55 SW - NE calm 0.0
4 4-May-07 36.8 24.1 69 61 SW - NE 8.0 0.0
5 5-May-07 37.1 26.3 70 56 S - N 7.0 0.0
6 6-May-07 37.1 25.9 73 63 N - S 8.0 0.0
7 7-May-07 36.2 24.0 71 51 NE - SW 8.0 0.0
8 8-May-07 36.5 25.7 68 57 N - S 9.0 0.0
9 9-May-07 36.2 25.2 70 55 N - S 8.0 0.0
10 10-May-07 35.4 26.8 69 51 NE - SW 8.0 0.0
11 11-May-07 35.2 25.6 70 56 N - S 12.0 2.0
12 12-May-07 35.8 24.2 69 57 NE - SW 10.0 0.0
13 13-May-07 34.4 27.6 71 52 NE - SW 10.0 0.0
14 14-May-07 36.3 26.2 73 50 N - S 8.0 0.0
15 15-May-07 35.3 26.1 68 54 NE - SW 12.0 0.0
16 16-May-07 35.3 24.4 68 60 NE - SW 8.0 0.0
17 17-May-07 35.9 25.4 72 57 NE - SW 11.0 1.0
18 18-May-07 35.7 25.3 70 55 NE - SW calm 0.0
19 19-May-07 36.5 24.2 69 56 N - S 10.0 0.0
20 20-May-07 34.7 24.3 72 50 N - S 10.0 6.0
21 21-May-07 37.6 24.2 70 62 N - S 10.0 6.0
22 22-May-07 36.2 25.8 68 52 N - S 9.0 0.0
23 23-May-07 37.8 25.5 71 58 N - S 8.0 0.0
24 24-May-07 33.8 25.4 69 44 NE - SW 11.0 0.0
25 25-May-07 36.0 26.9 73 53 NE - SW 7.0 13.0
26 26-May-07 35.8 26.1 71 58 NE - SW 8.0 0.0
27 27-May-07 34.6 26.7 69 44 NE - SW 10.0 0.0
28 28-May-07 37.4 24.2 72 62 NE - SW 8.0 0.0
29 29-May-07 36.7 24.1 69 63 NE - SW 8.0 0.0
30 30-May-07 35.3 24.8 71 55 NE - SW 11.0 0.0
31 31-May-07 37.4 25.6 70 59 N - S 8.0 0.0
Below 1.0 km/hr
Total Rain Fall in mm 31.0 Maximum Temperature in oC 37.8 Rainy Days 6
Minimum Temperature in oC 24.0

Dha Tagros Chemicals India Limited
Chapter VI 118
Meteorological Data For the month of June 2008
S.No. Date Temperature oC Relative
Humidity Wind Direction
From-->To
Wind Velocity (Km/hr)
Rain Fall in mm
Max Min Max % Min %
1 1-Jun-07 37.3 27.2 71 36 S - N 4.0 0.0
2 2-Jun-07 36.8 26.1 74 45 SW - NE 6.0 0.0
3 3-Jun-07 37.1 26.2 76 41 SW - NE 4.0 0.0
4 4-Jun-07 37.4 26.4 75 39 S - N 4.0 0.0
5 5-Jun-07 37.6 26.3 74 35 SW - NE 6.0 0.0
6 6-Jun-07 38.5 27.2 65 31 SW - NE calm 0.0
7 7-Jun-07 38.3 26.8 69 33 SW - NE calm 0.0
8 8-Jun-07 37.1 25.8 73 41 SW - NE 6.0 0.0
9 9-Jun-07 38.3 26.5 70 37 S - N 2.0 0.0
10 10-Jun-07 38.5 27.0 74 43 S - N 4.0 0.0
11 11-Jun-07 38.0 27.0 65 29 SW - NE calm 0.0
12 12-Jun-07 38.2 26.7 69 30 SW - NE 2.0 0.0
13 13-Jun-07 37.9 26.2 65 35 S - N 4.0 0.0
14 14-Jun-07 38.6 26.9 70 39 S - N 6.0 0.0
15 15-Jun-07 38.8 27.1 69 35 SW - NE 2.0 0.0
16 16-Jun-07 37.5 25.7 68 38 SW - NE 6.0 0.0
17 17-Jun-07 37.1 25.5 64 36 SW - NE 6.0 0.0
18 18-Jun-07 38.7 27.4 71 30 S - N calm 0.0
19 19-Jun-07 38.1 26.8 65 27 S - N 4.0 0.0
20 20-Jun-07 37.5 26.5 68 34 SW - NE 4.0 0.0
21 21-Jun-07 37.2 26.9 64 35 S - N 4.0 0.0
22 22-Jun-07 36.9 25.5 65 30 SW - NE 4.0 0.0
23 23-Jun-07 36.8 25.6 60 29 SW - NE 6.0 0.0
24 24-Jun-07 37.5 26.0 68 37 S - N 6.0 0.0
25 25-Jun-07 37.6 25.8 64 39 SW - NE 6.0 0.0
26 26-Jun-07 37.6 26.8 65 27 S - N calm 0.0
27 27-Jun-07 37.1 26.5 68 29 S - N 4.0 0.0
28 28-Jun-07 37.3 26.4 69 31 S - N 4.0 0.0
29 29-Jun-07 37.0 25.8 71 34 S - N 6.0 0.0
30 30-Jun-07 37.4 25.8 61 33 SW - NE 8.0 0.0
Below 1.0 km/hr
Total Rain Fall in mm 0.0
Maximum Temperature in oC 38.8 Rainy Days - Nil
Minimum Temperature in oC 25.5

Dha Tagros Chemicals India Limited
Chapter VI 119
ANNEXURE � II AMBIENT AIR QUALITY MONITORING RESULTS
Sl.No. Date Air Quality Monitoring Stations
Factory boundary Pachayankuppam Ponnaiyankuppam Karaikadu Karaikadu SPM RPM SO2 NOx SPM RPM SO2 NOx SPM RPM SO2 NOx SPM RPM SO2 NOx SPM RPM SO2 NOx
1 01.04.2007 130 17 11 16 133 18 11 15 132 17 11 19 126 16 13 15 130 17 11 18
2 02.04.2007 135 17 10 15 130 16 9 14 130 17 10 18 124 16 12 14 128 16 10 17
3 08.04.2007 139 18 15 20 142 17 12 21 139 18 15 23 132 17 17 19 135 18 15 22
4 09.04.2007 140 17 11 17 135 16 10 15 131 17 11 19 124 16 13 15 127 17 11 18
5 15.04.2007 135 17 17 19 140 19 10 16 137 18 16 23 124 18 15 16 122 18 18 23
6 16.04.2007 118 15 9 17 120 16 9 16 116 15 8 16 118 15 9 15 111 14 13 17
7 22.04.2007 145 18 13 18 140 18 12 17 137 18 13 21 130 17 15 17 133 17 13 20
8 23.04.2007 137 17 10 15 135 17 8 14 129 17 9 17 123 16 11 13 125 16 9 16
9 06.05.2007 145 18 14 21 140 18 13 18 138 18 14 22 132 17 16 18 134 17 14 21
10 07.05.2007 140 18 14 20 139 17 12 18 136 18 13 21 130 17 15 17 132 17 13 20
11 13.05.2007 135 16 11 17 130 17 9 15 126 16 10 18 120 16 12 14 122 16 10 17
12 14.05.2007 148 19 15 21 144 19 13 20 142 18 15 23 135 18 17 19 138 18 15 22
13 20.05.2007 143 18 12 17 139 17 11 16 135 18 12 20 128 17 14 16 131 17 12 19
14 21.05.2007 142 17 12 15 137 18 10 15 134 17 12 18 128 17 14 14 130 17 12 17
15 27.05.2007 125 16 11 20 125 16 11 20 123 16 12 20 122 16 11 19 118 15 17 21
16 28.05.2007 119 14 9 18 124 16 10 19 115 15 8 16 120 16 10 18 110 14 13 17
17 03.06.2007 123 15 10 19 114 15 8 16 121 16 10 18 110 14 7 15 116 15 15 19
18 04.06.2007 142 18 14 20 139 18 13 19 136 18 14 22 130 17 16 18 132 17 14 21
19 10.06.2007 138 17 13 18 134 17 10 17 131 17 12 20 125 16 14 16 127 17 12 19
20 11.06.2007 130 16 12 20 124 16 10 20 126 16 12 20 120 16 11 19 121 16 17 21
21 17.06.2007 123 15 10 17 119 15 9 18 119 15 9 17 115 15 9 17 114 15 14 18
22 18.06.2007 128 16 12 21 125 21 14 21 125 16 14 22 121 17 12 19 120 15 16 21
23 24.06.2007 130 15 8 18 135 18 15 18 118 18 10 17 118 15 8 12 115 17 18 20
24 25.06.2007 117 14 8 16 118 15 7 15 114 15 7 15 113 15 6 14 109 14 12 16
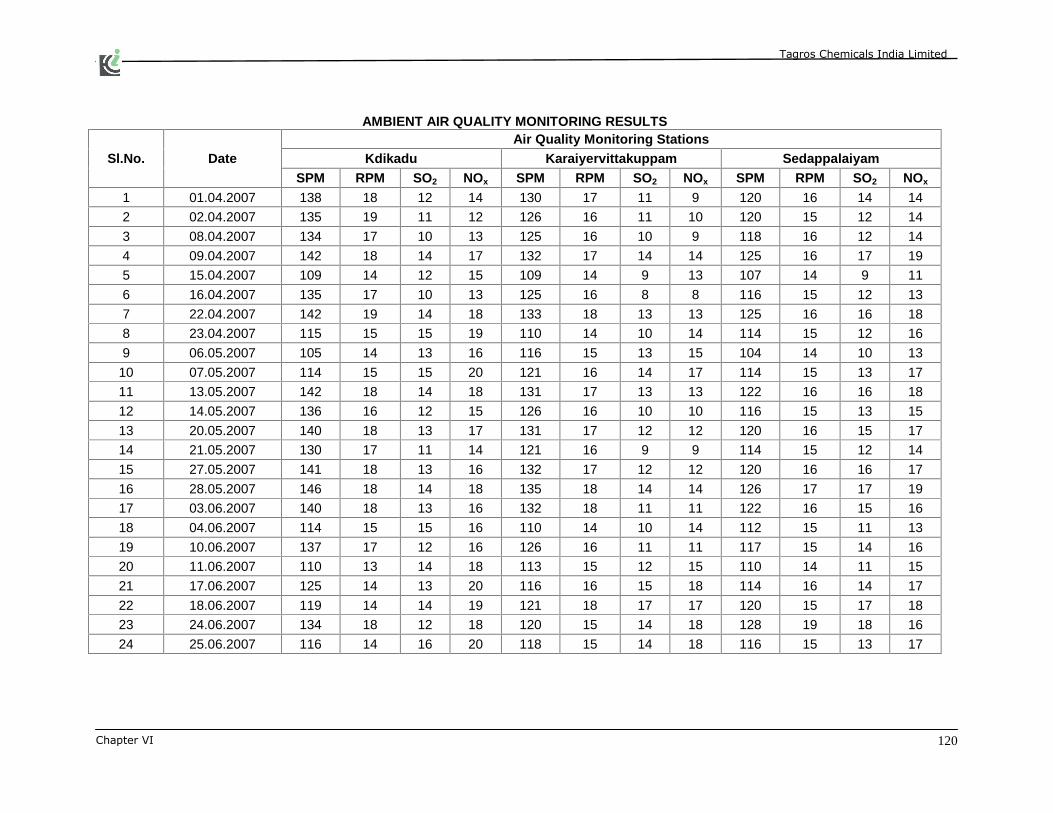
Dha Tagros Chemicals India Limited
Chapter VI 120
AMBIENT AIR QUALITY MONITORING RESULTS
Sl.No. Date Air Quality Monitoring Stations
Kdikadu Karaiyervittakuppam Sedappalaiyam SPM RPM SO2 NOx SPM RPM SO2 NOx SPM RPM SO2 NOx
1 01.04.2007 138 18 12 14 130 17 11 9 120 16 14 14
2 02.04.2007 135 19 11 12 126 16 11 10 120 15 12 14
3 08.04.2007 134 17 10 13 125 16 10 9 118 16 12 14
4 09.04.2007 142 18 14 17 132 17 14 14 125 16 17 19
5 15.04.2007 109 14 12 15 109 14 9 13 107 14 9 11
6 16.04.2007 135 17 10 13 125 16 8 8 116 15 12 13
7 22.04.2007 142 19 14 18 133 18 13 13 125 16 16 18
8 23.04.2007 115 15 15 19 110 14 10 14 114 15 12 16
9 06.05.2007 105 14 13 16 116 15 13 15 104 14 10 13
10 07.05.2007 114 15 15 20 121 16 14 17 114 15 13 17
11 13.05.2007 142 18 14 18 131 17 13 13 122 16 16 18
12 14.05.2007 136 16 12 15 126 16 10 10 116 15 13 15
13 20.05.2007 140 18 13 17 131 17 12 12 120 16 15 17
14 21.05.2007 130 17 11 14 121 16 9 9 114 15 12 14
15 27.05.2007 141 18 13 16 132 17 12 12 120 16 16 17
16 28.05.2007 146 18 14 18 135 18 14 14 126 17 17 19
17 03.06.2007 140 18 13 16 132 18 11 11 122 16 15 16
18 04.06.2007 114 15 15 16 110 14 10 14 112 15 11 13
19 10.06.2007 137 17 12 16 126 16 11 11 117 15 14 16
20 11.06.2007 110 13 14 18 113 15 12 15 110 14 11 15
21 17.06.2007 125 14 13 20 116 16 15 18 114 16 14 17
22 18.06.2007 119 14 14 19 121 18 17 17 120 15 17 18
23 24.06.2007 134 18 12 18 120 15 14 18 128 19 18 16
24 25.06.2007 116 14 16 20 118 15 14 18 116 15 13 17
Top Related