


Languages
Pages
Legal

Building Resilience and Managing Change in our Watersheds
September 8, 2011
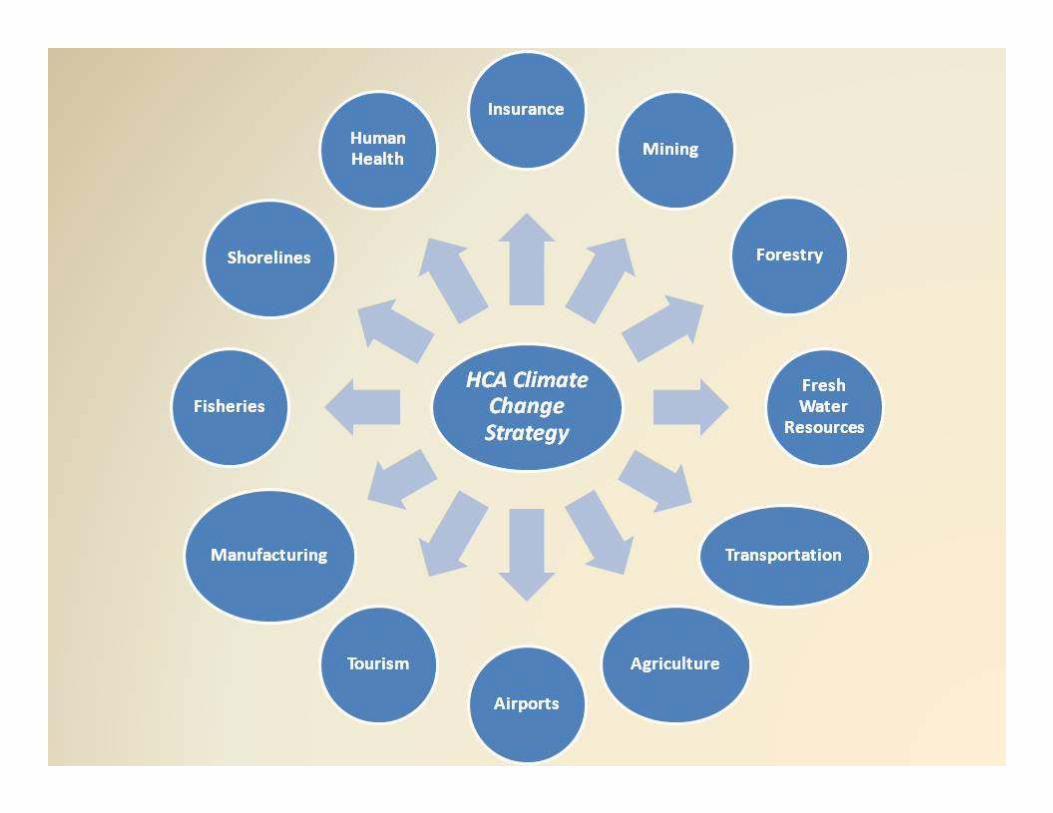
Managing Change:
Defining HCA’s Role in Climate Change

Historical Climate Data for Hamilton
6
7
8
9
10
19
70
19
75
19
80
19
85
19
90
19
95
20
00
20
05
20
10
Te
mp
era
ture
(°C
)
Year
Average Annual Mean
-10
-8
-6
-4
-2
0
19
70
19
75
19
80
19
85
19
90
19
95
20
00
20
05
20
10
Te
mp
era
ture
(°C
)
Year
Average Winter Mean
3
5
7
9
11
19
70
19
75
19
80
19
85
19
90
19
95
20
00
20
05
20
10
Te
mp
era
ture
(°C
)
Year
Average Spring Mean
16
17
18
19
20
21
22
23
19
70
19
75
19
80
19
85
19
90
19
95
20
00
20
05
20
10
Te
mp
era
ture
(°C
)
Year
Average Summer Mean
6
7
8
9
10
11
12
19
70
19
75
19
80
19
85
19
90
19
95
20
00
20
05
20
10
Te
mp
era
ture
(°C
)
Year
Average Fall Mean Change in Average Mean
Temperature
Annual Increase 0.9°C
Winter Increase 1.7°C
Spring Increase 0.7°C
Summer Increase 0.3°C
Fall Increase 0.7°C
Average Mean Temperature
2

Historical Climate Data for Hamilton
600
700
800
900
1000
1100
1200
19
70
19
75
19
80
19
85
19
90
19
95
20
00
20
05
20
10
Pre
cip
ita
tio
n (
mm
)
Year
Total Annual Precipitation
100
150
200
250
300
19
70
19
75
19
80
19
85
19
90
19
95
20
00
20
05
20
10
Pre
cip
ita
tio
n (
mm
)
Year
Total Winter Precipitation
0
100
200
300
400
19
70
19
75
19
80
19
85
19
90
19
95
20
00
20
05
20
10
Pre
cip
ita
tio
n (
mm
)
Year
Total Spring Precipitation
0
100
200
300
400
500
19
70
19
75
19
80
19
85
19
90
19
95
20
00
20
05
20
10
Pre
cip
ita
tio
n (
mm
)
Year
Total Summer Precipitation
50
150
250
350
450
19
70
19
75
19
80
19
85
19
90
19
95
20
00
20
05
20
10P
rec
ipit
ati
on
(m
m)
Year
Total Fall Precipitation - Hamilton Change in Total Precipitation
Annual Increase 26 mm
Winter Decrease of 9 mm
Spring Increase of 4 mm
Summer Increase of 29 mm
Fall Increase of 16 mm
Total Precipitation
3
Equates to approximately 3% increase in annual average
pptn.

What have we been seeing lately........

What have we been seeing lately.......

What have we been seeing lately.......

What have we been seeing lately..........

What have we been seeing lately.....

What have we been seeing lately.....

HCA’sHCA’s FocusFocus
� Water Management
� Natural Areas and Built Heritage
� Outdoor Recreation
� Conservation Education and Awareness
� Corporate Sustainability
HCA’s Programs

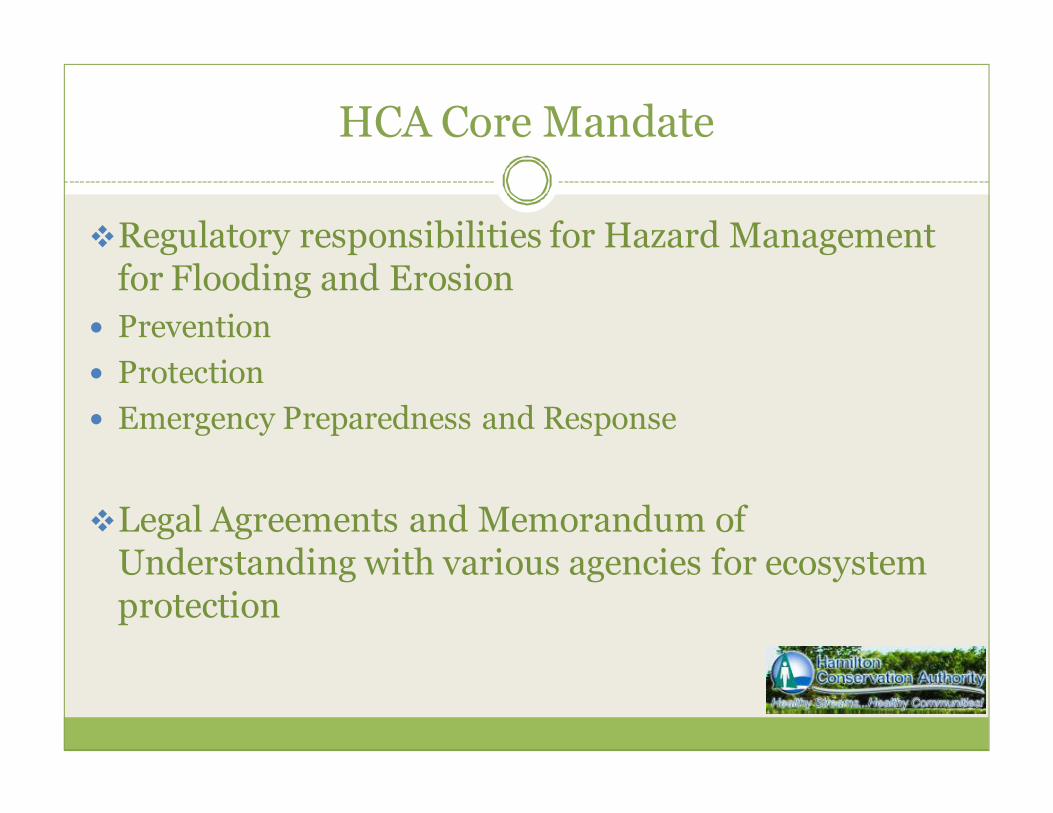
HCA Core Mandate
�Regulatory responsibilities for Hazard Management for Flooding and Erosion
� Prevention
� Protection
� Emergency Preparedness and Response
�Legal Agreements and Memorandum of Understanding with various agencies for ecosystem protection
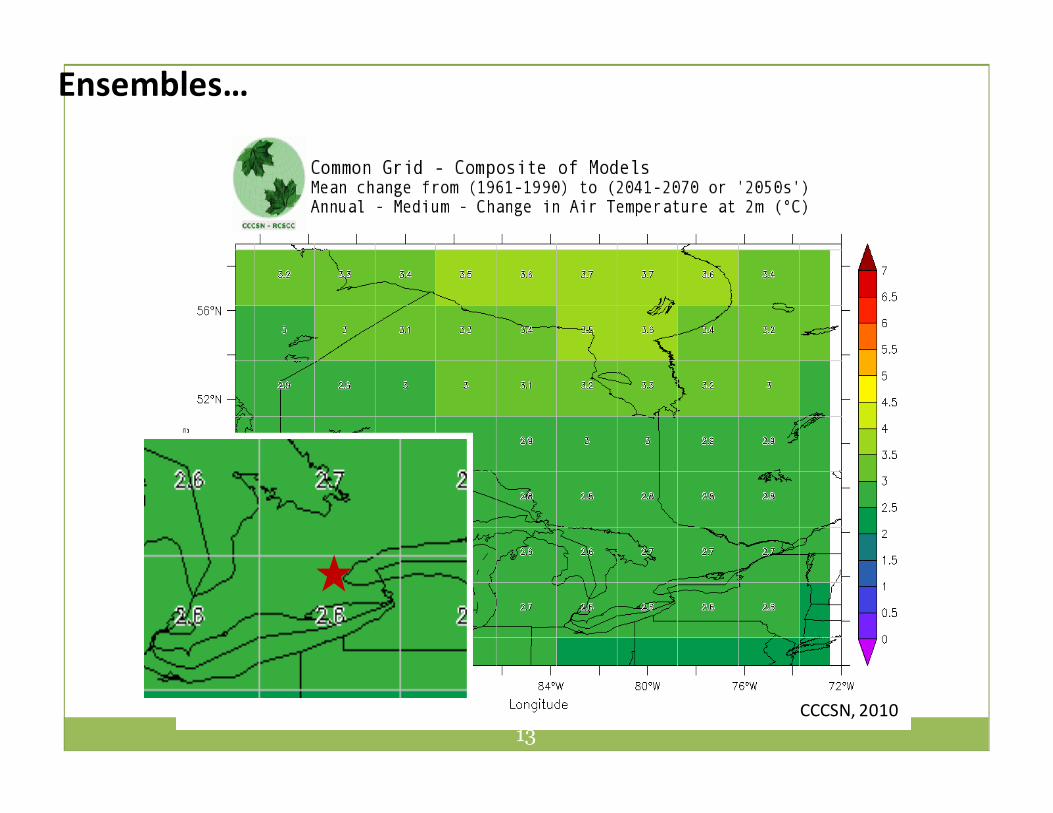
Ensembles…
CCCSN, 2010
13

Projected Changes and Associated Impacts in
Ontario
� Infrastructure
� Water
� Agriculture
� Health
� Communities at Risk
� Forests
� Ecosystems
What are CAs Considering for Adaptive Strategies
� Implementing riparian buffers
� Enhancing and restoring wetlands
� Reforesting
� Putting more storage back on the landscape
� Raising awareness of the impact of northward migration of flora, fauna and disease
� Reviewing and if needed adjusting dam operations
� Implementing good risk management policies
� Maintaining a current watershed plan
� Building Demonstration Projects -Education


What does this mean to HCA and our Partners
We need to continue to manage:
� Our watersheds (features, their functions and linkages) in the face of ongoing and future issues
� Our contributions of loading to Cootes Paradise and Hamilton Harbour
� Future issues including growth, redevelopment, aging infrastructure, deterioration in water quality, flooding and changing climate
� Within the context of Integrated Watershed Management to address these issues in a proactive manner
� Our programs with climate change as an additional but integrated consideration.

Next Steps
� Continue to dialogue with staff, HCA Board, CA Foundation and our partners to work towards a Strategy by December 2011
� Increase HCA’s understanding of how the climate is changing and the potential impacts on a local basis e.g. downscaling and vulnerability analyses
� Apply this understanding to HCA’s plans and operations with “no regrets” integrated adaptation and mitigation strategies
� Assess the need for policy and guidelines e.g. Stormwater management
� Share our findings with our partners
� All of the above will be periodically reviewed and updated.

Thank You
Top Related