


![Landscape Considerations in Wetland Management Reviving ... TAVLEEN.pdf · A. Ecology of wetland ecosystem Fig. 2. Ecology of wetland[2]. Wetlands are often described as “kidneys](https://static.fdocuments.net/doc/165x107/5f786592def5e35b8e0e8aed/landscape-considerations-in-wetland-management-reviving-tavleenpdf-a-ecology.jpg)


Languages
Pages
Legal

Water Systems Group
Comparative Analysis on Man-Made versus Natural Wetland Water
Systems Final Report
Regarding nutrient filtration and water quality of the water systems on the
University of Central Florida campus
Nicholas Shore, Camille Murray, Monica Deaner, and J. Matthew Bardin
November 23, 2010
Analysis of wetland construction variability with respect to nutrient and pollution handling will
contribute further insight into potential trends and cost benefits from wetland/retention modifications,
as well as positive social and environmental contributions.
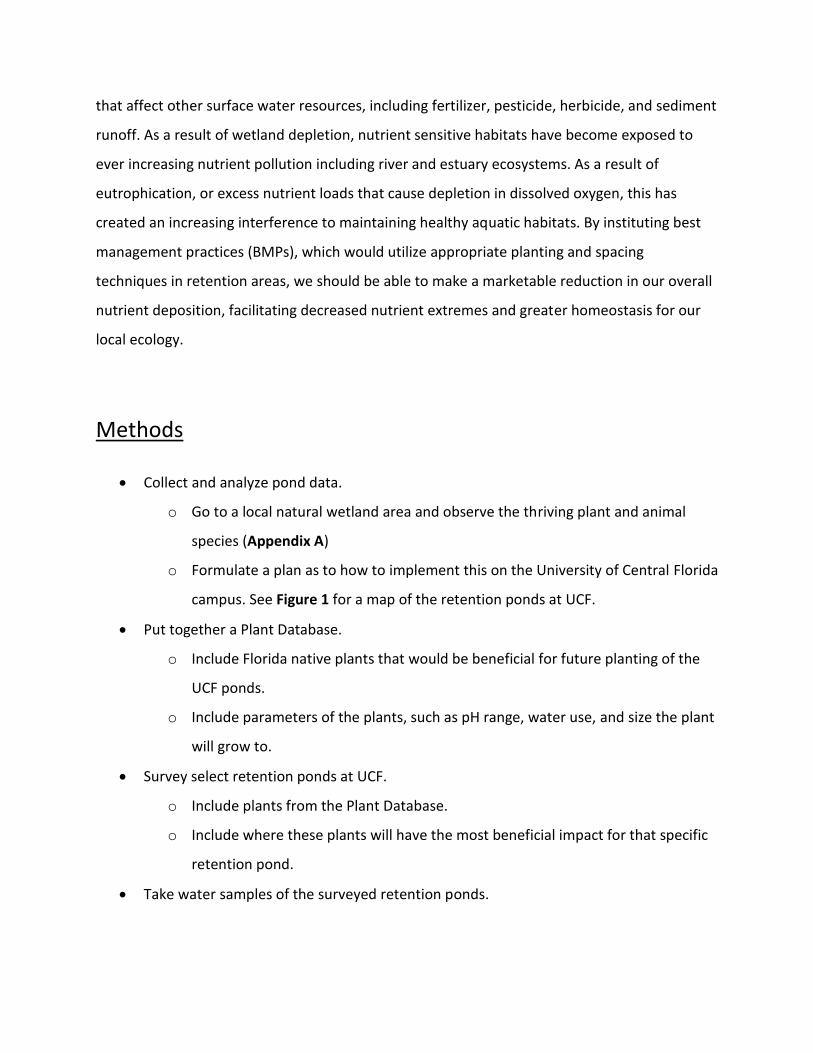
Introduction
Historically, Florida landscape was once covered with a majority of wetland areas that
served as natural floodwater retention areas and habitat. More than 200 million acres of
wetlands existed in the lower 48 states during colonial times. Less than half remain today
largely due to conversion to agricultural, urban, or suburban land (Environmental Protection
agency 1996). Florida alone has witnessed over half of its original wetland habitat lost. Since
wetlands serve as a habitat for diverse biological life, they are considered some of the most
important ecosystems in the world (Gu 2008). Wetlands also serve a variety of biological
functions and help facilitate several biogeochemical cycles (Dreschel 2008). Biogeochemical
cycles are the movement of matter within or between ecosystems, and are caused by living
organisms, chemical reactions, or geological forces. As a result of urban development however,
man-made water retention has been utilized as a replacement for wetland areas to account for
storm water accumulation and runoff. These man-made systems include the retention ponds
and canals that are seen throughout developed areas. Traditionally, these structures have been
utilized for containment, transfer and storage of access water, and have failed as serving as
efficient nutrient and pollutant filters. They are often aesthetically unattractive, devoid of
biological diversity, and serve only a limited function as a rain water runoff containment source.
According to the Miami chapter of the Sierra Club, “The number one source of today's
water pollution stems from storm water which leads to combined sewer overflows and urban
runoff [and] as a result, water quality is lowered, threatening human health and endangering
the vitality of our ecosystems.” Many recent studies over the last several decades have
continued to provide evidence in the added value and efficiency gained from modifying these
retention areas into constructed wetlands to serve as buffers against pollution runoff and act as
nutrient sinks (Sim 2007). Nutrient sinks are storage areas in an ecosystem that contain the
organic matter and nutrients within that ecosystem. Seeping water from wetlands can recharge
ground water supplies. Unaltered wetlands in a floodplain can reduce flooding. The natural
water filtration and sediment control capabilities of wetlands help maintain surface and ground
water quality (EPA 1996). Wetland water quality can be impacted by many of the same sources
that affect other surface water resources, including fertilizer, pesticide, herbicide, and sediment
runoff. As a result of wetland depletion, nutrient sensitive habitats have become exposed to
ever increasing nutrient pollution including river and estuary ecosystems. As a result of
eutrophication, or excess nutrient loads that cause depletion in dissolved oxygen, this has
created an increasing interference to maintaining healthy aquatic habitats. By instituting best
management practices (BMPs), which would utilize appropriate planting and spacing
techniques in retention areas, we should be able to make a marketable reduction in our overall
nutrient deposition, facilitating decreased nutrient extremes and greater homeostasis for our
local ecology.
Methods
Collect and analyze pond data.
o Go to a local natural wetland area and observe the thriving plant and animal
species (Appendix A)
o Formulate a plan as to how to implement this on the University of Central Florida
campus. See Figure 1 for a map of the retention ponds at UCF.
Put together a Plant Database.
o Include Florida native plants that would be beneficial for future planting of the
UCF ponds.
o Include parameters of the plants, such as pH range, water use, and size the plant
will grow to.
Survey select retention ponds at UCF.
o Include plants from the Plant Database.
o Include where these plants will have the most beneficial impact for that specific
retention pond.
Take water samples of the surveyed retention ponds.

o Analysis will include water quality parameters such as nitrogen, phosphorus,
oxygen, copper, and lead.
o Also take measurements of pH, dissolved oxygen and conductivity (Table 1)
Create a plan of action for future Sustainability Water Systems group members.
Outcomes and Results
Baseline water measurements for campus retention ponds were collected and logged.
Samples were also collected and stored for future composition analysis of
orthophosphate, nitrate, nitrite, and chlorophyll. Points locations referenced in Figure 2.
UCF Water Quality Monitoring Data
Site ID
Collection
Date Time pH
Temp
(deg C)
Cond
(uS/cm)
DO
(mg/L)
Ambient
Conditions
Flow
Conditions
W5-N W5-N 12/2/2010 9:15 AM 6.83 13.7 195.8 7.39 SUNNY SLIGHT
4-R 4R-O 12/2/2010 9:45 AM 7.66 19.4 169.4 8.6 SUNNY VERY SLIGHT
W-9 W9-O 12/2/2010 10:23 AM 6.88 13.9 197.3 7.5 SUNNY MODERATE
2-H EXT 2H EX-BL 12/2/2010 10:38 AM 7.14 19.8 199 6.77 SUNNY SLIGHT
2-H 2H-O 12/2/2010 1:26 PM 7.2 19.9 236 7.45 SUNNY SLIGHT
LkClr LC-DK 12/2/2010 11:25 AM 7.27 20 150.8 8.34 SUNNY NA
1-D 1D-O 12/2/2010 11:34 AM 7.34 20.6 220 8.05 SUNNY NONE
3-A 3A-O 12/2/2010 11:49 AM 8.18 19.4 209 8.65 SUNNY NONE
LkLee LL 12/2/2010 12:00 PM 6.83 20.4 140.4 7.98 SUNNY NA
BCrk BC-I 12/2/2010 12:15 PM 6.81 19.4 154.3 6.35 SUNNY NONE
4-M 4M-O 12/2/2010 12:25 PM 7.58 19.9 195 7.74 SUNNY SLIGHT
4-L 4L-O 12/2/2010 12:30 PM 7.14 20.1 205 7.4 SUNNY SLIGHT
Table 1

An excel spreadsheet was compiled for use as a GIS database file which was compiled to
contribute to future and ongoing studies of campus natural land. It includes plant
species parameters such as pH range, watering demands, max. growth height,
suggested planting density, etc. (Attached File “Campus Plant Database”)
A hard copy field guide was compiled which describes the planting parameters for plant
species within our database. See “Wetland Plant Database”.
Current plant species composition at retention ponds 4-B were surveyed and logged
into GIS and digitized onto campus maps. These surveys, when completed for the
remaining campus, will provide a database of current species diversity. This will allow
for easier determination of future pond modification sites, as well as provide a baseline
for potential future campus plant species monitoring.
Planting locations were identified for pond 2-H and digitized into ArcGIS to serve as a
guide for project execution. Figure 3
We were able to successfully plant and execute modifying retention pond 2-H with 72
native Florida tree and shrub species.
Plants Used Scientific Name Common Name Quantity Price Total
Pinus palustris Longleaf Pine 10 $2.00 $20.00
Pinus elliottii Slash Pine 2 $1.75 $3.50
Gordonia lasianthus Loblolly Bay 6 $6.00 $36.00
Ilex cassine Dahoon holly 12 $5.50 $66.00
Persea palustris Swamp Bay 11 $6.00 $66.00
Baccharis halimifolia Salt Myrtle 3 $4.50 $13.50
Callicarpa americana American Beauty Berry 1 $4.50 $4.50
Rhus copallina Shining Sumac 4 $5.00 $20.00
Serenoa repens Saw Palmetto 3 $3.50 $10.50
Vaccinium corymbosum Highbush Blueberry 3 $10.00 $30.00
Vaccinium myrsinites Shiny Blueberry 2 $3.00 $6.00
Lyonia lucida Shiny Lyonia 2 $2.50 $5.00
Myrica pusilla Dwarf Wax Myrtle 2 $5.00 $10.00 Rhododendron serrulatum Swamp Azalea 12 $5.00 $60.00
Total 73
$351.00
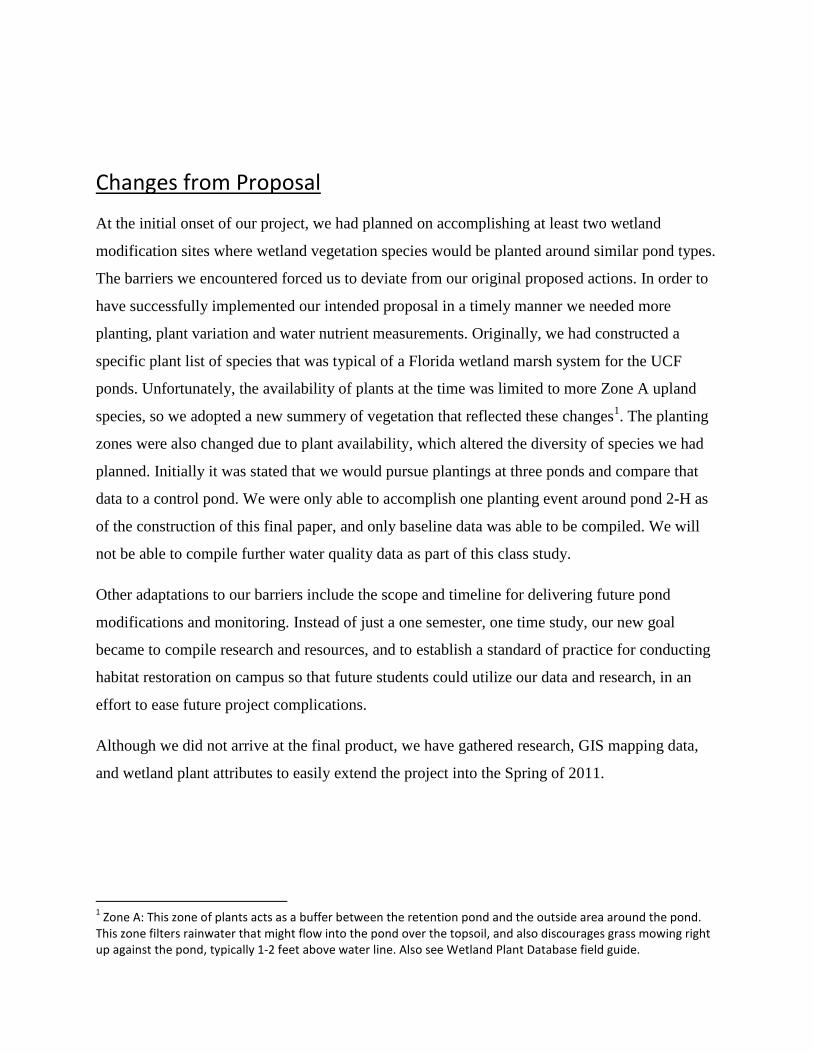
Changes from Proposal
At the initial onset of our project, we had planned on accomplishing at least two wetland
modification sites where wetland vegetation species would be planted around similar pond types.
The barriers we encountered forced us to deviate from our original proposed actions. In order to
have successfully implemented our intended proposal in a timely manner we needed more
planting, plant variation and water nutrient measurements. Originally, we had constructed a
specific plant list of species that was typical of a Florida wetland marsh system for the UCF
ponds. Unfortunately, the availability of plants at the time was limited to more Zone A upland
species, so we adopted a new summery of vegetation that reflected these changes1. The planting
zones were also changed due to plant availability, which altered the diversity of species we had
planned. Initially it was stated that we would pursue plantings at three ponds and compare that
data to a control pond. We were only able to accomplish one planting event around pond 2-H as
of the construction of this final paper, and only baseline data was able to be compiled. We will
not be able to compile further water quality data as part of this class study.
Other adaptations to our barriers include the scope and timeline for delivering future pond
modifications and monitoring. Instead of just a one semester, one time study, our new goal
became to compile research and resources, and to establish a standard of practice for conducting
habitat restoration on campus so that future students could utilize our data and research, in an
effort to ease future project complications.
Although we did not arrive at the final product, we have gathered research, GIS mapping data,
and wetland plant attributes to easily extend the project into the Spring of 2011.
1 Zone A: This zone of plants acts as a buffer between the retention pond and the outside area around the pond.
This zone filters rainwater that might flow into the pond over the topsoil, and also discourages grass mowing right up against the pond, typically 1-2 feet above water line. Also see Wetland Plant Database field guide.
Barriers Encountered and Solutions
We ran into a few barriers as we started to undertake the goals we set out in our proposal. Our
initial ideas were to have a few planting events that mainly focused around aquatic species. It
turned out that there were no aquatic plants available to us this semester, but there was a list of
upland plants that our group had for use. Our solution was to expand our scope to include aquatic
and shoreline buffer vegetation for a more comprehensive approach to the ecosystem restoration.
Other influential barriers we ran into were in our water quality sampling efforts. The equipment
available to us through UCF Landscape and Natural Resources (LNR) was not stored properly
and the calibration solutions necessary for the devices to give accurate readings were not
available to us. We also planned on a partnership with Orange County Environmental Protection
Division (EPD) to process some other water quality data. It was more difficult to accrue their
cooperation than expected. There were several individuals within the bureaucracy that we needed
approval from before we could get our samples processed. Our EPD contact also fell ill at a
crucial time, along with new EPA numeric nutrient analysis regulations that were going into
effect which posed a potential complication from regulatory and permit agencies. We were
finally able to come to an agreement with the EPD to process the necessary data from the ponds.
They were also able to supply us with test kits to find pH and dissolved oxygen to account for
the unusable water quality devices.
Suggestions for Project Improvement
The execution of restoring man made retention ponds into sustainable ecosystem relies
heavily on subsequent generations of students. By proposing the need for better water quality,
increased plant biomass, and an overall renewed understanding of sustainable habitats we create
a legacy for others to follow. Researching and discovering the source of natural wetland vitality
has allowed us to implement similar practices for the University of Central Florida’s retention
ponds. This, however, is only the beginning. Improvements would include: continued planting
for other UCF ponds; establishment of plant biomass for all wetland zones including aquatic

vegetation; and further data from the results of establishing these new ecosystems. By continuing
this project, nature not only benefits from the outcome but so does the public. It is intended that
people should find a new respect for their environment as they begin to see the progress and
change we can create. By improving scientific results and expanding planting zones, the final
product of pond renewal can be fulfilled.
Works Cited
Environmental Protection Agency. “Environmental Indicators of Water Quality in the United
States.” Office of Water. June 1996.
Gu, Binhe. “Phosphorous removal in small constructed wetlands dominated by submerged
aquatic vegetation in South Florida, USA.” The Journal of Plant Ecology. 1.1 (March 2008): 67-
74. Print.
Sim, Cheng Hua, Mohd Kamil Yusoff, Brian Shutes, Sinn Chye Ho, and Mashhor Mansor.
"Nutrient Removal in a Pilot and Full Scale Constructed Wetland, Putrajaya City,
Malaysia." Journal of Environmental Management 88 (2007): 307-17. Print.
The Sierra Club. "Stormwater Runoff." The Miami Group. 2004. Web. 26 Sept. 2010.
<http://ohio.sierraclub.org/miami/local/Stormwater.htm>.
Thomas Dreschel, Gu, and Binhe. "Wetlands: Effects of Plant Community and Phosphorous
Loading Rate On Constructed Wetland Performance In Florida, USA." The Society of Wetland
Scientists 28.1 (2008): 81-91. Print.

Figure 1.
UCF Retention Ponds

Figure 2

Figure 3
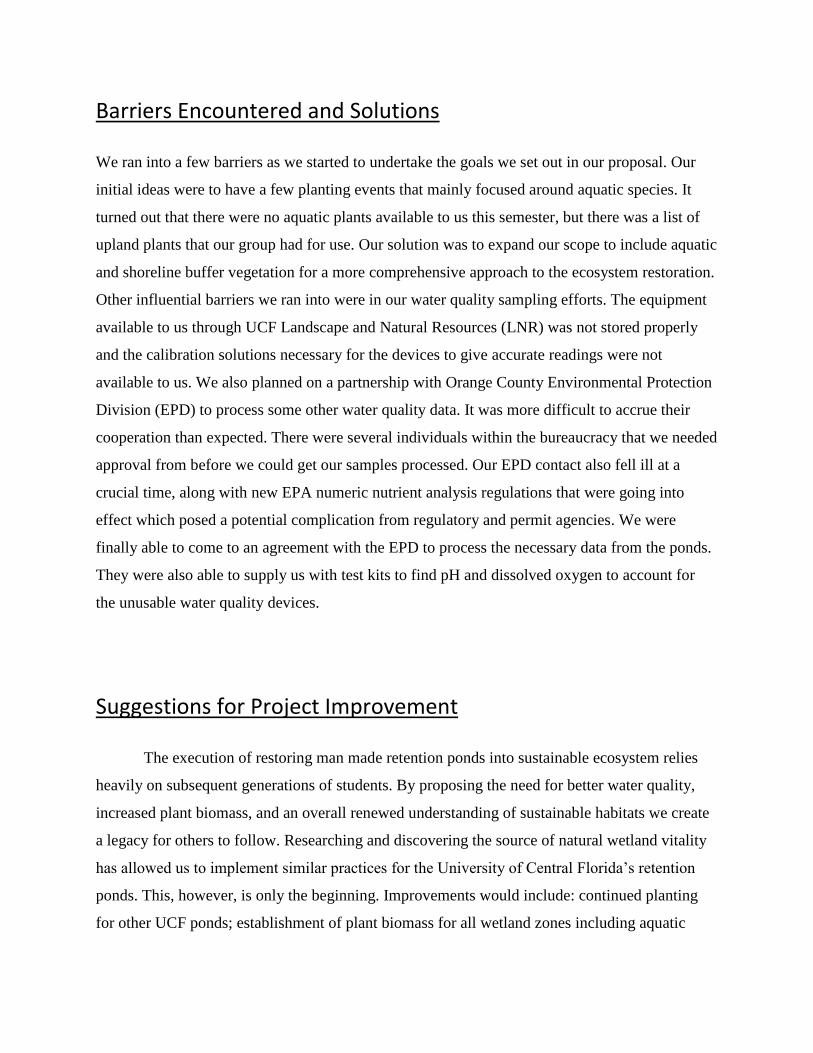
Appendix A
Entering UCF mitigation bank McKay Tract wetland.
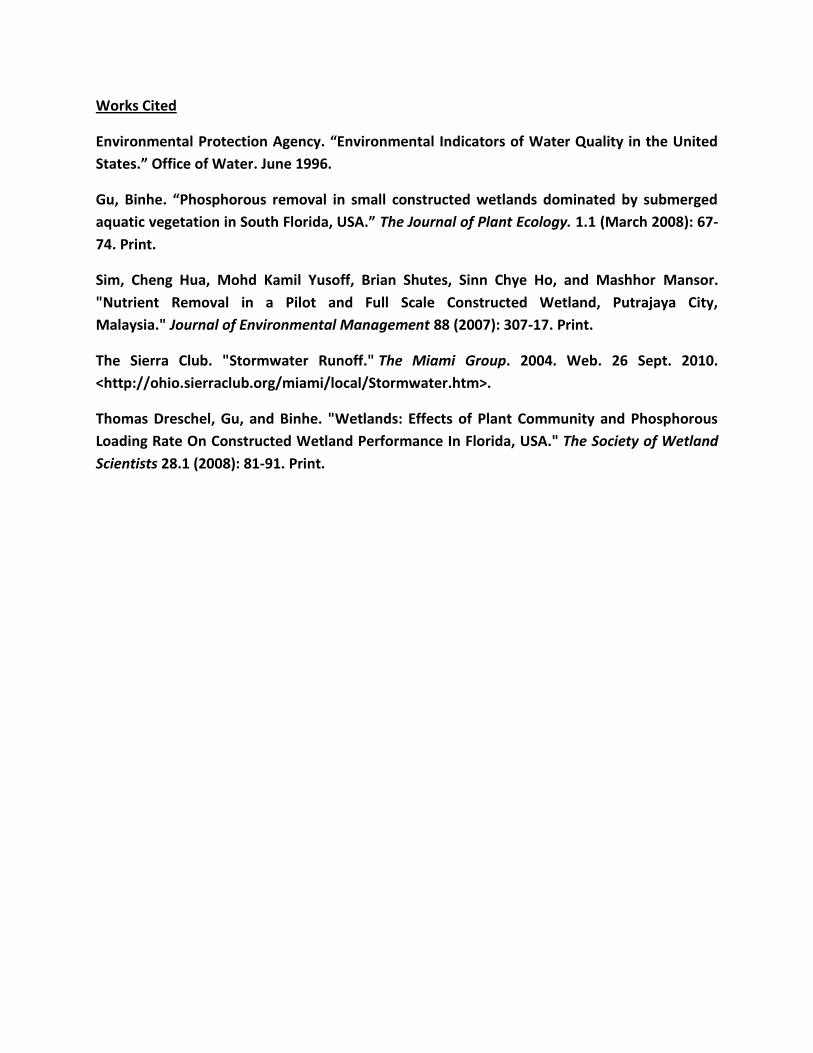
Maple canopy within the McKay Tract.
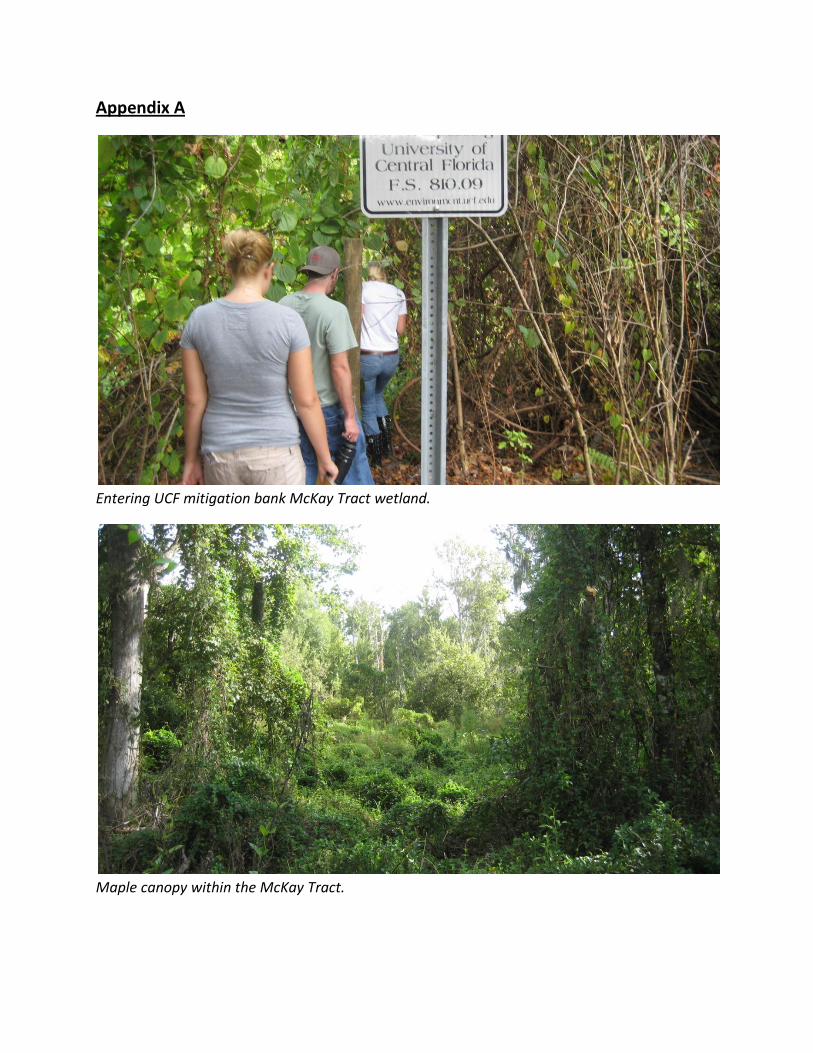
Typical hydrology of wetland systems requires high moisture saturation for prolonged periods.
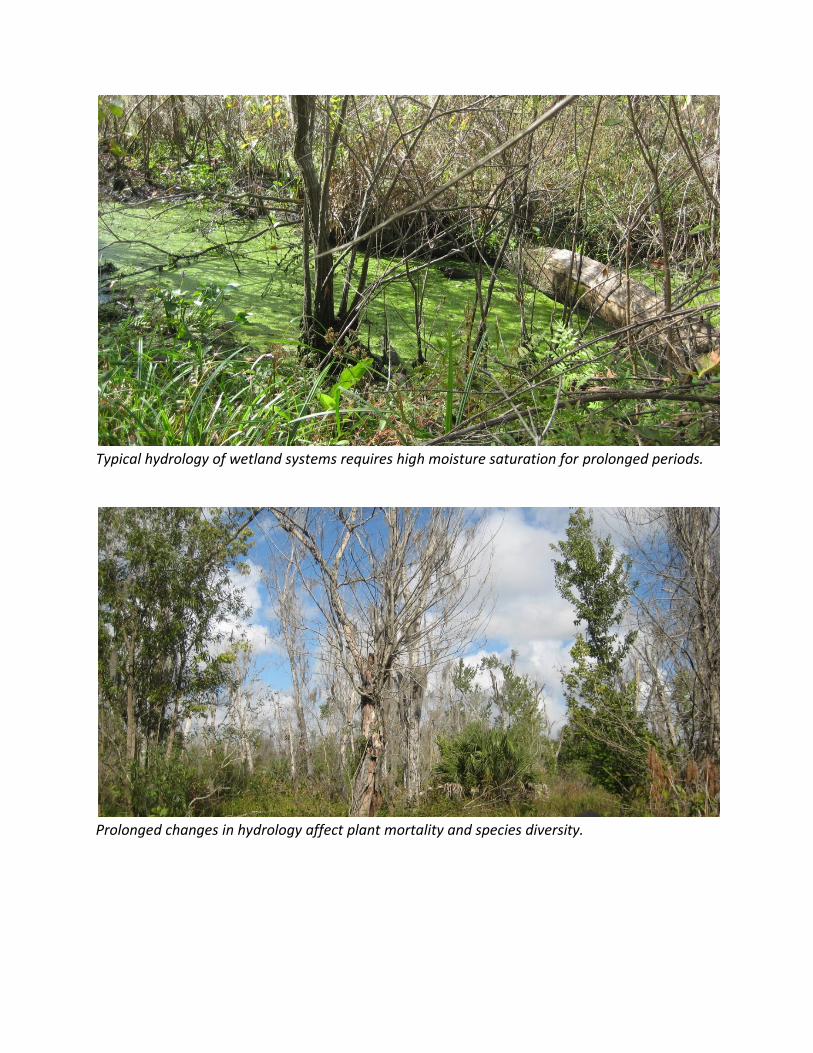
Prolonged changes in hydrology affect plant mortality and species diversity.
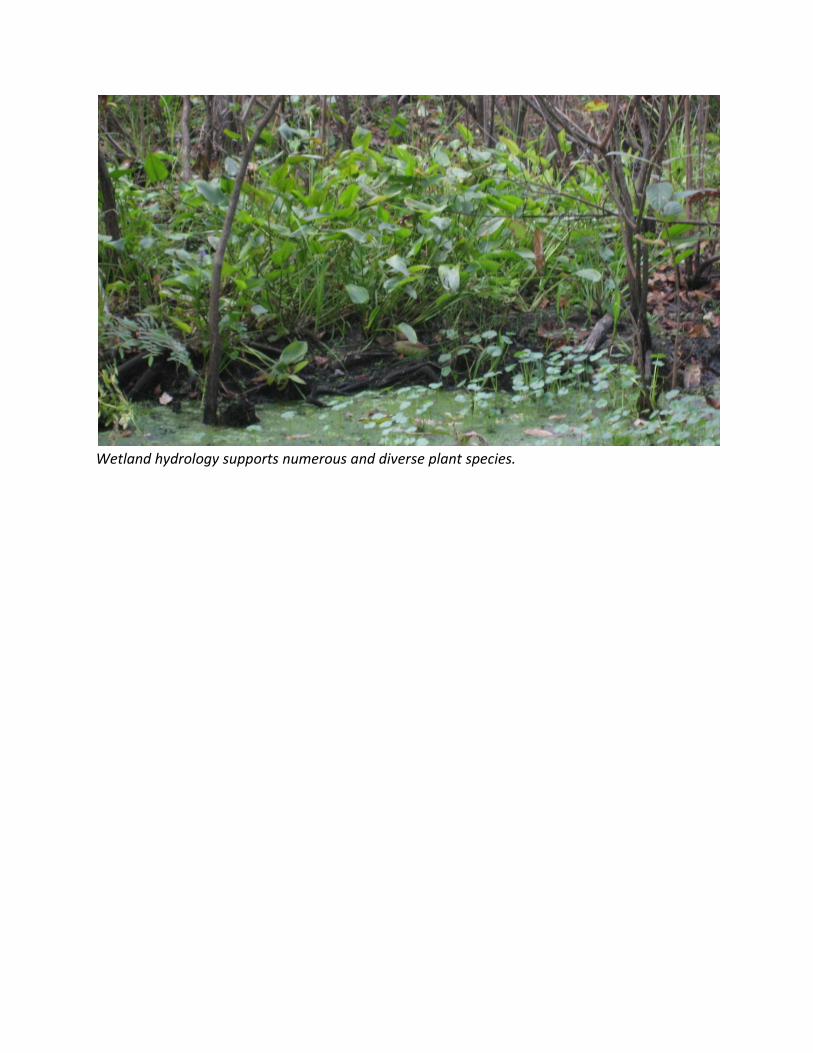
Wetland hydrology supports numerous and diverse plant species.
Top Related