


Languages
Pages
Legal


luci2 Urban Simulation Model
John R. OttensmannCenter for Urban Policy and the Environment
Indiana University-Purdue University Indianapolis

luci2 Urban Simulation Model
What the Model Does Simulates urban growth for Central
Indiana Forecasts employment change by ZIP code
for major industry groups Separately simulates residential and
employment-related development for mile-square grid cells
Allows users to create and compare scenarios reflecting policy choices and assumptions about future development
luci2 Urban Simulation Model
Central Indiana 2000 Percent Urban

luci2 Urban Simulation Model
Central Indiana Data Sources
LandSAT satellite images for 1985, 1993, and 2000 Land cover classification by Jeff
Wilson Employment by ZIP code for 1995,
2000 Indiana Department of Workforce
Development (ES-202) data

luci2 Urban Simulation Model
Estimation of Land Use Reclassification of classified land
cover data Developed set of classifiers based
on… Land cover in vicinity of each pixel Population and housing units from
census Road network

luci2 Urban Simulation Model
Predictive Equations in the Model (9)
Employment change for four industry groups by ZIP code
Probabilities of residential and employment-related development by grid cell
Densities of residential and employment-related development
Journey to work

luci2 Urban Simulation Model
Prediction of Development
Prediction of probability of conversion of land to residential and employment-related uses Based on random utility theory Estimated aggregated logit models Dependent variables logits of proportions of
land converted 1993-2000
Prediction of densities of development Estimated using 2000 data

luci2 Urban Simulation Model
Predictors of Probability of Residential Development
Accessibility to employment and employment change
Availability of water and sewer Distances to interstate interchanges and
other four-lane highways Proportion residential in 3x3
neighborhood and it square (logistic growth trend)
Logit proportion converted to residential in preceding period (persistence)
ISTEP scores for school districts

luci2 Urban Simulation Model
Accessibility to Employment

luci2 Urban Simulation Model
How luci2 Simulates Urban Development
Works in 5-year simulation periods Simulation driven by exogenous,
user-specified population growth for entire region
Predicts employment change by industry group for ZIP codes
Predicts employment-related and residential development

luci2 Urban Simulation Model
Prediction of Employment-Related Development
Predicts employment-related land use per employee by ZIP code
Predicts probability of conversion of land to employment-related uses by grid cell
Allocates employment-related development within each ZIP code to grid cells with highest probabilities

luci2 Urban Simulation Model
Prediction of Residential Development
Predicts probability of conversion of land to residential use
Predicts population density Adjusts probabilities to
accommodate specified population growth

luci2 Urban Simulation Model
Use of Scenarios in luci2 Purpose not to produce “best” forecast
but alternative scenarios Scenarios can reflect policy choices,
including restrictions on development on certain lands, utility expansion, densities, urban growth boundaries
Scenarios can reflect alternative assumptions about factors influencing development, including population growth and importance of accessibility to employment

luci2 Urban Simulation Model
The Current trends Scenario
luci2 starts with the Current trends scenario
Assumes population growth at the rate from 1990-2000
Uses all model parameters as estimated for the period prior to 2000
Assumes no changes to policies from recent period

luci2 Urban Simulation Model
luci2 Simulation Results Results provided for active and
comparison scenarios Maps show land urban and change and
generalized land uses Tables provide summary results for
region for land use and population Tables provide urban land and
employment and their change by county

luci2 Urban Simulation Model
Enhanced User Capabilities
Automatic output of more detailed simulation results Capability to add user scenarios
Restrictions on development in specified areas Restrictions on development Minimum or maximum densities Areas to be provided with utility service New transportation alternatives

luci2 Urban Simulation Model
luci2 as a General-Purpose Urban Simulation Model
Models can be implemented for different areas…
With different datasets… Using regular or irregular simulation
zones (including TAZs)… Using distances or travel times… For models of varying complexity Could implement LUCI and LUCI/T in
luci2

luci2 Urban Simulation Model
LUCI/T Model Developed for Central Indiana
Suburban Transportation & Mobility Study
Starting point original LUCI model 9-county area surrounding
Indianapolis Uses travel times from travel demand
model to calculate accessibility
luci2 Urban Simulation Model
Comparison of Baseline and Maximum Change Alternatives
Simulations to 2025, 2040 Baseline: existing and planned
transportation improvements Maximum change: 360º
circumferential limited-access highway in outer part of area (outer belt)
Use of LUCI/T forecast development for 2025 travel demand model

luci2 Urban Simulation Model
Differences between Baseline and Maximum Change Traffic Forecasts

luci2 Urban Simulation Model
LUCI/T Baseline and Maximum Change Forecast of Urban Change to 2025
Baseline (Minimum Change) Maximum Change

luci2 Urban Simulation Model
LUCI/T Differences between Baseline and Maximum Change Forecasts
Urban 2025 Baseline0 - 0.10.1 - 0.30.3 - 0.50.5 - 0.70.7 - 1
Difference Baseline and Maximum-0.005 - -0.004-0.004 - -0.002-0.002 - 0.0020.002 - 0.0040.004 - 0.009

luci2 Urban Simulation Model
Possible Reasons for Small Differences In general, the periphery of significant
urban development does not extend out to outer belt by 2025 (or 2040)
Households will find locations at urban periphery more accessible to employment than locations near outer belt
Major effect on travel times is to reduce times between locations near outer belt, but those have limited employment

luci2 Urban Simulation Model
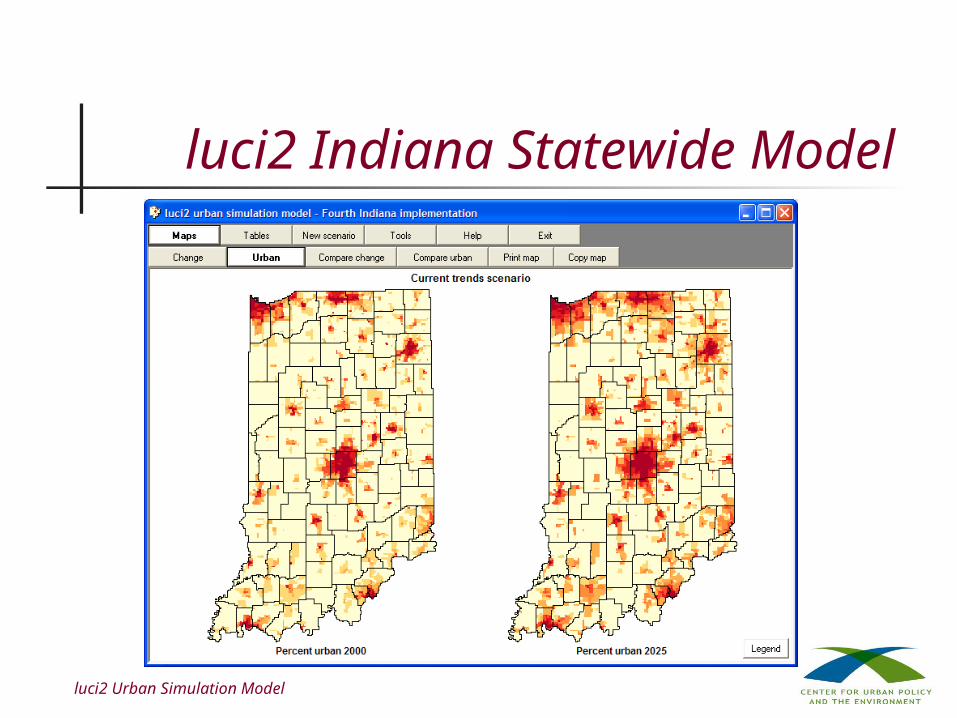
luci2 Indiana Statewide Model
Simulates residential and employment-related development for 4,579 TAZs in INDOT travel demand model
Simulates local-service employment growth for TAZs
Uses travel times from travel demand model

luci2 Urban Simulation Model
Integration of luci2 with INDOT Travel Demand Model
Simulation starts with 2000 travel times from the travel demand model
Simulates employment growth and urban development for 2005
Results used by travel demand model to simulate 2005 travel, travel times
New travel times used by luci2 to simulate growth and development for 2010
Process continues to 2030
luci2 Urban Simulation Model
luci2 Indiana Statewide Model
Top Related