


Languages
Pages
Legal


Local Government Finance Formula Grant Distribution Consultation paper
www.communities.gov.uk community, opportunity, prosperity


Local Government Finance Formula Grant Distribution Consultation paper
July 2010 Department for Communities and Local Government

Department for Communities and Local Government Eland House Bressenden Place London SW1E 5DU Telephone: 030 3444 0000 Website: www.communities.gov.uk © Crown Copyright, 2010 Copyright in the typographical arrangement rests with the Crown.
This publication, excluding logos, may be reproduced free of charge in any format or medium for research, private study or for internal circulation within an organisation. This is subject to it being reproduced accurately and not used in a misleading context. The material must be acknowledged as Crown copyright and the title of the publication specified.
Any other use of the contents of this publication would require a copyright licence. Please apply for a Click-Use Licence for core material at www.opsi.gov.uk/click-use/system/online/pLogin.asp, or by writing to the Office of Public Sector Information, Information Policy Team, Kew, Richmond, Surrey TW9 4DU
e-mail: [email protected] If you require this publication in an alternative format please email [email protected] Communities and Local Government Publications Tel: 030 0123 1124 Fax: 030 0123 1125 Email: [email protected] Online via the Communities and Local Government website: www.communities.gov.uk July 2010 ISBN: 978 1 4098 2508 1

1
Contents 1 Introduction ....................................................................................................3 Section 1 - Context 2 The Basis of Exemplifications ......................................................................6 Section 2 – Relative Needs Formula Changes 3 Adult Social Services...................................................................................34 4 Police ............................................................................................................50 5 Fire & Rescue ...............................................................................................96 6 Highways Maintenance..............................................................................128 7 Environmental, Protective and Cultural Services ...................................144 8 Area Cost Adjustment................................................................................176 Section 3 – Grant Formula Changes 9 Taking Account of Relative Needs and Resources.................................191 10 The Scaling Factor for the Central Allocation Block...............................192 11 Floor Damping Levels................................................................................208 12 Transfers and Adjustments.......................................................................213 Section 4 – Data 13 The Incapacity Benefit and Severe Disablement Allowance
Indicator ......................................................................................................335 14 Replacing the Children’s Income Support Indicator...............................351 15 Student Exemptions and the Council Tax Base ......................................371 15 Updating data on low achieving ethnic groups.......................................385
2
Section 5 – Helpful Information 17 Shares of Taxbase used in Exemplifications ..........................................401 18 List of Questions........................................................................................402 19 The Consultation Criteria ..........................................................................405

3
Chapter 1
Introduction Coverage
1. This consultation covers all local authorities in England that receive formula grant (Revenue Support Grant, redistributed National Non Domestic Rates and, where appropriate, Police Grant). Police authorities in both England and Wales who receive grant via this system are also covered. Background 2. Approximately 25% of public spending in England takes the form of spending by local authorities on services they provide. Most of this money is distributed as grant from central government, with the balance being raised locally via council tax. The Formula Grant Distribution System is concerned with the distribution of a large part of this grant from central government to local authorities, known as Formula Grant. 3. The Formula Grant Distribution System was last reviewed before the 2008-09 local government finance settlement. This paper provides the basis for a full consultation on options for grant distribution changes that could be introduced from the 2011-12 settlement onwards. 4. The system divides up the finite pot of available grant (which is determined in the spending reviews) between all local authorities in England. The system considers local authorities' individual circumstances, their needs and their potential to raise resources locally, relative to all other councils which provide the same services, by reference to a number of mathematical formulae. The Relative Needs Formulae take account of an authority’s relative need by considering a number of factors which appear to explain variations in the cost of providing services. 5. The system also takes account of the fact that areas that can raise more income locally require less support from Government to provide services, and looks at authorities’ potential to raise resources through council tax relative to other councils. 6. To ensure stability in the financing of local services, Government then sets a “floor” or lower limit to any authority’s change in their Formula Grant allocation year-on-year. 7. The Government has been clear the Spending Review will require tough decisions at both national and local levels and the proposals in this document do not prejudge the outcome of the Spending Review or other possible options.

4
History of technical work 8. The Settlement Working Group considers how the formula grant system might be changed. The Settlement Working Group consists of representatives from all types of local authority in England along with interested parties from central Government. 9. A separate technical group examines questions of grant distribution for Police Authorities in England and Wales. 10. Papers and minutes from the Settlement Working Group are available on the website for Communities and Local Government: (http://www.local.communities.gov.uk/finance/1112/grant.htm). Aims 11. This review is mainly looking to update and fine tune the existing system. Options 12. This consultation document contains options for a number of the components of the grant distribution system. These include some of the relative needs formulae, the balance of weight given to relative needs or resource, and possible improvements to the data used in the formulae. 13. There are sections containing options on each of these issues, together (where appropriate) with illustrations of how each option would affect individual authorities. The Government believes that the options in this paper could be used to update the Formula Grant Distribution System. For example, the options here may be further refined following consultation or respondents may propose new options. The components of the new system may not necessarily be drawn from the list contained here. How to respond 14. The Government would like your views on which of the options presented here should go to updating and modifying the grant distribution system. We would also welcome any alternative proposals. Specific questions are posed at the end of each chapter. 15. We particularly welcome responses submitted electronically. Please send responses by e-mail to [email protected].

5
16. If you are not able to respond by e-mail, please send your response to:
Andrew Lock Formula Grant Review Team Communities and Local Government Zone 5/J2 Eland House Bressenden Place London SW1E 5DU
17. Alternatively, they may be faxed to 0303 4443294. 18. Responses should reach us by 5pm on 6th October 2010. Confidentiality 19. All information in responses, including personal information, may be subject to publication or disclosure under freedom of information legislation. If a correspondent requests confidentiality, this cannot be guaranteed and will only be possible if considered appropriate under the legislation. Any such request should explain why confidentiality is necessary. Any automatic confidentiality disclaimer generated by your IT system will not be considered as such a request unless you specifically include a request, with an explanation, in the main text of your response. Queries 20. If you have any questions about this publication, please e-mail [email protected], ensuring that your message is headed ‘Query’. Summary of Responses A summary of responses to this consultation will be published by 31st December 2010 at the following address http://www.local.communities.gov.uk

6
Section 1: Context Chapter 2 The basis of exemplifications Construction of exemplifications 1. Normally we would show the approximate effects of the various options on authorities by exemplifying the effect if that option had been implemented in the most recent year’s settlement. In the case of the current consultation, that would normally be the 2010-11 Settlement. However the actual settlement for 2010-11 was calculated in a particular way to take account of the fact that local government restructuring took place mid way through a three year settlement.
2. The provisional 2010-11 Settlement that was issued at the time of the 2008-09 Settlement had to be calculated on the basis of those authorities that existed as at 1 April 2008. In order to ensure that authorities not directly affected by reorganisation did not experience a change to their provisional 2009-10 and 2010-11 Settlements, the previous Government ensured that the sum of grants for reorganised areas remained unchanged following reorganisation. This means that underlying calculations for the 2010-11 Settlement were not done on the basis of those authorities in existence at 1 April 2010.
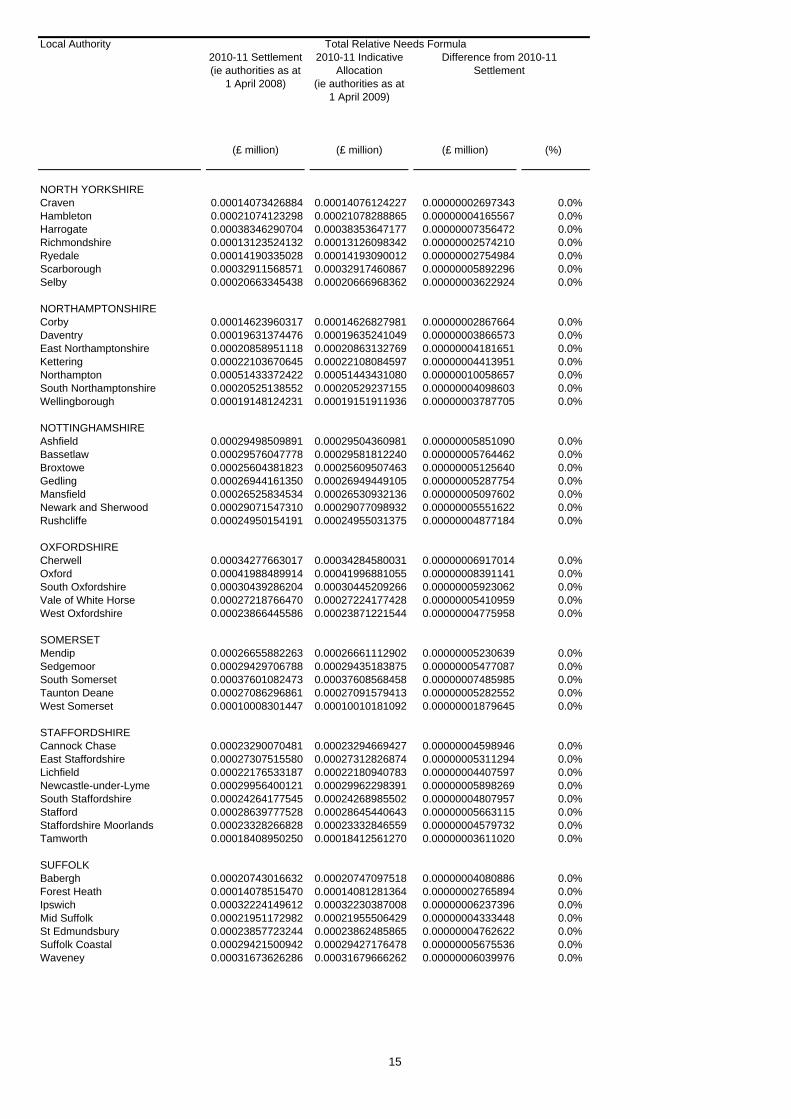
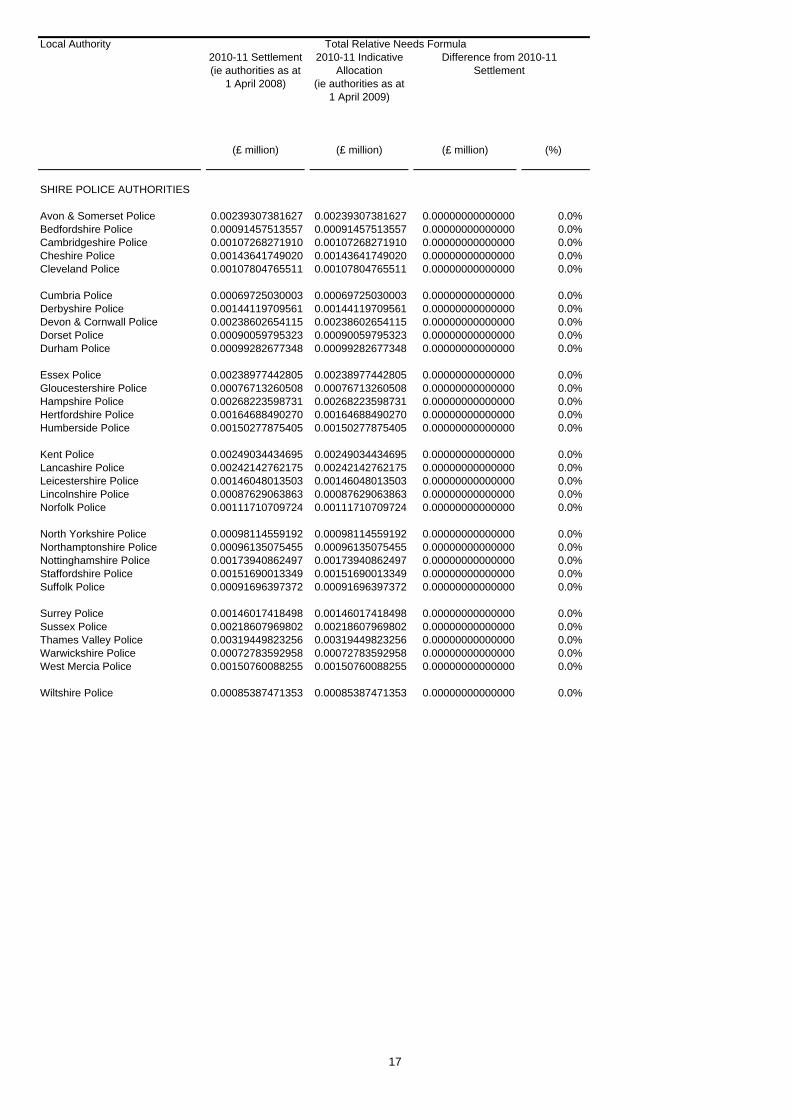
3. We will therefore provide a proper basis for comparisons of options by calculating 2010-11 Indicative Allocations as the basis for this Consultation Paper. These allocations are shown, in comparison with the actual settlement for 2010-11, in the exemplification at the end of this chapter.
4. The coefficients shown in the current formula sections in each chapter are those relating to the 2010-11 Indicative Allocations. These are likely to differ from the 2010-11 Settlements coefficients for those services which are provided by authorities affected by the reorganisation.
5. The exemplifications shown in this document are constructed by re-running the 2010-11 Indicative Allocations as though the particular option in question had been in place for that year.
6. We have frozen the amount of CLG formula grant distributed through each of the Relative Needs Amount, the Relative Resource Amount and the Central Allocation, unless otherwise stated. We have adjusted the shares of taxbase used in each of the exemplifications. The shares of taxbase that we have used for each option are given in the table in Chapter 17.
7. Other elements of the 2010-11 Indicative Allocations - such as the data used in the formula, and (in the case of the relative needs formulae) the Area

7
Cost Adjustment - are unchanged from the data used in the 2010-11 Settlement, except where stated.
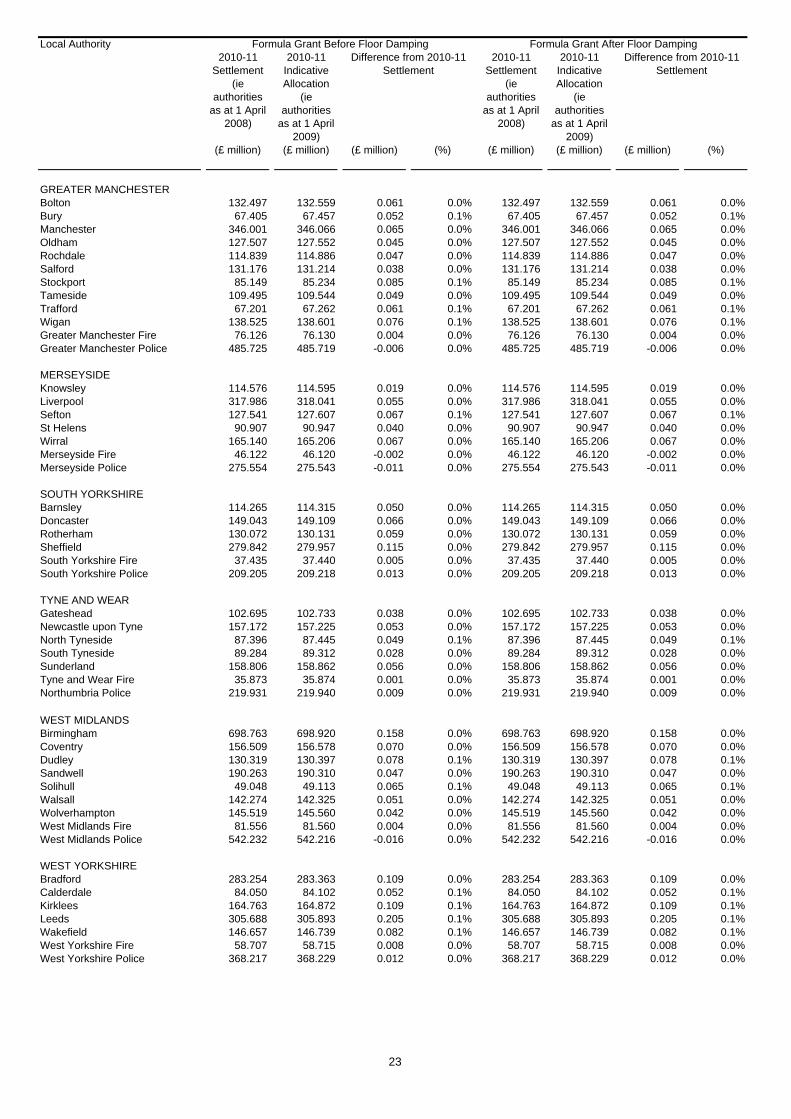
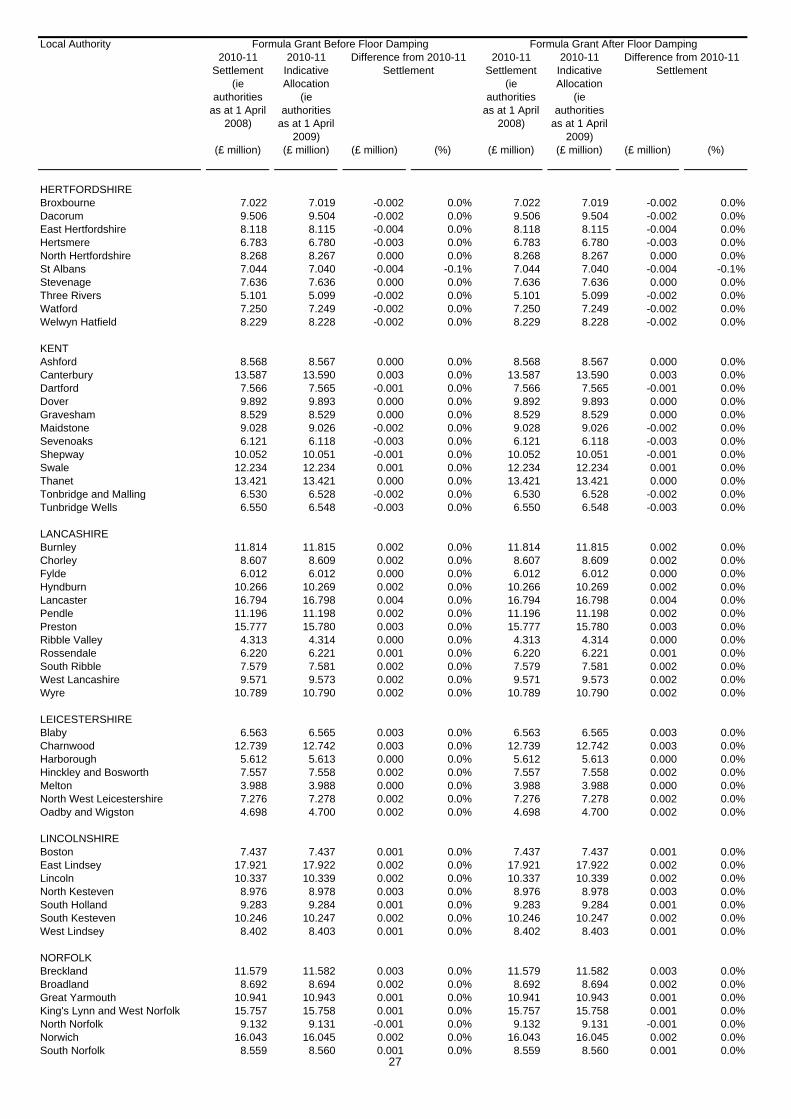
8. The outcome of each option is normally expressed in terms of change from the 2010-11 Indicative Allocations in £ million and percentage of total formula grant, before floors damping. Total grant is used so that the figures are comparable from one service to another. The figures for both amounts and percentages have been rounded to one decimal place.
Limitations of exemplifications 9. The grant system has always been designed to distribute one overall pot of funding to a range of authorities that offer different combinations of services. It has never been designed to deliver exactly any particular marginal change in funding or distribution. To operate the system, a rule is needed on how to apportion shares of council tax base between groups of authorities. Since 2003-04, we have set the shares of taxbase so that the change in grant is broadly proportional to the change in formula shares (now RNFs) for each floor damping group. This methodology means that there will inevitably be some small amount of leakage between the authority groups.
10. In addition, since we have frozen the 4-block splits, every time we change the distribution of the RNFs we have to alter the shares of taxbase to ensure that we reach the same total formula grant for each damping group (where appropriate). This means that the amount of formula grant going to each authority will also change slightly under each of the options.
11. Constructing exemplifications by re-running the 2010-11 Indicative Allocations in the way described above gives the best possible illustration of the effects of each option at the present time. However, the detailed effects of options in the context of the 2011-12 settlement would be different. This is partly because, when several changes are put together into the system, the overall change is not the same as the sum of the individual changes. It is also because the Spending Review will have produced new totals for the various formula blocks and grant; we will also be using updated data.

Basis of Exemplifications
Local Authority2010-11 Settlement(ie authorities as at
1 April 2008)
2010-11 Indicative Allocation
(ie authorities as at 1 April 2009)
(£ million) (£ million) (£ million) (%)
England 0.78435536851185 0.78417767564177 -0.00017769287008 0.0%
London area 0.14480544157377 0.14481298022166 0.00000753864789 0.0%Metropolitan areas 0.18829532326164 0.18830349488900 0.00000817162736 0.0%Shire areas 0.45125460367644 0.45106120053110 -0.00019340314534 0.0%Isles of Scilly
Inner London boroughs incl. City 0.05395508456218 0.05395890540694 0.00000382084477 0.0%Outer London boroughs 0.06517545647013 0.06517917427325 0.00000371780313 0.0%London boroughs 0.11913054103230 0.11913807968020 0.00000753864789 0.0%GLA - all functions 0.02567490054147 0.02567490054147 0.00000000000000 0.0%
Metropolitan districts 0.15789443425103 0.15790260587839 0.00000817162736 0.0%Metropolitan fire authorities 0.00761392515207 0.00761392515207 0.00000000000000 0.0%Metropolitan police authorities 0.02278696385854 0.02278696385854 0.00000000000000 0.0%
Shire unitaries with fire 0.00208736756364 0.01367575429984 0.01158838673620 555.2%Shire unitaries without fire 0.10716326204272 0.13471307920196 0.02754981715923 25.7%Shire counties with fire 0.08638696904096 0.07693359966257 -0.00945336937840 -10.9%Shire counties without fire 0.13598123353022 0.11414679848891 -0.02183443504131 -16.1%Shire districts 0.05976270421239 0.05171890159133 -0.00804380262106 -13.5%Combined fire authorities 0.01316008257013 0.01316008257013 0.00000000000000 0.0%Shire police authorities 0.04671298471638 0.04671298471638 0.00000000000000 0.0%
GO REGIONAL SUMMARY
South West GOR 0.07228106297706 0.07222281088615 -0.00005825209092 -0.1%South East GOR 0.10968864328736 0.10968129026246 -0.00000735302489 0.0%London GOR 0.14480544157377 0.14481298022166 0.00000753864789 0.0%Eastern GOR 0.07849631858727 0.07849262449528 -0.00000369409199 0.0%East Midlands GOR 0.06248322196727 0.06248209480163 -0.00000112716563 0.0%West Midlands GOR 0.08443899507754 0.08441578523374 -0.00002320984380 0.0%Yorkshire and Humber GOR 0.07911431859682 0.07911737015153 0.00000305155471 0.0%North East GOR 0.04186133556666 0.04178711995509 -0.00007421561156 -0.2%North West GOR 0.11118603087811 0.11116559963422 -0.00002043124390 0.0%
FLOOR DAMPING GROUPS
Education Authorities 0.60864380746088 0.61650991721186 0.00786610975098 1.3%Police Authorities 0.08908280817351 0.08908280817351 0.00000000000000 0.0%Fire Authorities 0.02686604866508 0.02686604866508 0.00000000000000 0.0%Shire Districts 0.05976270421239 0.05171890159133 -0.00804380262106 -13.5%
Total Relative Needs FormulaDifference from 2010-11
Settlement
8

Local Authority2010-11 Settlement(ie authorities as at
1 April 2008)
2010-11 Indicative Allocation
(ie authorities as at 1 April 2009)
(£ million) (£ million) (£ million) (%)
Total Relative Needs FormulaDifference from 2010-11
Settlement
GREATER LONDON
City of London 0.00120852013233 0.00120858477616 0.00000006464383 0.0%
Camden 0.00452884805648 0.00452919374004 0.00000034568356 0.0%Greenwich 0.00422843592162 0.00422869159970 0.00000025567807 0.0%Hackney 0.00463630252877 0.00463661296526 0.00000031043648 0.0%Hammersmith and Fulham 0.00304677712336 0.00304699963068 0.00000022250732 0.0%Islington 0.00376770734884 0.00376798454665 0.00000027719781 0.0%Kensington and Chelsea 0.00339580559853 0.00339605977909 0.00000025418056 0.0%
Lambeth 0.00493668796329 0.00493702081893 0.00000033285564 0.0%Lewisham 0.00446338065991 0.00446365455709 0.00000027389719 0.0%Southwark 0.00516194092050 0.00516230706714 0.00000036614664 0.0%Tower Hamlets 0.00514609053758 0.00514650442173 0.00000041388415 0.0%Wandsworth 0.00408090003400 0.00408117159072 0.00000027155672 0.0%Westminster 0.00535368773697 0.00535411991377 0.00000043217679 0.0%
Barking and Dagenham 0.00269259197006 0.00269275448149 0.00000016251143 0.0%Barnet 0.00419897739778 0.00419920323328 0.00000022583549 0.0%Bexley 0.00262210210933 0.00262223551233 0.00000013340299 0.0%Brent 0.00429420711726 0.00429447008785 0.00000026297059 0.0%Bromley 0.00330705722956 0.00330721762390 0.00000016039434 0.0%
Croydon 0.00436835526584 0.00436860471971 0.00000024945387 0.0%Ealing 0.00429439386524 0.00429465555346 0.00000026168822 0.0%Enfield 0.00411327343967 0.00411351441273 0.00000024097306 0.0%Haringey 0.00386724104973 0.00386749286157 0.00000025181184 0.0%Harrow 0.00274680234471 0.00274694366893 0.00000014132423 0.0%
Havering 0.00255516590500 0.00255529747471 0.00000013156971 0.0%Hillingdon 0.00321142256312 0.00321159717187 0.00000017460875 0.0%Hounslow 0.00290907376355 0.00290924750383 0.00000017374028 0.0%Kingston upon Thames 0.00169555021621 0.00169563795522 0.00000008773902 0.0%Merton 0.00241087292196 0.00241100935152 0.00000013642956 0.0%
Newham 0.00506305098021 0.00506338031775 0.00000032933753 0.0%Redbridge 0.00337681016242 0.00337698951098 0.00000017934856 0.0%Richmond upon Thames 0.00187421797965 0.00187431739120 0.00000009941155 0.0%Sutton 0.00215327538808 0.00215338226507 0.00000010687700 0.0%Waltham Forest 0.00342101480076 0.00342122317586 0.00000020837511 0.0%
GLA - all functions 0.02567490054147 0.02567490054147 0.00000000000000 0.0%
GLA - police 0.01958285959859 0.01958285959859 0.00000000000000 0.0%GLA - fire 0.00609204094287 0.00609204094287 0.00000000000000 0.0%
9

Local Authority2010-11 Settlement(ie authorities as at
1 April 2008)
2010-11 Indicative Allocation
(ie authorities as at 1 April 2009)
(£ million) (£ million) (£ million) (%)
Total Relative Needs FormulaDifference from 2010-11
Settlement
GREATER MANCHESTERBolton 0.00366542366558 0.00366560769073 0.00000018402515 0.0%Bury 0.00221025554775 0.00221036033370 0.00000010478596 0.0%Manchester 0.00802398408953 0.00802449006778 0.00000050597825 0.0%Oldham 0.00318114521237 0.00318130361098 0.00000015839861 0.0%Rochdale 0.00296391982058 0.00296407684359 0.00000015702301 0.0%Salford 0.00336470397726 0.00336488454557 0.00000018056831 0.0%Stockport 0.00323856060705 0.00323870847812 0.00000014787108 0.0%Tameside 0.00298267115066 0.00298281563329 0.00000014448262 0.0%Trafford 0.00258172171733 0.00258184072357 0.00000011900624 0.0%Wigan 0.00400932759881 0.00400951381017 0.00000018621136 0.0%Greater Manchester Fire 0.00175224071223 0.00175224071223 0.00000000000000 0.0%Greater Manchester Police 0.00526090434056 0.00526090434056 0.00000000000000 0.0%
MERSEYSIDEKnowsley 0.00261223903984 0.00261239655953 0.00000015751969 0.0%Liverpool 0.00756694186962 0.00756742143596 0.00000047956635 0.0%Sefton 0.00376622965315 0.00376641652777 0.00000018687462 0.0%St Helens 0.00249648251464 0.00249660874955 0.00000012623491 0.0%Wirral 0.00455005271328 0.00455028460194 0.00000023188867 0.0%Merseyside Fire 0.00101819106449 0.00101819106449 0.00000000000000 0.0%Merseyside Police 0.00295511444715 0.00295511444715 0.00000000000000 0.0%
SOUTH YORKSHIREBarnsley 0.00315851370034 0.00315866359569 0.00000014989534 0.0%Doncaster 0.00397085944866 0.00397103755950 0.00000017811084 0.0%Rotherham 0.00347091699292 0.00347108100202 0.00000016400911 0.0%Sheffield 0.00728498182432 0.00728534427611 0.00000036245178 0.0%South Yorkshire Fire 0.00084967579475 0.00084967579475 0.00000000000000 0.0%South Yorkshire Police 0.00230432656978 0.00230432656978 0.00000000000000 0.0%
TYNE AND WEARGateshead 0.00276741323913 0.00276755413620 0.00000014089707 0.0%Newcastle upon Tyne 0.00392157009354 0.00392180075948 0.00000023066595 0.0%North Tyneside 0.00259534103991 0.00259546769490 0.00000012665499 0.0%South Tyneside 0.00224932998187 0.00224945349941 0.00000012351754 0.0%Sunderland 0.00401847755360 0.00401868990230 0.00000021234871 0.0%Tyne and Wear Fire 0.00078570285536 0.00078570285536 0.00000000000000 0.0%Northumbria Police 0.00246042295929 0.00246042295929 0.00000000000000 0.0%
WEST MIDLANDSBirmingham 0.01660535133305 0.01660627972480 0.00000092839176 0.0%Coventry 0.00416214009904 0.00416235914741 0.00000021904836 0.0%Dudley 0.00391027406226 0.00391045399215 0.00000017992988 0.0%Sandwell 0.00462210055409 0.00462234054586 0.00000023999177 0.0%Solihull 0.00229805110388 0.00229814900784 0.00000009790396 0.0%Walsall 0.00370291833511 0.00370310178304 0.00000018344792 0.0%Wolverhampton 0.00362683640541 0.00362702312214 0.00000018671673 0.0%West Midlands Fire 0.00182495424050 0.00182495424050 0.00000000000000 0.0%West Midlands Police 0.00575349306780 0.00575349306780 0.00000000000000 0.0%
WEST YORKSHIREBradford 0.00721265053619 0.00721302346641 0.00000037293022 0.0%Calderdale 0.00258207686876 0.00258219535202 0.00000011848326 0.0%Kirklees 0.00502095387723 0.00502117637226 0.00000022249503 0.0%Leeds 0.00927822707356 0.00927869620408 0.00000046913051 0.0%Wakefield 0.00422179095075 0.00422198512256 0.00000019417181 0.0%West Yorkshire Fire 0.00138316048474 0.00138316048474 0.00000000000000 0.0%West Yorkshire Police 0.00405270247396 0.00405270247396 0.00000000000000 0.0%
10
Local Authority2010-11 Settlement(ie authorities as at
1 April 2008)
2010-11 Indicative Allocation
(ie authorities as at 1 April 2009)
(£ million) (£ million) (£ million) (%)
Total Relative Needs FormulaDifference from 2010-11
Settlement
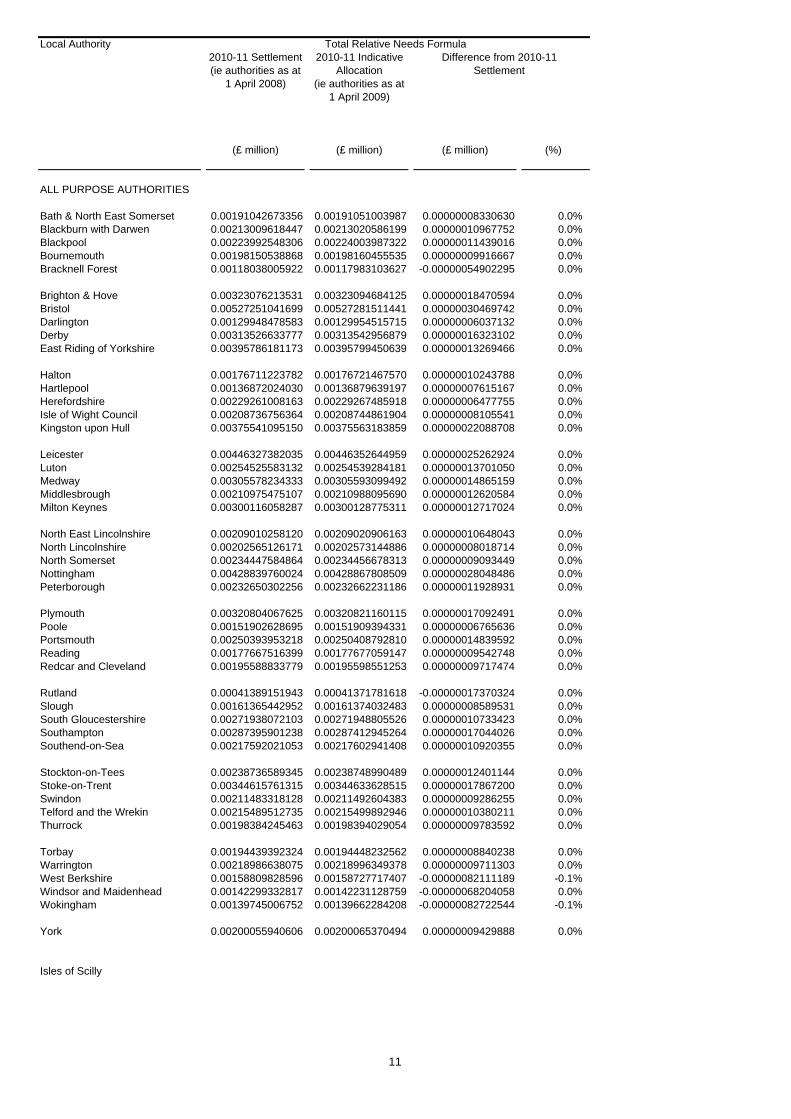
ALL PURPOSE AUTHORITIES
Bath & North East Somerset 0.00191042673356 0.00191051003987 0.00000008330630 0.0%Blackburn with Darwen 0.00213009618447 0.00213020586199 0.00000010967752 0.0%Blackpool 0.00223992548306 0.00224003987322 0.00000011439016 0.0%Bournemouth 0.00198150538868 0.00198160455535 0.00000009916667 0.0%Bracknell Forest 0.00118038005922 0.00117983103627 -0.00000054902295 0.0%
Brighton & Hove 0.00323076213531 0.00323094684125 0.00000018470594 0.0%Bristol 0.00527251041699 0.00527281511441 0.00000030469742 0.0%Darlington 0.00129948478583 0.00129954515715 0.00000006037132 0.0%Derby 0.00313526633777 0.00313542956879 0.00000016323102 0.0%East Riding of Yorkshire 0.00395786181173 0.00395799450639 0.00000013269466 0.0%
Halton 0.00176711223782 0.00176721467570 0.00000010243788 0.0%Hartlepool 0.00136872024030 0.00136879639197 0.00000007615167 0.0%Herefordshire 0.00229261008163 0.00229267485918 0.00000006477755 0.0%Isle of Wight Council 0.00208736756364 0.00208744861904 0.00000008105541 0.0%Kingston upon Hull 0.00375541095150 0.00375563183859 0.00000022088708 0.0%
Leicester 0.00446327382035 0.00446352644959 0.00000025262924 0.0%Luton 0.00254525583132 0.00254539284181 0.00000013701050 0.0%Medway 0.00305578234333 0.00305593099492 0.00000014865159 0.0%Middlesbrough 0.00210975475107 0.00210988095690 0.00000012620584 0.0%Milton Keynes 0.00300116058287 0.00300128775311 0.00000012717024 0.0%
North East Lincolnshire 0.00209010258120 0.00209020906163 0.00000010648043 0.0%North Lincolnshire 0.00202565126171 0.00202573144886 0.00000008018714 0.0%North Somerset 0.00234447584864 0.00234456678313 0.00000009093449 0.0%Nottingham 0.00428839760024 0.00428867808509 0.00000028048486 0.0%Peterborough 0.00232650302256 0.00232662231186 0.00000011928931 0.0%
Plymouth 0.00320804067625 0.00320821160115 0.00000017092491 0.0%Poole 0.00151902628695 0.00151909394331 0.00000006765636 0.0%Portsmouth 0.00250393953218 0.00250408792810 0.00000014839592 0.0%Reading 0.00177667516399 0.00177677059147 0.00000009542748 0.0%Redcar and Cleveland 0.00195588833779 0.00195598551253 0.00000009717474 0.0%
Rutland 0.00041389151943 0.00041371781618 -0.00000017370324 0.0%Slough 0.00161365442952 0.00161374032483 0.00000008589531 0.0%South Gloucestershire 0.00271938072103 0.00271948805526 0.00000010733423 0.0%Southampton 0.00287395901238 0.00287412945264 0.00000017044026 0.0%Southend-on-Sea 0.00217592021053 0.00217602941408 0.00000010920355 0.0%
Stockton-on-Tees 0.00238736589345 0.00238748990489 0.00000012401144 0.0%Stoke-on-Trent 0.00344615761315 0.00344633628515 0.00000017867200 0.0%Swindon 0.00211483318128 0.00211492604383 0.00000009286255 0.0%Telford and the Wrekin 0.00215489512735 0.00215499892946 0.00000010380211 0.0%Thurrock 0.00198384245463 0.00198394029054 0.00000009783592 0.0%
Torbay 0.00194439392324 0.00194448232562 0.00000008840238 0.0%Warrington 0.00218986638075 0.00218996349378 0.00000009711303 0.0%West Berkshire 0.00158809828596 0.00158727717407 -0.00000082111189 -0.1%Windsor and Maidenhead 0.00142299332817 0.00142231128759 -0.00000068204058 0.0%Wokingham 0.00139745006752 0.00139662284208 -0.00000082722544 -0.1%
York 0.00200055940606 0.00200065370494 0.00000009429888 0.0%
Isles of Scilly
11
Local Authority2010-11 Settlement(ie authorities as at
1 April 2008)
2010-11 Indicative Allocation
(ie authorities as at 1 April 2009)
(£ million) (£ million) (£ million) (%)
Total Relative Needs FormulaDifference from 2010-11
Settlement
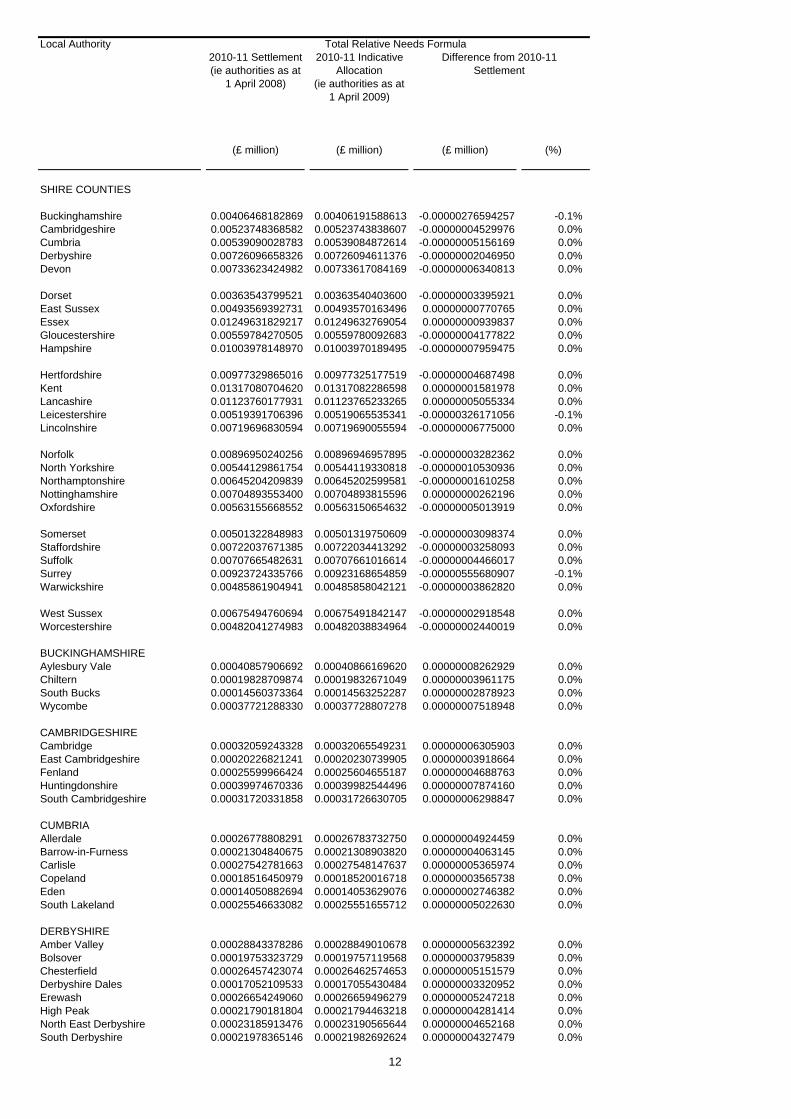
SHIRE COUNTIES
Buckinghamshire 0.00406468182869 0.00406191588613 -0.00000276594257 -0.1%Cambridgeshire 0.00523748368582 0.00523743838607 -0.00000004529976 0.0%Cumbria 0.00539090028783 0.00539084872614 -0.00000005156169 0.0%Derbyshire 0.00726096658326 0.00726094611376 -0.00000002046950 0.0%Devon 0.00733623424982 0.00733617084169 -0.00000006340813 0.0%
Dorset 0.00363543799521 0.00363540403600 -0.00000003395921 0.0%East Sussex 0.00493569392731 0.00493570163496 0.00000000770765 0.0%Essex 0.01249631829217 0.01249632769054 0.00000000939837 0.0%Gloucestershire 0.00559784270505 0.00559780092683 -0.00000004177822 0.0%Hampshire 0.01003978148970 0.01003970189495 -0.00000007959475 0.0%
Hertfordshire 0.00977329865016 0.00977325177519 -0.00000004687498 0.0%Kent 0.01317080704620 0.01317082286598 0.00000001581978 0.0%Lancashire 0.01123760177931 0.01123765233265 0.00000005055334 0.0%Leicestershire 0.00519391706396 0.00519065535341 -0.00000326171056 -0.1%Lincolnshire 0.00719696830594 0.00719690055594 -0.00000006775000 0.0%
Norfolk 0.00896950240256 0.00896946957895 -0.00000003282362 0.0%North Yorkshire 0.00544129861754 0.00544119330818 -0.00000010530936 0.0%Northamptonshire 0.00645204209839 0.00645202599581 -0.00000001610258 0.0%Nottinghamshire 0.00704893553400 0.00704893815596 0.00000000262196 0.0%Oxfordshire 0.00563155668552 0.00563150654632 -0.00000005013919 0.0%
Somerset 0.00501322848983 0.00501319750609 -0.00000003098374 0.0%Staffordshire 0.00722037671385 0.00722034413292 -0.00000003258093 0.0%Suffolk 0.00707665482631 0.00707661016614 -0.00000004466017 0.0%Surrey 0.00923724335766 0.00923168654859 -0.00000555680907 -0.1%Warwickshire 0.00485861904941 0.00485858042121 -0.00000003862820 0.0%
West Sussex 0.00675494760694 0.00675491842147 -0.00000002918548 0.0%Worcestershire 0.00482041274983 0.00482038834964 -0.00000002440019 0.0%
BUCKINGHAMSHIREAylesbury Vale 0.00040857906692 0.00040866169620 0.00000008262929 0.0%Chiltern 0.00019828709874 0.00019832671049 0.00000003961175 0.0%South Bucks 0.00014560373364 0.00014563252287 0.00000002878923 0.0%Wycombe 0.00037721288330 0.00037728807278 0.00000007518948 0.0%
CAMBRIDGESHIRECambridge 0.00032059243328 0.00032065549231 0.00000006305903 0.0%East Cambridgeshire 0.00020226821241 0.00020230739905 0.00000003918664 0.0%Fenland 0.00025599966424 0.00025604655187 0.00000004688763 0.0%Huntingdonshire 0.00039974670336 0.00039982544496 0.00000007874160 0.0%South Cambridgeshire 0.00031720331858 0.00031726630705 0.00000006298847 0.0%
CUMBRIAAllerdale 0.00026778808291 0.00026783732750 0.00000004924459 0.0%Barrow-in-Furness 0.00021304840675 0.00021308903820 0.00000004063145 0.0%Carlisle 0.00027542781663 0.00027548147637 0.00000005365974 0.0%Copeland 0.00018516450979 0.00018520016718 0.00000003565738 0.0%Eden 0.00014050882694 0.00014053629076 0.00000002746382 0.0%South Lakeland 0.00025546633082 0.00025551655712 0.00000005022630 0.0%
DERBYSHIREAmber Valley 0.00028843378286 0.00028849010678 0.00000005632392 0.0%Bolsover 0.00019753323729 0.00019757119568 0.00000003795839 0.0%Chesterfield 0.00026457423074 0.00026462574653 0.00000005151579 0.0%Derbyshire Dales 0.00017052109533 0.00017055430484 0.00000003320952 0.0%Erewash 0.00026654249060 0.00026659496279 0.00000005247218 0.0%High Peak 0.00021790181804 0.00021794463218 0.00000004281414 0.0%North East Derbyshire 0.00023185913476 0.00023190565644 0.00000004652168 0.0%South Derbyshire 0.00021978365146 0.00021982692624 0.00000004327479 0.0%
12

Local Authority2010-11 Settlement(ie authorities as at
1 April 2008)
2010-11 Indicative Allocation
(ie authorities as at 1 April 2009)
(£ million) (£ million) (£ million) (%)
Total Relative Needs FormulaDifference from 2010-11
Settlement
DEVONEast Devon 0.00031903538196 0.00031909863839 0.00000006325643 0.0%Exeter 0.00031740784771 0.00031746929626 0.00000006144855 0.0%Mid Devon 0.00019430946304 0.00019434777758 0.00000003831454 0.0%North Devon 0.00024451943336 0.00024456754699 0.00000004811363 0.0%South Hams 0.00020754898418 0.00020758933377 0.00000004034959 0.0%Teignbridge 0.00031885974632 0.00031892127293 0.00000006152661 0.0%Torridge 0.00018121037459 0.00018124612327 0.00000003574868 0.0%West Devon 0.00013603079754 0.00013605692559 0.00000002612805 0.0%
DORSETChristchurch 0.00011453533790 0.00011455558954 0.00000002025165 0.0%East Dorset 0.00018679668863 0.00018683358277 0.00000003689414 0.0%North Dorset 0.00016312394840 0.00016315596929 0.00000003202089 0.0%Purbeck 0.00011395487042 0.00011397595103 0.00000002108061 0.0%West Dorset 0.00026828655245 0.00026833480423 0.00000004825178 0.0%Weymouth and Portland 0.00017245259786 0.00017248505086 0.00000003245300 0.0%
EAST SUSSEXEastbourne 0.00028754042796 0.00028759277796 0.00000005235000 0.0%Hastings 0.00026267084830 0.00026272073154 0.00000004988324 0.0%Lewes 0.00022792224425 0.00022796679926 0.00000004455501 0.0%Rother 0.00023028021418 0.00023032429032 0.00000004407614 0.0%Wealden 0.00033768506955 0.00033775109818 0.00000006602862 0.0%
ESSEXBasildon 0.00045689666464 0.00045698757227 0.00000009090764 0.0%Braintree 0.00033986835883 0.00033993658764 0.00000006822881 0.0%Brentwood 0.00017770379131 0.00017773705549 0.00000003326417 0.0%Castle Point 0.00021137204709 0.00021141381956 0.00000004177247 0.0%Chelmsford 0.00038248363042 0.00038255851512 0.00000007488471 0.0%Colchester 0.00040850165442 0.00040858273935 0.00000008108492 0.0%Epping Forest 0.00032895421617 0.00032901535103 0.00000006113487 0.0%Harlow 0.00021981496266 0.00021985677114 0.00000004180848 0.0%Maldon 0.00015309596825 0.00015312579761 0.00000002982935 0.0%Rochford 0.00018610862769 0.00018614514042 0.00000003651272 0.0%Tendring 0.00039825915911 0.00039833567848 0.00000007651937 0.0%Uttlesford 0.00016927390675 0.00016930725122 0.00000003334447 0.0%
GLOUCESTERSHIRECheltenham 0.00027435088934 0.00027440494748 0.00000005405814 0.0%Cotswold 0.00020744523464 0.00020748630373 0.00000004106909 0.0%Forest of Dean 0.00020445037647 0.00020449054173 0.00000004016526 0.0%Gloucester 0.00029514528709 0.00029520289905 0.00000005761196 0.0%Stroud 0.00025442950836 0.00025447981949 0.00000005031113 0.0%Tewkesbury 0.00018661898848 0.00018665590944 0.00000003692096 0.0%
HAMPSHIREBasingstoke and Deane 0.00036929600951 0.00036936921638 0.00000007320687 0.0%East Hampshire 0.00025115141042 0.00025120056066 0.00000004915023 0.0%Eastleigh 0.00026908960613 0.00026914242323 0.00000005281711 0.0%Fareham 0.00023600074259 0.00023604783270 0.00000004709011 0.0%Gosport 0.00020527558394 0.00020531506145 0.00000003947751 0.0%Hart 0.00019051958057 0.00019055710487 0.00000003752430 0.0%Havant 0.00029562151829 0.00029567800048 0.00000005648219 0.0%New Forest 0.00042478596277 0.00042486598817 0.00000008002540 0.0%Rushmoor 0.00020584027332 0.00020588028996 0.00000004001664 0.0%Test Valley 0.00026598942677 0.00026604266508 0.00000005323832 0.0%Winchester 0.00026271542336 0.00026276697382 0.00000005155046 0.0%
13
Local Authority2010-11 Settlement(ie authorities as at
1 April 2008)
2010-11 Indicative Allocation
(ie authorities as at 1 April 2009)
(£ million) (£ million) (£ million) (%)
Total Relative Needs FormulaDifference from 2010-11
Settlement
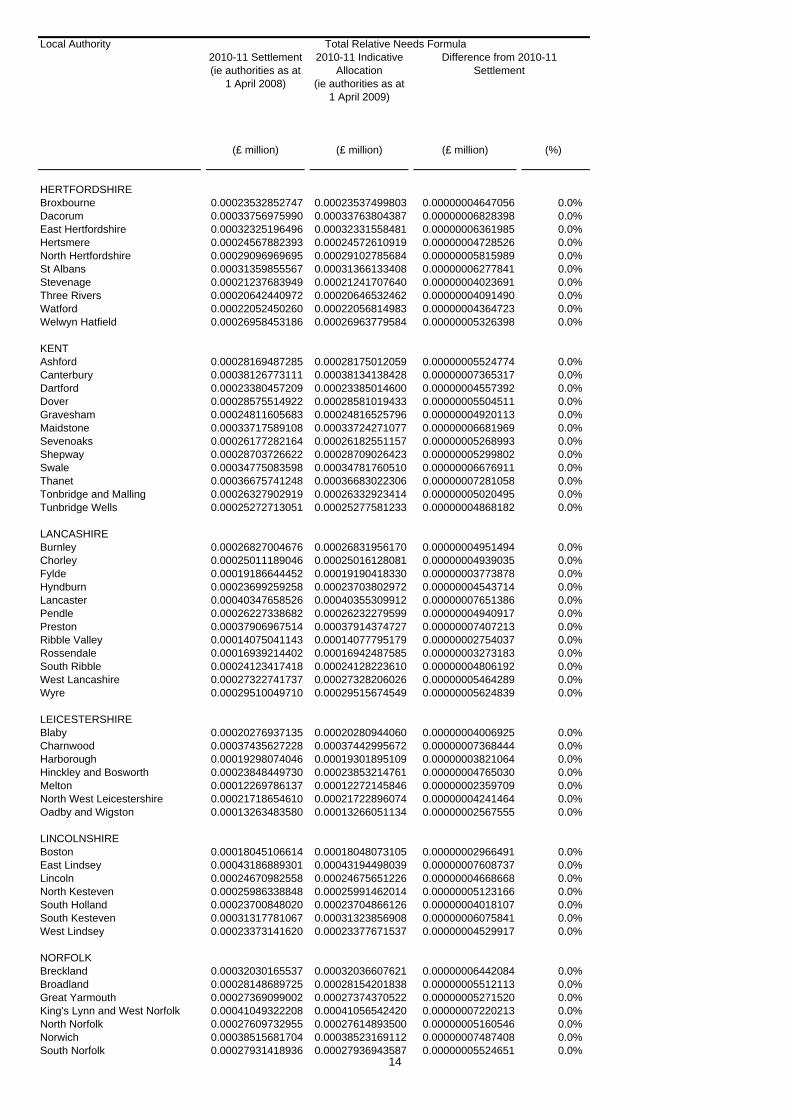
HERTFORDSHIREBroxbourne 0.00023532852747 0.00023537499803 0.00000004647056 0.0%Dacorum 0.00033756975990 0.00033763804387 0.00000006828398 0.0%East Hertfordshire 0.00032325196496 0.00032331558481 0.00000006361985 0.0%Hertsmere 0.00024567882393 0.00024572610919 0.00000004728526 0.0%North Hertfordshire 0.00029096969695 0.00029102785684 0.00000005815989 0.0%St Albans 0.00031359855567 0.00031366133408 0.00000006277841 0.0%Stevenage 0.00021237683949 0.00021241707640 0.00000004023691 0.0%Three Rivers 0.00020642440972 0.00020646532462 0.00000004091490 0.0%Watford 0.00022052450260 0.00022056814983 0.00000004364723 0.0%Welwyn Hatfield 0.00026958453186 0.00026963779584 0.00000005326398 0.0%
KENTAshford 0.00028169487285 0.00028175012059 0.00000005524774 0.0%Canterbury 0.00038126773111 0.00038134138428 0.00000007365317 0.0%Dartford 0.00023380457209 0.00023385014600 0.00000004557392 0.0%Dover 0.00028575514922 0.00028581019433 0.00000005504511 0.0%Gravesham 0.00024811605683 0.00024816525796 0.00000004920113 0.0%Maidstone 0.00033717589108 0.00033724271077 0.00000006681969 0.0%Sevenoaks 0.00026177282164 0.00026182551157 0.00000005268993 0.0%Shepway 0.00028703726622 0.00028709026423 0.00000005299802 0.0%Swale 0.00034775083598 0.00034781760510 0.00000006676911 0.0%Thanet 0.00036675741248 0.00036683022306 0.00000007281058 0.0%Tonbridge and Malling 0.00026327902919 0.00026332923414 0.00000005020495 0.0%Tunbridge Wells 0.00025272713051 0.00025277581233 0.00000004868182 0.0%
LANCASHIREBurnley 0.00026827004676 0.00026831956170 0.00000004951494 0.0%Chorley 0.00025011189046 0.00025016128081 0.00000004939035 0.0%Fylde 0.00019186644452 0.00019190418330 0.00000003773878 0.0%Hyndburn 0.00023699259258 0.00023703802972 0.00000004543714 0.0%Lancaster 0.00040347658526 0.00040355309912 0.00000007651386 0.0%Pendle 0.00026227338682 0.00026232279599 0.00000004940917 0.0%Preston 0.00037906967514 0.00037914374727 0.00000007407213 0.0%Ribble Valley 0.00014075041143 0.00014077795179 0.00000002754037 0.0%Rossendale 0.00016939214402 0.00016942487585 0.00000003273183 0.0%South Ribble 0.00024123417418 0.00024128223610 0.00000004806192 0.0%West Lancashire 0.00027322741737 0.00027328206026 0.00000005464289 0.0%Wyre 0.00029510049710 0.00029515674549 0.00000005624839 0.0%
LEICESTERSHIREBlaby 0.00020276937135 0.00020280944060 0.00000004006925 0.0%Charnwood 0.00037435627228 0.00037442995672 0.00000007368444 0.0%Harborough 0.00019298074046 0.00019301895109 0.00000003821064 0.0%Hinckley and Bosworth 0.00023848449730 0.00023853214761 0.00000004765030 0.0%Melton 0.00012269786137 0.00012272145846 0.00000002359709 0.0%North West Leicestershire 0.00021718654610 0.00021722896074 0.00000004241464 0.0%Oadby and Wigston 0.00013263483580 0.00013266051134 0.00000002567555 0.0%
LINCOLNSHIREBoston 0.00018045106614 0.00018048073105 0.00000002966491 0.0%East Lindsey 0.00043186889301 0.00043194498039 0.00000007608737 0.0%Lincoln 0.00024670982558 0.00024675651226 0.00000004668668 0.0%North Kesteven 0.00025986338848 0.00025991462014 0.00000005123166 0.0%South Holland 0.00023700848020 0.00023704866126 0.00000004018107 0.0%South Kesteven 0.00031317781067 0.00031323856908 0.00000006075841 0.0%West Lindsey 0.00023373141620 0.00023377671537 0.00000004529917 0.0%
NORFOLKBreckland 0.00032030165537 0.00032036607621 0.00000006442084 0.0%Broadland 0.00028148689725 0.00028154201838 0.00000005512113 0.0%Great Yarmouth 0.00027369099002 0.00027374370522 0.00000005271520 0.0%King's Lynn and West Norfolk 0.00041049322208 0.00041056542420 0.00000007220213 0.0%North Norfolk 0.00027609732955 0.00027614893500 0.00000005160546 0.0%Norwich 0.00038515681704 0.00038523169112 0.00000007487408 0.0%South Norfolk 0.00027931418936 0.00027936943587 0.00000005524651 0.0%
14
Local Authority2010-11 Settlement(ie authorities as at
1 April 2008)
2010-11 Indicative Allocation
(ie authorities as at 1 April 2009)
(£ million) (£ million) (£ million) (%)
Total Relative Needs FormulaDifference from 2010-11
Settlement
NORTH YORKSHIRECraven 0.00014073426884 0.00014076124227 0.00000002697343 0.0%Hambleton 0.00021074123298 0.00021078288865 0.00000004165567 0.0%Harrogate 0.00038346290704 0.00038353647177 0.00000007356472 0.0%Richmondshire 0.00013123524132 0.00013126098342 0.00000002574210 0.0%Ryedale 0.00014190335028 0.00014193090012 0.00000002754984 0.0%Scarborough 0.00032911568571 0.00032917460867 0.00000005892296 0.0%Selby 0.00020663345438 0.00020666968362 0.00000003622924 0.0%
NORTHAMPTONSHIRECorby 0.00014623960317 0.00014626827981 0.00000002867664 0.0%Daventry 0.00019631374476 0.00019635241049 0.00000003866573 0.0%East Northamptonshire 0.00020858951118 0.00020863132769 0.00000004181651 0.0%Kettering 0.00022103670645 0.00022108084597 0.00000004413951 0.0%Northampton 0.00051433372422 0.00051443431080 0.00000010058657 0.0%South Northamptonshire 0.00020525138552 0.00020529237155 0.00000004098603 0.0%Wellingborough 0.00019148124231 0.00019151911936 0.00000003787705 0.0%
NOTTINGHAMSHIREAshfield 0.00029498509891 0.00029504360981 0.00000005851090 0.0%Bassetlaw 0.00029576047778 0.00029581812240 0.00000005764462 0.0%Broxtowe 0.00025604381823 0.00025609507463 0.00000005125640 0.0%Gedling 0.00026944161350 0.00026949449105 0.00000005287754 0.0%Mansfield 0.00026525834534 0.00026530932136 0.00000005097602 0.0%Newark and Sherwood 0.00029071547310 0.00029077098932 0.00000005551622 0.0%Rushcliffe 0.00024950154191 0.00024955031375 0.00000004877184 0.0%
OXFORDSHIRECherwell 0.00034277663017 0.00034284580031 0.00000006917014 0.0%Oxford 0.00041988489914 0.00041996881055 0.00000008391141 0.0%South Oxfordshire 0.00030439286204 0.00030445209266 0.00000005923062 0.0%Vale of White Horse 0.00027218766470 0.00027224177428 0.00000005410959 0.0%West Oxfordshire 0.00023866445586 0.00023871221544 0.00000004775958 0.0%
SOMERSETMendip 0.00026655882263 0.00026661112902 0.00000005230639 0.0%Sedgemoor 0.00029429706788 0.00029435183875 0.00000005477087 0.0%South Somerset 0.00037601082473 0.00037608568458 0.00000007485985 0.0%Taunton Deane 0.00027086296861 0.00027091579413 0.00000005282552 0.0%West Somerset 0.00010008301447 0.00010010181092 0.00000001879645 0.0%
STAFFORDSHIRECannock Chase 0.00023290070481 0.00023294669427 0.00000004598946 0.0%East Staffordshire 0.00027307515580 0.00027312826874 0.00000005311294 0.0%Lichfield 0.00022176533187 0.00022180940783 0.00000004407597 0.0%Newcastle-under-Lyme 0.00029956400121 0.00029962298391 0.00000005898269 0.0%South Staffordshire 0.00024264177545 0.00024268985502 0.00000004807957 0.0%Stafford 0.00028639777528 0.00028645440643 0.00000005663115 0.0%Staffordshire Moorlands 0.00023328266828 0.00023332846559 0.00000004579732 0.0%Tamworth 0.00018408950250 0.00018412561270 0.00000003611020 0.0%
SUFFOLKBabergh 0.00020743016632 0.00020747097518 0.00000004080886 0.0%Forest Heath 0.00014078515470 0.00014081281364 0.00000002765894 0.0%Ipswich 0.00032224149612 0.00032230387008 0.00000006237396 0.0%Mid Suffolk 0.00021951172982 0.00021955506429 0.00000004333448 0.0%St Edmundsbury 0.00023857723244 0.00023862485865 0.00000004762622 0.0%Suffolk Coastal 0.00029421500942 0.00029427176478 0.00000005675536 0.0%Waveney 0.00031673626286 0.00031679666262 0.00000006039976 0.0%
15

Local Authority2010-11 Settlement(ie authorities as at
1 April 2008)
2010-11 Indicative Allocation
(ie authorities as at 1 April 2009)
(£ million) (£ million) (£ million) (%)
Total Relative Needs FormulaDifference from 2010-11
Settlement
SURREYElmbridge 0.00031285042754 0.00031291248126 0.00000006205372 0.0%Epsom and Ewell 0.00016888312139 0.00016891617555 0.00000003305416 0.0%Guildford 0.00032429405238 0.00032435768259 0.00000006363021 0.0%Mole Valley 0.00018920176816 0.00018923933964 0.00000003757149 0.0%Reigate and Banstead 0.00030431932772 0.00030437999838 0.00000006067065 0.0%Runnymede 0.00020224183640 0.00020228073685 0.00000003890046 0.0%Spelthorne 0.00022097582150 0.00022101913064 0.00000004330914 0.0%Surrey Heath 0.00019924761641 0.00019928366109 0.00000003604467 0.0%Tandridge 0.00019008138537 0.00019011924891 0.00000003786354 0.0%Waverley 0.00026854116396 0.00026859504524 0.00000005388128 0.0%Woking 0.00022716778027 0.00022721138193 0.00000004360165 0.0%
WARWICKSHIRENorth Warwickshire 0.00015465602215 0.00015468569348 0.00000002967134 0.0%Nuneaton and Bedworth 0.00030655984447 0.00030662042533 0.00000006058086 0.0%Rugby 0.00022187611169 0.00022191961452 0.00000004350283 0.0%Stratford-on-Avon 0.00028116525951 0.00028122091743 0.00000005565792 0.0%Warwick 0.00033778691359 0.00033785306785 0.00000006615426 0.0%
WEST SUSSEXAdur 0.00015231378323 0.00015234228562 0.00000002850239 0.0%Arun 0.00036305619008 0.00036312671910 0.00000007052901 0.0%Chichester 0.00026369022446 0.00026374122378 0.00000005099932 0.0%Crawley 0.00028129460911 0.00028135104085 0.00000005643174 0.0%Horsham 0.00028610118170 0.00028615721667 0.00000005603496 0.0%Mid Sussex 0.00027352240353 0.00027357591617 0.00000005351264 0.0%Worthing 0.00025020917809 0.00025025779609 0.00000004861800 0.0%
WORCESTERSHIREBromsgrove 0.00020232592892 0.00020236654091 0.00000004061198 0.0%Malvern Hills 0.00017873741116 0.00017877256022 0.00000003514906 0.0%Redditch 0.00019063685079 0.00019067390977 0.00000003705898 0.0%Worcester 0.00023003259456 0.00023007679979 0.00000004420523 0.0%Wychavon 0.00027764310641 0.00027769787233 0.00000005476592 0.0%Wyre Forest 0.00024177010781 0.00024181731814 0.00000004721033 0.0%
16
Local Authority2010-11 Settlement(ie authorities as at
1 April 2008)
2010-11 Indicative Allocation
(ie authorities as at 1 April 2009)
(£ million) (£ million) (£ million) (%)
Total Relative Needs FormulaDifference from 2010-11
Settlement
SHIRE POLICE AUTHORITIES
Avon & Somerset Police 0.00239307381627 0.00239307381627 0.00000000000000 0.0%Bedfordshire Police 0.00091457513557 0.00091457513557 0.00000000000000 0.0%Cambridgeshire Police 0.00107268271910 0.00107268271910 0.00000000000000 0.0%Cheshire Police 0.00143641749020 0.00143641749020 0.00000000000000 0.0%Cleveland Police 0.00107804765511 0.00107804765511 0.00000000000000 0.0%
Cumbria Police 0.00069725030003 0.00069725030003 0.00000000000000 0.0%Derbyshire Police 0.00144119709561 0.00144119709561 0.00000000000000 0.0%Devon & Cornwall Police 0.00238602654115 0.00238602654115 0.00000000000000 0.0%Dorset Police 0.00090059795323 0.00090059795323 0.00000000000000 0.0%Durham Police 0.00099282677348 0.00099282677348 0.00000000000000 0.0%
Essex Police 0.00238977442805 0.00238977442805 0.00000000000000 0.0%Gloucestershire Police 0.00076713260508 0.00076713260508 0.00000000000000 0.0%Hampshire Police 0.00268223598731 0.00268223598731 0.00000000000000 0.0%Hertfordshire Police 0.00164688490270 0.00164688490270 0.00000000000000 0.0%Humberside Police 0.00150277875405 0.00150277875405 0.00000000000000 0.0%
Kent Police 0.00249034434695 0.00249034434695 0.00000000000000 0.0%Lancashire Police 0.00242142762175 0.00242142762175 0.00000000000000 0.0%Leicestershire Police 0.00146048013503 0.00146048013503 0.00000000000000 0.0%Lincolnshire Police 0.00087629063863 0.00087629063863 0.00000000000000 0.0%Norfolk Police 0.00111710709724 0.00111710709724 0.00000000000000 0.0%
North Yorkshire Police 0.00098114559192 0.00098114559192 0.00000000000000 0.0%Northamptonshire Police 0.00096135075455 0.00096135075455 0.00000000000000 0.0%Nottinghamshire Police 0.00173940862497 0.00173940862497 0.00000000000000 0.0%Staffordshire Police 0.00151690013349 0.00151690013349 0.00000000000000 0.0%Suffolk Police 0.00091696397372 0.00091696397372 0.00000000000000 0.0%
Surrey Police 0.00146017418498 0.00146017418498 0.00000000000000 0.0%Sussex Police 0.00218607969802 0.00218607969802 0.00000000000000 0.0%Thames Valley Police 0.00319449823256 0.00319449823256 0.00000000000000 0.0%Warwickshire Police 0.00072783592958 0.00072783592958 0.00000000000000 0.0%West Mercia Police 0.00150760088255 0.00150760088255 0.00000000000000 0.0%
Wiltshire Police 0.00085387471353 0.00085387471353 0.00000000000000 0.0%
17

Local Authority2010-11 Settlement(ie authorities as at
1 April 2008)
2010-11 Indicative Allocation
(ie authorities as at 1 April 2009)
(£ million) (£ million) (£ million) (%)
Total Relative Needs FormulaDifference from 2010-11
Settlement
SHIRE FIRE AUTHORITIES
Avon Fire 0.00063983630179 0.00063983630179 0.00000000000000 0.0%Bedfordshire Fire 0.00032557000846 0.00032557000846 0.00000000000000 0.0%Berkshire Fire Auhtority 0.00043703147854 0.00043703147854 0.00000000000000 0.0%Buckinghamshire Fire 0.00034791084319 0.00034791084319 0.00000000000000 0.0%Cambridgeshire Fire 0.00042678231816 0.00042678231816 0.00000000000000 0.0%
Cheshire Fire 0.00056502059420 0.00056502059420 0.00000000000000 0.0%Cleveland Fire 0.00045649481882 0.00045649481882 0.00000000000000 0.0%Derbyshire Fire 0.00054729291695 0.00054729291695 0.00000000000000 0.0%Devon and Somerset Fire 0.00092782277234 0.00092782277234 0.00000000000000 0.0%Dorset Fire 0.00037879677246 0.00037879677246 0.00000000000000 0.0%
Durham Fire 0.00036584979368 0.00036584979368 0.00000000000000 0.0%East Sussex Fire 0.00044637179334 0.00044637179334 0.00000000000000 0.0%Essex Fire Auhtority 0.00097331480046 0.00097331480046 0.00000000000000 0.0%Hampshire Fire 0.00090886904219 0.00090886904219 0.00000000000000 0.0%Hereford & Worcester Fire 0.00036224160229 0.00036224160229 0.00000000000000 0.0%
Humberside Fire 0.00063570095901 0.00063570095901 0.00000000000000 0.0%Kent Fire 0.00091308895729 0.00091308895729 0.00000000000000 0.0%Lancashire Fire 0.00083347255843 0.00083347255843 0.00000000000000 0.0%Leicestershire Fire 0.00051722645701 0.00051722645701 0.00000000000000 0.0%North Yorkshire Fire 0.00038914592560 0.00038914592560 0.00000000000000 0.0%
Nottinghamshire Fire 0.00064029374881 0.00064029374881 0.00000000000000 0.0%Shropshire Fire 0.00024549467587 0.00024549467587 0.00000000000000 0.0%Staffordshire Fire 0.00054727942078 0.00054727942078 0.00000000000000 0.0%Wiltshire Fire 0.00032917401049 0.00032917401049 0.00000000000000 0.0%
18

Local Authority2010-11 Settlement(ie authorities as at
1 April 2008)
2010-11 Indicative Allocation
(ie authorities as at 1 April 2009)
(£ million) (£ million) (£ million) (%)
Total Relative Needs FormulaDifference from 2010-11
Settlement
REORGANISED AREAS
BEDFORDSHIRE
Bedfordshire 0.00355628492781
Bedford 0.00042492842772Mid Bedfordshire 0.00031093287054South Bedfordshire 0.00028624851763
Bedford 0.00193557488125Central Bedfordshire 0.00263657273211
Bedfordshire Area Total 0.00457839474370 0.00457214761336 -0.00000624713034 -0.1%
CHESHIRE
Cheshire 0.00598162030251
Chester 0.00030938750139Congleton 0.00020363637824Crewe and Nantwich 0.00029151113459Ellesmere Port and Neston 0.00020013817113Macclesfield 0.00033894329126Vale Royal 0.00030242419983
Cheshire East 0.00379564168027Cheshire West & Chester 0.00380723682468
Cheshire Area Total 0.00762766097896 0.00760287850495 -0.00002478247401 -0.3%
CORNWALL
Cornwall 0.00599841318355
Caradon 0.00021102658946Carrick 0.00023702006260Kerrier 0.00026162071934North Cornwall 0.00023232507075Penwith 0.00018099016600Restormel 0.00026645044156
Cornwall 0.00734963944416
Cornwall Area Total 0.00738784623325 0.00734963944416 -0.00003820678909 -0.5%
DURHAM
Durham 0.00541908898387
Chester-le-Street 0.00013441691547Derwentside 0.00023175288198Durham 0.00022113657899Easington 0.00027426840777Sedgefield 0.00024303838142Teesdale 0.00006898153106Wear Valley 0.00018473773857
Durham 0.00673444494700
Durham Area Total 0.00677742141912 0.00673444494700 -0.00004297647212 -0.6%
19

Local Authority2010-11 Settlement(ie authorities as at
1 April 2008)
2010-11 Indicative Allocation
(ie authorities as at 1 April 2009)
(£ million) (£ million) (£ million) (%)
Total Relative Needs FormulaDifference from 2010-11
Settlement
NORTHUMBERLAND
Northumberland 0.00344897988165
Alnwick 0.00008703192286Berwick-upon-Tweed 0.00007651702812Blyth Valley 0.00021860885397Castle Morpeth 0.00011944339419Tynedale 0.00014936517331Wansbeck 0.00017127712122
Northumberland 0.00423866623663
Northumberland Area Total 0.00427122337533 0.00423866623663 -0.00003255713870 -0.8%
SHROPSHIRE
Shropshire 0.00289731706839
Bridgnorth 0.00012989811096North Shropshire 0.00015695577990Oswestry 0.00010390467355Shrewsbury and Atcham 0.00022898249825South Shropshire 0.00011848669933
Shropshire 0.00360914456585
Shropshire Area Total 0.00363554483038 0.00360914456585 -0.00002640026453 -0.7%
WILTSHIRE
Wiltshire 0.00397374620115
Kennet 0.00018807173583North Wiltshire 0.00030331480835Salisbury 0.00027836371793West Wiltshire 0.00030772317064
Wiltshire 0.00502913964229
Wiltshire Area Total 0.00505121963389 0.00502913964229 -0.00002207999161 -0.4%
20

Basis of Exemplification
Local Authority
England
London areaMetropolitan areasShire areasIsles of Scilly
Inner London boroughs incl. CityOuter London boroughsLondon boroughsGLA - all functions
Metropolitan districtsMetropolitan fire authoritiesMetropolitan police authorities
Shire unitaries with fireShire unitaries without fireShire counties with fireShire counties without fireShire districtsCombined fire authoritiesShire police authorities
GO REGIONAL SUMMARY
South West GORSouth East GORLondon GOREastern GOREast Midlands GORWest Midlands GORYorkshire and Humber GORNorth East GORNorth West GOR
FLOOR DAMPING GROUPS
Education AuthoritiesPolice AuthoritiesFire AuthoritiesShire Districts
2010-11 Settlement
(ie authorities
as at 1 April 2008)
2010-11 Indicative Allocation
(ie authorities
as at 1 April 2009)
2010-11 Settlement
(ie authorities
as at 1 April 2008)
2010-11 Indicative Allocation
(ie authorities
as at 1 April 2009)
(£ million) (£ million) (£ million) (%) (£ million) (£ million) (£ million) (%)
28,995.502 28,995.502 0.000 0.0% 28,995.502 28,995.502 0.000 0.0%
6,152.189 6,153.410 1.222 0.0% 6,152.189 6,153.410 1.222 0.0%8,338.310 8,340.736 2.426 0.0% 8,338.310 8,340.736 2.426 0.0%
14,502.723 14,499.075 -3.647 0.0% 14,502.723 14,499.075 -3.647 0.0%2.281 2.281 0.000 0.0% 2.281 2.281 0.000 0.0%
2,024.692 2,025.017 0.324 0.0% 2,024.692 2,025.017 0.324 0.0%1,871.865 1,873.105 1.240 0.1% 1,871.865 1,873.105 1.240 0.1%3,896.558 3,898.122 1.565 0.0% 3,896.558 3,898.122 1.565 0.0%2,255.631 2,255.288 -0.343 0.0% 2,255.631 2,255.288 -0.343 0.0%
5,901.626 5,904.032 2.406 0.0% 5,901.626 5,904.032 2.406 0.0%335.820 335.840 0.020 0.0% 335.820 335.840 0.020 0.0%
2,100.864 2,100.864 0.000 0.0% 2,100.864 2,100.864 0.000 0.0%
64.940 425.622 360.682 555.4% 64.940 425.622 360.682 555.4%3,392.431 4,099.344 706.913 20.8% 3,392.431 4,099.344 706.913 20.8%1,873.136 1,588.957 -284.178 -15.2% 1,873.136 1,588.957 -284.178 -15.2%3,017.701 2,501.877 -515.824 -17.1% 3,017.701 2,501.877 -515.824 -17.1%1,925.556 1,653.993 -271.563 -14.1% 1,925.556 1,653.993 -271.563 -14.1%
467.669 467.719 0.050 0.0% 467.669 467.719 0.050 0.0%3,761.291 3,761.563 0.273 0.0% 3,761.291 3,761.563 0.273 0.0%
2,269.672 2,267.300 -2.372 -0.1% 2,269.672 2,267.300 -2.372 -0.1%2,955.068 2,957.043 1.975 0.1% 2,955.068 2,957.043 1.975 0.1%6,152.189 6,153.410 1.222 0.0% 6,152.189 6,153.410 1.222 0.0%2,436.474 2,437.791 1.317 0.1% 2,436.474 2,437.791 1.317 0.1%2,291.087 2,292.211 1.124 0.0% 2,291.087 2,292.211 1.124 0.0%3,350.293 3,349.945 -0.348 0.0% 3,350.293 3,349.945 -0.348 0.0%3,197.824 3,199.219 1.396 0.0% 3,197.824 3,199.219 1.396 0.0%1,781.555 1,777.226 -4.329 -0.2% 1,781.555 1,777.226 -4.329 -0.2%4,561.339 4,561.356 0.016 0.0% 4,561.339 4,561.356 0.016 0.0%
17,340.633 18,417.955 1,077.322 6.2% 17,340.633 18,417.955 1,077.322 6.2%7,864.755 7,864.755 0.000 0.0% 7,864.755 7,864.755 0.000 0.0%1,056.519 1,056.519 0.000 0.0% 1,056.519 1,056.519 0.000 0.0%1,653.993 1,653.993 0.000 0.0% 1,653.993 1,653.993 0.000 0.0%
Formula Grant After Floor DampingDifference from 2010-11
Settlement
Formula Grant Before Floor DampingDifference from 2010-11
Settlement
21

Local Authority
GREATER LONDON
City of London
CamdenGreenwichHackneyHammersmith and FulhamIslingtonKensington and Chelsea
LambethLewishamSouthwarkTower HamletsWandsworthWestminster
Barking and DagenhamBarnetBexleyBrentBromley
CroydonEalingEnfieldHaringeyHarrow
HaveringHillingdonHounslowKingston upon ThamesMerton
NewhamRedbridgeRichmond upon ThamesSuttonWaltham Forest
GLA - all functions
GLA - policeGLA - fire
2010-11 Settlement
(ie authorities
as at 1 April 2008)
2010-11 Indicative Allocation
(ie authorities
as at 1 April 2009)
2010-11 Settlement
(ie authorities
as at 1 April 2008)
2010-11 Indicative Allocation
(ie authorities
as at 1 April 2009)
(£ million) (£ million) (£ million) (%) (£ million) (£ million) (£ million) (%)
Formula Grant After Floor DampingDifference from 2010-11
Settlement
Formula Grant Before Floor DampingDifference from 2010-11
Settlement
91.082 91.052 -0.030 0.0% 91.082 91.052 -0.030 0.0%
170.938 170.973 0.034 0.0% 170.938 170.973 0.034 0.0%170.057 170.083 0.026 0.0% 170.057 170.083 0.026 0.0%201.784 201.786 0.002 0.0% 201.784 201.786 0.002 0.0%94.278 94.310 0.032 0.0% 94.278 94.310 0.032 0.0%
133.741 133.758 0.018 0.0% 133.741 133.758 0.018 0.0%95.897 95.938 0.041 0.0% 95.897 95.938 0.041 0.0%
180.256 180.292 0.036 0.0% 180.256 180.292 0.036 0.0%174.892 174.924 0.033 0.0% 174.892 174.924 0.033 0.0%210.142 210.168 0.027 0.0% 210.142 210.168 0.027 0.0%224.331 224.334 0.002 0.0% 224.331 224.334 0.002 0.0%98.551 98.623 0.073 0.1% 98.551 98.623 0.073 0.1%
178.744 178.775 0.031 0.0% 178.744 178.775 0.031 0.0%
108.165 108.193 0.029 0.0% 108.165 108.193 0.029 0.0%97.761 97.859 0.099 0.1% 97.761 97.859 0.099 0.1%64.417 64.485 0.068 0.1% 64.417 64.485 0.068 0.1%
156.952 157.002 0.050 0.0% 156.952 157.002 0.050 0.0%45.645 45.746 0.101 0.2% 45.645 45.746 0.101 0.2%
118.314 118.408 0.094 0.1% 118.314 118.408 0.094 0.1%128.877 128.950 0.073 0.1% 128.877 128.950 0.073 0.1%126.668 126.735 0.067 0.1% 126.668 126.735 0.067 0.1%137.546 137.579 0.033 0.0% 137.546 137.579 0.033 0.0%66.512 66.572 0.060 0.1% 66.512 66.572 0.060 0.1%
52.191 52.264 0.073 0.1% 52.191 52.264 0.073 0.1%85.528 85.598 0.070 0.1% 85.528 85.598 0.070 0.1%77.199 77.255 0.056 0.1% 77.199 77.255 0.056 0.1%32.559 32.613 0.054 0.2% 32.559 32.613 0.054 0.2%61.103 61.163 0.060 0.1% 61.103 61.163 0.060 0.1%
231.261 231.278 0.017 0.0% 231.261 231.278 0.017 0.0%102.551 102.618 0.067 0.1% 102.551 102.618 0.067 0.1%
9.536 9.606 0.070 0.7% 9.536 9.606 0.070 0.7%45.089 45.146 0.057 0.1% 45.089 45.146 0.057 0.1%
123.992 124.034 0.041 0.0% 123.992 124.034 0.041 0.0%
2,255.631 2,255.288 -0.343 0.0% 2,255.631 2,255.288 -0.343 0.0%
2,002.600 2,002.328 -0.273 0.0% 2,002.600 2,002.328 -0.273 0.0%253.031 252.961 -0.070 0.0% 253.031 252.961 -0.070 0.0%
22
Local Authority
GREATER MANCHESTERBoltonBuryManchesterOldhamRochdaleSalfordStockportTamesideTraffordWiganGreater Manchester FireGreater Manchester Police
MERSEYSIDEKnowsleyLiverpoolSeftonSt HelensWirralMerseyside FireMerseyside Police
SOUTH YORKSHIREBarnsleyDoncasterRotherhamSheffieldSouth Yorkshire FireSouth Yorkshire Police
TYNE AND WEARGatesheadNewcastle upon TyneNorth TynesideSouth TynesideSunderlandTyne and Wear FireNorthumbria Police
WEST MIDLANDSBirminghamCoventryDudleySandwellSolihullWalsallWolverhamptonWest Midlands FireWest Midlands Police
WEST YORKSHIREBradfordCalderdaleKirkleesLeedsWakefieldWest Yorkshire FireWest Yorkshire Police
2010-11 Settlement
(ie authorities
as at 1 April 2008)
2010-11 Indicative Allocation
(ie authorities
as at 1 April 2009)
2010-11 Settlement
(ie authorities
as at 1 April 2008)
2010-11 Indicative Allocation
(ie authorities
as at 1 April 2009)
(£ million) (£ million) (£ million) (%) (£ million) (£ million) (£ million) (%)
Formula Grant After Floor DampingDifference from 2010-11
Settlement
Formula Grant Before Floor DampingDifference from 2010-11
Settlement
132.497 132.559 0.061 0.0% 132.497 132.559 0.061 0.0%67.405 67.457 0.052 0.1% 67.405 67.457 0.052 0.1%
346.001 346.066 0.065 0.0% 346.001 346.066 0.065 0.0%127.507 127.552 0.045 0.0% 127.507 127.552 0.045 0.0%114.839 114.886 0.047 0.0% 114.839 114.886 0.047 0.0%131.176 131.214 0.038 0.0% 131.176 131.214 0.038 0.0%85.149 85.234 0.085 0.1% 85.149 85.234 0.085 0.1%
109.495 109.544 0.049 0.0% 109.495 109.544 0.049 0.0%67.201 67.262 0.061 0.1% 67.201 67.262 0.061 0.1%
138.525 138.601 0.076 0.1% 138.525 138.601 0.076 0.1%76.126 76.130 0.004 0.0% 76.126 76.130 0.004 0.0%
485.725 485.719 -0.006 0.0% 485.725 485.719 -0.006 0.0%
114.576 114.595 0.019 0.0% 114.576 114.595 0.019 0.0%317.986 318.041 0.055 0.0% 317.986 318.041 0.055 0.0%127.541 127.607 0.067 0.1% 127.541 127.607 0.067 0.1%90.907 90.947 0.040 0.0% 90.907 90.947 0.040 0.0%
165.140 165.206 0.067 0.0% 165.140 165.206 0.067 0.0%46.122 46.120 -0.002 0.0% 46.122 46.120 -0.002 0.0%
275.554 275.543 -0.011 0.0% 275.554 275.543 -0.011 0.0%
114.265 114.315 0.050 0.0% 114.265 114.315 0.050 0.0%149.043 149.109 0.066 0.0% 149.043 149.109 0.066 0.0%130.072 130.131 0.059 0.0% 130.072 130.131 0.059 0.0%279.842 279.957 0.115 0.0% 279.842 279.957 0.115 0.0%37.435 37.440 0.005 0.0% 37.435 37.440 0.005 0.0%
209.205 209.218 0.013 0.0% 209.205 209.218 0.013 0.0%
102.695 102.733 0.038 0.0% 102.695 102.733 0.038 0.0%157.172 157.225 0.053 0.0% 157.172 157.225 0.053 0.0%87.396 87.445 0.049 0.1% 87.396 87.445 0.049 0.1%89.284 89.312 0.028 0.0% 89.284 89.312 0.028 0.0%
158.806 158.862 0.056 0.0% 158.806 158.862 0.056 0.0%35.873 35.874 0.001 0.0% 35.873 35.874 0.001 0.0%
219.931 219.940 0.009 0.0% 219.931 219.940 0.009 0.0%
698.763 698.920 0.158 0.0% 698.763 698.920 0.158 0.0%156.509 156.578 0.070 0.0% 156.509 156.578 0.070 0.0%130.319 130.397 0.078 0.1% 130.319 130.397 0.078 0.1%190.263 190.310 0.047 0.0% 190.263 190.310 0.047 0.0%49.048 49.113 0.065 0.1% 49.048 49.113 0.065 0.1%
142.274 142.325 0.051 0.0% 142.274 142.325 0.051 0.0%145.519 145.560 0.042 0.0% 145.519 145.560 0.042 0.0%81.556 81.560 0.004 0.0% 81.556 81.560 0.004 0.0%
542.232 542.216 -0.016 0.0% 542.232 542.216 -0.016 0.0%
283.254 283.363 0.109 0.0% 283.254 283.363 0.109 0.0%84.050 84.102 0.052 0.1% 84.050 84.102 0.052 0.1%
164.763 164.872 0.109 0.1% 164.763 164.872 0.109 0.1%305.688 305.893 0.205 0.1% 305.688 305.893 0.205 0.1%146.657 146.739 0.082 0.1% 146.657 146.739 0.082 0.1%58.707 58.715 0.008 0.0% 58.707 58.715 0.008 0.0%
368.217 368.229 0.012 0.0% 368.217 368.229 0.012 0.0%
23

Local Authority
ALL PURPOSE AUTHORITIES
Bath & North East SomersetBlackburn with DarwenBlackpoolBournemouthBracknell Forest
Brighton & HoveBristolDarlingtonDerbyEast Riding of Yorkshire
HaltonHartlepoolHerefordshireIsle of Wight CouncilKingston upon Hull
LeicesterLutonMedwayMiddlesbroughMilton Keynes
North East LincolnshireNorth LincolnshireNorth SomersetNottinghamPeterborough
PlymouthPoolePortsmouthReadingRedcar and Cleveland
RutlandSloughSouth GloucestershireSouthamptonSouthend-on-Sea
Stockton-on-TeesStoke-on-TrentSwindonTelford and the WrekinThurrock
TorbayWarringtonWest BerkshireWindsor and MaidenheadWokingham
York
Isles of Scilly
2010-11 Settlement
(ie authorities
as at 1 April 2008)
2010-11 Indicative Allocation
(ie authorities
as at 1 April 2009)
2010-11 Settlement
(ie authorities
as at 1 April 2008)
2010-11 Indicative Allocation
(ie authorities
as at 1 April 2009)
(£ million) (£ million) (£ million) (%) (£ million) (£ million) (£ million) (%)
Formula Grant After Floor DampingDifference from 2010-11
Settlement
Formula Grant Before Floor DampingDifference from 2010-11
Settlement
44.052 44.112 0.059 0.1% 44.052 44.112 0.059 0.1%88.434 88.461 0.027 0.0% 88.434 88.461 0.027 0.0%86.857 86.885 0.027 0.0% 86.857 86.885 0.027 0.0%49.376 49.423 0.047 0.1% 49.376 49.423 0.047 0.1%22.635 22.634 -0.001 0.0% 22.635 22.634 -0.001 0.0%
89.699 89.770 0.071 0.1% 89.699 89.770 0.071 0.1%171.073 171.185 0.112 0.1% 171.073 171.185 0.112 0.1%40.083 40.108 0.026 0.1% 40.083 40.108 0.026 0.1%
114.453 114.512 0.059 0.1% 114.453 114.512 0.059 0.1%109.074 109.177 0.102 0.1% 109.074 109.177 0.102 0.1%
65.461 65.485 0.024 0.0% 65.461 65.485 0.024 0.0%53.939 53.958 0.019 0.0% 53.939 53.958 0.019 0.0%61.139 61.186 0.047 0.1% 61.139 61.186 0.047 0.1%64.940 64.972 0.032 0.1% 64.940 64.972 0.032 0.1%
159.125 159.174 0.050 0.0% 159.125 159.174 0.050 0.0%
188.394 188.443 0.049 0.0% 188.394 188.443 0.049 0.0%94.571 94.613 0.043 0.0% 94.571 94.613 0.043 0.0%89.450 89.525 0.075 0.1% 89.450 89.525 0.075 0.1%85.381 85.405 0.023 0.0% 85.381 85.405 0.023 0.0%91.577 91.636 0.060 0.1% 91.577 91.636 0.060 0.1%
76.902 76.941 0.039 0.1% 76.902 76.941 0.039 0.1%66.226 66.270 0.043 0.1% 66.226 66.270 0.043 0.1%54.494 54.558 0.065 0.1% 54.494 54.558 0.065 0.1%
179.475 179.532 0.057 0.0% 179.475 179.532 0.057 0.0%80.854 80.893 0.039 0.0% 80.854 80.893 0.039 0.0%
108.596 108.659 0.063 0.1% 108.596 108.659 0.063 0.1%25.606 25.650 0.044 0.2% 25.606 25.650 0.044 0.2%87.784 87.838 0.054 0.1% 87.784 87.838 0.054 0.1%47.976 48.015 0.039 0.1% 47.976 48.015 0.039 0.1%71.403 71.433 0.031 0.0% 71.403 71.433 0.031 0.0%
8.587 8.588 0.001 0.0% 8.587 8.588 0.001 0.0%52.784 52.812 0.028 0.1% 52.784 52.812 0.028 0.1%63.948 64.035 0.088 0.1% 63.948 64.035 0.088 0.1%
101.162 101.225 0.063 0.1% 101.162 101.225 0.063 0.1%62.285 62.325 0.040 0.1% 62.285 62.325 0.040 0.1%
80.577 80.630 0.053 0.1% 80.577 80.630 0.053 0.1%133.408 133.456 0.048 0.0% 133.408 133.456 0.048 0.0%43.614 43.673 0.059 0.1% 43.614 43.673 0.059 0.1%75.940 75.982 0.043 0.1% 75.940 75.982 0.043 0.1%62.017 62.056 0.039 0.1% 62.017 62.056 0.039 0.1%
64.129 64.161 0.032 0.1% 64.129 64.161 0.032 0.1%52.667 52.727 0.060 0.1% 52.667 52.727 0.060 0.1%23.064 23.056 -0.008 0.0% 23.064 23.056 -0.008 0.0%10.079 10.082 0.003 0.0% 10.079 10.082 0.003 0.0%8.357 8.360 0.003 0.0% 8.357 8.360 0.003 0.0%
45.726 45.794 0.068 0.1% 45.726 45.794 0.068 0.1%
2.281 2.281 0.000 0.0% 2.281 2.281 0.000 0.0%
24

Local Authority
SHIRE COUNTIES
BuckinghamshireCambridgeshireCumbriaDerbyshireDevon
DorsetEast SussexEssexGloucestershireHampshire
HertfordshireKentLancashireLeicestershireLincolnshire
NorfolkNorth YorkshireNorthamptonshireNottinghamshireOxfordshire
SomersetStaffordshireSuffolkSurreyWarwickshire
West SussexWorcestershire
BUCKINGHAMSHIREAylesbury ValeChilternSouth BucksWycombe
CAMBRIDGESHIRECambridgeEast CambridgeshireFenlandHuntingdonshireSouth Cambridgeshire
CUMBRIAAllerdaleBarrow-in-FurnessCarlisleCopelandEdenSouth Lakeland
DERBYSHIREAmber ValleyBolsoverChesterfieldDerbyshire DalesErewashHigh PeakNorth East DerbyshireSouth Derbyshire
2010-11 Settlement
(ie authorities
as at 1 April 2008)
2010-11 Indicative Allocation
(ie authorities
as at 1 April 2009)
2010-11 Settlement
(ie authorities
as at 1 April 2008)
2010-11 Indicative Allocation
(ie authorities
as at 1 April 2009)
(£ million) (£ million) (£ million) (%) (£ million) (£ million) (£ million) (%)
Formula Grant After Floor DampingDifference from 2010-11
Settlement
Formula Grant Before Floor DampingDifference from 2010-11
Settlement
43.544 43.547 0.003 0.0% 43.544 43.547 0.003 0.0%112.911 113.099 0.188 0.2% 112.911 113.099 0.188 0.2%157.359 157.483 0.124 0.1% 157.359 157.483 0.124 0.1%203.798 204.002 0.204 0.1% 203.798 204.002 0.204 0.1%176.166 176.383 0.217 0.1% 176.166 176.383 0.217 0.1%
57.503 57.642 0.139 0.2% 57.503 57.642 0.139 0.2%105.217 105.378 0.160 0.2% 105.217 105.378 0.160 0.2%257.819 258.257 0.438 0.2% 257.819 258.257 0.438 0.2%123.852 124.029 0.177 0.1% 123.852 124.029 0.177 0.1%126.177 126.634 0.457 0.4% 126.177 126.634 0.457 0.4%
147.903 148.273 0.370 0.3% 147.903 148.273 0.370 0.3%287.508 287.942 0.434 0.2% 287.508 287.942 0.434 0.2%328.559 328.873 0.314 0.1% 328.559 328.873 0.314 0.1%107.530 107.529 -0.001 0.0% 107.530 107.529 -0.001 0.0%210.411 210.599 0.188 0.1% 210.411 210.599 0.188 0.1%
260.225 260.446 0.222 0.1% 260.225 260.446 0.222 0.1%113.567 113.750 0.183 0.2% 113.567 113.750 0.183 0.2%162.047 162.249 0.202 0.1% 162.047 162.249 0.202 0.1%191.336 191.555 0.219 0.1% 191.336 191.555 0.219 0.1%99.597 99.813 0.216 0.2% 99.597 99.813 0.216 0.2%
120.564 120.719 0.155 0.1% 120.564 120.719 0.155 0.1%169.445 169.693 0.248 0.1% 169.445 169.693 0.248 0.1%180.748 180.951 0.203 0.1% 180.748 180.951 0.203 0.1%60.063 60.132 0.070 0.1% 60.063 60.132 0.070 0.1%96.437 96.607 0.171 0.2% 96.437 96.607 0.171 0.2%
88.094 88.374 0.279 0.3% 88.094 88.374 0.279 0.3%96.698 96.875 0.176 0.2% 96.698 96.875 0.176 0.2%
12.093 12.092 0.000 0.0% 12.093 12.092 0.000 0.0%3.245 3.240 -0.004 -0.1% 3.245 3.240 -0.004 -0.1%2.350 2.346 -0.003 -0.1% 2.350 2.346 -0.003 -0.1%9.542 9.538 -0.003 0.0% 9.542 9.538 -0.003 0.0%
11.997 11.998 0.001 0.0% 11.997 11.998 0.001 0.0%6.807 6.808 0.001 0.0% 6.807 6.808 0.001 0.0%9.894 9.895 0.001 0.0% 9.894 9.895 0.001 0.0%
13.357 13.360 0.003 0.0% 13.357 13.360 0.003 0.0%7.871 7.869 -0.002 0.0% 7.871 7.869 -0.002 0.0%
10.400 10.400 0.001 0.0% 10.400 10.400 0.001 0.0%9.132 9.133 0.001 0.0% 9.132 9.133 0.001 0.0%
10.219 10.220 0.001 0.0% 10.219 10.220 0.001 0.0%7.177 7.178 0.001 0.0% 7.177 7.178 0.001 0.0%4.718 4.718 0.000 0.0% 4.718 4.718 0.000 0.0%6.809 6.807 -0.002 0.0% 6.809 6.807 -0.002 0.0%
10.001 10.004 0.003 0.0% 10.001 10.004 0.003 0.0%7.961 7.963 0.002 0.0% 7.961 7.963 0.002 0.0%
10.166 10.168 0.002 0.0% 10.166 10.168 0.002 0.0%4.731 4.730 -0.001 0.0% 4.731 4.730 -0.001 0.0%9.726 9.729 0.003 0.0% 9.726 9.729 0.003 0.0%7.157 7.158 0.001 0.0% 7.157 7.158 0.001 0.0%7.929 7.931 0.002 0.0% 7.929 7.931 0.002 0.0%7.511 7.513 0.002 0.0% 7.511 7.513 0.002 0.0%
25

Local Authority
DEVONEast DevonExeterMid DevonNorth DevonSouth HamsTeignbridgeTorridgeWest Devon
DORSETChristchurchEast DorsetNorth DorsetPurbeckWest DorsetWeymouth and Portland
EAST SUSSEXEastbourneHastingsLewesRotherWealden
ESSEXBasildonBraintreeBrentwoodCastle PointChelmsfordColchesterEpping ForestHarlowMaldonRochfordTendringUttlesford
GLOUCESTERSHIRECheltenhamCotswoldForest of DeanGloucesterStroudTewkesbury
HAMPSHIREBasingstoke and DeaneEast HampshireEastleighFarehamGosportHartHavantNew ForestRushmoorTest ValleyWinchester
2010-11 Settlement
(ie authorities
as at 1 April 2008)
2010-11 Indicative Allocation
(ie authorities
as at 1 April 2009)
2010-11 Settlement
(ie authorities
as at 1 April 2008)
2010-11 Indicative Allocation
(ie authorities
as at 1 April 2009)
(£ million) (£ million) (£ million) (%) (£ million) (£ million) (£ million) (%)
Formula Grant After Floor DampingDifference from 2010-11
Settlement
Formula Grant Before Floor DampingDifference from 2010-11
Settlement
8.389 8.387 -0.002 0.0% 8.389 8.387 -0.002 0.0%12.132 12.134 0.002 0.0% 12.132 12.134 0.002 0.0%6.318 6.319 0.000 0.0% 6.318 6.319 0.000 0.0%8.482 8.483 0.001 0.0% 8.482 8.483 0.001 0.0%5.606 5.604 -0.002 0.0% 5.606 5.604 -0.002 0.0%
10.091 10.091 0.000 0.0% 10.091 10.091 0.000 0.0%6.630 6.630 0.001 0.0% 6.630 6.630 0.001 0.0%4.413 4.412 0.000 0.0% 4.413 4.412 0.000 0.0%
2.908 2.906 -0.002 -0.1% 2.908 2.906 -0.002 -0.1%3.817 3.815 -0.002 0.0% 3.817 3.815 -0.002 0.0%4.670 4.669 0.000 0.0% 4.670 4.669 0.000 0.0%3.257 3.256 -0.001 0.0% 3.257 3.256 -0.001 0.0%7.929 7.926 -0.003 0.0% 7.929 7.926 -0.003 0.0%6.101 6.101 0.000 0.0% 6.101 6.101 0.000 0.0%
10.462 10.461 -0.001 0.0% 10.462 10.461 -0.001 0.0%10.556 10.556 0.000 0.0% 10.556 10.556 0.000 0.0%6.567 6.567 -0.001 0.0% 6.567 6.567 -0.001 0.0%6.493 6.491 -0.003 0.0% 6.493 6.491 -0.003 0.0%8.452 8.450 -0.003 0.0% 8.452 8.450 -0.003 0.0%
16.108 16.108 0.000 0.0% 16.108 16.108 0.000 0.0%10.562 10.563 0.001 0.0% 10.562 10.563 0.001 0.0%4.418 4.415 -0.003 -0.1% 4.418 4.415 -0.003 -0.1%6.833 6.834 0.001 0.0% 6.833 6.834 0.001 0.0%
10.719 10.719 -0.001 0.0% 10.719 10.719 -0.001 0.0%13.141 13.143 0.002 0.0% 13.141 13.143 0.002 0.0%9.380 9.376 -0.004 0.0% 9.380 9.376 -0.004 0.0%8.153 8.152 0.000 0.0% 8.153 8.152 0.000 0.0%4.590 4.589 0.000 0.0% 4.590 4.589 0.000 0.0%5.235 5.235 0.000 0.0% 5.235 5.235 0.000 0.0%
14.611 14.613 0.002 0.0% 14.611 14.613 0.002 0.0%3.866 3.863 -0.002 -0.1% 3.866 3.863 -0.002 -0.1%
8.654 8.654 0.000 0.0% 8.654 8.654 0.000 0.0%5.459 5.457 -0.002 0.0% 5.459 5.457 -0.002 0.0%6.979 6.980 0.001 0.0% 6.979 6.980 0.001 0.0%
10.787 10.789 0.002 0.0% 10.787 10.789 0.002 0.0%7.306 7.306 0.000 0.0% 7.306 7.306 0.000 0.0%5.358 5.358 0.000 0.0% 5.358 5.358 0.000 0.0%
10.337 10.336 0.000 0.0% 10.337 10.336 0.000 0.0%5.947 5.945 -0.002 0.0% 5.947 5.945 -0.002 0.0%7.839 7.840 0.001 0.0% 7.839 7.840 0.001 0.0%6.050 6.050 0.000 0.0% 6.050 6.050 0.000 0.0%7.121 7.121 0.000 0.0% 7.121 7.121 0.000 0.0%3.882 3.880 -0.001 0.0% 3.882 3.880 -0.001 0.0%9.929 9.930 0.000 0.0% 9.929 9.930 0.000 0.0%
11.771 11.769 -0.003 0.0% 11.771 11.769 -0.003 0.0%6.299 6.299 0.000 0.0% 6.299 6.299 0.000 0.0%7.323 7.323 0.000 0.0% 7.323 7.323 0.000 0.0%6.679 6.676 -0.002 0.0% 6.679 6.676 -0.002 0.0%
26
Local Authority
HERTFORDSHIREBroxbourneDacorumEast HertfordshireHertsmereNorth HertfordshireSt AlbansStevenageThree RiversWatfordWelwyn Hatfield
KENTAshfordCanterburyDartfordDoverGraveshamMaidstoneSevenoaksShepwaySwaleThanetTonbridge and MallingTunbridge Wells
LANCASHIREBurnleyChorleyFyldeHyndburnLancasterPendlePrestonRibble ValleyRossendaleSouth RibbleWest LancashireWyre
LEICESTERSHIREBlabyCharnwoodHarboroughHinckley and BosworthMeltonNorth West LeicestershireOadby and Wigston
LINCOLNSHIREBostonEast LindseyLincolnNorth KestevenSouth HollandSouth KestevenWest Lindsey
NORFOLKBrecklandBroadlandGreat YarmouthKing's Lynn and West NorfolkNorth NorfolkNorwichSouth Norfolk
2010-11 Settlement
(ie authorities
as at 1 April 2008)
2010-11 Indicative Allocation
(ie authorities
as at 1 April 2009)
2010-11 Settlement
(ie authorities
as at 1 April 2008)
2010-11 Indicative Allocation
(ie authorities
as at 1 April 2009)
(£ million) (£ million) (£ million) (%) (£ million) (£ million) (£ million) (%)
Formula Grant After Floor DampingDifference from 2010-11
Settlement
Formula Grant Before Floor DampingDifference from 2010-11
Settlement
7.022 7.019 -0.002 0.0% 7.022 7.019 -0.002 0.0%9.506 9.504 -0.002 0.0% 9.506 9.504 -0.002 0.0%8.118 8.115 -0.004 0.0% 8.118 8.115 -0.004 0.0%6.783 6.780 -0.003 0.0% 6.783 6.780 -0.003 0.0%8.268 8.267 0.000 0.0% 8.268 8.267 0.000 0.0%7.044 7.040 -0.004 -0.1% 7.044 7.040 -0.004 -0.1%7.636 7.636 0.000 0.0% 7.636 7.636 0.000 0.0%5.101 5.099 -0.002 0.0% 5.101 5.099 -0.002 0.0%7.250 7.249 -0.002 0.0% 7.250 7.249 -0.002 0.0%8.229 8.228 -0.002 0.0% 8.229 8.228 -0.002 0.0%
8.568 8.567 0.000 0.0% 8.568 8.567 0.000 0.0%13.587 13.590 0.003 0.0% 13.587 13.590 0.003 0.0%7.566 7.565 -0.001 0.0% 7.566 7.565 -0.001 0.0%9.892 9.893 0.000 0.0% 9.892 9.893 0.000 0.0%8.529 8.529 0.000 0.0% 8.529 8.529 0.000 0.0%9.028 9.026 -0.002 0.0% 9.028 9.026 -0.002 0.0%6.121 6.118 -0.003 0.0% 6.121 6.118 -0.003 0.0%
10.052 10.051 -0.001 0.0% 10.052 10.051 -0.001 0.0%12.234 12.234 0.001 0.0% 12.234 12.234 0.001 0.0%13.421 13.421 0.000 0.0% 13.421 13.421 0.000 0.0%6.530 6.528 -0.002 0.0% 6.530 6.528 -0.002 0.0%6.550 6.548 -0.003 0.0% 6.550 6.548 -0.003 0.0%
11.814 11.815 0.002 0.0% 11.814 11.815 0.002 0.0%8.607 8.609 0.002 0.0% 8.607 8.609 0.002 0.0%6.012 6.012 0.000 0.0% 6.012 6.012 0.000 0.0%
10.266 10.269 0.002 0.0% 10.266 10.269 0.002 0.0%16.794 16.798 0.004 0.0% 16.794 16.798 0.004 0.0%11.196 11.198 0.002 0.0% 11.196 11.198 0.002 0.0%15.777 15.780 0.003 0.0% 15.777 15.780 0.003 0.0%4.313 4.314 0.000 0.0% 4.313 4.314 0.000 0.0%6.220 6.221 0.001 0.0% 6.220 6.221 0.001 0.0%7.579 7.581 0.002 0.0% 7.579 7.581 0.002 0.0%9.571 9.573 0.002 0.0% 9.571 9.573 0.002 0.0%
10.789 10.790 0.002 0.0% 10.789 10.790 0.002 0.0%
6.563 6.565 0.003 0.0% 6.563 6.565 0.003 0.0%12.739 12.742 0.003 0.0% 12.739 12.742 0.003 0.0%5.612 5.613 0.000 0.0% 5.612 5.613 0.000 0.0%7.557 7.558 0.002 0.0% 7.557 7.558 0.002 0.0%3.988 3.988 0.000 0.0% 3.988 3.988 0.000 0.0%7.276 7.278 0.002 0.0% 7.276 7.278 0.002 0.0%4.698 4.700 0.002 0.0% 4.698 4.700 0.002 0.0%
7.437 7.437 0.001 0.0% 7.437 7.437 0.001 0.0%17.921 17.922 0.002 0.0% 17.921 17.922 0.002 0.0%10.337 10.339 0.002 0.0% 10.337 10.339 0.002 0.0%8.976 8.978 0.003 0.0% 8.976 8.978 0.003 0.0%9.283 9.284 0.001 0.0% 9.283 9.284 0.001 0.0%
10.246 10.247 0.002 0.0% 10.246 10.247 0.002 0.0%8.402 8.403 0.001 0.0% 8.402 8.403 0.001 0.0%
11.579 11.582 0.003 0.0% 11.579 11.582 0.003 0.0%8.692 8.694 0.002 0.0% 8.692 8.694 0.002 0.0%
10.941 10.943 0.001 0.0% 10.941 10.943 0.001 0.0%15.757 15.758 0.001 0.0% 15.757 15.758 0.001 0.0%9.132 9.131 -0.001 0.0% 9.132 9.131 -0.001 0.0%
16.043 16.045 0.002 0.0% 16.043 16.045 0.002 0.0%8.559 8.560 0.001 0.0% 8.559 8.560 0.001 0.0%
27

Local Authority
NORTH YORKSHIRECravenHambletonHarrogateRichmondshireRyedaleScarboroughSelby
NORTHAMPTONSHIRECorbyDaventryEast NorthamptonshireKetteringNorthamptonSouth NorthamptonshireWellingborough
NOTTINGHAMSHIREAshfieldBassetlawBroxtoweGedlingMansfieldNewark and SherwoodRushcliffe
OXFORDSHIRECherwellOxfordSouth OxfordshireVale of White HorseWest Oxfordshire
SOMERSETMendipSedgemoorSouth SomersetTaunton DeaneWest Somerset
STAFFORDSHIRECannock ChaseEast StaffordshireLichfieldNewcastle-under-LymeSouth StaffordshireStaffordStaffordshire MoorlandsTamworth
SUFFOLKBaberghForest HeathIpswichMid SuffolkSt EdmundsburySuffolk CoastalWaveney
2010-11 Settlement
(ie authorities
as at 1 April 2008)
2010-11 Indicative Allocation
(ie authorities
as at 1 April 2009)
2010-11 Settlement
(ie authorities
as at 1 April 2008)
2010-11 Indicative Allocation
(ie authorities
as at 1 April 2009)
(£ million) (£ million) (£ million) (%) (£ million) (£ million) (£ million) (%)
Formula Grant After Floor DampingDifference from 2010-11
Settlement
Formula Grant Before Floor DampingDifference from 2010-11
Settlement
4.272 4.272 -0.001 0.0% 4.272 4.272 -0.001 0.0%5.917 5.916 -0.001 0.0% 5.917 5.916 -0.001 0.0%
11.488 11.488 -0.001 0.0% 11.488 11.488 -0.001 0.0%4.402 4.403 0.001 0.0% 4.402 4.403 0.001 0.0%4.674 4.674 0.000 0.0% 4.674 4.674 0.000 0.0%
12.621 12.620 -0.001 0.0% 12.621 12.620 -0.001 0.0%6.836 6.836 0.000 0.0% 6.836 6.836 0.000 0.0%
5.641 5.642 0.001 0.0% 5.641 5.642 0.001 0.0%6.365 6.365 0.001 0.0% 6.365 6.365 0.001 0.0%6.862 6.863 0.002 0.0% 6.862 6.863 0.002 0.0%7.404 7.405 0.001 0.0% 7.404 7.405 0.001 0.0%
18.856 18.859 0.002 0.0% 18.856 18.859 0.002 0.0%6.056 6.057 0.001 0.0% 6.056 6.057 0.001 0.0%7.104 7.106 0.002 0.0% 7.104 7.106 0.002 0.0%
11.645 11.649 0.004 0.0% 11.645 11.649 0.004 0.0%11.425 11.428 0.003 0.0% 11.425 11.428 0.003 0.0%9.077 9.081 0.004 0.0% 9.077 9.081 0.004 0.0%9.392 9.394 0.002 0.0% 9.392 9.394 0.002 0.0%
10.301 10.303 0.002 0.0% 10.301 10.303 0.002 0.0%10.513 10.514 0.002 0.0% 10.513 10.514 0.002 0.0%7.341 7.342 0.001 0.0% 7.341 7.342 0.001 0.0%
11.237 11.239 0.002 0.0% 11.237 11.239 0.002 0.0%16.922 16.926 0.004 0.0% 16.922 16.926 0.004 0.0%7.760 7.757 -0.003 0.0% 7.760 7.757 -0.003 0.0%7.229 7.228 -0.001 0.0% 7.229 7.228 -0.001 0.0%6.112 6.110 -0.002 0.0% 6.112 6.110 -0.002 0.0%
8.509 8.510 0.001 0.0% 8.509 8.510 0.001 0.0%10.263 10.264 0.001 0.0% 10.263 10.264 0.001 0.0%11.249 11.250 0.000 0.0% 11.249 11.250 0.000 0.0%8.917 8.918 0.001 0.0% 8.917 8.918 0.001 0.0%3.310 3.309 -0.001 0.0% 3.310 3.309 -0.001 0.0%
8.581 8.584 0.003 0.0% 8.581 8.584 0.003 0.0%9.579 9.580 0.002 0.0% 9.579 9.580 0.002 0.0%6.106 6.106 -0.001 0.0% 6.106 6.106 -0.001 0.0%
11.277 11.281 0.004 0.0% 11.277 11.281 0.004 0.0%7.241 7.241 0.000 0.0% 7.241 7.241 0.000 0.0%8.770 8.771 0.001 0.0% 8.770 8.771 0.001 0.0%7.592 7.593 0.000 0.0% 7.592 7.593 0.000 0.0%6.900 6.902 0.002 0.0% 6.900 6.902 0.002 0.0%
6.359 6.359 0.000 0.0% 6.359 6.359 0.000 0.0%5.538 5.542 0.003 0.1% 5.538 5.542 0.003 0.1%
11.942 11.944 0.001 0.0% 11.942 11.944 0.001 0.0%6.244 6.243 -0.001 0.0% 6.244 6.243 -0.001 0.0%7.126 7.126 0.000 0.0% 7.126 7.126 0.000 0.0%8.426 8.425 -0.001 0.0% 8.426 8.425 -0.001 0.0%
12.006 12.008 0.002 0.0% 12.006 12.008 0.002 0.0%
28

Local Authority
SURREYElmbridgeEpsom and EwellGuildfordMole ValleyReigate and BansteadRunnymedeSpelthorneSurrey HeathTandridgeWaverleyWoking
WARWICKSHIRENorth WarwickshireNuneaton and BedworthRugbyStratford-on-AvonWarwick
WEST SUSSEXAdurArunChichesterCrawleyHorshamMid SussexWorthing
WORCESTERSHIREBromsgroveMalvern HillsRedditchWorcesterWychavonWyre Forest
2010-11 Settlement
(ie authorities
as at 1 April 2008)
2010-11 Indicative Allocation
(ie authorities
as at 1 April 2009)
2010-11 Settlement
(ie authorities
as at 1 April 2008)
2010-11 Indicative Allocation
(ie authorities
as at 1 April 2009)
(£ million) (£ million) (£ million) (%) (£ million) (£ million) (£ million) (%)
Formula Grant After Floor DampingDifference from 2010-11
Settlement
Formula Grant Before Floor DampingDifference from 2010-11
Settlement
6.524 6.519 -0.005 -0.1% 6.524 6.519 -0.005 -0.1%4.006 4.004 -0.002 -0.1% 4.006 4.004 -0.002 -0.1%8.613 8.610 -0.003 0.0% 8.613 8.610 -0.003 0.0%3.295 3.291 -0.005 -0.1% 3.295 3.291 -0.005 -0.1%6.886 6.882 -0.004 -0.1% 6.886 6.882 -0.004 -0.1%5.772 5.771 -0.002 0.0% 5.772 5.771 -0.002 0.0%5.669 5.666 -0.003 -0.1% 5.669 5.666 -0.003 -0.1%4.659 4.656 -0.003 -0.1% 4.659 4.656 -0.003 -0.1%4.004 4.001 -0.003 -0.1% 4.004 4.001 -0.003 -0.1%5.434 5.429 -0.004 -0.1% 5.434 5.429 -0.004 -0.1%5.809 5.806 -0.003 -0.1% 5.809 5.806 -0.003 -0.1%
5.502 5.503 0.001 0.0% 5.502 5.503 0.001 0.0%11.361 11.363 0.003 0.0% 11.361 11.363 0.003 0.0%6.586 6.585 -0.001 0.0% 6.586 6.585 -0.001 0.0%6.880 6.877 -0.003 0.0% 6.880 6.877 -0.003 0.0%
10.468 10.467 0.000 0.0% 10.468 10.467 0.000 0.0%
5.038 5.038 0.000 0.0% 5.038 5.038 0.000 0.0%10.453 10.452 -0.001 0.0% 10.453 10.452 -0.001 0.0%5.937 5.933 -0.004 -0.1% 5.937 5.933 -0.004 -0.1%
10.504 10.504 0.000 0.0% 10.504 10.504 0.000 0.0%6.044 6.042 -0.003 0.0% 6.044 6.042 -0.003 0.0%5.307 5.304 -0.003 -0.1% 5.307 5.304 -0.003 -0.1%7.929 7.929 0.000 0.0% 7.929 7.929 0.000 0.0%
5.153 5.153 0.000 0.0% 5.153 5.153 0.000 0.0%5.214 5.213 -0.001 0.0% 5.214 5.213 -0.001 0.0%6.426 6.427 0.001 0.0% 6.426 6.427 0.001 0.0%7.849 7.850 0.001 0.0% 7.849 7.850 0.001 0.0%8.039 8.039 0.000 0.0% 8.039 8.039 0.000 0.0%8.131 8.132 0.001 0.0% 8.131 8.132 0.001 0.0%
29

Local Authority
SHIRE POLICE AUTHORITIES
Avon & Somerset PoliceBedfordshire PoliceCambridgeshire PoliceCheshire PoliceCleveland Police
Cumbria PoliceDerbyshire PoliceDevon & Cornwall PoliceDorset PoliceDurham Police
Essex PoliceGloucestershire PoliceHampshire PoliceHertfordshire PoliceHumberside Police
Kent PoliceLancashire PoliceLeicestershire PoliceLincolnshire PoliceNorfolk Police
North Yorkshire PoliceNorthamptonshire PoliceNottinghamshire PoliceStaffordshire PoliceSuffolk Police
Surrey PoliceSussex PoliceThames Valley PoliceWarwickshire PoliceWest Mercia Police
Wiltshire Police
2010-11 Settlement
(ie authorities
as at 1 April 2008)
2010-11 Indicative Allocation
(ie authorities
as at 1 April 2009)
2010-11 Settlement
(ie authorities
as at 1 April 2008)
2010-11 Indicative Allocation
(ie authorities
as at 1 April 2009)
(£ million) (£ million) (£ million) (%) (£ million) (£ million) (£ million) (%)
Formula Grant After Floor DampingDifference from 2010-11
Settlement
Formula Grant Before Floor DampingDifference from 2010-11
Settlement
197.538 197.552 0.014 0.0% 197.538 197.552 0.014 0.0%76.640 76.647 0.006 0.0% 76.640 76.647 0.006 0.0%86.206 86.216 0.010 0.0% 86.206 86.216 0.010 0.0%
114.056 114.062 0.007 0.0% 114.056 114.062 0.007 0.0%98.987 98.988 0.002 0.0% 98.987 98.988 0.002 0.0%
56.051 56.057 0.006 0.0% 56.051 56.057 0.006 0.0%120.644 120.660 0.016 0.0% 120.644 120.660 0.016 0.0%191.637 191.654 0.018 0.0% 191.637 191.654 0.018 0.0%64.309 64.312 0.003 0.0% 64.309 64.312 0.003 0.0%86.954 86.959 0.005 0.0% 86.954 86.959 0.005 0.0%
187.258 187.268 0.011 0.0% 187.258 187.268 0.011 0.0%58.506 58.511 0.006 0.0% 58.506 58.511 0.006 0.0%
214.958 214.970 0.012 0.0% 214.958 214.970 0.012 0.0%128.916 128.911 -0.005 0.0% 128.916 128.911 -0.005 0.0%132.899 132.912 0.012 0.0% 132.899 132.912 0.012 0.0%
200.177 200.185 0.007 0.0% 200.177 200.185 0.007 0.0%212.288 212.304 0.016 0.0% 212.288 212.304 0.016 0.0%124.187 124.200 0.013 0.0% 124.187 124.200 0.013 0.0%69.001 69.018 0.017 0.0% 69.001 69.018 0.017 0.0%88.465 88.480 0.014 0.0% 88.465 88.480 0.014 0.0%
73.042 73.053 0.012 0.0% 73.042 73.053 0.012 0.0%78.347 78.357 0.009 0.0% 78.347 78.357 0.009 0.0%
152.686 152.700 0.013 0.0% 152.686 152.700 0.013 0.0%125.079 125.094 0.015 0.0% 125.079 125.094 0.015 0.0%71.035 71.046 0.011 0.0% 71.035 71.046 0.011 0.0%
101.308 101.301 -0.007 0.0% 101.308 101.301 -0.007 0.0%167.072 167.076 0.004 0.0% 167.072 167.076 0.004 0.0%248.518 248.518 0.000 0.0% 248.518 248.518 0.000 0.0%56.134 56.139 0.004 0.0% 56.134 56.139 0.004 0.0%
114.304 114.322 0.017 0.0% 114.304 114.322 0.017 0.0%
64.088 64.093 0.005 0.0% 64.088 64.093 0.005 0.0%
30
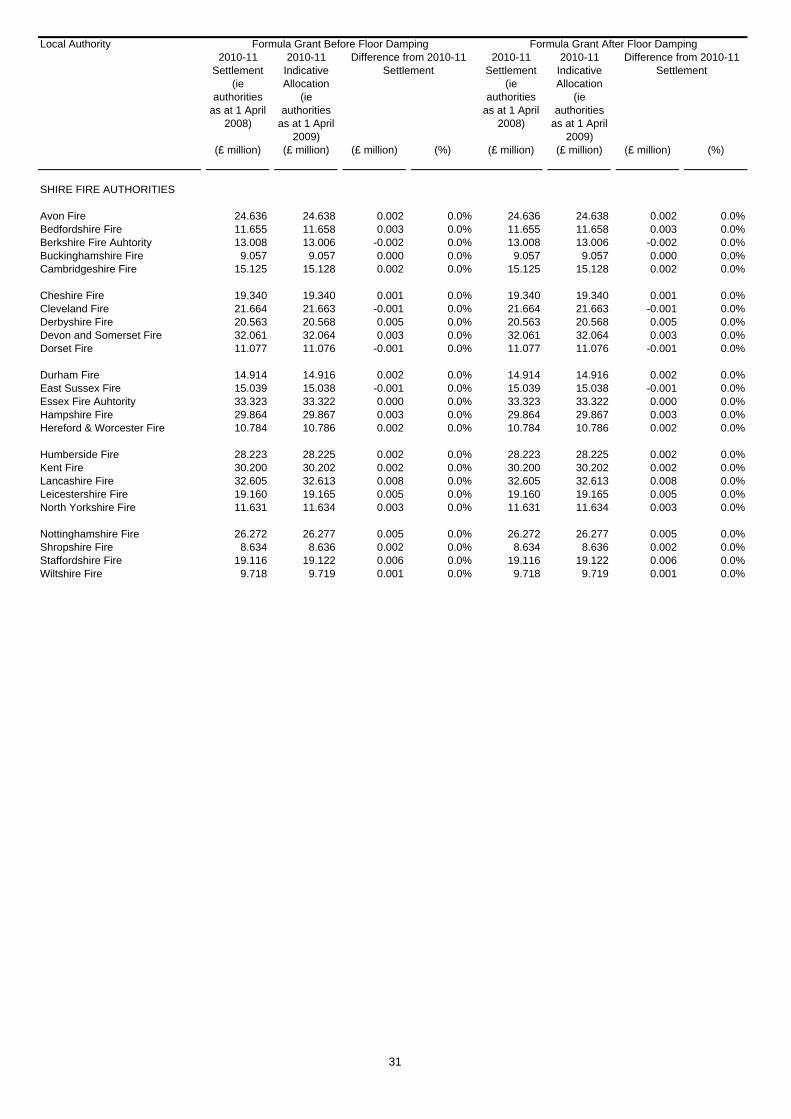
Local Authority
SHIRE FIRE AUTHORITIES
Avon FireBedfordshire FireBerkshire Fire AuhtorityBuckinghamshire FireCambridgeshire Fire
Cheshire FireCleveland FireDerbyshire FireDevon and Somerset FireDorset Fire
Durham FireEast Sussex FireEssex Fire AuhtorityHampshire FireHereford & Worcester Fire
Humberside FireKent FireLancashire FireLeicestershire FireNorth Yorkshire Fire
Nottinghamshire FireShropshire FireStaffordshire FireWiltshire Fire
2010-11 Settlement
(ie authorities
as at 1 April 2008)
2010-11 Indicative Allocation
(ie authorities
as at 1 April 2009)
2010-11 Settlement
(ie authorities
as at 1 April 2008)
2010-11 Indicative Allocation
(ie authorities
as at 1 April 2009)
(£ million) (£ million) (£ million) (%) (£ million) (£ million) (£ million) (%)
Formula Grant After Floor DampingDifference from 2010-11
Settlement
Formula Grant Before Floor DampingDifference from 2010-11
Settlement
24.636 24.638 0.002 0.0% 24.636 24.638 0.002 0.0%11.655 11.658 0.003 0.0% 11.655 11.658 0.003 0.0%13.008 13.006 -0.002 0.0% 13.008 13.006 -0.002 0.0%9.057 9.057 0.000 0.0% 9.057 9.057 0.000 0.0%
15.125 15.128 0.002 0.0% 15.125 15.128 0.002 0.0%
19.340 19.340 0.001 0.0% 19.340 19.340 0.001 0.0%21.664 21.663 -0.001 0.0% 21.664 21.663 -0.001 0.0%20.563 20.568 0.005 0.0% 20.563 20.568 0.005 0.0%32.061 32.064 0.003 0.0% 32.061 32.064 0.003 0.0%11.077 11.076 -0.001 0.0% 11.077 11.076 -0.001 0.0%
14.914 14.916 0.002 0.0% 14.914 14.916 0.002 0.0%15.039 15.038 -0.001 0.0% 15.039 15.038 -0.001 0.0%33.323 33.322 0.000 0.0% 33.323 33.322 0.000 0.0%29.864 29.867 0.003 0.0% 29.864 29.867 0.003 0.0%10.784 10.786 0.002 0.0% 10.784 10.786 0.002 0.0%
28.223 28.225 0.002 0.0% 28.223 28.225 0.002 0.0%30.200 30.202 0.002 0.0% 30.200 30.202 0.002 0.0%32.605 32.613 0.008 0.0% 32.605 32.613 0.008 0.0%19.160 19.165 0.005 0.0% 19.160 19.165 0.005 0.0%11.631 11.634 0.003 0.0% 11.631 11.634 0.003 0.0%
26.272 26.277 0.005 0.0% 26.272 26.277 0.005 0.0%8.634 8.636 0.002 0.0% 8.634 8.636 0.002 0.0%
19.116 19.122 0.006 0.0% 19.116 19.122 0.006 0.0%9.718 9.719 0.001 0.0% 9.718 9.719 0.001 0.0%
31
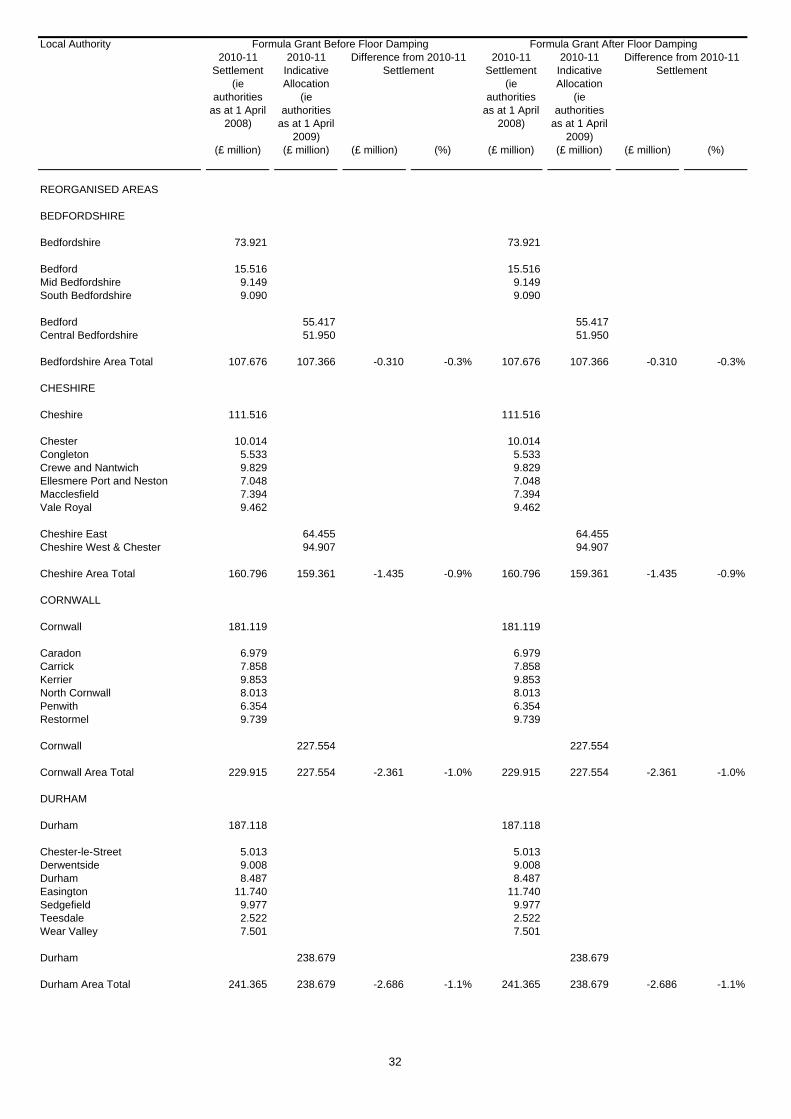
Local Authority
REORGANISED AREAS
BEDFORDSHIRE
Bedfordshire
BedfordMid BedfordshireSouth Bedfordshire
BedfordCentral Bedfordshire
Bedfordshire Area Total
CHESHIRE
Cheshire
ChesterCongletonCrewe and NantwichEllesmere Port and NestonMacclesfieldVale Royal
Cheshire EastCheshire West & Chester
Cheshire Area Total
CORNWALL
Cornwall
CaradonCarrickKerrierNorth CornwallPenwithRestormel
Cornwall
Cornwall Area Total
DURHAM
Durham
Chester-le-StreetDerwentsideDurhamEasingtonSedgefieldTeesdaleWear Valley
Durham
Durham Area Total
2010-11 Settlement
(ie authorities
as at 1 April 2008)
2010-11 Indicative Allocation
(ie authorities
as at 1 April 2009)
2010-11 Settlement
(ie authorities
as at 1 April 2008)
2010-11 Indicative Allocation
(ie authorities
as at 1 April 2009)
(£ million) (£ million) (£ million) (%) (£ million) (£ million) (£ million) (%)
Formula Grant After Floor DampingDifference from 2010-11
Settlement
Formula Grant Before Floor DampingDifference from 2010-11
Settlement
73.921 73.921
15.516 15.5169.149 9.1499.090 9.090
55.417 55.41751.950 51.950
107.676 107.366 -0.310 -0.3% 107.676 107.366 -0.310 -0.3%
111.516 111.516
10.014 10.0145.533 5.5339.829 9.8297.048 7.0487.394 7.3949.462 9.462
64.455 64.45594.907 94.907
160.796 159.361 -1.435 -0.9% 160.796 159.361 -1.435 -0.9%
181.119 181.119
6.979 6.9797.858 7.8589.853 9.8538.013 8.0136.354 6.3549.739 9.739
227.554 227.554
229.915 227.554 -2.361 -1.0% 229.915 227.554 -2.361 -1.0%
187.118 187.118
5.013 5.0139.008 9.0088.487 8.487
11.740 11.7409.977 9.9772.522 2.5227.501 7.501
238.679 238.679
241.365 238.679 -2.686 -1.1% 241.365 238.679 -2.686 -1.1%
32

Local Authority
NORTHUMBERLAND
Northumberland
AlnwickBerwick-upon-TweedBlyth ValleyCastle MorpethTynedaleWansbeck
Northumberland
Northumberland Area Total
SHROPSHIRE
Shropshire
BridgnorthNorth ShropshireOswestryShrewsbury and AtchamSouth Shropshire
Shropshire
Shropshire Area Total
WILTSHIRE
Wiltshire
KennetNorth WiltshireSalisburyWest Wiltshire
Wiltshire
Wiltshire Area Total
2010-11 Settlement
(ie authorities
as at 1 April 2008)
2010-11 Indicative Allocation
(ie authorities
as at 1 April 2009)
2010-11 Settlement
(ie authorities
as at 1 April 2008)
2010-11 Indicative Allocation
(ie authorities
as at 1 April 2009)
(£ million) (£ million) (£ million) (%) (£ million) (£ million) (£ million) (%)
Formula Grant After Floor DampingDifference from 2010-11
Settlement
Formula Grant Before Floor DampingDifference from 2010-11
Settlement
105.281 105.281
2.862 2.8622.838 2.8388.911 8.9113.426 3.4264.702 4.7027.110 7.110
133.096 133.096
135.130 133.096 -2.035 -1.5% 135.130 133.096 -2.035 -1.5%
74.693 74.693
3.981 3.9815.350 5.3503.741 3.7417.347 7.3473.929 3.929
97.405 97.405
99.040 97.405 -1.635 -1.7% 99.040 97.405 -1.635 -1.7%
72.109 72.109
5.318 5.3188.222 8.2228.138 8.1389.611 9.611
102.089 102.089
103.398 102.089 -1.309 -1.3% 103.398 102.089 -1.309 -1.3%
33
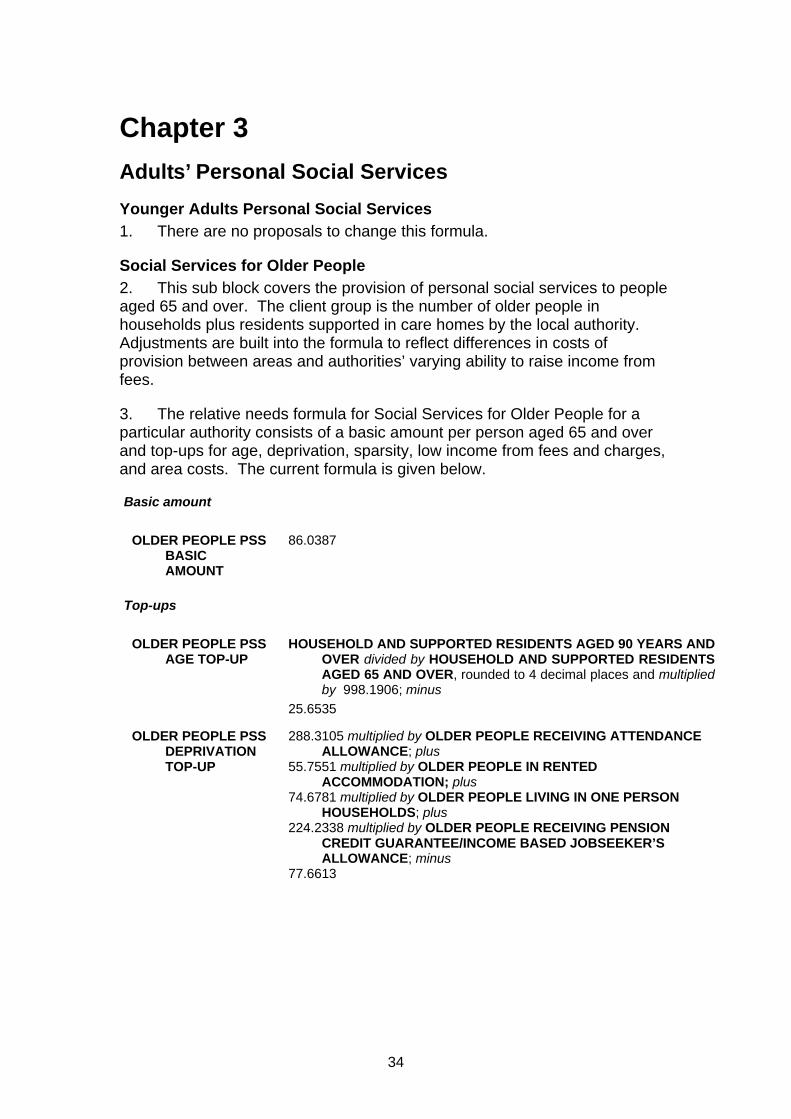
34
Chapter 3 Adults’ Personal Social Services Younger Adults Personal Social Services 1. There are no proposals to change this formula.
Social Services for Older People 2. This sub block covers the provision of personal social services to people aged 65 and over. The client group is the number of older people in households plus residents supported in care homes by the local authority. Adjustments are built into the formula to reflect differences in costs of provision between areas and authorities’ varying ability to raise income from fees.
3. The relative needs formula for Social Services for Older People for a particular authority consists of a basic amount per person aged 65 and over and top-ups for age, deprivation, sparsity, low income from fees and charges, and area costs. The current formula is given below.
Basic amount
OLDER PEOPLE PSS
BASIC AMOUNT
86.0387
Top-ups
OLDER PEOPLE PSS
AGE TOP-UP
HOUSEHOLD AND SUPPORTED RESIDENTS AGED 90 YEARS AND
OVER divided by HOUSEHOLD AND SUPPORTED RESIDENTS AGED 65 AND OVER, rounded to 4 decimal places and multiplied by 998.1906; minus
25.6535 OLDER PEOPLE PSS
DEPRIVATION TOP-UP
288.3105 multiplied by OLDER PEOPLE RECEIVING ATTENDANCE
ALLOWANCE; plus 55.7551 multiplied by OLDER PEOPLE IN RENTED
ACCOMMODATION; plus 74.6781 multiplied by OLDER PEOPLE LIVING IN ONE PERSON
HOUSEHOLDS; plus 224.2338 multiplied by OLDER PEOPLE RECEIVING PENSION
CREDIT GUARANTEE/INCOME BASED JOBSEEKER’S ALLOWANCE; minus
77.6613

35
The full formula used to calculate the Social Services for Older People element is:
Social Services for Older People
(a) PROJECTED HOUSEHOLD AND SUPORTED RESIDENTS AGED 65 YEARS AND OVER multiplied by the result of:
OLDER PEOPLE PSS BASIC AMOUNT; plus OLDER PEOPLE PSS AGE TOP-UP; plus OLDER PEOPLE PSS DEPRIVATION TOP-UP;
(b) The result of (a) is multiplied by LOW INCOME ADJUSTMENT;
(c) The result of (b) is multiplied by SPARSITY ADJUSTMENT FOR PEOPLE AGED 65 AND OVER;
(d) The result of (c) is multiplied by AREA COST ADJUSTMENT FOR OLDER PEOPLE’S PSS;
(e) The result of (d) is then multiplied by the scaling factor given in Annex F for the Social Services for Older People sub-block.
(f) The result of (e) is then divided by 10,000,000,000.
The Current Formula
4. The current formula was introduced in 2006-07. The main needs formula is based on a 2005 survey of social services clients and contemporaneous research. It determines the basic amount, and the age and deprivation top ups in this formula. We have no plans to update it for 2011-12. Equally, the size of the sparsity top up is determined by judgement and calculated using 2001 Census data. We have received no new evidence on the cost of delivering home care services (the primary determinant of sparsity costs) during this review.
Option OPPSS1; The Low Income Adjustment
5. The low income adjustment (LIA) is the top-up in the older peoples’ social services formula which takes account of local authorities’ differing ability to raise income from fees and charges.
6. The current LIA was derived using local authority income and expenditure data taken from the 2005-06 PSS EX1 and data. We would like to update the LIA, so that it is based on data from the latest 2008-09 PSS EX1.
The updated LIA is below: The sum of:
i) 0.1289 minus ii) 0.1289 multiplied by OLDER PEOPLE ON INCOME SUPPORT
/ INCOME BASED JOBSEEKERS ALLOWANCE / GUARANTEE ELEMENT OF PENSION CREDIT plus

36
iii) 0.110911925 The sum of the above is then divided by the AREA COST ADJUSTMENT FOR OLDER PEOPLES PSS and subtracted from 1. The indicator is the result of the above calculation divided by 0.776972182 and calculated to 4 decimal places.
7. The new formula is given below:
Basic amount
OLDER PEOPLE PSS
BASIC AMOUNT
85.6973
Top-ups
OLDER PEOPLE PSS
AGE TOP-UP
HOUSEHOLD AND SUPPORTED RESIDENTS AGED 90 YEARS AND
OVER divided by HOUSEHOLD AND SUPPORTED RESIDENTS AGED 65 AND OVER, rounded to 4 decimal places and multiplied by 994.2302; minus
25.5517 OLDER PEOPLE PSS
DEPRIVATION TOP-UP
287.1666 multiplied by OLDER PEOPLE RECEIVING ATTENDANCE
ALLOWANCE; plus 55.5338 multiplied by OLDER PEOPLE IN RENTED
ACCOMMODATION; plus 74.3818 multiplied by OLDER PEOPLE LIVING IN ONE PERSON
HOUSEHOLDS; plus 223.3441 multiplied by OLDER PEOPLE RECEIVING PENSION
CREDIT GUARANTEE/INCOME BASED JOBSEEKER’S ALLOWANCE; minus
77.3531
Question
Question 1: Do you agree that we should update the Low Income Adjustment? (OPPSS1)

Formula Grant Before Floor DampingLocal Authority
(£ million) (£ million) (%)
England 28,995.5 0.0 0.0%
London area 6,153.4 1.2 0.0%Metropolitan areas 8,340.7 3.2 0.0%Shire areas 14,499.1 -4.5 0.0%Isles of Scilly 2.3 0.0 0.0%
Inner London boroughs incl. City 2,025.0 1.2 0.1%Outer London boroughs 1,873.1 0.6 0.0%London boroughs 3,898.1 1.8 0.0%GLA - all functions 2,255.3 -0.6 0.0%
Metropolitan districts 5,904.0 3.4 0.1%Metropolitan fire authorities 335.8 0.0 0.0%Metropolitan police authorities 2,100.9 -0.1 0.0%
Shire unitaries with fire 425.6 -0.2 -0.1%Shire unitaries without fire 4,099.3 0.0 0.0%Shire counties with fire 1,589.0 -1.9 -0.1%Shire counties without fire 2,501.9 -3.0 -0.1%Shire districts 1,654.0 0.0 0.0%Combined fire authorities 467.7 0.1 0.0%Shire police authorities 3,761.6 0.6 0.0%
GO REGIONAL SUMMARY
South West GOR 2,267.3 -1.2 -0.1%South East GOR 2,957.0 -1.6 -0.1%London GOR 6,153.4 1.2 0.0%Eastern GOR 2,437.8 -0.9 0.0%East Midlands GOR 2,292.2 -0.1 0.0%West Midlands GOR 3,349.9 0.8 0.0%Yorkshire and Humber GOR 3,199.2 0.4 0.0%North East GOR 1,777.2 0.5 0.0%North West GOR 4,561.4 1.0 0.0%
FLOOR DAMPING GROUPS
Education Authorities 18,418.0 0.0 0.0%Police Authorities 7,864.8 0.0 0.0%Fire Authorities 1,056.5 0.0 0.0%Shire Districts 1,654.0 0.0 0.0%
Difference from Indicative Allocation
PSS: Updating the Low Income Adjustment
2010-11 Indicative Allocation Option PSS1
37

Formula Grant Before Floor DampingLocal Authority
(£ million) (£ million) (%)
Difference from Indicative Allocation
2010-11 Indicative Allocation Option PSS1
GREATER LONDON
City of London 91.1 -0.1 -0.1%
Camden 171.0 0.1 0.1%Greenwich 170.1 0.0 0.0%Hackney 201.8 0.2 0.1%Hammersmith and Fulham 94.3 0.0 0.1%Islington 133.8 0.2 0.1%Kensington and Chelsea 95.9 0.0 0.0%
Lambeth 180.3 0.1 0.1%Lewisham 174.9 0.1 0.0%Southwark 210.2 0.1 0.1%Tower Hamlets 224.3 0.3 0.1%Wandsworth 98.6 0.1 0.1%Westminster 178.8 0.0 0.0%
Barking and Dagenham 108.2 0.1 0.1%Barnet 97.9 0.0 0.0%Bexley 64.5 -0.1 -0.1%Brent 157.0 0.1 0.1%Bromley 45.7 -0.1 -0.2%
Croydon 118.4 0.0 0.0%Ealing 129.0 0.1 0.1%Enfield 126.7 0.0 0.0%Haringey 137.6 0.1 0.1%Harrow 66.6 0.0 0.0%
Havering 52.3 0.0 -0.1%Hillingdon 85.6 0.0 0.0%Hounslow 77.3 0.0 0.1%Kingston upon Thames 32.6 0.0 0.0%Merton 61.2 0.0 0.0%
Newham 231.3 0.2 0.1%Redbridge 102.6 0.0 0.0%Richmond upon Thames 9.6 0.0 0.0%Sutton 45.1 0.0 0.0%Waltham Forest 124.0 0.1 0.1%
GLA - all functions 2,255.3 -0.6 0.0%
GLA - police 2,002.3 -0.5 0.0%GLA - fire 253.0 -0.1 0.0%
38

Formula Grant Before Floor DampingLocal Authority
(£ million) (£ million) (%)
Difference from Indicative Allocation
2010-11 Indicative Allocation Option PSS1
GREATER MANCHESTERBolton 132.6 0.1 0.1%Bury 67.5 0.0 0.0%Manchester 346.1 0.4 0.1%Oldham 127.6 0.1 0.0%Rochdale 114.9 0.1 0.1%Salford 131.2 0.1 0.1%Stockport 85.2 0.0 0.0%Tameside 109.5 0.1 0.1%Trafford 67.3 0.0 0.0%Wigan 138.6 0.1 0.0%Greater Manchester Fire 76.1 0.0 0.0%Greater Manchester Police 485.7 0.0 0.0%
MERSEYSIDEKnowsley 114.6 0.1 0.1%Liverpool 318.0 0.4 0.1%Sefton 127.6 0.0 0.0%St Helens 90.9 0.0 0.0%Wirral 165.2 0.0 0.0%Merseyside Fire 46.1 0.0 0.0%Merseyside Police 275.5 0.0 0.0%
SOUTH YORKSHIREBarnsley 114.3 0.0 0.0%Doncaster 149.1 0.0 0.0%Rotherham 130.1 0.0 0.0%Sheffield 280.0 0.2 0.1%South Yorkshire Fire 37.4 0.0 0.0%South Yorkshire Police 209.2 0.0 0.0%
TYNE AND WEARGateshead 102.7 0.1 0.1%Newcastle upon Tyne 157.2 0.1 0.1%North Tyneside 87.4 0.0 0.0%South Tyneside 89.3 0.1 0.1%Sunderland 158.9 0.1 0.1%Tyne and Wear Fire 35.9 0.0 0.0%Northumbria Police 219.9 0.0 0.0%
WEST MIDLANDSBirmingham 698.9 0.6 0.1%Coventry 156.6 0.1 0.1%Dudley 130.4 0.0 0.0%Sandwell 190.3 0.2 0.1%Solihull 49.1 0.0 -0.1%Walsall 142.3 0.1 0.1%Wolverhampton 145.6 0.1 0.1%West Midlands Fire 81.6 0.0 0.0%West Midlands Police 542.2 -0.1 0.0%
WEST YORKSHIREBradford 283.4 0.1 0.0%Calderdale 84.1 0.0 0.0%Kirklees 164.9 0.1 0.0%Leeds 305.9 0.1 0.0%Wakefield 146.7 0.0 0.0%West Yorkshire Fire 58.7 0.0 0.0%West Yorkshire Police 368.2 0.0 0.0%
39

Formula Grant Before Floor DampingLocal Authority
(£ million) (£ million) (%)
Difference from Indicative Allocation
2010-11 Indicative Allocation Option PSS1
ALL PURPOSE AUTHORITIES
Bath & North East Somerset 44.1 0.0 -0.1%Bedford 55.4 0.0 0.0%Blackburn with Darwen 88.5 0.1 0.1%Blackpool 86.9 0.1 0.1%Bournemouth 49.4 0.0 0.0%
Bracknell Forest 22.6 0.0 0.0%Brighton & Hove 89.8 0.0 0.0%Bristol 171.2 0.1 0.0%Central Bedfordshire 51.9 0.0 -0.1%Cheshire East 64.5 -0.1 -0.2%
Cheshire West & Chester 94.9 -0.1 -0.1%Cornwall 227.6 -0.1 0.0%Darlington 40.1 0.0 0.0%Derby 114.5 0.0 0.0%Durham 238.7 0.1 0.0%
East Riding of Yorkshire 109.2 -0.1 -0.1%Halton 65.5 0.0 0.0%Hartlepool 54.0 0.0 0.1%Herefordshire 61.2 -0.1 -0.1%Isle of Wight Council 65.0 0.0 -0.1%
Kingston upon Hull 159.2 0.2 0.1%Leicester 188.4 0.2 0.1%Luton 94.6 0.0 0.0%Medway 89.5 0.0 0.0%Middlesbrough 85.4 0.0 0.0%
Milton Keynes 91.6 0.0 0.0%North East Lincolnshire 76.9 0.0 0.0%North Lincolnshire 66.3 0.0 0.0%North Somerset 54.6 -0.1 -0.1%Northumberland 133.1 -0.1 -0.1%
Nottingham 179.5 0.1 0.1%Peterborough 80.9 0.0 0.0%Plymouth 108.7 0.0 0.0%Poole 25.6 0.0 -0.2%Portsmouth 87.8 0.0 0.0%
Reading 48.0 0.0 0.0%Redcar and Cleveland 71.4 0.0 0.0%Rutland 8.6 0.0 -0.2%Shropshire 97.4 -0.1 -0.1%Slough 52.8 0.0 0.0%
South Gloucestershire 64.0 -0.1 -0.1%Southampton 101.2 0.0 0.0%Southend-on-Sea 62.3 0.0 0.0%Stockton-on-Tees 80.6 0.0 0.0%Stoke-on-Trent 133.5 0.0 0.0%
Swindon 43.7 0.0 0.0%Telford and the Wrekin 76.0 0.0 0.0%Thurrock 62.1 0.0 0.0%Torbay 64.2 0.0 0.0%Warrington 52.7 0.0 0.0%
40

Formula Grant Before Floor DampingLocal Authority
(£ million) (£ million) (%)
Difference from Indicative Allocation
2010-11 Indicative Allocation Option PSS1
West Berkshire 23.1 0.0 -0.1%Wiltshire 102.1 -0.1 -0.1%Windsor and Maidenhead 10.1 0.0 -0.2%Wokingham 8.4 0.0 -0.2%York 45.8 0.0 -0.1%
Isles of Scilly 2.3 0.0 0.0%
41
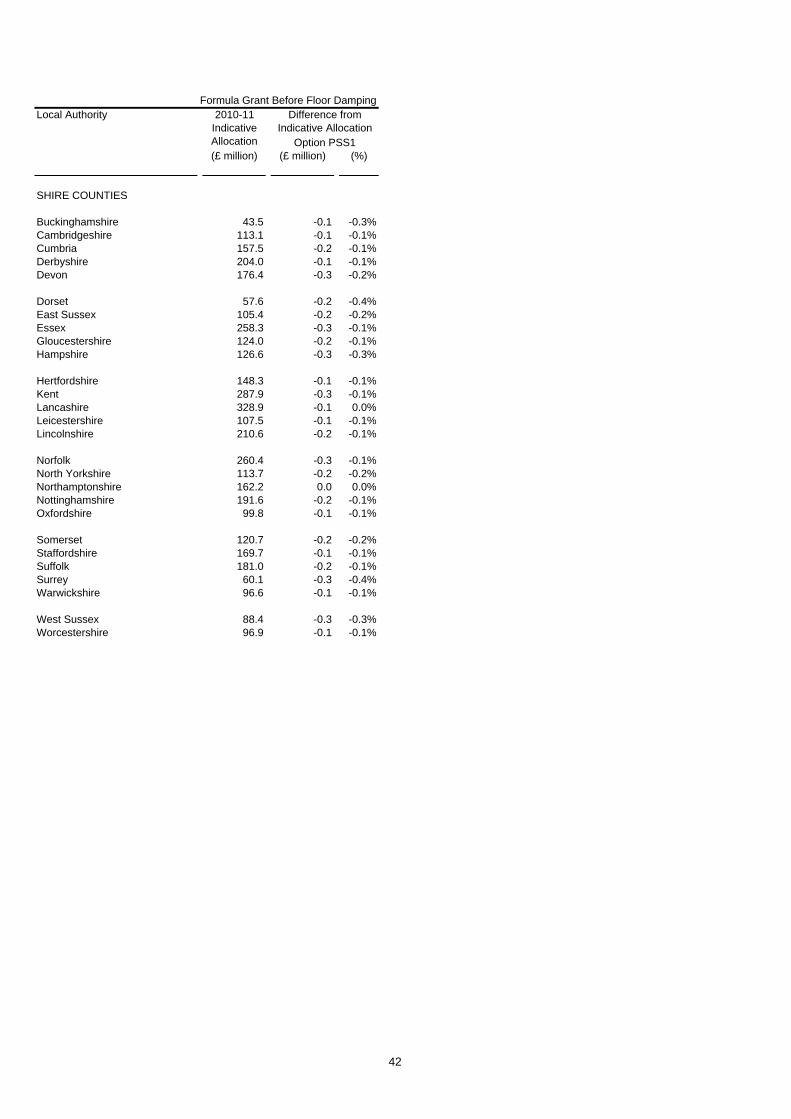
Formula Grant Before Floor DampingLocal Authority
(£ million) (£ million) (%)
Difference from Indicative Allocation
2010-11 Indicative Allocation Option PSS1
SHIRE COUNTIES
Buckinghamshire 43.5 -0.1 -0.3%Cambridgeshire 113.1 -0.1 -0.1%Cumbria 157.5 -0.2 -0.1%Derbyshire 204.0 -0.1 -0.1%Devon 176.4 -0.3 -0.2%
Dorset 57.6 -0.2 -0.4%East Sussex 105.4 -0.2 -0.2%Essex 258.3 -0.3 -0.1%Gloucestershire 124.0 -0.2 -0.1%Hampshire 126.6 -0.3 -0.3%
Hertfordshire 148.3 -0.1 -0.1%Kent 287.9 -0.3 -0.1%Lancashire 328.9 -0.1 0.0%Leicestershire 107.5 -0.1 -0.1%Lincolnshire 210.6 -0.2 -0.1%
Norfolk 260.4 -0.3 -0.1%North Yorkshire 113.7 -0.2 -0.2%Northamptonshire 162.2 0.0 0.0%Nottinghamshire 191.6 -0.2 -0.1%Oxfordshire 99.8 -0.1 -0.1%
Somerset 120.7 -0.2 -0.2%Staffordshire 169.7 -0.1 -0.1%Suffolk 181.0 -0.2 -0.1%Surrey 60.1 -0.3 -0.4%Warwickshire 96.6 -0.1 -0.1%
West Sussex 88.4 -0.3 -0.3%Worcestershire 96.9 -0.1 -0.1%
42

Formula Grant Before Floor DampingLocal Authority
(£ million) (£ million) (%)
Difference from Indicative Allocation
2010-11 Indicative Allocation Option PSS1
BUCKINGHAMSHIREAylesbury Vale 12.1 0.0 0.0%Chiltern 3.2 0.0 -0.1%South Bucks 2.3 0.0 -0.1%Wycombe 9.5 0.0 0.0%
CAMBRIDGESHIRECambridge 12.0 0.0 0.0%East Cambridgeshire 6.8 0.0 0.0%Fenland 9.9 0.0 0.0%Huntingdonshire 13.4 0.0 0.0%South Cambridgeshire 7.9 0.0 0.0%
CUMBRIAAllerdale 10.4 0.0 0.0%Barrow-in-Furness 9.1 0.0 0.0%Carlisle 10.2 0.0 0.0%Copeland 7.2 0.0 0.0%Eden 4.7 0.0 0.0%South Lakeland 6.8 0.0 0.0%
DERBYSHIREAmber Valley 10.0 0.0 0.0%Bolsover 8.0 0.0 0.0%Chesterfield 10.2 0.0 0.0%Derbyshire Dales 4.7 0.0 0.0%Erewash 9.7 0.0 0.0%High Peak 7.2 0.0 0.0%North East Derbyshire 7.9 0.0 0.0%South Derbyshire 7.5 0.0 0.0%
DEVONEast Devon 8.4 0.0 0.0%Exeter 12.1 0.0 0.0%Mid Devon 6.3 0.0 0.0%North Devon 8.5 0.0 0.0%South Hams 5.6 0.0 0.0%Teignbridge 10.1 0.0 0.0%Torridge 6.6 0.0 0.0%West Devon 4.4 0.0 0.0%
DORSETChristchurch 2.9 0.0 0.0%East Dorset 3.8 0.0 0.0%North Dorset 4.7 0.0 0.0%Purbeck 3.3 0.0 0.0%West Dorset 7.9 0.0 0.0%Weymouth and Portland 6.1 0.0 0.0%
EAST SUSSEXEastbourne 10.5 0.0 0.0%Hastings 10.6 0.0 0.0%Lewes 6.6 0.0 0.0%Rother 6.5 0.0 0.0%Wealden 8.4 0.0 0.0%
43
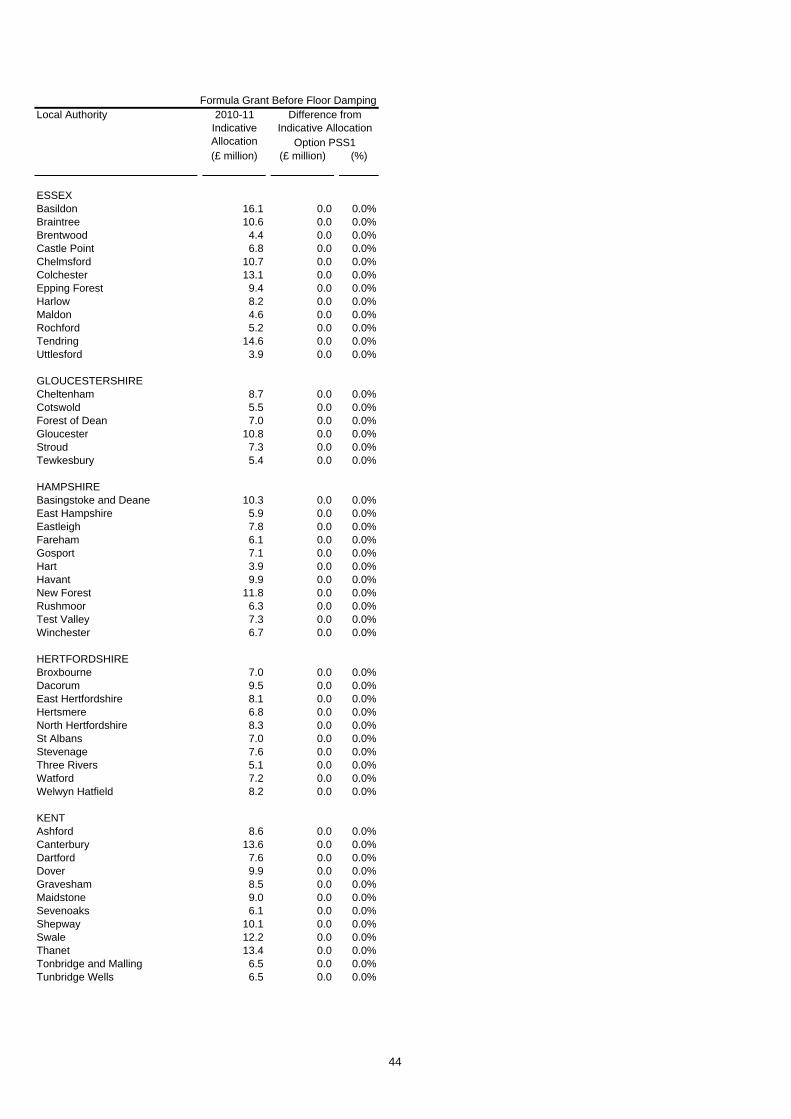
Formula Grant Before Floor DampingLocal Authority
(£ million) (£ million) (%)
Difference from Indicative Allocation
2010-11 Indicative Allocation Option PSS1
ESSEXBasildon 16.1 0.0 0.0%Braintree 10.6 0.0 0.0%Brentwood 4.4 0.0 0.0%Castle Point 6.8 0.0 0.0%Chelmsford 10.7 0.0 0.0%Colchester 13.1 0.0 0.0%Epping Forest 9.4 0.0 0.0%Harlow 8.2 0.0 0.0%Maldon 4.6 0.0 0.0%Rochford 5.2 0.0 0.0%Tendring 14.6 0.0 0.0%Uttlesford 3.9 0.0 0.0%
GLOUCESTERSHIRECheltenham 8.7 0.0 0.0%Cotswold 5.5 0.0 0.0%Forest of Dean 7.0 0.0 0.0%Gloucester 10.8 0.0 0.0%Stroud 7.3 0.0 0.0%Tewkesbury 5.4 0.0 0.0%
HAMPSHIREBasingstoke and Deane 10.3 0.0 0.0%East Hampshire 5.9 0.0 0.0%Eastleigh 7.8 0.0 0.0%Fareham 6.1 0.0 0.0%Gosport 7.1 0.0 0.0%Hart 3.9 0.0 0.0%Havant 9.9 0.0 0.0%New Forest 11.8 0.0 0.0%Rushmoor 6.3 0.0 0.0%Test Valley 7.3 0.0 0.0%Winchester 6.7 0.0 0.0%
HERTFORDSHIREBroxbourne 7.0 0.0 0.0%Dacorum 9.5 0.0 0.0%East Hertfordshire 8.1 0.0 0.0%Hertsmere 6.8 0.0 0.0%North Hertfordshire 8.3 0.0 0.0%St Albans 7.0 0.0 0.0%Stevenage 7.6 0.0 0.0%Three Rivers 5.1 0.0 0.0%Watford 7.2 0.0 0.0%Welwyn Hatfield 8.2 0.0 0.0%
KENTAshford 8.6 0.0 0.0%Canterbury 13.6 0.0 0.0%Dartford 7.6 0.0 0.0%Dover 9.9 0.0 0.0%Gravesham 8.5 0.0 0.0%Maidstone 9.0 0.0 0.0%Sevenoaks 6.1 0.0 0.0%Shepway 10.1 0.0 0.0%Swale 12.2 0.0 0.0%Thanet 13.4 0.0 0.0%Tonbridge and Malling 6.5 0.0 0.0%Tunbridge Wells 6.5 0.0 0.0%
44

Formula Grant Before Floor DampingLocal Authority
(£ million) (£ million) (%)
Difference from Indicative Allocation
2010-11 Indicative Allocation Option PSS1
LANCASHIREBurnley 11.8 0.0 0.0%Chorley 8.6 0.0 0.0%Fylde 6.0 0.0 0.0%Hyndburn 10.3 0.0 0.0%Lancaster 16.8 0.0 0.0%Pendle 11.2 0.0 0.0%Preston 15.8 0.0 0.0%Ribble Valley 4.3 0.0 0.0%Rossendale 6.2 0.0 0.0%South Ribble 7.6 0.0 0.0%West Lancashire 9.6 0.0 0.0%Wyre 10.8 0.0 0.0%
LEICESTERSHIREBlaby 6.6 0.0 0.1%Charnwood 12.7 0.0 0.0%Harborough 5.6 0.0 0.0%Hinckley and Bosworth 7.6 0.0 0.0%Melton 4.0 0.0 0.0%North West Leicestershire 7.3 0.0 0.0%Oadby and Wigston 4.7 0.0 0.0%
LINCOLNSHIREBoston 7.4 0.0 0.0%East Lindsey 17.9 0.0 0.0%Lincoln 10.3 0.0 0.0%North Kesteven 9.0 0.0 0.0%South Holland 9.3 0.0 0.0%South Kesteven 10.2 0.0 0.0%West Lindsey 8.4 0.0 0.0%
NORFOLKBreckland 11.6 0.0 0.0%Broadland 8.7 0.0 0.0%Great Yarmouth 10.9 0.0 0.0%King's Lynn and West Norfolk 15.8 0.0 0.0%North Norfolk 9.1 0.0 0.0%Norwich 16.0 0.0 0.0%South Norfolk 8.6 0.0 0.0%
NORTH YORKSHIRECraven 4.3 0.0 0.0%Hambleton 5.9 0.0 0.0%Harrogate 11.5 0.0 0.0%Richmondshire 4.4 0.0 0.0%Ryedale 4.7 0.0 0.0%Scarborough 12.6 0.0 0.0%Selby 6.8 0.0 0.0%
NORTHAMPTONSHIRECorby 5.6 0.0 0.0%Daventry 6.4 0.0 0.0%East Northamptonshire 6.9 0.0 0.0%Kettering 7.4 0.0 0.0%Northampton 18.9 0.0 0.0%South Northamptonshire 6.1 0.0 0.0%Wellingborough 7.1 0.0 0.0%
45

Formula Grant Before Floor DampingLocal Authority
(£ million) (£ million) (%)
Difference from Indicative Allocation
2010-11 Indicative Allocation Option PSS1
NOTTINGHAMSHIREAshfield 11.6 0.0 0.0%Bassetlaw 11.4 0.0 0.0%Broxtowe 9.1 0.0 0.0%Gedling 9.4 0.0 0.0%Mansfield 10.3 0.0 0.0%Newark and Sherwood 10.5 0.0 0.0%Rushcliffe 7.3 0.0 0.0%
OXFORDSHIRECherwell 11.2 0.0 0.0%Oxford 16.9 0.0 0.0%South Oxfordshire 7.8 0.0 0.0%Vale of White Horse 7.2 0.0 0.0%West Oxfordshire 6.1 0.0 0.0%
SOMERSETMendip 8.5 0.0 0.0%Sedgemoor 10.3 0.0 0.0%South Somerset 11.2 0.0 0.0%Taunton Deane 8.9 0.0 0.0%West Somerset 3.3 0.0 0.0%
STAFFORDSHIRECannock Chase 8.6 0.0 0.0%East Staffordshire 9.6 0.0 0.0%Lichfield 6.1 0.0 0.0%Newcastle-under-Lyme 11.3 0.0 0.0%South Staffordshire 7.2 0.0 0.0%Stafford 8.8 0.0 0.0%Staffordshire Moorlands 7.6 0.0 0.0%Tamworth 6.9 0.0 0.0%
SUFFOLKBabergh 6.4 0.0 0.0%Forest Heath 5.5 0.0 0.1%Ipswich 11.9 0.0 0.0%Mid Suffolk 6.2 0.0 0.0%St Edmundsbury 7.1 0.0 0.0%Suffolk Coastal 8.4 0.0 0.0%Waveney 12.0 0.0 0.0%
SURREYElmbridge 6.5 0.0 0.0%Epsom and Ewell 4.0 0.0 0.0%Guildford 8.6 0.0 0.0%Mole Valley 3.3 0.0 -0.1%Reigate and Banstead 6.9 0.0 0.0%Runnymede 5.8 0.0 0.0%Spelthorne 5.7 0.0 0.0%Surrey Heath 4.7 0.0 0.0%Tandridge 4.0 0.0 0.0%Waverley 5.4 0.0 0.0%Woking 5.8 0.0 0.0%
WARWICKSHIRENorth Warwickshire 5.5 0.0 0.0%Nuneaton and Bedworth 11.4 0.0 0.0%Rugby 6.6 0.0 0.0%Stratford-on-Avon 6.9 0.0 0.0%Warwick 10.5 0.0 0.0%
46

Formula Grant Before Floor DampingLocal Authority
(£ million) (£ million) (%)
Difference from Indicative Allocation
2010-11 Indicative Allocation Option PSS1
WEST SUSSEXAdur 5.0 0.0 0.0%Arun 10.5 0.0 0.0%Chichester 5.9 0.0 0.0%Crawley 10.5 0.0 0.0%Horsham 6.0 0.0 0.0%Mid Sussex 5.3 0.0 0.0%Worthing 7.9 0.0 0.0%
WORCESTERSHIREBromsgrove 5.2 0.0 0.0%Malvern Hills 5.2 0.0 0.0%Redditch 6.4 0.0 0.0%Worcester 7.8 0.0 0.0%Wychavon 8.0 0.0 0.0%Wyre Forest 8.1 0.0 0.0%
47
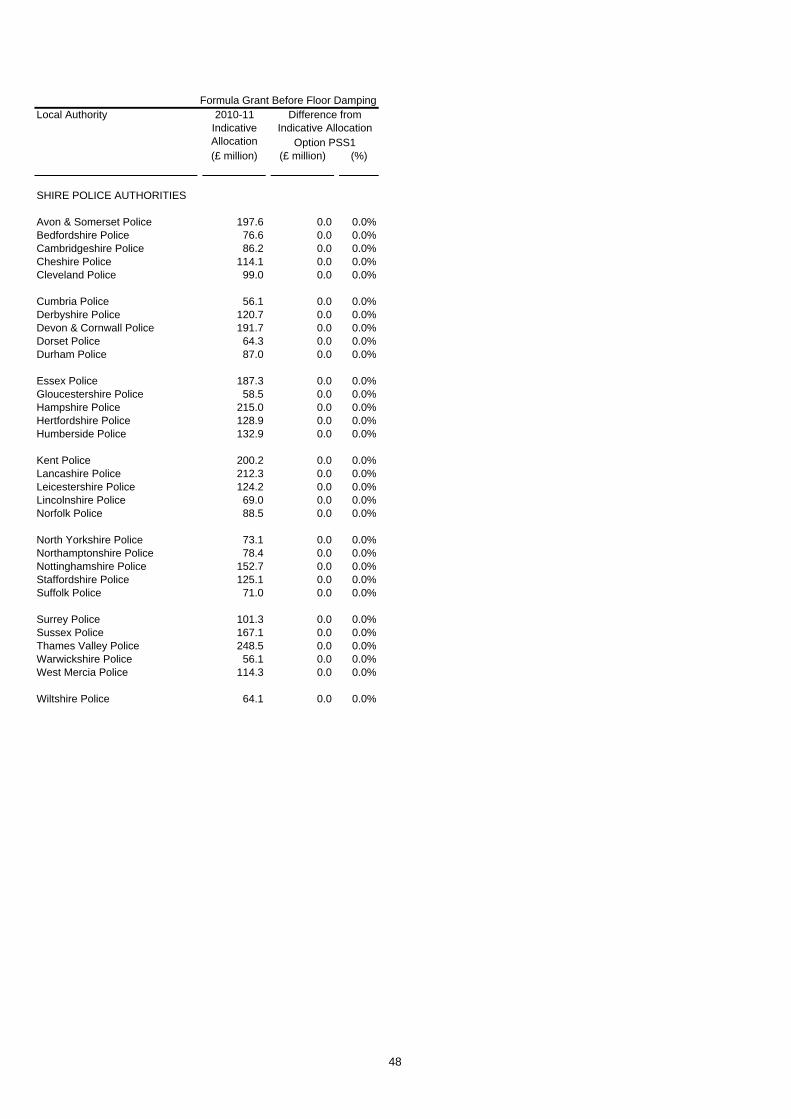
Formula Grant Before Floor DampingLocal Authority
(£ million) (£ million) (%)
Difference from Indicative Allocation
2010-11 Indicative Allocation Option PSS1
SHIRE POLICE AUTHORITIES
Avon & Somerset Police 197.6 0.0 0.0%Bedfordshire Police 76.6 0.0 0.0%Cambridgeshire Police 86.2 0.0 0.0%Cheshire Police 114.1 0.0 0.0%Cleveland Police 99.0 0.0 0.0%
Cumbria Police 56.1 0.0 0.0%Derbyshire Police 120.7 0.0 0.0%Devon & Cornwall Police 191.7 0.0 0.0%Dorset Police 64.3 0.0 0.0%Durham Police 87.0 0.0 0.0%
Essex Police 187.3 0.0 0.0%Gloucestershire Police 58.5 0.0 0.0%Hampshire Police 215.0 0.0 0.0%Hertfordshire Police 128.9 0.0 0.0%Humberside Police 132.9 0.0 0.0%
Kent Police 200.2 0.0 0.0%Lancashire Police 212.3 0.0 0.0%Leicestershire Police 124.2 0.0 0.0%Lincolnshire Police 69.0 0.0 0.0%Norfolk Police 88.5 0.0 0.0%
North Yorkshire Police 73.1 0.0 0.0%Northamptonshire Police 78.4 0.0 0.0%Nottinghamshire Police 152.7 0.0 0.0%Staffordshire Police 125.1 0.0 0.0%Suffolk Police 71.0 0.0 0.0%
Surrey Police 101.3 0.0 0.0%Sussex Police 167.1 0.0 0.0%Thames Valley Police 248.5 0.0 0.0%Warwickshire Police 56.1 0.0 0.0%West Mercia Police 114.3 0.0 0.0%
Wiltshire Police 64.1 0.0 0.0%
48

Formula Grant Before Floor DampingLocal Authority
(£ million) (£ million) (%)
Difference from Indicative Allocation
2010-11 Indicative Allocation Option PSS1
SHIRE FIRE AUTHORITIES
Avon Fire 24.6 0.0 0.0%Bedfordshire Fire 11.7 0.0 0.0%Berkshire Fire Auhtority 13.0 0.0 0.0%Buckinghamshire Fire 9.1 0.0 0.0%Cambridgeshire Fire 15.1 0.0 0.0%
Cheshire Fire 19.3 0.0 0.0%Cleveland Fire 21.7 0.0 0.0%Derbyshire Fire 20.6 0.0 0.0%Devon and Somerset Fire 32.1 0.0 0.0%Dorset Fire 11.1 0.0 0.0%
Durham Fire 14.9 0.0 0.0%East Sussex Fire 15.0 0.0 0.0%Essex Fire Auhtority 33.3 0.0 0.0%Hampshire Fire 29.9 0.0 0.0%Hereford & Worcester Fire 10.8 0.0 0.1%
Humberside Fire 28.2 0.0 0.0%Kent Fire 30.2 0.0 0.0%Lancashire Fire 32.6 0.0 0.0%Leicestershire Fire 19.2 0.0 0.0%North Yorkshire Fire 11.6 0.0 0.1%
Nottinghamshire Fire 26.3 0.0 0.0%Shropshire Fire 8.6 0.0 0.0%Staffordshire Fire 19.1 0.0 0.0%Wiltshire Fire 9.7 0.0 0.0%
49

50
Chapter 4 Police 1. The formula used for distributing Home Office Principal Formula Police Grant (commonly referred to in the Home Office as Main Grant) is the same as the Police Relative Needs Formula (RNF) used by the Department for Communities and Local Government (CLG) in England and the Welsh Assembly Government (WAG) in Wales.
2. The first stage of the formula is to divide funds between the different activities that the police undertake. These activities, or workloads, can be broken down into five ‘key areas’:
• Crime (of which there are seven sub-categories) • Incidents (e.g. public disorder) • Traffic (e.g. assistance at road traffic accidents) • Fear of Crime (e.g. public reassurance) • Special Events (e.g. football matches)
3. A portion of total funding is also distributed according to population sparsity, to address the specific needs of rural police forces.
4. The second stage is to divide funding for each of these workloads between the 43 police authorities of England and Wales. In order to do this, ‘workload indicators’ are calculated to estimate how much work each police force is expected to have in each of the key areas compared to other forces. These estimates are calculated using socio-economic and demographic indicators that are correlated with each workload. Indicators of workload are used rather than data on actual recorded crime levels to account for known variations in recording practices and to avoid creating perverse incentives.
The formula consist of a basic amount per resident and a basic amount for special events, and top-ups for the five key areas, sparsity and area costs (which takes account for regional differences in costs). These are detailed below.
Basic amounts
POLICE BASIC AMOUNT
16.6310
SPECIAL EVENTS BASIC AMOUNT
0.8190
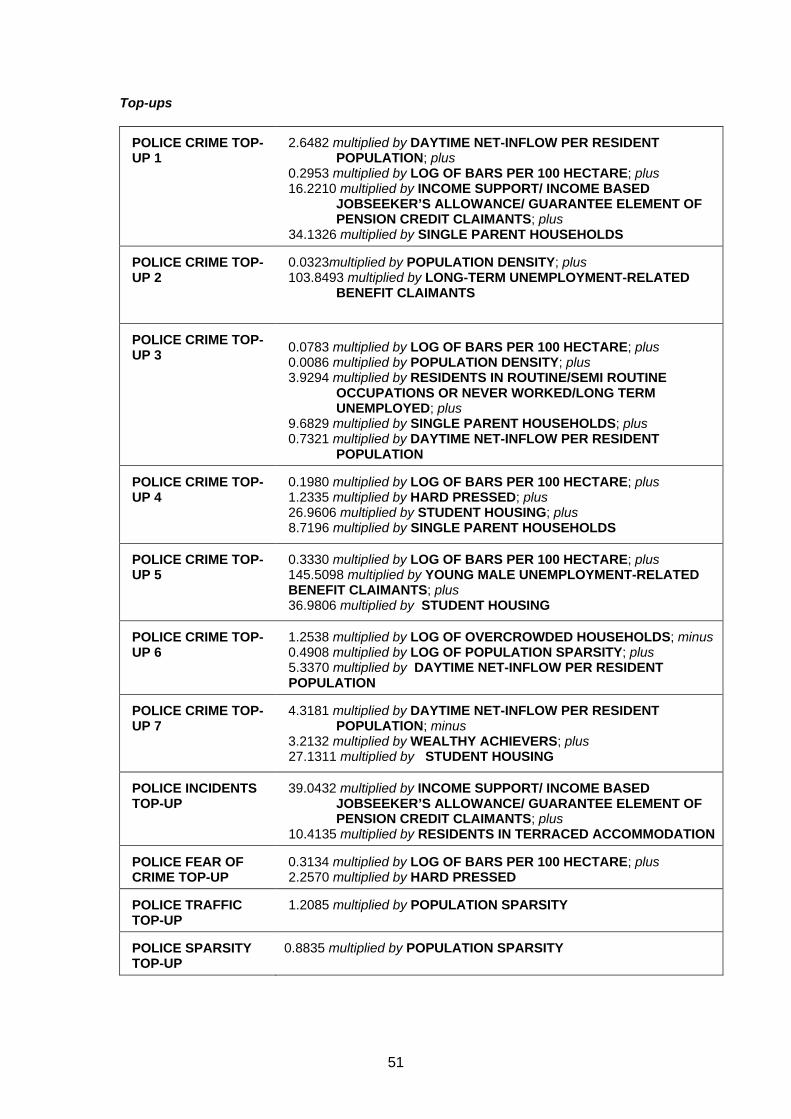
51
Top-ups
POLICE CRIME TOP-UP 1
2.6482 multiplied by DAYTIME NET-INFLOW PER RESIDENT
POPULATION; plus 0.2953 multiplied by LOG OF BARS PER 100 HECTARE; plus 16.2210 multiplied by INCOME SUPPORT/ INCOME BASED
JOBSEEKER’S ALLOWANCE/ GUARANTEE ELEMENT OF PENSION CREDIT CLAIMANTS; plus
34.1326 multiplied by SINGLE PARENT HOUSEHOLDS POLICE CRIME TOP-UP 2
0.0323multiplied by POPULATION DENSITY; plus 103.8493 multiplied by LONG-TERM UNEMPLOYMENT-RELATED
BENEFIT CLAIMANTS
POLICE CRIME TOP-UP 3
0.0783 multiplied by LOG OF BARS PER 100 HECTARE; plus 0.0086 multiplied by POPULATION DENSITY; plus 3.9294 multiplied by RESIDENTS IN ROUTINE/SEMI ROUTINE
OCCUPATIONS OR NEVER WORKED/LONG TERM UNEMPLOYED; plus
9.6829 multiplied by SINGLE PARENT HOUSEHOLDS; plus 0.7321 multiplied by DAYTIME NET-INFLOW PER RESIDENT
POPULATION POLICE CRIME TOP-UP 4
0.1980 multiplied by LOG OF BARS PER 100 HECTARE; plus 1.2335 multiplied by HARD PRESSED; plus 26.9606 multiplied by STUDENT HOUSING; plus 8.7196 multiplied by SINGLE PARENT HOUSEHOLDS
POLICE CRIME TOP-UP 5
0.3330 multiplied by LOG OF BARS PER 100 HECTARE; plus 145.5098 multiplied by YOUNG MALE UNEMPLOYMENT-RELATED BENEFIT CLAIMANTS; plus 36.9806 multiplied by STUDENT HOUSING
POLICE CRIME TOP-UP 6
1.2538 multiplied by LOG OF OVERCROWDED HOUSEHOLDS; minus 0.4908 multiplied by LOG OF POPULATION SPARSITY; plus 5.3370 multiplied by DAYTIME NET-INFLOW PER RESIDENT POPULATION
POLICE CRIME TOP-UP 7
4.3181 multiplied by DAYTIME NET-INFLOW PER RESIDENT
POPULATION; minus 3.2132 multiplied by WEALTHY ACHIEVERS; plus 27.1311 multiplied by STUDENT HOUSING
POLICE INCIDENTS TOP-UP
39.0432 multiplied by INCOME SUPPORT/ INCOME BASED
JOBSEEKER’S ALLOWANCE/ GUARANTEE ELEMENT OF PENSION CREDIT CLAIMANTS; plus
10.4135 multiplied by RESIDENTS IN TERRACED ACCOMMODATION POLICE FEAR OF CRIME TOP-UP
0.3134 multiplied by LOG OF BARS PER 100 HECTARE; plus 2.2570 multiplied by HARD PRESSED
POLICE TRAFFIC TOP-UP
1.2085 multiplied by POPULATION SPARSITY
POLICE SPARSITY TOP-UP
0.8835 multiplied by POPULATION SPARSITY
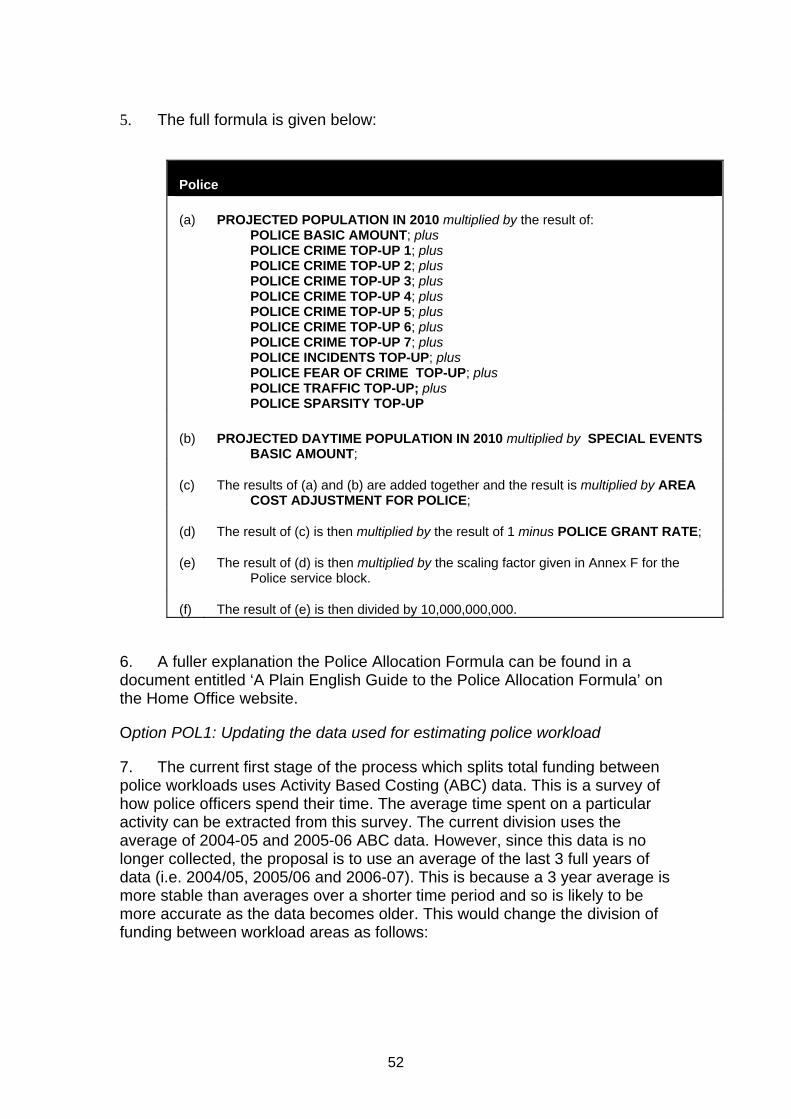
52
5. The full formula is given below:
Police
(a) PROJECTED POPULATION IN 2010 multiplied by the result of: POLICE BASIC AMOUNT; plus POLICE CRIME TOP-UP 1; plus POLICE CRIME TOP-UP 2; plus POLICE CRIME TOP-UP 3; plus POLICE CRIME TOP-UP 4; plus POLICE CRIME TOP-UP 5; plus POLICE CRIME TOP-UP 6; plus POLICE CRIME TOP-UP 7; plus POLICE INCIDENTS TOP-UP; plus POLICE FEAR OF CRIME TOP-UP; plus POLICE TRAFFIC TOP-UP; plus POLICE SPARSITY TOP-UP
(b) PROJECTED DAYTIME POPULATION IN 2010 multiplied by SPECIAL EVENTS BASIC AMOUNT;
(c) The results of (a) and (b) are added together and the result is multiplied by AREA COST ADJUSTMENT FOR POLICE;
(d) The result of (c) is then multiplied by the result of 1 minus POLICE GRANT RATE;
(e) The result of (d) is then multiplied by the scaling factor given in Annex F for the Police service block.
(f) The result of (e) is then divided by 10,000,000,000.
6. A fuller explanation the Police Allocation Formula can be found in a document entitled ‘A Plain English Guide to the Police Allocation Formula’ on the Home Office website.
Option POL1: Updating the data used for estimating police workload
7. The current first stage of the process which splits total funding between police workloads uses Activity Based Costing (ABC) data. This is a survey of how police officers spend their time. The average time spent on a particular activity can be extracted from this survey. The current division uses the average of 2004-05 and 2005-06 ABC data. However, since this data is no longer collected, the proposal is to use an average of the last 3 full years of data (i.e. 2004/05, 2005/06 and 2006-07). This is because a 3 year average is more stable than averages over a shorter time period and so is likely to be more accurate as the data becomes older. This would change the division of funding between workload areas as follows:

53
8. The second stage of the analysis would remain unchanged (i.e. the amount of funding allocated to each activity would change as a result of the updated ABC data but the way that funding was allocated between forces would not).
9. The new formula is given below.
Basic amounts
POLICE BASIC AMOUNT
15.7960
SPECIAL EVENTS BASIC AMOUNT
0.8190
Weighting
Split Between Areas 2 Year Average (04/05 – 05/06)
3 Year Average (04/05 – 06/07)
Crime 60.5% 60.1% Road Traffic Accidents 5.6% 5.7% Providing Public Reassurance 7.0% 7.8% Calls for service/Incidents 23.5% 23.5% Special Events 2.9% 2.9%

54
Top-ups
POLICE CRIME TOP-UP 1
2.5475 multiplied by DAYTIME NET-INFLOW PER RESIDENT
POPULATION; plus 0.2841 multiplied by LOG OF WEIGHTED BARS PER 100 HECTARE; plus 15.6037 multiplied by INCOME SUPPORT/ INCOME BASED
JOBSEEKER’S ALLOWANCE/ GUARANTEE ELEMENT OF PENSION CREDIT CLAIMANTS; plus
32.8336 multiplied by SINGLE PARENT HOUSEHOLDS POLICE CRIME TOP-UP 2
0.0311 multiplied by POPULATION DENSITY; plus 99.8973 multiplied by LONG-TERM UNEMPLOYMENT-RELATED
BENEFIT CLAIMANTS POLICE CRIME TOP-UP 3
0.0753 multiplied by LOG OF WEIGHTED BARS PER 100 HECTARE; plus 0.0082 multiplied by POPULATION DENSITY; plus 3.7799 multiplied by RESIDENTS IN ROUTINE/SEMI ROUTINE
OCCUPATIONS OR NEVER WORKED/LONG TERM UNEMPLOYED; plus
9.3145 multiplied by SINGLE PARENT HOUSEHOLDS; plus 0.7043 multiplied by DAYTIME NET-INFLOW PER RESIDENT
POPULATION POLICE CRIME TOP-UP 4
0.1905 multiplied by LOG OF WEIGHTED BARS PER 100 HECTARE; plus 1.1865 multiplied by HARD PRESSED; plus 25.9346 multiplied by STUDENT HOUSING; plus 8.3879 multiplied by SINGLE PARENT HOUSEHOLDS
POLICE CRIME TOP-UP 5
0.3203 multiplied by LOG OF BARS PER 100 HECTARE; plus 139.9723 multiplied by YOUNG MALE UNEMPLOYMENT-RELATED BENEFIT CLAIMANTS; plus 35.5732 multiplied by STUDENT HOUSING
POLICE CRIME TOP-UP 6
1.2060 multiplied by LOG OF OVERCROWDED HOUSEHOLDS; minus 0.4721 multiplied by LOG OF POPULATION SPARSITY; plus 5.1339 multiplied by DAYTIME NET-INFLOW PER RESIDENT POPULATION
POLICE CRIME TOP-UP 7
4.1538 multiplied by DAYTIME NET-INFLOW PER RESIDENT
POPULATION; minus 3.0909 multiplied by WEALTHY ACHIEVERS; plus 26.0986 multiplied by STUDENT HOUSING
POLICE INCIDENTS TOP-UP
39.0432 multiplied by INCOME SUPPORT/ INCOME BASED
JOBSEEKER’S ALLOWANCE/ GUARANTEE ELEMENT OF PENSION CREDIT CLAIMANTS; plus
10.4135 multiplied by RESIDENTS IN TERRACED ACCOMMODATION POLICE FEAR OF CRIME TOP-UP
0.2934 multiplied by LOG OF WEIGHTED BARS PER 100 HECTARE; plus 2.8676 multiplied by HARD PRESSED
POLICE TRAFFIC TOP-UP
1.2085 multiplied by POPULATION SPARSITY
POLICE SPARSITY TOP-UP
0.8835 multiplied by POPULATION SPARSITY
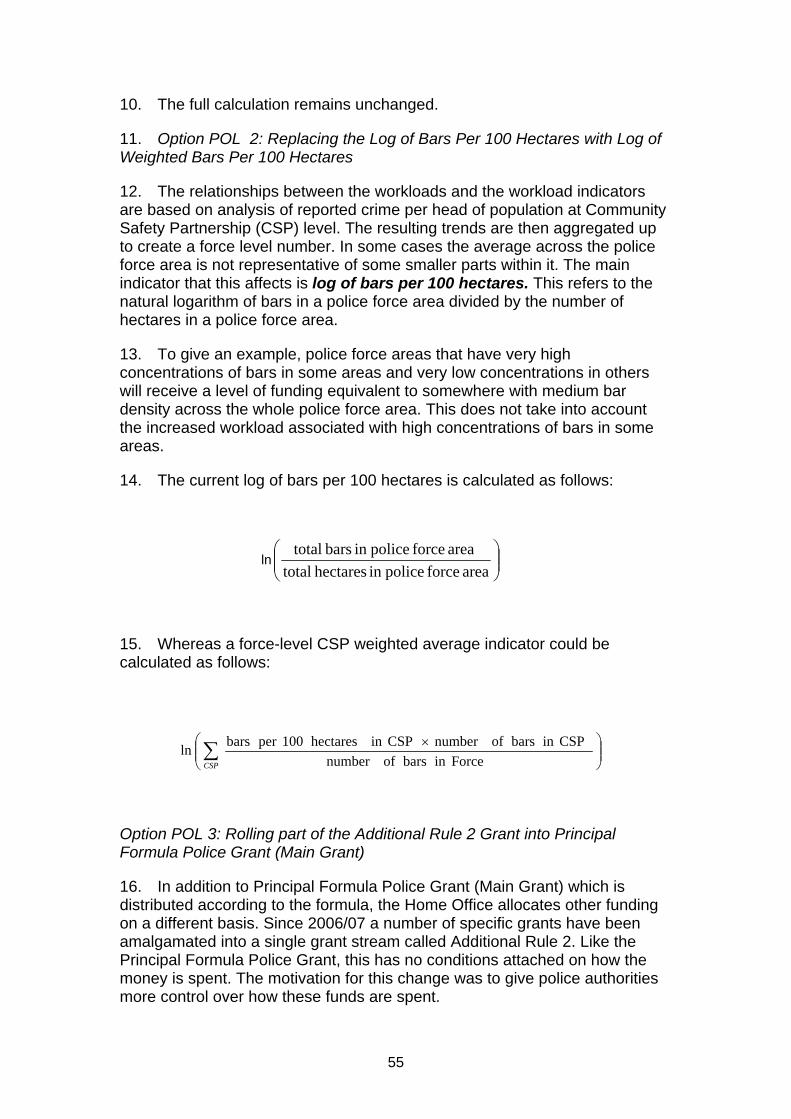
55
10. The full calculation remains unchanged.
11. Option POL 2: Replacing the Log of Bars Per 100 Hectares with Log of Weighted Bars Per 100 Hectares
12. The relationships between the workloads and the workload indicators are based on analysis of reported crime per head of population at Community Safety Partnership (CSP) level. The resulting trends are then aggregated up to create a force level number. In some cases the average across the police force area is not representative of some smaller parts within it. The main indicator that this affects is log of bars per 100 hectares. This refers to the natural logarithm of bars in a police force area divided by the number of hectares in a police force area.
13. To give an example, police force areas that have very high concentrations of bars in some areas and very low concentrations in others will receive a level of funding equivalent to somewhere with medium bar density across the whole police force area. This does not take into account the increased workload associated with high concentrations of bars in some areas.
14. The current log of bars per 100 hectares is calculated as follows:
ln ⎟⎟⎠
⎞⎜⎜⎝
⎛area force policein hectares total
area force policein bars total
15. Whereas a force-level CSP weighted average indicator could be calculated as follows:
Option POL 3: Rolling part of the Additional Rule 2 Grant into Principal Formula Police Grant (Main Grant)
16. In addition to Principal Formula Police Grant (Main Grant) which is distributed according to the formula, the Home Office allocates other funding on a different basis. Since 2006/07 a number of specific grants have been amalgamated into a single grant stream called Additional Rule 2. Like the Principal Formula Police Grant, this has no conditions attached on how the money is spent. The motivation for this change was to give police authorities more control over how these funds are spent.
⎟⎟⎠
⎞⎜⎜⎝
⎛ ×∑CSP Forceinbarsofnumber
CSPinbarsofnumberCSPinhectares100perbarsln

56
17. Additional Rule 2 is distributed according to the historic distribution of the five former specific grants, namely the Rural Policing Fund, Forensic Grant, Special Priority Payments Grant, London/South East (SE) Allowances Grant and Integrated Police Learning and Development Programme.
18. As a result of the in-year cuts announced in May 2010, the total Rule 2 amount in 2010-11 has been reduced by £115 million. This will have an impact on the way that this proposal could be implemented.
19. The proposed change is to roll the Forensic Grant, the Special Priority Payments and the Integrated Police Learning and Development Programme elements of Additional Rule 2 less the in-year cuts, where possible, in to the Principal Formula Police Grant (so that they are distributed via the formula). The rest of the in-year cuts has been applied to the London/SE Allowances Grant and Rural Policing Fund elements of the Rule 2 Grant.
20. Further details of this transfer can be found in Chapter 12 Transfers.
21. Option POL 4: Rolling all of the Additional Rule 2 Grant into Principal Formula Police Grant (Main Grant)
22. The in-year cuts may have implications for the viability of implementing the above option. A potential solution to this issue is to roll the entirety of the Rule 2 grant into the main grant.
23. Further details of this transfer can be found in Chapter 12 Transfers.
Questions:
Question 2: Do you agree the activity analysis should be updated and a three year average used instead of the current two year average (POL1)?
Question 3: Do you agree that the log of weighted bars per 100 hectares indicator should be used in place of log of bars per 100 hectares indicator (POL4)?
Question 4: Do you agree that the three elements of Additional Rule 2 Grant mentioned in paragraph 19 should be rolled into Principal Formula Police Grant (Main Grant) and therefore distributed as through the Police Allocation Formula (POL3)?
Question 5: Do you agree with that the whole of the Rule 2 grant should be rolled into Principal Formula Police Grant (Main Grant) and therefore distributed as through the Police Allocation Formula (POL4)?

Formula Grant Before Floor DampingLocal Authority
(£ million) (£ million) (%) (£ million) (%)
England and Wales 29,388.8 0.0 0.0% 0.0 0.0%
England 28,995.5 0.4 0.0% 3.3 0.0%Wales 393.3 -0.4 -0.1% -3.3 -0.8%
London area 6,153.4 1.2 0.0% -2.5 0.0%Metropolitan areas 8,340.7 -3.8 0.0% -41.6 -0.5%Shire areas 14,499.1 3.0 0.0% 47.4 0.3%Isles of Scilly 2.3 0.0 0.0% 0.0 0.0%
Inner London boroughs incl. City 2,025.0 0.6 0.0% -0.9 0.0%Outer London boroughs 1,873.1 0.0 0.0% 0.3 0.0%London boroughs 3,898.1 0.6 0.0% -0.6 0.0%GLA - all functions 2,255.3 0.7 0.0% -1.9 -0.1%
Metropolitan districts 5,904.0 0.1 0.0% 1.0 0.0%Metropolitan fire authorities 335.8 0.0 0.0% 0.0 0.0%Metropolitan police authorities 2,100.9 -3.9 -0.2% -42.6 -2.0%
Shire unitaries with fire 425.6 0.0 0.0% 0.0 0.0%Shire unitaries without fire 4,099.3 -0.1 0.0% 0.0 0.0%Shire counties with fire 1,589.0 -0.2 0.0% -0.5 0.0%Shire counties without fire 2,501.9 -0.2 0.0% -0.7 0.0%Shire districts 1,654.0 0.0 0.0% 0.0 0.0%Combined fire authorities 467.7 0.0 0.0% -0.1 0.0%Shire police authorities 3,761.6 3.5 0.1% 48.7 1.3%
GO REGIONAL SUMMARY
South West GOR 2,267.3 0.7 0.0% 19.5 0.9%South East GOR 2,957.0 2.3 0.1% 10.4 0.4%London GOR 6,153.4 1.2 0.0% -2.5 0.0%Eastern GOR 2,437.8 1.2 0.0% 7.1 0.3%East Midlands GOR 2,292.2 -0.5 0.0% 10.0 0.4%West Midlands GOR 3,349.9 -0.9 0.0% -13.2 -0.4%Yorkshire and Humber GOR 3,199.2 -1.0 0.0% -13.5 -0.4%North East GOR 1,777.2 -0.8 0.0% 8.6 0.5%North West GOR 4,561.4 -1.8 0.0% -23.1 -0.5%
FLOOR DAMPING GROUPS
Education Authorities 18,418.0 0.2 0.0% -0.8 0.0%Police Authorities 7,864.8 0.2 0.0% 4.1 0.1%Fire Authorities 1,056.5 0.0 0.0% 0.0 0.0%Shire Districts 1,654.0 0.0 0.0% 0.0 0.0%
Police - Formula Changes
Difference from 2010-11 Indicative 2010-11 Indicative Allocation
Option POL1 Option POL2
57

Formula Grant Before Floor DampingLocal Authority
(£ million) (£ million) (%) (£ million) (%)
Difference from 2010-11 Indicative 2010-11 Indicative Allocation
Option POL1 Option POL2
GREATER LONDON
City of London 91.1 0.4 0.5% -1.8 -2.0%
Camden 171.0 0.0 0.0% 0.1 0.0%Greenwich 170.1 0.0 0.0% 0.1 0.0%Hackney 201.8 0.0 0.0% 0.1 0.1%Hammersmith and Fulham 94.3 0.0 0.0% 0.0 0.0%Islington 133.8 0.0 0.0% 0.1 0.1%Kensington and Chelsea 95.9 0.0 0.0% 0.0 0.0%
Lambeth 180.3 0.0 0.0% 0.1 0.0%Lewisham 174.9 0.0 0.0% 0.1 0.0%Southwark 210.2 0.0 0.0% 0.1 0.0%Tower Hamlets 224.3 0.0 0.0% 0.1 0.1%Wandsworth 98.6 0.0 0.0% 0.0 0.0%Westminster 178.8 0.0 0.0% 0.1 0.1%
Barking and Dagenham 108.2 0.0 0.0% 0.0 0.0%Barnet 97.9 0.0 0.0% 0.0 0.0%Bexley 64.5 0.0 0.0% 0.0 0.0%Brent 157.0 0.0 0.0% 0.0 0.0%Bromley 45.7 0.0 0.0% 0.0 0.0%
Croydon 118.4 0.0 0.0% 0.0 0.0%Ealing 129.0 0.0 0.0% 0.0 0.0%Enfield 126.7 0.0 0.0% 0.0 0.0%Haringey 137.6 0.0 0.0% 0.1 0.0%Harrow 66.6 0.0 0.0% 0.0 0.0%
Havering 52.3 0.0 0.0% 0.0 0.0%Hillingdon 85.6 0.0 0.0% 0.0 0.0%Hounslow 77.3 0.0 0.0% 0.0 0.0%Kingston upon Thames 32.6 0.0 0.0% 0.0 0.0%Merton 61.2 0.0 0.0% 0.0 0.0%
Newham 231.3 0.0 0.0% 0.1 0.0%Redbridge 102.6 0.0 0.0% 0.0 0.0%Richmond upon Thames 9.6 0.0 -0.1% 0.0 -0.2%Sutton 45.1 0.0 0.0% 0.0 0.0%Waltham Forest 124.0 0.0 0.0% 0.0 0.0%
GLA - all functions 2,255.3 0.7 0.0% -1.9 -0.1%
GLA - police 2,002.3 0.6 0.0% -2.0 -0.1%GLA - fire 253.0 0.0 0.0% 0.1 0.0%
58

Formula Grant Before Floor DampingLocal Authority
(£ million) (£ million) (%) (£ million) (%)
Difference from 2010-11 Indicative 2010-11 Indicative Allocation
Option POL1 Option POL2
GREATER MANCHESTERBolton 132.6 0.0 0.0% 0.0 0.0%Bury 67.5 0.0 0.0% 0.0 0.0%Manchester 346.1 0.0 0.0% 0.1 0.0%Oldham 127.6 0.0 0.0% 0.0 0.0%Rochdale 114.9 0.0 0.0% 0.0 0.0%Salford 131.2 0.0 0.0% 0.0 0.0%Stockport 85.2 0.0 0.0% 0.0 0.0%Tameside 109.5 0.0 0.0% 0.0 0.0%Trafford 67.3 0.0 0.0% 0.0 0.0%Wigan 138.6 0.0 0.0% 0.0 0.0%Greater Manchester Fire 76.1 0.0 0.0% 0.0 0.0%Greater Manchester Police 485.7 -0.7 -0.1% -14.7 -3.0%
MERSEYSIDEKnowsley 114.6 0.0 0.0% 0.0 0.0%Liverpool 318.0 0.0 0.0% 0.1 0.0%Sefton 127.6 0.0 0.0% 0.0 0.0%St Helens 90.9 0.0 0.0% 0.0 0.0%Wirral 165.2 0.0 0.0% 0.0 0.0%Merseyside Fire 46.1 0.0 0.0% 0.0 0.0%Merseyside Police 275.5 -1.0 -0.4% -5.6 -2.0%
SOUTH YORKSHIREBarnsley 114.3 0.0 0.0% 0.0 0.0%Doncaster 149.1 0.0 0.0% 0.0 0.0%Rotherham 130.1 0.0 0.0% 0.0 0.0%Sheffield 280.0 0.0 0.0% 0.0 0.0%South Yorkshire Fire 37.4 0.0 0.0% 0.0 0.0%South Yorkshire Police 209.2 -0.4 -0.2% -5.4 -2.6%
TYNE AND WEARGateshead 102.7 0.0 0.0% 0.0 0.0%Newcastle upon Tyne 157.2 0.0 0.0% 0.0 0.0%North Tyneside 87.4 0.0 0.0% 0.0 0.0%South Tyneside 89.3 0.0 0.0% 0.0 0.0%Sunderland 158.9 0.0 0.0% 0.0 0.0%Tyne and Wear Fire 35.9 0.0 0.0% 0.0 0.0%Northumbria Police 219.9 -0.3 -0.1% 11.5 5.2%
WEST MIDLANDSBirmingham 698.9 0.0 0.0% 0.2 0.0%Coventry 156.6 0.0 0.0% 0.0 0.0%Dudley 130.4 0.0 0.0% 0.0 0.0%Sandwell 190.3 0.0 0.0% 0.1 0.0%Solihull 49.1 0.0 0.0% 0.0 0.0%Walsall 142.3 0.0 0.0% 0.0 0.0%Wolverhampton 145.6 0.0 0.0% 0.0 0.0%West Midlands Fire 81.6 0.0 0.0% 0.0 0.0%West Midlands Police 542.2 -1.1 -0.2% -15.4 -2.8%
WEST YORKSHIREBradford 283.4 0.0 0.0% 0.0 0.0%Calderdale 84.1 0.0 0.0% 0.0 0.0%Kirklees 164.9 0.0 0.0% 0.0 0.0%Leeds 305.9 0.0 0.0% 0.0 0.0%Wakefield 146.7 0.0 0.0% 0.0 0.0%West Yorkshire Fire 58.7 0.0 0.0% 0.0 0.0%West Yorkshire Police 368.2 -0.3 -0.1% -13.0 -3.5%
59
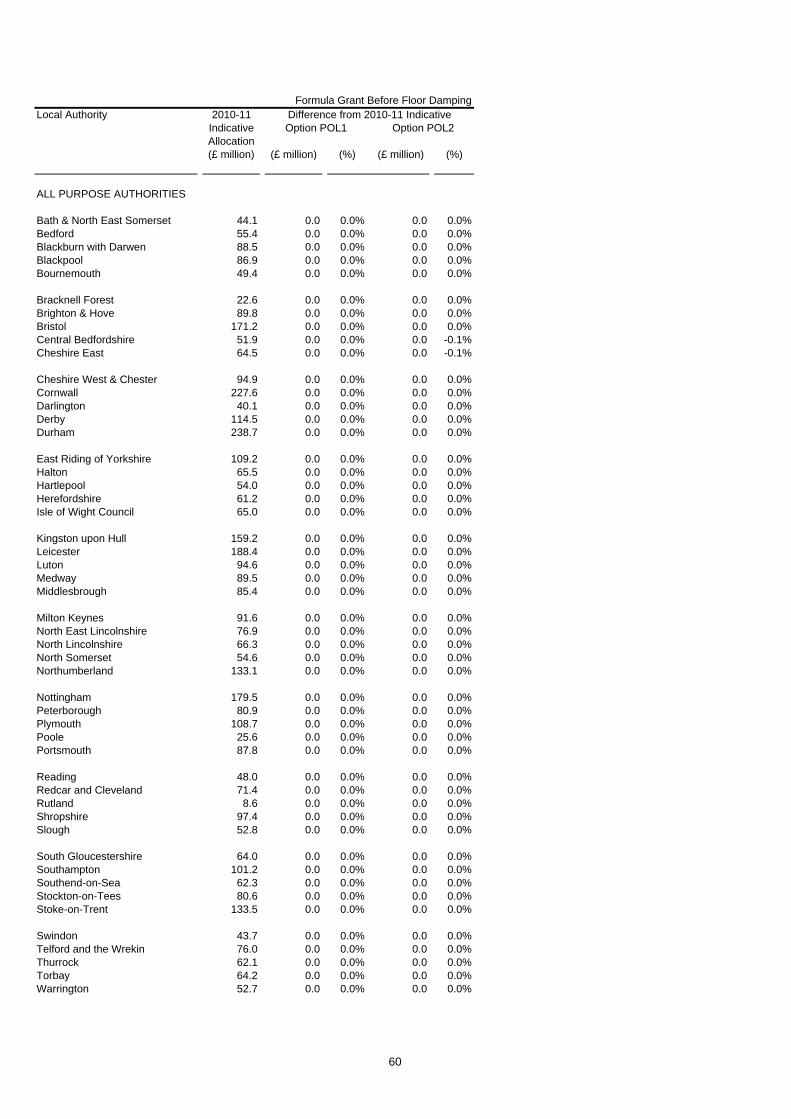
Formula Grant Before Floor DampingLocal Authority
(£ million) (£ million) (%) (£ million) (%)
Difference from 2010-11 Indicative 2010-11 Indicative Allocation
Option POL1 Option POL2
ALL PURPOSE AUTHORITIES
Bath & North East Somerset 44.1 0.0 0.0% 0.0 0.0%Bedford 55.4 0.0 0.0% 0.0 0.0%Blackburn with Darwen 88.5 0.0 0.0% 0.0 0.0%Blackpool 86.9 0.0 0.0% 0.0 0.0%Bournemouth 49.4 0.0 0.0% 0.0 0.0%
Bracknell Forest 22.6 0.0 0.0% 0.0 0.0%Brighton & Hove 89.8 0.0 0.0% 0.0 0.0%Bristol 171.2 0.0 0.0% 0.0 0.0%Central Bedfordshire 51.9 0.0 0.0% 0.0 -0.1%Cheshire East 64.5 0.0 0.0% 0.0 -0.1%
Cheshire West & Chester 94.9 0.0 0.0% 0.0 0.0%Cornwall 227.6 0.0 0.0% 0.0 0.0%Darlington 40.1 0.0 0.0% 0.0 0.0%Derby 114.5 0.0 0.0% 0.0 0.0%Durham 238.7 0.0 0.0% 0.0 0.0%
East Riding of Yorkshire 109.2 0.0 0.0% 0.0 0.0%Halton 65.5 0.0 0.0% 0.0 0.0%Hartlepool 54.0 0.0 0.0% 0.0 0.0%Herefordshire 61.2 0.0 0.0% 0.0 0.0%Isle of Wight Council 65.0 0.0 0.0% 0.0 0.0%
Kingston upon Hull 159.2 0.0 0.0% 0.0 0.0%Leicester 188.4 0.0 0.0% 0.0 0.0%Luton 94.6 0.0 0.0% 0.0 0.0%Medway 89.5 0.0 0.0% 0.0 0.0%Middlesbrough 85.4 0.0 0.0% 0.0 0.0%
Milton Keynes 91.6 0.0 0.0% 0.0 0.0%North East Lincolnshire 76.9 0.0 0.0% 0.0 0.0%North Lincolnshire 66.3 0.0 0.0% 0.0 0.0%North Somerset 54.6 0.0 0.0% 0.0 0.0%Northumberland 133.1 0.0 0.0% 0.0 0.0%
Nottingham 179.5 0.0 0.0% 0.0 0.0%Peterborough 80.9 0.0 0.0% 0.0 0.0%Plymouth 108.7 0.0 0.0% 0.0 0.0%Poole 25.6 0.0 0.0% 0.0 0.0%Portsmouth 87.8 0.0 0.0% 0.0 0.0%
Reading 48.0 0.0 0.0% 0.0 0.0%Redcar and Cleveland 71.4 0.0 0.0% 0.0 0.0%Rutland 8.6 0.0 0.0% 0.0 0.0%Shropshire 97.4 0.0 0.0% 0.0 0.0%Slough 52.8 0.0 0.0% 0.0 0.0%
South Gloucestershire 64.0 0.0 0.0% 0.0 0.0%Southampton 101.2 0.0 0.0% 0.0 0.0%Southend-on-Sea 62.3 0.0 0.0% 0.0 0.0%Stockton-on-Tees 80.6 0.0 0.0% 0.0 0.0%Stoke-on-Trent 133.5 0.0 0.0% 0.0 0.0%
Swindon 43.7 0.0 0.0% 0.0 0.0%Telford and the Wrekin 76.0 0.0 0.0% 0.0 0.0%Thurrock 62.1 0.0 0.0% 0.0 0.0%Torbay 64.2 0.0 0.0% 0.0 0.0%Warrington 52.7 0.0 0.0% 0.0 0.0%
60

Formula Grant Before Floor DampingLocal Authority
(£ million) (£ million) (%) (£ million) (%)
Difference from 2010-11 Indicative 2010-11 Indicative Allocation
Option POL1 Option POL2
West Berkshire 23.1 0.0 0.0% 0.0 0.0%Wiltshire 102.1 0.0 0.0% 0.0 0.0%Windsor and Maidenhead 10.1 0.0 0.0% 0.0 -0.2%Wokingham 8.4 0.0 -0.1% 0.0 -0.3%York 45.8 0.0 0.0% 0.0 -0.1%
Isles of Scilly 2.3 0.0 0.0% 0.0 0.0%
61

Formula Grant Before Floor DampingLocal Authority
(£ million) (£ million) (%) (£ million) (%)
Difference from 2010-11 Indicative 2010-11 Indicative Allocation
Option POL1 Option POL2
SHIRE COUNTIES
Buckinghamshire 43.5 0.0 0.0% -0.1 -0.1%Cambridgeshire 113.1 0.0 0.0% 0.0 0.0%Cumbria 157.5 0.0 0.0% 0.0 0.0%Derbyshire 204.0 0.0 0.0% 0.0 0.0%Devon 176.4 0.0 0.0% 0.0 0.0%
Dorset 57.6 0.0 0.0% 0.0 -0.1%East Sussex 105.4 0.0 0.0% 0.0 0.0%Essex 258.3 0.0 0.0% -0.1 0.0%Gloucestershire 124.0 0.0 0.0% 0.0 0.0%Hampshire 126.6 0.0 0.0% -0.2 -0.1%
Hertfordshire 148.3 0.0 0.0% -0.1 -0.1%Kent 287.9 0.0 0.0% -0.1 0.0%Lancashire 328.9 0.0 0.0% 0.0 0.0%Leicestershire 107.5 0.0 0.0% -0.1 -0.1%Lincolnshire 210.6 0.0 0.0% 0.0 0.0%
Norfolk 260.4 0.0 0.0% 0.0 0.0%North Yorkshire 113.7 0.0 0.0% 0.0 0.0%Northamptonshire 162.2 0.0 0.0% 0.0 0.0%Nottinghamshire 191.6 0.0 0.0% 0.0 0.0%Oxfordshire 99.8 0.0 0.0% -0.1 -0.1%
Somerset 120.7 0.0 0.0% 0.0 0.0%Staffordshire 169.7 0.0 0.0% -0.1 0.0%Suffolk 181.0 0.0 0.0% 0.0 0.0%Surrey 60.1 0.0 -0.1% -0.1 -0.2%Warwickshire 96.6 0.0 0.0% 0.0 0.0%
West Sussex 88.4 0.0 0.0% -0.1 -0.1%Worcestershire 96.9 0.0 0.0% 0.0 0.0%
62

Formula Grant Before Floor DampingLocal Authority
(£ million) (£ million) (%) (£ million) (%)
Difference from 2010-11 Indicative 2010-11 Indicative Allocation
Option POL1 Option POL2
BUCKINGHAMSHIREAylesbury Vale 12.1 0.0 0.0% 0.0 0.0%Chiltern 3.2 0.0 0.0% 0.0 0.1%South Bucks 2.3 0.0 0.0% 0.0 0.1%Wycombe 9.5 0.0 0.0% 0.0 0.0%
CAMBRIDGESHIRECambridge 12.0 0.0 0.0% 0.0 0.0%East Cambridgeshire 6.8 0.0 0.0% 0.0 0.0%Fenland 9.9 0.0 0.0% 0.0 0.0%Huntingdonshire 13.4 0.0 0.0% 0.0 0.0%South Cambridgeshire 7.9 0.0 0.0% 0.0 0.0%
CUMBRIAAllerdale 10.4 0.0 0.0% 0.0 0.0%Barrow-in-Furness 9.1 0.0 0.0% 0.0 0.0%Carlisle 10.2 0.0 0.0% 0.0 0.0%Copeland 7.2 0.0 0.0% 0.0 0.0%Eden 4.7 0.0 0.0% 0.0 0.0%South Lakeland 6.8 0.0 0.0% 0.0 0.0%
DERBYSHIREAmber Valley 10.0 0.0 0.0% 0.0 0.0%Bolsover 8.0 0.0 0.0% 0.0 0.0%Chesterfield 10.2 0.0 0.0% 0.0 0.0%Derbyshire Dales 4.7 0.0 0.0% 0.0 0.0%Erewash 9.7 0.0 0.0% 0.0 0.0%High Peak 7.2 0.0 0.0% 0.0 0.0%North East Derbyshire 7.9 0.0 0.0% 0.0 0.0%South Derbyshire 7.5 0.0 0.0% 0.0 0.0%
DEVONEast Devon 8.4 0.0 0.0% 0.0 0.0%Exeter 12.1 0.0 0.0% 0.0 0.0%Mid Devon 6.3 0.0 0.0% 0.0 0.0%North Devon 8.5 0.0 0.0% 0.0 0.0%South Hams 5.6 0.0 0.0% 0.0 0.0%Teignbridge 10.1 0.0 0.0% 0.0 0.0%Torridge 6.6 0.0 0.0% 0.0 0.0%West Devon 4.4 0.0 0.0% 0.0 0.0%
DORSETChristchurch 2.9 0.0 0.0% 0.0 0.0%East Dorset 3.8 0.0 0.0% 0.0 0.0%North Dorset 4.7 0.0 0.0% 0.0 0.0%Purbeck 3.3 0.0 0.0% 0.0 0.0%West Dorset 7.9 0.0 0.0% 0.0 0.0%Weymouth and Portland 6.1 0.0 0.0% 0.0 0.0%
EAST SUSSEXEastbourne 10.5 0.0 0.0% 0.0 0.0%Hastings 10.6 0.0 0.0% 0.0 0.0%Lewes 6.6 0.0 0.0% 0.0 0.0%Rother 6.5 0.0 0.0% 0.0 0.0%Wealden 8.4 0.0 0.0% 0.0 0.0%
63

Formula Grant Before Floor DampingLocal Authority
(£ million) (£ million) (%) (£ million) (%)
Difference from 2010-11 Indicative 2010-11 Indicative Allocation
Option POL1 Option POL2
ESSEXBasildon 16.1 0.0 0.0% 0.0 0.0%Braintree 10.6 0.0 0.0% 0.0 0.0%Brentwood 4.4 0.0 0.0% 0.0 0.0%Castle Point 6.8 0.0 0.0% 0.0 0.0%Chelmsford 10.7 0.0 0.0% 0.0 0.0%Colchester 13.1 0.0 0.0% 0.0 0.0%Epping Forest 9.4 0.0 0.0% 0.0 0.0%Harlow 8.2 0.0 0.0% 0.0 0.0%Maldon 4.6 0.0 0.0% 0.0 0.0%Rochford 5.2 0.0 0.0% 0.0 0.0%Tendring 14.6 0.0 0.0% 0.0 0.0%Uttlesford 3.9 0.0 0.0% 0.0 0.0%
GLOUCESTERSHIRECheltenham 8.7 0.0 0.0% 0.0 0.0%Cotswold 5.5 0.0 0.0% 0.0 0.0%Forest of Dean 7.0 0.0 0.0% 0.0 0.0%Gloucester 10.8 0.0 0.0% 0.0 0.0%Stroud 7.3 0.0 0.0% 0.0 0.0%Tewkesbury 5.4 0.0 0.0% 0.0 0.0%
HAMPSHIREBasingstoke and Deane 10.3 0.0 0.0% 0.0 0.0%East Hampshire 5.9 0.0 0.0% 0.0 0.0%Eastleigh 7.8 0.0 0.0% 0.0 0.0%Fareham 6.1 0.0 0.0% 0.0 0.0%Gosport 7.1 0.0 0.0% 0.0 0.0%Hart 3.9 0.0 0.0% 0.0 0.0%Havant 9.9 0.0 0.0% 0.0 0.0%New Forest 11.8 0.0 0.0% 0.0 0.0%Rushmoor 6.3 0.0 0.0% 0.0 0.0%Test Valley 7.3 0.0 0.0% 0.0 0.0%Winchester 6.7 0.0 0.0% 0.0 0.0%
HERTFORDSHIREBroxbourne 7.0 0.0 0.0% 0.0 0.0%Dacorum 9.5 0.0 0.0% 0.0 0.0%East Hertfordshire 8.1 0.0 0.0% 0.0 0.0%Hertsmere 6.8 0.0 0.0% 0.0 0.0%North Hertfordshire 8.3 0.0 0.0% 0.0 0.0%St Albans 7.0 0.0 0.0% 0.0 0.0%Stevenage 7.6 0.0 0.0% 0.0 0.0%Three Rivers 5.1 0.0 0.0% 0.0 0.0%Watford 7.2 0.0 0.0% 0.0 0.0%Welwyn Hatfield 8.2 0.0 0.0% 0.0 0.0%
KENTAshford 8.6 0.0 0.0% 0.0 0.0%Canterbury 13.6 0.0 0.0% 0.0 0.0%Dartford 7.6 0.0 0.0% 0.0 0.0%Dover 9.9 0.0 0.0% 0.0 0.0%Gravesham 8.5 0.0 0.0% 0.0 0.0%Maidstone 9.0 0.0 0.0% 0.0 0.0%Sevenoaks 6.1 0.0 0.0% 0.0 0.0%Shepway 10.1 0.0 0.0% 0.0 0.0%Swale 12.2 0.0 0.0% 0.0 0.0%Thanet 13.4 0.0 0.0% 0.0 0.0%Tonbridge and Malling 6.5 0.0 0.0% 0.0 0.0%Tunbridge Wells 6.5 0.0 0.0% 0.0 0.0%
64

Formula Grant Before Floor DampingLocal Authority
(£ million) (£ million) (%) (£ million) (%)
Difference from 2010-11 Indicative 2010-11 Indicative Allocation
Option POL1 Option POL2
LANCASHIREBurnley 11.8 0.0 0.0% 0.0 0.0%Chorley 8.6 0.0 0.0% 0.0 0.0%Fylde 6.0 0.0 0.0% 0.0 0.0%Hyndburn 10.3 0.0 0.0% 0.0 0.0%Lancaster 16.8 0.0 0.0% 0.0 0.0%Pendle 11.2 0.0 0.0% 0.0 0.0%Preston 15.8 0.0 0.0% 0.0 0.0%Ribble Valley 4.3 0.0 0.0% 0.0 0.0%Rossendale 6.2 0.0 0.0% 0.0 0.0%South Ribble 7.6 0.0 0.0% 0.0 0.0%West Lancashire 9.6 0.0 0.0% 0.0 0.0%Wyre 10.8 0.0 0.0% 0.0 0.0%
LEICESTERSHIREBlaby 6.6 0.0 0.0% 0.0 0.0%Charnwood 12.7 0.0 0.0% 0.0 0.0%Harborough 5.6 0.0 0.0% 0.0 0.0%Hinckley and Bosworth 7.6 0.0 0.0% 0.0 0.0%Melton 4.0 0.0 0.0% 0.0 0.0%North West Leicestershire 7.3 0.0 0.0% 0.0 0.0%Oadby and Wigston 4.7 0.0 0.0% 0.0 0.0%
LINCOLNSHIREBoston 7.4 0.0 0.0% 0.0 0.0%East Lindsey 17.9 0.0 0.0% 0.0 0.0%Lincoln 10.3 0.0 0.0% 0.0 0.0%North Kesteven 9.0 0.0 0.0% 0.0 0.0%South Holland 9.3 0.0 0.0% 0.0 0.0%South Kesteven 10.2 0.0 0.0% 0.0 0.0%West Lindsey 8.4 0.0 0.0% 0.0 0.0%
NORFOLKBreckland 11.6 0.0 0.0% 0.0 0.0%Broadland 8.7 0.0 0.0% 0.0 0.0%Great Yarmouth 10.9 0.0 0.0% 0.0 0.0%King's Lynn and West Norfolk 15.8 0.0 0.0% 0.0 0.0%North Norfolk 9.1 0.0 0.0% 0.0 0.0%Norwich 16.0 0.0 0.0% 0.0 0.0%South Norfolk 8.6 0.0 0.0% 0.0 0.0%
NORTH YORKSHIRECraven 4.3 0.0 0.0% 0.0 0.0%Hambleton 5.9 0.0 0.0% 0.0 0.0%Harrogate 11.5 0.0 0.0% 0.0 0.0%Richmondshire 4.4 0.0 0.0% 0.0 0.0%Ryedale 4.7 0.0 0.0% 0.0 0.0%Scarborough 12.6 0.0 0.0% 0.0 0.0%Selby 6.8 0.0 0.0% 0.0 0.0%
NORTHAMPTONSHIRECorby 5.6 0.0 0.0% 0.0 0.0%Daventry 6.4 0.0 0.0% 0.0 0.0%East Northamptonshire 6.9 0.0 0.0% 0.0 0.0%Kettering 7.4 0.0 0.0% 0.0 0.0%Northampton 18.9 0.0 0.0% 0.0 0.0%South Northamptonshire 6.1 0.0 0.0% 0.0 0.0%Wellingborough 7.1 0.0 0.0% 0.0 0.0%
65
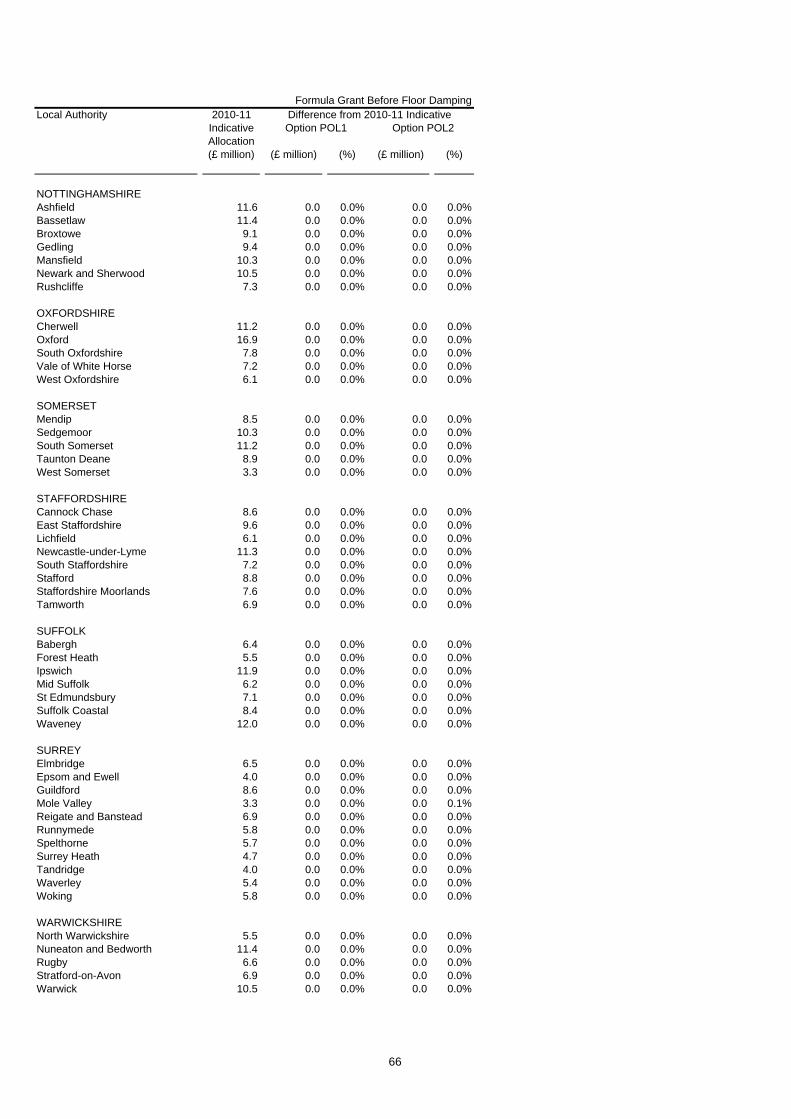
Formula Grant Before Floor DampingLocal Authority
(£ million) (£ million) (%) (£ million) (%)
Difference from 2010-11 Indicative 2010-11 Indicative Allocation
Option POL1 Option POL2
NOTTINGHAMSHIREAshfield 11.6 0.0 0.0% 0.0 0.0%Bassetlaw 11.4 0.0 0.0% 0.0 0.0%Broxtowe 9.1 0.0 0.0% 0.0 0.0%Gedling 9.4 0.0 0.0% 0.0 0.0%Mansfield 10.3 0.0 0.0% 0.0 0.0%Newark and Sherwood 10.5 0.0 0.0% 0.0 0.0%Rushcliffe 7.3 0.0 0.0% 0.0 0.0%
OXFORDSHIRECherwell 11.2 0.0 0.0% 0.0 0.0%Oxford 16.9 0.0 0.0% 0.0 0.0%South Oxfordshire 7.8 0.0 0.0% 0.0 0.0%Vale of White Horse 7.2 0.0 0.0% 0.0 0.0%West Oxfordshire 6.1 0.0 0.0% 0.0 0.0%
SOMERSETMendip 8.5 0.0 0.0% 0.0 0.0%Sedgemoor 10.3 0.0 0.0% 0.0 0.0%South Somerset 11.2 0.0 0.0% 0.0 0.0%Taunton Deane 8.9 0.0 0.0% 0.0 0.0%West Somerset 3.3 0.0 0.0% 0.0 0.0%
STAFFORDSHIRECannock Chase 8.6 0.0 0.0% 0.0 0.0%East Staffordshire 9.6 0.0 0.0% 0.0 0.0%Lichfield 6.1 0.0 0.0% 0.0 0.0%Newcastle-under-Lyme 11.3 0.0 0.0% 0.0 0.0%South Staffordshire 7.2 0.0 0.0% 0.0 0.0%Stafford 8.8 0.0 0.0% 0.0 0.0%Staffordshire Moorlands 7.6 0.0 0.0% 0.0 0.0%Tamworth 6.9 0.0 0.0% 0.0 0.0%
SUFFOLKBabergh 6.4 0.0 0.0% 0.0 0.0%Forest Heath 5.5 0.0 0.0% 0.0 0.0%Ipswich 11.9 0.0 0.0% 0.0 0.0%Mid Suffolk 6.2 0.0 0.0% 0.0 0.0%St Edmundsbury 7.1 0.0 0.0% 0.0 0.0%Suffolk Coastal 8.4 0.0 0.0% 0.0 0.0%Waveney 12.0 0.0 0.0% 0.0 0.0%
SURREYElmbridge 6.5 0.0 0.0% 0.0 0.0%Epsom and Ewell 4.0 0.0 0.0% 0.0 0.0%Guildford 8.6 0.0 0.0% 0.0 0.0%Mole Valley 3.3 0.0 0.0% 0.0 0.1%Reigate and Banstead 6.9 0.0 0.0% 0.0 0.0%Runnymede 5.8 0.0 0.0% 0.0 0.0%Spelthorne 5.7 0.0 0.0% 0.0 0.0%Surrey Heath 4.7 0.0 0.0% 0.0 0.0%Tandridge 4.0 0.0 0.0% 0.0 0.0%Waverley 5.4 0.0 0.0% 0.0 0.0%Woking 5.8 0.0 0.0% 0.0 0.0%
WARWICKSHIRENorth Warwickshire 5.5 0.0 0.0% 0.0 0.0%Nuneaton and Bedworth 11.4 0.0 0.0% 0.0 0.0%Rugby 6.6 0.0 0.0% 0.0 0.0%Stratford-on-Avon 6.9 0.0 0.0% 0.0 0.0%Warwick 10.5 0.0 0.0% 0.0 0.0%
66

Formula Grant Before Floor DampingLocal Authority
(£ million) (£ million) (%) (£ million) (%)
Difference from 2010-11 Indicative 2010-11 Indicative Allocation
Option POL1 Option POL2
WEST SUSSEXAdur 5.0 0.0 0.0% 0.0 0.0%Arun 10.5 0.0 0.0% 0.0 0.0%Chichester 5.9 0.0 0.0% 0.0 0.0%Crawley 10.5 0.0 0.0% 0.0 0.0%Horsham 6.0 0.0 0.0% 0.0 0.0%Mid Sussex 5.3 0.0 0.0% 0.0 0.0%Worthing 7.9 0.0 0.0% 0.0 0.0%
WORCESTERSHIREBromsgrove 5.2 0.0 0.0% 0.0 0.0%Malvern Hills 5.2 0.0 0.0% 0.0 0.0%Redditch 6.4 0.0 0.0% 0.0 0.0%Worcester 7.8 0.0 0.0% 0.0 0.0%Wychavon 8.0 0.0 0.0% 0.0 0.0%Wyre Forest 8.1 0.0 0.0% 0.0 0.0%
67
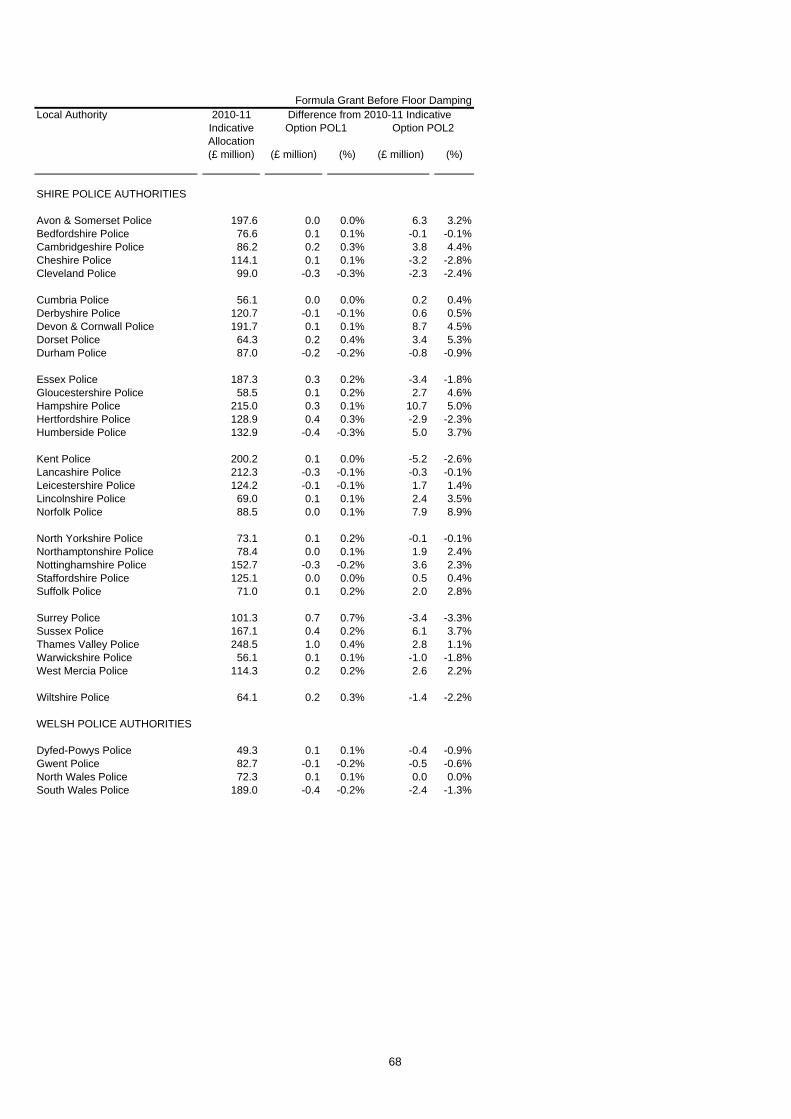
Formula Grant Before Floor DampingLocal Authority
(£ million) (£ million) (%) (£ million) (%)
Difference from 2010-11 Indicative 2010-11 Indicative Allocation
Option POL1 Option POL2
SHIRE POLICE AUTHORITIES
Avon & Somerset Police 197.6 0.0 0.0% 6.3 3.2%Bedfordshire Police 76.6 0.1 0.1% -0.1 -0.1%Cambridgeshire Police 86.2 0.2 0.3% 3.8 4.4%Cheshire Police 114.1 0.1 0.1% -3.2 -2.8%Cleveland Police 99.0 -0.3 -0.3% -2.3 -2.4%
Cumbria Police 56.1 0.0 0.0% 0.2 0.4%Derbyshire Police 120.7 -0.1 -0.1% 0.6 0.5%Devon & Cornwall Police 191.7 0.1 0.1% 8.7 4.5%Dorset Police 64.3 0.2 0.4% 3.4 5.3%Durham Police 87.0 -0.2 -0.2% -0.8 -0.9%
Essex Police 187.3 0.3 0.2% -3.4 -1.8%Gloucestershire Police 58.5 0.1 0.2% 2.7 4.6%Hampshire Police 215.0 0.3 0.1% 10.7 5.0%Hertfordshire Police 128.9 0.4 0.3% -2.9 -2.3%Humberside Police 132.9 -0.4 -0.3% 5.0 3.7%
Kent Police 200.2 0.1 0.0% -5.2 -2.6%Lancashire Police 212.3 -0.3 -0.1% -0.3 -0.1%Leicestershire Police 124.2 -0.1 -0.1% 1.7 1.4%Lincolnshire Police 69.0 0.1 0.1% 2.4 3.5%Norfolk Police 88.5 0.0 0.1% 7.9 8.9%
North Yorkshire Police 73.1 0.1 0.2% -0.1 -0.1%Northamptonshire Police 78.4 0.0 0.1% 1.9 2.4%Nottinghamshire Police 152.7 -0.3 -0.2% 3.6 2.3%Staffordshire Police 125.1 0.0 0.0% 0.5 0.4%Suffolk Police 71.0 0.1 0.2% 2.0 2.8%
Surrey Police 101.3 0.7 0.7% -3.4 -3.3%Sussex Police 167.1 0.4 0.2% 6.1 3.7%Thames Valley Police 248.5 1.0 0.4% 2.8 1.1%Warwickshire Police 56.1 0.1 0.1% -1.0 -1.8%West Mercia Police 114.3 0.2 0.2% 2.6 2.2%
Wiltshire Police 64.1 0.2 0.3% -1.4 -2.2%
WELSH POLICE AUTHORITIES
Dyfed-Powys Police 49.3 0.1 0.1% -0.4 -0.9%Gwent Police 82.7 -0.1 -0.2% -0.5 -0.6%North Wales Police 72.3 0.1 0.1% 0.0 0.0%South Wales Police 189.0 -0.4 -0.2% -2.4 -1.3%
68

Formula Grant Before Floor DampingLocal Authority
(£ million) (£ million) (%) (£ million) (%)
Difference from 2010-11 Indicative 2010-11 Indicative Allocation
Option POL1 Option POL2
SHIRE FIRE AUTHORITIES
Avon Fire 24.6 0.0 0.0% 0.0 0.0%Bedfordshire Fire 11.7 0.0 0.0% 0.0 0.0%Berkshire Fire Auhtority 13.0 0.0 0.0% 0.0 0.0%Buckinghamshire Fire 9.1 0.0 0.0% 0.0 0.0%Cambridgeshire Fire 15.1 0.0 0.0% 0.0 0.0%
Cheshire Fire 19.3 0.0 0.0% 0.0 0.0%Cleveland Fire 21.7 0.0 0.0% 0.0 0.0%Derbyshire Fire 20.6 0.0 0.0% 0.0 0.0%Devon and Somerset Fire 32.1 0.0 0.0% 0.0 0.0%Dorset Fire 11.1 0.0 0.0% 0.0 0.0%
Durham Fire 14.9 0.0 0.0% 0.0 0.0%East Sussex Fire 15.0 0.0 0.0% 0.0 0.0%Essex Fire Auhtority 33.3 0.0 0.0% 0.0 0.0%Hampshire Fire 29.9 0.0 0.0% 0.0 0.0%Hereford & Worcester Fire 10.8 0.0 0.0% 0.0 0.0%
Humberside Fire 28.2 0.0 0.0% 0.0 0.0%Kent Fire 30.2 0.0 0.0% 0.0 0.0%Lancashire Fire 32.6 0.0 0.0% 0.0 0.0%Leicestershire Fire 19.2 0.0 0.0% 0.0 0.0%North Yorkshire Fire 11.6 0.0 0.0% 0.0 0.0%
Nottinghamshire Fire 26.3 0.0 0.0% 0.0 0.0%Shropshire Fire 8.6 0.0 0.0% 0.0 0.0%Staffordshire Fire 19.1 0.0 0.0% 0.0 0.0%Wiltshire Fire 9.7 0.0 0.0% 0.0 0.0%
69

Base Position = 2010-11 Indicative Allocation + Part of 2010-11 Additional Rule 2 GrantBase Position 2 = 2010-11 Indicative Allocation + 2010-11 Additional Rule 2 Grant Formula Grant Before Floor DampingLocal Authority
(£ million) (£ million) (£ million) (£ million) (%) (£ million) (£ million) (£ million) (%)
England and Wales 29,388.8 23.2 29,412.0 0.0 0.0% 93.8 29,482.6 0.0 0.0%
England 28,995.5 21.9 29,017.4 0.1 0.0% 88.1 29,083.6 0.8 0.0%Wales 393.3 1.3 394.6 -0.1 0.0% 5.6 399.0 -0.8 -0.2%
London area 6,153.4 0.0 6,153.4 4.9 0.1% 27.3 6,180.7 -7.4 -0.1%Metropolitan areas 8,340.7 5.4 8,346.1 0.2 0.0% 5.4 8,346.1 17.3 0.2%Shire areas 14,499.1 16.6 14,515.6 -5.1 0.0% 55.5 14,554.6 -9.1 -0.1%Isles of Scilly 2.3 0.0 2.3 0.0 0.0% 0.0 2.3 0.0 0.0%
Inner London boroughs incl. City 2,025.0 0.0 2,025.0 0.1 0.0% 0.5 2,025.6 -0.1 0.0%Outer London boroughs 1,873.1 0.0 1,873.1 0.0 0.0% 0.0 1,873.1 0.0 0.0%London boroughs 3,898.1 0.0 3,898.1 0.1 0.0% 0.5 3,898.7 -0.1 0.0%GLA - all functions 2,255.3 0.0 2,255.3 4.8 0.2% 26.7 2,282.0 -7.3 -0.3%
Metropolitan districts 5,904.0 0.0 5,904.0 0.0 0.0% 0.0 5,904.0 0.0 0.0%Metropolitan fire authorities 335.8 0.0 335.8 0.0 0.0% 0.0 335.8 0.0 0.0%Metropolitan police authorities 2,100.9 5.4 2,106.2 0.2 0.0% 5.4 2,106.2 17.3 0.8%
Shire unitaries with fire 425.6 0.0 425.6 0.0 0.0% 0.0 425.6 0.0 0.0%Shire unitaries without fire 4,099.3 0.0 4,099.3 0.0 0.0% 0.0 4,099.3 0.0 0.0%Shire counties with fire 1,589.0 0.0 1,589.0 0.0 0.0% 0.0 1,589.0 0.0 0.0%Shire counties without fire 2,501.9 0.0 2,501.9 0.0 0.0% 0.0 2,501.9 0.0 0.0%Shire districts 1,654.0 0.0 1,654.0 0.0 0.0% 0.0 1,654.0 0.0 0.0%Combined fire authorities 467.7 0.0 467.7 0.0 0.0% 0.0 467.7 0.0 0.0%Shire police authorities 3,761.6 16.6 3,778.1 -5.1 -0.1% 55.5 3,817.1 -9.1 -0.2%
GO REGIONAL SUMMARY
South West GOR 2,267.3 2.2 2,269.5 -0.5 0.0% 8.6 2,275.9 -1.4 -0.1%South East GOR 2,957.0 5.3 2,962.4 -2.4 -0.1% 17.1 2,974.1 -5.1 -0.2%London GOR 6,153.4 0.0 6,153.4 4.9 0.1% 27.3 6,180.7 -7.4 -0.1%Eastern GOR 2,437.8 2.6 2,440.4 -0.6 0.0% 12.0 2,449.8 -4.0 -0.2%East Midlands GOR 2,292.2 1.6 2,293.8 0.0 0.0% 5.2 2,297.4 1.2 0.1%West Midlands GOR 3,349.9 3.7 3,353.6 -1.4 0.0% 6.9 3,356.8 2.6 0.1%Yorkshire and Humber GOR 3,199.2 1.4 3,200.7 0.7 0.0% 4.2 3,203.4 4.6 0.1%North East GOR 1,777.2 0.3 1,777.5 0.8 0.0% 0.5 1,777.7 4.0 0.2%North West GOR 4,561.4 4.8 4,566.1 -1.6 0.0% 6.4 4,567.7 6.3 0.1%
FLOOR DAMPING GROUPS
Education Authorities 18,418.0 0.0 18,418.0 0.1 0.0% 0.0 18,418.0 0.5 0.0%Police Authorities 7,864.8 0.0 7,864.8 21.9 0.3% 0.0 7,864.8 88.5 1.1%Fire Authorities 1,056.5 0.0 1,056.5 0.0 0.0% 0.0 1,056.5 0.0 0.0%Shire Districts 1,654.0 0.0 1,654.0 0.0 0.0% 0.0 1,654.0 0.0 0.0%
Police - Rolling in Rule 2
Option POL4Option POL3
2010-11 Indicative Allocation
Part of 2010-11
Additional Rule 2 Grant
Base Position
2010-11 Additional
Rule 2 Grant
Base Position 2
Difference from Base Position
Difference from Base Position 2
70
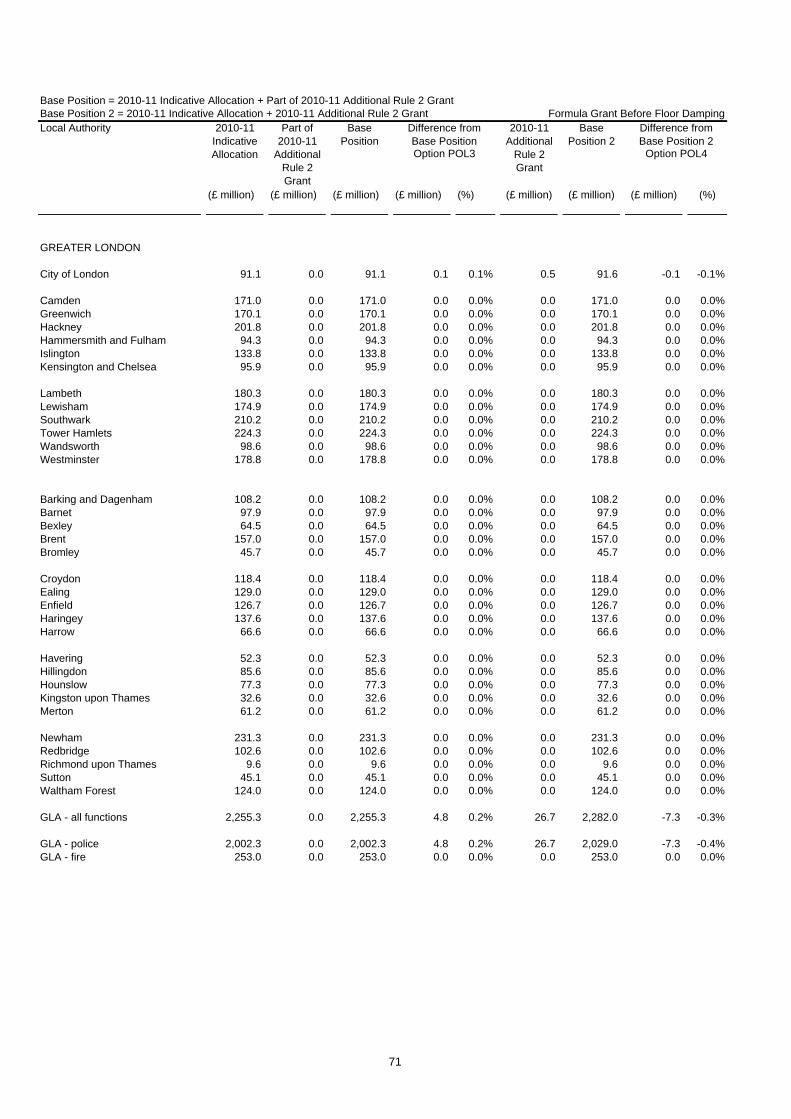
Base Position = 2010-11 Indicative Allocation + Part of 2010-11 Additional Rule 2 GrantBase Position 2 = 2010-11 Indicative Allocation + 2010-11 Additional Rule 2 Grant Formula Grant Before Floor DampingLocal Authority
(£ million) (£ million) (£ million) (£ million) (%) (£ million) (£ million) (£ million) (%)
Option POL4Option POL3
2010-11 Indicative Allocation
Part of 2010-11
Additional Rule 2 Grant
Base Position
2010-11 Additional
Rule 2 Grant
Base Position 2
Difference from Base Position
Difference from Base Position 2
GREATER LONDON
City of London 91.1 0.0 91.1 0.1 0.1% 0.5 91.6 -0.1 -0.1%
Camden 171.0 0.0 171.0 0.0 0.0% 0.0 171.0 0.0 0.0%Greenwich 170.1 0.0 170.1 0.0 0.0% 0.0 170.1 0.0 0.0%Hackney 201.8 0.0 201.8 0.0 0.0% 0.0 201.8 0.0 0.0%Hammersmith and Fulham 94.3 0.0 94.3 0.0 0.0% 0.0 94.3 0.0 0.0%Islington 133.8 0.0 133.8 0.0 0.0% 0.0 133.8 0.0 0.0%Kensington and Chelsea 95.9 0.0 95.9 0.0 0.0% 0.0 95.9 0.0 0.0%
Lambeth 180.3 0.0 180.3 0.0 0.0% 0.0 180.3 0.0 0.0%Lewisham 174.9 0.0 174.9 0.0 0.0% 0.0 174.9 0.0 0.0%Southwark 210.2 0.0 210.2 0.0 0.0% 0.0 210.2 0.0 0.0%Tower Hamlets 224.3 0.0 224.3 0.0 0.0% 0.0 224.3 0.0 0.0%Wandsworth 98.6 0.0 98.6 0.0 0.0% 0.0 98.6 0.0 0.0%Westminster 178.8 0.0 178.8 0.0 0.0% 0.0 178.8 0.0 0.0%
Barking and Dagenham 108.2 0.0 108.2 0.0 0.0% 0.0 108.2 0.0 0.0%Barnet 97.9 0.0 97.9 0.0 0.0% 0.0 97.9 0.0 0.0%Bexley 64.5 0.0 64.5 0.0 0.0% 0.0 64.5 0.0 0.0%Brent 157.0 0.0 157.0 0.0 0.0% 0.0 157.0 0.0 0.0%Bromley 45.7 0.0 45.7 0.0 0.0% 0.0 45.7 0.0 0.0%
Croydon 118.4 0.0 118.4 0.0 0.0% 0.0 118.4 0.0 0.0%Ealing 129.0 0.0 129.0 0.0 0.0% 0.0 129.0 0.0 0.0%Enfield 126.7 0.0 126.7 0.0 0.0% 0.0 126.7 0.0 0.0%Haringey 137.6 0.0 137.6 0.0 0.0% 0.0 137.6 0.0 0.0%Harrow 66.6 0.0 66.6 0.0 0.0% 0.0 66.6 0.0 0.0%
Havering 52.3 0.0 52.3 0.0 0.0% 0.0 52.3 0.0 0.0%Hillingdon 85.6 0.0 85.6 0.0 0.0% 0.0 85.6 0.0 0.0%Hounslow 77.3 0.0 77.3 0.0 0.0% 0.0 77.3 0.0 0.0%Kingston upon Thames 32.6 0.0 32.6 0.0 0.0% 0.0 32.6 0.0 0.0%Merton 61.2 0.0 61.2 0.0 0.0% 0.0 61.2 0.0 0.0%
Newham 231.3 0.0 231.3 0.0 0.0% 0.0 231.3 0.0 0.0%Redbridge 102.6 0.0 102.6 0.0 0.0% 0.0 102.6 0.0 0.0%Richmond upon Thames 9.6 0.0 9.6 0.0 0.0% 0.0 9.6 0.0 0.0%Sutton 45.1 0.0 45.1 0.0 0.0% 0.0 45.1 0.0 0.0%Waltham Forest 124.0 0.0 124.0 0.0 0.0% 0.0 124.0 0.0 0.0%
GLA - all functions 2,255.3 0.0 2,255.3 4.8 0.2% 26.7 2,282.0 -7.3 -0.3%
GLA - police 2,002.3 0.0 2,002.3 4.8 0.2% 26.7 2,029.0 -7.3 -0.4%GLA - fire 253.0 0.0 253.0 0.0 0.0% 0.0 253.0 0.0 0.0%
71

Base Position = 2010-11 Indicative Allocation + Part of 2010-11 Additional Rule 2 GrantBase Position 2 = 2010-11 Indicative Allocation + 2010-11 Additional Rule 2 Grant Formula Grant Before Floor DampingLocal Authority
(£ million) (£ million) (£ million) (£ million) (%) (£ million) (£ million) (£ million) (%)
Option POL4Option POL3
2010-11 Indicative Allocation
Part of 2010-11
Additional Rule 2 Grant
Base Position
2010-11 Additional
Rule 2 Grant
Base Position 2
Difference from Base Position
Difference from Base Position 2
GREATER MANCHESTERBolton 132.6 0.0 132.6 0.0 0.0% 0.0 132.6 0.0 0.0%Bury 67.5 0.0 67.5 0.0 0.0% 0.0 67.5 0.0 0.0%Manchester 346.1 0.0 346.1 0.0 0.0% 0.0 346.1 0.0 0.0%Oldham 127.6 0.0 127.6 0.0 0.0% 0.0 127.6 0.0 0.0%Rochdale 114.9 0.0 114.9 0.0 0.0% 0.0 114.9 0.0 0.0%Salford 131.2 0.0 131.2 0.0 0.0% 0.0 131.2 0.0 0.0%Stockport 85.2 0.0 85.2 0.0 0.0% 0.0 85.2 0.0 0.0%Tameside 109.5 0.0 109.5 0.0 0.0% 0.0 109.5 0.0 0.0%Trafford 67.3 0.0 67.3 0.0 0.0% 0.0 67.3 0.0 0.0%Wigan 138.6 0.0 138.6 0.0 0.0% 0.0 138.6 0.0 0.0%Greater Manchester Fire 76.1 0.0 76.1 0.0 0.0% 0.0 76.1 0.0 0.0%Greater Manchester Police 485.7 1.3 487.1 0.0 0.0% 1.3 487.1 3.9 0.8%
MERSEYSIDEKnowsley 114.6 0.0 114.6 0.0 0.0% 0.0 114.6 0.0 0.0%Liverpool 318.0 0.0 318.0 0.0 0.0% 0.0 318.0 0.0 0.0%Sefton 127.6 0.0 127.6 0.0 0.0% 0.0 127.6 0.0 0.0%St Helens 90.9 0.0 90.9 0.0 0.0% 0.0 90.9 0.0 0.0%Wirral 165.2 0.0 165.2 0.0 0.0% 0.0 165.2 0.0 0.0%Merseyside Fire 46.1 0.0 46.1 0.0 0.0% 0.0 46.1 0.0 0.0%Merseyside Police 275.5 1.0 276.6 -0.3 -0.1% 1.0 276.6 1.9 0.7%
SOUTH YORKSHIREBarnsley 114.3 0.0 114.3 0.0 0.0% 0.0 114.3 0.0 0.0%Doncaster 149.1 0.0 149.1 0.0 0.0% 0.0 149.1 0.0 0.0%Rotherham 130.1 0.0 130.1 0.0 0.0% 0.0 130.1 0.0 0.0%Sheffield 280.0 0.0 280.0 0.0 0.0% 0.0 280.0 0.0 0.0%South Yorkshire Fire 37.4 0.0 37.4 0.0 0.0% 0.0 37.4 0.0 0.0%South Yorkshire Police 209.2 0.3 209.5 0.2 0.1% 0.3 209.5 2.0 0.9%
TYNE AND WEARGateshead 102.7 0.0 102.7 0.0 0.0% 0.0 102.7 0.0 0.0%Newcastle upon Tyne 157.2 0.0 157.2 0.0 0.0% 0.0 157.2 0.0 0.0%North Tyneside 87.4 0.0 87.4 0.0 0.0% 0.0 87.4 0.0 0.0%South Tyneside 89.3 0.0 89.3 0.0 0.0% 0.0 89.3 0.0 0.0%Sunderland 158.9 0.0 158.9 0.0 0.0% 0.0 158.9 0.0 0.0%Tyne and Wear Fire 35.9 0.0 35.9 0.0 0.0% 0.0 35.9 0.0 0.0%Northumbria Police 219.9 0.0 220.0 0.5 0.2% 0.0 220.0 2.4 1.1%
WEST MIDLANDSBirmingham 698.9 0.0 698.9 0.0 0.0% 0.0 698.9 0.0 0.0%Coventry 156.6 0.0 156.6 0.0 0.0% 0.0 156.6 0.0 0.0%Dudley 130.4 0.0 130.4 0.0 0.0% 0.0 130.4 0.0 0.0%Sandwell 190.3 0.0 190.3 0.0 0.0% 0.0 190.3 0.0 0.0%Solihull 49.1 0.0 49.1 0.0 0.0% 0.0 49.1 0.0 0.0%Walsall 142.3 0.0 142.3 0.0 0.0% 0.0 142.3 0.0 0.0%Wolverhampton 145.6 0.0 145.6 0.0 0.0% 0.0 145.6 0.0 0.0%West Midlands Fire 81.6 0.0 81.6 0.0 0.0% 0.0 81.6 0.0 0.0%West Midlands Police 542.2 2.0 544.3 -0.6 -0.1% 2.0 544.3 3.7 0.7%
WEST YORKSHIREBradford 283.4 0.0 283.4 0.0 0.0% 0.0 283.4 0.0 0.0%Calderdale 84.1 0.0 84.1 0.0 0.0% 0.0 84.1 0.0 0.0%Kirklees 164.9 0.0 164.9 0.0 0.0% 0.0 164.9 0.0 0.0%Leeds 305.9 0.0 305.9 0.0 0.0% 0.0 305.9 0.0 0.0%Wakefield 146.7 0.0 146.7 0.0 0.0% 0.0 146.7 0.0 0.0%West Yorkshire Fire 58.7 0.0 58.7 0.0 0.0% 0.0 58.7 0.0 0.0%West Yorkshire Police 368.2 0.6 368.8 0.4 0.1% 0.6 368.8 3.4 0.9%
72

Base Position = 2010-11 Indicative Allocation + Part of 2010-11 Additional Rule 2 GrantBase Position 2 = 2010-11 Indicative Allocation + 2010-11 Additional Rule 2 Grant Formula Grant Before Floor DampingLocal Authority
(£ million) (£ million) (£ million) (£ million) (%) (£ million) (£ million) (£ million) (%)
Option POL4Option POL3
2010-11 Indicative Allocation
Part of 2010-11
Additional Rule 2 Grant
Base Position
2010-11 Additional
Rule 2 Grant
Base Position 2
Difference from Base Position
Difference from Base Position 2
ALL PURPOSE AUTHORITIES
Bath & North East Somerset 44.1 0.0 44.1 0.0 0.0% 0.0 44.1 0.0 0.0%Bedford 55.4 0.0 55.4 0.0 0.0% 0.0 55.4 0.0 0.0%Blackburn with Darwen 88.5 0.0 88.5 0.0 0.0% 0.0 88.5 0.0 0.0%Blackpool 86.9 0.0 86.9 0.0 0.0% 0.0 86.9 0.0 0.0%Bournemouth 49.4 0.0 49.4 0.0 0.0% 0.0 49.4 0.0 0.0%
Bracknell Forest 22.6 0.0 22.6 0.0 0.0% 0.0 22.6 0.0 0.0%Brighton & Hove 89.8 0.0 89.8 0.0 0.0% 0.0 89.8 0.0 0.0%Bristol 171.2 0.0 171.2 0.0 0.0% 0.0 171.2 0.0 0.0%Central Bedfordshire 51.9 0.0 51.9 0.0 0.0% 0.0 51.9 0.0 0.0%Cheshire East 64.5 0.0 64.5 0.0 0.0% 0.0 64.5 0.0 0.0%
Cheshire West & Chester 94.9 0.0 94.9 0.0 0.0% 0.0 94.9 0.0 0.0%Cornwall 227.6 0.0 227.6 0.0 0.0% 0.0 227.6 0.0 0.0%Darlington 40.1 0.0 40.1 0.0 0.0% 0.0 40.1 0.0 0.0%Derby 114.5 0.0 114.5 0.0 0.0% 0.0 114.5 0.0 0.0%Durham 238.7 0.0 238.7 0.0 0.0% 0.0 238.7 0.0 0.0%
East Riding of Yorkshire 109.2 0.0 109.2 0.0 0.0% 0.0 109.2 0.0 0.0%Halton 65.5 0.0 65.5 0.0 0.0% 0.0 65.5 0.0 0.0%Hartlepool 54.0 0.0 54.0 0.0 0.0% 0.0 54.0 0.0 0.0%Herefordshire 61.2 0.0 61.2 0.0 0.0% 0.0 61.2 0.0 0.0%Isle of Wight Council 65.0 0.0 65.0 0.0 0.0% 0.0 65.0 0.0 0.0%
Kingston upon Hull 159.2 0.0 159.2 0.0 0.0% 0.0 159.2 0.0 0.0%Leicester 188.4 0.0 188.4 0.0 0.0% 0.0 188.4 0.0 0.0%Luton 94.6 0.0 94.6 0.0 0.0% 0.0 94.6 0.0 0.0%Medway 89.5 0.0 89.5 0.0 0.0% 0.0 89.5 0.0 0.0%Middlesbrough 85.4 0.0 85.4 0.0 0.0% 0.0 85.4 0.0 0.0%
Milton Keynes 91.6 0.0 91.6 0.0 0.0% 0.0 91.6 0.0 0.0%North East Lincolnshire 76.9 0.0 76.9 0.0 0.0% 0.0 76.9 0.0 0.0%North Lincolnshire 66.3 0.0 66.3 0.0 0.0% 0.0 66.3 0.0 0.0%North Somerset 54.6 0.0 54.6 0.0 0.0% 0.0 54.6 0.0 0.0%Northumberland 133.1 0.0 133.1 0.0 0.0% 0.0 133.1 0.0 0.0%
Nottingham 179.5 0.0 179.5 0.0 0.0% 0.0 179.5 0.0 0.0%Peterborough 80.9 0.0 80.9 0.0 0.0% 0.0 80.9 0.0 0.0%Plymouth 108.7 0.0 108.7 0.0 0.0% 0.0 108.7 0.0 0.0%Poole 25.6 0.0 25.6 0.0 0.0% 0.0 25.6 0.0 0.0%Portsmouth 87.8 0.0 87.8 0.0 0.0% 0.0 87.8 0.0 0.0%
Reading 48.0 0.0 48.0 0.0 0.0% 0.0 48.0 0.0 0.0%Redcar and Cleveland 71.4 0.0 71.4 0.0 0.0% 0.0 71.4 0.0 0.0%Rutland 8.6 0.0 8.6 0.0 0.0% 0.0 8.6 0.0 0.0%Shropshire 97.4 0.0 97.4 0.0 0.0% 0.0 97.4 0.0 0.0%Slough 52.8 0.0 52.8 0.0 0.0% 0.0 52.8 0.0 0.0%
South Gloucestershire 64.0 0.0 64.0 0.0 0.0% 0.0 64.0 0.0 0.0%Southampton 101.2 0.0 101.2 0.0 0.0% 0.0 101.2 0.0 0.0%Southend-on-Sea 62.3 0.0 62.3 0.0 0.0% 0.0 62.3 0.0 0.0%Stockton-on-Tees 80.6 0.0 80.6 0.0 0.0% 0.0 80.6 0.0 0.0%Stoke-on-Trent 133.5 0.0 133.5 0.0 0.0% 0.0 133.5 0.0 0.0%
Swindon 43.7 0.0 43.7 0.0 0.0% 0.0 43.7 0.0 0.0%Telford and the Wrekin 76.0 0.0 76.0 0.0 0.0% 0.0 76.0 0.0 0.0%Thurrock 62.1 0.0 62.1 0.0 0.0% 0.0 62.1 0.0 0.0%Torbay 64.2 0.0 64.2 0.0 0.0% 0.0 64.2 0.0 0.0%Warrington 52.7 0.0 52.7 0.0 0.0% 0.0 52.7 0.0 0.0%
73
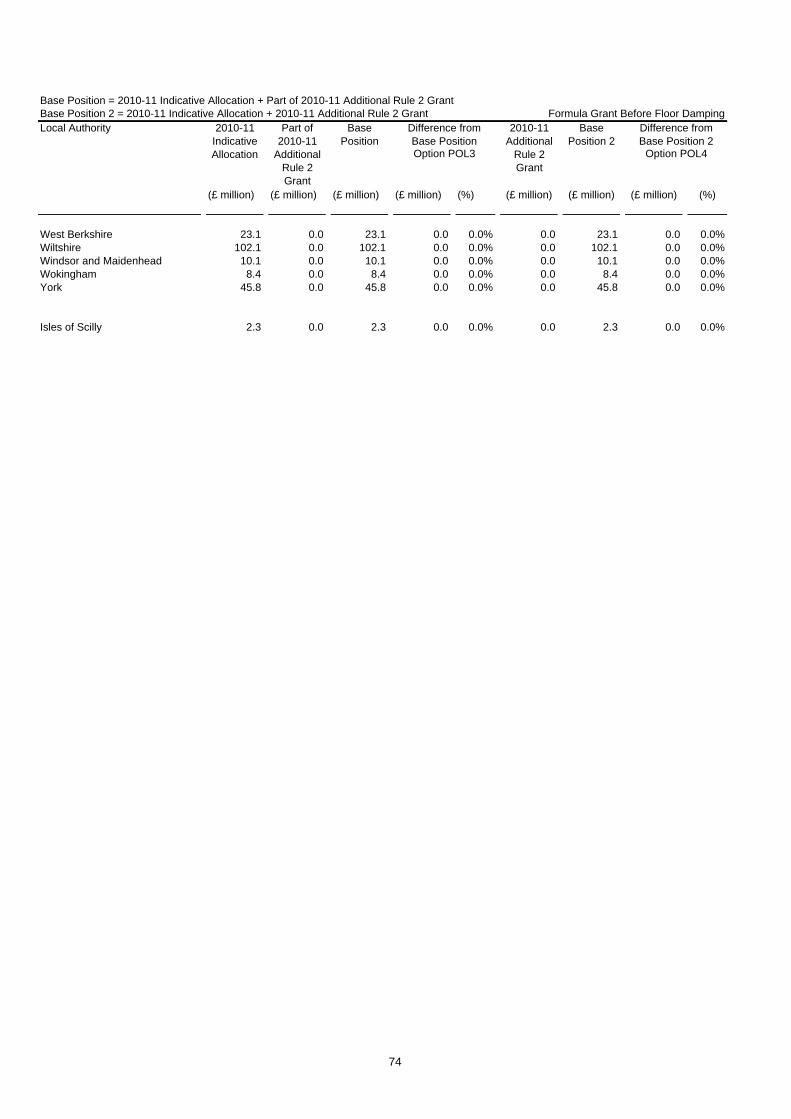
Base Position = 2010-11 Indicative Allocation + Part of 2010-11 Additional Rule 2 GrantBase Position 2 = 2010-11 Indicative Allocation + 2010-11 Additional Rule 2 Grant Formula Grant Before Floor DampingLocal Authority
(£ million) (£ million) (£ million) (£ million) (%) (£ million) (£ million) (£ million) (%)
Option POL4Option POL3
2010-11 Indicative Allocation
Part of 2010-11
Additional Rule 2 Grant
Base Position
2010-11 Additional
Rule 2 Grant
Base Position 2
Difference from Base Position
Difference from Base Position 2
West Berkshire 23.1 0.0 23.1 0.0 0.0% 0.0 23.1 0.0 0.0%Wiltshire 102.1 0.0 102.1 0.0 0.0% 0.0 102.1 0.0 0.0%Windsor and Maidenhead 10.1 0.0 10.1 0.0 0.0% 0.0 10.1 0.0 0.0%Wokingham 8.4 0.0 8.4 0.0 0.0% 0.0 8.4 0.0 0.0%York 45.8 0.0 45.8 0.0 0.0% 0.0 45.8 0.0 0.0%
Isles of Scilly 2.3 0.0 2.3 0.0 0.0% 0.0 2.3 0.0 0.0%
74

Base Position = 2010-11 Indicative Allocation + Part of 2010-11 Additional Rule 2 GrantBase Position 2 = 2010-11 Indicative Allocation + 2010-11 Additional Rule 2 Grant Formula Grant Before Floor DampingLocal Authority
(£ million) (£ million) (£ million) (£ million) (%) (£ million) (£ million) (£ million) (%)
Option POL4Option POL3
2010-11 Indicative Allocation
Part of 2010-11
Additional Rule 2 Grant
Base Position
2010-11 Additional
Rule 2 Grant
Base Position 2
Difference from Base Position
Difference from Base Position 2
SHIRE COUNTIES
Buckinghamshire 43.5 0.0 43.5 0.0 0.0% 0.0 43.5 0.0 0.0%Cambridgeshire 113.1 0.0 113.1 0.0 0.0% 0.0 113.1 0.0 0.0%Cumbria 157.5 0.0 157.5 0.0 0.0% 0.0 157.5 0.0 0.0%Derbyshire 204.0 0.0 204.0 0.0 0.0% 0.0 204.0 0.0 0.0%Devon 176.4 0.0 176.4 0.0 0.0% 0.0 176.4 0.0 0.0%
Dorset 57.6 0.0 57.6 0.0 0.0% 0.0 57.6 0.0 0.0%East Sussex 105.4 0.0 105.4 0.0 0.0% 0.0 105.4 0.0 0.0%Essex 258.3 0.0 258.3 0.0 0.0% 0.0 258.3 0.0 0.0%Gloucestershire 124.0 0.0 124.0 0.0 0.0% 0.0 124.0 0.0 0.0%Hampshire 126.6 0.0 126.6 0.0 0.0% 0.0 126.6 0.0 0.0%
Hertfordshire 148.3 0.0 148.3 0.0 0.0% 0.0 148.3 0.0 0.0%Kent 287.9 0.0 287.9 0.0 0.0% 0.0 287.9 0.0 0.0%Lancashire 328.9 0.0 328.9 0.0 0.0% 0.0 328.9 0.0 0.0%Leicestershire 107.5 0.0 107.5 0.0 0.0% 0.0 107.5 0.0 0.0%Lincolnshire 210.6 0.0 210.6 0.0 0.0% 0.0 210.6 0.0 0.0%
Norfolk 260.4 0.0 260.4 0.0 0.0% 0.0 260.4 0.0 0.0%North Yorkshire 113.7 0.0 113.7 0.0 0.0% 0.0 113.7 0.0 0.0%Northamptonshire 162.2 0.0 162.2 0.0 0.0% 0.0 162.2 0.0 0.0%Nottinghamshire 191.6 0.0 191.6 0.0 0.0% 0.0 191.6 0.0 0.0%Oxfordshire 99.8 0.0 99.8 0.0 0.0% 0.0 99.8 0.0 0.0%
Somerset 120.7 0.0 120.7 0.0 0.0% 0.0 120.7 0.0 0.0%Staffordshire 169.7 0.0 169.7 0.0 0.0% 0.0 169.7 0.0 0.0%Suffolk 181.0 0.0 181.0 0.0 0.0% 0.0 181.0 0.0 0.0%Surrey 60.1 0.0 60.1 0.0 0.0% 0.0 60.1 0.0 0.0%Warwickshire 96.6 0.0 96.6 0.0 0.0% 0.0 96.6 0.0 0.0%
West Sussex 88.4 0.0 88.4 0.0 0.0% 0.0 88.4 0.0 0.0%Worcestershire 96.9 0.0 96.9 0.0 0.0% 0.0 96.9 0.0 0.0%
75

Base Position = 2010-11 Indicative Allocation + Part of 2010-11 Additional Rule 2 GrantBase Position 2 = 2010-11 Indicative Allocation + 2010-11 Additional Rule 2 Grant Formula Grant Before Floor DampingLocal Authority
(£ million) (£ million) (£ million) (£ million) (%) (£ million) (£ million) (£ million) (%)
Option POL4Option POL3
2010-11 Indicative Allocation
Part of 2010-11
Additional Rule 2 Grant
Base Position
2010-11 Additional
Rule 2 Grant
Base Position 2
Difference from Base Position
Difference from Base Position 2
BUCKINGHAMSHIREAylesbury Vale 12.1 0.0 12.1 0.0 0.0% 0.0 12.1 0.0 0.0%Chiltern 3.2 0.0 3.2 0.0 0.0% 0.0 3.2 0.0 0.0%South Bucks 2.3 0.0 2.3 0.0 0.0% 0.0 2.3 0.0 0.0%Wycombe 9.5 0.0 9.5 0.0 0.0% 0.0 9.5 0.0 0.0%
CAMBRIDGESHIRECambridge 12.0 0.0 12.0 0.0 0.0% 0.0 12.0 0.0 0.0%East Cambridgeshire 6.8 0.0 6.8 0.0 0.0% 0.0 6.8 0.0 0.0%Fenland 9.9 0.0 9.9 0.0 0.0% 0.0 9.9 0.0 0.0%Huntingdonshire 13.4 0.0 13.4 0.0 0.0% 0.0 13.4 0.0 0.0%South Cambridgeshire 7.9 0.0 7.9 0.0 0.0% 0.0 7.9 0.0 0.0%
CUMBRIAAllerdale 10.4 0.0 10.4 0.0 0.0% 0.0 10.4 0.0 0.0%Barrow-in-Furness 9.1 0.0 9.1 0.0 0.0% 0.0 9.1 0.0 0.0%Carlisle 10.2 0.0 10.2 0.0 0.0% 0.0 10.2 0.0 0.0%Copeland 7.2 0.0 7.2 0.0 0.0% 0.0 7.2 0.0 0.0%Eden 4.7 0.0 4.7 0.0 0.0% 0.0 4.7 0.0 0.0%South Lakeland 6.8 0.0 6.8 0.0 0.0% 0.0 6.8 0.0 0.0%
DERBYSHIREAmber Valley 10.0 0.0 10.0 0.0 0.0% 0.0 10.0 0.0 0.0%Bolsover 8.0 0.0 8.0 0.0 0.0% 0.0 8.0 0.0 0.0%Chesterfield 10.2 0.0 10.2 0.0 0.0% 0.0 10.2 0.0 0.0%Derbyshire Dales 4.7 0.0 4.7 0.0 0.0% 0.0 4.7 0.0 0.0%Erewash 9.7 0.0 9.7 0.0 0.0% 0.0 9.7 0.0 0.0%High Peak 7.2 0.0 7.2 0.0 0.0% 0.0 7.2 0.0 0.0%North East Derbyshire 7.9 0.0 7.9 0.0 0.0% 0.0 7.9 0.0 0.0%South Derbyshire 7.5 0.0 7.5 0.0 0.0% 0.0 7.5 0.0 0.0%
DEVONEast Devon 8.4 0.0 8.4 0.0 0.0% 0.0 8.4 0.0 0.0%Exeter 12.1 0.0 12.1 0.0 0.0% 0.0 12.1 0.0 0.0%Mid Devon 6.3 0.0 6.3 0.0 0.0% 0.0 6.3 0.0 0.0%North Devon 8.5 0.0 8.5 0.0 0.0% 0.0 8.5 0.0 0.0%South Hams 5.6 0.0 5.6 0.0 0.0% 0.0 5.6 0.0 0.0%Teignbridge 10.1 0.0 10.1 0.0 0.0% 0.0 10.1 0.0 0.0%Torridge 6.6 0.0 6.6 0.0 0.0% 0.0 6.6 0.0 0.0%West Devon 4.4 0.0 4.4 0.0 0.0% 0.0 4.4 0.0 0.0%
DORSETChristchurch 2.9 0.0 2.9 0.0 0.0% 0.0 2.9 0.0 0.0%East Dorset 3.8 0.0 3.8 0.0 0.0% 0.0 3.8 0.0 0.0%North Dorset 4.7 0.0 4.7 0.0 0.0% 0.0 4.7 0.0 0.0%Purbeck 3.3 0.0 3.3 0.0 0.0% 0.0 3.3 0.0 0.0%West Dorset 7.9 0.0 7.9 0.0 0.0% 0.0 7.9 0.0 0.0%Weymouth and Portland 6.1 0.0 6.1 0.0 0.0% 0.0 6.1 0.0 0.0%
EAST SUSSEXEastbourne 10.5 0.0 10.5 0.0 0.0% 0.0 10.5 0.0 0.0%Hastings 10.6 0.0 10.6 0.0 0.0% 0.0 10.6 0.0 0.0%Lewes 6.6 0.0 6.6 0.0 0.0% 0.0 6.6 0.0 0.0%Rother 6.5 0.0 6.5 0.0 0.0% 0.0 6.5 0.0 0.0%Wealden 8.4 0.0 8.4 0.0 0.0% 0.0 8.4 0.0 0.0%
76

Base Position = 2010-11 Indicative Allocation + Part of 2010-11 Additional Rule 2 GrantBase Position 2 = 2010-11 Indicative Allocation + 2010-11 Additional Rule 2 Grant Formula Grant Before Floor DampingLocal Authority
(£ million) (£ million) (£ million) (£ million) (%) (£ million) (£ million) (£ million) (%)
Option POL4Option POL3
2010-11 Indicative Allocation
Part of 2010-11
Additional Rule 2 Grant
Base Position
2010-11 Additional
Rule 2 Grant
Base Position 2
Difference from Base Position
Difference from Base Position 2
ESSEXBasildon 16.1 0.0 16.1 0.0 0.0% 0.0 16.1 0.0 0.0%Braintree 10.6 0.0 10.6 0.0 0.0% 0.0 10.6 0.0 0.0%Brentwood 4.4 0.0 4.4 0.0 0.0% 0.0 4.4 0.0 0.0%Castle Point 6.8 0.0 6.8 0.0 0.0% 0.0 6.8 0.0 0.0%Chelmsford 10.7 0.0 10.7 0.0 0.0% 0.0 10.7 0.0 0.0%Colchester 13.1 0.0 13.1 0.0 0.0% 0.0 13.1 0.0 0.0%Epping Forest 9.4 0.0 9.4 0.0 0.0% 0.0 9.4 0.0 0.0%Harlow 8.2 0.0 8.2 0.0 0.0% 0.0 8.2 0.0 0.0%Maldon 4.6 0.0 4.6 0.0 0.0% 0.0 4.6 0.0 0.0%Rochford 5.2 0.0 5.2 0.0 0.0% 0.0 5.2 0.0 0.0%Tendring 14.6 0.0 14.6 0.0 0.0% 0.0 14.6 0.0 0.0%Uttlesford 3.9 0.0 3.9 0.0 0.0% 0.0 3.9 0.0 0.0%
GLOUCESTERSHIRECheltenham 8.7 0.0 8.7 0.0 0.0% 0.0 8.7 0.0 0.0%Cotswold 5.5 0.0 5.5 0.0 0.0% 0.0 5.5 0.0 0.0%Forest of Dean 7.0 0.0 7.0 0.0 0.0% 0.0 7.0 0.0 0.0%Gloucester 10.8 0.0 10.8 0.0 0.0% 0.0 10.8 0.0 0.0%Stroud 7.3 0.0 7.3 0.0 0.0% 0.0 7.3 0.0 0.0%Tewkesbury 5.4 0.0 5.4 0.0 0.0% 0.0 5.4 0.0 0.0%
HAMPSHIREBasingstoke and Deane 10.3 0.0 10.3 0.0 0.0% 0.0 10.3 0.0 0.0%East Hampshire 5.9 0.0 5.9 0.0 0.0% 0.0 5.9 0.0 0.0%Eastleigh 7.8 0.0 7.8 0.0 0.0% 0.0 7.8 0.0 0.0%Fareham 6.1 0.0 6.1 0.0 0.0% 0.0 6.1 0.0 0.0%Gosport 7.1 0.0 7.1 0.0 0.0% 0.0 7.1 0.0 0.0%Hart 3.9 0.0 3.9 0.0 0.0% 0.0 3.9 0.0 0.0%Havant 9.9 0.0 9.9 0.0 0.0% 0.0 9.9 0.0 0.0%New Forest 11.8 0.0 11.8 0.0 0.0% 0.0 11.8 0.0 0.0%Rushmoor 6.3 0.0 6.3 0.0 0.0% 0.0 6.3 0.0 0.0%Test Valley 7.3 0.0 7.3 0.0 0.0% 0.0 7.3 0.0 0.0%Winchester 6.7 0.0 6.7 0.0 0.0% 0.0 6.7 0.0 0.0%
HERTFORDSHIREBroxbourne 7.0 0.0 7.0 0.0 0.0% 0.0 7.0 0.0 0.0%Dacorum 9.5 0.0 9.5 0.0 0.0% 0.0 9.5 0.0 0.0%East Hertfordshire 8.1 0.0 8.1 0.0 0.0% 0.0 8.1 0.0 0.0%Hertsmere 6.8 0.0 6.8 0.0 0.0% 0.0 6.8 0.0 0.0%North Hertfordshire 8.3 0.0 8.3 0.0 0.0% 0.0 8.3 0.0 0.0%St Albans 7.0 0.0 7.0 0.0 0.0% 0.0 7.0 0.0 0.0%Stevenage 7.6 0.0 7.6 0.0 0.0% 0.0 7.6 0.0 0.0%Three Rivers 5.1 0.0 5.1 0.0 0.0% 0.0 5.1 0.0 0.0%Watford 7.2 0.0 7.2 0.0 0.0% 0.0 7.2 0.0 0.0%Welwyn Hatfield 8.2 0.0 8.2 0.0 0.0% 0.0 8.2 0.0 0.0%
KENTAshford 8.6 0.0 8.6 0.0 0.0% 0.0 8.6 0.0 0.0%Canterbury 13.6 0.0 13.6 0.0 0.0% 0.0 13.6 0.0 0.0%Dartford 7.6 0.0 7.6 0.0 0.0% 0.0 7.6 0.0 0.0%Dover 9.9 0.0 9.9 0.0 0.0% 0.0 9.9 0.0 0.0%Gravesham 8.5 0.0 8.5 0.0 0.0% 0.0 8.5 0.0 0.0%Maidstone 9.0 0.0 9.0 0.0 0.0% 0.0 9.0 0.0 0.0%Sevenoaks 6.1 0.0 6.1 0.0 0.0% 0.0 6.1 0.0 0.0%Shepway 10.1 0.0 10.1 0.0 0.0% 0.0 10.1 0.0 0.0%Swale 12.2 0.0 12.2 0.0 0.0% 0.0 12.2 0.0 0.0%Thanet 13.4 0.0 13.4 0.0 0.0% 0.0 13.4 0.0 0.0%Tonbridge and Malling 6.5 0.0 6.5 0.0 0.0% 0.0 6.5 0.0 0.0%Tunbridge Wells 6.5 0.0 6.5 0.0 0.0% 0.0 6.5 0.0 0.0%
77
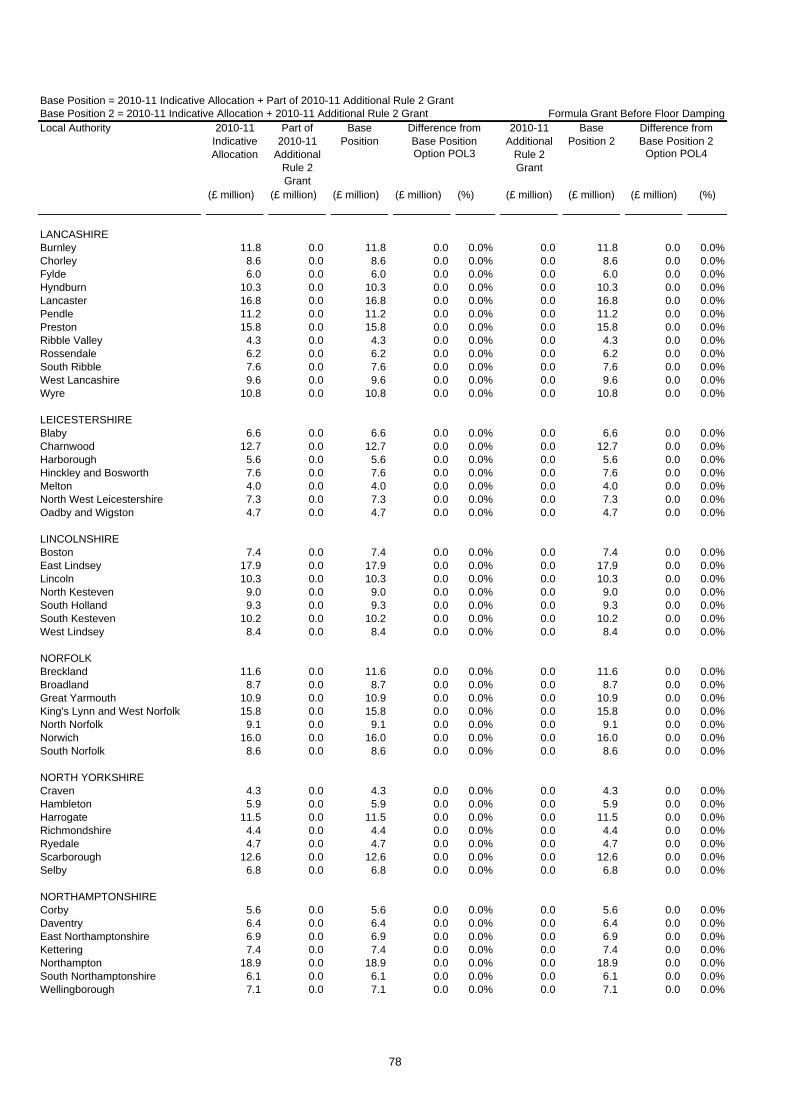
Base Position = 2010-11 Indicative Allocation + Part of 2010-11 Additional Rule 2 GrantBase Position 2 = 2010-11 Indicative Allocation + 2010-11 Additional Rule 2 Grant Formula Grant Before Floor DampingLocal Authority
(£ million) (£ million) (£ million) (£ million) (%) (£ million) (£ million) (£ million) (%)
Option POL4Option POL3
2010-11 Indicative Allocation
Part of 2010-11
Additional Rule 2 Grant
Base Position
2010-11 Additional
Rule 2 Grant
Base Position 2
Difference from Base Position
Difference from Base Position 2
LANCASHIREBurnley 11.8 0.0 11.8 0.0 0.0% 0.0 11.8 0.0 0.0%Chorley 8.6 0.0 8.6 0.0 0.0% 0.0 8.6 0.0 0.0%Fylde 6.0 0.0 6.0 0.0 0.0% 0.0 6.0 0.0 0.0%Hyndburn 10.3 0.0 10.3 0.0 0.0% 0.0 10.3 0.0 0.0%Lancaster 16.8 0.0 16.8 0.0 0.0% 0.0 16.8 0.0 0.0%Pendle 11.2 0.0 11.2 0.0 0.0% 0.0 11.2 0.0 0.0%Preston 15.8 0.0 15.8 0.0 0.0% 0.0 15.8 0.0 0.0%Ribble Valley 4.3 0.0 4.3 0.0 0.0% 0.0 4.3 0.0 0.0%Rossendale 6.2 0.0 6.2 0.0 0.0% 0.0 6.2 0.0 0.0%South Ribble 7.6 0.0 7.6 0.0 0.0% 0.0 7.6 0.0 0.0%West Lancashire 9.6 0.0 9.6 0.0 0.0% 0.0 9.6 0.0 0.0%Wyre 10.8 0.0 10.8 0.0 0.0% 0.0 10.8 0.0 0.0%
LEICESTERSHIREBlaby 6.6 0.0 6.6 0.0 0.0% 0.0 6.6 0.0 0.0%Charnwood 12.7 0.0 12.7 0.0 0.0% 0.0 12.7 0.0 0.0%Harborough 5.6 0.0 5.6 0.0 0.0% 0.0 5.6 0.0 0.0%Hinckley and Bosworth 7.6 0.0 7.6 0.0 0.0% 0.0 7.6 0.0 0.0%Melton 4.0 0.0 4.0 0.0 0.0% 0.0 4.0 0.0 0.0%North West Leicestershire 7.3 0.0 7.3 0.0 0.0% 0.0 7.3 0.0 0.0%Oadby and Wigston 4.7 0.0 4.7 0.0 0.0% 0.0 4.7 0.0 0.0%
LINCOLNSHIREBoston 7.4 0.0 7.4 0.0 0.0% 0.0 7.4 0.0 0.0%East Lindsey 17.9 0.0 17.9 0.0 0.0% 0.0 17.9 0.0 0.0%Lincoln 10.3 0.0 10.3 0.0 0.0% 0.0 10.3 0.0 0.0%North Kesteven 9.0 0.0 9.0 0.0 0.0% 0.0 9.0 0.0 0.0%South Holland 9.3 0.0 9.3 0.0 0.0% 0.0 9.3 0.0 0.0%South Kesteven 10.2 0.0 10.2 0.0 0.0% 0.0 10.2 0.0 0.0%West Lindsey 8.4 0.0 8.4 0.0 0.0% 0.0 8.4 0.0 0.0%
NORFOLKBreckland 11.6 0.0 11.6 0.0 0.0% 0.0 11.6 0.0 0.0%Broadland 8.7 0.0 8.7 0.0 0.0% 0.0 8.7 0.0 0.0%Great Yarmouth 10.9 0.0 10.9 0.0 0.0% 0.0 10.9 0.0 0.0%King's Lynn and West Norfolk 15.8 0.0 15.8 0.0 0.0% 0.0 15.8 0.0 0.0%North Norfolk 9.1 0.0 9.1 0.0 0.0% 0.0 9.1 0.0 0.0%Norwich 16.0 0.0 16.0 0.0 0.0% 0.0 16.0 0.0 0.0%South Norfolk 8.6 0.0 8.6 0.0 0.0% 0.0 8.6 0.0 0.0%
NORTH YORKSHIRECraven 4.3 0.0 4.3 0.0 0.0% 0.0 4.3 0.0 0.0%Hambleton 5.9 0.0 5.9 0.0 0.0% 0.0 5.9 0.0 0.0%Harrogate 11.5 0.0 11.5 0.0 0.0% 0.0 11.5 0.0 0.0%Richmondshire 4.4 0.0 4.4 0.0 0.0% 0.0 4.4 0.0 0.0%Ryedale 4.7 0.0 4.7 0.0 0.0% 0.0 4.7 0.0 0.0%Scarborough 12.6 0.0 12.6 0.0 0.0% 0.0 12.6 0.0 0.0%Selby 6.8 0.0 6.8 0.0 0.0% 0.0 6.8 0.0 0.0%
NORTHAMPTONSHIRECorby 5.6 0.0 5.6 0.0 0.0% 0.0 5.6 0.0 0.0%Daventry 6.4 0.0 6.4 0.0 0.0% 0.0 6.4 0.0 0.0%East Northamptonshire 6.9 0.0 6.9 0.0 0.0% 0.0 6.9 0.0 0.0%Kettering 7.4 0.0 7.4 0.0 0.0% 0.0 7.4 0.0 0.0%Northampton 18.9 0.0 18.9 0.0 0.0% 0.0 18.9 0.0 0.0%South Northamptonshire 6.1 0.0 6.1 0.0 0.0% 0.0 6.1 0.0 0.0%Wellingborough 7.1 0.0 7.1 0.0 0.0% 0.0 7.1 0.0 0.0%
78
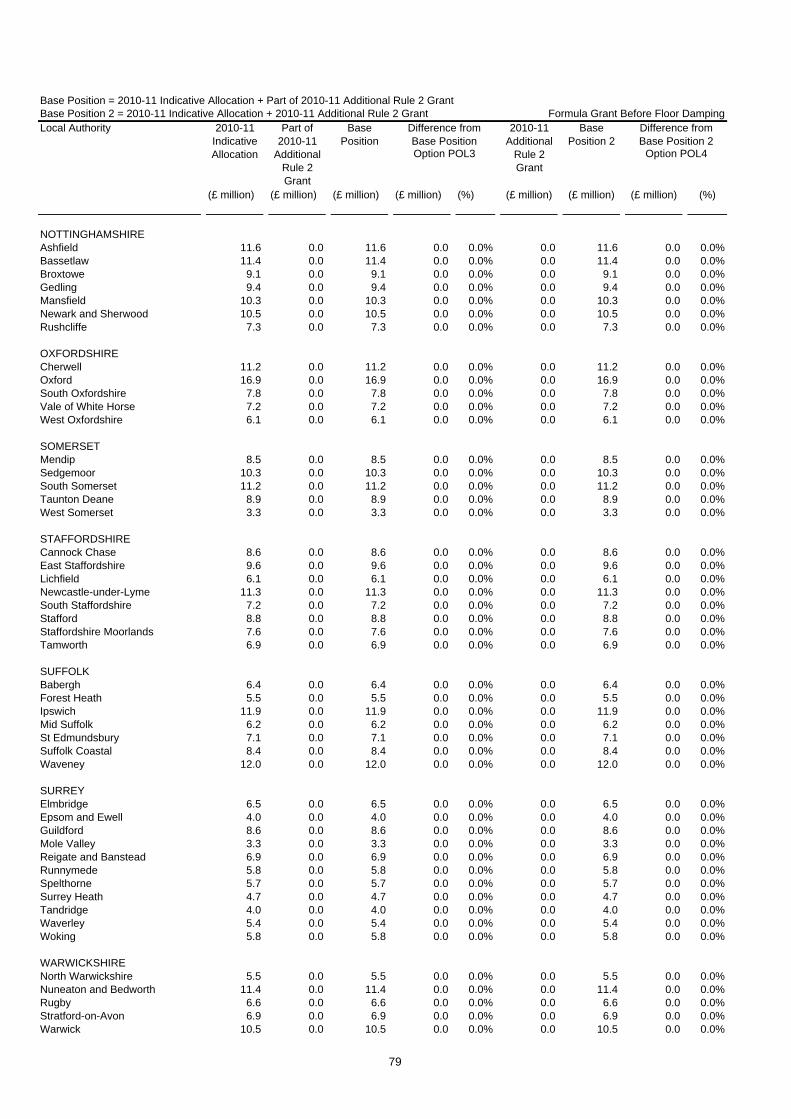
Base Position = 2010-11 Indicative Allocation + Part of 2010-11 Additional Rule 2 GrantBase Position 2 = 2010-11 Indicative Allocation + 2010-11 Additional Rule 2 Grant Formula Grant Before Floor DampingLocal Authority
(£ million) (£ million) (£ million) (£ million) (%) (£ million) (£ million) (£ million) (%)
Option POL4Option POL3
2010-11 Indicative Allocation
Part of 2010-11
Additional Rule 2 Grant
Base Position
2010-11 Additional
Rule 2 Grant
Base Position 2
Difference from Base Position
Difference from Base Position 2
NOTTINGHAMSHIREAshfield 11.6 0.0 11.6 0.0 0.0% 0.0 11.6 0.0 0.0%Bassetlaw 11.4 0.0 11.4 0.0 0.0% 0.0 11.4 0.0 0.0%Broxtowe 9.1 0.0 9.1 0.0 0.0% 0.0 9.1 0.0 0.0%Gedling 9.4 0.0 9.4 0.0 0.0% 0.0 9.4 0.0 0.0%Mansfield 10.3 0.0 10.3 0.0 0.0% 0.0 10.3 0.0 0.0%Newark and Sherwood 10.5 0.0 10.5 0.0 0.0% 0.0 10.5 0.0 0.0%Rushcliffe 7.3 0.0 7.3 0.0 0.0% 0.0 7.3 0.0 0.0%
OXFORDSHIRECherwell 11.2 0.0 11.2 0.0 0.0% 0.0 11.2 0.0 0.0%Oxford 16.9 0.0 16.9 0.0 0.0% 0.0 16.9 0.0 0.0%South Oxfordshire 7.8 0.0 7.8 0.0 0.0% 0.0 7.8 0.0 0.0%Vale of White Horse 7.2 0.0 7.2 0.0 0.0% 0.0 7.2 0.0 0.0%West Oxfordshire 6.1 0.0 6.1 0.0 0.0% 0.0 6.1 0.0 0.0%
SOMERSETMendip 8.5 0.0 8.5 0.0 0.0% 0.0 8.5 0.0 0.0%Sedgemoor 10.3 0.0 10.3 0.0 0.0% 0.0 10.3 0.0 0.0%South Somerset 11.2 0.0 11.2 0.0 0.0% 0.0 11.2 0.0 0.0%Taunton Deane 8.9 0.0 8.9 0.0 0.0% 0.0 8.9 0.0 0.0%West Somerset 3.3 0.0 3.3 0.0 0.0% 0.0 3.3 0.0 0.0%
STAFFORDSHIRECannock Chase 8.6 0.0 8.6 0.0 0.0% 0.0 8.6 0.0 0.0%East Staffordshire 9.6 0.0 9.6 0.0 0.0% 0.0 9.6 0.0 0.0%Lichfield 6.1 0.0 6.1 0.0 0.0% 0.0 6.1 0.0 0.0%Newcastle-under-Lyme 11.3 0.0 11.3 0.0 0.0% 0.0 11.3 0.0 0.0%South Staffordshire 7.2 0.0 7.2 0.0 0.0% 0.0 7.2 0.0 0.0%Stafford 8.8 0.0 8.8 0.0 0.0% 0.0 8.8 0.0 0.0%Staffordshire Moorlands 7.6 0.0 7.6 0.0 0.0% 0.0 7.6 0.0 0.0%Tamworth 6.9 0.0 6.9 0.0 0.0% 0.0 6.9 0.0 0.0%
SUFFOLKBabergh 6.4 0.0 6.4 0.0 0.0% 0.0 6.4 0.0 0.0%Forest Heath 5.5 0.0 5.5 0.0 0.0% 0.0 5.5 0.0 0.0%Ipswich 11.9 0.0 11.9 0.0 0.0% 0.0 11.9 0.0 0.0%Mid Suffolk 6.2 0.0 6.2 0.0 0.0% 0.0 6.2 0.0 0.0%St Edmundsbury 7.1 0.0 7.1 0.0 0.0% 0.0 7.1 0.0 0.0%Suffolk Coastal 8.4 0.0 8.4 0.0 0.0% 0.0 8.4 0.0 0.0%Waveney 12.0 0.0 12.0 0.0 0.0% 0.0 12.0 0.0 0.0%
SURREYElmbridge 6.5 0.0 6.5 0.0 0.0% 0.0 6.5 0.0 0.0%Epsom and Ewell 4.0 0.0 4.0 0.0 0.0% 0.0 4.0 0.0 0.0%Guildford 8.6 0.0 8.6 0.0 0.0% 0.0 8.6 0.0 0.0%Mole Valley 3.3 0.0 3.3 0.0 0.0% 0.0 3.3 0.0 0.0%Reigate and Banstead 6.9 0.0 6.9 0.0 0.0% 0.0 6.9 0.0 0.0%Runnymede 5.8 0.0 5.8 0.0 0.0% 0.0 5.8 0.0 0.0%Spelthorne 5.7 0.0 5.7 0.0 0.0% 0.0 5.7 0.0 0.0%Surrey Heath 4.7 0.0 4.7 0.0 0.0% 0.0 4.7 0.0 0.0%Tandridge 4.0 0.0 4.0 0.0 0.0% 0.0 4.0 0.0 0.0%Waverley 5.4 0.0 5.4 0.0 0.0% 0.0 5.4 0.0 0.0%Woking 5.8 0.0 5.8 0.0 0.0% 0.0 5.8 0.0 0.0%
WARWICKSHIRENorth Warwickshire 5.5 0.0 5.5 0.0 0.0% 0.0 5.5 0.0 0.0%Nuneaton and Bedworth 11.4 0.0 11.4 0.0 0.0% 0.0 11.4 0.0 0.0%Rugby 6.6 0.0 6.6 0.0 0.0% 0.0 6.6 0.0 0.0%Stratford-on-Avon 6.9 0.0 6.9 0.0 0.0% 0.0 6.9 0.0 0.0%Warwick 10.5 0.0 10.5 0.0 0.0% 0.0 10.5 0.0 0.0%
79

Base Position = 2010-11 Indicative Allocation + Part of 2010-11 Additional Rule 2 GrantBase Position 2 = 2010-11 Indicative Allocation + 2010-11 Additional Rule 2 Grant Formula Grant Before Floor DampingLocal Authority
(£ million) (£ million) (£ million) (£ million) (%) (£ million) (£ million) (£ million) (%)
Option POL4Option POL3
2010-11 Indicative Allocation
Part of 2010-11
Additional Rule 2 Grant
Base Position
2010-11 Additional
Rule 2 Grant
Base Position 2
Difference from Base Position
Difference from Base Position 2
WEST SUSSEXAdur 5.0 0.0 5.0 0.0 0.0% 0.0 5.0 0.0 0.0%Arun 10.5 0.0 10.5 0.0 0.0% 0.0 10.5 0.0 0.0%Chichester 5.9 0.0 5.9 0.0 0.0% 0.0 5.9 0.0 0.0%Crawley 10.5 0.0 10.5 0.0 0.0% 0.0 10.5 0.0 0.0%Horsham 6.0 0.0 6.0 0.0 0.0% 0.0 6.0 0.0 0.0%Mid Sussex 5.3 0.0 5.3 0.0 0.0% 0.0 5.3 0.0 0.0%Worthing 7.9 0.0 7.9 0.0 0.0% 0.0 7.9 0.0 0.0%
WORCESTERSHIREBromsgrove 5.2 0.0 5.2 0.0 0.0% 0.0 5.2 0.0 0.0%Malvern Hills 5.2 0.0 5.2 0.0 0.0% 0.0 5.2 0.0 0.0%Redditch 6.4 0.0 6.4 0.0 0.0% 0.0 6.4 0.0 0.0%Worcester 7.8 0.0 7.8 0.0 0.0% 0.0 7.8 0.0 0.0%Wychavon 8.0 0.0 8.0 0.0 0.0% 0.0 8.0 0.0 0.0%Wyre Forest 8.1 0.0 8.1 0.0 0.0% 0.0 8.1 0.0 0.0%
80

Base Position = 2010-11 Indicative Allocation + Part of 2010-11 Additional Rule 2 GrantBase Position 2 = 2010-11 Indicative Allocation + 2010-11 Additional Rule 2 Grant Formula Grant Before Floor DampingLocal Authority
(£ million) (£ million) (£ million) (£ million) (%) (£ million) (£ million) (£ million) (%)
Option POL4Option POL3
2010-11 Indicative Allocation
Part of 2010-11
Additional Rule 2 Grant
Base Position
2010-11 Additional
Rule 2 Grant
Base Position 2
Difference from Base Position
Difference from Base Position 2
SHIRE POLICE AUTHORITIES
Avon & Somerset Police 197.6 1.2 198.7 -0.6 -0.3% 2.2 199.7 0.2 0.1%Bedfordshire Police 76.6 0.3 77.0 -0.1 -0.1% 0.9 77.6 0.0 0.0%Cambridgeshire Police 86.2 0.5 86.7 -0.2 -0.3% 1.6 87.8 -0.5 -0.6%Cheshire Police 114.1 0.9 115.0 -0.6 -0.5% 1.2 115.2 0.3 0.2%Cleveland Police 99.0 0.1 99.1 0.2 0.2% 0.1 99.1 1.0 1.0%
Cumbria Police 56.1 0.4 56.4 -0.2 -0.3% 1.7 57.8 -1.0 -1.7%Derbyshire Police 120.7 0.6 121.2 -0.2 -0.2% 1.0 121.6 0.5 0.4%Devon & Cornwall Police 191.7 0.0 191.7 0.6 0.3% 3.1 194.8 -0.7 -0.4%Dorset Police 64.3 0.3 64.6 -0.1 -0.2% 0.8 65.1 0.1 0.2%Durham Police 87.0 0.1 87.1 0.1 0.2% 0.3 87.3 0.6 0.7%
Essex Police 187.3 0.7 188.0 -0.1 -0.1% 3.3 190.6 -0.9 -0.5%Gloucestershire Police 58.5 0.4 58.9 -0.2 -0.4% 1.2 59.7 -0.4 -0.7%Hampshire Police 215.0 0.9 215.9 -0.3 -0.1% 2.4 217.4 0.2 0.1%Hertfordshire Police 128.9 0.5 129.4 -0.1 0.0% 2.1 131.1 -0.5 -0.4%Humberside Police 132.9 0.2 133.1 0.2 0.1% 0.9 133.8 0.6 0.4%
Kent Police 200.2 1.4 201.5 -0.8 -0.4% 4.5 204.6 -2.0 -1.0%Lancashire Police 212.3 1.1 213.4 -0.5 -0.2% 1.2 213.5 1.3 0.6%Leicestershire Police 124.2 0.4 124.6 0.0 0.0% 0.8 125.0 0.6 0.5%Lincolnshire Police 69.0 0.3 69.3 -0.1 -0.1% 2.3 71.4 -1.5 -2.1%Norfolk Police 88.5 0.3 88.7 0.0 0.0% 2.3 90.8 -1.2 -1.4%
North Yorkshire Police 73.1 0.3 73.4 -0.1 -0.1% 2.3 75.4 -1.4 -1.8%Northamptonshire Police 78.4 0.4 78.7 -0.1 -0.2% 1.1 79.4 -0.1 -0.2%Nottinghamshire Police 152.7 0.0 152.7 0.4 0.3% 0.0 152.7 1.7 1.1%Staffordshire Police 125.1 0.7 125.8 -0.3 -0.3% 1.0 126.1 0.5 0.4%Suffolk Police 71.0 0.3 71.3 -0.1 -0.1% 1.7 72.7 -0.8 -1.1%
Surrey Police 101.3 0.7 102.0 -0.4 -0.3% 2.1 103.4 -0.7 -0.7%Sussex Police 167.1 1.5 168.5 -0.9 -0.5% 3.1 170.2 -0.9 -0.5%Thames Valley Police 248.5 0.9 249.4 -0.1 0.0% 4.9 253.5 -1.8 -0.7%Warwickshire Police 56.1 0.2 56.3 0.0 0.0% 0.7 56.9 0.0 0.0%West Mercia Police 114.3 0.8 115.1 -0.4 -0.4% 3.1 117.5 -1.7 -1.4%
Wiltshire Police 64.1 0.3 64.4 -0.1 -0.1% 1.4 65.5 -0.5 -0.8%
WELSH POLICE AUTHORITIES
Dyfed-Powys Police 49.3 0.1 49.5 0.0 -0.1% 2.8 52.1 -2.4 -4.5%Gwent Police 82.7 0.1 82.8 0.2 0.2% 0.3 83.0 0.8 1.0%North Wales Police 72.3 0.6 72.9 -0.4 -0.6% 2.1 74.4 -1.4 -1.9%South Wales Police 189.0 0.5 189.4 0.2 0.1% 0.5 189.4 2.1 1.1%
81

Base Position = 2010-11 Indicative Allocation + Part of 2010-11 Additional Rule 2 GrantBase Position 2 = 2010-11 Indicative Allocation + 2010-11 Additional Rule 2 Grant Formula Grant Before Floor DampingLocal Authority
(£ million) (£ million) (£ million) (£ million) (%) (£ million) (£ million) (£ million) (%)
Option POL4Option POL3
2010-11 Indicative Allocation
Part of 2010-11
Additional Rule 2 Grant
Base Position
2010-11 Additional
Rule 2 Grant
Base Position 2
Difference from Base Position
Difference from Base Position 2
SHIRE FIRE AUTHORITIES
Avon Fire 24.6 0.0 24.6 0.0 0.0% 0.0 24.6 0.0 0.0%Bedfordshire Fire 11.7 0.0 11.7 0.0 0.0% 0.0 11.7 0.0 0.0%Berkshire Fire Auhtority 13.0 0.0 13.0 0.0 0.0% 0.0 13.0 0.0 0.0%Buckinghamshire Fire 9.1 0.0 9.1 0.0 0.0% 0.0 9.1 0.0 0.0%Cambridgeshire Fire 15.1 0.0 15.1 0.0 0.0% 0.0 15.1 0.0 0.0%
Cheshire Fire 19.3 0.0 19.3 0.0 0.0% 0.0 19.3 0.0 0.0%Cleveland Fire 21.7 0.0 21.7 0.0 0.0% 0.0 21.7 0.0 0.0%Derbyshire Fire 20.6 0.0 20.6 0.0 0.0% 0.0 20.6 0.0 0.0%Devon and Somerset Fire 32.1 0.0 32.1 0.0 0.0% 0.0 32.1 0.0 0.0%Dorset Fire 11.1 0.0 11.1 0.0 0.0% 0.0 11.1 0.0 0.0%
Durham Fire 14.9 0.0 14.9 0.0 0.0% 0.0 14.9 0.0 0.0%East Sussex Fire 15.0 0.0 15.0 0.0 0.0% 0.0 15.0 0.0 0.0%Essex Fire Auhtority 33.3 0.0 33.3 0.0 0.0% 0.0 33.3 0.0 0.0%Hampshire Fire 29.9 0.0 29.9 0.0 0.0% 0.0 29.9 0.0 0.0%Hereford & Worcester Fire 10.8 0.0 10.8 0.0 0.0% 0.0 10.8 0.0 0.0%
Humberside Fire 28.2 0.0 28.2 0.0 0.0% 0.0 28.2 0.0 0.0%Kent Fire 30.2 0.0 30.2 0.0 0.0% 0.0 30.2 0.0 0.0%Lancashire Fire 32.6 0.0 32.6 0.0 0.0% 0.0 32.6 0.0 0.0%Leicestershire Fire 19.2 0.0 19.2 0.0 0.0% 0.0 19.2 0.0 0.0%North Yorkshire Fire 11.6 0.0 11.6 0.0 0.0% 0.0 11.6 0.0 0.0%
Nottinghamshire Fire 26.3 0.0 26.3 0.0 0.0% 0.0 26.3 0.0 0.0%Shropshire Fire 8.6 0.0 8.6 0.0 0.0% 0.0 8.6 0.0 0.0%Staffordshire Fire 19.1 0.0 19.1 0.0 0.0% 0.0 19.1 0.0 0.0%Wiltshire Fire 9.7 0.0 9.7 0.0 0.0% 0.0 9.7 0.0 0.0%
82

Base Position = 2010-11 Indicative Allocation + Part of 2010-11 Additional Rule 2 GrantBase Position 2 = 2010-11 Indicative Allocation + 2010-11 Additional Rule 2 Grant Formula Grant After Floor DampingLocal Authority
(£ million) (£ million) (£ million) (£ million) (%) (£ million) (£ million) (£ million) (%)
England & Wales 29,404.5 28.8 29,433.4 7.9 0.0% 93.8 29,498.3 6.3 0.0%
England 28,995.5 21.9 29,017.4 0.1 0.0% 88.1 29,083.6 0.8 0.0%Wales 409.0 6.9 415.9 7.9 1.9% 5.6 414.7 5.5 1.3%
London area 6,475.5 0.0 6,475.5 -3.9 -0.1% 27.3 6,502.8 -0.2 0.0%Metropolitan areas 8,197.3 5.4 8,202.7 0.8 0.0% 5.4 8,202.7 2.4 0.0%Shire areas 14,320.4 16.6 14,337.0 3.1 0.0% 55.5 14,375.9 -1.4 0.0%Isles of Scilly 2.3 0.0 2.3 0.0 0.0% 0.0 2.3 0.0 0.0%
Inner London boroughs incl. City 2,234.6 0.0 2,234.6 0.6 0.0% 0.5 2,235.1 0.9 0.0%Outer London boroughs 1,953.6 0.0 1,953.6 0.0 0.0% 0.0 1,953.6 0.0 0.0%London boroughs 4,188.2 0.0 4,188.2 0.6 0.0% 0.5 4,188.7 0.9 0.0%GLA - all functions 2,287.3 0.0 2,287.3 -4.5 -0.2% 26.7 2,314.0 -1.1 0.0%
Metropolitan districts 5,798.0 0.0 5,798.0 -0.1 0.0% 0.0 5,798.0 -0.2 0.0%Metropolitan fire authorities 332.3 0.0 332.3 0.0 0.0% 0.0 332.3 0.0 0.0%Metropolitan police authorities 2,067.0 5.4 2,072.4 1.0 0.0% 5.4 2,072.4 2.6 0.1%
Shire unitaries with fire 404.3 0.0 404.3 0.0 0.0% 0.0 404.3 0.0 0.0%Shire unitaries without fire 4,033.1 0.0 4,033.1 -0.1 0.0% 0.0 4,033.1 -0.2 0.0%Shire counties with fire 1,615.8 0.0 1,615.8 -0.1 0.0% 0.0 1,615.8 -0.1 0.0%Shire counties without fire 2,378.5 0.0 2,378.5 -0.1 0.0% 0.0 2,378.5 -0.3 0.0%Shire districts 1,654.0 0.0 1,654.0 0.0 0.0% 0.0 1,654.0 0.0 0.0%Combined fire authorities 464.7 0.0 464.7 0.0 0.0% 0.0 464.7 0.0 0.0%Shire police authorities 3,770.0 16.6 3,786.5 3.5 0.1% 55.5 3,825.5 -0.6 0.0%
GO REGIONAL SUMMARY
South West GOR 2,199.8 2.2 2,202.0 0.4 0.0% 8.6 2,208.4 -0.2 0.0%South East GOR 3,118.8 5.3 3,124.1 0.9 0.0% 17.1 3,135.9 -0.8 0.0%London GOR 6,475.5 0.0 6,475.5 -3.9 -0.1% 27.3 6,502.8 -0.2 0.0%Eastern GOR 2,390.8 2.6 2,393.4 0.5 0.0% 12.0 2,402.9 -0.3 0.0%East Midlands GOR 2,181.5 1.6 2,183.2 0.2 0.0% 5.2 2,186.8 0.2 0.0%West Midlands GOR 3,238.8 3.7 3,242.5 0.1 0.0% 6.9 3,245.6 1.0 0.0%Yorkshire and Humber GOR 3,100.9 1.4 3,102.3 0.5 0.0% 4.2 3,105.0 0.8 0.0%North East GOR 1,812.2 0.3 1,812.5 0.5 0.0% 0.5 1,812.7 -0.4 0.0%North West GOR 4,477.2 4.8 4,481.9 0.8 0.0% 6.4 4,483.6 0.6 0.0%
FLOOR DAMPING GROUPS
Education Authorities 18,418.0 0.0 18,418.0 0.1 0.0% 0.0 18,418.0 0.5 0.0%Police Authorities 7,864.8 0.0 7,864.8 21.9 0.3% 0.0 7,864.8 88.5 1.1%Fire Authorities 1,056.5 0.0 1,056.5 0.0 0.0% 0.0 1,056.5 0.0 0.0%Shire Districts 1,654.0 0.0 1,654.0 0.0 0.0% 0.0 1,654.0 0.0 0.0%
Police - Rolling in Rule 2
Difference from Base Position
Difference from Base Position 2
2010-11 Indicative Allocation
Part of 2010-11
Additional Rule 2 Grant
Base Position
Option POL3
2010-11 Additional
Rule 2 Grant
Base Position 2
Option POL4
83
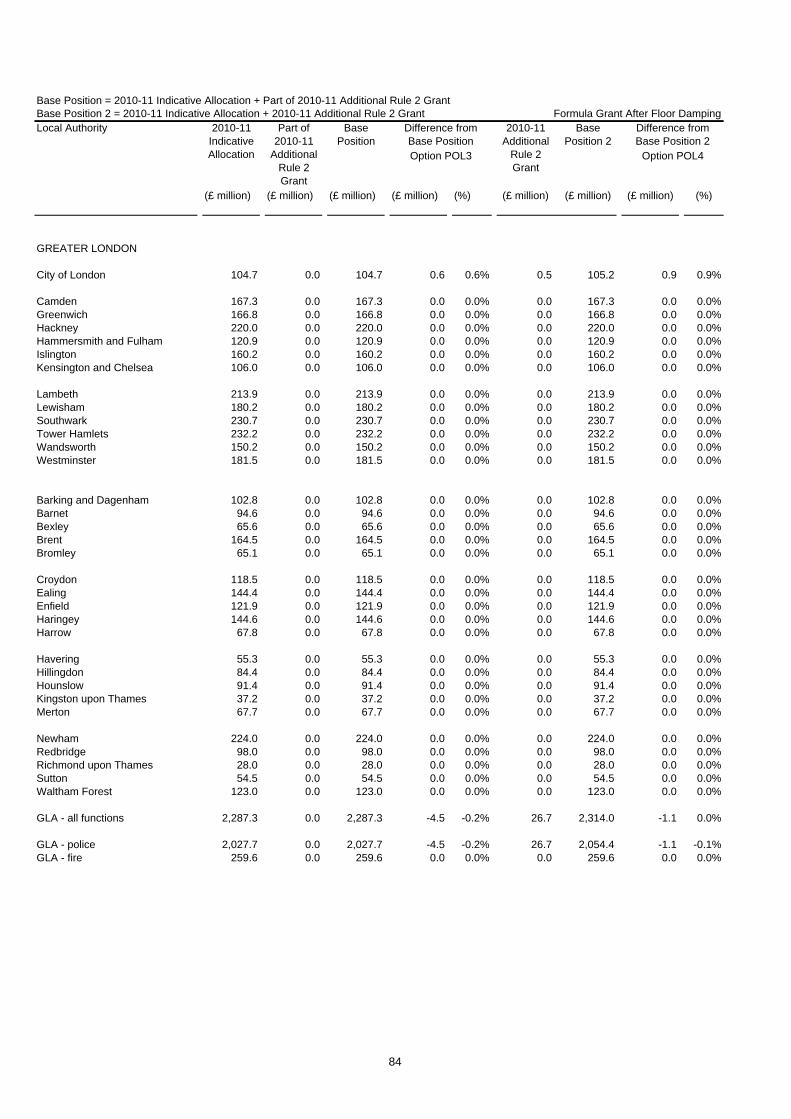
Base Position = 2010-11 Indicative Allocation + Part of 2010-11 Additional Rule 2 GrantBase Position 2 = 2010-11 Indicative Allocation + 2010-11 Additional Rule 2 Grant Formula Grant After Floor DampingLocal Authority
(£ million) (£ million) (£ million) (£ million) (%) (£ million) (£ million) (£ million) (%)
Difference from Base Position
Difference from Base Position 2
2010-11 Indicative Allocation
Part of 2010-11
Additional Rule 2 Grant
Base Position
Option POL3
2010-11 Additional
Rule 2 Grant
Base Position 2
Option POL4
GREATER LONDON
City of London 104.7 0.0 104.7 0.6 0.6% 0.5 105.2 0.9 0.9%
Camden 167.3 0.0 167.3 0.0 0.0% 0.0 167.3 0.0 0.0%Greenwich 166.8 0.0 166.8 0.0 0.0% 0.0 166.8 0.0 0.0%Hackney 220.0 0.0 220.0 0.0 0.0% 0.0 220.0 0.0 0.0%Hammersmith and Fulham 120.9 0.0 120.9 0.0 0.0% 0.0 120.9 0.0 0.0%Islington 160.2 0.0 160.2 0.0 0.0% 0.0 160.2 0.0 0.0%Kensington and Chelsea 106.0 0.0 106.0 0.0 0.0% 0.0 106.0 0.0 0.0%
Lambeth 213.9 0.0 213.9 0.0 0.0% 0.0 213.9 0.0 0.0%Lewisham 180.2 0.0 180.2 0.0 0.0% 0.0 180.2 0.0 0.0%Southwark 230.7 0.0 230.7 0.0 0.0% 0.0 230.7 0.0 0.0%Tower Hamlets 232.2 0.0 232.2 0.0 0.0% 0.0 232.2 0.0 0.0%Wandsworth 150.2 0.0 150.2 0.0 0.0% 0.0 150.2 0.0 0.0%Westminster 181.5 0.0 181.5 0.0 0.0% 0.0 181.5 0.0 0.0%
Barking and Dagenham 102.8 0.0 102.8 0.0 0.0% 0.0 102.8 0.0 0.0%Barnet 94.6 0.0 94.6 0.0 0.0% 0.0 94.6 0.0 0.0%Bexley 65.6 0.0 65.6 0.0 0.0% 0.0 65.6 0.0 0.0%Brent 164.5 0.0 164.5 0.0 0.0% 0.0 164.5 0.0 0.0%Bromley 65.1 0.0 65.1 0.0 0.0% 0.0 65.1 0.0 0.0%
Croydon 118.5 0.0 118.5 0.0 0.0% 0.0 118.5 0.0 0.0%Ealing 144.4 0.0 144.4 0.0 0.0% 0.0 144.4 0.0 0.0%Enfield 121.9 0.0 121.9 0.0 0.0% 0.0 121.9 0.0 0.0%Haringey 144.6 0.0 144.6 0.0 0.0% 0.0 144.6 0.0 0.0%Harrow 67.8 0.0 67.8 0.0 0.0% 0.0 67.8 0.0 0.0%
Havering 55.3 0.0 55.3 0.0 0.0% 0.0 55.3 0.0 0.0%Hillingdon 84.4 0.0 84.4 0.0 0.0% 0.0 84.4 0.0 0.0%Hounslow 91.4 0.0 91.4 0.0 0.0% 0.0 91.4 0.0 0.0%Kingston upon Thames 37.2 0.0 37.2 0.0 0.0% 0.0 37.2 0.0 0.0%Merton 67.7 0.0 67.7 0.0 0.0% 0.0 67.7 0.0 0.0%
Newham 224.0 0.0 224.0 0.0 0.0% 0.0 224.0 0.0 0.0%Redbridge 98.0 0.0 98.0 0.0 0.0% 0.0 98.0 0.0 0.0%Richmond upon Thames 28.0 0.0 28.0 0.0 0.0% 0.0 28.0 0.0 0.0%Sutton 54.5 0.0 54.5 0.0 0.0% 0.0 54.5 0.0 0.0%Waltham Forest 123.0 0.0 123.0 0.0 0.0% 0.0 123.0 0.0 0.0%
GLA - all functions 2,287.3 0.0 2,287.3 -4.5 -0.2% 26.7 2,314.0 -1.1 0.0%
GLA - police 2,027.7 0.0 2,027.7 -4.5 -0.2% 26.7 2,054.4 -1.1 -0.1%GLA - fire 259.6 0.0 259.6 0.0 0.0% 0.0 259.6 0.0 0.0%
84
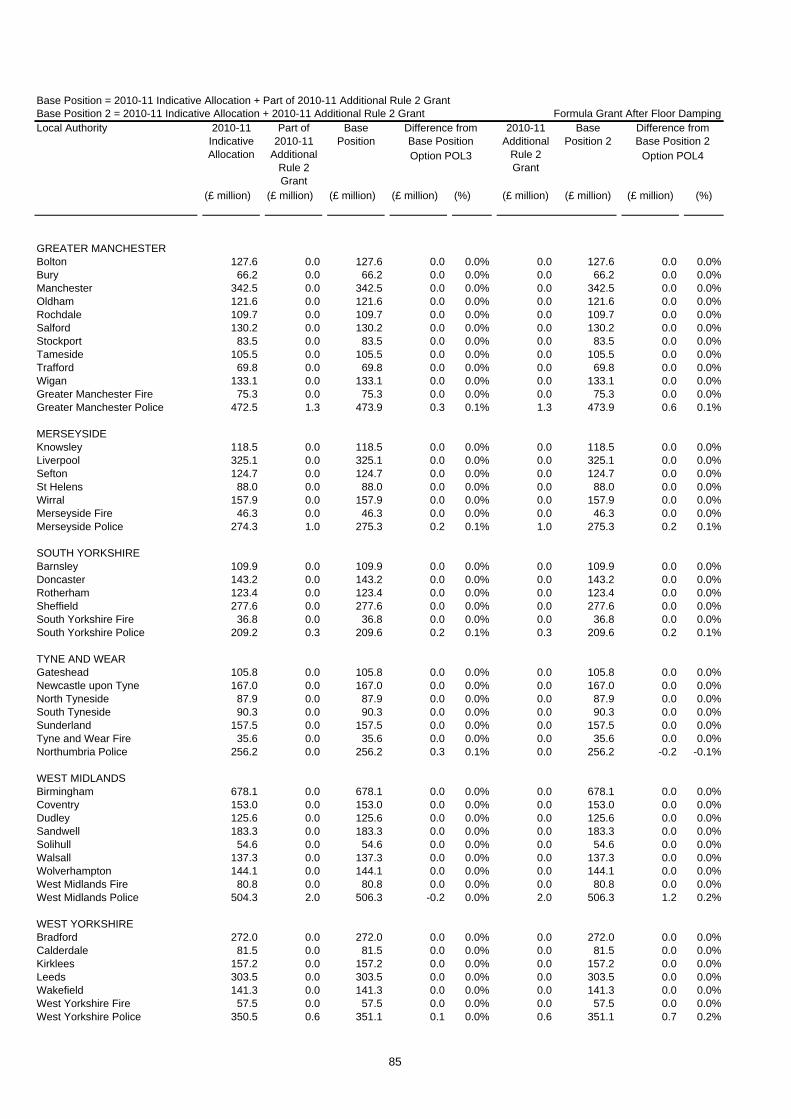
Base Position = 2010-11 Indicative Allocation + Part of 2010-11 Additional Rule 2 GrantBase Position 2 = 2010-11 Indicative Allocation + 2010-11 Additional Rule 2 Grant Formula Grant After Floor DampingLocal Authority
(£ million) (£ million) (£ million) (£ million) (%) (£ million) (£ million) (£ million) (%)
Difference from Base Position
Difference from Base Position 2
2010-11 Indicative Allocation
Part of 2010-11
Additional Rule 2 Grant
Base Position
Option POL3
2010-11 Additional
Rule 2 Grant
Base Position 2
Option POL4
GREATER MANCHESTERBolton 127.6 0.0 127.6 0.0 0.0% 0.0 127.6 0.0 0.0%Bury 66.2 0.0 66.2 0.0 0.0% 0.0 66.2 0.0 0.0%Manchester 342.5 0.0 342.5 0.0 0.0% 0.0 342.5 0.0 0.0%Oldham 121.6 0.0 121.6 0.0 0.0% 0.0 121.6 0.0 0.0%Rochdale 109.7 0.0 109.7 0.0 0.0% 0.0 109.7 0.0 0.0%Salford 130.2 0.0 130.2 0.0 0.0% 0.0 130.2 0.0 0.0%Stockport 83.5 0.0 83.5 0.0 0.0% 0.0 83.5 0.0 0.0%Tameside 105.5 0.0 105.5 0.0 0.0% 0.0 105.5 0.0 0.0%Trafford 69.8 0.0 69.8 0.0 0.0% 0.0 69.8 0.0 0.0%Wigan 133.1 0.0 133.1 0.0 0.0% 0.0 133.1 0.0 0.0%Greater Manchester Fire 75.3 0.0 75.3 0.0 0.0% 0.0 75.3 0.0 0.0%Greater Manchester Police 472.5 1.3 473.9 0.3 0.1% 1.3 473.9 0.6 0.1%
MERSEYSIDEKnowsley 118.5 0.0 118.5 0.0 0.0% 0.0 118.5 0.0 0.0%Liverpool 325.1 0.0 325.1 0.0 0.0% 0.0 325.1 0.0 0.0%Sefton 124.7 0.0 124.7 0.0 0.0% 0.0 124.7 0.0 0.0%St Helens 88.0 0.0 88.0 0.0 0.0% 0.0 88.0 0.0 0.0%Wirral 157.9 0.0 157.9 0.0 0.0% 0.0 157.9 0.0 0.0%Merseyside Fire 46.3 0.0 46.3 0.0 0.0% 0.0 46.3 0.0 0.0%Merseyside Police 274.3 1.0 275.3 0.2 0.1% 1.0 275.3 0.2 0.1%
SOUTH YORKSHIREBarnsley 109.9 0.0 109.9 0.0 0.0% 0.0 109.9 0.0 0.0%Doncaster 143.2 0.0 143.2 0.0 0.0% 0.0 143.2 0.0 0.0%Rotherham 123.4 0.0 123.4 0.0 0.0% 0.0 123.4 0.0 0.0%Sheffield 277.6 0.0 277.6 0.0 0.0% 0.0 277.6 0.0 0.0%South Yorkshire Fire 36.8 0.0 36.8 0.0 0.0% 0.0 36.8 0.0 0.0%South Yorkshire Police 209.2 0.3 209.6 0.2 0.1% 0.3 209.6 0.2 0.1%
TYNE AND WEARGateshead 105.8 0.0 105.8 0.0 0.0% 0.0 105.8 0.0 0.0%Newcastle upon Tyne 167.0 0.0 167.0 0.0 0.0% 0.0 167.0 0.0 0.0%North Tyneside 87.9 0.0 87.9 0.0 0.0% 0.0 87.9 0.0 0.0%South Tyneside 90.3 0.0 90.3 0.0 0.0% 0.0 90.3 0.0 0.0%Sunderland 157.5 0.0 157.5 0.0 0.0% 0.0 157.5 0.0 0.0%Tyne and Wear Fire 35.6 0.0 35.6 0.0 0.0% 0.0 35.6 0.0 0.0%Northumbria Police 256.2 0.0 256.2 0.3 0.1% 0.0 256.2 -0.2 -0.1%
WEST MIDLANDSBirmingham 678.1 0.0 678.1 0.0 0.0% 0.0 678.1 0.0 0.0%Coventry 153.0 0.0 153.0 0.0 0.0% 0.0 153.0 0.0 0.0%Dudley 125.6 0.0 125.6 0.0 0.0% 0.0 125.6 0.0 0.0%Sandwell 183.3 0.0 183.3 0.0 0.0% 0.0 183.3 0.0 0.0%Solihull 54.6 0.0 54.6 0.0 0.0% 0.0 54.6 0.0 0.0%Walsall 137.3 0.0 137.3 0.0 0.0% 0.0 137.3 0.0 0.0%Wolverhampton 144.1 0.0 144.1 0.0 0.0% 0.0 144.1 0.0 0.0%West Midlands Fire 80.8 0.0 80.8 0.0 0.0% 0.0 80.8 0.0 0.0%West Midlands Police 504.3 2.0 506.3 -0.2 0.0% 2.0 506.3 1.2 0.2%
WEST YORKSHIREBradford 272.0 0.0 272.0 0.0 0.0% 0.0 272.0 0.0 0.0%Calderdale 81.5 0.0 81.5 0.0 0.0% 0.0 81.5 0.0 0.0%Kirklees 157.2 0.0 157.2 0.0 0.0% 0.0 157.2 0.0 0.0%Leeds 303.5 0.0 303.5 0.0 0.0% 0.0 303.5 0.0 0.0%Wakefield 141.3 0.0 141.3 0.0 0.0% 0.0 141.3 0.0 0.0%West Yorkshire Fire 57.5 0.0 57.5 0.0 0.0% 0.0 57.5 0.0 0.0%West Yorkshire Police 350.5 0.6 351.1 0.1 0.0% 0.6 351.1 0.7 0.2%
85

Base Position = 2010-11 Indicative Allocation + Part of 2010-11 Additional Rule 2 GrantBase Position 2 = 2010-11 Indicative Allocation + 2010-11 Additional Rule 2 Grant Formula Grant After Floor DampingLocal Authority
(£ million) (£ million) (£ million) (£ million) (%) (£ million) (£ million) (£ million) (%)
Difference from Base Position
Difference from Base Position 2
2010-11 Indicative Allocation
Part of 2010-11
Additional Rule 2 Grant
Base Position
Option POL3
2010-11 Additional
Rule 2 Grant
Base Position 2
Option POL4
ALL PURPOSE AUTHORITIES
Bath & North East Somerset 41.6 0.0 41.6 0.0 0.0% 0.0 41.6 0.0 0.0%Bedford 54.1 0.0 54.1 0.0 0.0% 0.0 54.1 0.0 0.0%Blackburn with Darwen 81.6 0.0 81.6 0.0 0.0% 0.0 81.6 0.0 0.0%Blackpool 81.8 0.0 81.8 0.0 0.0% 0.0 81.8 0.0 0.0%Bournemouth 55.0 0.0 55.0 0.0 0.0% 0.0 55.0 0.0 0.0%
Bracknell Forest 26.1 0.0 26.1 0.0 0.0% 0.0 26.1 0.0 0.0%Brighton & Hove 109.2 0.0 109.2 0.0 0.0% 0.0 109.2 0.0 0.0%Bristol 166.9 0.0 166.9 0.0 0.0% 0.0 166.9 0.0 0.0%Central Bedfordshire 50.6 0.0 50.6 0.0 0.0% 0.0 50.6 0.0 0.0%Cheshire East 63.2 0.0 63.2 0.0 0.0% 0.0 63.2 0.0 0.0%
Cheshire West & Chester 93.5 0.0 93.5 0.0 0.0% 0.0 93.5 0.0 0.0%Cornwall 213.1 0.0 213.1 0.0 0.0% 0.0 213.1 0.0 0.0%Darlington 38.8 0.0 38.8 0.0 0.0% 0.0 38.8 0.0 0.0%Derby 109.7 0.0 109.7 0.0 0.0% 0.0 109.7 0.0 0.0%Durham 230.6 0.0 230.6 0.0 0.0% 0.0 230.6 0.0 0.0%
East Riding of Yorkshire 101.4 0.0 101.4 0.0 0.0% 0.0 101.4 0.0 0.0%Halton 64.0 0.0 64.0 0.0 0.0% 0.0 64.0 0.0 0.0%Hartlepool 51.5 0.0 51.5 0.0 0.0% 0.0 51.5 0.0 0.0%Herefordshire 57.6 0.0 57.6 0.0 0.0% 0.0 57.6 0.0 0.0%Isle of Wight Council 61.4 0.0 61.4 0.0 0.0% 0.0 61.4 0.0 0.0%
Kingston upon Hull 152.0 0.0 152.0 0.0 0.0% 0.0 152.0 0.0 0.0%Leicester 182.4 0.0 182.4 0.0 0.0% 0.0 182.4 0.0 0.0%Luton 89.9 0.0 89.9 0.0 0.0% 0.0 89.9 0.0 0.0%Medway 85.2 0.0 85.2 0.0 0.0% 0.0 85.2 0.0 0.0%Middlesbrough 83.6 0.0 83.6 0.0 0.0% 0.0 83.6 0.0 0.0%
Milton Keynes 87.3 0.0 87.3 0.0 0.0% 0.0 87.3 0.0 0.0%North East Lincolnshire 72.8 0.0 72.8 0.0 0.0% 0.0 72.8 0.0 0.0%North Lincolnshire 62.3 0.0 62.3 0.0 0.0% 0.0 62.3 0.0 0.0%North Somerset 52.0 0.0 52.0 0.0 0.0% 0.0 52.0 0.0 0.0%Northumberland 129.8 0.0 129.8 0.0 0.0% 0.0 129.8 0.0 0.0%
Nottingham 172.6 0.0 172.6 0.0 0.0% 0.0 172.6 0.0 0.0%Peterborough 77.0 0.0 77.0 0.0 0.0% 0.0 77.0 0.0 0.0%Plymouth 106.0 0.0 106.0 0.0 0.0% 0.0 106.0 0.0 0.0%Poole 26.9 0.0 26.9 0.0 0.0% 0.0 26.9 0.0 0.0%Portsmouth 87.5 0.0 87.5 0.0 0.0% 0.0 87.5 0.0 0.0%
Reading 55.4 0.0 55.4 0.0 0.0% 0.0 55.4 0.0 0.0%Redcar and Cleveland 68.7 0.0 68.7 0.0 0.0% 0.0 68.7 0.0 0.0%Rutland 7.7 0.0 7.7 0.0 0.0% 0.0 7.7 0.0 0.0%Shropshire 93.1 0.0 93.1 0.0 0.0% 0.0 93.1 0.0 0.0%Slough 56.8 0.0 56.8 0.0 0.0% 0.0 56.8 0.0 0.0%
South Gloucestershire 60.8 0.0 60.8 0.0 0.0% 0.0 60.8 0.0 0.0%Southampton 100.2 0.0 100.2 0.0 0.0% 0.0 100.2 0.0 0.0%Southend-on-Sea 61.5 0.0 61.5 0.0 0.0% 0.0 61.5 0.0 0.0%Stockton-on-Tees 78.2 0.0 78.2 0.0 0.0% 0.0 78.2 0.0 0.0%Stoke-on-Trent 127.3 0.0 127.3 0.0 0.0% 0.0 127.3 0.0 0.0%
Swindon 50.6 0.0 50.6 0.0 0.0% 0.0 50.6 0.0 0.0%Telford and the Wrekin 70.6 0.0 70.6 0.0 0.0% 0.0 70.6 0.0 0.0%Thurrock 59.8 0.0 59.8 0.0 0.0% 0.0 59.8 0.0 0.0%Torbay 59.0 0.0 59.0 0.0 0.0% 0.0 59.0 0.0 0.0%Warrington 54.0 0.0 54.0 0.0 0.0% 0.0 54.0 0.0 0.0%
86

Base Position = 2010-11 Indicative Allocation + Part of 2010-11 Additional Rule 2 GrantBase Position 2 = 2010-11 Indicative Allocation + 2010-11 Additional Rule 2 Grant Formula Grant After Floor DampingLocal Authority
(£ million) (£ million) (£ million) (£ million) (%) (£ million) (£ million) (£ million) (%)
Difference from Base Position
Difference from Base Position 2
2010-11 Indicative Allocation
Part of 2010-11
Additional Rule 2 Grant
Base Position
Option POL3
2010-11 Additional
Rule 2 Grant
Base Position 2
Option POL4
West Berkshire 29.2 0.0 29.2 0.0 0.0% 0.0 29.2 0.0 0.0%Wiltshire 102.2 0.0 102.2 0.0 0.0% 0.0 102.2 0.0 0.0%Windsor and Maidenhead 18.8 0.0 18.8 0.0 0.0% 0.0 18.8 0.0 0.0%Wokingham 19.6 0.0 19.6 0.0 0.0% 0.0 19.6 0.0 0.0%York 44.6 0.0 44.6 0.0 0.0% 0.0 44.6 0.0 0.0%
Isles of Scilly 2.3 0.0 2.3 0.0 0.0% 0.0 2.3 0.0 0.0%
87

Base Position = 2010-11 Indicative Allocation + Part of 2010-11 Additional Rule 2 GrantBase Position 2 = 2010-11 Indicative Allocation + 2010-11 Additional Rule 2 Grant Formula Grant After Floor DampingLocal Authority
(£ million) (£ million) (£ million) (£ million) (%) (£ million) (£ million) (£ million) (%)
Difference from Base Position
Difference from Base Position 2
2010-11 Indicative Allocation
Part of 2010-11
Additional Rule 2 Grant
Base Position
Option POL3
2010-11 Additional
Rule 2 Grant
Base Position 2
Option POL4
SHIRE COUNTIES
Buckinghamshire 59.6 0.0 59.6 0.0 0.0% 0.0 59.6 0.0 0.0%Cambridgeshire 111.1 0.0 111.1 0.0 0.0% 0.0 111.1 0.0 0.0%Cumbria 144.6 0.0 144.6 0.0 0.0% 0.0 144.6 0.0 0.0%Derbyshire 185.2 0.0 185.2 0.0 0.0% 0.0 185.2 0.0 0.0%Devon 161.2 0.0 161.2 0.0 0.0% 0.0 161.2 0.0 0.0%
Dorset 50.8 0.0 50.8 0.0 0.0% 0.0 50.8 0.0 0.0%East Sussex 100.2 0.0 100.2 0.0 0.0% 0.0 100.2 0.0 0.0%Essex 246.8 0.0 246.8 0.0 0.0% 0.0 246.8 0.0 0.0%Gloucestershire 117.0 0.0 117.0 0.0 0.0% 0.0 117.0 0.0 0.0%Hampshire 146.8 0.0 146.8 0.0 0.0% 0.0 146.8 0.0 0.0%
Hertfordshire 176.0 0.0 176.0 0.0 0.0% 0.0 176.0 0.0 0.0%Kent 275.9 0.0 275.9 0.0 0.0% 0.0 275.9 0.0 0.0%Lancashire 302.2 0.0 302.2 0.0 0.0% 0.0 302.2 0.0 0.0%Leicestershire 100.7 0.0 100.7 0.0 0.0% 0.0 100.7 0.0 0.0%Lincolnshire 192.1 0.0 192.1 0.0 0.0% 0.0 192.1 0.0 0.0%
Norfolk 238.3 0.0 238.3 0.0 0.0% 0.0 238.3 0.0 0.0%North Yorkshire 104.4 0.0 104.4 0.0 0.0% 0.0 104.4 0.0 0.0%Northamptonshire 154.2 0.0 154.2 0.0 0.0% 0.0 154.2 0.0 0.0%Nottinghamshire 176.2 0.0 176.2 0.0 0.0% 0.0 176.2 0.0 0.0%Oxfordshire 106.3 0.0 106.3 0.0 0.0% 0.0 106.3 0.0 0.0%
Somerset 110.0 0.0 110.0 0.0 0.0% 0.0 110.0 0.0 0.0%Staffordshire 157.3 0.0 157.3 0.0 0.0% 0.0 157.3 0.0 0.0%Suffolk 169.0 0.0 169.0 0.0 0.0% 0.0 169.0 0.0 0.0%Surrey 127.5 0.0 127.5 0.0 0.0% 0.0 127.5 0.0 0.0%Warwickshire 92.1 0.0 92.1 0.0 0.0% 0.0 92.1 0.0 0.0%
West Sussex 98.7 0.0 98.7 0.0 0.0% 0.0 98.7 0.0 0.0%Worcestershire 90.2 0.0 90.2 0.0 0.0% 0.0 90.2 0.0 0.0%
88
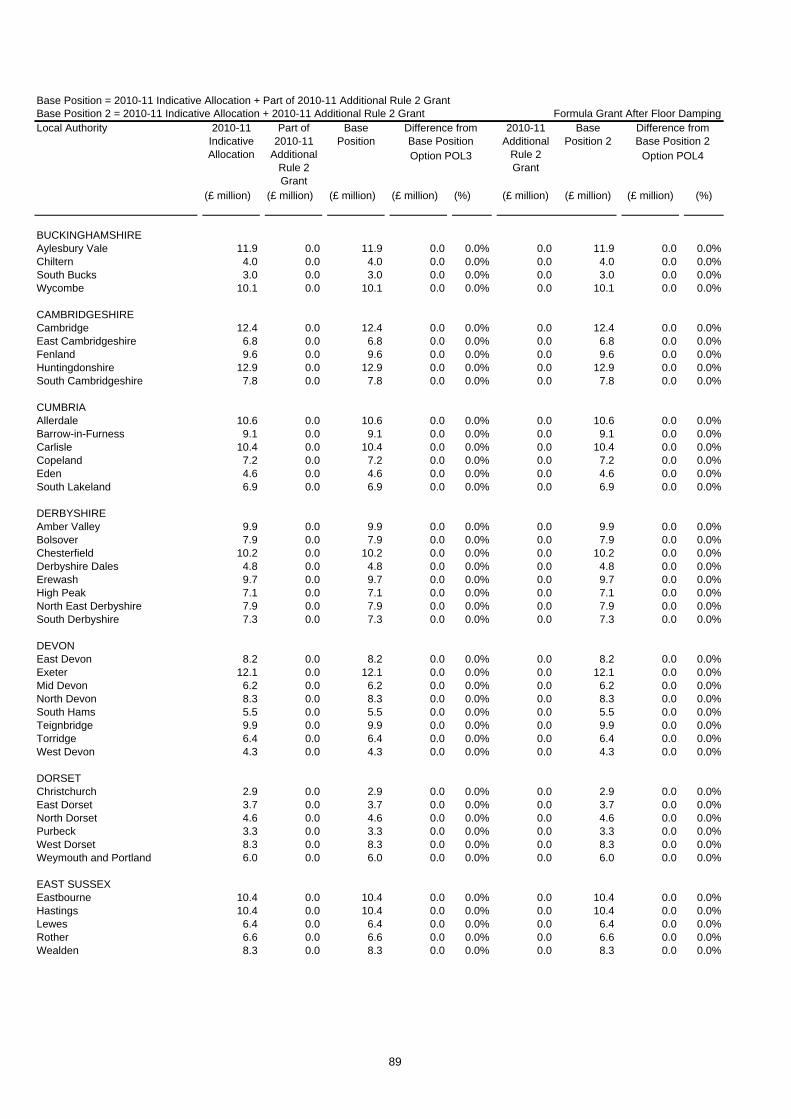
Base Position = 2010-11 Indicative Allocation + Part of 2010-11 Additional Rule 2 GrantBase Position 2 = 2010-11 Indicative Allocation + 2010-11 Additional Rule 2 Grant Formula Grant After Floor DampingLocal Authority
(£ million) (£ million) (£ million) (£ million) (%) (£ million) (£ million) (£ million) (%)
Difference from Base Position
Difference from Base Position 2
2010-11 Indicative Allocation
Part of 2010-11
Additional Rule 2 Grant
Base Position
Option POL3
2010-11 Additional
Rule 2 Grant
Base Position 2
Option POL4
BUCKINGHAMSHIREAylesbury Vale 11.9 0.0 11.9 0.0 0.0% 0.0 11.9 0.0 0.0%Chiltern 4.0 0.0 4.0 0.0 0.0% 0.0 4.0 0.0 0.0%South Bucks 3.0 0.0 3.0 0.0 0.0% 0.0 3.0 0.0 0.0%Wycombe 10.1 0.0 10.1 0.0 0.0% 0.0 10.1 0.0 0.0%
CAMBRIDGESHIRECambridge 12.4 0.0 12.4 0.0 0.0% 0.0 12.4 0.0 0.0%East Cambridgeshire 6.8 0.0 6.8 0.0 0.0% 0.0 6.8 0.0 0.0%Fenland 9.6 0.0 9.6 0.0 0.0% 0.0 9.6 0.0 0.0%Huntingdonshire 12.9 0.0 12.9 0.0 0.0% 0.0 12.9 0.0 0.0%South Cambridgeshire 7.8 0.0 7.8 0.0 0.0% 0.0 7.8 0.0 0.0%
CUMBRIAAllerdale 10.6 0.0 10.6 0.0 0.0% 0.0 10.6 0.0 0.0%Barrow-in-Furness 9.1 0.0 9.1 0.0 0.0% 0.0 9.1 0.0 0.0%Carlisle 10.4 0.0 10.4 0.0 0.0% 0.0 10.4 0.0 0.0%Copeland 7.2 0.0 7.2 0.0 0.0% 0.0 7.2 0.0 0.0%Eden 4.6 0.0 4.6 0.0 0.0% 0.0 4.6 0.0 0.0%South Lakeland 6.9 0.0 6.9 0.0 0.0% 0.0 6.9 0.0 0.0%
DERBYSHIREAmber Valley 9.9 0.0 9.9 0.0 0.0% 0.0 9.9 0.0 0.0%Bolsover 7.9 0.0 7.9 0.0 0.0% 0.0 7.9 0.0 0.0%Chesterfield 10.2 0.0 10.2 0.0 0.0% 0.0 10.2 0.0 0.0%Derbyshire Dales 4.8 0.0 4.8 0.0 0.0% 0.0 4.8 0.0 0.0%Erewash 9.7 0.0 9.7 0.0 0.0% 0.0 9.7 0.0 0.0%High Peak 7.1 0.0 7.1 0.0 0.0% 0.0 7.1 0.0 0.0%North East Derbyshire 7.9 0.0 7.9 0.0 0.0% 0.0 7.9 0.0 0.0%South Derbyshire 7.3 0.0 7.3 0.0 0.0% 0.0 7.3 0.0 0.0%
DEVONEast Devon 8.2 0.0 8.2 0.0 0.0% 0.0 8.2 0.0 0.0%Exeter 12.1 0.0 12.1 0.0 0.0% 0.0 12.1 0.0 0.0%Mid Devon 6.2 0.0 6.2 0.0 0.0% 0.0 6.2 0.0 0.0%North Devon 8.3 0.0 8.3 0.0 0.0% 0.0 8.3 0.0 0.0%South Hams 5.5 0.0 5.5 0.0 0.0% 0.0 5.5 0.0 0.0%Teignbridge 9.9 0.0 9.9 0.0 0.0% 0.0 9.9 0.0 0.0%Torridge 6.4 0.0 6.4 0.0 0.0% 0.0 6.4 0.0 0.0%West Devon 4.3 0.0 4.3 0.0 0.0% 0.0 4.3 0.0 0.0%
DORSETChristchurch 2.9 0.0 2.9 0.0 0.0% 0.0 2.9 0.0 0.0%East Dorset 3.7 0.0 3.7 0.0 0.0% 0.0 3.7 0.0 0.0%North Dorset 4.6 0.0 4.6 0.0 0.0% 0.0 4.6 0.0 0.0%Purbeck 3.3 0.0 3.3 0.0 0.0% 0.0 3.3 0.0 0.0%West Dorset 8.3 0.0 8.3 0.0 0.0% 0.0 8.3 0.0 0.0%Weymouth and Portland 6.0 0.0 6.0 0.0 0.0% 0.0 6.0 0.0 0.0%
EAST SUSSEXEastbourne 10.4 0.0 10.4 0.0 0.0% 0.0 10.4 0.0 0.0%Hastings 10.4 0.0 10.4 0.0 0.0% 0.0 10.4 0.0 0.0%Lewes 6.4 0.0 6.4 0.0 0.0% 0.0 6.4 0.0 0.0%Rother 6.6 0.0 6.6 0.0 0.0% 0.0 6.6 0.0 0.0%Wealden 8.3 0.0 8.3 0.0 0.0% 0.0 8.3 0.0 0.0%
89
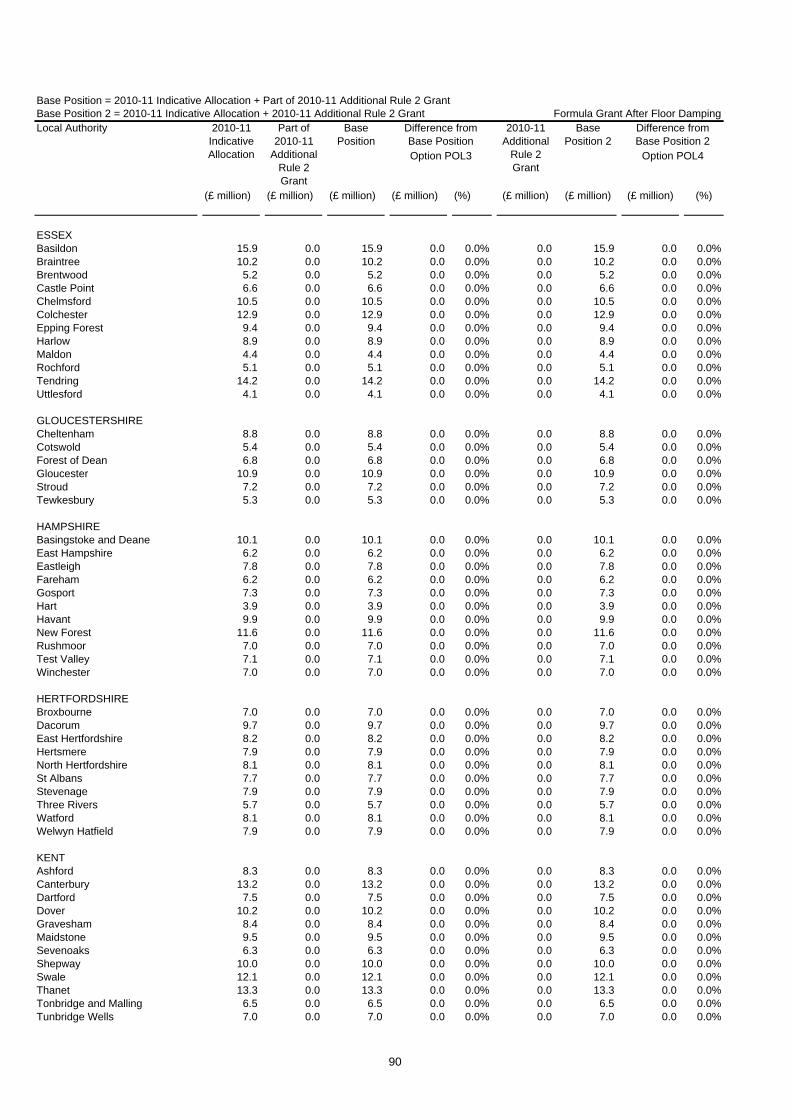
Base Position = 2010-11 Indicative Allocation + Part of 2010-11 Additional Rule 2 GrantBase Position 2 = 2010-11 Indicative Allocation + 2010-11 Additional Rule 2 Grant Formula Grant After Floor DampingLocal Authority
(£ million) (£ million) (£ million) (£ million) (%) (£ million) (£ million) (£ million) (%)
Difference from Base Position
Difference from Base Position 2
2010-11 Indicative Allocation
Part of 2010-11
Additional Rule 2 Grant
Base Position
Option POL3
2010-11 Additional
Rule 2 Grant
Base Position 2
Option POL4
ESSEXBasildon 15.9 0.0 15.9 0.0 0.0% 0.0 15.9 0.0 0.0%Braintree 10.2 0.0 10.2 0.0 0.0% 0.0 10.2 0.0 0.0%Brentwood 5.2 0.0 5.2 0.0 0.0% 0.0 5.2 0.0 0.0%Castle Point 6.6 0.0 6.6 0.0 0.0% 0.0 6.6 0.0 0.0%Chelmsford 10.5 0.0 10.5 0.0 0.0% 0.0 10.5 0.0 0.0%Colchester 12.9 0.0 12.9 0.0 0.0% 0.0 12.9 0.0 0.0%Epping Forest 9.4 0.0 9.4 0.0 0.0% 0.0 9.4 0.0 0.0%Harlow 8.9 0.0 8.9 0.0 0.0% 0.0 8.9 0.0 0.0%Maldon 4.4 0.0 4.4 0.0 0.0% 0.0 4.4 0.0 0.0%Rochford 5.1 0.0 5.1 0.0 0.0% 0.0 5.1 0.0 0.0%Tendring 14.2 0.0 14.2 0.0 0.0% 0.0 14.2 0.0 0.0%Uttlesford 4.1 0.0 4.1 0.0 0.0% 0.0 4.1 0.0 0.0%
GLOUCESTERSHIRECheltenham 8.8 0.0 8.8 0.0 0.0% 0.0 8.8 0.0 0.0%Cotswold 5.4 0.0 5.4 0.0 0.0% 0.0 5.4 0.0 0.0%Forest of Dean 6.8 0.0 6.8 0.0 0.0% 0.0 6.8 0.0 0.0%Gloucester 10.9 0.0 10.9 0.0 0.0% 0.0 10.9 0.0 0.0%Stroud 7.2 0.0 7.2 0.0 0.0% 0.0 7.2 0.0 0.0%Tewkesbury 5.3 0.0 5.3 0.0 0.0% 0.0 5.3 0.0 0.0%
HAMPSHIREBasingstoke and Deane 10.1 0.0 10.1 0.0 0.0% 0.0 10.1 0.0 0.0%East Hampshire 6.2 0.0 6.2 0.0 0.0% 0.0 6.2 0.0 0.0%Eastleigh 7.8 0.0 7.8 0.0 0.0% 0.0 7.8 0.0 0.0%Fareham 6.2 0.0 6.2 0.0 0.0% 0.0 6.2 0.0 0.0%Gosport 7.3 0.0 7.3 0.0 0.0% 0.0 7.3 0.0 0.0%Hart 3.9 0.0 3.9 0.0 0.0% 0.0 3.9 0.0 0.0%Havant 9.9 0.0 9.9 0.0 0.0% 0.0 9.9 0.0 0.0%New Forest 11.6 0.0 11.6 0.0 0.0% 0.0 11.6 0.0 0.0%Rushmoor 7.0 0.0 7.0 0.0 0.0% 0.0 7.0 0.0 0.0%Test Valley 7.1 0.0 7.1 0.0 0.0% 0.0 7.1 0.0 0.0%Winchester 7.0 0.0 7.0 0.0 0.0% 0.0 7.0 0.0 0.0%
HERTFORDSHIREBroxbourne 7.0 0.0 7.0 0.0 0.0% 0.0 7.0 0.0 0.0%Dacorum 9.7 0.0 9.7 0.0 0.0% 0.0 9.7 0.0 0.0%East Hertfordshire 8.2 0.0 8.2 0.0 0.0% 0.0 8.2 0.0 0.0%Hertsmere 7.9 0.0 7.9 0.0 0.0% 0.0 7.9 0.0 0.0%North Hertfordshire 8.1 0.0 8.1 0.0 0.0% 0.0 8.1 0.0 0.0%St Albans 7.7 0.0 7.7 0.0 0.0% 0.0 7.7 0.0 0.0%Stevenage 7.9 0.0 7.9 0.0 0.0% 0.0 7.9 0.0 0.0%Three Rivers 5.7 0.0 5.7 0.0 0.0% 0.0 5.7 0.0 0.0%Watford 8.1 0.0 8.1 0.0 0.0% 0.0 8.1 0.0 0.0%Welwyn Hatfield 7.9 0.0 7.9 0.0 0.0% 0.0 7.9 0.0 0.0%
KENTAshford 8.3 0.0 8.3 0.0 0.0% 0.0 8.3 0.0 0.0%Canterbury 13.2 0.0 13.2 0.0 0.0% 0.0 13.2 0.0 0.0%Dartford 7.5 0.0 7.5 0.0 0.0% 0.0 7.5 0.0 0.0%Dover 10.2 0.0 10.2 0.0 0.0% 0.0 10.2 0.0 0.0%Gravesham 8.4 0.0 8.4 0.0 0.0% 0.0 8.4 0.0 0.0%Maidstone 9.5 0.0 9.5 0.0 0.0% 0.0 9.5 0.0 0.0%Sevenoaks 6.3 0.0 6.3 0.0 0.0% 0.0 6.3 0.0 0.0%Shepway 10.0 0.0 10.0 0.0 0.0% 0.0 10.0 0.0 0.0%Swale 12.1 0.0 12.1 0.0 0.0% 0.0 12.1 0.0 0.0%Thanet 13.3 0.0 13.3 0.0 0.0% 0.0 13.3 0.0 0.0%Tonbridge and Malling 6.5 0.0 6.5 0.0 0.0% 0.0 6.5 0.0 0.0%Tunbridge Wells 7.0 0.0 7.0 0.0 0.0% 0.0 7.0 0.0 0.0%
90

Base Position = 2010-11 Indicative Allocation + Part of 2010-11 Additional Rule 2 GrantBase Position 2 = 2010-11 Indicative Allocation + 2010-11 Additional Rule 2 Grant Formula Grant After Floor DampingLocal Authority
(£ million) (£ million) (£ million) (£ million) (%) (£ million) (£ million) (£ million) (%)
Difference from Base Position
Difference from Base Position 2
2010-11 Indicative Allocation
Part of 2010-11
Additional Rule 2 Grant
Base Position
Option POL3
2010-11 Additional
Rule 2 Grant
Base Position 2
Option POL4
LANCASHIREBurnley 11.9 0.0 11.9 0.0 0.0% 0.0 11.9 0.0 0.0%Chorley 8.5 0.0 8.5 0.0 0.0% 0.0 8.5 0.0 0.0%Fylde 5.9 0.0 5.9 0.0 0.0% 0.0 5.9 0.0 0.0%Hyndburn 10.2 0.0 10.2 0.0 0.0% 0.0 10.2 0.0 0.0%Lancaster 16.4 0.0 16.4 0.0 0.0% 0.0 16.4 0.0 0.0%Pendle 11.1 0.0 11.1 0.0 0.0% 0.0 11.1 0.0 0.0%Preston 16.0 0.0 16.0 0.0 0.0% 0.0 16.0 0.0 0.0%Ribble Valley 4.1 0.0 4.1 0.0 0.0% 0.0 4.1 0.0 0.0%Rossendale 6.3 0.0 6.3 0.0 0.0% 0.0 6.3 0.0 0.0%South Ribble 7.5 0.0 7.5 0.0 0.0% 0.0 7.5 0.0 0.0%West Lancashire 9.6 0.0 9.6 0.0 0.0% 0.0 9.6 0.0 0.0%Wyre 10.4 0.0 10.4 0.0 0.0% 0.0 10.4 0.0 0.0%
LEICESTERSHIREBlaby 6.4 0.0 6.4 0.0 0.0% 0.0 6.4 0.0 0.0%Charnwood 12.5 0.0 12.5 0.0 0.0% 0.0 12.5 0.0 0.0%Harborough 5.4 0.0 5.4 0.0 0.0% 0.0 5.4 0.0 0.0%Hinckley and Bosworth 7.4 0.0 7.4 0.0 0.0% 0.0 7.4 0.0 0.0%Melton 3.9 0.0 3.9 0.0 0.0% 0.0 3.9 0.0 0.0%North West Leicestershire 7.1 0.0 7.1 0.0 0.0% 0.0 7.1 0.0 0.0%Oadby and Wigston 4.6 0.0 4.6 0.0 0.0% 0.0 4.6 0.0 0.0%
LINCOLNSHIREBoston 7.3 0.0 7.3 0.0 0.0% 0.0 7.3 0.0 0.0%East Lindsey 17.4 0.0 17.4 0.0 0.0% 0.0 17.4 0.0 0.0%Lincoln 10.6 0.0 10.6 0.0 0.0% 0.0 10.6 0.0 0.0%North Kesteven 8.8 0.0 8.8 0.0 0.0% 0.0 8.8 0.0 0.0%South Holland 9.0 0.0 9.0 0.0 0.0% 0.0 9.0 0.0 0.0%South Kesteven 10.1 0.0 10.1 0.0 0.0% 0.0 10.1 0.0 0.0%West Lindsey 8.2 0.0 8.2 0.0 0.0% 0.0 8.2 0.0 0.0%
NORFOLKBreckland 11.3 0.0 11.3 0.0 0.0% 0.0 11.3 0.0 0.0%Broadland 8.5 0.0 8.5 0.0 0.0% 0.0 8.5 0.0 0.0%Great Yarmouth 10.8 0.0 10.8 0.0 0.0% 0.0 10.8 0.0 0.0%King's Lynn and West Norfolk 15.4 0.0 15.4 0.0 0.0% 0.0 15.4 0.0 0.0%North Norfolk 9.0 0.0 9.0 0.0 0.0% 0.0 9.0 0.0 0.0%Norwich 15.9 0.0 15.9 0.0 0.0% 0.0 15.9 0.0 0.0%South Norfolk 8.4 0.0 8.4 0.0 0.0% 0.0 8.4 0.0 0.0%
NORTH YORKSHIRECraven 4.2 0.0 4.2 0.0 0.0% 0.0 4.2 0.0 0.0%Hambleton 5.8 0.0 5.8 0.0 0.0% 0.0 5.8 0.0 0.0%Harrogate 11.3 0.0 11.3 0.0 0.0% 0.0 11.3 0.0 0.0%Richmondshire 4.3 0.0 4.3 0.0 0.0% 0.0 4.3 0.0 0.0%Ryedale 4.5 0.0 4.5 0.0 0.0% 0.0 4.5 0.0 0.0%Scarborough 12.5 0.0 12.5 0.0 0.0% 0.0 12.5 0.0 0.0%Selby 6.8 0.0 6.8 0.0 0.0% 0.0 6.8 0.0 0.0%
NORTHAMPTONSHIRECorby 5.7 0.0 5.7 0.0 0.0% 0.0 5.7 0.0 0.0%Daventry 6.2 0.0 6.2 0.0 0.0% 0.0 6.2 0.0 0.0%East Northamptonshire 6.7 0.0 6.7 0.0 0.0% 0.0 6.7 0.0 0.0%Kettering 7.3 0.0 7.3 0.0 0.0% 0.0 7.3 0.0 0.0%Northampton 18.9 0.0 18.9 0.0 0.0% 0.0 18.9 0.0 0.0%South Northamptonshire 5.8 0.0 5.8 0.0 0.0% 0.0 5.8 0.0 0.0%Wellingborough 7.0 0.0 7.0 0.0 0.0% 0.0 7.0 0.0 0.0%
91
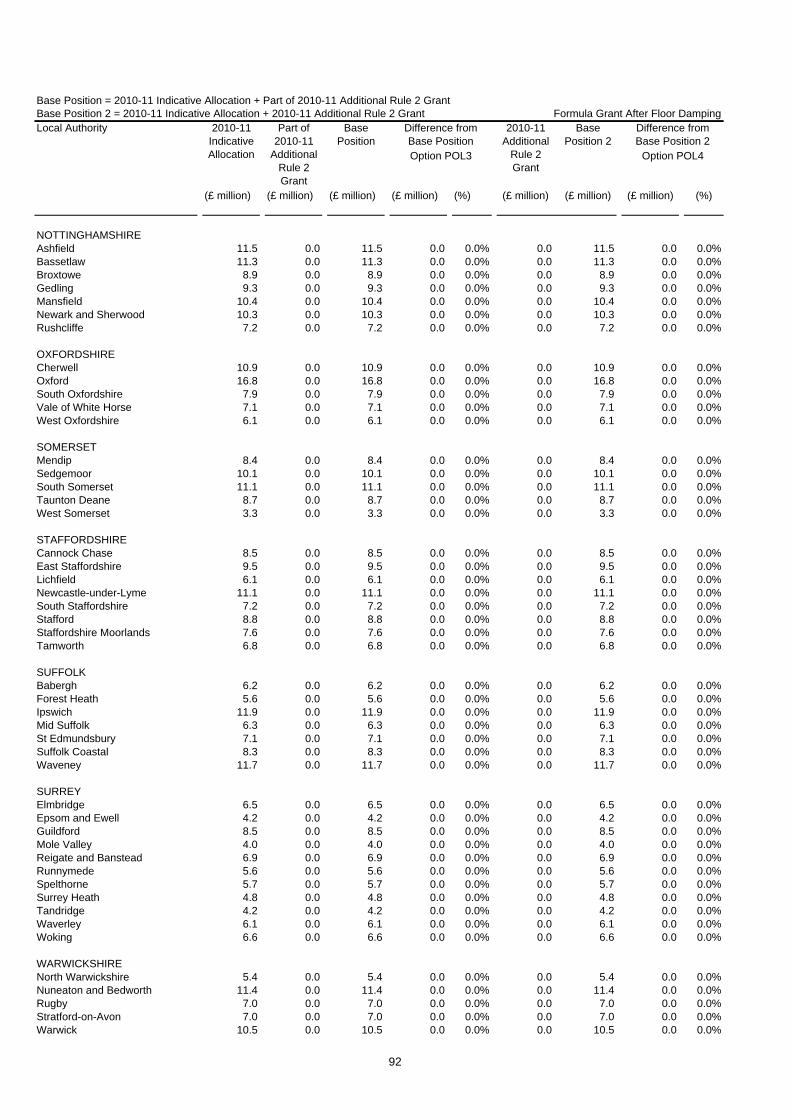
Base Position = 2010-11 Indicative Allocation + Part of 2010-11 Additional Rule 2 GrantBase Position 2 = 2010-11 Indicative Allocation + 2010-11 Additional Rule 2 Grant Formula Grant After Floor DampingLocal Authority
(£ million) (£ million) (£ million) (£ million) (%) (£ million) (£ million) (£ million) (%)
Difference from Base Position
Difference from Base Position 2
2010-11 Indicative Allocation
Part of 2010-11
Additional Rule 2 Grant
Base Position
Option POL3
2010-11 Additional
Rule 2 Grant
Base Position 2
Option POL4
NOTTINGHAMSHIREAshfield 11.5 0.0 11.5 0.0 0.0% 0.0 11.5 0.0 0.0%Bassetlaw 11.3 0.0 11.3 0.0 0.0% 0.0 11.3 0.0 0.0%Broxtowe 8.9 0.0 8.9 0.0 0.0% 0.0 8.9 0.0 0.0%Gedling 9.3 0.0 9.3 0.0 0.0% 0.0 9.3 0.0 0.0%Mansfield 10.4 0.0 10.4 0.0 0.0% 0.0 10.4 0.0 0.0%Newark and Sherwood 10.3 0.0 10.3 0.0 0.0% 0.0 10.3 0.0 0.0%Rushcliffe 7.2 0.0 7.2 0.0 0.0% 0.0 7.2 0.0 0.0%
OXFORDSHIRECherwell 10.9 0.0 10.9 0.0 0.0% 0.0 10.9 0.0 0.0%Oxford 16.8 0.0 16.8 0.0 0.0% 0.0 16.8 0.0 0.0%South Oxfordshire 7.9 0.0 7.9 0.0 0.0% 0.0 7.9 0.0 0.0%Vale of White Horse 7.1 0.0 7.1 0.0 0.0% 0.0 7.1 0.0 0.0%West Oxfordshire 6.1 0.0 6.1 0.0 0.0% 0.0 6.1 0.0 0.0%
SOMERSETMendip 8.4 0.0 8.4 0.0 0.0% 0.0 8.4 0.0 0.0%Sedgemoor 10.1 0.0 10.1 0.0 0.0% 0.0 10.1 0.0 0.0%South Somerset 11.1 0.0 11.1 0.0 0.0% 0.0 11.1 0.0 0.0%Taunton Deane 8.7 0.0 8.7 0.0 0.0% 0.0 8.7 0.0 0.0%West Somerset 3.3 0.0 3.3 0.0 0.0% 0.0 3.3 0.0 0.0%
STAFFORDSHIRECannock Chase 8.5 0.0 8.5 0.0 0.0% 0.0 8.5 0.0 0.0%East Staffordshire 9.5 0.0 9.5 0.0 0.0% 0.0 9.5 0.0 0.0%Lichfield 6.1 0.0 6.1 0.0 0.0% 0.0 6.1 0.0 0.0%Newcastle-under-Lyme 11.1 0.0 11.1 0.0 0.0% 0.0 11.1 0.0 0.0%South Staffordshire 7.2 0.0 7.2 0.0 0.0% 0.0 7.2 0.0 0.0%Stafford 8.8 0.0 8.8 0.0 0.0% 0.0 8.8 0.0 0.0%Staffordshire Moorlands 7.6 0.0 7.6 0.0 0.0% 0.0 7.6 0.0 0.0%Tamworth 6.8 0.0 6.8 0.0 0.0% 0.0 6.8 0.0 0.0%
SUFFOLKBabergh 6.2 0.0 6.2 0.0 0.0% 0.0 6.2 0.0 0.0%Forest Heath 5.6 0.0 5.6 0.0 0.0% 0.0 5.6 0.0 0.0%Ipswich 11.9 0.0 11.9 0.0 0.0% 0.0 11.9 0.0 0.0%Mid Suffolk 6.3 0.0 6.3 0.0 0.0% 0.0 6.3 0.0 0.0%St Edmundsbury 7.1 0.0 7.1 0.0 0.0% 0.0 7.1 0.0 0.0%Suffolk Coastal 8.3 0.0 8.3 0.0 0.0% 0.0 8.3 0.0 0.0%Waveney 11.7 0.0 11.7 0.0 0.0% 0.0 11.7 0.0 0.0%
SURREYElmbridge 6.5 0.0 6.5 0.0 0.0% 0.0 6.5 0.0 0.0%Epsom and Ewell 4.2 0.0 4.2 0.0 0.0% 0.0 4.2 0.0 0.0%Guildford 8.5 0.0 8.5 0.0 0.0% 0.0 8.5 0.0 0.0%Mole Valley 4.0 0.0 4.0 0.0 0.0% 0.0 4.0 0.0 0.0%Reigate and Banstead 6.9 0.0 6.9 0.0 0.0% 0.0 6.9 0.0 0.0%Runnymede 5.6 0.0 5.6 0.0 0.0% 0.0 5.6 0.0 0.0%Spelthorne 5.7 0.0 5.7 0.0 0.0% 0.0 5.7 0.0 0.0%Surrey Heath 4.8 0.0 4.8 0.0 0.0% 0.0 4.8 0.0 0.0%Tandridge 4.2 0.0 4.2 0.0 0.0% 0.0 4.2 0.0 0.0%Waverley 6.1 0.0 6.1 0.0 0.0% 0.0 6.1 0.0 0.0%Woking 6.6 0.0 6.6 0.0 0.0% 0.0 6.6 0.0 0.0%
WARWICKSHIRENorth Warwickshire 5.4 0.0 5.4 0.0 0.0% 0.0 5.4 0.0 0.0%Nuneaton and Bedworth 11.4 0.0 11.4 0.0 0.0% 0.0 11.4 0.0 0.0%Rugby 7.0 0.0 7.0 0.0 0.0% 0.0 7.0 0.0 0.0%Stratford-on-Avon 7.0 0.0 7.0 0.0 0.0% 0.0 7.0 0.0 0.0%Warwick 10.5 0.0 10.5 0.0 0.0% 0.0 10.5 0.0 0.0%
92

Base Position = 2010-11 Indicative Allocation + Part of 2010-11 Additional Rule 2 GrantBase Position 2 = 2010-11 Indicative Allocation + 2010-11 Additional Rule 2 Grant Formula Grant After Floor DampingLocal Authority
(£ million) (£ million) (£ million) (£ million) (%) (£ million) (£ million) (£ million) (%)
Difference from Base Position
Difference from Base Position 2
2010-11 Indicative Allocation
Part of 2010-11
Additional Rule 2 Grant
Base Position
Option POL3
2010-11 Additional
Rule 2 Grant
Base Position 2
Option POL4
WEST SUSSEXAdur 5.0 0.0 5.0 0.0 0.0% 0.0 5.0 0.0 0.0%Arun 10.3 0.0 10.3 0.0 0.0% 0.0 10.3 0.0 0.0%Chichester 7.2 0.0 7.2 0.0 0.0% 0.0 7.2 0.0 0.0%Crawley 10.5 0.0 10.5 0.0 0.0% 0.0 10.5 0.0 0.0%Horsham 6.2 0.0 6.2 0.0 0.0% 0.0 6.2 0.0 0.0%Mid Sussex 6.5 0.0 6.5 0.0 0.0% 0.0 6.5 0.0 0.0%Worthing 7.9 0.0 7.9 0.0 0.0% 0.0 7.9 0.0 0.0%
WORCESTERSHIREBromsgrove 5.0 0.0 5.0 0.0 0.0% 0.0 5.0 0.0 0.0%Malvern Hills 5.2 0.0 5.2 0.0 0.0% 0.0 5.2 0.0 0.0%Redditch 6.5 0.0 6.5 0.0 0.0% 0.0 6.5 0.0 0.0%Worcester 8.2 0.0 8.2 0.0 0.0% 0.0 8.2 0.0 0.0%Wychavon 7.8 0.0 7.8 0.0 0.0% 0.0 7.8 0.0 0.0%Wyre Forest 8.1 0.0 8.1 0.0 0.0% 0.0 8.1 0.0 0.0%
93

Base Position = 2010-11 Indicative Allocation + Part of 2010-11 Additional Rule 2 GrantBase Position 2 = 2010-11 Indicative Allocation + 2010-11 Additional Rule 2 Grant Formula Grant After Floor DampingLocal Authority
(£ million) (£ million) (£ million) (£ million) (%) (£ million) (£ million) (£ million) (%)
Difference from Base Position
Difference from Base Position 2
2010-11 Indicative Allocation
Part of 2010-11
Additional Rule 2 Grant
Base Position
Option POL3
2010-11 Additional
Rule 2 Grant
Base Position 2
Option POL4
SHIRE POLICE AUTHORITIES
Avon & Somerset Police 186.1 1.2 187.2 0.0 0.0% 2.2 188.2 0.2 0.1%Bedfordshire Police 73.1 0.3 73.4 0.0 0.0% 0.9 74.0 0.1 0.1%Cambridgeshire Police 83.5 0.5 84.0 0.0 0.0% 1.6 85.1 0.0 -0.1%Cheshire Police 123.5 0.9 124.5 0.2 0.1% 1.2 124.7 -0.1 -0.1%Cleveland Police 100.1 0.1 100.2 0.1 0.1% 0.1 100.2 -0.1 -0.1%
Cumbria Police 68.9 0.4 69.2 0.1 0.2% 1.7 70.6 0.0 0.0%Derbyshire Police 116.2 0.6 116.7 0.0 0.0% 1.0 117.1 0.1 0.1%Devon & Cornwall Police 191.2 0.0 191.2 0.3 0.1% 3.1 194.3 -0.2 -0.1%Dorset Police 66.9 0.3 67.3 0.1 0.1% 0.8 67.7 0.0 -0.1%Durham Police 93.7 0.1 93.8 0.1 0.1% 0.3 94.0 -0.1 -0.1%
Essex Police 183.0 0.7 183.7 0.1 0.1% 3.3 186.3 -0.1 -0.1%Gloucestershire Police 60.8 0.4 61.2 0.1 0.1% 1.2 62.0 0.0 0.0%Hampshire Police 213.0 0.9 214.0 0.2 0.1% 2.4 215.5 0.0 0.0%Hertfordshire Police 124.8 0.5 125.3 0.1 0.1% 2.1 127.0 0.0 0.0%Humberside Police 131.8 0.2 132.0 0.1 0.1% 0.9 132.7 0.0 0.0%
Kent Police 197.4 1.4 198.8 0.1 0.1% 4.5 201.8 -0.3 -0.1%Lancashire Police 209.7 1.1 210.8 0.1 0.1% 1.2 210.8 0.1 0.1%Leicestershire Police 121.4 0.4 121.8 0.1 0.1% 0.8 122.2 0.1 0.1%Lincolnshire Police 66.3 0.3 66.6 0.0 0.1% 2.3 68.6 -0.2 -0.2%Norfolk Police 89.8 0.3 90.0 0.1 0.2% 2.3 92.1 0.0 0.0%
North Yorkshire Police 78.6 0.3 78.9 0.1 0.2% 2.3 80.9 0.0 0.0%Northamptonshire Police 77.5 0.4 77.9 0.1 0.1% 1.1 78.6 0.0 0.0%Nottinghamshire Police 146.0 0.0 146.0 0.1 0.1% 0.0 146.0 0.3 0.2%Staffordshire Police 123.8 0.7 124.5 0.1 0.1% 1.0 124.7 0.0 0.0%Suffolk Police 72.7 0.3 73.0 0.1 0.1% 1.7 74.4 0.0 0.0%
Surrey Police 104.4 0.7 105.1 0.2 0.1% 2.1 106.5 0.0 0.0%Sussex Police 174.1 1.5 175.5 0.3 0.1% 3.1 177.2 -0.1 0.0%Thames Valley Police 244.7 0.9 245.6 0.2 0.1% 4.9 249.7 -0.3 -0.1%Warwickshire Police 55.6 0.2 55.7 0.1 0.1% 0.7 56.3 0.0 0.0%West Mercia Police 124.9 0.8 125.7 0.2 0.2% 3.1 128.0 0.0 0.0%
Wiltshire Police 66.8 0.3 67.1 0.1 0.1% 1.4 68.2 0.0 0.0%
WELSH POLICE AUTHORITIES
Dyfed-Powys Police 55.788 0.9 56.7 2.8 5.0% 2.8 58.6 0.0 0.0%Gwent Police 84.684 1.3 85.9 0.3 0.4% 0.3 85.0 -0.1 -0.1%North Wales Police 82.133 1.7 83.9 1.7 2.0% 2.1 84.2 0.0 0.0%South Wales Police 186.421 3.0 189.4 3.1 1.7% 0.5 186.9 5.5 3.0%
94

Base Position = 2010-11 Indicative Allocation + Part of 2010-11 Additional Rule 2 GrantBase Position 2 = 2010-11 Indicative Allocation + 2010-11 Additional Rule 2 Grant Formula Grant After Floor DampingLocal Authority
(£ million) (£ million) (£ million) (£ million) (%) (£ million) (£ million) (£ million) (%)
Difference from Base Position
Difference from Base Position 2
2010-11 Indicative Allocation
Part of 2010-11
Additional Rule 2 Grant
Base Position
Option POL3
2010-11 Additional
Rule 2 Grant
Base Position 2
Option POL4
SHIRE FIRE AUTHORITIES
Avon Fire 24.9 0.0 24.9 0.0 0.0% 0.0 24.9 0.0 0.0%Bedfordshire Fire 11.4 0.0 11.4 0.0 0.0% 0.0 11.4 0.0 0.0%Berkshire Fire Auhtority 15.4 0.0 15.4 0.0 0.0% 0.0 15.4 0.0 0.0%Buckinghamshire Fire 11.5 0.0 11.5 0.0 0.0% 0.0 11.5 0.0 0.0%Cambridgeshire Fire 14.4 0.0 14.4 0.0 0.0% 0.0 14.4 0.0 0.0%
Cheshire Fire 18.6 0.0 18.6 0.0 0.0% 0.0 18.6 0.0 0.0%Cleveland Fire 22.4 0.0 22.4 0.0 0.0% 0.0 22.4 0.0 0.0%Derbyshire Fire 19.7 0.0 19.7 0.0 0.0% 0.0 19.7 0.0 0.0%Devon and Somerset Fire 31.2 0.0 31.2 0.0 0.0% 0.0 31.2 0.0 0.0%Dorset Fire 11.0 0.0 11.0 0.0 0.0% 0.0 11.0 0.0 0.0%
Durham Fire 14.5 0.0 14.5 0.0 0.0% 0.0 14.5 0.0 0.0%East Sussex Fire 14.7 0.0 14.7 0.0 0.0% 0.0 14.7 0.0 0.0%Essex Fire Auhtority 32.4 0.0 32.4 0.0 0.0% 0.0 32.4 0.0 0.0%Hampshire Fire 29.3 0.0 29.3 0.0 0.0% 0.0 29.3 0.0 0.0%Hereford & Worcester Fire 10.7 0.0 10.7 0.0 0.0% 0.0 10.7 0.0 0.0%
Humberside Fire 27.2 0.0 27.2 0.0 0.0% 0.0 27.2 0.0 0.0%Kent Fire 29.6 0.0 29.6 0.0 0.0% 0.0 29.6 0.0 0.0%Lancashire Fire 32.6 0.0 32.6 0.0 0.0% 0.0 32.6 0.0 0.0%Leicestershire Fire 18.8 0.0 18.8 0.0 0.0% 0.0 18.8 0.0 0.0%North Yorkshire Fire 13.0 0.0 13.0 0.0 0.0% 0.0 13.0 0.0 0.0%
Nottinghamshire Fire 25.0 0.0 25.0 0.0 0.0% 0.0 25.0 0.0 0.0%Shropshire Fire 8.3 0.0 8.3 0.0 0.0% 0.0 8.3 0.0 0.0%Staffordshire Fire 18.6 0.0 18.6 0.0 0.0% 0.0 18.6 0.0 0.0%Wiltshire Fire 9.6 0.0 9.6 0.0 0.0% 0.0 9.6 0.0 0.0%
95

96
Chapter 5 Fire and Rescue The current system 1. The main determinants of the existing Fire and Rescue Relative Needs Formula are the resident population and fire safety. Cost adjustments are made to reflect coastline, deprivation and the number of upper tier Control of Major Accident Hazards (COMAH) sites and the differences in the costs of provision between areas (measured by the Area Cost Adjustment).
2. The current formula is given below.
Basic amounts
FIRE AND RESCUE
BASIC AMOUNT
1.6824
Top-ups
FIRE AND RESCUE
COASTLINE TOP-UP
0.7825 multiplied by COASTLINE
FIRE AND RESCUE
DEPRIVATION TOP-UP
0.2349 multiplied by RISK INDEX
HIGH RISK TOP-UP
30,869.6814 multiplied by COMAH SITES
PROPERTY AND SOCIETAL RISK TOP-UP
PROPERTY AND SOCIETAL RISK
COMMUNITY FIRE SAFETY TOP-UP
COMMUNITY FIRE SAFETY
The full formula used to calculate the Fire and Rescue element is:
Fire and Rescue
(a) PROJECTED POPULATION IN 2010 multiplied by the result of: FIRE AND RESCUE BASIC AMOUNT; plus FIRE AND RESCUE COASTLINE TOP-UP; plus FIRE AND RESCUE DEPRIVATION TOP-UP; plus HIGH RISK TOP-UP; plus PROPERTY AND SOCIETAL RISK TOP-UP; plus COMMUNITY FIRE SAFETY TOP-UP
(b) The result of (a) is then multiplied by AREA COST ADJUSTMENT FOR FIRE;

97
(c) The result of (b) is then multiplied by the scaling factor given in Annex F for the Fire and Rescue service block.
(d) The result of (c) is then divided by 10,000,000,000.
Updating the regression expenditure base
Option FIR1
3. The coefficients applied to the basic amount, coastline, deprivation and high risk top-ups are determined by regression against past expenditure.
4. The current regression base uses net current expenditure less pensions expenditure data averaged over the period 1998-99 to 2000-01. These data are now out of date.
5. Option FIR1 updates this expenditure base with the latest available data, and uses net current expenditure for fire and rescue services (on a non-FRS17 basis) less recorded income from special grants relating to fire, averaged over the period 2006-07 to 2008-09. This data comes from the RO returns to the Department.
6. The new basic amount and top-ups for Option FIR1 are given below:
Basic amounts
FIRE AND RESCUE
BASIC AMOUNT
2.4841
Top-ups
FIRE AND RESCUE
COASTLINE TOP-UP
1.1091 multiplied by COASTLINE
FIRE AND RESCUE
DEPRIVATION TOP-UP
0.1742 multiplied by RISK INDEX
HIGH RISK TOP-UP
24,856.3811 multiplied by COMAH SITES
PROPERTY AND SOCIETAL RISK TOP-UP
PROPERTY AND SOCIETAL RISK
COMMUNITY FIRE SAFETY TOP-UP
COMMUNITY FIRE SAFETY

98
Option FIR2
7. Option FIR2 uses the same updated expenditure base data in Option FIR1 but adds in annual cashable efficiency savings averaged over 2006-07 to 2008-09. This data comes from Annual Efficiency Statements returned to the Department. This adjustment for efficiencies may help overcome the perception that authorities are in some way penalised for making efficiency savings.
8. The new basic amount and top-ups for Option FIR2 are given below:
Basic amounts
FIRE AND RESCUE
BASIC AMOUNT
2.4222
Top-ups
FIRE AND RESCUE
COASTLINE TOP-UP
1.1682 multiplied by COASTLINE
FIRE AND RESCUE
DEPRIVATION TOP-UP
0.1778 multiplied by RISK INDEX
HIGH RISK TOP-UP
26,538.4732 multiplied by COMAH SITES
PROPERTY AND SOCIETAL RISK TOP-UP
PROPERTY AND SOCIETAL RISK
COMMUNITY FIRE SAFETY TOP-UP
COMMUNITY FIRE SAFETY
Updating the risk index
9. The current risk index uses a combination of six factors that are each standardised. A constant is added to each factor to ensure that all values are positive. These factors are
• Proportion of children of Income Support / Income based Jobseekers’ Allowance Claimants
• Proportion of households not containing a couple with no children
• Proportion of people living in rented accommodation
• Average number of absences in pupils of primary school age

99
• Average number of rooms per household resident
• Proportion of people in ACORN type 50 (single elderly people, council flats) and type 53 (old people, many high rise flats)
10. The risk index was developed in 2002, using statistical analysis to determine a group of indicators that had a relationship to the number of incidents that fire and rescue services attended. The number of incidents covered all types of incidents not just fires. The current risk index was introduced in the 2006-07 settlement, with the average number of rooms per household resident and ACORN types 50 and 53 included in the index instead of using housing type factors. However, this change did not update the original 2002 analysis.
11. Options FIR3 and FIR4 are the result of rerunning the analysis process, using more up to date incident data, and new or updated factors for consideration in the analysis.
Option FIR3
12. Option FIR3 contains a risk index that uses the following standardised factors. Again, a constant has been added to each standardised factor before they are combined into the index.
• Proportion of people of working age with no qualifications
• Proportion of people of working age who are not in employment (ie are on New Deal, receive Incapacity Benefit or Severe Disablement Allowance, or receiving apprenticeship training)
• Proportion of people receiving Income Support/Income based Jobseeker’s Allowance/guarantee element of Pension Credit
• Proportion of people in ACORN Group G: Starting Out (reflecting Type 24: Young Couples, Flats and Terraces and Type 25: White-Collar, Single and Sharers, Terraces)
• Standardised Mortality Ratio: 0 – 74 years
13. In addition, population sparsity is included as a separate indicator (with a negative coefficient) in the population density top-up.
14. The new basic amount and top-ups for Option FIR3 are given below:
Basic amounts
FIRE AND RESCUE
BASIC AMOUNT
4.6804

100
Top-ups
FIRE AND RESCUE
COASTLINE TOP-UP
1.3160 multiplied by COASTLINE
FIRE AND RESCUE
DEPRIVATION TOP-UP
0.1032 multiplied by RISK INDEX (OPTION FIR3)
FIRE AND RESCUE
POPULATION DENSITY TOP-UP
- 2.9282 multiplied by POPULATION SPARSITY
HIGH RISK TOP-UP
23,456.6387 multiplied by COMAH SITES
PROPERTY AND SOCIETAL RISK TOP-UP
PROPERTY AND SOCIETAL RISK
COMMUNITY FIRE SAFETY TOP-UP
COMMUNITY FIRE SAFETY
Option FIR4
15. Option FIR4 contains a risk index that uses the following standardised factors. Again, a constant has been added to each standardised factor before they are combined into the index.
• Proportion of people of working age with no qualifications
• Proportion of people of working age who are not in employment (ie are on New Deal, receive Incapacity Benefit or Severe Disablement Allowance, or receiving apprenticeship training)
• Proportion of people receiving Income Support/Income based Jobseeker’s Allowance guarantee element of Pension Credit
• Standardised Mortality Ratio: 0 – 74 years
16. In addition, population density is included as a separate indicator in the deprivation top-up.
17. The new basic amount and top-ups for Option FIR4 are given below:
Basic amounts
FIRE AND RESCUE
BASIC AMOUNT
3.0293

101
Top-ups
FIRE AND RESCUE
COASTLINE TOP-UP
0.8302 multiplied by COASTLINE
FIRE AND RESCUE
DEPRIVATION TOP-UP
0.1575 multiplied by RISK INDEX (OPTION FIR4)
FIRE AND RESCUE
POPULATION DENSITY TOP-UP
0.0883 multiplied by POPULATION DENSITY
HIGH RISK TOP-UP
24,709.0496 multiplied by COMAH SITES
PROPERTY AND SOCIETAL RISK TOP-UP
PROPERTY AND SOCIETAL RISK
COMMUNITY FIRE SAFETY TOP-UP
COMMUNITY FIRE SAFETY
Questions
Question 6: Do you agree that the expenditure data used to determine the coefficients should be updated (FIR1)?
Question 7: Should annual cashable efficiency savings be added to the updated expenditure data used to determine the coefficients (FIR2)?
Question 8: Would you prefer either FIR3 or FIR4 as an alternative to the current risk index?

Formula Grant Before Floor DampingLocal Authority
(£ million) (£ million) (%) (£ million) (%)
England 28,995.5 0.0 0.0% 0.0 0.0%
London area 6,153.4 -2.8 0.0% -3.3 -0.1%Metropolitan areas 8,340.7 -8.7 -0.1% -8.7 -0.1%Shire areas 14,499.1 11.5 0.1% 12.0 0.1%Isles of Scilly 2.3 0.0 0.0% 0.0 0.0%
Inner London boroughs incl. City 2,025.0 6.0 0.3% 5.5 0.3%Outer London boroughs 1,873.1 0.5 0.0% 0.4 0.0%London boroughs 3,898.1 6.4 0.2% 5.9 0.2%GLA - all functions 2,255.3 -9.2 -0.4% -9.3 -0.4%
Metropolitan districts 5,904.0 4.8 0.1% 4.4 0.1%Metropolitan fire authorities 335.8 -14.2 -4.2% -13.6 -4.1%Metropolitan police authorities 2,100.9 0.7 0.0% 0.6 0.0%
Shire unitaries with fire 425.6 2.4 0.6% 2.7 0.6%Shire unitaries without fire 4,099.3 -2.5 -0.1% -2.4 -0.1%Shire counties with fire 1,589.0 5.9 0.4% 5.5 0.3%Shire counties without fire 2,501.9 -8.8 -0.4% -8.2 -0.3%Shire districts 1,654.0 0.0 0.0% 0.0 0.0%Combined fire authorities 467.7 17.7 3.8% 17.3 3.7%Shire police authorities 3,761.6 -3.2 -0.1% -3.0 -0.1%
GO REGIONAL SUMMARY
South West GOR 2,267.3 4.1 0.2% 4.3 0.2%South East GOR 2,957.0 5.1 0.2% 4.6 0.2%London GOR 6,153.4 -2.8 0.0% -3.3 -0.1%Eastern GOR 2,437.8 1.4 0.1% 1.4 0.1%East Midlands GOR 2,292.2 0.1 0.0% 0.0 0.0%West Midlands GOR 3,349.9 -0.9 0.0% -1.2 0.0%Yorkshire and Humber GOR 3,199.2 -1.7 -0.1% -1.4 0.0%North East GOR 1,777.2 -2.9 -0.2% -2.4 -0.1%North West GOR 4,561.4 -2.4 -0.1% -2.2 0.0%
FLOOR DAMPING GROUPS
Education Authorities 18,418.0 8.2 0.0% 8.0 0.0%Police Authorities 7,864.8 0.1 0.0% 0.1 0.0%Fire Authorities 1,056.5 -8.3 -0.8% -8.1 -0.8%Shire Districts 1,654.0 0.0 0.0% 0.0 0.0%
Option FIR1 Option FIR22010-11
Indicative Allocation
Fire: Updating Expenditure Data
Difference from 2010-11 Indicative
102
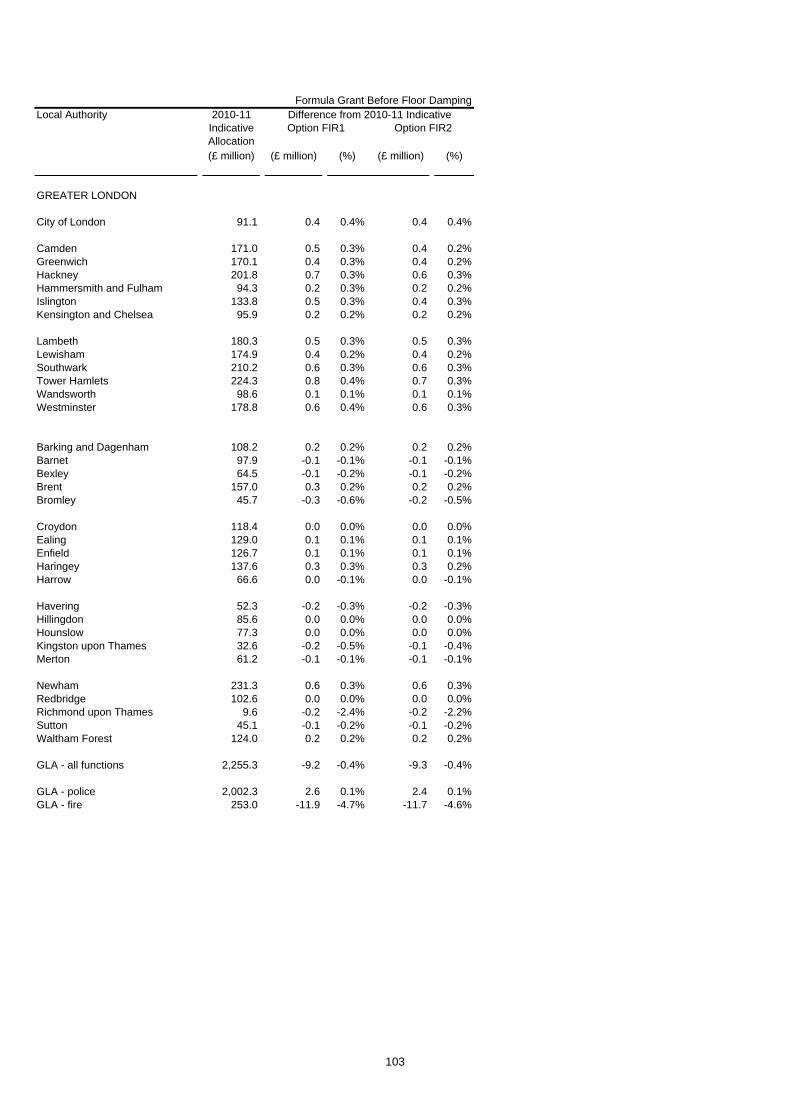
Formula Grant Before Floor DampingLocal Authority
(£ million) (£ million) (%) (£ million) (%)
Option FIR1 Option FIR22010-11
Indicative Allocation
Difference from 2010-11 Indicative
GREATER LONDON
City of London 91.1 0.4 0.4% 0.4 0.4%
Camden 171.0 0.5 0.3% 0.4 0.2%Greenwich 170.1 0.4 0.3% 0.4 0.2%Hackney 201.8 0.7 0.3% 0.6 0.3%Hammersmith and Fulham 94.3 0.2 0.3% 0.2 0.2%Islington 133.8 0.5 0.3% 0.4 0.3%Kensington and Chelsea 95.9 0.2 0.2% 0.2 0.2%
Lambeth 180.3 0.5 0.3% 0.5 0.3%Lewisham 174.9 0.4 0.2% 0.4 0.2%Southwark 210.2 0.6 0.3% 0.6 0.3%Tower Hamlets 224.3 0.8 0.4% 0.7 0.3%Wandsworth 98.6 0.1 0.1% 0.1 0.1%Westminster 178.8 0.6 0.4% 0.6 0.3%
Barking and Dagenham 108.2 0.2 0.2% 0.2 0.2%Barnet 97.9 -0.1 -0.1% -0.1 -0.1%Bexley 64.5 -0.1 -0.2% -0.1 -0.2%Brent 157.0 0.3 0.2% 0.2 0.2%Bromley 45.7 -0.3 -0.6% -0.2 -0.5%
Croydon 118.4 0.0 0.0% 0.0 0.0%Ealing 129.0 0.1 0.1% 0.1 0.1%Enfield 126.7 0.1 0.1% 0.1 0.1%Haringey 137.6 0.3 0.3% 0.3 0.2%Harrow 66.6 0.0 -0.1% 0.0 -0.1%
Havering 52.3 -0.2 -0.3% -0.2 -0.3%Hillingdon 85.6 0.0 0.0% 0.0 0.0%Hounslow 77.3 0.0 0.0% 0.0 0.0%Kingston upon Thames 32.6 -0.2 -0.5% -0.1 -0.4%Merton 61.2 -0.1 -0.1% -0.1 -0.1%
Newham 231.3 0.6 0.3% 0.6 0.3%Redbridge 102.6 0.0 0.0% 0.0 0.0%Richmond upon Thames 9.6 -0.2 -2.4% -0.2 -2.2%Sutton 45.1 -0.1 -0.2% -0.1 -0.2%Waltham Forest 124.0 0.2 0.2% 0.2 0.2%
GLA - all functions 2,255.3 -9.2 -0.4% -9.3 -0.4%
GLA - police 2,002.3 2.6 0.1% 2.4 0.1%GLA - fire 253.0 -11.9 -4.7% -11.7 -4.6%
103

Formula Grant Before Floor DampingLocal Authority
(£ million) (£ million) (%) (£ million) (%)
Option FIR1 Option FIR22010-11
Indicative Allocation
Difference from 2010-11 Indicative
GREATER MANCHESTERBolton 132.6 0.1 0.1% 0.1 0.0%Bury 67.5 -0.1 -0.1% -0.1 -0.1%Manchester 346.1 0.7 0.2% 0.7 0.2%Oldham 127.6 0.1 0.1% 0.1 0.1%Rochdale 114.9 0.1 0.1% 0.1 0.1%Salford 131.2 0.2 0.2% 0.2 0.1%Stockport 85.2 -0.2 -0.2% -0.2 -0.2%Tameside 109.5 0.1 0.1% 0.1 0.0%Trafford 67.3 -0.1 -0.1% -0.1 -0.1%Wigan 138.6 0.0 0.0% 0.0 0.0%Greater Manchester Fire 76.1 -2.9 -3.9% -2.9 -3.8%Greater Manchester Police 485.7 0.2 0.0% 0.2 0.0%
MERSEYSIDEKnowsley 114.6 0.2 0.2% 0.2 0.2%Liverpool 318.0 0.7 0.2% 0.7 0.2%Sefton 127.6 0.0 0.0% 0.0 0.0%St Helens 90.9 0.1 0.1% 0.1 0.1%Wirral 165.2 0.2 0.1% 0.1 0.1%Merseyside Fire 46.1 -2.9 -6.2% -2.7 -5.8%Merseyside Police 275.5 0.2 0.1% 0.2 0.1%
SOUTH YORKSHIREBarnsley 114.3 0.1 0.1% 0.1 0.1%Doncaster 149.1 0.1 0.0% 0.1 0.0%Rotherham 130.1 0.0 0.0% 0.0 0.0%Sheffield 280.0 0.2 0.1% 0.2 0.1%South Yorkshire Fire 37.4 -1.2 -3.3% -1.2 -3.2%South Yorkshire Police 209.2 0.0 0.0% 0.0 0.0%
TYNE AND WEARGateshead 102.7 0.1 0.1% 0.1 0.1%Newcastle upon Tyne 157.2 0.2 0.1% 0.2 0.1%North Tyneside 87.4 0.0 0.0% 0.0 0.0%South Tyneside 89.3 0.1 0.1% 0.1 0.1%Sunderland 158.9 0.2 0.1% 0.1 0.1%Tyne and Wear Fire 35.9 -2.1 -6.0% -2.0 -5.6%Northumbria Police 219.9 0.0 0.0% 0.0 0.0%
WEST MIDLANDSBirmingham 698.9 1.2 0.2% 1.1 0.2%Coventry 156.6 0.1 0.1% 0.1 0.0%Dudley 130.4 0.0 0.0% 0.0 0.0%Sandwell 190.3 0.3 0.2% 0.3 0.2%Solihull 49.1 -0.2 -0.3% -0.1 -0.3%Walsall 142.3 0.1 0.1% 0.1 0.1%Wolverhampton 145.6 0.2 0.1% 0.2 0.1%West Midlands Fire 81.6 -4.1 -5.0% -4.0 -4.9%West Midlands Police 542.2 0.3 0.1% 0.3 0.1%
WEST YORKSHIREBradford 283.4 0.2 0.1% 0.2 0.1%Calderdale 84.1 0.0 0.0% 0.0 0.0%Kirklees 164.9 -0.1 -0.1% -0.1 -0.1%Leeds 305.9 -0.2 -0.1% -0.2 -0.1%Wakefield 146.7 0.0 0.0% 0.0 0.0%West Yorkshire Fire 58.7 -0.8 -1.4% -0.8 -1.4%West Yorkshire Police 368.2 0.0 0.0% 0.0 0.0%
104
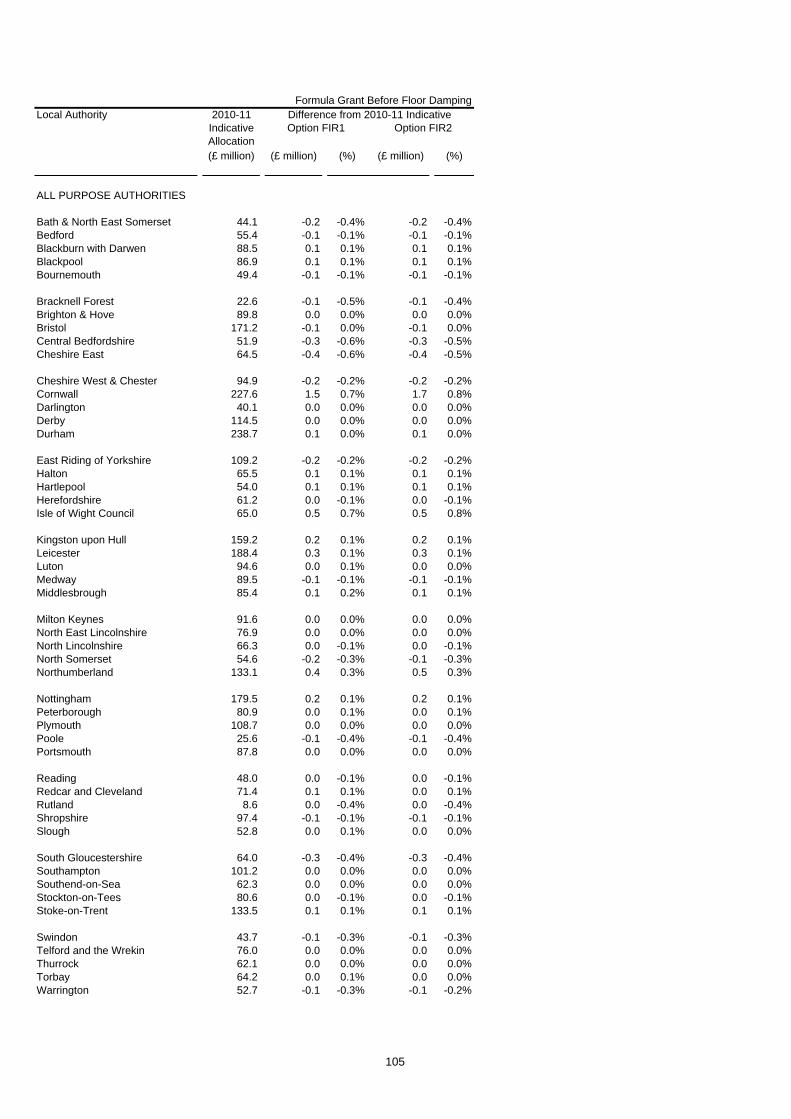
Formula Grant Before Floor DampingLocal Authority
(£ million) (£ million) (%) (£ million) (%)
Option FIR1 Option FIR22010-11
Indicative Allocation
Difference from 2010-11 Indicative
ALL PURPOSE AUTHORITIES
Bath & North East Somerset 44.1 -0.2 -0.4% -0.2 -0.4%Bedford 55.4 -0.1 -0.1% -0.1 -0.1%Blackburn with Darwen 88.5 0.1 0.1% 0.1 0.1%Blackpool 86.9 0.1 0.1% 0.1 0.1%Bournemouth 49.4 -0.1 -0.1% -0.1 -0.1%
Bracknell Forest 22.6 -0.1 -0.5% -0.1 -0.4%Brighton & Hove 89.8 0.0 0.0% 0.0 0.0%Bristol 171.2 -0.1 0.0% -0.1 0.0%Central Bedfordshire 51.9 -0.3 -0.6% -0.3 -0.5%Cheshire East 64.5 -0.4 -0.6% -0.4 -0.5%
Cheshire West & Chester 94.9 -0.2 -0.2% -0.2 -0.2%Cornwall 227.6 1.5 0.7% 1.7 0.8%Darlington 40.1 0.0 0.0% 0.0 0.0%Derby 114.5 0.0 0.0% 0.0 0.0%Durham 238.7 0.1 0.0% 0.1 0.0%
East Riding of Yorkshire 109.2 -0.2 -0.2% -0.2 -0.2%Halton 65.5 0.1 0.1% 0.1 0.1%Hartlepool 54.0 0.1 0.1% 0.1 0.1%Herefordshire 61.2 0.0 -0.1% 0.0 -0.1%Isle of Wight Council 65.0 0.5 0.7% 0.5 0.8%
Kingston upon Hull 159.2 0.2 0.1% 0.2 0.1%Leicester 188.4 0.3 0.1% 0.3 0.1%Luton 94.6 0.0 0.1% 0.0 0.0%Medway 89.5 -0.1 -0.1% -0.1 -0.1%Middlesbrough 85.4 0.1 0.2% 0.1 0.1%
Milton Keynes 91.6 0.0 0.0% 0.0 0.0%North East Lincolnshire 76.9 0.0 0.0% 0.0 0.0%North Lincolnshire 66.3 0.0 -0.1% 0.0 -0.1%North Somerset 54.6 -0.2 -0.3% -0.1 -0.3%Northumberland 133.1 0.4 0.3% 0.5 0.3%
Nottingham 179.5 0.2 0.1% 0.2 0.1%Peterborough 80.9 0.0 0.1% 0.0 0.1%Plymouth 108.7 0.0 0.0% 0.0 0.0%Poole 25.6 -0.1 -0.4% -0.1 -0.4%Portsmouth 87.8 0.0 0.0% 0.0 0.0%
Reading 48.0 0.0 -0.1% 0.0 -0.1%Redcar and Cleveland 71.4 0.1 0.1% 0.0 0.1%Rutland 8.6 0.0 -0.4% 0.0 -0.4%Shropshire 97.4 -0.1 -0.1% -0.1 -0.1%Slough 52.8 0.0 0.1% 0.0 0.0%
South Gloucestershire 64.0 -0.3 -0.4% -0.3 -0.4%Southampton 101.2 0.0 0.0% 0.0 0.0%Southend-on-Sea 62.3 0.0 0.0% 0.0 0.0%Stockton-on-Tees 80.6 0.0 -0.1% 0.0 -0.1%Stoke-on-Trent 133.5 0.1 0.1% 0.1 0.1%
Swindon 43.7 -0.1 -0.3% -0.1 -0.3%Telford and the Wrekin 76.0 0.0 0.0% 0.0 0.0%Thurrock 62.1 0.0 0.0% 0.0 0.0%Torbay 64.2 0.0 0.1% 0.0 0.0%Warrington 52.7 -0.1 -0.3% -0.1 -0.2%
105

Formula Grant Before Floor DampingLocal Authority
(£ million) (£ million) (%) (£ million) (%)
Option FIR1 Option FIR22010-11
Indicative Allocation
Difference from 2010-11 Indicative
West Berkshire 23.1 -0.1 -0.6% -0.1 -0.5%Wiltshire 102.1 -0.4 -0.4% -0.4 -0.4%Windsor and Maidenhead 10.1 -0.2 -1.6% -0.2 -1.5%Wokingham 8.4 -0.2 -2.9% -0.2 -2.7%York 45.8 -0.2 -0.5% -0.2 -0.4%
Isles of Scilly 2.3 0.0 0.0% 0.0 0.0%
106
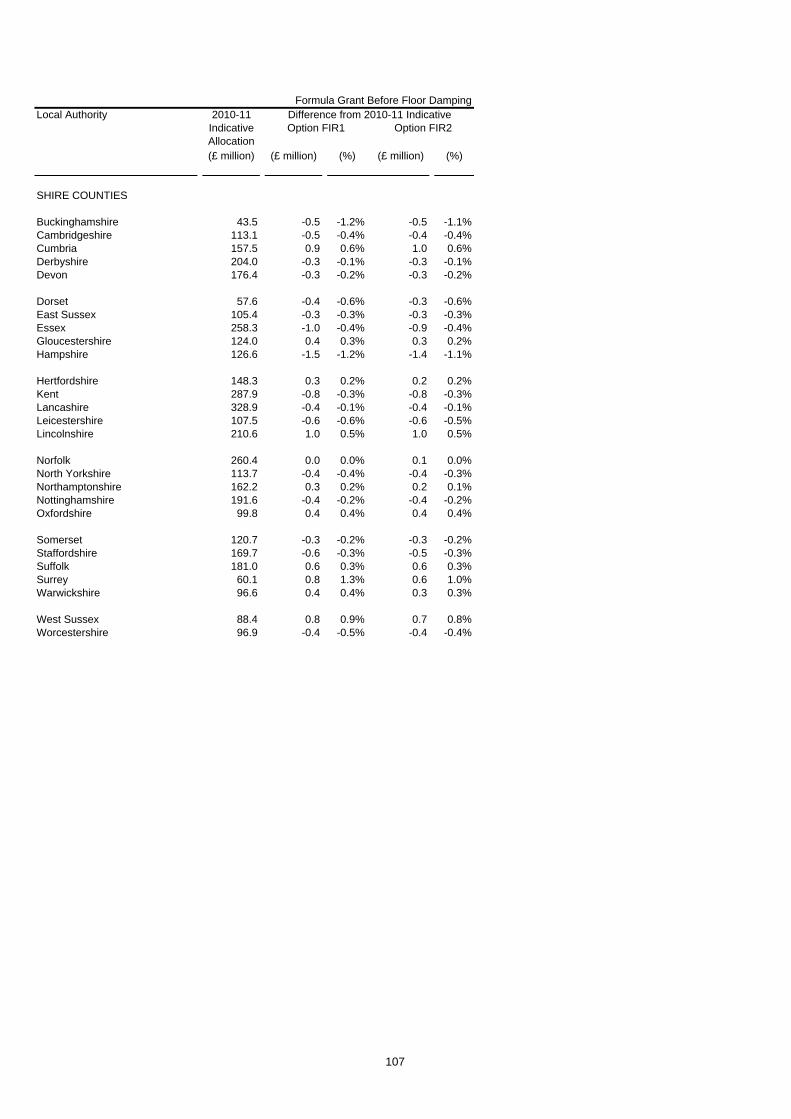
Formula Grant Before Floor DampingLocal Authority
(£ million) (£ million) (%) (£ million) (%)
Option FIR1 Option FIR22010-11
Indicative Allocation
Difference from 2010-11 Indicative
SHIRE COUNTIES
Buckinghamshire 43.5 -0.5 -1.2% -0.5 -1.1%Cambridgeshire 113.1 -0.5 -0.4% -0.4 -0.4%Cumbria 157.5 0.9 0.6% 1.0 0.6%Derbyshire 204.0 -0.3 -0.1% -0.3 -0.1%Devon 176.4 -0.3 -0.2% -0.3 -0.2%
Dorset 57.6 -0.4 -0.6% -0.3 -0.6%East Sussex 105.4 -0.3 -0.3% -0.3 -0.3%Essex 258.3 -1.0 -0.4% -0.9 -0.4%Gloucestershire 124.0 0.4 0.3% 0.3 0.2%Hampshire 126.6 -1.5 -1.2% -1.4 -1.1%
Hertfordshire 148.3 0.3 0.2% 0.2 0.2%Kent 287.9 -0.8 -0.3% -0.8 -0.3%Lancashire 328.9 -0.4 -0.1% -0.4 -0.1%Leicestershire 107.5 -0.6 -0.6% -0.6 -0.5%Lincolnshire 210.6 1.0 0.5% 1.0 0.5%
Norfolk 260.4 0.0 0.0% 0.1 0.0%North Yorkshire 113.7 -0.4 -0.4% -0.4 -0.3%Northamptonshire 162.2 0.3 0.2% 0.2 0.1%Nottinghamshire 191.6 -0.4 -0.2% -0.4 -0.2%Oxfordshire 99.8 0.4 0.4% 0.4 0.4%
Somerset 120.7 -0.3 -0.2% -0.3 -0.2%Staffordshire 169.7 -0.6 -0.3% -0.5 -0.3%Suffolk 181.0 0.6 0.3% 0.6 0.3%Surrey 60.1 0.8 1.3% 0.6 1.0%Warwickshire 96.6 0.4 0.4% 0.3 0.3%
West Sussex 88.4 0.8 0.9% 0.7 0.8%Worcestershire 96.9 -0.4 -0.5% -0.4 -0.4%
107
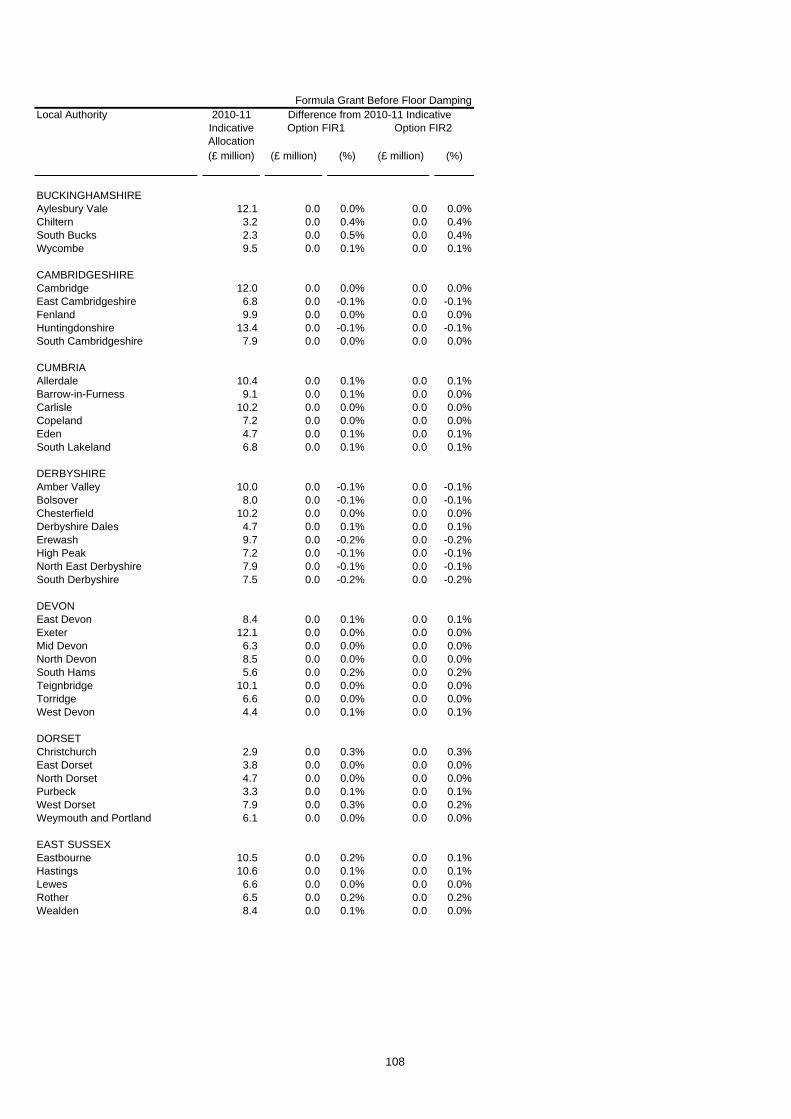
Formula Grant Before Floor DampingLocal Authority
(£ million) (£ million) (%) (£ million) (%)
Option FIR1 Option FIR22010-11
Indicative Allocation
Difference from 2010-11 Indicative
BUCKINGHAMSHIREAylesbury Vale 12.1 0.0 0.0% 0.0 0.0%Chiltern 3.2 0.0 0.4% 0.0 0.4%South Bucks 2.3 0.0 0.5% 0.0 0.4%Wycombe 9.5 0.0 0.1% 0.0 0.1%
CAMBRIDGESHIRECambridge 12.0 0.0 0.0% 0.0 0.0%East Cambridgeshire 6.8 0.0 -0.1% 0.0 -0.1%Fenland 9.9 0.0 0.0% 0.0 0.0%Huntingdonshire 13.4 0.0 -0.1% 0.0 -0.1%South Cambridgeshire 7.9 0.0 0.0% 0.0 0.0%
CUMBRIAAllerdale 10.4 0.0 0.1% 0.0 0.1%Barrow-in-Furness 9.1 0.0 0.1% 0.0 0.0%Carlisle 10.2 0.0 0.0% 0.0 0.0%Copeland 7.2 0.0 0.0% 0.0 0.0%Eden 4.7 0.0 0.1% 0.0 0.1%South Lakeland 6.8 0.0 0.1% 0.0 0.1%
DERBYSHIREAmber Valley 10.0 0.0 -0.1% 0.0 -0.1%Bolsover 8.0 0.0 -0.1% 0.0 -0.1%Chesterfield 10.2 0.0 0.0% 0.0 0.0%Derbyshire Dales 4.7 0.0 0.1% 0.0 0.1%Erewash 9.7 0.0 -0.2% 0.0 -0.2%High Peak 7.2 0.0 -0.1% 0.0 -0.1%North East Derbyshire 7.9 0.0 -0.1% 0.0 -0.1%South Derbyshire 7.5 0.0 -0.2% 0.0 -0.2%
DEVONEast Devon 8.4 0.0 0.1% 0.0 0.1%Exeter 12.1 0.0 0.0% 0.0 0.0%Mid Devon 6.3 0.0 0.0% 0.0 0.0%North Devon 8.5 0.0 0.0% 0.0 0.0%South Hams 5.6 0.0 0.2% 0.0 0.2%Teignbridge 10.1 0.0 0.0% 0.0 0.0%Torridge 6.6 0.0 0.0% 0.0 0.0%West Devon 4.4 0.0 0.1% 0.0 0.1%
DORSETChristchurch 2.9 0.0 0.3% 0.0 0.3%East Dorset 3.8 0.0 0.0% 0.0 0.0%North Dorset 4.7 0.0 0.0% 0.0 0.0%Purbeck 3.3 0.0 0.1% 0.0 0.1%West Dorset 7.9 0.0 0.3% 0.0 0.2%Weymouth and Portland 6.1 0.0 0.0% 0.0 0.0%
EAST SUSSEXEastbourne 10.5 0.0 0.2% 0.0 0.1%Hastings 10.6 0.0 0.1% 0.0 0.1%Lewes 6.6 0.0 0.0% 0.0 0.0%Rother 6.5 0.0 0.2% 0.0 0.2%Wealden 8.4 0.0 0.1% 0.0 0.0%
108

Formula Grant Before Floor DampingLocal Authority
(£ million) (£ million) (%) (£ million) (%)
Option FIR1 Option FIR22010-11
Indicative Allocation
Difference from 2010-11 Indicative
ESSEXBasildon 16.1 0.0 0.1% 0.0 0.1%Braintree 10.6 0.0 -0.1% 0.0 -0.1%Brentwood 4.4 0.0 0.3% 0.0 0.2%Castle Point 6.8 0.0 -0.1% 0.0 -0.1%Chelmsford 10.7 0.0 0.0% 0.0 0.0%Colchester 13.1 0.0 -0.1% 0.0 -0.1%Epping Forest 9.4 0.0 0.3% 0.0 0.3%Harlow 8.2 0.0 0.1% 0.0 0.1%Maldon 4.6 0.0 0.0% 0.0 0.0%Rochford 5.2 0.0 -0.1% 0.0 -0.1%Tendring 14.6 0.0 0.0% 0.0 0.0%Uttlesford 3.9 0.0 0.2% 0.0 0.2%
GLOUCESTERSHIRECheltenham 8.7 0.0 0.0% 0.0 0.0%Cotswold 5.5 0.0 0.2% 0.0 0.2%Forest of Dean 7.0 0.0 0.0% 0.0 0.0%Gloucester 10.8 0.0 0.0% 0.0 0.0%Stroud 7.3 0.0 -0.1% 0.0 -0.1%Tewkesbury 5.4 0.0 0.0% 0.0 0.0%
HAMPSHIREBasingstoke and Deane 10.3 0.0 -0.1% 0.0 0.0%East Hampshire 5.9 0.0 0.1% 0.0 0.1%Eastleigh 7.8 0.0 -0.1% 0.0 -0.1%Fareham 6.1 0.0 -0.2% 0.0 -0.1%Gosport 7.1 0.0 0.0% 0.0 0.0%Hart 3.9 0.0 -0.1% 0.0 -0.1%Havant 9.9 0.0 0.0% 0.0 0.0%New Forest 11.8 0.0 0.1% 0.0 0.1%Rushmoor 6.3 0.0 0.0% 0.0 0.0%Test Valley 7.3 0.0 0.0% 0.0 0.0%Winchester 6.7 0.0 0.1% 0.0 0.1%
HERTFORDSHIREBroxbourne 7.0 0.0 0.2% 0.0 0.2%Dacorum 9.5 0.0 0.1% 0.0 0.1%East Hertfordshire 8.1 0.0 0.2% 0.0 0.2%Hertsmere 6.8 0.0 0.2% 0.0 0.2%North Hertfordshire 8.3 0.0 0.0% 0.0 0.0%St Albans 7.0 0.0 0.2% 0.0 0.2%Stevenage 7.6 0.0 0.0% 0.0 0.0%Three Rivers 5.1 0.0 0.1% 0.0 0.1%Watford 7.2 0.0 0.2% 0.0 0.2%Welwyn Hatfield 8.2 0.0 0.1% 0.0 0.1%
KENTAshford 8.6 0.0 0.0% 0.0 0.0%Canterbury 13.6 0.0 -0.1% 0.0 -0.1%Dartford 7.6 0.0 0.1% 0.0 0.1%Dover 9.9 0.0 0.0% 0.0 0.0%Gravesham 8.5 0.0 0.0% 0.0 0.0%Maidstone 9.0 0.0 0.0% 0.0 0.0%Sevenoaks 6.1 0.0 0.2% 0.0 0.1%Shepway 10.1 0.0 0.1% 0.0 0.1%Swale 12.2 0.0 0.0% 0.0 0.0%Thanet 13.4 0.0 0.1% 0.0 0.1%Tonbridge and Malling 6.5 0.0 0.0% 0.0 0.0%Tunbridge Wells 6.5 0.0 0.2% 0.0 0.1%
109
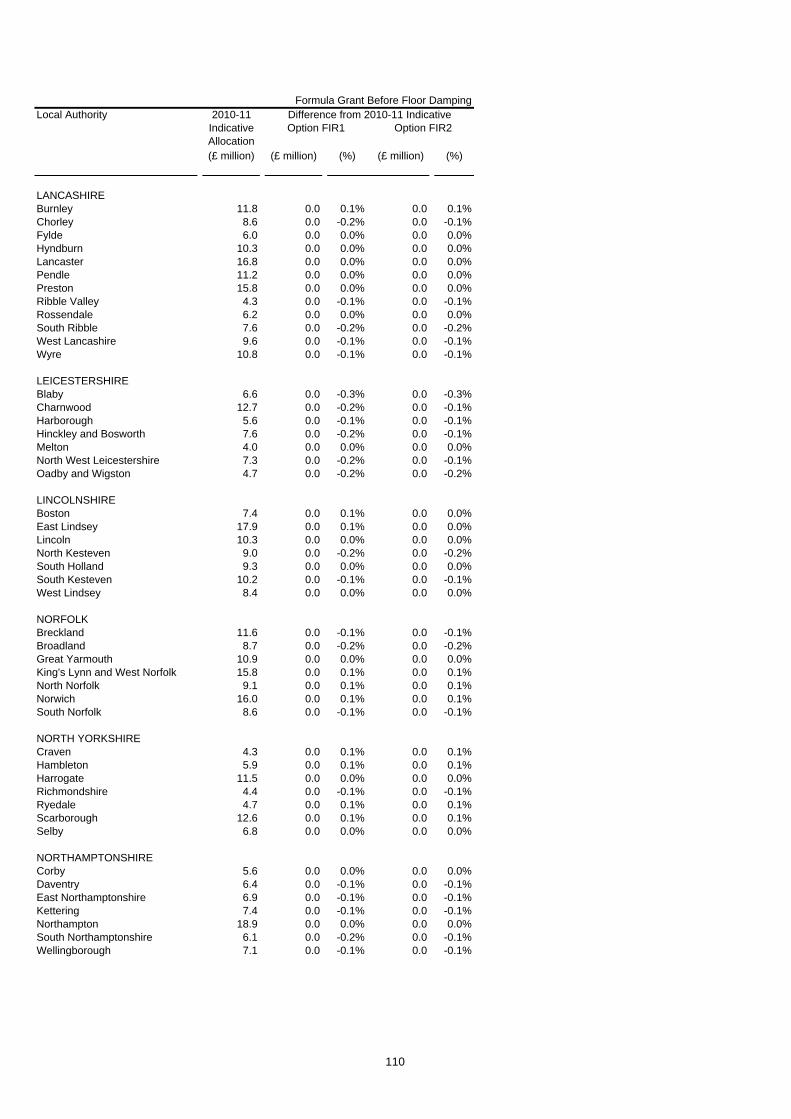
Formula Grant Before Floor DampingLocal Authority
(£ million) (£ million) (%) (£ million) (%)
Option FIR1 Option FIR22010-11
Indicative Allocation
Difference from 2010-11 Indicative
LANCASHIREBurnley 11.8 0.0 0.1% 0.0 0.1%Chorley 8.6 0.0 -0.2% 0.0 -0.1%Fylde 6.0 0.0 0.0% 0.0 0.0%Hyndburn 10.3 0.0 0.0% 0.0 0.0%Lancaster 16.8 0.0 0.0% 0.0 0.0%Pendle 11.2 0.0 0.0% 0.0 0.0%Preston 15.8 0.0 0.0% 0.0 0.0%Ribble Valley 4.3 0.0 -0.1% 0.0 -0.1%Rossendale 6.2 0.0 0.0% 0.0 0.0%South Ribble 7.6 0.0 -0.2% 0.0 -0.2%West Lancashire 9.6 0.0 -0.1% 0.0 -0.1%Wyre 10.8 0.0 -0.1% 0.0 -0.1%
LEICESTERSHIREBlaby 6.6 0.0 -0.3% 0.0 -0.3%Charnwood 12.7 0.0 -0.2% 0.0 -0.1%Harborough 5.6 0.0 -0.1% 0.0 -0.1%Hinckley and Bosworth 7.6 0.0 -0.2% 0.0 -0.1%Melton 4.0 0.0 0.0% 0.0 0.0%North West Leicestershire 7.3 0.0 -0.2% 0.0 -0.1%Oadby and Wigston 4.7 0.0 -0.2% 0.0 -0.2%
LINCOLNSHIREBoston 7.4 0.0 0.1% 0.0 0.0%East Lindsey 17.9 0.0 0.1% 0.0 0.0%Lincoln 10.3 0.0 0.0% 0.0 0.0%North Kesteven 9.0 0.0 -0.2% 0.0 -0.2%South Holland 9.3 0.0 0.0% 0.0 0.0%South Kesteven 10.2 0.0 -0.1% 0.0 -0.1%West Lindsey 8.4 0.0 0.0% 0.0 0.0%
NORFOLKBreckland 11.6 0.0 -0.1% 0.0 -0.1%Broadland 8.7 0.0 -0.2% 0.0 -0.2%Great Yarmouth 10.9 0.0 0.0% 0.0 0.0%King's Lynn and West Norfolk 15.8 0.0 0.1% 0.0 0.1%North Norfolk 9.1 0.0 0.1% 0.0 0.1%Norwich 16.0 0.0 0.1% 0.0 0.1%South Norfolk 8.6 0.0 -0.1% 0.0 -0.1%
NORTH YORKSHIRECraven 4.3 0.0 0.1% 0.0 0.1%Hambleton 5.9 0.0 0.1% 0.0 0.1%Harrogate 11.5 0.0 0.0% 0.0 0.0%Richmondshire 4.4 0.0 -0.1% 0.0 -0.1%Ryedale 4.7 0.0 0.1% 0.0 0.1%Scarborough 12.6 0.0 0.1% 0.0 0.1%Selby 6.8 0.0 0.0% 0.0 0.0%
NORTHAMPTONSHIRECorby 5.6 0.0 0.0% 0.0 0.0%Daventry 6.4 0.0 -0.1% 0.0 -0.1%East Northamptonshire 6.9 0.0 -0.1% 0.0 -0.1%Kettering 7.4 0.0 -0.1% 0.0 -0.1%Northampton 18.9 0.0 0.0% 0.0 0.0%South Northamptonshire 6.1 0.0 -0.2% 0.0 -0.1%Wellingborough 7.1 0.0 -0.1% 0.0 -0.1%
110

Formula Grant Before Floor DampingLocal Authority
(£ million) (£ million) (%) (£ million) (%)
Option FIR1 Option FIR22010-11
Indicative Allocation
Difference from 2010-11 Indicative
NOTTINGHAMSHIREAshfield 11.6 0.0 -0.1% 0.0 -0.1%Bassetlaw 11.4 0.0 -0.1% 0.0 -0.1%Broxtowe 9.1 0.0 -0.2% 0.0 -0.2%Gedling 9.4 0.0 -0.1% 0.0 -0.1%Mansfield 10.3 0.0 0.0% 0.0 0.0%Newark and Sherwood 10.5 0.0 -0.1% 0.0 -0.1%Rushcliffe 7.3 0.0 -0.1% 0.0 -0.1%
OXFORDSHIRECherwell 11.2 0.0 -0.1% 0.0 -0.1%Oxford 16.9 0.0 0.0% 0.0 0.0%South Oxfordshire 7.8 0.0 0.1% 0.0 0.1%Vale of White Horse 7.2 0.0 0.0% 0.0 0.0%West Oxfordshire 6.1 0.0 0.1% 0.0 0.1%
SOMERSETMendip 8.5 0.0 -0.1% 0.0 0.0%Sedgemoor 10.3 0.0 0.0% 0.0 0.0%South Somerset 11.2 0.0 -0.1% 0.0 -0.1%Taunton Deane 8.9 0.0 -0.1% 0.0 -0.1%West Somerset 3.3 0.0 0.2% 0.0 0.2%
STAFFORDSHIRECannock Chase 8.6 0.0 -0.1% 0.0 -0.1%East Staffordshire 9.6 0.0 -0.1% 0.0 -0.1%Lichfield 6.1 0.0 0.0% 0.0 0.0%Newcastle-under-Lyme 11.3 0.0 -0.2% 0.0 -0.2%South Staffordshire 7.2 0.0 -0.1% 0.0 -0.1%Stafford 8.8 0.0 -0.1% 0.0 -0.1%Staffordshire Moorlands 7.6 0.0 0.0% 0.0 0.0%Tamworth 6.9 0.0 -0.1% 0.0 -0.1%
SUFFOLKBabergh 6.4 0.0 -0.1% 0.0 -0.1%Forest Heath 5.5 0.0 -0.3% 0.0 -0.3%Ipswich 11.9 0.0 0.0% 0.0 0.0%Mid Suffolk 6.2 0.0 0.0% 0.0 0.0%St Edmundsbury 7.1 0.0 -0.1% 0.0 -0.1%Suffolk Coastal 8.4 0.0 0.0% 0.0 0.0%Waveney 12.0 0.0 0.0% 0.0 0.0%
SURREYElmbridge 6.5 0.0 0.3% 0.0 0.2%Epsom and Ewell 4.0 0.0 0.2% 0.0 0.2%Guildford 8.6 0.0 0.1% 0.0 0.1%Mole Valley 3.3 0.0 0.5% 0.0 0.5%Reigate and Banstead 6.9 0.0 0.2% 0.0 0.2%Runnymede 5.8 0.0 0.1% 0.0 0.1%Spelthorne 5.7 0.0 0.3% 0.0 0.2%Surrey Heath 4.7 0.0 0.3% 0.0 0.2%Tandridge 4.0 0.0 0.3% 0.0 0.3%Waverley 5.4 0.0 0.3% 0.0 0.3%Woking 5.8 0.0 0.3% 0.0 0.2%
WARWICKSHIRENorth Warwickshire 5.5 0.0 -0.1% 0.0 -0.1%Nuneaton and Bedworth 11.4 0.0 -0.1% 0.0 -0.1%Rugby 6.6 0.0 0.0% 0.0 0.0%Stratford-on-Avon 6.9 0.0 0.2% 0.0 0.1%Warwick 10.5 0.0 0.0% 0.0 0.0%
111

Formula Grant Before Floor DampingLocal Authority
(£ million) (£ million) (%) (£ million) (%)
Option FIR1 Option FIR22010-11
Indicative Allocation
Difference from 2010-11 Indicative
WEST SUSSEXAdur 5.0 0.0 0.0% 0.0 0.0%Arun 10.5 0.0 0.0% 0.0 0.0%Chichester 5.9 0.0 0.2% 0.0 0.2%Crawley 10.5 0.0 0.1% 0.0 0.1%Horsham 6.0 0.0 0.0% 0.0 0.0%Mid Sussex 5.3 0.0 0.1% 0.0 0.1%Worthing 7.9 0.0 0.0% 0.0 0.0%
WORCESTERSHIREBromsgrove 5.2 0.0 -0.1% 0.0 -0.1%Malvern Hills 5.2 0.0 0.0% 0.0 0.0%Redditch 6.4 0.0 -0.1% 0.0 -0.1%Worcester 7.8 0.0 0.0% 0.0 0.0%Wychavon 8.0 0.0 0.0% 0.0 0.0%Wyre Forest 8.1 0.0 0.0% 0.0 0.0%
112

Formula Grant Before Floor DampingLocal Authority
(£ million) (£ million) (%) (£ million) (%)
Option FIR1 Option FIR22010-11
Indicative Allocation
Difference from 2010-11 Indicative
SHIRE POLICE AUTHORITIES
Avon & Somerset Police 197.6 -0.1 -0.1% -0.1 -0.1%Bedfordshire Police 76.6 -0.1 -0.1% -0.1 -0.1%Cambridgeshire Police 86.2 -0.1 -0.1% -0.1 -0.1%Cheshire Police 114.1 -0.1 -0.1% -0.1 -0.1%Cleveland Police 99.0 0.0 0.0% 0.0 0.0%
Cumbria Police 56.1 -0.1 -0.1% -0.1 -0.1%Derbyshire Police 120.7 -0.1 -0.1% -0.1 -0.1%Devon & Cornwall Police 191.7 -0.2 -0.1% -0.2 -0.1%Dorset Police 64.3 -0.1 -0.1% -0.1 -0.1%Durham Police 87.0 0.0 0.0% 0.0 0.0%
Essex Police 187.3 -0.2 -0.1% -0.2 -0.1%Gloucestershire Police 58.5 -0.1 -0.1% -0.1 -0.1%Hampshire Police 215.0 -0.2 -0.1% -0.2 -0.1%Hertfordshire Police 128.9 0.0 0.0% 0.0 0.0%Humberside Police 132.9 -0.1 -0.1% -0.1 -0.1%
Kent Police 200.2 -0.1 -0.1% -0.1 -0.1%Lancashire Police 212.3 -0.1 0.0% -0.1 0.0%Leicestershire Police 124.2 -0.1 -0.1% -0.1 -0.1%Lincolnshire Police 69.0 -0.2 -0.2% -0.1 -0.2%Norfolk Police 88.5 -0.1 -0.2% -0.1 -0.1%
North Yorkshire Police 73.1 -0.1 -0.2% -0.1 -0.2%Northamptonshire Police 78.4 -0.1 -0.1% -0.1 -0.1%Nottinghamshire Police 152.7 -0.1 -0.1% -0.1 -0.1%Staffordshire Police 125.1 -0.1 -0.1% -0.1 -0.1%Suffolk Police 71.0 -0.1 -0.2% -0.1 -0.2%
Surrey Police 101.3 -0.1 -0.1% -0.1 -0.1%Sussex Police 167.1 -0.1 -0.1% -0.1 -0.1%Thames Valley Police 248.5 -0.1 0.0% -0.1 0.0%Warwickshire Police 56.1 -0.1 -0.1% -0.1 -0.1%West Mercia Police 114.3 -0.2 -0.2% -0.2 -0.2%
Wiltshire Police 64.1 -0.1 -0.1% -0.1 -0.1%
113

Formula Grant Before Floor DampingLocal Authority
(£ million) (£ million) (%) (£ million) (%)
Option FIR1 Option FIR22010-11
Indicative Allocation
Difference from 2010-11 Indicative
SHIRE FIRE AUTHORITIES
Avon Fire 24.6 0.2 0.8% 0.2 0.9%Bedfordshire Fire 11.7 0.5 4.4% 0.4 3.8%Berkshire Fire Auhtority 13.0 1.3 10.4% 1.2 9.4%Buckinghamshire Fire 9.1 1.6 17.3% 1.4 15.5%Cambridgeshire Fire 15.1 0.6 3.7% 0.5 3.3%
Cheshire Fire 19.3 0.5 2.4% 0.6 3.1%Cleveland Fire 21.7 -1.6 -7.5% -1.3 -5.8%Derbyshire Fire 20.6 0.5 2.2% 0.4 2.0%Devon and Somerset Fire 32.1 2.9 8.9% 2.9 9.0%Dorset Fire 11.1 1.1 9.7% 1.1 9.6%
Durham Fire 14.9 -0.3 -2.0% -0.3 -2.0%East Sussex Fire 15.0 0.4 2.8% 0.4 2.6%Essex Fire Auhtority 33.3 1.6 4.7% 1.6 4.8%Hampshire Fire 29.9 2.0 6.7% 1.8 6.2%Hereford & Worcester Fire 10.8 1.0 9.3% 0.9 8.4%
Humberside Fire 28.2 -0.6 -2.1% -0.3 -0.9%Kent Fire 30.2 1.7 5.5% 1.6 5.2%Lancashire Fire 32.6 0.7 2.0% 0.6 1.8%Leicestershire Fire 19.2 0.7 3.8% 0.6 3.4%North Yorkshire Fire 11.6 1.7 14.5% 1.6 13.7%
Nottinghamshire Fire 26.3 -0.6 -2.3% -0.7 -2.5%Shropshire Fire 8.6 0.3 3.4% 0.2 2.8%Staffordshire Fire 19.1 0.9 4.8% 0.8 4.2%Wiltshire Fire 9.7 0.9 9.0% 0.8 8.3%
114

Formula Grant Before Floor DampingLocal Authority
(£ million) (£ million) (%) (£ million) (%)
England 28,995.5 0.0 0.0% 0.0 0.0%
London area 6,153.4 -21.1 -0.3% -9.9 -0.2%Metropolitan areas 8,340.7 9.2 0.1% 7.0 0.1%Shire areas 14,499.1 11.9 0.1% 2.9 0.0%Isles of Scilly 2.3 0.0 0.0% 0.0 0.0%
Inner London boroughs incl. City 2,025.0 -0.3 0.0% 2.5 0.1%Outer London boroughs 1,873.1 0.2 0.0% 0.6 0.0%London boroughs 3,898.1 -0.1 0.0% 3.2 0.1%GLA - all functions 2,255.3 -21.0 -0.9% -13.1 -0.6%
Metropolitan districts 5,904.0 0.1 0.0% 2.7 0.0%Metropolitan fire authorities 335.8 9.2 2.7% 4.0 1.2%Metropolitan police authorities 2,100.9 0.0 0.0% 0.3 0.0%
Shire unitaries with fire 425.6 -0.6 -0.1% -1.6 -0.4%Shire unitaries without fire 4,099.3 0.6 0.0% 0.0 0.0%Shire counties with fire 1,589.0 -4.4 -0.3% -5.2 -0.3%Shire counties without fire 2,501.9 1.1 0.0% -2.2 -0.1%Shire districts 1,654.0 0.0 0.0% 0.0 0.0%Combined fire authorities 467.7 14.9 3.2% 13.0 2.8%Shire police authorities 3,761.6 0.3 0.0% -1.2 0.0%
GO REGIONAL SUMMARY
South West GOR 2,267.3 -7.0 -0.3% -6.9 -0.3%South East GOR 2,957.0 8.4 0.3% -5.4 -0.2%London GOR 6,153.4 -21.1 -0.3% -9.9 -0.2%Eastern GOR 2,437.8 -5.1 -0.2% -5.4 -0.2%East Midlands GOR 2,292.2 1.7 0.1% 2.8 0.1%West Midlands GOR 3,349.9 6.0 0.2% 6.9 0.2%Yorkshire and Humber GOR 3,199.2 3.4 0.1% 4.1 0.1%North East GOR 1,777.2 -1.1 -0.1% -1.6 -0.1%North West GOR 4,561.4 14.7 0.3% 15.3 0.3%
FLOOR DAMPING GROUPS
Education Authorities 18,418.0 -3.4 0.0% -3.1 0.0%Police Authorities 7,864.8 0.1 0.0% 0.1 0.0%Fire Authorities 1,056.5 3.3 0.3% 3.0 0.3%Shire Districts 1,654.0 0.0 0.0% 0.0 0.0%
Option FIR3 Option FIR42010-11
Indicative Allocation
Fire: Updating the Fire Risk Index
Difference from 2010-11 Indicative
115

Formula Grant Before Floor DampingLocal Authority
(£ million) (£ million) (%) (£ million) (%)
Option FIR3 Option FIR42010-11
Indicative Allocation
Difference from 2010-11 Indicative
GREATER LONDON
City of London 91.1 0.0 0.0% 0.2 0.2%
Camden 171.0 0.0 0.0% 0.2 0.1%Greenwich 170.1 0.0 0.0% 0.2 0.1%Hackney 201.8 0.0 0.0% 0.3 0.1%Hammersmith and Fulham 94.3 0.0 0.0% 0.1 0.1%Islington 133.8 0.0 0.0% 0.2 0.1%Kensington and Chelsea 95.9 0.0 0.0% 0.1 0.1%
Lambeth 180.3 0.0 0.0% 0.2 0.1%Lewisham 174.9 0.0 0.0% 0.2 0.1%Southwark 210.2 0.0 0.0% 0.3 0.1%Tower Hamlets 224.3 0.0 0.0% 0.3 0.1%Wandsworth 98.6 0.0 0.0% 0.1 0.1%Westminster 178.8 0.0 0.0% 0.3 0.2%
Barking and Dagenham 108.2 0.0 0.0% 0.1 0.1%Barnet 97.9 0.0 0.0% 0.0 0.0%Bexley 64.5 0.0 0.0% 0.0 0.0%Brent 157.0 0.0 0.0% 0.1 0.1%Bromley 45.7 0.0 0.1% -0.1 -0.1%
Croydon 118.4 0.0 0.0% 0.0 0.0%Ealing 129.0 0.0 0.0% 0.1 0.1%Enfield 126.7 0.0 0.0% 0.1 0.1%Haringey 137.6 0.0 0.0% 0.2 0.1%Harrow 66.6 0.0 0.0% 0.0 0.0%
Havering 52.3 0.0 0.0% 0.0 -0.1%Hillingdon 85.6 0.0 0.0% 0.0 0.0%Hounslow 77.3 0.0 0.0% 0.0 0.0%Kingston upon Thames 32.6 0.0 0.1% 0.0 -0.1%Merton 61.2 0.0 0.0% 0.0 0.0%
Newham 231.3 0.0 0.0% 0.3 0.1%Redbridge 102.6 0.0 0.0% 0.0 0.0%Richmond upon Thames 9.6 0.0 0.2% -0.1 -0.7%Sutton 45.1 0.0 0.0% 0.0 -0.1%Waltham Forest 124.0 0.0 0.0% 0.1 0.1%
GLA - all functions 2,255.3 -21.0 -0.9% -13.1 -0.6%
GLA - police 2,002.3 -0.2 0.0% 1.0 0.1%GLA - fire 253.0 -20.8 -8.2% -14.1 -5.6%
116

Formula Grant Before Floor DampingLocal Authority
(£ million) (£ million) (%) (£ million) (%)
Option FIR3 Option FIR42010-11
Indicative Allocation
Difference from 2010-11 Indicative
GREATER MANCHESTERBolton 132.6 0.0 0.0% 0.0 0.0%Bury 67.5 0.0 0.0% 0.0 0.0%Manchester 346.1 0.0 0.0% 0.3 0.1%Oldham 127.6 0.0 0.0% 0.1 0.0%Rochdale 114.9 0.0 0.0% 0.0 0.0%Salford 131.2 0.0 0.0% 0.1 0.1%Stockport 85.2 0.0 0.0% 0.0 0.0%Tameside 109.5 0.0 0.0% 0.0 0.0%Trafford 67.3 0.0 0.0% 0.0 0.0%Wigan 138.6 0.0 0.0% 0.0 0.0%Greater Manchester Fire 76.1 4.9 6.4% 3.8 5.0%Greater Manchester Police 485.7 0.0 0.0% 0.1 0.0%
MERSEYSIDEKnowsley 114.6 0.0 0.0% 0.1 0.1%Liverpool 318.0 0.0 0.0% 0.3 0.1%Sefton 127.6 0.0 0.0% 0.0 0.0%St Helens 90.9 0.0 0.0% 0.0 0.0%Wirral 165.2 0.0 0.0% 0.1 0.1%Merseyside Fire 46.1 0.8 1.7% 1.1 2.4%Merseyside Police 275.5 0.0 0.0% 0.1 0.0%
SOUTH YORKSHIREBarnsley 114.3 0.0 0.0% 0.0 0.0%Doncaster 149.1 0.0 0.0% 0.0 0.0%Rotherham 130.1 0.0 0.0% 0.0 0.0%Sheffield 280.0 0.0 0.0% 0.1 0.0%South Yorkshire Fire 37.4 0.2 0.4% -0.6 -1.7%South Yorkshire Police 209.2 0.0 0.0% 0.0 0.0%
TYNE AND WEARGateshead 102.7 0.0 0.0% 0.1 0.1%Newcastle upon Tyne 157.2 0.0 0.0% 0.1 0.1%North Tyneside 87.4 0.0 0.0% 0.0 0.0%South Tyneside 89.3 0.0 0.0% 0.1 0.1%Sunderland 158.9 0.0 0.0% 0.1 0.1%Tyne and Wear Fire 35.9 -1.6 -4.6% -2.3 -6.5%Northumbria Police 219.9 0.0 0.0% 0.0 0.0%
WEST MIDLANDSBirmingham 698.9 0.0 0.0% 0.5 0.1%Coventry 156.6 0.0 0.0% 0.1 0.0%Dudley 130.4 0.0 0.0% 0.0 0.0%Sandwell 190.3 0.0 0.0% 0.1 0.1%Solihull 49.1 0.0 0.0% 0.0 -0.1%Walsall 142.3 0.0 0.0% 0.1 0.1%Wolverhampton 145.6 0.0 0.0% 0.1 0.1%West Midlands Fire 81.6 1.5 1.8% -0.2 -0.2%West Midlands Police 542.2 0.0 0.0% 0.1 0.0%
WEST YORKSHIREBradford 283.4 0.0 0.0% 0.1 0.0%Calderdale 84.1 0.0 0.0% 0.0 0.0%Kirklees 164.9 0.0 0.0% 0.0 0.0%Leeds 305.9 0.0 0.0% 0.0 0.0%Wakefield 146.7 0.0 0.0% 0.0 0.0%West Yorkshire Fire 58.7 3.5 5.9% 2.3 3.9%West Yorkshire Police 368.2 0.0 0.0% 0.0 0.0%
117

Formula Grant Before Floor DampingLocal Authority
(£ million) (£ million) (%) (£ million) (%)
Option FIR3 Option FIR42010-11
Indicative Allocation
Difference from 2010-11 Indicative
ALL PURPOSE AUTHORITIES
Bath & North East Somerset 44.1 0.0 0.0% 0.0 -0.1%Bedford 55.4 0.0 0.0% 0.0 0.0%Blackburn with Darwen 88.5 0.0 0.0% 0.0 0.1%Blackpool 86.9 0.0 0.0% 0.1 0.1%Bournemouth 49.4 0.0 0.0% 0.0 0.0%
Bracknell Forest 22.6 0.0 0.1% 0.0 -0.1%Brighton & Hove 89.8 0.0 0.0% 0.0 0.0%Bristol 171.2 0.0 0.0% 0.0 0.0%Central Bedfordshire 51.9 0.0 0.1% -0.1 -0.2%Cheshire East 64.5 0.0 0.1% -0.1 -0.2%
Cheshire West & Chester 94.9 0.0 0.0% 0.0 -0.1%Cornwall 227.6 -0.9 -0.4% -1.5 -0.6%Darlington 40.1 0.0 0.0% 0.0 0.0%Derby 114.5 0.0 0.0% 0.0 0.0%Durham 238.7 0.0 0.0% 0.1 0.0%
East Riding of Yorkshire 109.2 0.0 0.0% -0.1 -0.1%Halton 65.5 0.0 0.0% 0.0 0.1%Hartlepool 54.0 0.0 0.0% 0.0 0.1%Herefordshire 61.2 0.0 0.0% 0.0 0.0%Isle of Wight Council 65.0 0.7 1.1% 0.2 0.3%
Kingston upon Hull 159.2 0.0 0.0% 0.1 0.1%Leicester 188.4 0.0 0.0% 0.1 0.1%Luton 94.6 0.0 0.0% 0.0 0.0%Medway 89.5 0.0 0.0% 0.0 0.0%Middlesbrough 85.4 0.0 0.0% 0.1 0.1%
Milton Keynes 91.6 0.0 0.0% 0.0 0.0%North East Lincolnshire 76.9 0.0 0.0% 0.0 0.0%North Lincolnshire 66.3 0.0 0.0% 0.0 0.0%North Somerset 54.6 0.0 0.0% 0.0 -0.1%Northumberland 133.1 -0.4 -0.3% -0.3 -0.2%
Nottingham 179.5 0.0 0.0% 0.1 0.1%Peterborough 80.9 0.0 0.0% 0.0 0.0%Plymouth 108.7 0.0 0.0% 0.0 0.0%Poole 25.6 0.0 0.0% 0.0 -0.1%Portsmouth 87.8 0.0 0.0% 0.0 0.0%
Reading 48.0 0.0 0.0% 0.0 0.0%Redcar and Cleveland 71.4 0.0 0.0% 0.0 0.0%Rutland 8.6 0.0 0.0% 0.0 -0.1%Shropshire 97.4 0.0 0.0% 0.0 0.0%Slough 52.8 0.0 0.0% 0.0 0.0%
South Gloucestershire 64.0 0.0 0.0% -0.1 -0.1%Southampton 101.2 0.0 0.0% 0.0 0.0%Southend-on-Sea 62.3 0.0 0.0% 0.0 0.0%Stockton-on-Tees 80.6 0.0 0.0% 0.0 0.0%Stoke-on-Trent 133.5 0.0 0.0% 0.1 0.1%
Swindon 43.7 0.0 0.0% 0.0 -0.1%Telford and the Wrekin 76.0 0.0 0.0% 0.0 0.0%Thurrock 62.1 0.0 0.0% 0.0 0.0%Torbay 64.2 0.0 0.0% 0.0 0.0%Warrington 52.7 0.0 0.0% 0.0 -0.1%
118

Formula Grant Before Floor DampingLocal Authority
(£ million) (£ million) (%) (£ million) (%)
Option FIR3 Option FIR42010-11
Indicative Allocation
Difference from 2010-11 Indicative
West Berkshire 23.1 0.0 0.1% 0.0 -0.2%Wiltshire 102.1 0.0 0.0% -0.1 -0.1%Windsor and Maidenhead 10.1 0.0 0.2% 0.0 -0.5%Wokingham 8.4 0.0 0.3% -0.1 -0.9%York 45.8 0.0 0.0% -0.1 -0.1%
Isles of Scilly 2.3 0.0 0.0% 0.0 0.0%
119

Formula Grant Before Floor DampingLocal Authority
(£ million) (£ million) (%) (£ million) (%)
Option FIR3 Option FIR42010-11
Indicative Allocation
Difference from 2010-11 Indicative
SHIRE COUNTIES
Buckinghamshire 43.5 0.1 0.1% -0.2 -0.3%Cambridgeshire 113.1 0.1 0.0% -0.1 -0.1%Cumbria 157.5 -0.1 -0.1% 1.0 0.6%Derbyshire 204.0 0.0 0.0% 0.0 0.0%Devon 176.4 0.1 0.0% -0.1 0.0%
Dorset 57.6 0.0 0.1% -0.1 -0.2%East Sussex 105.4 0.0 0.0% -0.1 -0.1%Essex 258.3 0.1 0.0% -0.2 -0.1%Gloucestershire 124.0 -1.2 -1.0% -0.7 -0.6%Hampshire 126.6 0.1 0.1% -0.4 -0.3%
Hertfordshire 148.3 -0.3 -0.2% -2.2 -1.5%Kent 287.9 0.1 0.0% -0.2 -0.1%Lancashire 328.9 0.1 0.0% -0.1 0.0%Leicestershire 107.5 0.1 0.1% -0.2 -0.2%Lincolnshire 210.6 -0.6 -0.3% 1.3 0.6%
Norfolk 260.4 -5.0 -1.9% -2.7 -1.0%North Yorkshire 113.7 0.1 0.0% -0.1 -0.1%Northamptonshire 162.2 0.3 0.2% 0.6 0.4%Nottinghamshire 191.6 0.1 0.0% -0.1 -0.1%Oxfordshire 99.8 -1.5 -1.5% -0.9 -0.9%
Somerset 120.7 0.0 0.0% -0.1 0.0%Staffordshire 169.7 0.1 0.0% -0.2 -0.1%Suffolk 181.0 -0.8 -0.4% 0.3 0.1%Surrey 60.1 1.8 3.0% -2.9 -4.9%Warwickshire 96.6 0.6 0.7% 0.8 0.8%
West Sussex 88.4 2.3 2.6% 0.3 0.3%Worcestershire 96.9 0.1 0.1% -0.1 -0.1%
120

Formula Grant Before Floor DampingLocal Authority
(£ million) (£ million) (%) (£ million) (%)
Option FIR3 Option FIR42010-11
Indicative Allocation
Difference from 2010-11 Indicative
BUCKINGHAMSHIREAylesbury Vale 12.1 0.0 0.0% 0.0 0.0%Chiltern 3.2 0.0 0.0% 0.0 0.1%South Bucks 2.3 0.0 0.0% 0.0 0.2%Wycombe 9.5 0.0 0.0% 0.0 0.0%
CAMBRIDGESHIRECambridge 12.0 0.0 0.0% 0.0 0.0%East Cambridgeshire 6.8 0.0 0.0% 0.0 0.0%Fenland 9.9 0.0 0.0% 0.0 0.0%Huntingdonshire 13.4 0.0 0.0% 0.0 -0.1%South Cambridgeshire 7.9 0.0 0.0% 0.0 0.0%
CUMBRIAAllerdale 10.4 0.0 0.0% 0.0 0.0%Barrow-in-Furness 9.1 0.0 0.0% 0.0 0.0%Carlisle 10.2 0.0 0.0% 0.0 0.0%Copeland 7.2 0.0 0.0% 0.0 0.0%Eden 4.7 0.0 0.0% 0.0 0.0%South Lakeland 6.8 0.0 0.0% 0.0 0.0%
DERBYSHIREAmber Valley 10.0 0.0 0.0% 0.0 -0.1%Bolsover 8.0 0.0 0.0% 0.0 0.0%Chesterfield 10.2 0.0 0.0% 0.0 0.0%Derbyshire Dales 4.7 0.0 0.0% 0.0 0.0%Erewash 9.7 0.0 0.0% 0.0 -0.1%High Peak 7.2 0.0 0.0% 0.0 0.0%North East Derbyshire 7.9 0.0 0.0% 0.0 0.0%South Derbyshire 7.5 0.0 0.0% 0.0 -0.1%
DEVONEast Devon 8.4 0.0 0.0% 0.0 0.0%Exeter 12.1 0.0 0.0% 0.0 0.0%Mid Devon 6.3 0.0 0.0% 0.0 0.0%North Devon 8.5 0.0 0.0% 0.0 0.0%South Hams 5.6 0.0 0.0% 0.0 0.1%Teignbridge 10.1 0.0 0.0% 0.0 0.0%Torridge 6.6 0.0 0.0% 0.0 0.0%West Devon 4.4 0.0 0.0% 0.0 0.0%
DORSETChristchurch 2.9 0.0 0.0% 0.0 0.1%East Dorset 3.8 0.0 0.0% 0.0 0.0%North Dorset 4.7 0.0 0.0% 0.0 0.0%Purbeck 3.3 0.0 0.0% 0.0 0.1%West Dorset 7.9 0.0 0.0% 0.0 0.1%Weymouth and Portland 6.1 0.0 0.0% 0.0 0.0%
EAST SUSSEXEastbourne 10.5 0.0 0.0% 0.0 0.1%Hastings 10.6 0.0 0.0% 0.0 0.0%Lewes 6.6 0.0 0.0% 0.0 0.0%Rother 6.5 0.0 0.0% 0.0 0.1%Wealden 8.4 0.0 0.0% 0.0 0.0%
121

Formula Grant Before Floor DampingLocal Authority
(£ million) (£ million) (%) (£ million) (%)
Option FIR3 Option FIR42010-11
Indicative Allocation
Difference from 2010-11 Indicative
ESSEXBasildon 16.1 0.0 0.0% 0.0 0.0%Braintree 10.6 0.0 0.0% 0.0 0.0%Brentwood 4.4 0.0 0.0% 0.0 0.1%Castle Point 6.8 0.0 0.0% 0.0 0.0%Chelmsford 10.7 0.0 0.0% 0.0 0.0%Colchester 13.1 0.0 0.0% 0.0 0.0%Epping Forest 9.4 0.0 0.0% 0.0 0.1%Harlow 8.2 0.0 0.0% 0.0 0.0%Maldon 4.6 0.0 0.0% 0.0 0.0%Rochford 5.2 0.0 0.0% 0.0 0.0%Tendring 14.6 0.0 0.0% 0.0 0.0%Uttlesford 3.9 0.0 0.0% 0.0 0.1%
GLOUCESTERSHIRECheltenham 8.7 0.0 0.0% 0.0 0.0%Cotswold 5.5 0.0 0.0% 0.0 0.1%Forest of Dean 7.0 0.0 0.0% 0.0 0.0%Gloucester 10.8 0.0 0.0% 0.0 0.0%Stroud 7.3 0.0 0.0% 0.0 0.0%Tewkesbury 5.4 0.0 0.0% 0.0 0.0%
HAMPSHIREBasingstoke and Deane 10.3 0.0 0.0% 0.0 0.0%East Hampshire 5.9 0.0 0.0% 0.0 0.0%Eastleigh 7.8 0.0 0.0% 0.0 0.0%Fareham 6.1 0.0 0.0% 0.0 -0.1%Gosport 7.1 0.0 0.0% 0.0 0.0%Hart 3.9 0.0 0.0% 0.0 0.0%Havant 9.9 0.0 0.0% 0.0 0.0%New Forest 11.8 0.0 0.0% 0.0 0.0%Rushmoor 6.3 0.0 0.0% 0.0 0.0%Test Valley 7.3 0.0 0.0% 0.0 0.0%Winchester 6.7 0.0 0.0% 0.0 0.0%
HERTFORDSHIREBroxbourne 7.0 0.0 0.0% 0.0 0.1%Dacorum 9.5 0.0 0.0% 0.0 0.0%East Hertfordshire 8.1 0.0 0.0% 0.0 0.1%Hertsmere 6.8 0.0 0.0% 0.0 0.1%North Hertfordshire 8.3 0.0 0.0% 0.0 0.0%St Albans 7.0 0.0 0.0% 0.0 0.1%Stevenage 7.6 0.0 0.0% 0.0 0.0%Three Rivers 5.1 0.0 0.0% 0.0 0.0%Watford 7.2 0.0 0.0% 0.0 0.1%Welwyn Hatfield 8.2 0.0 0.0% 0.0 0.0%
KENTAshford 8.6 0.0 0.0% 0.0 0.0%Canterbury 13.6 0.0 0.0% 0.0 0.0%Dartford 7.6 0.0 0.0% 0.0 0.0%Dover 9.9 0.0 0.0% 0.0 0.0%Gravesham 8.5 0.0 0.0% 0.0 0.0%Maidstone 9.0 0.0 0.0% 0.0 0.0%Sevenoaks 6.1 0.0 0.0% 0.0 0.1%Shepway 10.1 0.0 0.0% 0.0 0.0%Swale 12.2 0.0 0.0% 0.0 0.0%Thanet 13.4 0.0 0.0% 0.0 0.0%Tonbridge and Malling 6.5 0.0 0.0% 0.0 0.0%Tunbridge Wells 6.5 0.0 0.0% 0.0 0.1%
122

Formula Grant Before Floor DampingLocal Authority
(£ million) (£ million) (%) (£ million) (%)
Option FIR3 Option FIR42010-11
Indicative Allocation
Difference from 2010-11 Indicative
LANCASHIREBurnley 11.8 0.0 0.0% 0.0 0.0%Chorley 8.6 0.0 0.0% 0.0 -0.1%Fylde 6.0 0.0 0.0% 0.0 0.0%Hyndburn 10.3 0.0 0.0% 0.0 0.0%Lancaster 16.8 0.0 0.0% 0.0 0.0%Pendle 11.2 0.0 0.0% 0.0 0.0%Preston 15.8 0.0 0.0% 0.0 0.0%Ribble Valley 4.3 0.0 0.0% 0.0 0.0%Rossendale 6.2 0.0 0.0% 0.0 0.0%South Ribble 7.6 0.0 0.0% 0.0 -0.1%West Lancashire 9.6 0.0 0.0% 0.0 0.0%Wyre 10.8 0.0 0.0% 0.0 0.0%
LEICESTERSHIREBlaby 6.6 0.0 0.0% 0.0 -0.1%Charnwood 12.7 0.0 0.0% 0.0 -0.1%Harborough 5.6 0.0 0.0% 0.0 0.0%Hinckley and Bosworth 7.6 0.0 0.0% 0.0 -0.1%Melton 4.0 0.0 0.0% 0.0 0.0%North West Leicestershire 7.3 0.0 0.0% 0.0 -0.1%Oadby and Wigston 4.7 0.0 0.0% 0.0 -0.1%
LINCOLNSHIREBoston 7.4 0.0 0.0% 0.0 0.0%East Lindsey 17.9 0.0 0.0% 0.0 0.0%Lincoln 10.3 0.0 0.0% 0.0 0.0%North Kesteven 9.0 0.0 0.0% 0.0 -0.1%South Holland 9.3 0.0 0.0% 0.0 0.0%South Kesteven 10.2 0.0 0.0% 0.0 0.0%West Lindsey 8.4 0.0 0.0% 0.0 0.0%
NORFOLKBreckland 11.6 0.0 0.0% 0.0 -0.1%Broadland 8.7 0.0 0.0% 0.0 -0.1%Great Yarmouth 10.9 0.0 0.0% 0.0 0.0%King's Lynn and West Norfolk 15.8 0.0 0.0% 0.0 0.0%North Norfolk 9.1 0.0 0.0% 0.0 0.0%Norwich 16.0 0.0 0.0% 0.0 0.0%South Norfolk 8.6 0.0 0.0% 0.0 0.0%
NORTH YORKSHIRECraven 4.3 0.0 0.0% 0.0 0.0%Hambleton 5.9 0.0 0.0% 0.0 0.0%Harrogate 11.5 0.0 0.0% 0.0 0.0%Richmondshire 4.4 0.0 0.0% 0.0 0.0%Ryedale 4.7 0.0 0.0% 0.0 0.0%Scarborough 12.6 0.0 0.0% 0.0 0.1%Selby 6.8 0.0 0.0% 0.0 0.0%
NORTHAMPTONSHIRECorby 5.6 0.0 0.0% 0.0 0.0%Daventry 6.4 0.0 0.0% 0.0 0.0%East Northamptonshire 6.9 0.0 0.0% 0.0 -0.1%Kettering 7.4 0.0 0.0% 0.0 0.0%Northampton 18.9 0.0 0.0% 0.0 0.0%South Northamptonshire 6.1 0.0 0.0% 0.0 -0.1%Wellingborough 7.1 0.0 0.0% 0.0 0.0%
123
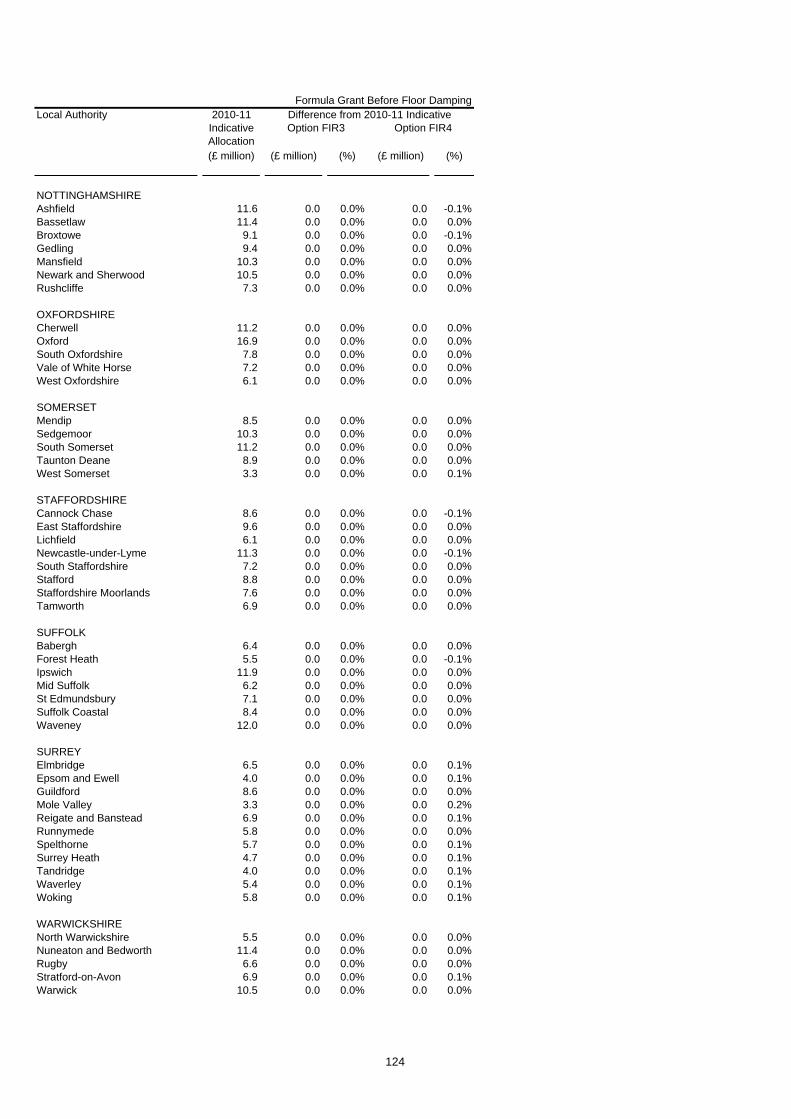
Formula Grant Before Floor DampingLocal Authority
(£ million) (£ million) (%) (£ million) (%)
Option FIR3 Option FIR42010-11
Indicative Allocation
Difference from 2010-11 Indicative
NOTTINGHAMSHIREAshfield 11.6 0.0 0.0% 0.0 -0.1%Bassetlaw 11.4 0.0 0.0% 0.0 0.0%Broxtowe 9.1 0.0 0.0% 0.0 -0.1%Gedling 9.4 0.0 0.0% 0.0 0.0%Mansfield 10.3 0.0 0.0% 0.0 0.0%Newark and Sherwood 10.5 0.0 0.0% 0.0 0.0%Rushcliffe 7.3 0.0 0.0% 0.0 0.0%
OXFORDSHIRECherwell 11.2 0.0 0.0% 0.0 0.0%Oxford 16.9 0.0 0.0% 0.0 0.0%South Oxfordshire 7.8 0.0 0.0% 0.0 0.0%Vale of White Horse 7.2 0.0 0.0% 0.0 0.0%West Oxfordshire 6.1 0.0 0.0% 0.0 0.0%
SOMERSETMendip 8.5 0.0 0.0% 0.0 0.0%Sedgemoor 10.3 0.0 0.0% 0.0 0.0%South Somerset 11.2 0.0 0.0% 0.0 0.0%Taunton Deane 8.9 0.0 0.0% 0.0 0.0%West Somerset 3.3 0.0 0.0% 0.0 0.1%
STAFFORDSHIRECannock Chase 8.6 0.0 0.0% 0.0 -0.1%East Staffordshire 9.6 0.0 0.0% 0.0 0.0%Lichfield 6.1 0.0 0.0% 0.0 0.0%Newcastle-under-Lyme 11.3 0.0 0.0% 0.0 -0.1%South Staffordshire 7.2 0.0 0.0% 0.0 0.0%Stafford 8.8 0.0 0.0% 0.0 0.0%Staffordshire Moorlands 7.6 0.0 0.0% 0.0 0.0%Tamworth 6.9 0.0 0.0% 0.0 0.0%
SUFFOLKBabergh 6.4 0.0 0.0% 0.0 0.0%Forest Heath 5.5 0.0 0.0% 0.0 -0.1%Ipswich 11.9 0.0 0.0% 0.0 0.0%Mid Suffolk 6.2 0.0 0.0% 0.0 0.0%St Edmundsbury 7.1 0.0 0.0% 0.0 0.0%Suffolk Coastal 8.4 0.0 0.0% 0.0 0.0%Waveney 12.0 0.0 0.0% 0.0 0.0%
SURREYElmbridge 6.5 0.0 0.0% 0.0 0.1%Epsom and Ewell 4.0 0.0 0.0% 0.0 0.1%Guildford 8.6 0.0 0.0% 0.0 0.0%Mole Valley 3.3 0.0 0.0% 0.0 0.2%Reigate and Banstead 6.9 0.0 0.0% 0.0 0.1%Runnymede 5.8 0.0 0.0% 0.0 0.0%Spelthorne 5.7 0.0 0.0% 0.0 0.1%Surrey Heath 4.7 0.0 0.0% 0.0 0.1%Tandridge 4.0 0.0 0.0% 0.0 0.1%Waverley 5.4 0.0 0.0% 0.0 0.1%Woking 5.8 0.0 0.0% 0.0 0.1%
WARWICKSHIRENorth Warwickshire 5.5 0.0 0.0% 0.0 0.0%Nuneaton and Bedworth 11.4 0.0 0.0% 0.0 0.0%Rugby 6.6 0.0 0.0% 0.0 0.0%Stratford-on-Avon 6.9 0.0 0.0% 0.0 0.1%Warwick 10.5 0.0 0.0% 0.0 0.0%
124
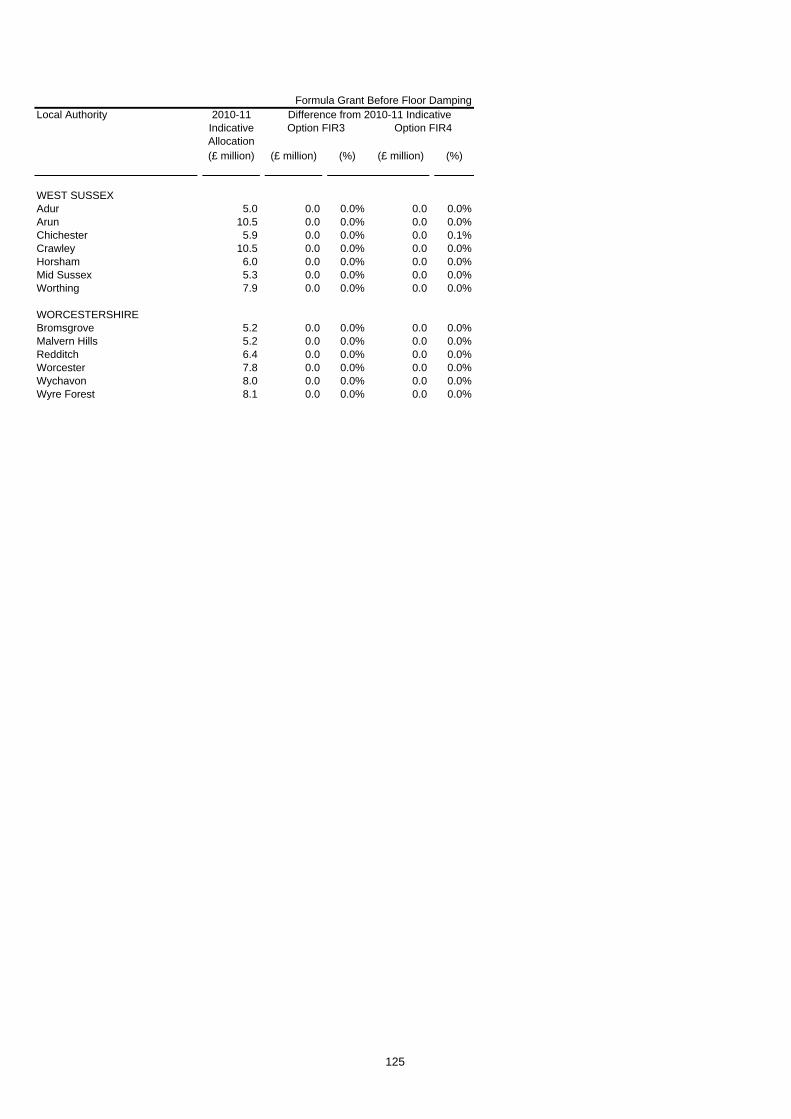
Formula Grant Before Floor DampingLocal Authority
(£ million) (£ million) (%) (£ million) (%)
Option FIR3 Option FIR42010-11
Indicative Allocation
Difference from 2010-11 Indicative
WEST SUSSEXAdur 5.0 0.0 0.0% 0.0 0.0%Arun 10.5 0.0 0.0% 0.0 0.0%Chichester 5.9 0.0 0.0% 0.0 0.1%Crawley 10.5 0.0 0.0% 0.0 0.0%Horsham 6.0 0.0 0.0% 0.0 0.0%Mid Sussex 5.3 0.0 0.0% 0.0 0.0%Worthing 7.9 0.0 0.0% 0.0 0.0%
WORCESTERSHIREBromsgrove 5.2 0.0 0.0% 0.0 0.0%Malvern Hills 5.2 0.0 0.0% 0.0 0.0%Redditch 6.4 0.0 0.0% 0.0 0.0%Worcester 7.8 0.0 0.0% 0.0 0.0%Wychavon 8.0 0.0 0.0% 0.0 0.0%Wyre Forest 8.1 0.0 0.0% 0.0 0.0%
125
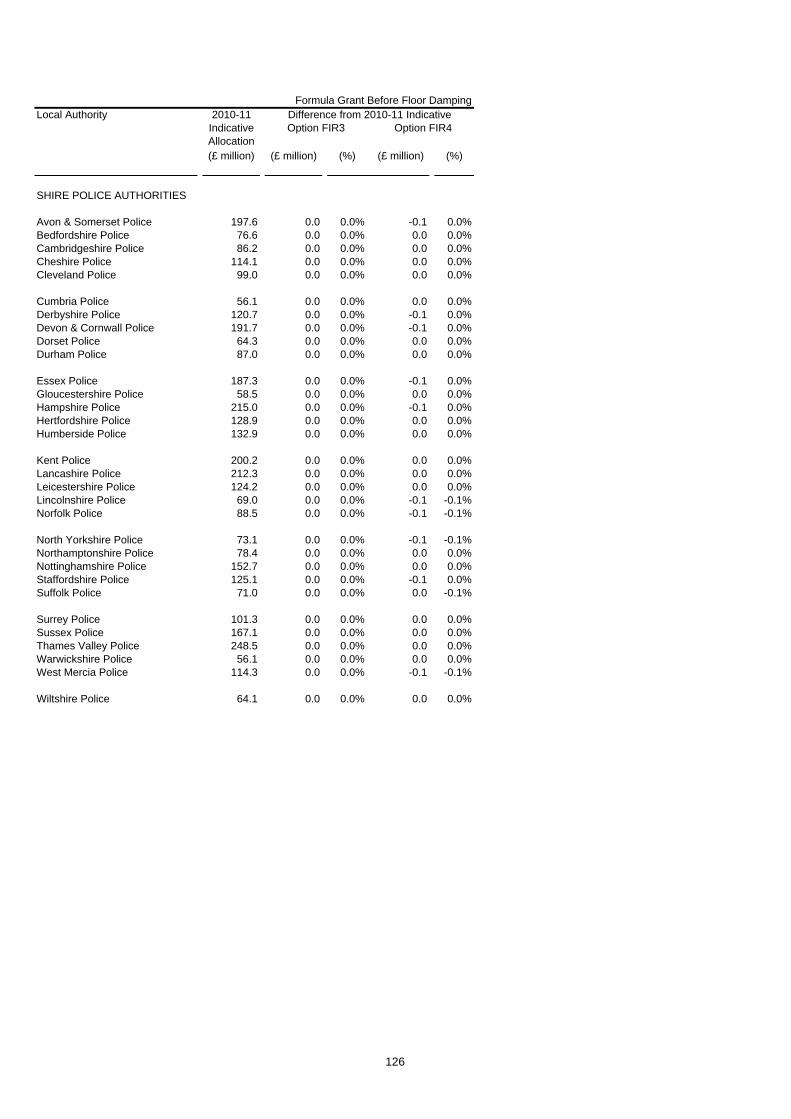
Formula Grant Before Floor DampingLocal Authority
(£ million) (£ million) (%) (£ million) (%)
Option FIR3 Option FIR42010-11
Indicative Allocation
Difference from 2010-11 Indicative
SHIRE POLICE AUTHORITIES
Avon & Somerset Police 197.6 0.0 0.0% -0.1 0.0%Bedfordshire Police 76.6 0.0 0.0% 0.0 0.0%Cambridgeshire Police 86.2 0.0 0.0% 0.0 0.0%Cheshire Police 114.1 0.0 0.0% 0.0 0.0%Cleveland Police 99.0 0.0 0.0% 0.0 0.0%
Cumbria Police 56.1 0.0 0.0% 0.0 0.0%Derbyshire Police 120.7 0.0 0.0% -0.1 0.0%Devon & Cornwall Police 191.7 0.0 0.0% -0.1 0.0%Dorset Police 64.3 0.0 0.0% 0.0 0.0%Durham Police 87.0 0.0 0.0% 0.0 0.0%
Essex Police 187.3 0.0 0.0% -0.1 0.0%Gloucestershire Police 58.5 0.0 0.0% 0.0 0.0%Hampshire Police 215.0 0.0 0.0% -0.1 0.0%Hertfordshire Police 128.9 0.0 0.0% 0.0 0.0%Humberside Police 132.9 0.0 0.0% 0.0 0.0%
Kent Police 200.2 0.0 0.0% 0.0 0.0%Lancashire Police 212.3 0.0 0.0% 0.0 0.0%Leicestershire Police 124.2 0.0 0.0% 0.0 0.0%Lincolnshire Police 69.0 0.0 0.0% -0.1 -0.1%Norfolk Police 88.5 0.0 0.0% -0.1 -0.1%
North Yorkshire Police 73.1 0.0 0.0% -0.1 -0.1%Northamptonshire Police 78.4 0.0 0.0% 0.0 0.0%Nottinghamshire Police 152.7 0.0 0.0% 0.0 0.0%Staffordshire Police 125.1 0.0 0.0% -0.1 0.0%Suffolk Police 71.0 0.0 0.0% 0.0 -0.1%
Surrey Police 101.3 0.0 0.0% 0.0 0.0%Sussex Police 167.1 0.0 0.0% 0.0 0.0%Thames Valley Police 248.5 0.0 0.0% 0.0 0.0%Warwickshire Police 56.1 0.0 0.0% 0.0 0.0%West Mercia Police 114.3 0.0 0.0% -0.1 -0.1%
Wiltshire Police 64.1 0.0 0.0% 0.0 0.0%
126
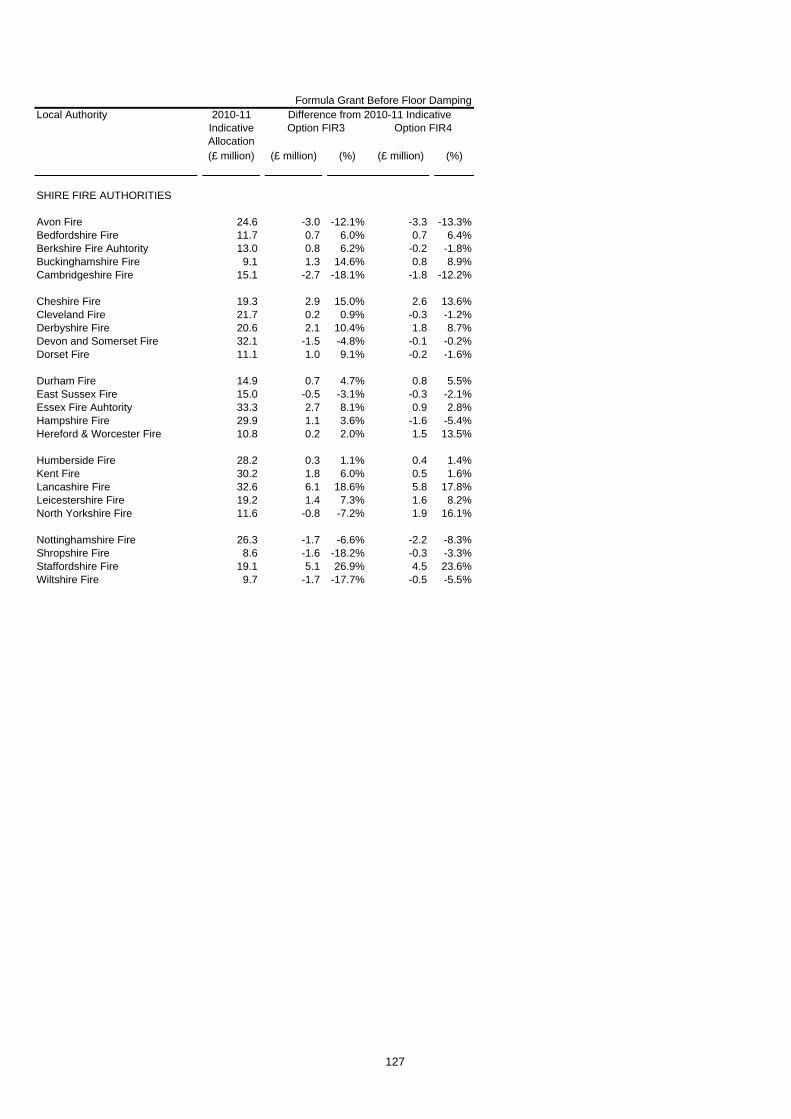
Formula Grant Before Floor DampingLocal Authority
(£ million) (£ million) (%) (£ million) (%)
Option FIR3 Option FIR42010-11
Indicative Allocation
Difference from 2010-11 Indicative
SHIRE FIRE AUTHORITIES
Avon Fire 24.6 -3.0 -12.1% -3.3 -13.3%Bedfordshire Fire 11.7 0.7 6.0% 0.7 6.4%Berkshire Fire Auhtority 13.0 0.8 6.2% -0.2 -1.8%Buckinghamshire Fire 9.1 1.3 14.6% 0.8 8.9%Cambridgeshire Fire 15.1 -2.7 -18.1% -1.8 -12.2%
Cheshire Fire 19.3 2.9 15.0% 2.6 13.6%Cleveland Fire 21.7 0.2 0.9% -0.3 -1.2%Derbyshire Fire 20.6 2.1 10.4% 1.8 8.7%Devon and Somerset Fire 32.1 -1.5 -4.8% -0.1 -0.2%Dorset Fire 11.1 1.0 9.1% -0.2 -1.6%
Durham Fire 14.9 0.7 4.7% 0.8 5.5%East Sussex Fire 15.0 -0.5 -3.1% -0.3 -2.1%Essex Fire Auhtority 33.3 2.7 8.1% 0.9 2.8%Hampshire Fire 29.9 1.1 3.6% -1.6 -5.4%Hereford & Worcester Fire 10.8 0.2 2.0% 1.5 13.5%
Humberside Fire 28.2 0.3 1.1% 0.4 1.4%Kent Fire 30.2 1.8 6.0% 0.5 1.6%Lancashire Fire 32.6 6.1 18.6% 5.8 17.8%Leicestershire Fire 19.2 1.4 7.3% 1.6 8.2%North Yorkshire Fire 11.6 -0.8 -7.2% 1.9 16.1%
Nottinghamshire Fire 26.3 -1.7 -6.6% -2.2 -8.3%Shropshire Fire 8.6 -1.6 -18.2% -0.3 -3.3%Staffordshire Fire 19.1 5.1 26.9% 4.5 23.6%Wiltshire Fire 9.7 -1.7 -17.7% -0.5 -5.5%
127

128
Chapter 6 Highway Maintenance 1. The current Highway Maintenance formula is based on regression against past (the average of 2003-04 to 2005-06, which was converted to a non-FRS17 basis) spending. Two regressions on past expenditure are used to determine the coefficients - one regression is based on non-winter maintenance and the other on winter maintenance.
2. The current formula is given below.
Basic amount
HIGHWAY BASIC
AMOUNT
130.9925
Top-ups
USAGE TOP-UP
10.8549 multiplied by TRAFFIC FLOW; plus 0.7779 multiplied by DAYTIME POPULATION PER KM
WINTER
MAINTENANCE TOP-UP
0.4998 multiplied by DAYS WITH SNOW LYING; plus 1.1243 multiplied by PREDICTED GRITTING DAYS
The full formula used to calculate the Highway Maintenance element is:
Highway Maintenance
(a) WEIGHTED ROAD LENGTHS multiplied by the result of: HIGHWAY BASIC AMOUNT; plus USAGE TOP-UP; plus WINTER MAINTENANCE TOP-UP;
(b) The result of (a) is multiplied by AREA COST ADJUSTMENT FOR HIGHWAY MAINTENANCE;
(c) The result of (b) is then multiplied by the scaling factor given in Annex F for the Highway Maintenance service block.
(d) The result of (c) is then divided by 10,000,000,000.

129
Option HM1: Removing the Day Visitors component from Daytime Population
3. The day visitors indicator forms one of the components in the Daytime Population per km indicator used in Highway Maintenance RNF.
4. Unlike the other visitor indicators, there is no consistent reliable source on the number of day visitors to an authority from another authority. The current indicator is determined from a model and constructed using various information including the 1998-99 Leisure Day Visits Survey, the 1991 Census, the 1991 Census of Employment and the 1991 survey of visits to tourist attractions and other information about the area.
5. As part of the 2005 review, research was commissioned to update the day visitors indicator to include information from the 2002-03 Great Britain Day Visits Survey (GBDVS), the 2001 Census, the 2003 Labour Force Survey. The model used in the work was similar to the current model but the results were not widely accepted as reliable.
6. As part of the 2007 review, a different approach to determine a replacement for this indicator was taken. The aim was for an indicator that would reflect the reasons that day visits are made but would not attempt to estimate the number of day visitors to an area. Again the results were not widely accepted as reliable.
7. We consider the existing indicator to no longer be fit for purpose due to the fact that it is now over 20 year since the modelling was done. We are therefore intending to remove the day visitors element from the daytime population per km variable; the new variable will be called enhanced population per km.
8. The new basic amount and usage top-ups are given below: HIGHWAY BASIC
AMOUNT
128.0334
USAGE TOP-UP
10.9151 multiplied by TRAFFIC FLOW; plus 0.8191 multiplied by ENHANCED POPULATION PER KM
Option HM2: Updating the regression expenditure base
9. We have updated the spending base to the average of 2006-07 to 2008-09 based on non-FRS17 data collected from highway authorities, as well as using the enhanced population per km indicator.
10. The new formula is given below.
Basic amount
HIGHWAY BASIC
AMOUNT
116.2562

130
Top-ups
USAGE TOP-UP
11.1987 multiplied by TRAFFIC FLOW; plus 0.8325 multiplied by ENHANCED POPULATION PER KM
WINTER
MAINTENANCE TOP-UP
0.4997 multiplied by DAYS WITH SNOW LYING; plus 1.1243 multiplied by PREDICTED GRITTING DAYS
11. The full calculation remains unchanged.
Questions
Question 9: Do you agree that the daytime visitors component of daytime population per km should be removed? (HM1)
Question 10: Do you agree that the expenditure data used to determine the coefficients should be updated? (HM2)

Formla Grant Before Floor DampingLocal Authority
(£ million) (£ million) (%) (£ million) (%)
England 28,995.5 0.0 0.0% 0.0 0.0%
London area 6,153.4 0.6 0.0% 3.5 0.1%Metropolitan areas 8,340.7 0.8 0.0% 2.7 0.0%Shire areas 14,499.1 -1.3 0.0% -6.3 0.0%Isles of Scilly 2.3 0.0 0.0% 0.0 0.0%
Inner London boroughs incl. City 2,025.0 -0.6 0.0% 1.0 0.0%Outer London boroughs 1,873.1 0.8 0.0% 2.0 0.1%London boroughs 3,898.1 0.2 0.0% 3.0 0.1%GLA - all functions 2,255.3 0.3 0.0% 0.6 0.0%
Metropolitan districts 5,904.0 0.7 0.0% 2.6 0.0%Metropolitan fire authorities 335.8 0.0 0.0% 0.0 0.0%Metropolitan police authorities 2,100.9 0.1 0.0% 0.1 0.0%
Shire unitaries with fire 425.6 0.0 0.0% -0.7 -0.2%Shire unitaries without fire 4,099.3 0.0 0.0% 0.4 0.0%Shire counties with fire 1,589.0 -0.3 0.0% -2.2 -0.1%Shire counties without fire 2,501.9 -0.6 0.0% -3.0 -0.1%Shire districts 1,654.0 0.0 0.0% 0.0 0.0%Combined fire authorities 467.7 -0.1 0.0% -0.1 0.0%Shire police authorities 3,761.6 -0.3 0.0% -0.6 0.0%
GO REGIONAL SUMMARY
South West GOR 2,267.3 -0.1 0.0% -1.8 -0.1%South East GOR 2,957.0 0.0 0.0% -0.8 0.0%London GOR 6,153.4 0.6 0.0% 3.5 0.1%Eastern GOR 2,437.8 0.3 0.0% 0.2 0.0%East Midlands GOR 2,292.2 -0.3 0.0% -0.5 0.0%West Midlands GOR 3,349.9 0.0 0.0% -0.1 0.0%Yorkshire and Humber GOR 3,199.2 -0.1 0.0% -0.2 0.0%North East GOR 1,777.2 0.0 0.0% -0.1 0.0%North West GOR 4,561.4 -0.4 0.0% -0.3 0.0%
FLOOR DAMPING GROUPS
Education Authorities 18,418.0 0.0 0.0% 0.0 0.0%Police Authorities 7,864.8 0.0 0.0% 0.0 0.0%Fire Authorities 1,056.5 0.0 0.0% 0.0 0.0%Shire Districts 1,654.0 0.0 0.0% 0.0 0.0%
Highway Maintenance
Difference from 2010-11 Indicative 2010-11 Indicative
AllocationsOption HM1 Option HM2
131
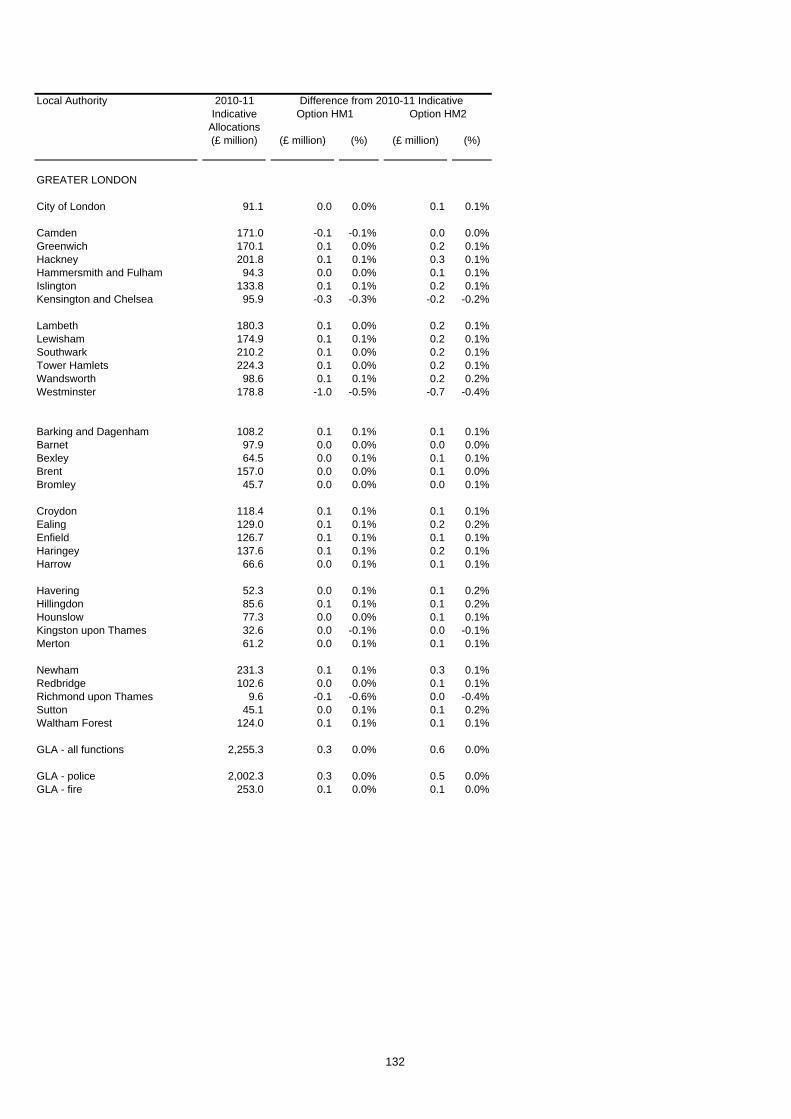
Local Authority
(£ million) (£ million) (%) (£ million) (%)
Difference from 2010-11 Indicative 2010-11 Indicative
AllocationsOption HM1 Option HM2
GREATER LONDON
City of London 91.1 0.0 0.0% 0.1 0.1%
Camden 171.0 -0.1 -0.1% 0.0 0.0%Greenwich 170.1 0.1 0.0% 0.2 0.1%Hackney 201.8 0.1 0.1% 0.3 0.1%Hammersmith and Fulham 94.3 0.0 0.0% 0.1 0.1%Islington 133.8 0.1 0.1% 0.2 0.1%Kensington and Chelsea 95.9 -0.3 -0.3% -0.2 -0.2%
Lambeth 180.3 0.1 0.0% 0.2 0.1%Lewisham 174.9 0.1 0.1% 0.2 0.1%Southwark 210.2 0.1 0.0% 0.2 0.1%Tower Hamlets 224.3 0.1 0.0% 0.2 0.1%Wandsworth 98.6 0.1 0.1% 0.2 0.2%Westminster 178.8 -1.0 -0.5% -0.7 -0.4%
Barking and Dagenham 108.2 0.1 0.1% 0.1 0.1%Barnet 97.9 0.0 0.0% 0.0 0.0%Bexley 64.5 0.0 0.1% 0.1 0.1%Brent 157.0 0.0 0.0% 0.1 0.0%Bromley 45.7 0.0 0.0% 0.0 0.1%
Croydon 118.4 0.1 0.1% 0.1 0.1%Ealing 129.0 0.1 0.1% 0.2 0.2%Enfield 126.7 0.1 0.1% 0.1 0.1%Haringey 137.6 0.1 0.1% 0.2 0.1%Harrow 66.6 0.0 0.1% 0.1 0.1%
Havering 52.3 0.0 0.1% 0.1 0.2%Hillingdon 85.6 0.1 0.1% 0.1 0.2%Hounslow 77.3 0.0 0.0% 0.1 0.1%Kingston upon Thames 32.6 0.0 -0.1% 0.0 -0.1%Merton 61.2 0.0 0.1% 0.1 0.1%
Newham 231.3 0.1 0.1% 0.3 0.1%Redbridge 102.6 0.0 0.0% 0.1 0.1%Richmond upon Thames 9.6 -0.1 -0.6% 0.0 -0.4%Sutton 45.1 0.0 0.1% 0.1 0.2%Waltham Forest 124.0 0.1 0.1% 0.1 0.1%
GLA - all functions 2,255.3 0.3 0.0% 0.6 0.0%
GLA - police 2,002.3 0.3 0.0% 0.5 0.0%GLA - fire 253.0 0.1 0.0% 0.1 0.0%
132
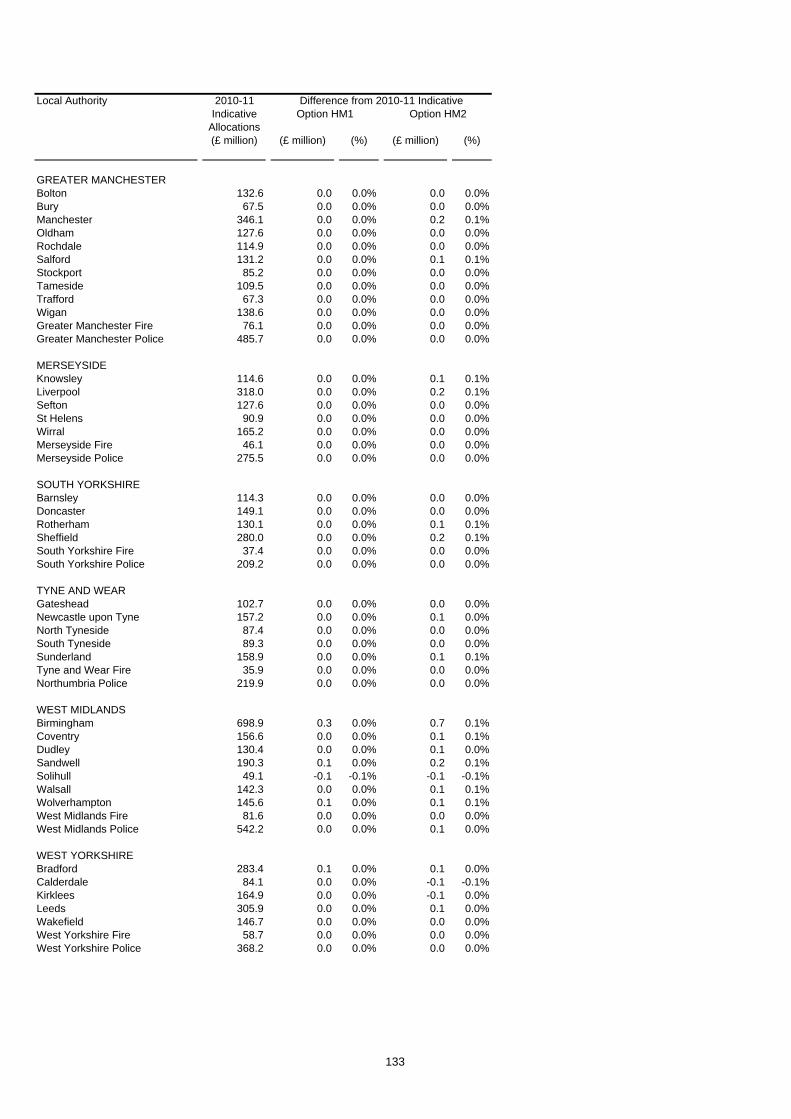
Local Authority
(£ million) (£ million) (%) (£ million) (%)
Difference from 2010-11 Indicative 2010-11 Indicative
AllocationsOption HM1 Option HM2
GREATER MANCHESTERBolton 132.6 0.0 0.0% 0.0 0.0%Bury 67.5 0.0 0.0% 0.0 0.0%Manchester 346.1 0.0 0.0% 0.2 0.1%Oldham 127.6 0.0 0.0% 0.0 0.0%Rochdale 114.9 0.0 0.0% 0.0 0.0%Salford 131.2 0.0 0.0% 0.1 0.1%Stockport 85.2 0.0 0.0% 0.0 0.0%Tameside 109.5 0.0 0.0% 0.0 0.0%Trafford 67.3 0.0 0.0% 0.0 0.0%Wigan 138.6 0.0 0.0% 0.0 0.0%Greater Manchester Fire 76.1 0.0 0.0% 0.0 0.0%Greater Manchester Police 485.7 0.0 0.0% 0.0 0.0%
MERSEYSIDEKnowsley 114.6 0.0 0.0% 0.1 0.1%Liverpool 318.0 0.0 0.0% 0.2 0.1%Sefton 127.6 0.0 0.0% 0.0 0.0%St Helens 90.9 0.0 0.0% 0.0 0.0%Wirral 165.2 0.0 0.0% 0.0 0.0%Merseyside Fire 46.1 0.0 0.0% 0.0 0.0%Merseyside Police 275.5 0.0 0.0% 0.0 0.0%
SOUTH YORKSHIREBarnsley 114.3 0.0 0.0% 0.0 0.0%Doncaster 149.1 0.0 0.0% 0.0 0.0%Rotherham 130.1 0.0 0.0% 0.1 0.1%Sheffield 280.0 0.0 0.0% 0.2 0.1%South Yorkshire Fire 37.4 0.0 0.0% 0.0 0.0%South Yorkshire Police 209.2 0.0 0.0% 0.0 0.0%
TYNE AND WEARGateshead 102.7 0.0 0.0% 0.0 0.0%Newcastle upon Tyne 157.2 0.0 0.0% 0.1 0.0%North Tyneside 87.4 0.0 0.0% 0.0 0.0%South Tyneside 89.3 0.0 0.0% 0.0 0.0%Sunderland 158.9 0.0 0.0% 0.1 0.1%Tyne and Wear Fire 35.9 0.0 0.0% 0.0 0.0%Northumbria Police 219.9 0.0 0.0% 0.0 0.0%
WEST MIDLANDSBirmingham 698.9 0.3 0.0% 0.7 0.1%Coventry 156.6 0.0 0.0% 0.1 0.1%Dudley 130.4 0.0 0.0% 0.1 0.0%Sandwell 190.3 0.1 0.0% 0.2 0.1%Solihull 49.1 -0.1 -0.1% -0.1 -0.1%Walsall 142.3 0.0 0.0% 0.1 0.1%Wolverhampton 145.6 0.1 0.0% 0.1 0.1%West Midlands Fire 81.6 0.0 0.0% 0.0 0.0%West Midlands Police 542.2 0.0 0.0% 0.1 0.0%
WEST YORKSHIREBradford 283.4 0.1 0.0% 0.1 0.0%Calderdale 84.1 0.0 0.0% -0.1 -0.1%Kirklees 164.9 0.0 0.0% -0.1 0.0%Leeds 305.9 0.0 0.0% 0.1 0.0%Wakefield 146.7 0.0 0.0% 0.0 0.0%West Yorkshire Fire 58.7 0.0 0.0% 0.0 0.0%West Yorkshire Police 368.2 0.0 0.0% 0.0 0.0%
133

Local Authority
(£ million) (£ million) (%) (£ million) (%)
Difference from 2010-11 Indicative 2010-11 Indicative
AllocationsOption HM1 Option HM2
ALL PURPOSE AUTHORITIES
Bath & North East Somerset 44.1 0.0 -0.1% -0.1 -0.2%Bedford 55.4 0.0 0.0% 0.0 0.0%Blackburn with Darwen 88.5 0.0 0.0% 0.0 0.0%Blackpool 86.9 -0.2 -0.2% -0.1 -0.2%Bournemouth 49.4 0.0 0.1% 0.0 0.1%
Bracknell Forest 22.6 0.0 0.0% 0.0 0.0%Brighton & Hove 89.8 0.0 0.0% 0.0 0.0%Bristol 171.2 0.1 0.0% 0.2 0.1%Central Bedfordshire 51.9 0.0 -0.1% 0.0 -0.1%Cheshire East 64.5 -0.1 -0.2% -0.2 -0.3%
Cheshire West & Chester 94.9 -0.1 -0.1% -0.1 -0.1%Cornwall 227.6 0.0 0.0% -0.3 -0.1%Darlington 40.1 0.0 0.0% 0.0 0.0%Derby 114.5 0.0 0.0% 0.1 0.1%Durham 238.7 0.0 0.0% -0.1 0.0%
East Riding of Yorkshire 109.2 0.0 0.0% -0.1 -0.1%Halton 65.5 0.0 0.0% 0.1 0.2%Hartlepool 54.0 0.0 0.0% 0.0 0.0%Herefordshire 61.2 0.0 -0.1% -0.2 -0.3%Isle of Wight Council 65.0 0.0 0.0% -0.1 -0.1%
Kingston upon Hull 159.2 0.1 0.1% 0.2 0.1%Leicester 188.4 0.1 0.0% 0.2 0.1%Luton 94.6 0.0 0.0% 0.1 0.1%Medway 89.5 0.0 0.1% 0.1 0.1%Middlesbrough 85.4 0.0 0.0% 0.1 0.1%
Milton Keynes 91.6 0.1 0.1% 0.1 0.1%North East Lincolnshire 76.9 0.0 0.0% 0.0 0.0%North Lincolnshire 66.3 0.0 0.0% 0.0 -0.1%North Somerset 54.6 0.0 0.0% 0.0 0.0%Northumberland 133.1 -0.1 -0.1% -0.3 -0.3%
Nottingham 179.5 0.0 0.0% 0.1 0.1%Peterborough 80.9 0.1 0.1% 0.2 0.2%Plymouth 108.7 0.1 0.1% 0.2 0.2%Poole 25.6 0.0 0.0% 0.0 0.1%Portsmouth 87.8 0.0 0.0% 0.0 0.1%
Reading 48.0 0.0 0.0% 0.1 0.1%Redcar and Cleveland 71.4 0.0 0.0% 0.0 0.0%Rutland 8.6 0.0 -0.2% 0.0 -0.5%Shropshire 97.4 -0.1 -0.1% -0.3 -0.3%Slough 52.8 0.0 0.0% 0.0 0.0%
South Gloucestershire 64.0 0.0 0.0% 0.0 0.0%Southampton 101.2 0.0 0.0% 0.1 0.1%Southend-on-Sea 62.3 0.0 0.0% 0.0 0.1%Stockton-on-Tees 80.6 0.0 0.0% 0.0 0.0%Stoke-on-Trent 133.5 0.0 0.0% 0.0 0.0%
Swindon 43.7 0.0 0.1% 0.0 0.1%Telford and the Wrekin 76.0 0.0 0.0% 0.0 0.1%Thurrock 62.1 0.0 0.1% 0.1 0.2%Torbay 64.2 0.0 0.0% 0.0 0.0%Warrington 52.7 0.0 -0.1% 0.0 -0.1%
134

Local Authority
(£ million) (£ million) (%) (£ million) (%)
Difference from 2010-11 Indicative 2010-11 Indicative
AllocationsOption HM1 Option HM2
West Berkshire 23.1 0.0 0.0% 0.0 -0.1%Wiltshire 102.1 0.0 0.0% -0.2 -0.2%Windsor and Maidenhead 10.1 -0.1 -0.8% -0.1 -1.0%Wokingham 8.4 0.0 0.1% 0.0 0.2%York 45.8 -0.1 -0.3% -0.1 -0.2%
Isles of Scilly 2.3 0.0 0.0% 0.0 0.0%
135
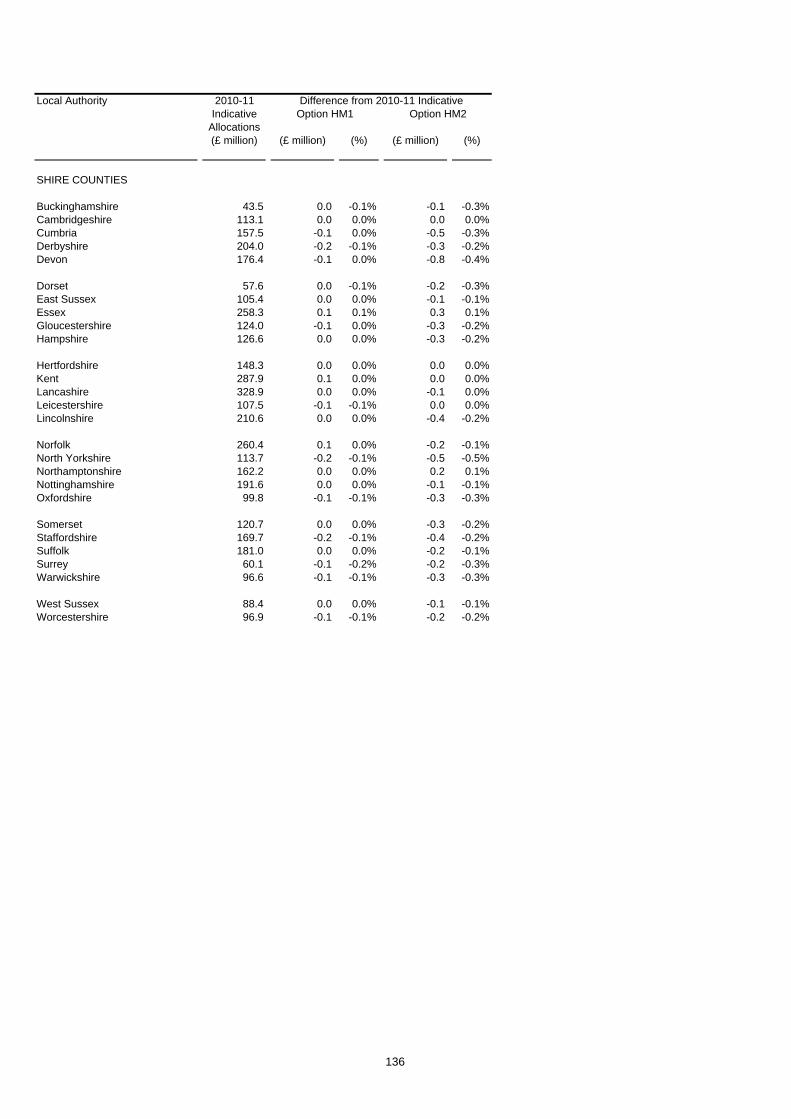
Local Authority
(£ million) (£ million) (%) (£ million) (%)
Difference from 2010-11 Indicative 2010-11 Indicative
AllocationsOption HM1 Option HM2
SHIRE COUNTIES
Buckinghamshire 43.5 0.0 -0.1% -0.1 -0.3%Cambridgeshire 113.1 0.0 0.0% 0.0 0.0%Cumbria 157.5 -0.1 0.0% -0.5 -0.3%Derbyshire 204.0 -0.2 -0.1% -0.3 -0.2%Devon 176.4 -0.1 0.0% -0.8 -0.4%
Dorset 57.6 0.0 -0.1% -0.2 -0.3%East Sussex 105.4 0.0 0.0% -0.1 -0.1%Essex 258.3 0.1 0.1% 0.3 0.1%Gloucestershire 124.0 -0.1 0.0% -0.3 -0.2%Hampshire 126.6 0.0 0.0% -0.3 -0.2%
Hertfordshire 148.3 0.0 0.0% 0.0 0.0%Kent 287.9 0.1 0.0% 0.0 0.0%Lancashire 328.9 0.0 0.0% -0.1 0.0%Leicestershire 107.5 -0.1 -0.1% 0.0 0.0%Lincolnshire 210.6 0.0 0.0% -0.4 -0.2%
Norfolk 260.4 0.1 0.0% -0.2 -0.1%North Yorkshire 113.7 -0.2 -0.1% -0.5 -0.5%Northamptonshire 162.2 0.0 0.0% 0.2 0.1%Nottinghamshire 191.6 0.0 0.0% -0.1 -0.1%Oxfordshire 99.8 -0.1 -0.1% -0.3 -0.3%
Somerset 120.7 0.0 0.0% -0.3 -0.2%Staffordshire 169.7 -0.2 -0.1% -0.4 -0.2%Suffolk 181.0 0.0 0.0% -0.2 -0.1%Surrey 60.1 -0.1 -0.2% -0.2 -0.3%Warwickshire 96.6 -0.1 -0.1% -0.3 -0.3%
West Sussex 88.4 0.0 0.0% -0.1 -0.1%Worcestershire 96.9 -0.1 -0.1% -0.2 -0.2%
136
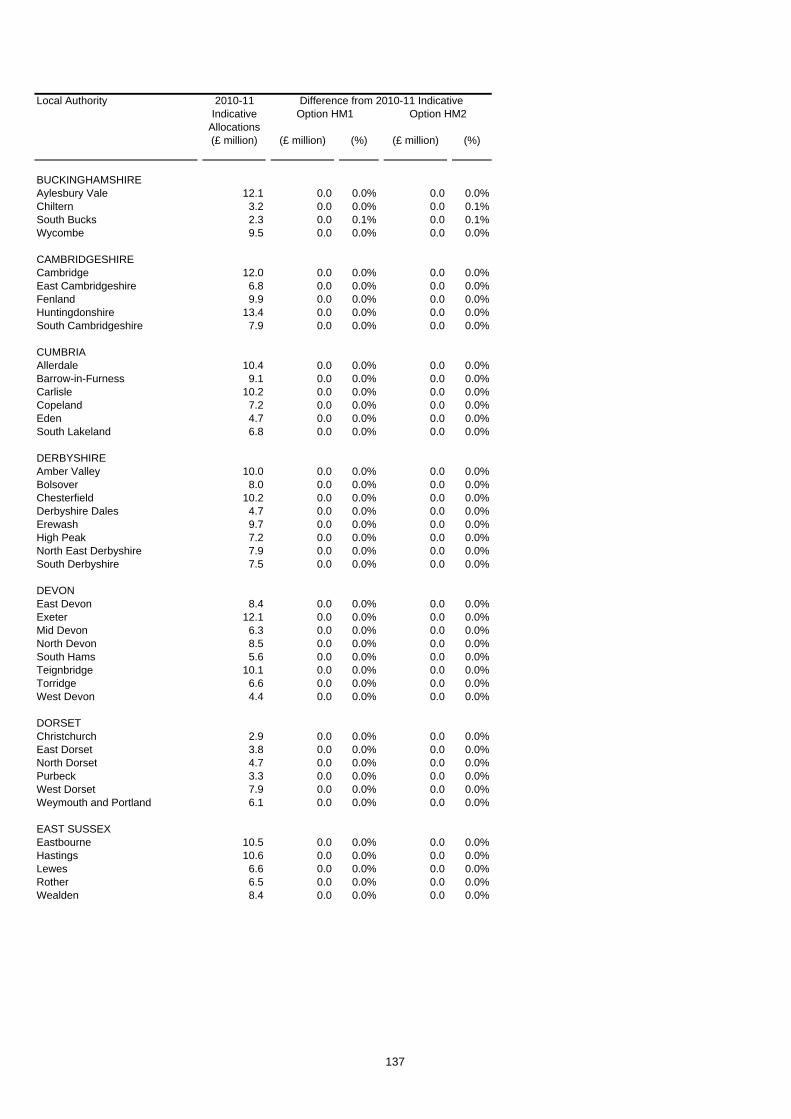
Local Authority
(£ million) (£ million) (%) (£ million) (%)
Difference from 2010-11 Indicative 2010-11 Indicative
AllocationsOption HM1 Option HM2
BUCKINGHAMSHIREAylesbury Vale 12.1 0.0 0.0% 0.0 0.0%Chiltern 3.2 0.0 0.0% 0.0 0.1%South Bucks 2.3 0.0 0.1% 0.0 0.1%Wycombe 9.5 0.0 0.0% 0.0 0.0%
CAMBRIDGESHIRECambridge 12.0 0.0 0.0% 0.0 0.0%East Cambridgeshire 6.8 0.0 0.0% 0.0 0.0%Fenland 9.9 0.0 0.0% 0.0 0.0%Huntingdonshire 13.4 0.0 0.0% 0.0 0.0%South Cambridgeshire 7.9 0.0 0.0% 0.0 0.0%
CUMBRIAAllerdale 10.4 0.0 0.0% 0.0 0.0%Barrow-in-Furness 9.1 0.0 0.0% 0.0 0.0%Carlisle 10.2 0.0 0.0% 0.0 0.0%Copeland 7.2 0.0 0.0% 0.0 0.0%Eden 4.7 0.0 0.0% 0.0 0.0%South Lakeland 6.8 0.0 0.0% 0.0 0.0%
DERBYSHIREAmber Valley 10.0 0.0 0.0% 0.0 0.0%Bolsover 8.0 0.0 0.0% 0.0 0.0%Chesterfield 10.2 0.0 0.0% 0.0 0.0%Derbyshire Dales 4.7 0.0 0.0% 0.0 0.0%Erewash 9.7 0.0 0.0% 0.0 0.0%High Peak 7.2 0.0 0.0% 0.0 0.0%North East Derbyshire 7.9 0.0 0.0% 0.0 0.0%South Derbyshire 7.5 0.0 0.0% 0.0 0.0%
DEVONEast Devon 8.4 0.0 0.0% 0.0 0.0%Exeter 12.1 0.0 0.0% 0.0 0.0%Mid Devon 6.3 0.0 0.0% 0.0 0.0%North Devon 8.5 0.0 0.0% 0.0 0.0%South Hams 5.6 0.0 0.0% 0.0 0.0%Teignbridge 10.1 0.0 0.0% 0.0 0.0%Torridge 6.6 0.0 0.0% 0.0 0.0%West Devon 4.4 0.0 0.0% 0.0 0.0%
DORSETChristchurch 2.9 0.0 0.0% 0.0 0.0%East Dorset 3.8 0.0 0.0% 0.0 0.0%North Dorset 4.7 0.0 0.0% 0.0 0.0%Purbeck 3.3 0.0 0.0% 0.0 0.0%West Dorset 7.9 0.0 0.0% 0.0 0.0%Weymouth and Portland 6.1 0.0 0.0% 0.0 0.0%
EAST SUSSEXEastbourne 10.5 0.0 0.0% 0.0 0.0%Hastings 10.6 0.0 0.0% 0.0 0.0%Lewes 6.6 0.0 0.0% 0.0 0.0%Rother 6.5 0.0 0.0% 0.0 0.0%Wealden 8.4 0.0 0.0% 0.0 0.0%
137
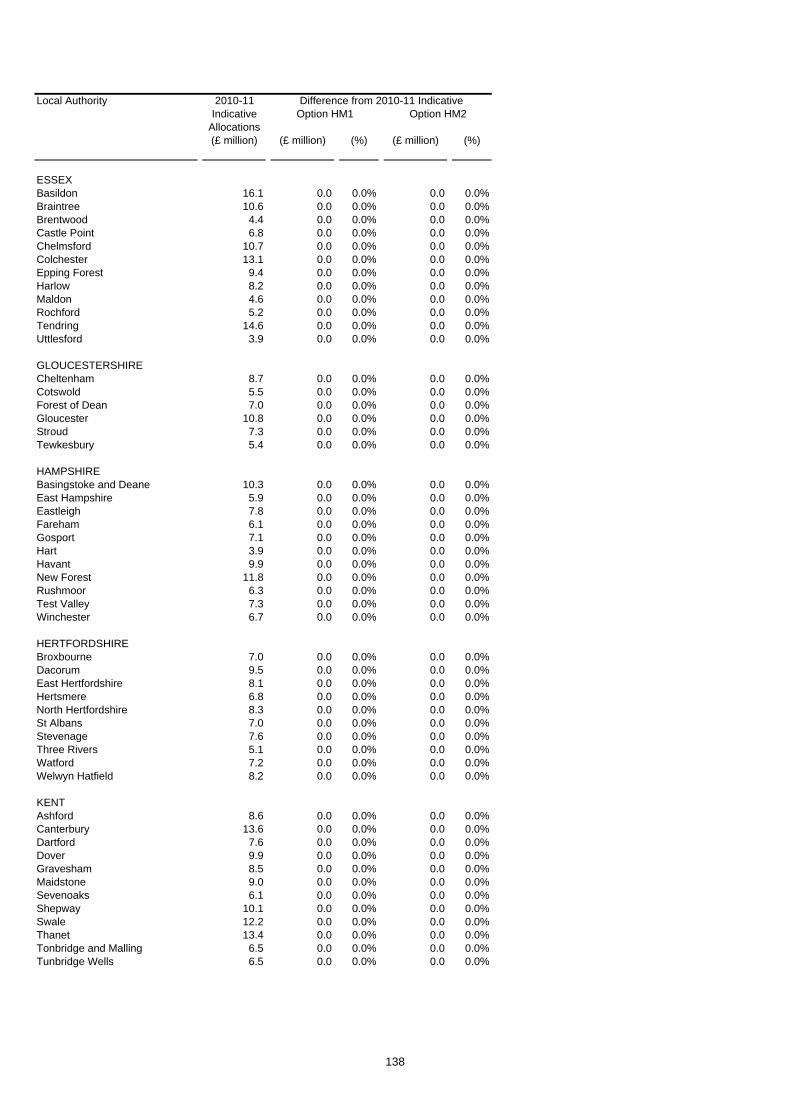
Local Authority
(£ million) (£ million) (%) (£ million) (%)
Difference from 2010-11 Indicative 2010-11 Indicative
AllocationsOption HM1 Option HM2
ESSEXBasildon 16.1 0.0 0.0% 0.0 0.0%Braintree 10.6 0.0 0.0% 0.0 0.0%Brentwood 4.4 0.0 0.0% 0.0 0.0%Castle Point 6.8 0.0 0.0% 0.0 0.0%Chelmsford 10.7 0.0 0.0% 0.0 0.0%Colchester 13.1 0.0 0.0% 0.0 0.0%Epping Forest 9.4 0.0 0.0% 0.0 0.0%Harlow 8.2 0.0 0.0% 0.0 0.0%Maldon 4.6 0.0 0.0% 0.0 0.0%Rochford 5.2 0.0 0.0% 0.0 0.0%Tendring 14.6 0.0 0.0% 0.0 0.0%Uttlesford 3.9 0.0 0.0% 0.0 0.0%
GLOUCESTERSHIRECheltenham 8.7 0.0 0.0% 0.0 0.0%Cotswold 5.5 0.0 0.0% 0.0 0.0%Forest of Dean 7.0 0.0 0.0% 0.0 0.0%Gloucester 10.8 0.0 0.0% 0.0 0.0%Stroud 7.3 0.0 0.0% 0.0 0.0%Tewkesbury 5.4 0.0 0.0% 0.0 0.0%
HAMPSHIREBasingstoke and Deane 10.3 0.0 0.0% 0.0 0.0%East Hampshire 5.9 0.0 0.0% 0.0 0.0%Eastleigh 7.8 0.0 0.0% 0.0 0.0%Fareham 6.1 0.0 0.0% 0.0 0.0%Gosport 7.1 0.0 0.0% 0.0 0.0%Hart 3.9 0.0 0.0% 0.0 0.0%Havant 9.9 0.0 0.0% 0.0 0.0%New Forest 11.8 0.0 0.0% 0.0 0.0%Rushmoor 6.3 0.0 0.0% 0.0 0.0%Test Valley 7.3 0.0 0.0% 0.0 0.0%Winchester 6.7 0.0 0.0% 0.0 0.0%
HERTFORDSHIREBroxbourne 7.0 0.0 0.0% 0.0 0.0%Dacorum 9.5 0.0 0.0% 0.0 0.0%East Hertfordshire 8.1 0.0 0.0% 0.0 0.0%Hertsmere 6.8 0.0 0.0% 0.0 0.0%North Hertfordshire 8.3 0.0 0.0% 0.0 0.0%St Albans 7.0 0.0 0.0% 0.0 0.0%Stevenage 7.6 0.0 0.0% 0.0 0.0%Three Rivers 5.1 0.0 0.0% 0.0 0.0%Watford 7.2 0.0 0.0% 0.0 0.0%Welwyn Hatfield 8.2 0.0 0.0% 0.0 0.0%
KENTAshford 8.6 0.0 0.0% 0.0 0.0%Canterbury 13.6 0.0 0.0% 0.0 0.0%Dartford 7.6 0.0 0.0% 0.0 0.0%Dover 9.9 0.0 0.0% 0.0 0.0%Gravesham 8.5 0.0 0.0% 0.0 0.0%Maidstone 9.0 0.0 0.0% 0.0 0.0%Sevenoaks 6.1 0.0 0.0% 0.0 0.0%Shepway 10.1 0.0 0.0% 0.0 0.0%Swale 12.2 0.0 0.0% 0.0 0.0%Thanet 13.4 0.0 0.0% 0.0 0.0%Tonbridge and Malling 6.5 0.0 0.0% 0.0 0.0%Tunbridge Wells 6.5 0.0 0.0% 0.0 0.0%
138

Local Authority
(£ million) (£ million) (%) (£ million) (%)
Difference from 2010-11 Indicative 2010-11 Indicative
AllocationsOption HM1 Option HM2
LANCASHIREBurnley 11.8 0.0 0.0% 0.0 0.0%Chorley 8.6 0.0 0.0% 0.0 0.0%Fylde 6.0 0.0 0.0% 0.0 0.0%Hyndburn 10.3 0.0 0.0% 0.0 0.0%Lancaster 16.8 0.0 0.0% 0.0 0.0%Pendle 11.2 0.0 0.0% 0.0 0.0%Preston 15.8 0.0 0.0% 0.0 0.0%Ribble Valley 4.3 0.0 0.0% 0.0 0.0%Rossendale 6.2 0.0 0.0% 0.0 0.0%South Ribble 7.6 0.0 0.0% 0.0 0.0%West Lancashire 9.6 0.0 0.0% 0.0 0.0%Wyre 10.8 0.0 0.0% 0.0 0.0%
LEICESTERSHIREBlaby 6.6 0.0 0.0% 0.0 -0.1%Charnwood 12.7 0.0 0.0% 0.0 0.0%Harborough 5.6 0.0 0.0% 0.0 0.0%Hinckley and Bosworth 7.6 0.0 0.0% 0.0 0.0%Melton 4.0 0.0 0.0% 0.0 0.0%North West Leicestershire 7.3 0.0 0.0% 0.0 0.0%Oadby and Wigston 4.7 0.0 0.0% 0.0 0.0%
LINCOLNSHIREBoston 7.4 0.0 0.0% 0.0 0.0%East Lindsey 17.9 0.0 0.0% 0.0 0.0%Lincoln 10.3 0.0 0.0% 0.0 0.0%North Kesteven 9.0 0.0 0.0% 0.0 0.0%South Holland 9.3 0.0 0.0% 0.0 0.0%South Kesteven 10.2 0.0 0.0% 0.0 0.0%West Lindsey 8.4 0.0 0.0% 0.0 0.0%
NORFOLKBreckland 11.6 0.0 0.0% 0.0 0.0%Broadland 8.7 0.0 0.0% 0.0 0.0%Great Yarmouth 10.9 0.0 0.0% 0.0 0.0%King's Lynn and West Norfolk 15.8 0.0 0.0% 0.0 0.0%North Norfolk 9.1 0.0 0.0% 0.0 0.0%Norwich 16.0 0.0 0.0% 0.0 0.0%South Norfolk 8.6 0.0 0.0% 0.0 0.0%
NORTH YORKSHIRECraven 4.3 0.0 0.0% 0.0 0.0%Hambleton 5.9 0.0 0.0% 0.0 0.0%Harrogate 11.5 0.0 0.0% 0.0 0.0%Richmondshire 4.4 0.0 0.0% 0.0 0.0%Ryedale 4.7 0.0 0.0% 0.0 0.0%Scarborough 12.6 0.0 0.0% 0.0 0.0%Selby 6.8 0.0 0.0% 0.0 0.0%
NORTHAMPTONSHIRECorby 5.6 0.0 0.0% 0.0 0.0%Daventry 6.4 0.0 0.0% 0.0 0.0%East Northamptonshire 6.9 0.0 0.0% 0.0 0.0%Kettering 7.4 0.0 0.0% 0.0 0.0%Northampton 18.9 0.0 0.0% 0.0 0.0%South Northamptonshire 6.1 0.0 0.0% 0.0 0.0%Wellingborough 7.1 0.0 0.0% 0.0 0.0%
139

Local Authority
(£ million) (£ million) (%) (£ million) (%)
Difference from 2010-11 Indicative 2010-11 Indicative
AllocationsOption HM1 Option HM2
NOTTINGHAMSHIREAshfield 11.6 0.0 0.0% 0.0 0.0%Bassetlaw 11.4 0.0 0.0% 0.0 0.0%Broxtowe 9.1 0.0 0.0% 0.0 0.0%Gedling 9.4 0.0 0.0% 0.0 0.0%Mansfield 10.3 0.0 0.0% 0.0 0.0%Newark and Sherwood 10.5 0.0 0.0% 0.0 0.0%Rushcliffe 7.3 0.0 0.0% 0.0 0.0%
OXFORDSHIRECherwell 11.2 0.0 0.0% 0.0 0.0%Oxford 16.9 0.0 0.0% 0.0 0.0%South Oxfordshire 7.8 0.0 0.0% 0.0 0.0%Vale of White Horse 7.2 0.0 0.0% 0.0 0.0%West Oxfordshire 6.1 0.0 0.0% 0.0 0.0%
SOMERSETMendip 8.5 0.0 0.0% 0.0 0.0%Sedgemoor 10.3 0.0 0.0% 0.0 0.0%South Somerset 11.2 0.0 0.0% 0.0 0.0%Taunton Deane 8.9 0.0 0.0% 0.0 0.0%West Somerset 3.3 0.0 0.0% 0.0 0.0%
STAFFORDSHIRECannock Chase 8.6 0.0 0.0% 0.0 0.0%East Staffordshire 9.6 0.0 0.0% 0.0 0.0%Lichfield 6.1 0.0 0.0% 0.0 0.0%Newcastle-under-Lyme 11.3 0.0 0.0% 0.0 0.0%South Staffordshire 7.2 0.0 0.0% 0.0 0.0%Stafford 8.8 0.0 0.0% 0.0 0.0%Staffordshire Moorlands 7.6 0.0 0.0% 0.0 0.0%Tamworth 6.9 0.0 0.0% 0.0 0.0%
SUFFOLKBabergh 6.4 0.0 0.0% 0.0 0.0%Forest Heath 5.5 0.0 0.0% 0.0 -0.1%Ipswich 11.9 0.0 0.0% 0.0 0.0%Mid Suffolk 6.2 0.0 0.0% 0.0 0.0%St Edmundsbury 7.1 0.0 0.0% 0.0 0.0%Suffolk Coastal 8.4 0.0 0.0% 0.0 0.0%Waveney 12.0 0.0 0.0% 0.0 0.0%
SURREYElmbridge 6.5 0.0 0.0% 0.0 0.0%Epsom and Ewell 4.0 0.0 0.0% 0.0 0.0%Guildford 8.6 0.0 0.0% 0.0 0.0%Mole Valley 3.3 0.0 0.1% 0.0 0.1%Reigate and Banstead 6.9 0.0 0.0% 0.0 0.0%Runnymede 5.8 0.0 0.0% 0.0 0.0%Spelthorne 5.7 0.0 0.0% 0.0 0.0%Surrey Heath 4.7 0.0 0.0% 0.0 0.0%Tandridge 4.0 0.0 0.0% 0.0 0.0%Waverley 5.4 0.0 0.0% 0.0 0.0%Woking 5.8 0.0 0.0% 0.0 0.0%
WARWICKSHIRENorth Warwickshire 5.5 0.0 0.0% 0.0 0.0%Nuneaton and Bedworth 11.4 0.0 0.0% 0.0 0.0%Rugby 6.6 0.0 0.0% 0.0 0.0%Stratford-on-Avon 6.9 0.0 0.0% 0.0 0.0%Warwick 10.5 0.0 0.0% 0.0 0.0%
140

Local Authority
(£ million) (£ million) (%) (£ million) (%)
Difference from 2010-11 Indicative 2010-11 Indicative
AllocationsOption HM1 Option HM2
WEST SUSSEXAdur 5.0 0.0 0.0% 0.0 0.0%Arun 10.5 0.0 0.0% 0.0 0.0%Chichester 5.9 0.0 0.0% 0.0 0.0%Crawley 10.5 0.0 0.0% 0.0 0.0%Horsham 6.0 0.0 0.0% 0.0 0.0%Mid Sussex 5.3 0.0 0.0% 0.0 0.0%Worthing 7.9 0.0 0.0% 0.0 0.0%
WORCESTERSHIREBromsgrove 5.2 0.0 0.0% 0.0 0.0%Malvern Hills 5.2 0.0 0.0% 0.0 0.0%Redditch 6.4 0.0 0.0% 0.0 0.0%Worcester 7.8 0.0 0.0% 0.0 0.0%Wychavon 8.0 0.0 0.0% 0.0 0.0%Wyre Forest 8.1 0.0 0.0% 0.0 0.0%
141

Local Authority
(£ million) (£ million) (%) (£ million) (%)
Difference from 2010-11 Indicative 2010-11 Indicative
AllocationsOption HM1 Option HM2
SHIRE POLICE AUTHORITIES
Avon & Somerset Police 197.6 0.0 0.0% 0.0 0.0%Bedfordshire Police 76.6 0.0 0.0% 0.0 0.0%Cambridgeshire Police 86.2 0.0 0.0% 0.0 0.0%Cheshire Police 114.1 0.0 0.0% 0.0 0.0%Cleveland Police 99.0 0.0 0.0% 0.0 0.0%
Cumbria Police 56.1 0.0 0.0% 0.0 0.0%Derbyshire Police 120.7 0.0 0.0% 0.0 0.0%Devon & Cornwall Police 191.7 0.0 0.0% 0.0 0.0%Dorset Police 64.3 0.0 0.0% 0.0 0.0%Durham Police 87.0 0.0 0.0% 0.0 0.0%
Essex Police 187.3 0.0 0.0% 0.0 0.0%Gloucestershire Police 58.5 0.0 0.0% 0.0 0.0%Hampshire Police 215.0 0.0 0.0% 0.0 0.0%Hertfordshire Police 128.9 0.0 0.0% 0.0 0.0%Humberside Police 132.9 0.0 0.0% 0.0 0.0%
Kent Police 200.2 0.0 0.0% 0.0 0.0%Lancashire Police 212.3 0.0 0.0% 0.0 0.0%Leicestershire Police 124.2 0.0 0.0% 0.0 0.0%Lincolnshire Police 69.0 0.0 0.0% 0.0 0.0%Norfolk Police 88.5 0.0 0.0% 0.0 0.0%
North Yorkshire Police 73.1 0.0 0.0% 0.0 0.0%Northamptonshire Police 78.4 0.0 0.0% 0.0 0.0%Nottinghamshire Police 152.7 0.0 0.0% 0.0 0.0%Staffordshire Police 125.1 0.0 0.0% 0.0 0.0%Suffolk Police 71.0 0.0 0.0% 0.0 0.0%
Surrey Police 101.3 0.0 0.0% 0.0 0.0%Sussex Police 167.1 0.0 0.0% 0.0 0.0%Thames Valley Police 248.5 0.0 0.0% 0.0 0.0%Warwickshire Police 56.1 0.0 0.0% 0.0 0.0%West Mercia Police 114.3 0.0 0.0% 0.0 0.0%
Wiltshire Police 64.1 0.0 0.0% 0.0 0.0%
142

Local Authority
(£ million) (£ million) (%) (£ million) (%)
Difference from 2010-11 Indicative 2010-11 Indicative
AllocationsOption HM1 Option HM2
SHIRE FIRE AUTHORITIES
Avon Fire 24.6 0.0 0.0% 0.0 0.0%Bedfordshire Fire 11.7 0.0 0.0% 0.0 0.0%Berkshire Fire Auhtority 13.0 0.0 0.0% 0.0 0.0%Buckinghamshire Fire 9.1 0.0 0.0% 0.0 0.0%Cambridgeshire Fire 15.1 0.0 0.0% 0.0 0.0%
Cheshire Fire 19.3 0.0 0.0% 0.0 0.0%Cleveland Fire 21.7 0.0 0.0% 0.0 0.0%Derbyshire Fire 20.6 0.0 0.0% 0.0 0.0%Devon and Somerset Fire 32.1 0.0 0.0% 0.0 0.0%Dorset Fire 11.1 0.0 0.0% 0.0 0.0%
Durham Fire 14.9 0.0 0.0% 0.0 0.0%East Sussex Fire 15.0 0.0 0.0% 0.0 0.0%Essex Fire Auhtority 33.3 0.0 0.0% 0.0 0.0%Hampshire Fire 29.9 0.0 0.0% 0.0 0.0%Hereford & Worcester Fire 10.8 0.0 0.0% 0.0 -0.1%
Humberside Fire 28.2 0.0 0.0% 0.0 0.0%Kent Fire 30.2 0.0 0.0% 0.0 0.0%Lancashire Fire 32.6 0.0 0.0% 0.0 0.0%Leicestershire Fire 19.2 0.0 0.0% 0.0 0.0%North Yorkshire Fire 11.6 0.0 0.0% 0.0 -0.1%
Nottinghamshire Fire 26.3 0.0 0.0% 0.0 0.0%Shropshire Fire 8.6 0.0 0.0% 0.0 0.0%Staffordshire Fire 19.1 0.0 0.0% 0.0 0.0%Wiltshire Fire 9.7 0.0 0.0% 0.0 0.0%
143
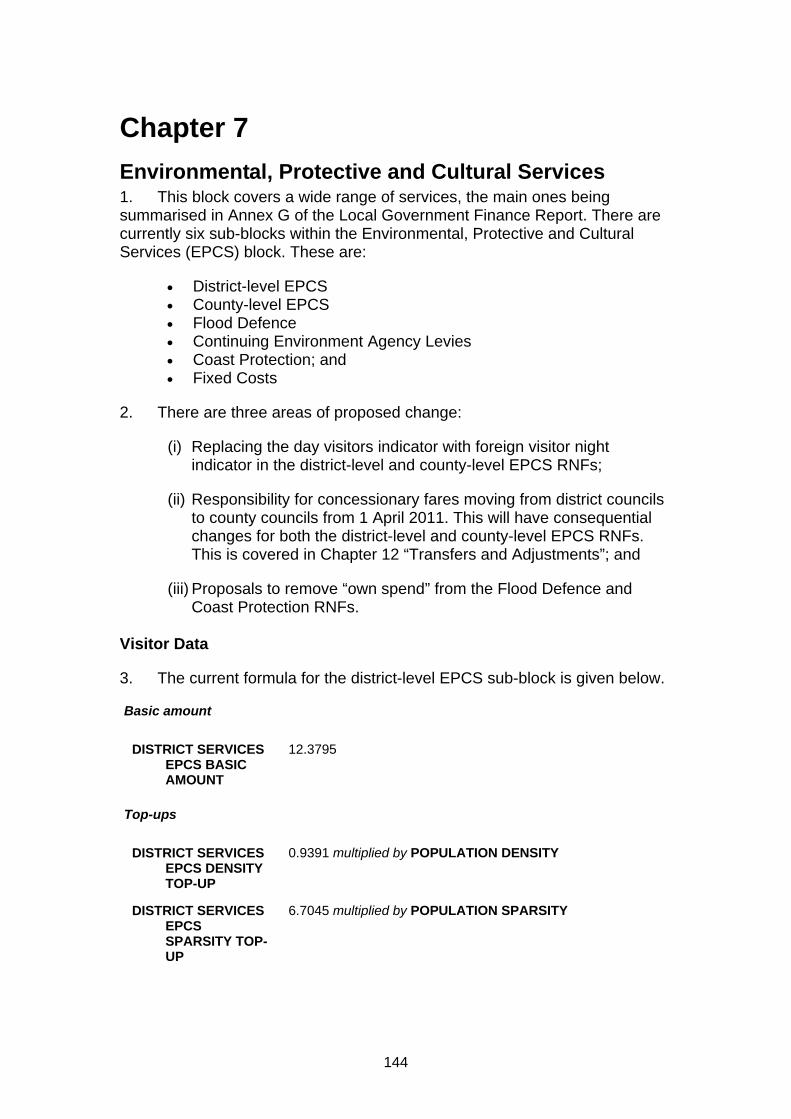
144
Chapter 7 Environmental, Protective and Cultural Services 1. This block covers a wide range of services, the main ones being summarised in Annex G of the Local Government Finance Report. There are currently six sub-blocks within the Environmental, Protective and Cultural Services (EPCS) block. These are:
• District-level EPCS • County-level EPCS • Flood Defence • Continuing Environment Agency Levies • Coast Protection; and • Fixed Costs
2. There are three areas of proposed change:
(i) Replacing the day visitors indicator with foreign visitor night indicator in the district-level and county-level EPCS RNFs;
(ii) Responsibility for concessionary fares moving from district councils to county councils from 1 April 2011. This will have consequential changes for both the district-level and county-level EPCS RNFs. This is covered in Chapter 12 “Transfers and Adjustments”; and
(iii) Proposals to remove “own spend” from the Flood Defence and Coast Protection RNFs.
Visitor Data
3. The current formula for the district-level EPCS sub-block is given below.
Basic amount
DISTRICT SERVICES
EPCS BASIC AMOUNT
12.3795
Top-ups
DISTRICT SERVICES
EPCS DENSITY TOP-UP
0.9391 multiplied by POPULATION DENSITY
DISTRICT SERVICES
EPCS SPARSITY TOP-UP
6.7045 multiplied by POPULATION SPARSITY

145
DISTRICT SERVICES
EPCS ADDITIONAL POPULATION TOP-UP
4.9940 multiplied by NET IN-COMMUTERS; plus 4.2397 multiplied by DAY VISITORS
DISTRICT SERVICES EPCS DEPRIVATION TOP-UP
40.1387 multiplied by INCAPACITY BENEFIT AND SEVERE
DISABLEMENT ALLOWANCE; plus 27.1354 multiplied by INCOME SUPPORT/ INCOME BASED
JOBSEEKER’S ALLOWANCE/ GUARANTEE ELEMENT OF PENSION CREDIT CLAIMANTS; plus
40.1387 multiplied by OLDER PEOPLE ON INCOME SUPPORT/ INCOME BASED JOBSEEKER’S ALLOWANCE/ GUARANTEE ELEMENT OF PENSION CREDIT; plus
27.1354 multiplied by UNEMPLOYMENT RELATED BENEFIT CLAIMANTS; plus
3.6586 multiplied by COUNTRY OF BIRTH OF RESIDENTS
The full formula used to calculate the RNF element for these services is:
Services provided predominantly by non-metropolitan district councils in non-metropolitan areas
(a) PROJECTED POPULATION IN 2010 multiplied by the result of: DISTRICT SERVICES EPCS BASIC AMOUNT; plus DISTRICT SERVICES EPCS DENSITY TOP-UP; plus DISTRICT SERVICES EPCS SPARSITY TOP-UP;
(b) DISTRICT SERVICES EPCS ADDITIONAL POPULATION TOP-UP; plus DISTRICT SERVICES EPCS DEPRIVATION TOP-UP
(c) The results of (a) and (b) are added together and that result is then multiplied by AREA COST ADJUSTMENT FOR ENVIRONMENTAL, PROTECTIVE AND CULTURAL SERVICES;
(d) The result of (c) is then multiplied by the scaling factor given in Annex F for these services;
(e) The result of (d) is then divided by 10,000,000,000.
4. The current formula for the county-level EPCS sub-block is given below.
Basic amount
COUNTY SERVICES
EPCS BASIC AMOUNT
9.1637
Top-ups
COUNTY SERVICES
EPCS DENSITY TOP-UP
0.2232 multiplied by POPULATION DENSITY
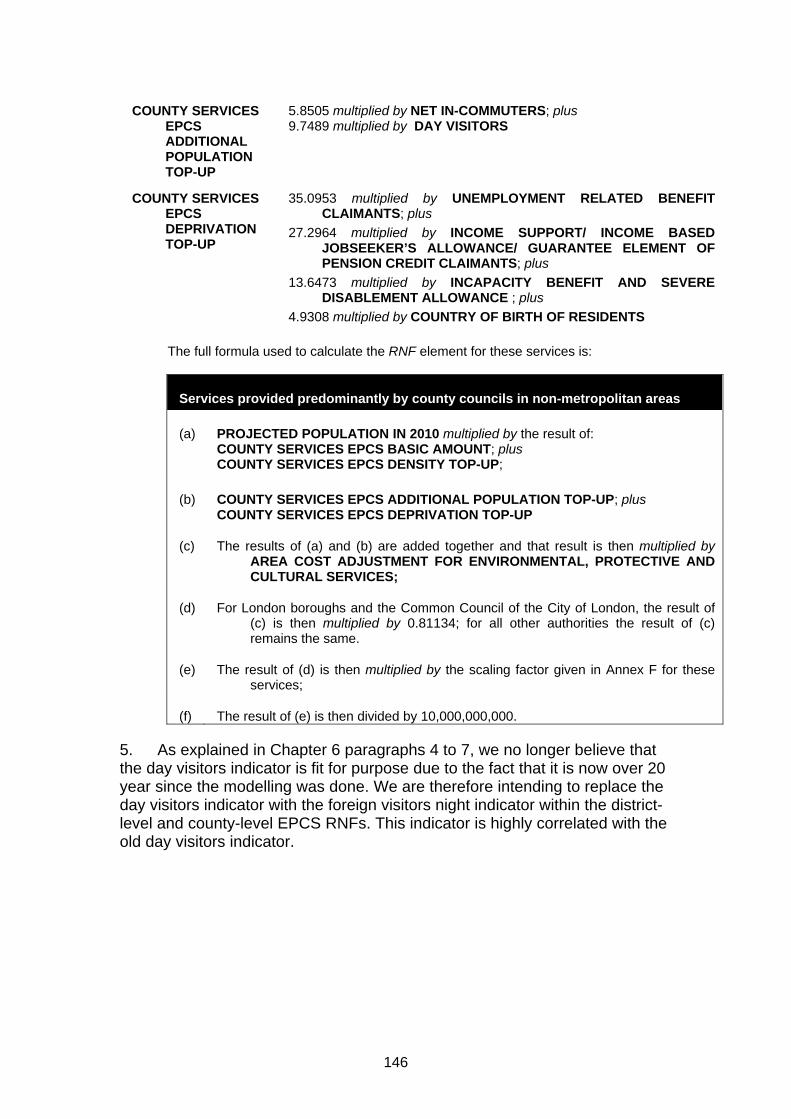
146
COUNTY SERVICES
EPCS ADDITIONAL POPULATION TOP-UP
5.8505 multiplied by NET IN-COMMUTERS; plus 9.7489 multiplied by DAY VISITORS
COUNTY SERVICES
EPCS DEPRIVATION TOP-UP
35.0953 multiplied by UNEMPLOYMENT RELATED BENEFIT
CLAIMANTS; plus 27.2964 multiplied by INCOME SUPPORT/ INCOME BASED
JOBSEEKER’S ALLOWANCE/ GUARANTEE ELEMENT OF PENSION CREDIT CLAIMANTS; plus
13.6473 multiplied by INCAPACITY BENEFIT AND SEVERE DISABLEMENT ALLOWANCE ; plus
4.9308 multiplied by COUNTRY OF BIRTH OF RESIDENTS
The full formula used to calculate the RNF element for these services is:
Services provided predominantly by county councils in non-metropolitan areas
(a) PROJECTED POPULATION IN 2010 multiplied by the result of: COUNTY SERVICES EPCS BASIC AMOUNT; plus COUNTY SERVICES EPCS DENSITY TOP-UP;
(b) COUNTY SERVICES EPCS ADDITIONAL POPULATION TOP-UP; plus COUNTY SERVICES EPCS DEPRIVATION TOP-UP
(c) The results of (a) and (b) are added together and that result is then multiplied by AREA COST ADJUSTMENT FOR ENVIRONMENTAL, PROTECTIVE AND CULTURAL SERVICES;
(d) For London boroughs and the Common Council of the City of London, the result of (c) is then multiplied by 0.81134; for all other authorities the result of (c) remains the same.
(e) The result of (d) is then multiplied by the scaling factor given in Annex F for these services;
(f) The result of (e) is then divided by 10,000,000,000.
5. As explained in Chapter 6 paragraphs 4 to 7, we no longer believe that the day visitors indicator is fit for purpose due to the fact that it is now over 20 year since the modelling was done. We are therefore intending to replace the day visitors indicator with the foreign visitors night indicator within the district-level and county-level EPCS RNFs. This indicator is highly correlated with the old day visitors indicator.

147
Option EPCS1 Replacing the day visitors with foreign visitor nights
6. The new District Services EPCS Additional Population Top-Up is given below.
DISTRICT SERVICES
EPCS ADDITIONAL POPULATION TOP-UP
4.9940 multiplied by NET IN-COMMUTERS; plus 17.8800 multiplied by FOREIGN VISITOR NIGHTS
7. The new County Services EPCS Additional Population Top-Up is given below.
COUNTY SERVICES
EPCS ADDITIONAL POPULATION TOP-UP
5.8505 multiplied by NET IN-COMMUTERS; plus 40.2908 multiplied by FOREIGN VISITOR NIGHTS
Removing the “own spend” indicators from the Flood Defence and Coast Protection sub-blocks
8. The current formula for the Flood Defence sub-block is given below.
Flood Defence
(a) FLOOD DEFENCE EXPENDITURE
(b) The result of (a) is multiplied by the scaling factor given in Annex F for Flood Defence.
(c) The result of (b) is divided by 10,000,000,000.
9. The current formula for the Coast Protection sub-block is given below.
Coast Protection
(a) COAST PROTECTION EXPENDITURE is multiplied by the scaling factor given in Annex F for Coast Protection
(b) The result of (a) is then divided by 10,000,000,000.
10. Evidence of flood and coastal erosion risk continues to improve, most notably using Geographical Information Systems. This means that it is becoming more realistic to distribute according to an assessment of need.
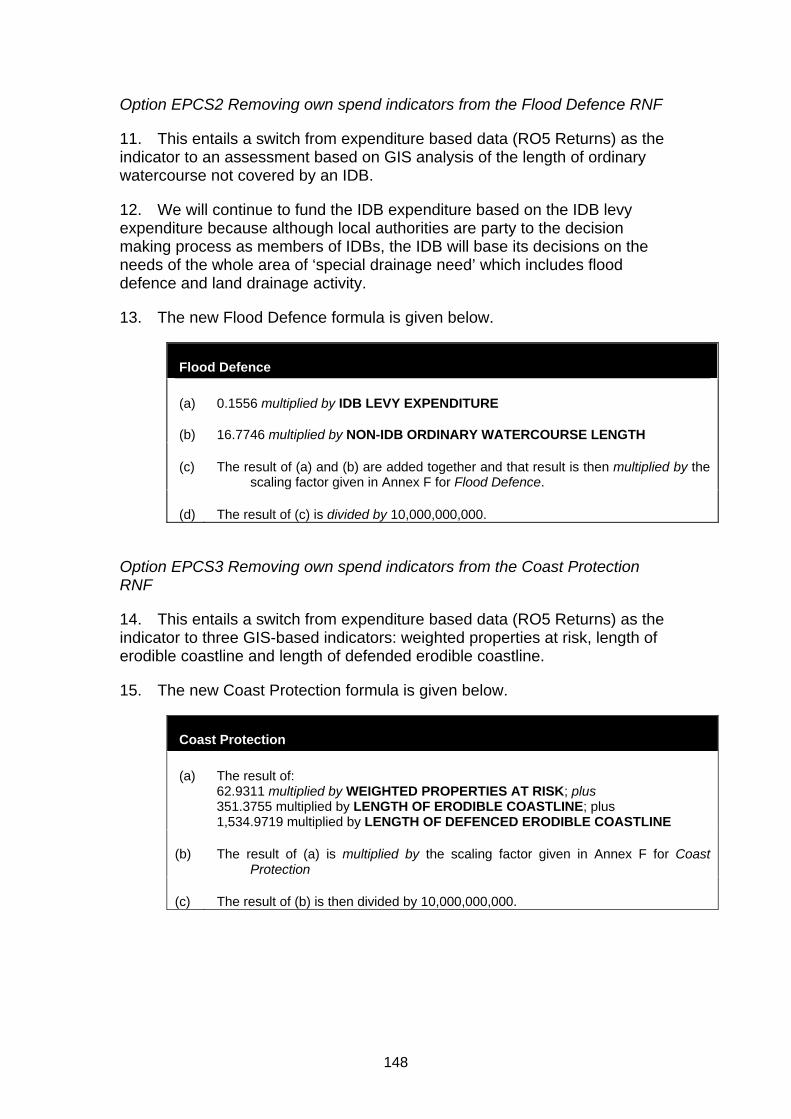
148
Option EPCS2 Removing own spend indicators from the Flood Defence RNF
11. This entails a switch from expenditure based data (RO5 Returns) as the indicator to an assessment based on GIS analysis of the length of ordinary watercourse not covered by an IDB.
12. We will continue to fund the IDB expenditure based on the IDB levy expenditure because although local authorities are party to the decision making process as members of IDBs, the IDB will base its decisions on the needs of the whole area of ‘special drainage need’ which includes flood defence and land drainage activity.
13. The new Flood Defence formula is given below.
Flood Defence
(a)
(b)
0.1556 multiplied by IDB LEVY EXPENDITURE
16.7746 multiplied by NON-IDB ORDINARY WATERCOURSE LENGTH
(c) The result of (a) and (b) are added together and that result is then multiplied by the scaling factor given in Annex F for Flood Defence.
(d) The result of (c) is divided by 10,000,000,000.
Option EPCS3 Removing own spend indicators from the Coast Protection RNF
14. This entails a switch from expenditure based data (RO5 Returns) as the indicator to three GIS-based indicators: weighted properties at risk, length of erodible coastline and length of defended erodible coastline.
15. The new Coast Protection formula is given below.
Coast Protection
(a) The result of: 62.9311 multiplied by WEIGHTED PROPERTIES AT RISK; plus 351.3755 multiplied by LENGTH OF ERODIBLE COASTLINE; plus 1,534.9719 multiplied by LENGTH OF DEFENCED ERODIBLE COASTLINE
(b) The result of (a) is multiplied by the scaling factor given in Annex F for Coast Protection
(c) The result of (b) is then divided by 10,000,000,000.

149
Questions
Question 11: Do you agree that foreign visitor nights is a suitable replacement for day visitors in the district-level and county-level EPCS RNFs (EPCS1)?
Question 12: Do you agree that the new GIS–based flood defence formula should be used (EPCS2)?
Question 13: Do you agree that the new GIS–based coast protection formula should be used (EPCS3)?

Formula Grant Before Floor DampingLocal Authority
(£ million) (£ million) (%)
England 28,995.5 0.0 0.0%
London area 6,153.4 60.7 1.0%Metropolitan areas 8,340.7 -18.7 -0.2%Shire areas 14,499.1 -42.1 -0.3%Isles of Scilly 2.3 0.0 0.0%
Inner London boroughs incl. City 2,025.0 39.9 2.0%Outer London boroughs 1,873.1 18.2 1.0%London boroughs 3,898.1 58.1 1.5%GLA - all functions 2,255.3 2.6 0.1%
Metropolitan districts 5,904.0 -19.2 -0.3%Metropolitan fire authorities 335.8 0.0 0.0%Metropolitan police authorities 2,100.9 0.5 0.0%
Shire unitaries with fire 425.6 0.1 0.0%Shire unitaries without fire 4,099.3 -16.5 -0.4%Shire counties with fire 1,589.0 -6.6 -0.4%Shire counties without fire 2,501.9 -13.1 -0.5%Shire districts 1,654.0 -2.9 -0.2%Combined fire authorities 467.7 -0.5 -0.1%Shire police authorities 3,761.6 -2.6 -0.1%
GO REGIONAL SUMMARY
South West GOR 2,267.3 0.5 0.0%South East GOR 2,957.0 1.3 0.0%London GOR 6,153.4 60.7 1.0%Eastern GOR 2,437.8 -2.6 -0.1%East Midlands GOR 2,292.2 -12.3 -0.5%West Midlands GOR 3,349.9 -11.4 -0.3%Yorkshire and Humber GOR 3,199.2 -12.2 -0.4%North East GOR 1,777.2 -5.9 -0.3%North West GOR 4,561.4 -18.1 -0.4%
FLOOR DAMPING GROUPS
Education Authorities 18,418.0 2.9 0.0%Police Authorities 7,864.8 0.1 0.0%Fire Authorities 1,056.5 0.0 0.0%Shire Districts 1,654.0 -2.9 -0.2%
7 EPCS - Main Formulae
Difference from Indicative Allocation
Option EPCS1
2010-11 Indicative Allocation
150

Formula Grant Before Floor DampingLocal Authority
(£ million) (£ million) (%)
Difference from Indicative Allocation
Option EPCS1
2010-11 Indicative Allocation
GREATER LONDON
City of London 91.1 -1.7 -1.9%
Camden 171.0 5.8 3.4%Greenwich 170.1 0.9 0.5%Hackney 201.8 1.6 0.8%Hammersmith and Fulham 94.3 2.5 2.6%Islington 133.8 2.3 1.8%Kensington and Chelsea 95.9 7.9 8.2%
Lambeth 180.3 1.9 1.1%Lewisham 174.9 1.3 0.8%Southwark 210.2 1.3 0.6%Tower Hamlets 224.3 0.8 0.3%Wandsworth 98.6 2.5 2.5%Westminster 178.8 12.9 7.2%
Barking and Dagenham 108.2 0.2 0.2%Barnet 97.9 2.5 2.5%Bexley 64.5 -0.1 -0.2%Brent 157.0 1.1 0.7%Bromley 45.7 0.5 1.2%
Croydon 118.4 1.0 0.8%Ealing 129.0 2.4 1.8%Enfield 126.7 0.7 0.6%Haringey 137.6 1.8 1.3%Harrow 66.6 1.1 1.6%
Havering 52.3 -0.1 -0.2%Hillingdon 85.6 1.6 1.8%Hounslow 77.3 0.9 1.1%Kingston upon Thames 32.6 0.4 1.2%Merton 61.2 0.9 1.5%
Newham 231.3 1.1 0.5%Redbridge 102.6 0.4 0.4%Richmond upon Thames 9.6 1.1 11.7%Sutton 45.1 0.3 0.7%Waltham Forest 124.0 0.6 0.5%
GLA - all functions 2,255.3 2.6 0.1%
GLA - police 2,002.3 2.1 0.1%GLA - fire 253.0 0.5 0.2%
151

Formula Grant Before Floor DampingLocal Authority
(£ million) (£ million) (%)
Difference from Indicative Allocation
Option EPCS1
2010-11 Indicative Allocation
GREATER MANCHESTERBolton 132.6 -0.8 -0.6%Bury 67.5 -0.4 -0.5%Manchester 346.1 -0.3 -0.1%Oldham 127.6 -0.5 -0.4%Rochdale 114.9 -0.4 -0.4%Salford 131.2 -0.1 -0.1%Stockport 85.2 -0.7 -0.8%Tameside 109.5 -0.4 -0.4%Trafford 67.3 -0.6 -0.9%Wigan 138.6 -1.0 -0.8%Greater Manchester Fire 76.1 0.0 0.0%Greater Manchester Police 485.7 0.2 0.0%
MERSEYSIDEKnowsley 114.6 -0.1 -0.1%Liverpool 318.0 -0.7 -0.2%Sefton 127.6 -0.7 -0.5%St Helens 90.9 -0.6 -0.6%Wirral 165.2 -0.4 -0.2%Merseyside Fire 46.1 0.0 0.1%Merseyside Police 275.5 0.2 0.1%
SOUTH YORKSHIREBarnsley 114.3 -0.6 -0.6%Doncaster 149.1 -0.7 -0.4%Rotherham 130.1 -0.7 -0.6%Sheffield 280.0 -1.1 -0.4%South Yorkshire Fire 37.4 0.0 0.0%South Yorkshire Police 209.2 0.0 0.0%
TYNE AND WEARGateshead 102.7 -0.5 -0.5%Newcastle upon Tyne 157.2 -0.4 -0.2%North Tyneside 87.4 -0.4 -0.5%South Tyneside 89.3 -0.2 -0.3%Sunderland 158.9 -0.4 -0.2%Tyne and Wear Fire 35.9 0.0 0.0%Northumbria Police 219.9 0.0 0.0%
WEST MIDLANDSBirmingham 698.9 0.2 0.0%Coventry 156.6 0.3 0.2%Dudley 130.4 -0.7 -0.6%Sandwell 190.3 -0.4 -0.2%Solihull 49.1 -1.2 -2.4%Walsall 142.3 -0.4 -0.3%Wolverhampton 145.6 0.1 0.1%West Midlands Fire 81.6 0.0 0.0%West Midlands Police 542.2 0.3 0.1%
WEST YORKSHIREBradford 283.4 -0.7 -0.3%Calderdale 84.1 -0.7 -0.8%Kirklees 164.9 -0.7 -0.4%Leeds 305.9 -1.4 -0.5%Wakefield 146.7 -0.9 -0.6%West Yorkshire Fire 58.7 0.0 -0.1%West Yorkshire Police 368.2 0.0 0.0%
152

Formula Grant Before Floor DampingLocal Authority
(£ million) (£ million) (%)
Difference from Indicative Allocation
Option EPCS1
2010-11 Indicative Allocation
ALL PURPOSE AUTHORITIES
Bath & North East Somerset 44.1 -0.2 -0.5%Bedford 55.4 0.1 0.1%Blackburn with Darwen 88.5 -0.5 -0.6%Blackpool 86.9 -2.0 -2.3%Bournemouth 49.4 0.6 1.2%
Bracknell Forest 22.6 0.0 0.1%Brighton & Hove 89.8 0.9 1.0%Bristol 171.2 1.2 0.7%Central Bedfordshire 51.9 -0.6 -1.2%Cheshire East 64.5 -1.9 -2.9%
Cheshire West & Chester 94.9 -1.6 -1.7%Cornwall 227.6 1.3 0.6%Darlington 40.1 -0.3 -0.7%Derby 114.5 -0.6 -0.5%Durham 238.7 -1.2 -0.5%
East Riding of Yorkshire 109.2 -1.0 -1.0%Halton 65.5 -0.3 -0.4%Hartlepool 54.0 -0.3 -0.5%Herefordshire 61.2 -0.2 -0.4%Isle of Wight Council 65.0 -0.3 -0.4%
Kingston upon Hull 159.2 0.0 0.0%Leicester 188.4 -0.4 -0.2%Luton 94.6 0.0 0.0%Medway 89.5 -0.2 -0.2%Middlesbrough 85.4 -0.4 -0.5%
Milton Keynes 91.6 -0.1 -0.1%North East Lincolnshire 76.9 -0.3 -0.3%North Lincolnshire 66.3 -0.2 -0.3%North Somerset 54.6 -0.3 -0.5%Northumberland 133.1 -0.9 -0.7%
Nottingham 179.5 -0.5 -0.3%Peterborough 80.9 0.1 0.1%Plymouth 108.7 0.3 0.3%Poole 25.6 -0.1 -0.3%Portsmouth 87.8 -0.2 -0.2%
Reading 48.0 0.3 0.5%Redcar and Cleveland 71.4 -0.3 -0.4%Rutland 8.6 -0.1 -0.8%Shropshire 97.4 -0.5 -0.5%Slough 52.8 -0.3 -0.6%
South Gloucestershire 64.0 -0.4 -0.6%Southampton 101.2 -0.1 -0.1%Southend-on-Sea 62.3 -0.3 -0.5%Stockton-on-Tees 80.6 -0.7 -0.8%Stoke-on-Trent 133.5 -0.8 -0.6%
Swindon 43.7 -0.3 -0.7%Telford and the Wrekin 76.0 -0.2 -0.2%Thurrock 62.1 -0.2 -0.3%Torbay 64.2 -0.1 -0.1%Warrington 52.7 -0.9 -1.7%
153

Formula Grant Before Floor DampingLocal Authority
(£ million) (£ million) (%)
Difference from Indicative Allocation
Option EPCS1
2010-11 Indicative Allocation
West Berkshire 23.1 0.3 1.1%Wiltshire 102.1 -0.5 -0.5%Windsor and Maidenhead 10.1 -0.3 -2.9%Wokingham 8.4 0.2 2.8%York 45.8 -1.4 -3.0%
Isles of Scilly 2.3 0.0 0.0%
154

Formula Grant Before Floor DampingLocal Authority
(£ million) (£ million) (%)
Difference from Indicative Allocation
Option EPCS1
2010-11 Indicative Allocation
SHIRE COUNTIES
Buckinghamshire 43.5 -0.6 -1.4%Cambridgeshire 113.1 1.3 1.1%Cumbria 157.5 0.0 0.0%Derbyshire 204.0 -2.5 -1.2%Devon 176.4 0.5 0.3%
Dorset 57.6 0.1 0.2%East Sussex 105.4 0.9 0.9%Essex 258.3 -1.5 -0.6%Gloucestershire 124.0 -0.8 -0.7%Hampshire 126.6 -1.1 -0.8%
Hertfordshire 148.3 -1.2 -0.8%Kent 287.9 0.8 0.3%Lancashire 328.9 -2.3 -0.7%Leicestershire 107.5 -1.7 -1.6%Lincolnshire 210.6 -1.0 -0.5%
Norfolk 260.4 0.0 0.0%North Yorkshire 113.7 -1.3 -1.1%Northamptonshire 162.2 -1.1 -0.7%Nottinghamshire 191.6 -1.3 -0.7%Oxfordshire 99.8 1.3 1.3%
Somerset 120.7 -0.4 -0.3%Staffordshire 169.7 -3.0 -1.8%Suffolk 181.0 -0.2 -0.1%Surrey 60.1 -1.6 -2.6%Warwickshire 96.6 -1.5 -1.5%
West Sussex 88.4 -0.7 -0.7%Worcestershire 96.9 -1.2 -1.2%
155
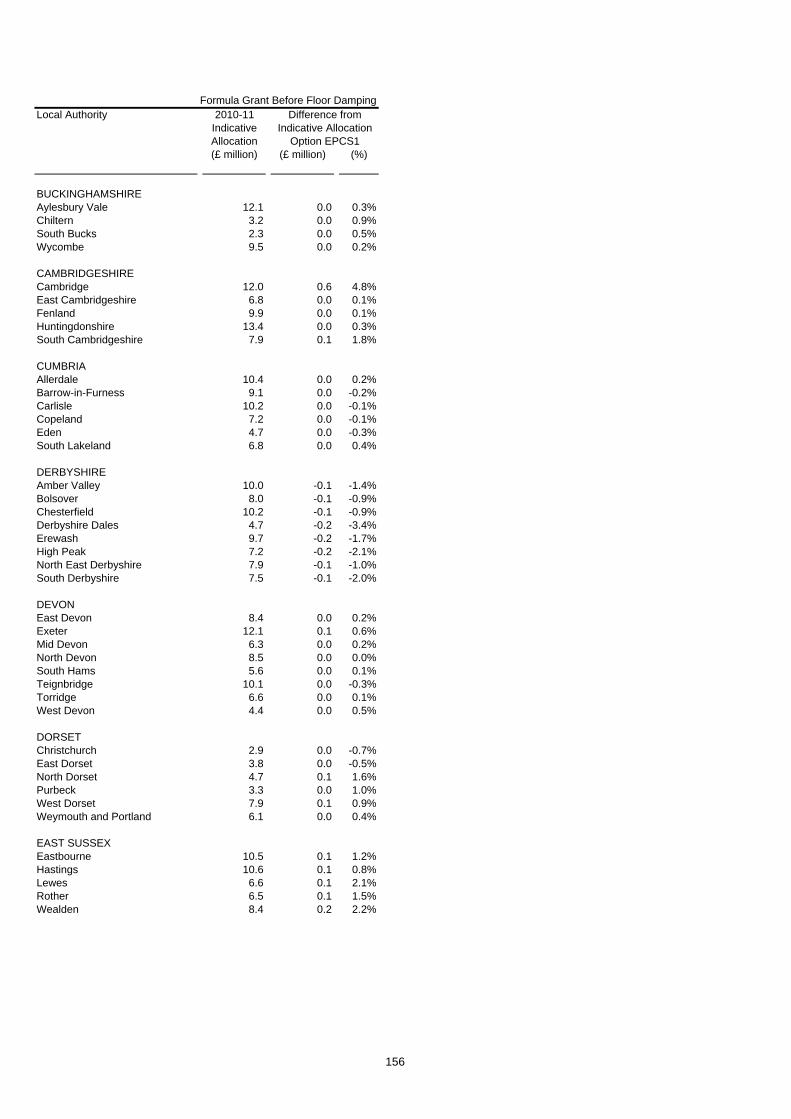
Formula Grant Before Floor DampingLocal Authority
(£ million) (£ million) (%)
Difference from Indicative Allocation
Option EPCS1
2010-11 Indicative Allocation
BUCKINGHAMSHIREAylesbury Vale 12.1 0.0 0.3%Chiltern 3.2 0.0 0.9%South Bucks 2.3 0.0 0.5%Wycombe 9.5 0.0 0.2%
CAMBRIDGESHIRECambridge 12.0 0.6 4.8%East Cambridgeshire 6.8 0.0 0.1%Fenland 9.9 0.0 0.1%Huntingdonshire 13.4 0.0 0.3%South Cambridgeshire 7.9 0.1 1.8%
CUMBRIAAllerdale 10.4 0.0 0.2%Barrow-in-Furness 9.1 0.0 -0.2%Carlisle 10.2 0.0 -0.1%Copeland 7.2 0.0 -0.1%Eden 4.7 0.0 -0.3%South Lakeland 6.8 0.0 0.4%
DERBYSHIREAmber Valley 10.0 -0.1 -1.4%Bolsover 8.0 -0.1 -0.9%Chesterfield 10.2 -0.1 -0.9%Derbyshire Dales 4.7 -0.2 -3.4%Erewash 9.7 -0.2 -1.7%High Peak 7.2 -0.2 -2.1%North East Derbyshire 7.9 -0.1 -1.0%South Derbyshire 7.5 -0.1 -2.0%
DEVONEast Devon 8.4 0.0 0.2%Exeter 12.1 0.1 0.6%Mid Devon 6.3 0.0 0.2%North Devon 8.5 0.0 0.0%South Hams 5.6 0.0 0.1%Teignbridge 10.1 0.0 -0.3%Torridge 6.6 0.0 0.1%West Devon 4.4 0.0 0.5%
DORSETChristchurch 2.9 0.0 -0.7%East Dorset 3.8 0.0 -0.5%North Dorset 4.7 0.1 1.6%Purbeck 3.3 0.0 1.0%West Dorset 7.9 0.1 0.9%Weymouth and Portland 6.1 0.0 0.4%
EAST SUSSEXEastbourne 10.5 0.1 1.2%Hastings 10.6 0.1 0.8%Lewes 6.6 0.1 2.1%Rother 6.5 0.1 1.5%Wealden 8.4 0.2 2.2%
156

Formula Grant Before Floor DampingLocal Authority
(£ million) (£ million) (%)
Difference from Indicative Allocation
Option EPCS1
2010-11 Indicative Allocation
ESSEXBasildon 16.1 0.0 -0.2%Braintree 10.6 0.0 0.0%Brentwood 4.4 0.0 -1.0%Castle Point 6.8 0.0 -0.5%Chelmsford 10.7 0.0 0.0%Colchester 13.1 0.0 0.3%Epping Forest 9.4 0.0 -0.5%Harlow 8.2 -0.1 -0.7%Maldon 4.6 0.0 -0.3%Rochford 5.2 0.0 -0.3%Tendring 14.6 0.0 -0.2%Uttlesford 3.9 0.0 0.5%
GLOUCESTERSHIRECheltenham 8.7 0.1 0.6%Cotswold 5.5 0.0 -0.4%Forest of Dean 7.0 0.0 -0.6%Gloucester 10.8 -0.1 -1.0%Stroud 7.3 0.0 -0.4%Tewkesbury 5.4 0.0 -0.8%
HAMPSHIREBasingstoke and Deane 10.3 0.0 -0.1%East Hampshire 5.9 0.0 0.7%Eastleigh 7.8 -0.1 -0.8%Fareham 6.1 0.0 0.0%Gosport 7.1 0.0 -0.1%Hart 3.9 0.0 -0.1%Havant 9.9 0.0 0.2%New Forest 11.8 0.0 0.0%Rushmoor 6.3 0.0 -0.4%Test Valley 7.3 0.0 -0.4%Winchester 6.7 0.0 -0.6%
HERTFORDSHIREBroxbourne 7.0 0.0 -0.6%Dacorum 9.5 0.1 0.6%East Hertfordshire 8.1 0.0 0.5%Hertsmere 6.8 0.1 0.8%North Hertfordshire 8.3 0.0 0.3%St Albans 7.0 0.0 -0.2%Stevenage 7.6 0.0 -0.4%Three Rivers 5.1 0.0 0.1%Watford 7.2 0.0 -0.6%Welwyn Hatfield 8.2 0.0 0.4%
KENTAshford 8.6 0.1 0.7%Canterbury 13.6 0.2 1.5%Dartford 7.6 0.0 -0.4%Dover 9.9 0.1 1.3%Gravesham 8.5 0.0 -0.1%Maidstone 9.0 -0.1 -0.6%Sevenoaks 6.1 0.0 -0.1%Shepway 10.1 0.1 0.7%Swale 12.2 0.0 0.2%Thanet 13.4 0.2 1.2%Tonbridge and Malling 6.5 0.0 -0.3%Tunbridge Wells 6.5 0.1 1.2%
157

Formula Grant Before Floor DampingLocal Authority
(£ million) (£ million) (%)
Difference from Indicative Allocation
Option EPCS1
2010-11 Indicative Allocation
LANCASHIREBurnley 11.8 -0.1 -1.0%Chorley 8.6 -0.2 -2.3%Fylde 6.0 -0.1 -1.2%Hyndburn 10.3 -0.1 -0.8%Lancaster 16.8 -0.1 -0.4%Pendle 11.2 -0.1 -0.5%Preston 15.8 -0.1 -0.5%Ribble Valley 4.3 0.0 -0.9%Rossendale 6.2 -0.1 -1.2%South Ribble 7.6 -0.1 -1.0%West Lancashire 9.6 -0.1 -1.4%Wyre 10.8 -0.1 -0.7%
LEICESTERSHIREBlaby 6.6 -0.1 -1.4%Charnwood 12.7 -0.1 -0.9%Harborough 5.6 -0.1 -1.2%Hinckley and Bosworth 7.6 -0.1 -1.6%Melton 4.0 0.0 -1.2%North West Leicestershire 7.3 -0.1 -1.2%Oadby and Wigston 4.7 0.0 -0.8%
LINCOLNSHIREBoston 7.4 0.0 -0.2%East Lindsey 17.9 0.0 -0.2%Lincoln 10.3 -0.1 -1.1%North Kesteven 9.0 0.0 -0.4%South Holland 9.3 0.0 -0.3%South Kesteven 10.2 -0.1 -0.5%West Lindsey 8.4 0.0 -0.5%
NORFOLKBreckland 11.6 0.0 0.0%Broadland 8.7 0.0 -0.5%Great Yarmouth 10.9 -0.1 -0.7%King's Lynn and West Norfolk 15.8 0.0 0.0%North Norfolk 9.1 0.0 0.1%Norwich 16.0 0.0 -0.2%South Norfolk 8.6 0.0 0.1%
NORTH YORKSHIRECraven 4.3 -0.1 -2.5%Hambleton 5.9 0.0 -0.5%Harrogate 11.5 -0.1 -0.6%Richmondshire 4.4 0.0 -1.1%Ryedale 4.7 0.0 -0.7%Scarborough 12.6 0.1 0.4%Selby 6.8 0.0 -0.6%
NORTHAMPTONSHIRECorby 5.6 -0.1 -1.1%Daventry 6.4 -0.1 -0.9%East Northamptonshire 6.9 0.0 -0.3%Kettering 7.4 0.0 -0.6%Northampton 18.9 -0.1 -0.3%South Northamptonshire 6.1 0.0 -0.3%Wellingborough 7.1 0.0 -0.7%
158

Formula Grant Before Floor DampingLocal Authority
(£ million) (£ million) (%)
Difference from Indicative Allocation
Option EPCS1
2010-11 Indicative Allocation
NOTTINGHAMSHIREAshfield 11.6 -0.1 -0.8%Bassetlaw 11.4 -0.1 -0.8%Broxtowe 9.1 -0.1 -0.6%Gedling 9.4 0.0 -0.5%Mansfield 10.3 -0.1 -0.7%Newark and Sherwood 10.5 -0.1 -1.1%Rushcliffe 7.3 0.0 0.2%
OXFORDSHIRECherwell 11.2 0.1 0.5%Oxford 16.9 0.6 3.6%South Oxfordshire 7.8 0.1 1.3%Vale of White Horse 7.2 0.1 1.9%West Oxfordshire 6.1 0.0 0.0%
SOMERSETMendip 8.5 0.0 -0.1%Sedgemoor 10.3 0.0 -0.4%South Somerset 11.2 0.0 0.2%Taunton Deane 8.9 0.0 0.5%West Somerset 3.3 0.0 -0.9%
STAFFORDSHIRECannock Chase 8.6 -0.1 -1.3%East Staffordshire 9.6 -0.1 -1.4%Lichfield 6.1 -0.1 -2.0%Newcastle-under-Lyme 11.3 -0.1 -1.1%South Staffordshire 7.2 -0.1 -1.3%Stafford 8.8 -0.1 -1.2%Staffordshire Moorlands 7.6 -0.3 -3.3%Tamworth 6.9 -0.2 -2.2%
SUFFOLKBabergh 6.4 0.0 -0.2%Forest Heath 5.5 0.0 0.8%Ipswich 11.9 0.0 -0.1%Mid Suffolk 6.2 0.0 0.0%St Edmundsbury 7.1 0.0 -0.6%Suffolk Coastal 8.4 0.0 0.5%Waveney 12.0 0.0 0.0%
SURREYElmbridge 6.5 0.0 0.7%Epsom and Ewell 4.0 0.0 -0.8%Guildford 8.6 0.0 0.5%Mole Valley 3.3 0.0 0.0%Reigate and Banstead 6.9 0.0 0.4%Runnymede 5.8 0.0 -0.8%Spelthorne 5.7 -0.1 -1.2%Surrey Heath 4.7 0.0 -0.2%Tandridge 4.0 0.0 0.3%Waverley 5.4 0.1 2.0%Woking 5.8 0.0 0.3%
WARWICKSHIRENorth Warwickshire 5.5 -0.1 -1.5%Nuneaton and Bedworth 11.4 -0.1 -0.8%Rugby 6.6 -0.1 -1.0%Stratford-on-Avon 6.9 -0.1 -1.5%Warwick 10.5 -0.1 -0.7%
159

Formula Grant Before Floor DampingLocal Authority
(£ million) (£ million) (%)
Difference from Indicative Allocation
Option EPCS1
2010-11 Indicative Allocation
WEST SUSSEXAdur 5.0 0.0 0.0%Arun 10.5 0.0 0.2%Chichester 5.9 0.0 0.1%Crawley 10.5 0.0 0.0%Horsham 6.0 0.0 0.6%Mid Sussex 5.3 0.1 1.1%Worthing 7.9 0.0 0.4%
WORCESTERSHIREBromsgrove 5.2 -0.1 -2.1%Malvern Hills 5.2 0.0 0.9%Redditch 6.4 0.0 -0.6%Worcester 7.8 -0.1 -1.1%Wychavon 8.0 -0.1 -0.7%Wyre Forest 8.1 -0.1 -1.0%
160

Formula Grant Before Floor DampingLocal Authority
(£ million) (£ million) (%)
Difference from Indicative Allocation
Option EPCS1
2010-11 Indicative Allocation
SHIRE POLICE AUTHORITIES
Avon & Somerset Police 197.6 -0.1 -0.1%Bedfordshire Police 76.6 0.0 -0.1%Cambridgeshire Police 86.2 -0.1 -0.1%Cheshire Police 114.1 -0.1 -0.1%Cleveland Police 99.0 0.0 0.0%
Cumbria Police 56.1 -0.1 -0.1%Derbyshire Police 120.7 -0.1 -0.1%Devon & Cornwall Police 191.7 -0.2 -0.1%Dorset Police 64.3 -0.1 -0.1%Durham Police 87.0 0.0 0.0%
Essex Police 187.3 -0.1 -0.1%Gloucestershire Police 58.5 -0.1 -0.1%Hampshire Police 215.0 -0.1 -0.1%Hertfordshire Police 128.9 0.0 0.0%Humberside Police 132.9 -0.1 0.0%
Kent Police 200.2 -0.1 0.0%Lancashire Police 212.3 -0.1 0.0%Leicestershire Police 124.2 -0.1 -0.1%Lincolnshire Police 69.0 -0.1 -0.2%Norfolk Police 88.5 -0.1 -0.1%
North Yorkshire Police 73.1 -0.1 -0.2%Northamptonshire Police 78.4 -0.1 -0.1%Nottinghamshire Police 152.7 -0.1 0.0%Staffordshire Police 125.1 -0.1 -0.1%Suffolk Police 71.0 -0.1 -0.1%
Surrey Police 101.3 0.0 0.0%Sussex Police 167.1 -0.1 -0.1%Thames Valley Police 248.5 -0.1 0.0%Warwickshire Police 56.1 0.0 -0.1%West Mercia Police 114.3 -0.2 -0.1%
Wiltshire Police 64.1 -0.1 -0.1%
161

Formula Grant Before Floor DampingLocal Authority
(£ million) (£ million) (%)
Difference from Indicative Allocation
Option EPCS1
2010-11 Indicative Allocation
SHIRE FIRE AUTHORITIES
Avon Fire 24.6 0.0 -0.1%Bedfordshire Fire 11.7 0.0 -0.2%Berkshire Fire Auhtority 13.0 0.0 0.0%Buckinghamshire Fire 9.1 0.0 -0.2%Cambridgeshire Fire 15.1 0.0 -0.1%
Cheshire Fire 19.3 0.0 -0.1%Cleveland Fire 21.7 0.0 0.1%Derbyshire Fire 20.6 0.0 -0.2%Devon and Somerset Fire 32.1 0.0 -0.1%Dorset Fire 11.1 0.0 -0.1%
Durham Fire 14.9 0.0 -0.1%East Sussex Fire 15.0 0.0 0.0%Essex Fire Auhtority 33.3 0.0 0.0%Hampshire Fire 29.9 0.0 -0.1%Hereford & Worcester Fire 10.8 0.0 -0.2%
Humberside Fire 28.2 0.0 0.0%Kent Fire 30.2 0.0 -0.1%Lancashire Fire 32.6 0.0 -0.1%Leicestershire Fire 19.2 0.0 -0.2%North Yorkshire Fire 11.6 0.0 -0.3%
Nottinghamshire Fire 26.3 0.0 -0.1%Shropshire Fire 8.6 0.0 -0.2%Staffordshire Fire 19.1 0.0 -0.2%Wiltshire Fire 9.7 0.0 -0.2%
162

Formula Grant Before Floor DampingLocal Authority
(£ million) (£ million) (%) (£ million) (%)
England 28,995.5 0.0 0.0% 0.0 0.0%
London area 6,153.4 0.0 0.0% 0.3 0.0%Metropolitan areas 8,340.7 -1.2 0.0% -2.4 0.0%Shire areas 14,499.1 1.2 0.0% 2.1 0.0%Isles of Scilly 2.3 0.0 0.0% 0.0 0.0%
Inner London boroughs incl. City 2,025.0 0.9 0.0% 0.1 0.0%Outer London boroughs 1,873.1 -1.6 -0.1% 0.1 0.0%London boroughs 3,898.1 -0.6 0.0% 0.2 0.0%GLA - all functions 2,255.3 0.6 0.0% 0.1 0.0%
Metropolitan districts 5,904.0 -1.3 0.0% -2.4 0.0%Metropolitan fire authorities 335.8 0.0 0.0% 0.0 0.0%Metropolitan police authorities 2,100.9 0.1 0.0% 0.0 0.0%
Shire unitaries with fire 425.6 1.7 0.4% 2.4 0.6%Shire unitaries without fire 4,099.3 -0.1 0.0% -0.5 0.0%Shire counties with fire 1,589.0 -1.0 -0.1% 0.4 0.0%Shire counties without fire 2,501.9 -1.3 -0.1% 0.4 0.0%Shire districts 1,654.0 2.7 0.2% -0.6 0.0%Combined fire authorities 467.7 -0.2 0.0% 0.0 0.0%Shire police authorities 3,761.6 -0.6 0.0% 0.0 0.0%
GO REGIONAL SUMMARY
South West GOR 2,267.3 1.1 0.0% 3.0 0.1%South East GOR 2,957.0 -3.4 -0.1% 0.4 0.0%London GOR 6,153.4 0.0 0.0% 0.3 0.0%Eastern GOR 2,437.8 -1.2 0.0% -0.6 0.0%East Midlands GOR 2,292.2 -0.3 0.0% 0.0 0.0%West Midlands GOR 3,349.9 -0.7 0.0% 0.0 0.0%Yorkshire and Humber GOR 3,199.2 0.9 0.0% 0.0 0.0%North East GOR 1,777.2 1.7 0.1% -0.1 0.0%North West GOR 4,561.4 1.9 0.0% -2.9 -0.1%
FLOOR DAMPING GROUPS
Education Authorities 18,418.0 -2.7 0.0% 0.5 0.0%Police Authorities 7,864.8 0.1 0.0% 0.1 0.0%Fire Authorities 1,056.5 -0.1 0.0% 0.0 0.0%Shire Districts 1,654.0 2.7 0.2% -0.6 0.0%
7 EPCS: Flood Defence and Coast Protection
2010-11 Indicative Allocation
Difference from 2010-11 Indicative Option EPCS2 Option EPCS3
163

Formula Grant Before Floor DampingLocal Authority
(£ million) (£ million) (%) (£ million) (%)
2010-11 Indicative Allocation
Difference from 2010-11 Indicative Option EPCS2 Option EPCS3
GREATER LONDON
City of London 91.1 0.1 0.1% 0.0 0.0%
Camden 171.0 0.1 0.0% 0.0 0.0%Greenwich 170.1 0.0 0.0% 0.0 0.0%Hackney 201.8 0.1 0.1% 0.0 0.0%Hammersmith and Fulham 94.3 0.0 0.0% 0.0 0.0%Islington 133.8 0.1 0.1% 0.0 0.0%Kensington and Chelsea 95.9 0.0 0.0% 0.0 0.0%
Lambeth 180.3 0.1 0.0% 0.0 0.0%Lewisham 174.9 0.1 0.0% 0.0 0.0%Southwark 210.2 0.1 0.0% 0.0 0.0%Tower Hamlets 224.3 0.1 0.1% 0.0 0.0%Wandsworth 98.6 0.0 0.0% 0.0 0.0%Westminster 178.8 0.1 0.1% 0.0 0.0%
Barking and Dagenham 108.2 0.0 0.0% 0.0 0.0%Barnet 97.9 -0.3 -0.3% 0.0 0.0%Bexley 64.5 0.0 -0.1% 0.0 0.0%Brent 157.0 -0.1 -0.1% 0.0 0.0%Bromley 45.7 -0.1 -0.1% 0.0 0.0%
Croydon 118.4 0.0 0.0% 0.0 0.0%Ealing 129.0 0.0 0.0% 0.0 0.0%Enfield 126.7 0.0 0.0% 0.0 0.0%Haringey 137.6 0.1 0.0% 0.0 0.0%Harrow 66.6 -0.5 -0.8% 0.0 0.0%
Havering 52.3 -0.1 -0.3% 0.0 0.0%Hillingdon 85.6 0.0 0.0% 0.0 0.0%Hounslow 77.3 -0.2 -0.3% 0.0 0.0%Kingston upon Thames 32.6 0.0 -0.2% 0.0 0.0%Merton 61.2 0.0 0.0% 0.0 0.0%
Newham 231.3 0.1 0.0% 0.0 0.0%Redbridge 102.6 -0.3 -0.3% 0.0 0.0%Richmond upon Thames 9.6 -0.1 -0.6% 0.0 0.0%Sutton 45.1 0.0 -0.1% 0.0 0.0%Waltham Forest 124.0 0.0 0.0% 0.0 0.0%
GLA - all functions 2,255.3 0.6 0.0% 0.1 0.0%
GLA - police 2,002.3 0.5 0.0% 0.1 0.0%GLA - fire 253.0 0.1 0.0% 0.0 0.0%
164

Formula Grant Before Floor DampingLocal Authority
(£ million) (£ million) (%) (£ million) (%)
2010-11 Indicative Allocation
Difference from 2010-11 Indicative Option EPCS2 Option EPCS3
GREATER MANCHESTERBolton 132.6 0.0 0.0% 0.0 0.0%Bury 67.5 -0.1 -0.1% 0.0 0.0%Manchester 346.1 0.0 0.0% 0.0 0.0%Oldham 127.6 0.0 0.0% 0.0 0.0%Rochdale 114.9 0.0 0.0% 0.0 0.0%Salford 131.2 0.0 0.0% 0.0 0.0%Stockport 85.2 0.0 -0.1% 0.0 0.0%Tameside 109.5 0.0 0.0% 0.0 0.0%Trafford 67.3 0.0 0.0% 0.0 0.0%Wigan 138.6 -0.1 -0.1% 0.0 0.0%Greater Manchester Fire 76.1 0.0 0.0% 0.0 0.0%Greater Manchester Police 485.7 0.0 0.0% 0.0 0.0%
MERSEYSIDEKnowsley 114.6 0.0 0.0% 0.0 0.0%Liverpool 318.0 0.1 0.0% 0.0 0.0%Sefton 127.6 -0.1 -0.1% -1.6 -1.2%St Helens 90.9 0.0 0.0% 0.0 0.0%Wirral 165.2 -0.6 -0.3% -0.3 -0.2%Merseyside Fire 46.1 0.0 0.0% 0.0 0.0%Merseyside Police 275.5 0.0 0.0% 0.0 0.0%
SOUTH YORKSHIREBarnsley 114.3 0.1 0.1% 0.0 0.0%Doncaster 149.1 0.1 0.0% 0.0 0.0%Rotherham 130.1 0.0 0.0% 0.0 0.0%Sheffield 280.0 0.1 0.0% 0.0 0.0%South Yorkshire Fire 37.4 0.0 0.0% 0.0 0.0%South Yorkshire Police 209.2 0.0 0.0% 0.0 0.0%
TYNE AND WEARGateshead 102.7 -0.1 -0.1% 0.0 0.0%Newcastle upon Tyne 157.2 0.0 0.0% 0.0 0.0%North Tyneside 87.4 0.0 0.0% 0.0 0.1%South Tyneside 89.3 0.0 0.0% 0.0 0.0%Sunderland 158.9 0.0 0.0% -0.5 -0.3%Tyne and Wear Fire 35.9 0.0 0.0% 0.0 0.0%Northumbria Police 219.9 0.0 0.0% 0.0 0.0%
WEST MIDLANDSBirmingham 698.9 -0.3 0.0% 0.0 0.0%Coventry 156.6 -0.1 -0.1% 0.0 0.0%Dudley 130.4 -0.1 -0.1% 0.0 0.0%Sandwell 190.3 0.0 0.0% 0.0 0.0%Solihull 49.1 0.0 0.0% 0.0 0.0%Walsall 142.3 0.0 0.0% 0.0 0.0%Wolverhampton 145.6 -0.1 0.0% 0.0 0.0%West Midlands Fire 81.6 0.0 0.0% 0.0 0.0%West Midlands Police 542.2 0.1 0.0% 0.0 0.0%
WEST YORKSHIREBradford 283.4 -0.4 -0.1% 0.0 0.0%Calderdale 84.1 0.0 0.0% 0.0 0.0%Kirklees 164.9 0.0 0.0% 0.0 0.0%Leeds 305.9 0.0 0.0% 0.0 0.0%Wakefield 146.7 0.0 0.0% 0.0 0.0%West Yorkshire Fire 58.7 0.0 0.0% 0.0 0.0%West Yorkshire Police 368.2 0.0 0.0% 0.0 0.0%
165

Formula Grant Before Floor DampingLocal Authority
(£ million) (£ million) (%) (£ million) (%)
2010-11 Indicative Allocation
Difference from 2010-11 Indicative Option EPCS2 Option EPCS3
ALL PURPOSE AUTHORITIES
Bath & North East Somerset 44.1 0.0 0.0% 0.0 0.0%Bedford 55.4 0.1 0.1% 0.0 0.0%Blackburn with Darwen 88.5 0.1 0.1% 0.0 0.0%Blackpool 86.9 0.0 0.0% -0.6 -0.7%Bournemouth 49.4 0.0 -0.1% 0.1 0.2%
Bracknell Forest 22.6 0.0 -0.1% 0.0 0.0%Brighton & Hove 89.8 0.0 0.0% -0.2 -0.2%Bristol 171.2 0.1 0.0% 0.0 0.0%Central Bedfordshire 51.9 0.0 0.0% 0.0 0.0%Cheshire East 64.5 0.0 0.0% 0.0 0.0%
Cheshire West & Chester 94.9 0.1 0.1% 0.0 0.0%Cornwall 227.6 0.4 0.2% 1.5 0.6%Darlington 40.1 0.0 0.0% 0.0 0.0%Derby 114.5 -0.2 -0.2% 0.0 0.0%Durham 238.7 0.6 0.2% 0.0 0.0%
East Riding of Yorkshire 109.2 0.0 0.0% 0.3 0.2%Halton 65.5 0.0 0.0% 0.0 0.0%Hartlepool 54.0 0.0 0.0% 0.0 -0.1%Herefordshire 61.2 0.1 0.2% 0.0 0.0%Isle of Wight Council 65.0 0.1 0.1% 0.6 1.0%
Kingston upon Hull 159.2 -0.1 0.0% 0.0 0.0%Leicester 188.4 -0.1 0.0% 0.0 0.0%Luton 94.6 0.0 0.0% 0.0 0.0%Medway 89.5 -0.1 -0.1% 0.0 0.0%Middlesbrough 85.4 -0.1 -0.1% 0.0 0.0%
Milton Keynes 91.6 0.0 0.0% 0.0 0.0%North East Lincolnshire 76.9 0.0 0.0% -0.1 -0.1%North Lincolnshire 66.3 0.0 0.1% 0.0 0.0%North Somerset 54.6 0.0 -0.1% 0.1 0.1%Northumberland 133.1 1.2 0.9% 0.3 0.2%
Nottingham 179.5 0.0 0.0% 0.0 0.0%Peterborough 80.9 -0.1 -0.1% 0.0 0.0%Plymouth 108.7 0.0 0.0% 0.2 0.2%Poole 25.6 -0.1 -0.4% 0.1 0.3%Portsmouth 87.8 0.0 0.0% -0.2 -0.2%
Reading 48.0 0.0 0.0% 0.0 0.0%Redcar and Cleveland 71.4 -0.1 -0.1% 0.1 0.1%Rutland 8.6 0.0 0.3% 0.0 0.0%Shropshire 97.4 0.5 0.5% 0.0 0.0%Slough 52.8 -0.2 -0.3% 0.0 0.0%
South Gloucestershire 64.0 -0.1 -0.1% 0.1 0.2%Southampton 101.2 0.0 0.0% -0.1 -0.1%Southend-on-Sea 62.3 0.0 0.0% 0.0 -0.1%Stockton-on-Tees 80.6 0.0 0.0% 0.0 0.0%Stoke-on-Trent 133.5 -0.1 -0.1% 0.0 0.0%
Swindon 43.7 0.0 0.0% 0.0 0.0%Telford and the Wrekin 76.0 -0.1 -0.2% 0.0 0.0%Thurrock 62.1 0.0 0.0% 0.0 0.0%Torbay 64.2 -0.1 -0.2% -0.3 -0.4%Warrington 52.7 0.0 -0.1% 0.0 0.0%
166
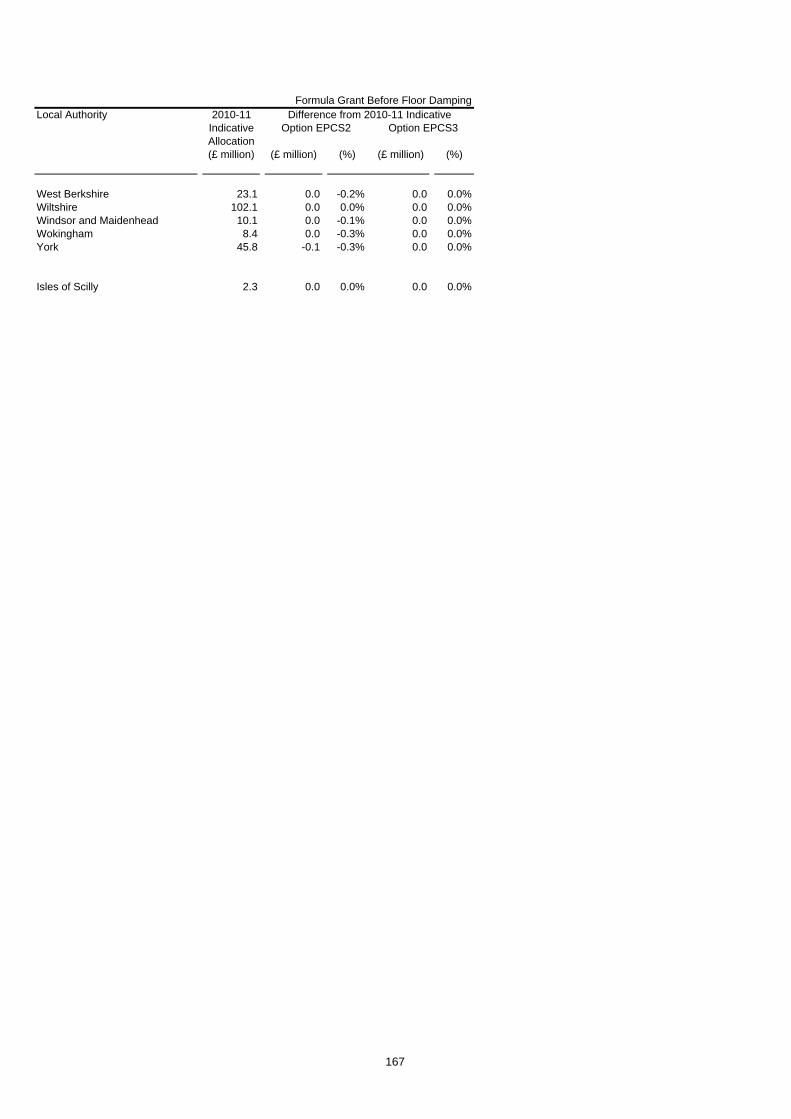
Formula Grant Before Floor DampingLocal Authority
(£ million) (£ million) (%) (£ million) (%)
2010-11 Indicative Allocation
Difference from 2010-11 Indicative Option EPCS2 Option EPCS3
West Berkshire 23.1 0.0 -0.2% 0.0 0.0%Wiltshire 102.1 0.0 0.0% 0.0 0.0%Windsor and Maidenhead 10.1 0.0 -0.1% 0.0 0.0%Wokingham 8.4 0.0 -0.3% 0.0 0.0%York 45.8 -0.1 -0.3% 0.0 0.0%
Isles of Scilly 2.3 0.0 0.0% 0.0 0.0%
167

Formula Grant Before Floor DampingLocal Authority
(£ million) (£ million) (%) (£ million) (%)
2010-11 Indicative Allocation
Difference from 2010-11 Indicative Option EPCS2 Option EPCS3
SHIRE COUNTIES
Buckinghamshire 43.5 -0.1 -0.2% 0.0 0.1%Cambridgeshire 113.1 -0.1 -0.1% 0.0 0.0%Cumbria 157.5 0.0 0.0% 0.0 0.0%Derbyshire 204.0 0.0 0.0% 0.0 0.0%Devon 176.4 0.0 0.0% 0.0 0.0%
Dorset 57.6 -0.1 -0.1% 0.0 0.1%East Sussex 105.4 0.0 0.0% 0.0 0.0%Essex 258.3 -0.1 -0.1% 0.1 0.0%Gloucestershire 124.0 -0.1 0.0% 0.0 0.0%Hampshire 126.6 -0.2 -0.2% 0.0 0.0%
Hertfordshire 148.3 -0.2 -0.1% 0.1 0.0%Kent 287.9 -0.1 0.0% 0.0 0.0%Lancashire 328.9 -0.1 0.0% 0.1 0.0%Leicestershire 107.5 -0.1 -0.1% 0.0 0.0%Lincolnshire 210.6 -0.1 0.0% 0.0 0.0%
Norfolk 260.4 0.0 0.0% 0.0 0.0%North Yorkshire 113.7 -0.1 -0.1% 0.0 0.0%Northamptonshire 162.2 -0.1 0.0% 0.0 0.0%Nottinghamshire 191.6 -0.1 0.0% 0.0 0.0%Oxfordshire 99.8 -0.1 -0.1% 0.0 0.0%
Somerset 120.7 0.0 0.0% 0.1 0.0%Staffordshire 169.7 -0.1 -0.1% 0.0 0.0%Suffolk 181.0 -0.1 0.0% 0.0 0.0%Surrey 60.1 -0.2 -0.4% 0.1 0.1%Warwickshire 96.6 -0.1 -0.1% 0.0 0.0%
West Sussex 88.4 -0.1 -0.2% 0.0 0.0%Worcestershire 96.9 -0.1 -0.1% 0.0 0.0%
168

Formula Grant Before Floor DampingLocal Authority
(£ million) (£ million) (%) (£ million) (%)
2010-11 Indicative Allocation
Difference from 2010-11 Indicative Option EPCS2 Option EPCS3
BUCKINGHAMSHIREAylesbury Vale 12.1 0.0 0.0% 0.0 -0.1%Chiltern 3.2 0.0 -0.2% 0.0 -0.2%South Bucks 2.3 0.0 0.4% 0.0 -0.2%Wycombe 9.5 0.0 -0.5% 0.0 -0.1%
CAMBRIDGESHIRECambridge 12.0 0.0 0.0% 0.0 -0.1%East Cambridgeshire 6.8 0.0 -0.3% 0.0 -0.1%Fenland 9.9 0.0 -0.2% 0.0 0.0%Huntingdonshire 13.4 0.0 -0.1% 0.0 -0.1%South Cambridgeshire 7.9 -0.1 -1.0% 0.0 -0.1%
CUMBRIAAllerdale 10.4 0.3 3.2% 0.1 1.2%Barrow-in-Furness 9.1 0.0 0.2% 0.0 0.2%Carlisle 10.2 0.2 2.2% 0.0 -0.1%Copeland 7.2 0.2 3.0% 0.1 1.1%Eden 4.7 0.6 12.2% 0.0 -0.1%South Lakeland 6.8 0.5 7.3% 0.0 0.2%
DERBYSHIREAmber Valley 10.0 -0.1 -1.1% 0.0 -0.1%Bolsover 8.0 0.0 0.1% 0.0 0.0%Chesterfield 10.2 0.0 -0.4% 0.0 0.0%Derbyshire Dales 4.7 0.1 1.7% 0.0 -0.1%Erewash 9.7 0.0 0.2% 0.0 -0.1%High Peak 7.2 0.2 2.4% 0.0 -0.1%North East Derbyshire 7.9 0.0 0.5% 0.0 -0.1%South Derbyshire 7.5 0.0 0.3% 0.0 -0.1%
DEVONEast Devon 8.4 0.1 1.2% 0.1 1.2%Exeter 12.1 -0.1 -0.8% 0.0 0.0%Mid Devon 6.3 0.2 3.6% 0.0 -0.1%North Devon 8.5 0.2 2.6% 0.3 3.3%South Hams 5.6 0.1 2.5% 0.2 3.5%Teignbridge 10.1 -0.1 -0.9% 0.0 0.4%Torridge 6.6 0.2 3.4% 0.1 1.9%West Devon 4.4 0.3 6.0% 0.0 -0.1%
DORSETChristchurch 2.9 0.0 -1.2% -0.3 -11.2%East Dorset 3.8 0.0 0.5% 0.0 -0.1%North Dorset 4.7 0.1 1.2% 0.0 -0.1%Purbeck 3.3 0.1 2.6% 0.3 10.4%West Dorset 7.9 -0.2 -2.1% -0.1 -0.8%Weymouth and Portland 6.1 -0.1 -1.0% 0.1 1.4%
EAST SUSSEXEastbourne 10.5 0.0 -0.1% -0.2 -1.5%Hastings 10.6 0.0 -0.2% 0.1 1.0%Lewes 6.6 0.0 -0.2% 0.1 1.3%Rother 6.5 0.1 1.0% 0.1 1.7%Wealden 8.4 0.1 0.9% 0.0 -0.4%
169

Formula Grant Before Floor DampingLocal Authority
(£ million) (£ million) (%) (£ million) (%)
2010-11 Indicative Allocation
Difference from 2010-11 Indicative Option EPCS2 Option EPCS3
ESSEXBasildon 16.1 0.0 0.0% 0.0 -0.1%Braintree 10.6 0.0 -0.1% 0.0 -0.1%Brentwood 4.4 -0.1 -3.1% 0.0 -0.1%Castle Point 6.8 0.0 -0.5% 0.0 -0.1%Chelmsford 10.7 0.0 0.4% 0.0 -0.1%Colchester 13.1 0.0 0.2% 0.0 -0.1%Epping Forest 9.4 -0.3 -3.1% 0.0 -0.1%Harlow 8.2 0.0 0.0% 0.0 0.0%Maldon 4.6 0.1 1.3% 0.0 -0.1%Rochford 5.2 0.0 0.6% 0.0 -0.1%Tendring 14.6 0.0 0.3% -0.7 -4.5%Uttlesford 3.9 0.1 1.4% 0.0 -0.1%
GLOUCESTERSHIRECheltenham 8.7 0.0 -0.2% 0.0 -0.1%Cotswold 5.5 0.1 1.9% 0.0 -0.1%Forest of Dean 7.0 0.1 0.9% 0.2 2.8%Gloucester 10.8 0.0 -0.4% 0.0 -0.1%Stroud 7.3 0.0 0.4% 0.1 1.0%Tewkesbury 5.4 0.0 -0.2% 0.0 -0.1%
HAMPSHIREBasingstoke and Deane 10.3 -0.1 -1.3% 0.0 -0.1%East Hampshire 5.9 -0.1 -0.9% 0.0 -0.1%Eastleigh 7.8 0.0 -0.5% 0.0 0.3%Fareham 6.1 0.0 -0.3% 0.0 0.8%Gosport 7.1 0.0 -0.1% 0.0 -0.2%Hart 3.9 0.0 -0.3% 0.0 -0.1%Havant 9.9 0.0 -0.2% -0.1 -1.0%New Forest 11.8 0.0 -0.3% -0.3 -2.1%Rushmoor 6.3 0.0 -0.3% 0.0 -0.1%Test Valley 7.3 0.0 0.6% 0.0 -0.1%Winchester 6.7 0.0 -0.1% 0.0 -0.1%
HERTFORDSHIREBroxbourne 7.0 0.0 -0.5% 0.0 -0.1%Dacorum 9.5 0.0 -0.1% 0.0 -0.1%East Hertfordshire 8.1 -0.1 -1.4% 0.0 -0.1%Hertsmere 6.8 -0.5 -6.8% 0.0 -0.1%North Hertfordshire 8.3 0.0 -0.3% 0.0 -0.1%St Albans 7.0 0.0 -0.1% 0.0 -0.1%Stevenage 7.6 0.0 0.0% 0.0 -0.1%Three Rivers 5.1 0.0 -0.2% 0.0 -0.1%Watford 7.2 0.0 -0.1% 0.0 -0.1%Welwyn Hatfield 8.2 0.0 0.1% 0.0 -0.1%
KENTAshford 8.6 0.1 0.9% 0.0 -0.1%Canterbury 13.6 0.0 0.1% -0.2 -1.5%Dartford 7.6 -0.1 -1.7% 0.0 -0.1%Dover 9.9 0.0 0.0% 0.1 1.4%Gravesham 8.5 0.0 -0.1% 0.0 -0.1%Maidstone 9.0 0.0 0.3% 0.0 -0.1%Sevenoaks 6.1 0.0 0.5% 0.0 -0.1%Shepway 10.1 0.0 -0.1% 0.3 2.6%Swale 12.2 0.0 0.1% 0.2 1.6%Thanet 13.4 0.0 0.0% 0.1 0.5%Tonbridge and Malling 6.5 -0.1 -1.0% 0.0 -0.1%Tunbridge Wells 6.5 0.0 0.4% 0.0 -0.1%
170

Formula Grant Before Floor DampingLocal Authority
(£ million) (£ million) (%) (£ million) (%)
2010-11 Indicative Allocation
Difference from 2010-11 Indicative Option EPCS2 Option EPCS3
LANCASHIREBurnley 11.8 0.0 0.2% 0.0 0.0%Chorley 8.6 0.1 0.6% 0.0 -0.1%Fylde 6.0 0.0 0.6% 0.0 -0.6%Hyndburn 10.3 0.0 0.1% 0.0 0.0%Lancaster 16.8 0.1 0.5% -0.4 -2.2%Pendle 11.2 0.0 -0.1% 0.0 0.0%Preston 15.8 0.0 0.1% 0.0 0.0%Ribble Valley 4.3 0.2 4.8% 0.0 -0.1%Rossendale 6.2 0.0 -0.5% 0.0 -0.1%South Ribble 7.6 0.0 0.5% 0.0 -0.1%West Lancashire 9.6 0.1 1.0% 0.0 -0.1%Wyre 10.8 0.0 -0.2% -0.3 -3.2%
LEICESTERSHIREBlaby 6.6 -0.1 -1.0% 0.0 -0.1%Charnwood 12.7 -0.2 -1.7% 0.0 -0.1%Harborough 5.6 0.0 0.5% 0.0 -0.1%Hinckley and Bosworth 7.6 0.0 0.0% 0.0 -0.1%Melton 4.0 0.0 0.2% 0.0 -0.1%North West Leicestershire 7.3 0.0 0.2% 0.0 -0.1%Oadby and Wigston 4.7 0.0 -0.2% 0.0 -0.1%
LINCOLNSHIREBoston 7.4 0.0 0.0% 0.0 0.0%East Lindsey 17.9 0.2 1.0% 0.0 0.0%Lincoln 10.3 0.0 -0.1% 0.0 0.0%North Kesteven 9.0 0.1 0.7% 0.0 -0.1%South Holland 9.3 0.0 0.0% 0.0 0.0%South Kesteven 10.2 0.0 0.3% 0.0 -0.1%West Lindsey 8.4 0.1 1.4% 0.0 -0.1%
NORFOLKBreckland 11.6 0.1 1.0% 0.0 -0.1%Broadland 8.7 0.0 0.1% 0.0 -0.1%Great Yarmouth 10.9 0.0 -0.2% 0.3 2.3%King's Lynn and West Norfolk 15.8 0.0 0.2% 0.0 0.0%North Norfolk 9.1 0.0 0.2% 0.3 3.4%Norwich 16.0 0.0 -0.1% 0.0 0.0%South Norfolk 8.6 0.1 1.3% 0.0 -0.1%
NORTH YORKSHIRECraven 4.3 0.3 6.8% 0.0 -0.1%Hambleton 5.9 0.1 2.4% 0.0 -0.1%Harrogate 11.5 0.2 2.0% 0.0 -0.1%Richmondshire 4.4 0.4 8.8% 0.0 -0.1%Ryedale 4.7 0.2 4.2% 0.0 -0.1%Scarborough 12.6 0.1 0.7% 0.0 0.0%Selby 6.8 0.0 0.3% 0.0 -0.1%
NORTHAMPTONSHIRECorby 5.6 0.0 0.0% 0.0 0.0%Daventry 6.4 0.1 1.4% 0.0 -0.1%East Northamptonshire 6.9 0.1 1.0% 0.0 -0.1%Kettering 7.4 0.0 0.1% 0.0 -0.1%Northampton 18.9 0.0 -0.1% 0.0 -0.1%South Northamptonshire 6.1 0.0 0.5% 0.0 -0.1%Wellingborough 7.1 0.0 -0.1% 0.0 -0.1%
171

Formula Grant Before Floor DampingLocal Authority
(£ million) (£ million) (%) (£ million) (%)
2010-11 Indicative Allocation
Difference from 2010-11 Indicative Option EPCS2 Option EPCS3
NOTTINGHAMSHIREAshfield 11.6 0.0 -0.3% 0.0 0.0%Bassetlaw 11.4 0.1 0.5% 0.0 0.0%Broxtowe 9.1 -0.1 -0.8% 0.0 -0.1%Gedling 9.4 -0.1 -0.7% 0.0 -0.1%Mansfield 10.3 0.0 -0.1% 0.0 0.0%Newark and Sherwood 10.5 0.0 0.4% 0.0 -0.1%Rushcliffe 7.3 0.0 -0.1% 0.0 -0.1%
OXFORDSHIRECherwell 11.2 0.0 0.0% 0.0 -0.1%Oxford 16.9 -0.1 -0.4% 0.0 0.0%South Oxfordshire 7.8 0.0 0.4% 0.0 -0.1%Vale of White Horse 7.2 0.0 0.2% 0.0 -0.1%West Oxfordshire 6.1 0.1 1.1% 0.0 -0.1%
SOMERSETMendip 8.5 0.1 1.1% 0.0 -0.1%Sedgemoor 10.3 0.0 -0.2% 0.0 -0.2%South Somerset 11.2 0.1 1.2% 0.0 -0.1%Taunton Deane 8.9 -0.1 -0.6% 0.0 -0.1%West Somerset 3.3 0.2 4.5% 0.1 4.0%
STAFFORDSHIRECannock Chase 8.6 0.0 -0.2% 0.0 -0.1%East Staffordshire 9.6 0.0 0.2% 0.0 -0.1%Lichfield 6.1 0.0 0.7% 0.0 -0.1%Newcastle-under-Lyme 11.3 -0.1 -1.0% 0.0 -0.1%South Staffordshire 7.2 0.0 0.3% 0.0 -0.1%Stafford 8.8 0.0 -0.2% 0.0 -0.1%Staffordshire Moorlands 7.6 0.1 1.7% 0.0 -0.1%Tamworth 6.9 -0.1 -1.3% 0.0 -0.1%
SUFFOLKBabergh 6.4 0.1 1.0% 0.0 -0.1%Forest Heath 5.5 0.0 0.2% 0.0 -0.1%Ipswich 11.9 -0.1 -0.6% 0.0 -0.1%Mid Suffolk 6.2 0.1 1.5% 0.0 -0.1%St Edmundsbury 7.1 0.1 0.9% 0.0 -0.1%Suffolk Coastal 8.4 0.1 0.8% -0.1 -1.4%Waveney 12.0 0.0 -0.3% -0.4 -2.9%
SURREYElmbridge 6.5 -0.1 -1.1% 0.0 -0.1%Epsom and Ewell 4.0 0.0 -0.3% 0.0 -0.1%Guildford 8.6 -0.2 -2.2% 0.0 -0.1%Mole Valley 3.3 0.0 1.2% 0.0 -0.2%Reigate and Banstead 6.9 -0.1 -1.6% 0.0 -0.1%Runnymede 5.8 -0.4 -6.4% 0.0 -0.1%Spelthorne 5.7 -0.1 -1.4% 0.0 -0.1%Surrey Heath 4.7 -0.5 -10.1% 0.0 -0.1%Tandridge 4.0 0.0 0.2% 0.0 -0.1%Waverley 5.4 0.1 2.5% 0.0 -0.1%Woking 5.8 -0.2 -4.2% 0.0 -0.1%
WARWICKSHIRENorth Warwickshire 5.5 0.0 0.8% 0.0 -0.1%Nuneaton and Bedworth 11.4 0.0 0.1% 0.0 -0.1%Rugby 6.6 0.0 -0.5% 0.0 -0.1%Stratford-on-Avon 6.9 0.0 0.1% 0.0 -0.1%Warwick 10.5 -0.1 -0.7% 0.0 -0.1%
172

Formula Grant Before Floor DampingLocal Authority
(£ million) (£ million) (%) (£ million) (%)
2010-11 Indicative Allocation
Difference from 2010-11 Indicative Option EPCS2 Option EPCS3
WEST SUSSEXAdur 5.0 0.0 -0.2% 0.0 -0.2%Arun 10.5 -0.1 -0.7% 0.0 0.0%Chichester 5.9 0.1 1.0% -0.1 -1.0%Crawley 10.5 -0.2 -1.5% 0.0 0.0%Horsham 6.0 -0.2 -2.9% 0.0 -0.1%Mid Sussex 5.3 0.0 -0.8% 0.0 -0.1%Worthing 7.9 0.0 -0.6% 0.0 0.3%
WORCESTERSHIREBromsgrove 5.2 0.0 0.6% 0.0 -0.1%Malvern Hills 5.2 0.1 1.5% 0.0 -0.1%Redditch 6.4 -0.1 -1.4% 0.0 -0.1%Worcester 7.8 0.0 -0.1% 0.0 -0.1%Wychavon 8.0 -0.1 -1.1% 0.0 -0.1%Wyre Forest 8.1 0.0 0.2% 0.0 -0.1%
173

Formula Grant Before Floor DampingLocal Authority
(£ million) (£ million) (%) (£ million) (%)
2010-11 Indicative Allocation
Difference from 2010-11 Indicative Option EPCS2 Option EPCS3
SHIRE POLICE AUTHORITIES
Avon & Somerset Police 197.6 0.0 0.0% 0.0 0.0%Bedfordshire Police 76.6 0.0 0.0% 0.0 0.0%Cambridgeshire Police 86.2 0.0 0.0% 0.0 0.0%Cheshire Police 114.1 0.0 0.0% 0.0 0.0%Cleveland Police 99.0 0.0 0.0% 0.0 0.0%
Cumbria Police 56.1 0.0 0.0% 0.0 0.0%Derbyshire Police 120.7 0.0 0.0% 0.0 0.0%Devon & Cornwall Police 191.7 0.0 0.0% 0.0 0.0%Dorset Police 64.3 0.0 0.0% 0.0 0.0%Durham Police 87.0 0.0 0.0% 0.0 0.0%
Essex Police 187.3 0.0 0.0% 0.0 0.0%Gloucestershire Police 58.5 0.0 0.0% 0.0 0.0%Hampshire Police 215.0 0.0 0.0% 0.0 0.0%Hertfordshire Police 128.9 0.0 0.0% 0.0 0.0%Humberside Police 132.9 0.0 0.0% 0.0 0.0%
Kent Police 200.2 0.0 0.0% 0.0 0.0%Lancashire Police 212.3 0.0 0.0% 0.0 0.0%Leicestershire Police 124.2 0.0 0.0% 0.0 0.0%Lincolnshire Police 69.0 0.0 0.0% 0.0 0.0%Norfolk Police 88.5 0.0 0.0% 0.0 0.0%
North Yorkshire Police 73.1 0.0 0.0% 0.0 0.0%Northamptonshire Police 78.4 0.0 0.0% 0.0 0.0%Nottinghamshire Police 152.7 0.0 0.0% 0.0 0.0%Staffordshire Police 125.1 0.0 0.0% 0.0 0.0%Suffolk Police 71.0 0.0 0.0% 0.0 0.0%
Surrey Police 101.3 0.0 0.0% 0.0 0.0%Sussex Police 167.1 0.0 0.0% 0.0 0.0%Thames Valley Police 248.5 0.0 0.0% 0.0 0.0%Warwickshire Police 56.1 0.0 0.0% 0.0 0.0%West Mercia Police 114.3 0.0 0.0% 0.0 0.0%
Wiltshire Police 64.1 0.0 0.0% 0.0 0.0%
174

Formula Grant Before Floor DampingLocal Authority
(£ million) (£ million) (%) (£ million) (%)
2010-11 Indicative Allocation
Difference from 2010-11 Indicative Option EPCS2 Option EPCS3
SHIRE FIRE AUTHORITIES
Avon Fire 24.6 0.0 0.0% 0.0 0.0%Bedfordshire Fire 11.7 0.0 -0.1% 0.0 0.0%Berkshire Fire Auhtority 13.0 0.0 0.0% 0.0 0.0%Buckinghamshire Fire 9.1 0.0 -0.1% 0.0 0.0%Cambridgeshire Fire 15.1 0.0 0.0% 0.0 0.0%
Cheshire Fire 19.3 0.0 0.0% 0.0 0.0%Cleveland Fire 21.7 0.0 0.0% 0.0 0.0%Derbyshire Fire 20.6 0.0 -0.1% 0.0 0.0%Devon and Somerset Fire 32.1 0.0 0.0% 0.0 0.0%Dorset Fire 11.1 0.0 0.0% 0.0 0.0%
Durham Fire 14.9 0.0 0.0% 0.0 0.0%East Sussex Fire 15.0 0.0 0.0% 0.0 0.0%Essex Fire Auhtority 33.3 0.0 0.0% 0.0 0.0%Hampshire Fire 29.9 0.0 0.0% 0.0 0.0%Hereford & Worcester Fire 10.8 0.0 -0.1% 0.0 0.0%
Humberside Fire 28.2 0.0 0.0% 0.0 0.0%Kent Fire 30.2 0.0 0.0% 0.0 0.0%Lancashire Fire 32.6 0.0 -0.1% 0.0 0.0%Leicestershire Fire 19.2 0.0 -0.1% 0.0 0.0%North Yorkshire Fire 11.6 0.0 -0.1% 0.0 0.0%
Nottinghamshire Fire 26.3 0.0 0.0% 0.0 0.0%Shropshire Fire 8.6 0.0 -0.1% 0.0 0.0%Staffordshire Fire 19.1 0.0 -0.1% 0.0 0.0%Wiltshire Fire 9.7 0.0 -0.1% 0.0 0.0%
175

176
Chapter 8 Area Cost Adjustment 1. The Area Cost Adjustment (ACA) is the element of the relative needs formulae which reflects particular variations in the costs of service delivery around the country.
2. The ACA has two components. By far the largest component is the Labour Cost Adjustment (LCA), which takes account of differences in pay across the country. It is calculated using local wage information from the Annual Survey of Hours and Earnings (ASHE). The second element is the Rates Cost Adjustment (RCA), which reflects the differences in the cost of business rates on council premises across the country.
3. The current ACA was introduced in the 2008-09 Local Government Finance Settlement. It reflects pay variation across the country at the scale of the former county level. It is subject to a lower limit, below which all authorities receive the same ACA factor of 1.0. This reflects the fact that in areas of relatively low pay, many council employees are still paid according to national pay scales.
The Rates Cost Adjustment 4. The Rates Cost Adjustment (RCA) takes account of the differences in the cost of business rates on council premises across the country. Currently, this adjustment receives a weight of between 0% and 2% in the ACA calculation. We do not propose to make any changes to the RCA methodology.
The Labour Cost Adjustment Option ACA 1 Adjustment to the LCA weights 5. The current weight given to the Labour Cost Adjustment (LCA) in the ACA calculation varies from 60% for Highways Maintenance to 85% for Police and Fire Services. These weights were derived using wage and expenditure data from the 2005-06 Subjective Analysis Return (“SAR”) and the 2005-06 Trading Account Services (“TSR”) returns. Judgement was needed to determine the proportion of labour costs for many contracted out services provided by third parties as these payments are not broken down by labour and non-labour costs in the SAR or TSR. As part of the review it was agreed that the LCA weights would be examined, particularly the assumptions regarding third party payments.
6. Estimating the proportion of local authority expenditure on wage and other labour costs is not straightforward. We have data on expenditure on their own staff from the SAR and the TSR, but we do not have a comprehensive source of information on staff costs for contracted out

177
services. To estimate the labour share of third party contractors, Company Account estimates of the labour share in the various service groups have been used. This provides an evidence based approach to determining the labour share of third party contractors rather than the judgement based approach used previously. Details of the approach are given in SWG paper SWG/09/46 ‘Finalising the LCA Weights’ at http://www.local.communities.gov.uk/finance/1011/swg/SWG-09-46.pdf.
7. The table below presents the LCA weights currently used and those proposed. The main differences occur in the services which use a significant share of third party labour: Highway Maintenance, Children and Younger Adults’ Social Services and Older People’s Social Services. Due to limited third party labour in Education, Police and Fire Services these labour weights remain unchanged.
Current LCA
Proposed LCA
Education 80% 80%
Highway Maintenance 60% 40%
Children and Younger Adults’ Social Services 75% 65%
Older People’s Social Services 80% 65%
Police 85% 85%
Fire 85% 85%
Environmental, Cultural and Protective Services 65% 60%
Questions
Question 14: Do you agree with the proposal to update the weights given to the labour cost adjustment (ACA 1)?

Formula Grant Before Floor DampingLocal Authority
(£ million) (£ million) (%)
England 28,995.5 0.0 0.0%
London area 6,153.4 -100.5 -1.6%Metropolitan areas 8,340.7 19.7 0.2%Shire areas 14,499.1 80.8 0.6%Isles of Scilly 2.3 0.0 0.0%
Inner London boroughs incl. City 2,025.0 -67.3 -3.3%Outer London boroughs 1,873.1 -27.5 -1.5%London boroughs 3,898.1 -94.8 -2.4%GLA - all functions 2,255.3 -5.7 -0.3%
Metropolitan districts 5,904.0 20.8 0.4%Metropolitan fire authorities 335.8 0.0 0.0%Metropolitan police authorities 2,100.9 -1.1 -0.1%
Shire unitaries with fire 425.6 3.0 0.7%Shire unitaries without fire 4,099.3 19.4 0.5%Shire counties with fire 1,589.0 13.3 0.8%Shire counties without fire 2,501.9 36.3 1.4%Shire districts 1,654.0 2.0 0.1%Combined fire authorities 467.7 1.1 0.2%Shire police authorities 3,761.6 5.8 0.2%
GO REGIONAL SUMMARY
South West GOR 2,267.3 17.6 0.8%South East GOR 2,957.0 3.5 0.1%London GOR 6,153.4 -100.5 -1.6%Eastern GOR 2,437.8 8.1 0.3%East Midlands GOR 2,292.2 16.9 0.7%West Midlands GOR 3,349.9 14.7 0.4%Yorkshire and Humber GOR 3,199.2 16.6 0.5%North East GOR 1,777.2 7.6 0.4%North West GOR 4,561.4 15.6 0.3%
FLOOR DAMPING GROUPS
Education Authorities 18,418.0 -2.1 0.0%Police Authorities 7,864.8 0.1 0.0%Fire Authorities 1,056.5 0.0 0.0%Shire Districts 1,654.0 2.0 0.1%
Area Cost: Reducing Labour Cost Weights
Difference from Indicative Allocations
2010-11 Indicative
Allocations Option ACA1
178
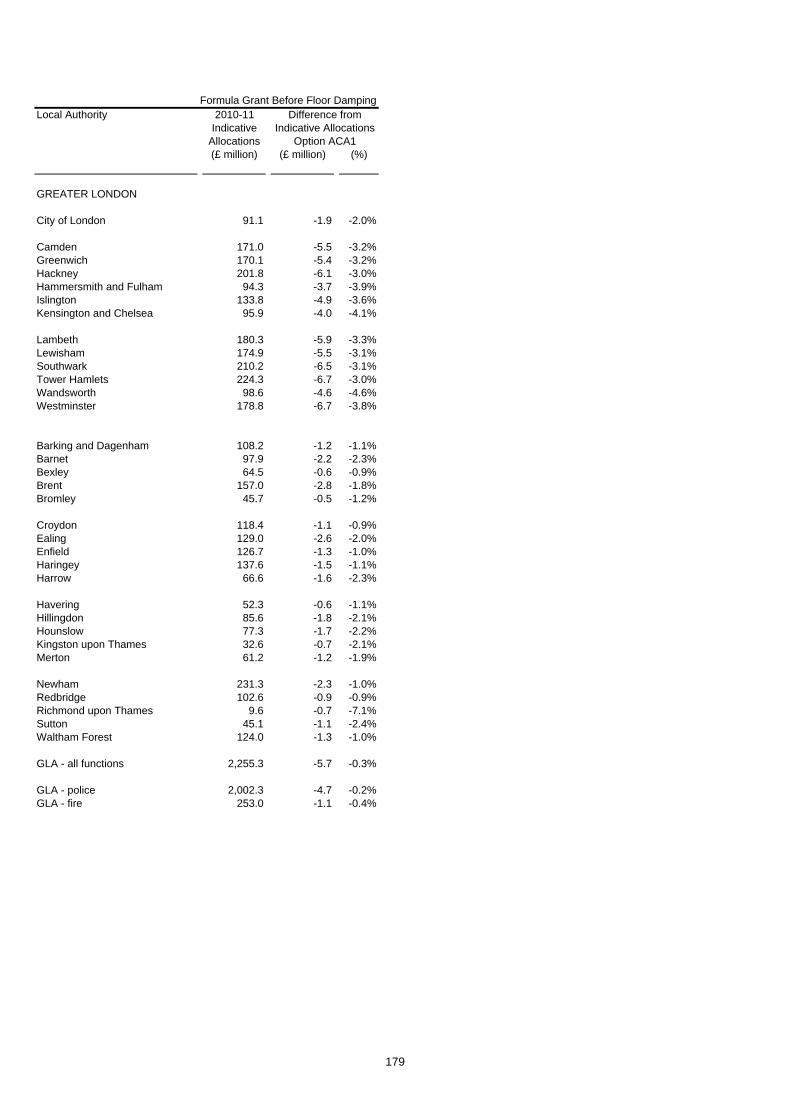
Formula Grant Before Floor DampingLocal Authority
(£ million) (£ million) (%)
Difference from Indicative Allocations
2010-11 Indicative
Allocations Option ACA1
GREATER LONDON
City of London 91.1 -1.9 -2.0%
Camden 171.0 -5.5 -3.2%Greenwich 170.1 -5.4 -3.2%Hackney 201.8 -6.1 -3.0%Hammersmith and Fulham 94.3 -3.7 -3.9%Islington 133.8 -4.9 -3.6%Kensington and Chelsea 95.9 -4.0 -4.1%
Lambeth 180.3 -5.9 -3.3%Lewisham 174.9 -5.5 -3.1%Southwark 210.2 -6.5 -3.1%Tower Hamlets 224.3 -6.7 -3.0%Wandsworth 98.6 -4.6 -4.6%Westminster 178.8 -6.7 -3.8%
Barking and Dagenham 108.2 -1.2 -1.1%Barnet 97.9 -2.2 -2.3%Bexley 64.5 -0.6 -0.9%Brent 157.0 -2.8 -1.8%Bromley 45.7 -0.5 -1.2%
Croydon 118.4 -1.1 -0.9%Ealing 129.0 -2.6 -2.0%Enfield 126.7 -1.3 -1.0%Haringey 137.6 -1.5 -1.1%Harrow 66.6 -1.6 -2.3%
Havering 52.3 -0.6 -1.1%Hillingdon 85.6 -1.8 -2.1%Hounslow 77.3 -1.7 -2.2%Kingston upon Thames 32.6 -0.7 -2.1%Merton 61.2 -1.2 -1.9%
Newham 231.3 -2.3 -1.0%Redbridge 102.6 -0.9 -0.9%Richmond upon Thames 9.6 -0.7 -7.1%Sutton 45.1 -1.1 -2.4%Waltham Forest 124.0 -1.3 -1.0%
GLA - all functions 2,255.3 -5.7 -0.3%
GLA - police 2,002.3 -4.7 -0.2%GLA - fire 253.0 -1.1 -0.4%
179

Formula Grant Before Floor DampingLocal Authority
(£ million) (£ million) (%)
Difference from Indicative Allocations
2010-11 Indicative
Allocations Option ACA1
GREATER MANCHESTERBolton 132.6 0.3 0.2%Bury 67.5 0.4 0.6%Manchester 346.1 -0.4 -0.1%Oldham 127.6 0.1 0.1%Rochdale 114.9 0.2 0.1%Salford 131.2 0.0 0.0%Stockport 85.2 0.7 0.8%Tameside 109.5 0.2 0.2%Trafford 67.3 0.5 0.7%Wigan 138.6 0.4 0.3%Greater Manchester Fire 76.1 0.0 0.0%Greater Manchester Police 485.7 -0.3 -0.1%
MERSEYSIDEKnowsley 114.6 0.1 0.1%Liverpool 318.0 0.5 0.1%Sefton 127.6 0.8 0.6%St Helens 90.9 0.5 0.5%Wirral 165.2 0.8 0.5%Merseyside Fire 46.1 -0.1 -0.2%Merseyside Police 275.5 -0.3 -0.1%
SOUTH YORKSHIREBarnsley 114.3 0.7 0.6%Doncaster 149.1 0.9 0.6%Rotherham 130.1 0.8 0.6%Sheffield 280.0 1.6 0.6%South Yorkshire Fire 37.4 0.0 0.1%South Yorkshire Police 209.2 0.1 0.0%
TYNE AND WEARGateshead 102.7 0.5 0.5%Newcastle upon Tyne 157.2 0.6 0.4%North Tyneside 87.4 0.7 0.8%South Tyneside 89.3 0.4 0.4%Sunderland 158.9 0.7 0.5%Tyne and Wear Fire 35.9 0.0 -0.1%Northumbria Police 219.9 0.1 0.0%
WEST MIDLANDSBirmingham 698.9 0.8 0.1%Coventry 156.6 0.6 0.4%Dudley 130.4 0.8 0.6%Sandwell 190.3 0.2 0.1%Solihull 49.1 0.7 1.4%Walsall 142.3 0.4 0.3%Wolverhampton 145.6 0.3 0.2%West Midlands Fire 81.6 0.0 0.0%West Midlands Police 542.2 -0.6 -0.1%
WEST YORKSHIREBradford 283.4 0.8 0.3%Calderdale 84.1 0.5 0.6%Kirklees 164.9 1.1 0.7%Leeds 305.9 2.1 0.7%Wakefield 146.7 0.8 0.5%West Yorkshire Fire 58.7 0.1 0.1%West Yorkshire Police 368.2 0.0 0.0%
180

Formula Grant Before Floor DampingLocal Authority
(£ million) (£ million) (%)
Difference from Indicative Allocations
2010-11 Indicative
Allocations Option ACA1
ALL PURPOSE AUTHORITIES
Bath & North East Somerset 44.1 0.3 0.8%Bedford 55.4 0.1 0.2%Blackburn with Darwen 88.5 0.4 0.4%Blackpool 86.9 0.4 0.4%Bournemouth 49.4 0.7 1.4%
Bracknell Forest 22.6 -0.4 -1.9%Brighton & Hove 89.8 0.7 0.8%Bristol 171.2 0.2 0.1%Central Bedfordshire 51.9 0.5 0.9%Cheshire East 64.5 1.5 2.3%
Cheshire West & Chester 94.9 1.2 1.2%Cornwall 227.6 2.0 0.9%Darlington 40.1 0.4 0.9%Derby 114.5 0.8 0.7%Durham 238.7 1.6 0.7%
East Riding of Yorkshire 109.2 1.5 1.3%Halton 65.5 0.2 0.3%Hartlepool 54.0 0.2 0.4%Herefordshire 61.2 0.7 1.1%Isle of Wight Council 65.0 -0.1 -0.2%
Kingston upon Hull 159.2 0.6 0.4%Leicester 188.4 0.3 0.2%Luton 94.6 -0.1 -0.1%Medway 89.5 0.7 0.8%Middlesbrough 85.4 0.3 0.3%
Milton Keynes 91.6 -0.8 -0.9%North East Lincolnshire 76.9 0.5 0.7%North Lincolnshire 66.3 0.6 0.9%North Somerset 54.6 0.3 0.6%Northumberland 133.1 1.1 0.8%
Nottingham 179.5 0.6 0.3%Peterborough 80.9 -0.3 -0.3%Plymouth 108.7 0.9 0.8%Poole 25.6 0.6 2.4%Portsmouth 87.8 0.0 0.0%
Reading 48.0 -0.8 -1.8%Redcar and Cleveland 71.4 0.4 0.6%Rutland 8.6 0.1 1.7%Shropshire 97.4 1.2 1.2%Slough 52.8 -0.9 -1.7%
South Gloucestershire 64.0 0.5 0.8%Southampton 101.2 0.0 0.0%Southend-on-Sea 62.3 0.3 0.5%Stockton-on-Tees 80.6 0.7 0.8%Stoke-on-Trent 133.5 0.6 0.4%
Swindon 43.7 0.4 0.8%Telford and the Wrekin 76.0 0.6 0.8%Thurrock 62.1 -0.5 -0.7%Torbay 64.2 0.5 0.8%Warrington 52.7 0.7 1.3%
181

Formula Grant Before Floor DampingLocal Authority
(£ million) (£ million) (%)
Difference from Indicative Allocations
2010-11 Indicative
Allocations Option ACA1
West Berkshire 23.1 -0.6 -2.6%Wiltshire 102.1 1.0 1.0%Windsor and Maidenhead 10.1 -0.5 -4.5%Wokingham 8.4 -0.3 -3.0%York 45.8 0.9 2.0%
Isles of Scilly 2.3 0.0 0.0%
182

Formula Grant Before Floor DampingLocal Authority
(£ million) (£ million) (%)
Difference from Indicative Allocations
2010-11 Indicative
Allocations Option ACA1
SHIRE COUNTIES
Buckinghamshire 43.5 -0.5 -1.1%Cambridgeshire 113.1 0.5 0.4%Cumbria 157.5 1.7 1.1%Derbyshire 204.0 2.8 1.4%Devon 176.4 2.9 1.6%
Dorset 57.6 1.8 3.2%East Sussex 105.4 1.7 1.6%Essex 258.3 2.1 0.8%Gloucestershire 124.0 1.6 1.3%Hampshire 126.6 2.5 1.9%
Hertfordshire 148.3 -1.4 -0.9%Kent 287.9 3.3 1.1%Lancashire 328.9 4.1 1.2%Leicestershire 107.5 2.3 2.1%Lincolnshire 210.6 2.6 1.2%
Norfolk 260.4 3.0 1.1%North Yorkshire 113.7 2.4 2.1%Northamptonshire 162.2 1.9 1.2%Nottinghamshire 191.6 2.7 1.4%Oxfordshire 99.8 0.0 0.0%
Somerset 120.7 2.1 1.7%Staffordshire 169.7 3.2 1.9%Suffolk 181.0 2.7 1.5%Surrey 60.1 -3.1 -5.1%Warwickshire 96.6 1.5 1.5%
West Sussex 88.4 2.7 3.1%Worcestershire 96.9 2.3 2.4%
183

Formula Grant Before Floor DampingLocal Authority
(£ million) (£ million) (%)
Difference from Indicative Allocations
2010-11 Indicative
Allocations Option ACA1
BUCKINGHAMSHIREAylesbury Vale 12.1 -0.1 -0.6%Chiltern 3.2 -0.1 -2.2%South Bucks 2.3 -0.1 -2.3%Wycombe 9.5 -0.1 -1.0%
CAMBRIDGESHIRECambridge 12.0 0.0 -0.1%East Cambridgeshire 6.8 0.0 0.0%Fenland 9.9 0.0 -0.1%Huntingdonshire 13.4 0.0 0.1%South Cambridgeshire 7.9 0.0 -0.2%
CUMBRIAAllerdale 10.4 0.0 0.2%Barrow-in-Furness 9.1 0.0 0.2%Carlisle 10.2 0.0 0.4%Copeland 7.2 0.0 0.4%Eden 4.7 0.0 0.3%South Lakeland 6.8 0.0 0.3%
DERBYSHIREAmber Valley 10.0 0.1 0.6%Bolsover 8.0 0.0 0.5%Chesterfield 10.2 0.0 0.4%Derbyshire Dales 4.7 0.0 0.2%Erewash 9.7 0.1 0.7%High Peak 7.2 0.0 0.6%North East Derbyshire 7.9 0.1 0.6%South Derbyshire 7.5 0.1 0.7%
DEVONEast Devon 8.4 0.0 0.4%Exeter 12.1 0.0 0.4%Mid Devon 6.3 0.0 0.4%North Devon 8.5 0.0 0.4%South Hams 5.6 0.0 0.1%Teignbridge 10.1 0.0 0.4%Torridge 6.6 0.0 0.3%West Devon 4.4 0.0 0.3%
DORSETChristchurch 2.9 0.0 -0.1%East Dorset 3.8 0.0 0.5%North Dorset 4.7 0.0 0.4%Purbeck 3.3 0.0 0.1%West Dorset 7.9 0.0 -0.1%Weymouth and Portland 6.1 0.0 0.4%
EAST SUSSEXEastbourne 10.5 0.0 0.0%Hastings 10.6 0.0 0.1%Lewes 6.6 0.0 0.3%Rother 6.5 0.0 -0.1%Wealden 8.4 0.0 0.2%
184
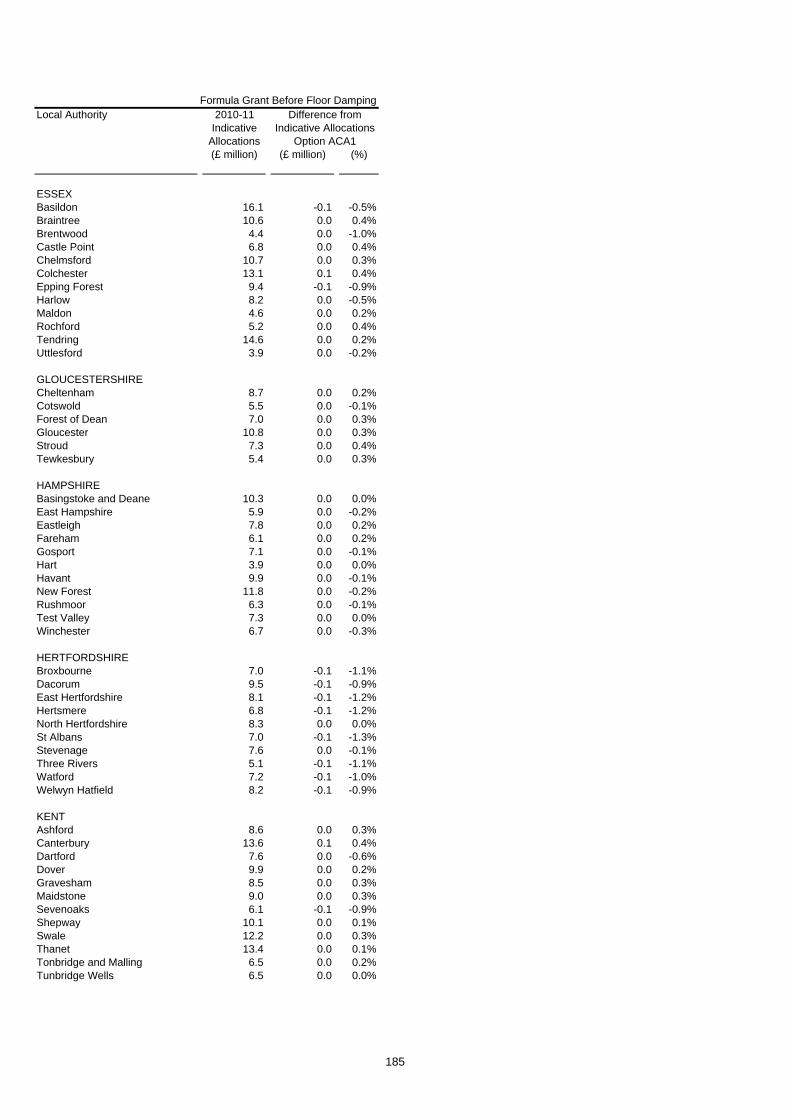
Formula Grant Before Floor DampingLocal Authority
(£ million) (£ million) (%)
Difference from Indicative Allocations
2010-11 Indicative
Allocations Option ACA1
ESSEXBasildon 16.1 -0.1 -0.5%Braintree 10.6 0.0 0.4%Brentwood 4.4 0.0 -1.0%Castle Point 6.8 0.0 0.4%Chelmsford 10.7 0.0 0.3%Colchester 13.1 0.1 0.4%Epping Forest 9.4 -0.1 -0.9%Harlow 8.2 0.0 -0.5%Maldon 4.6 0.0 0.2%Rochford 5.2 0.0 0.4%Tendring 14.6 0.0 0.2%Uttlesford 3.9 0.0 -0.2%
GLOUCESTERSHIRECheltenham 8.7 0.0 0.2%Cotswold 5.5 0.0 -0.1%Forest of Dean 7.0 0.0 0.3%Gloucester 10.8 0.0 0.3%Stroud 7.3 0.0 0.4%Tewkesbury 5.4 0.0 0.3%
HAMPSHIREBasingstoke and Deane 10.3 0.0 0.0%East Hampshire 5.9 0.0 -0.2%Eastleigh 7.8 0.0 0.2%Fareham 6.1 0.0 0.2%Gosport 7.1 0.0 -0.1%Hart 3.9 0.0 0.0%Havant 9.9 0.0 -0.1%New Forest 11.8 0.0 -0.2%Rushmoor 6.3 0.0 -0.1%Test Valley 7.3 0.0 0.0%Winchester 6.7 0.0 -0.3%
HERTFORDSHIREBroxbourne 7.0 -0.1 -1.1%Dacorum 9.5 -0.1 -0.9%East Hertfordshire 8.1 -0.1 -1.2%Hertsmere 6.8 -0.1 -1.2%North Hertfordshire 8.3 0.0 0.0%St Albans 7.0 -0.1 -1.3%Stevenage 7.6 0.0 -0.1%Three Rivers 5.1 -0.1 -1.1%Watford 7.2 -0.1 -1.0%Welwyn Hatfield 8.2 -0.1 -0.9%
KENTAshford 8.6 0.0 0.3%Canterbury 13.6 0.1 0.4%Dartford 7.6 0.0 -0.6%Dover 9.9 0.0 0.2%Gravesham 8.5 0.0 0.3%Maidstone 9.0 0.0 0.3%Sevenoaks 6.1 -0.1 -0.9%Shepway 10.1 0.0 0.1%Swale 12.2 0.0 0.3%Thanet 13.4 0.0 0.1%Tonbridge and Malling 6.5 0.0 0.2%Tunbridge Wells 6.5 0.0 0.0%
185
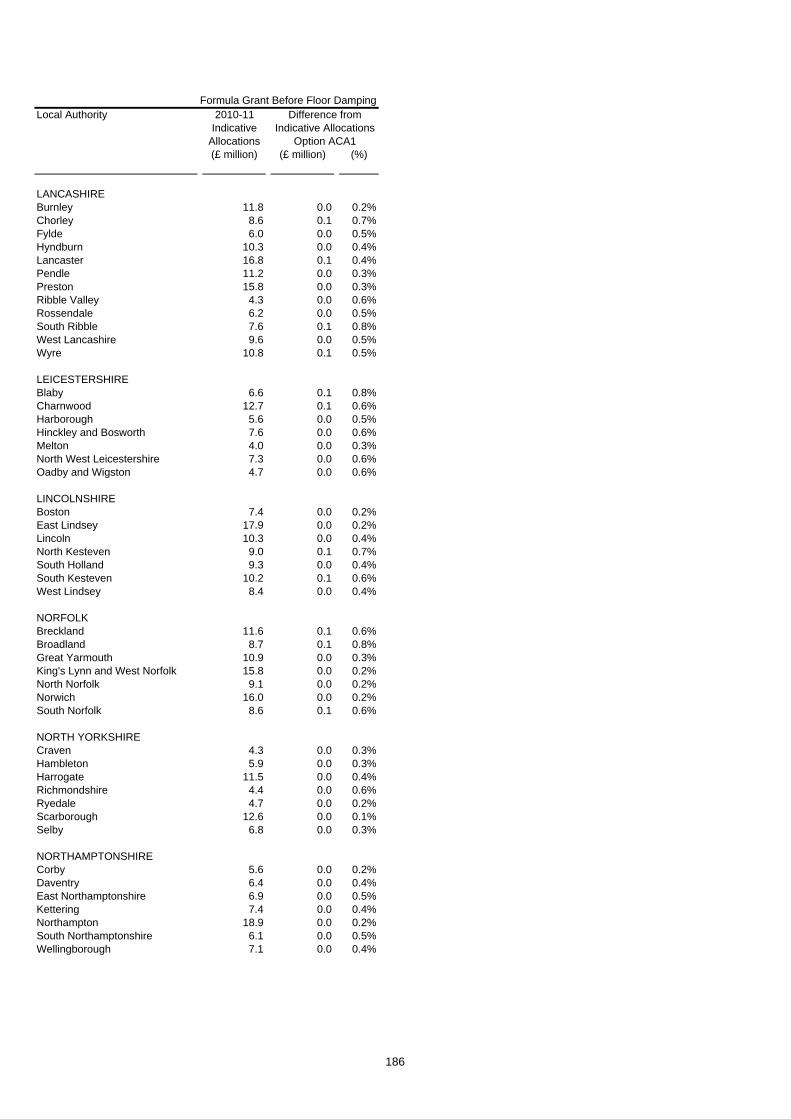
Formula Grant Before Floor DampingLocal Authority
(£ million) (£ million) (%)
Difference from Indicative Allocations
2010-11 Indicative
Allocations Option ACA1
LANCASHIREBurnley 11.8 0.0 0.2%Chorley 8.6 0.1 0.7%Fylde 6.0 0.0 0.5%Hyndburn 10.3 0.0 0.4%Lancaster 16.8 0.1 0.4%Pendle 11.2 0.0 0.3%Preston 15.8 0.0 0.3%Ribble Valley 4.3 0.0 0.6%Rossendale 6.2 0.0 0.5%South Ribble 7.6 0.1 0.8%West Lancashire 9.6 0.0 0.5%Wyre 10.8 0.1 0.5%
LEICESTERSHIREBlaby 6.6 0.1 0.8%Charnwood 12.7 0.1 0.6%Harborough 5.6 0.0 0.5%Hinckley and Bosworth 7.6 0.0 0.6%Melton 4.0 0.0 0.3%North West Leicestershire 7.3 0.0 0.6%Oadby and Wigston 4.7 0.0 0.6%
LINCOLNSHIREBoston 7.4 0.0 0.2%East Lindsey 17.9 0.0 0.2%Lincoln 10.3 0.0 0.4%North Kesteven 9.0 0.1 0.7%South Holland 9.3 0.0 0.4%South Kesteven 10.2 0.1 0.6%West Lindsey 8.4 0.0 0.4%
NORFOLKBreckland 11.6 0.1 0.6%Broadland 8.7 0.1 0.8%Great Yarmouth 10.9 0.0 0.3%King's Lynn and West Norfolk 15.8 0.0 0.2%North Norfolk 9.1 0.0 0.2%Norwich 16.0 0.0 0.2%South Norfolk 8.6 0.1 0.6%
NORTH YORKSHIRECraven 4.3 0.0 0.3%Hambleton 5.9 0.0 0.3%Harrogate 11.5 0.0 0.4%Richmondshire 4.4 0.0 0.6%Ryedale 4.7 0.0 0.2%Scarborough 12.6 0.0 0.1%Selby 6.8 0.0 0.3%
NORTHAMPTONSHIRECorby 5.6 0.0 0.2%Daventry 6.4 0.0 0.4%East Northamptonshire 6.9 0.0 0.5%Kettering 7.4 0.0 0.4%Northampton 18.9 0.0 0.2%South Northamptonshire 6.1 0.0 0.5%Wellingborough 7.1 0.0 0.4%
186

Formula Grant Before Floor DampingLocal Authority
(£ million) (£ million) (%)
Difference from Indicative Allocations
2010-11 Indicative
Allocations Option ACA1
NOTTINGHAMSHIREAshfield 11.6 0.1 0.6%Bassetlaw 11.4 0.1 0.5%Broxtowe 9.1 0.1 0.8%Gedling 9.4 0.1 0.6%Mansfield 10.3 0.0 0.4%Newark and Sherwood 10.5 0.0 0.4%Rushcliffe 7.3 0.0 0.6%
OXFORDSHIRECherwell 11.2 0.0 -0.2%Oxford 16.9 0.0 -0.2%South Oxfordshire 7.8 -0.1 -0.7%Vale of White Horse 7.2 0.0 -0.5%West Oxfordshire 6.1 0.0 -0.7%
SOMERSETMendip 8.5 0.0 0.5%Sedgemoor 10.3 0.0 0.4%South Somerset 11.2 0.1 0.5%Taunton Deane 8.9 0.0 0.5%West Somerset 3.3 0.0 0.0%
STAFFORDSHIRECannock Chase 8.6 0.1 0.6%East Staffordshire 9.6 0.1 0.5%Lichfield 6.1 0.0 0.5%Newcastle-under-Lyme 11.3 0.1 0.7%South Staffordshire 7.2 0.0 0.6%Stafford 8.8 0.1 0.6%Staffordshire Moorlands 7.6 0.0 0.4%Tamworth 6.9 0.0 0.6%
SUFFOLKBabergh 6.4 0.0 0.6%Forest Heath 5.5 0.1 0.9%Ipswich 11.9 0.0 0.4%Mid Suffolk 6.2 0.0 0.4%St Edmundsbury 7.1 0.0 0.6%Suffolk Coastal 8.4 0.0 0.4%Waveney 12.0 0.1 0.4%
SURREYElmbridge 6.5 -0.1 -2.0%Epsom and Ewell 4.0 -0.1 -1.8%Guildford 8.6 -0.1 -1.4%Mole Valley 3.3 -0.1 -2.9%Reigate and Banstead 6.9 -0.1 -1.8%Runnymede 5.8 -0.1 -1.3%Spelthorne 5.7 -0.1 -1.7%Surrey Heath 4.7 -0.1 -1.8%Tandridge 4.0 -0.1 -2.0%Waverley 5.4 -0.1 -2.1%Woking 5.8 -0.1 -1.7%
WARWICKSHIRENorth Warwickshire 5.5 0.0 0.3%Nuneaton and Bedworth 11.4 0.0 0.3%Rugby 6.6 0.0 0.1%Stratford-on-Avon 6.9 0.0 -0.1%Warwick 10.5 0.0 0.2%
187

Formula Grant Before Floor DampingLocal Authority
(£ million) (£ million) (%)
Difference from Indicative Allocations
2010-11 Indicative
Allocations Option ACA1
WEST SUSSEXAdur 5.0 0.0 0.4%Arun 10.5 0.0 0.4%Chichester 5.9 0.0 0.1%Crawley 10.5 -0.1 -1.0%Horsham 6.0 0.0 0.4%Mid Sussex 5.3 0.0 0.4%Worthing 7.9 0.0 0.4%
WORCESTERSHIREBromsgrove 5.2 0.0 0.7%Malvern Hills 5.2 0.0 0.4%Redditch 6.4 0.0 0.5%Worcester 7.8 0.0 0.5%Wychavon 8.0 0.0 0.5%Wyre Forest 8.1 0.0 0.4%
188

Formula Grant Before Floor DampingLocal Authority
(£ million) (£ million) (%)
Difference from Indicative Allocations
2010-11 Indicative
Allocations Option ACA1
SHIRE POLICE AUTHORITIES
Avon & Somerset Police 197.6 0.3 0.1%Bedfordshire Police 76.6 0.1 0.1%Cambridgeshire Police 86.2 0.2 0.2%Cheshire Police 114.1 0.2 0.2%Cleveland Police 99.0 0.0 0.0%
Cumbria Police 56.1 0.1 0.2%Derbyshire Police 120.7 0.2 0.2%Devon & Cornwall Police 191.7 0.4 0.2%Dorset Police 64.3 0.1 0.2%Durham Police 87.0 0.1 0.1%
Essex Police 187.3 0.3 0.2%Gloucestershire Police 58.5 0.1 0.2%Hampshire Police 215.0 0.3 0.1%Hertfordshire Police 128.9 0.0 0.0%Humberside Police 132.9 0.1 0.1%
Kent Police 200.2 0.2 0.1%Lancashire Police 212.3 0.2 0.1%Leicestershire Police 124.2 0.2 0.2%Lincolnshire Police 69.0 0.3 0.4%Norfolk Police 88.5 0.3 0.3%
North Yorkshire Police 73.1 0.3 0.3%Northamptonshire Police 78.4 0.2 0.2%Nottinghamshire Police 152.7 0.2 0.1%Staffordshire Police 125.1 0.2 0.2%Suffolk Police 71.0 0.2 0.3%
Surrey Police 101.3 0.1 0.1%Sussex Police 167.1 0.2 0.1%Thames Valley Police 248.5 0.2 0.1%Warwickshire Police 56.1 0.1 0.2%West Mercia Police 114.3 0.4 0.3%
Wiltshire Police 64.1 0.1 0.2%
189

Formula Grant Before Floor DampingLocal Authority
(£ million) (£ million) (%)
Difference from Indicative Allocations
2010-11 Indicative
Allocations Option ACA1
SHIRE FIRE AUTHORITIES
Avon Fire 24.6 0.0 0.1%Bedfordshire Fire 11.7 0.0 0.4%Berkshire Fire Auhtority 13.0 0.0 0.1%Buckinghamshire Fire 9.1 0.0 0.4%Cambridgeshire Fire 15.1 0.0 0.3%
Cheshire Fire 19.3 0.0 0.2%Cleveland Fire 21.7 0.0 -0.2%Derbyshire Fire 20.6 0.1 0.4%Devon and Somerset Fire 32.1 0.1 0.2%Dorset Fire 11.1 0.0 0.1%
Durham Fire 14.9 0.0 0.1%East Sussex Fire 15.0 0.0 0.0%Essex Fire Auhtority 33.3 0.0 0.1%Hampshire Fire 29.9 0.1 0.3%Hereford & Worcester Fire 10.8 0.1 0.5%
Humberside Fire 28.2 0.0 0.0%Kent Fire 30.2 0.1 0.2%Lancashire Fire 32.6 0.1 0.3%Leicestershire Fire 19.2 0.1 0.4%North Yorkshire Fire 11.6 0.1 0.6%
Nottinghamshire Fire 26.3 0.1 0.2%Shropshire Fire 8.6 0.0 0.4%Staffordshire Fire 19.1 0.1 0.5%Wiltshire Fire 9.7 0.0 0.4%
190

191
Chapter 9 Taking account of Relative Needs and Resources 1. The grant distribution system takes account of both the relative need by different councils to spend on services based on their socio-economic and demographic characteristics and of the relative ability of different councils to raise council tax. We currently do this by setting the percentages of Revenue Support Grant plus redistributed business rates that will form the Relative Needs Amount and the Relative Resource Amount respectively.
2. Under the previous formula grant system, in order to increase the account taken of needs or resource we had to increase both the level of Assumed National Council Tax and the levels of the relative needs element (Standard Spending Assessments (SSAs) or Formula Spending Shares (FSSs)). While these options were described in terms of increasing resource equalisation, in fact they also incorporated greater reflection of relative needs.
3. One advantage of the 4-block model over the previous SSA and FSS models is that there is more freedom to change the account we take of relative need, independently of relative resource; or vice versa. There are differing views about which element is the more important, and the extent to which each should matter in grant distribution. Ultimately, the levels at which they are set is a matter of judgement, in the same way that the levels of the old SSAs or FSSs were.
4. In 2007-08 the Relative Needs Amount distributed 70.99% of the CLG Formula Grant, the Relative Resource Amount distributed -24.57%, and the Central Allocation distributed 53.58%. In 2008-09 this was changed so that the Relative Needs Amount distributed 73.0% of the CLG Formula Grant, after removing the amount of formula grant for the Isles of Scilly, the Relative Resource Amount distributed -26.6%, and the Central Allocation distributed 53.6%.
5. The split of CLG Formula Grant between the three blocks may again be changed. The way in which this may happen would be influenced by the considerations on the scaling factor for the Central Allocation (see Chapter 10).

192
Chapter 10 The Scaling Factor for the Central Allocation Block 1. The distribution of formula grant takes into account the difference in needs and resources of authorities. For example, in order to take into account the difference for needs across upper-tier services we only need to consider the amount above the minimum or threshold (the blue area in Diagram 1) since the amount below the threshold (the pink area in Diagram 1) is consistent across all authorities. The same also applies with regard to resources.
2. We therefore simply use the RNFs per head above the threshold to allocate the Relative Needs Amount and the taxbase per head above the threshold to allocate the Relative Resource Amount.
Diagram 1: 2008-09 Upper Tier RNF Per Head
0.0000
0.0050
0.0100
0.0150
0.0200
0.0250
0.0300
0.0350
0.0400
0.0450
0.0500
Local Authority
RNF per headMinimum RNF per head
3. There is also a substantial sum of grant that is not distributed according to relative needs or resource and this is known as the Central Allocation, which distributes money on a per head basis based on the services an authority provides. Since the amounts below the threshold are already constants across services we use these in the calculation of the Central Allocation.
4. The scaling factor applied to the Central Allocation refers to the calculated total for all authorities divided by the control total for the Central Allocation. The scaling factors applied to the Central Allocation for each year since the introduction of the 4-block model are given in the table over the page:

193
Year Calculated total for all authorities
Control Total for Central Allocation
Scaling Factor
2006-07 11,192,576,891 11,205,498,375 1.001154469084812007-08 11,305,136,484 11,595,117,419 1.025650370113662008-09 9,561,108,009 12,516,465,980 1.309624990259552009-10 10,788,412,469 12,868,267,628 1.192786025559962010-11 12,094,644,971 13,196,169,188 1.09148877231644
5. In 2008-09 the Government specified the levels of the Relative Needs Amount and the Relative Resource Amount. Since the sum of these two blocks plus the Central Allocation must add to the amount specified by HM Treasury in the Spending Review, this also defined the amount to be allocated through the Central Allocation. This led to the scaling factor in 2008-09 moving further away from one.
6. A change in the Central Allocation scaling factor away from one means that the amount below the threshold can have either more or less weight applied to it than the amount above the threshold. For example, if the scaling factor for the central allocation is greater than one each authority’s RNF above the threshold becomes relatively less important in the allocation of funding whilst the RNF below the threshold becomes increasingly important. The reverse is true if the scaling factor falls below one. It has therefore been suggested that if the scaling factor for the Central Allocation is not very close to one, the distribution of grant will be distorted; and that this should be avoided.
7. As the three blocks (the Relative Needs Amount, the Relative Resource Amount and the Central Allocation) must add up to the amount of CLG formula grant provided by HM Treasury it follows that Ministers can only set the levels of two out of three of the blocks. If the scaling factor for the Central Allocation is to be set as close to one as possible then this means that Ministers can specify the size of either the Relative Needs Amount or the Relative Resource Amount, but not both.
8. To illustrate the options here, we have recalculated the 2010-11 Indicative Allocations so that the scaling factor for the Central Allocation becomes as close to one as possible. This can be achieved as follows:
Option CAS1 Keeping the Relative Needs Amount Unchanged
9. We have changed the proportion allocated by the Relative Resource Amount from -26.6% to -25.5%; and therefore the proportion allocated by the central allocation changes from 53.6% to 52.5%. The proportion allocated by the Relative Needs Amount remains unchanged at 73.0%.
Option CAS2 Keeping the Relative Resource Amount Unchanged
10. We have changed the proportion allocated by the Relative Needs Amount from 73.0% to 74.6%; and therefore the proportion allocated by the

194
central allocation changes from 53.6% to 52.0%. The proportion allocated by the Relative Resource Amount remains unchanged at -26.6%.
11. The table below shows the scaling factors for each of the above options.
% Allocated by Relative Needs Amount
% Allocated by Relative Resource Amount
Calculated total for all authorities
Control Total for Central Allocation
Scaling Factor
Indicative Allocation
73.0% -26.6% 12,055,320,458 13,201,169,191 1.09504921396
Option CAS1 73.0% -25.5% 12,928,165,631 12,930,352,286 1.00016913888Option CAS2 74.6% -26.6% 12,789,746,121 12,807,253,693 1.00136887567
Questions
Question 15: Do you think that the scaling factor for the central allocation should be close to one, so that equal importance is attached to the amounts above and below the threshold?
Question 16: If so, would you prefer Ministers to be able to set judgemental weights for the Relative Needs Amount, as in option CAS1, or the Relative Resource Amount, as in option CAS2?

Formula Grant Before Floor DampingLocal Authority
(£ million) (£ million) (%) (£ million) (%)
England 28,995.5 0.0 0.0% 0.0 0.0%
London area 6,153.4 19.5 0.3% 40.3 0.7%Metropolitan areas 8,340.7 -32.0 -0.4% 26.0 0.3%Shire areas 14,499.1 12.5 0.1% -66.3 -0.5%Isles of Scilly 2.3 0.0 0.0% 0.0 0.0%
Inner London boroughs incl. City 2,025.0 7.8 0.4% 24.1 1.2%Outer London boroughs 1,873.1 7.1 0.4% 4.1 0.2%London boroughs 3,898.1 14.9 0.4% 28.2 0.7%GLA - all functions 2,255.3 4.6 0.2% 12.2 0.5%
Metropolitan districts 5,904.0 -24.7 -0.4% 23.3 0.4%Metropolitan fire authorities 335.8 -1.9 -0.6% 0.1 0.0%Metropolitan police authorities 2,100.9 -5.3 -0.3% 2.6 0.1%
Shire unitaries with fire 425.6 -0.1 0.0% 0.3 0.1%Shire unitaries without fire 4,099.3 -7.2 -0.2% -4.5 -0.1%Shire counties with fire 1,589.0 9.7 0.6% -19.9 -1.3%Shire counties without fire 2,501.9 7.4 0.3% -27.5 -1.1%Shire districts 1,654.0 0.0 0.0% 0.0 0.0%Combined fire authorities 467.7 0.5 0.1% -2.3 -0.5%Shire police authorities 3,761.6 2.2 0.1% -12.5 -0.3%
GO REGIONAL SUMMARY
South West GOR 2,267.3 4.1 0.2% -10.5 -0.5%South East GOR 2,957.0 20.3 0.7% -24.2 -0.8%London GOR 6,153.4 19.5 0.3% 40.3 0.7%Eastern GOR 2,437.8 4.8 0.2% -12.5 -0.5%East Midlands GOR 2,292.2 -8.7 -0.4% -7.7 -0.3%West Midlands GOR 3,349.9 -8.0 -0.2% 2.8 0.1%Yorkshire and Humber GOR 3,199.2 -13.4 -0.4% -0.6 0.0%North East GOR 1,777.2 -6.4 -0.4% 4.4 0.2%North West GOR 4,561.4 -12.2 -0.3% 8.0 0.2%
FLOOR DAMPING GROUPS
Education Authorities 18,418.0 0.0 0.0% 0.0 0.0%Police Authorities 7,864.8 0.0 0.0% 0.0 0.0%Fire Authorities 1,056.5 0.0 0.0% 0.0 0.0%Shire Districts 1,654.0 0.0 0.0% 0.0 0.0%
10 Scaling in the Central Allocation
Difference from 2010-11 Indicative 2010-11 Indicative Allocation
Option CAS1 Option CAS2
195

Formula Grant Before Floor DampingLocal Authority
(£ million) (£ million) (%) (£ million) (%)
Difference from 2010-11 Indicative 2010-11 Indicative Allocation
Option CAS1 Option CAS2
GREATER LONDON
City of London 91.1 0.2 0.2% 1.5 1.7%
Camden 171.0 0.4 0.2% 1.9 1.1%Greenwich 170.1 0.0 0.0% 1.8 1.0%Hackney 201.8 0.1 0.1% 2.7 1.3%Hammersmith and Fulham 94.3 0.9 0.9% 1.0 1.1%Islington 133.8 1.0 0.7% 1.9 1.4%Kensington and Chelsea 95.9 1.2 1.2% 1.0 1.0%
Lambeth 180.3 0.6 0.4% 2.0 1.1%Lewisham 174.9 0.0 0.0% 1.7 1.0%Southwark 210.2 0.1 0.0% 2.4 1.1%Tower Hamlets 224.3 0.2 0.1% 3.2 1.4%Wandsworth 98.6 1.4 1.5% 0.5 0.5%Westminster 178.8 1.7 1.0% 2.6 1.4%
Barking and Dagenham 108.2 -0.3 -0.3% 0.8 0.7%Barnet 97.9 0.9 0.9% -0.3 -0.3%Bexley 64.5 0.2 0.3% -0.4 -0.6%Brent 157.0 0.0 0.0% 1.1 0.7%Bromley 45.7 1.3 2.8% -0.9 -1.9%
Croydon 118.4 0.5 0.4% 0.0 0.0%Ealing 129.0 0.5 0.4% 0.5 0.4%Enfield 126.7 0.4 0.3% 0.6 0.4%Haringey 137.6 0.5 0.4% 1.4 1.0%Harrow 66.6 0.6 0.8% -0.1 -0.1%
Havering 52.3 0.5 0.9% -0.5 -1.0%Hillingdon 85.6 0.4 0.4% 0.0 -0.1%Hounslow 77.3 0.6 0.8% 0.2 0.3%Kingston upon Thames 32.6 0.2 0.7% -0.5 -1.6%Merton 61.2 0.2 0.4% -0.2 -0.4%
Newham 231.3 -0.8 -0.3% 2.5 1.1%Redbridge 102.6 0.0 0.0% 0.1 0.1%Richmond upon Thames 9.6 1.1 11.4% -0.8 -8.3%Sutton 45.1 0.4 1.0% -0.3 -0.7%Waltham Forest 124.0 0.0 0.0% 0.9 0.7%
GLA - all functions 2,255.3 4.6 0.2% 12.2 0.5%
GLA - police 2,002.3 3.1 0.2% 9.9 0.5%GLA - fire 253.0 1.4 0.6% 2.3 0.9%
196
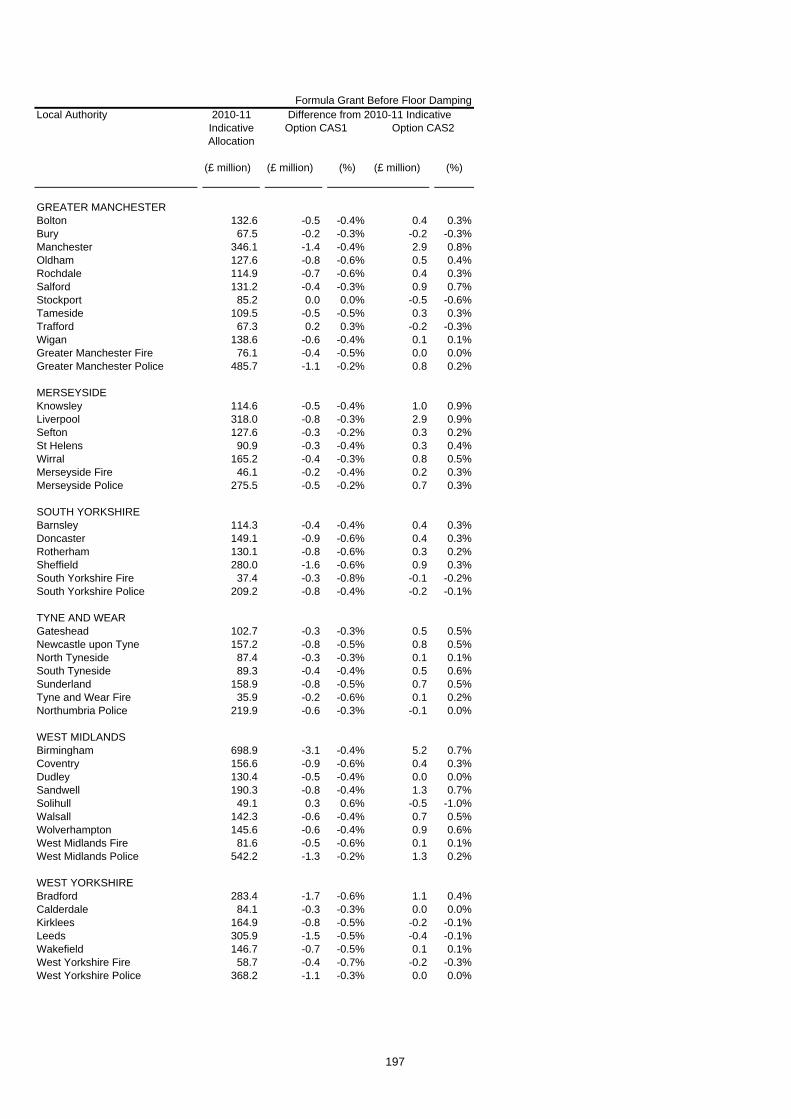
Formula Grant Before Floor DampingLocal Authority
(£ million) (£ million) (%) (£ million) (%)
Difference from 2010-11 Indicative 2010-11 Indicative Allocation
Option CAS1 Option CAS2
GREATER MANCHESTERBolton 132.6 -0.5 -0.4% 0.4 0.3%Bury 67.5 -0.2 -0.3% -0.2 -0.3%Manchester 346.1 -1.4 -0.4% 2.9 0.8%Oldham 127.6 -0.8 -0.6% 0.5 0.4%Rochdale 114.9 -0.7 -0.6% 0.4 0.3%Salford 131.2 -0.4 -0.3% 0.9 0.7%Stockport 85.2 0.0 0.0% -0.5 -0.6%Tameside 109.5 -0.5 -0.5% 0.3 0.3%Trafford 67.3 0.2 0.3% -0.2 -0.3%Wigan 138.6 -0.6 -0.4% 0.1 0.1%Greater Manchester Fire 76.1 -0.4 -0.5% 0.0 0.0%Greater Manchester Police 485.7 -1.1 -0.2% 0.8 0.2%
MERSEYSIDEKnowsley 114.6 -0.5 -0.4% 1.0 0.9%Liverpool 318.0 -0.8 -0.3% 2.9 0.9%Sefton 127.6 -0.3 -0.2% 0.3 0.2%St Helens 90.9 -0.3 -0.4% 0.3 0.4%Wirral 165.2 -0.4 -0.3% 0.8 0.5%Merseyside Fire 46.1 -0.2 -0.4% 0.2 0.3%Merseyside Police 275.5 -0.5 -0.2% 0.7 0.3%
SOUTH YORKSHIREBarnsley 114.3 -0.4 -0.4% 0.4 0.3%Doncaster 149.1 -0.9 -0.6% 0.4 0.3%Rotherham 130.1 -0.8 -0.6% 0.3 0.2%Sheffield 280.0 -1.6 -0.6% 0.9 0.3%South Yorkshire Fire 37.4 -0.3 -0.8% -0.1 -0.2%South Yorkshire Police 209.2 -0.8 -0.4% -0.2 -0.1%
TYNE AND WEARGateshead 102.7 -0.3 -0.3% 0.5 0.5%Newcastle upon Tyne 157.2 -0.8 -0.5% 0.8 0.5%North Tyneside 87.4 -0.3 -0.3% 0.1 0.1%South Tyneside 89.3 -0.4 -0.4% 0.5 0.6%Sunderland 158.9 -0.8 -0.5% 0.7 0.5%Tyne and Wear Fire 35.9 -0.2 -0.6% 0.1 0.2%Northumbria Police 219.9 -0.6 -0.3% -0.1 0.0%
WEST MIDLANDSBirmingham 698.9 -3.1 -0.4% 5.2 0.7%Coventry 156.6 -0.9 -0.6% 0.4 0.3%Dudley 130.4 -0.5 -0.4% 0.0 0.0%Sandwell 190.3 -0.8 -0.4% 1.3 0.7%Solihull 49.1 0.3 0.6% -0.5 -1.0%Walsall 142.3 -0.6 -0.4% 0.7 0.5%Wolverhampton 145.6 -0.6 -0.4% 0.9 0.6%West Midlands Fire 81.6 -0.5 -0.6% 0.1 0.1%West Midlands Police 542.2 -1.3 -0.2% 1.3 0.2%
WEST YORKSHIREBradford 283.4 -1.7 -0.6% 1.1 0.4%Calderdale 84.1 -0.3 -0.3% 0.0 0.0%Kirklees 164.9 -0.8 -0.5% -0.2 -0.1%Leeds 305.9 -1.5 -0.5% -0.4 -0.1%Wakefield 146.7 -0.7 -0.5% 0.1 0.1%West Yorkshire Fire 58.7 -0.4 -0.7% -0.2 -0.3%West Yorkshire Police 368.2 -1.1 -0.3% 0.0 0.0%
197

Formula Grant Before Floor DampingLocal Authority
(£ million) (£ million) (%) (£ million) (%)
Difference from 2010-11 Indicative 2010-11 Indicative Allocation
Option CAS1 Option CAS2
ALL PURPOSE AUTHORITIES
Bath & North East Somerset 44.1 0.0 0.0% -0.6 -1.3%Bedford 55.4 -0.1 -0.2% -0.2 -0.4%Blackburn with Darwen 88.5 -0.6 -0.6% 0.4 0.5%Blackpool 86.9 -0.3 -0.3% 0.5 0.6%Bournemouth 49.4 0.2 0.5% -0.2 -0.3%
Bracknell Forest 22.6 0.2 0.7% -0.4 -1.6%Brighton & Hove 89.8 0.2 0.3% 0.0 -0.1%Bristol 171.2 -0.6 -0.3% 0.0 0.0%Central Bedfordshire 51.9 0.1 0.2% -1.0 -1.9%Cheshire East 64.5 0.7 1.1% -1.3 -2.0%
Cheshire West & Chester 94.9 0.2 0.2% -0.6 -0.7%Cornwall 227.6 -0.1 -0.1% 0.1 0.0%Darlington 40.1 0.0 -0.1% 0.0 0.1%Derby 114.5 -0.7 -0.6% 0.2 0.1%Durham 238.7 -0.9 -0.4% 0.6 0.2%
East Riding of Yorkshire 109.2 -0.3 -0.3% -0.7 -0.6%Halton 65.5 -0.2 -0.3% 0.4 0.5%Hartlepool 54.0 -0.3 -0.5% 0.3 0.5%Herefordshire 61.2 0.2 0.4% -0.1 -0.1%Isle of Wight Council 65.0 0.1 0.2% 0.2 0.3%
Kingston upon Hull 159.2 -1.1 -0.7% 0.8 0.5%Leicester 188.4 -1.0 -0.6% 1.2 0.6%Luton 94.6 -0.5 -0.5% 0.3 0.3%Medway 89.5 -0.3 -0.3% -0.3 -0.4%Middlesbrough 85.4 -0.3 -0.4% 0.6 0.7%
Milton Keynes 91.6 -0.1 -0.1% 0.0 0.0%North East Lincolnshire 76.9 -0.5 -0.6% 0.1 0.1%North Lincolnshire 66.3 -0.3 -0.5% -0.1 -0.1%North Somerset 54.6 0.2 0.3% -0.5 -0.9%Northumberland 133.1 -0.1 -0.1% 0.1 0.1%
Nottingham 179.5 -1.1 -0.6% 0.9 0.5%Peterborough 80.9 -0.2 -0.2% 0.3 0.3%Plymouth 108.7 -0.4 -0.4% 0.1 0.1%Poole 25.6 0.5 1.9% -0.3 -1.3%Portsmouth 87.8 -0.6 -0.6% 0.0 0.0%
Reading 48.0 0.2 0.3% 0.0 -0.1%Redcar and Cleveland 71.4 -0.3 -0.4% 0.3 0.4%Rutland 8.6 0.0 0.4% -0.1 -1.4%Shropshire 97.4 0.2 0.2% -0.3 -0.3%Slough 52.8 0.0 0.0% 0.2 0.3%
South Gloucestershire 64.0 -0.2 -0.3% -0.9 -1.4%Southampton 101.2 -0.7 -0.7% -0.1 -0.1%Southend-on-Sea 62.3 0.3 0.4% 0.2 0.2%Stockton-on-Tees 80.6 -0.5 -0.6% -0.1 -0.1%Stoke-on-Trent 133.5 -0.6 -0.4% 0.6 0.5%
Swindon 43.7 0.4 0.9% -0.4 -1.0%Telford and the Wrekin 76.0 -0.4 -0.6% 0.0 0.0%Thurrock 62.1 -0.1 -0.1% 0.1 0.1%Torbay 64.2 0.0 -0.1% 0.2 0.3%Warrington 52.7 0.1 0.2% -0.4 -0.8%
198

Formula Grant Before Floor DampingLocal Authority
(£ million) (£ million) (%) (£ million) (%)
Difference from 2010-11 Indicative 2010-11 Indicative Allocation
Option CAS1 Option CAS2
West Berkshire 23.1 0.6 2.4% -0.4 -1.9%Wiltshire 102.1 0.6 0.6% -1.3 -1.3%Windsor and Maidenhead 10.1 0.8 7.4% -0.6 -5.6%Wokingham 8.4 0.5 6.3% -0.8 -10.1%York 45.8 -0.2 -0.4% -0.7 -1.6%
Isles of Scilly 2.3 0.0 0.0% 0.0 0.0%
199

Formula Grant Before Floor DampingLocal Authority
(£ million) (£ million) (%) (£ million) (%)
Difference from 2010-11 Indicative 2010-11 Indicative Allocation
Option CAS1 Option CAS2
SHIRE COUNTIES
Buckinghamshire 43.5 1.3 3.0% -1.8 -4.1%Cambridgeshire 113.1 0.1 0.1% -1.5 -1.4%Cumbria 157.5 0.1 0.0% -0.1 -0.1%Derbyshire 204.0 -0.4 -0.2% -0.8 -0.4%Devon 176.4 0.6 0.4% -1.0 -0.5%
Dorset 57.6 0.8 1.5% -1.2 -2.0%East Sussex 105.4 0.7 0.7% -0.9 -0.8%Essex 258.3 1.4 0.5% -3.1 -1.2%Gloucestershire 124.0 0.6 0.5% -1.2 -1.0%Hampshire 126.6 1.8 1.4% -5.0 -4.0%
Hertfordshire 148.3 2.5 1.7% -3.4 -2.3%Kent 287.9 1.5 0.5% -2.5 -0.9%Lancashire 328.9 -1.0 -0.3% -1.1 -0.3%Leicestershire 107.5 -0.2 -0.1% -2.0 -1.9%Lincolnshire 210.6 -0.5 -0.3% -0.8 -0.4%
Norfolk 260.4 -0.1 -0.1% -0.5 -0.2%North Yorkshire 113.7 0.6 0.5% -1.3 -1.2%Northamptonshire 162.2 -0.1 -0.1% -1.4 -0.9%Nottinghamshire 191.6 -0.6 -0.3% -1.3 -0.7%Oxfordshire 99.8 0.7 0.7% -2.2 -2.2%
Somerset 120.7 0.3 0.2% -0.8 -0.7%Staffordshire 169.7 -0.1 -0.1% -1.8 -1.1%Suffolk 181.0 0.2 0.1% -1.1 -0.6%Surrey 60.1 4.1 6.8% -4.8 -7.9%Warwickshire 96.6 0.5 0.6% -1.5 -1.5%
West Sussex 88.4 1.8 2.0% -2.9 -3.3%Worcestershire 96.9 0.4 0.4% -1.4 -1.5%
200

Formula Grant Before Floor DampingLocal Authority
(£ million) (£ million) (%) (£ million) (%)
Difference from 2010-11 Indicative 2010-11 Indicative Allocation
Option CAS1 Option CAS2
BUCKINGHAMSHIREAylesbury Vale 12.1 0.0 0.3% 0.0 -0.1%Chiltern 3.2 0.2 5.5% 0.0 1.4%South Bucks 2.3 0.1 5.9% 0.0 1.7%Wycombe 9.5 0.1 1.5% 0.0 0.4%
CAMBRIDGESHIRECambridge 12.0 -0.1 -0.6% 0.0 0.1%East Cambridgeshire 6.8 0.0 -0.4% 0.0 -0.2%Fenland 9.9 -0.1 -0.7% 0.0 0.0%Huntingdonshire 13.4 -0.1 -0.7% -0.1 -0.6%South Cambridgeshire 7.9 0.1 1.2% 0.0 0.0%
CUMBRIAAllerdale 10.4 -0.1 -0.5% 0.0 0.2%Barrow-in-Furness 9.1 -0.1 -0.9% 0.0 0.2%Carlisle 10.2 -0.1 -0.6% 0.0 0.0%Copeland 7.2 -0.1 -0.8% 0.0 -0.1%Eden 4.7 0.0 0.0% 0.0 0.3%South Lakeland 6.8 0.1 1.1% 0.0 0.3%
DERBYSHIREAmber Valley 10.0 -0.1 -0.8% -0.1 -0.5%Bolsover 8.0 -0.1 -1.2% 0.0 -0.4%Chesterfield 10.2 -0.1 -0.9% 0.0 -0.2%Derbyshire Dales 4.7 0.0 1.0% 0.0 0.4%Erewash 9.7 -0.1 -1.2% -0.1 -0.6%High Peak 7.2 0.0 -0.5% 0.0 -0.4%North East Derbyshire 7.9 -0.1 -0.8% 0.0 -0.5%South Derbyshire 7.5 -0.1 -0.9% 0.0 -0.6%
DEVONEast Devon 8.4 0.1 1.1% 0.0 0.2%Exeter 12.1 -0.1 -0.7% 0.0 0.0%Mid Devon 6.3 0.0 -0.1% 0.0 0.0%North Devon 8.5 0.0 -0.3% 0.0 0.0%South Hams 5.6 0.1 1.4% 0.0 0.7%Teignbridge 10.1 0.0 0.0% 0.0 0.0%Torridge 6.6 0.0 -0.5% 0.0 0.1%West Devon 4.4 0.0 0.2% 0.0 0.3%
DORSETChristchurch 2.9 0.1 2.1% 0.0 1.0%East Dorset 3.8 0.1 2.4% 0.0 0.0%North Dorset 4.7 0.0 0.5% 0.0 0.0%Purbeck 3.3 0.0 1.0% 0.0 0.5%West Dorset 7.9 0.1 1.3% 0.1 1.0%Weymouth and Portland 6.1 0.0 -0.4% 0.0 0.0%
EAST SUSSEXEastbourne 10.5 0.0 0.0% 0.1 0.6%Hastings 10.6 -0.1 -0.5% 0.0 0.4%Lewes 6.6 0.0 0.5% 0.0 0.0%Rother 6.5 0.1 1.3% 0.1 0.8%Wealden 8.4 0.1 1.4% 0.0 0.2%
201

Formula Grant Before Floor DampingLocal Authority
(£ million) (£ million) (%) (£ million) (%)
Difference from 2010-11 Indicative 2010-11 Indicative Allocation
Option CAS1 Option CAS2
ESSEXBasildon 16.1 0.0 -0.2% 0.0 0.2%Braintree 10.6 0.0 -0.3% 0.0 -0.4%Brentwood 4.4 0.1 2.1% 0.0 0.9%Castle Point 6.8 0.0 -0.3% 0.0 -0.3%Chelmsford 10.7 0.1 0.5% 0.0 -0.1%Colchester 13.1 -0.1 -0.4% -0.1 -0.4%Epping Forest 9.4 0.1 1.5% 0.1 1.0%Harlow 8.2 0.0 -0.2% 0.0 0.4%Maldon 4.6 0.0 0.3% 0.0 0.0%Rochford 5.2 0.0 0.3% 0.0 -0.3%Tendring 14.6 -0.1 -0.6% 0.0 0.0%Uttlesford 3.9 0.1 2.5% 0.0 0.9%
GLOUCESTERSHIRECheltenham 8.7 0.0 0.2% 0.0 0.1%Cotswold 5.5 0.1 1.6% 0.0 0.7%Forest of Dean 7.0 0.0 -0.4% 0.0 -0.2%Gloucester 10.8 -0.1 -0.6% 0.0 -0.1%Stroud 7.3 0.0 0.2% 0.0 -0.3%Tewkesbury 5.4 0.0 0.3% 0.0 -0.2%
HAMPSHIREBasingstoke and Deane 10.3 0.0 0.4% 0.0 -0.2%East Hampshire 5.9 0.1 1.6% 0.0 0.2%Eastleigh 7.8 0.0 -0.1% 0.0 -0.5%Fareham 6.1 0.0 0.5% 0.0 -0.6%Gosport 7.1 0.0 -0.2% 0.0 0.2%Hart 3.9 0.1 1.9% 0.0 -0.5%Havant 9.9 0.0 -0.2% 0.0 0.0%New Forest 11.8 0.1 0.9% 0.0 0.2%Rushmoor 6.3 0.0 0.2% 0.0 0.0%Test Valley 7.3 0.0 0.5% 0.0 -0.2%Winchester 6.7 0.1 1.5% 0.0 0.4%
HERTFORDSHIREBroxbourne 7.0 0.1 1.0% 0.0 0.7%Dacorum 9.5 0.1 0.9% 0.0 0.3%East Hertfordshire 8.1 0.1 1.7% 0.0 0.6%Hertsmere 6.8 0.1 1.4% 0.1 0.8%North Hertfordshire 8.3 0.0 0.4% 0.0 -0.2%St Albans 7.0 0.2 2.5% 0.0 0.7%Stevenage 7.6 0.0 -0.4% 0.0 0.1%Three Rivers 5.1 0.1 1.6% 0.0 0.4%Watford 7.2 0.0 0.6% 0.1 0.7%Welwyn Hatfield 8.2 0.1 0.6% 0.0 0.4%
KENTAshford 8.6 0.0 0.2% 0.0 0.0%Canterbury 13.6 -0.1 -0.7% 0.0 -0.3%Dartford 7.6 0.0 0.3% 0.0 0.3%Dover 9.9 0.0 -0.2% 0.0 0.1%Gravesham 8.5 0.0 -0.2% 0.0 0.1%Maidstone 9.0 0.1 0.9% 0.0 0.0%Sevenoaks 6.1 0.1 2.1% 0.0 0.5%Shepway 10.1 0.0 0.0% 0.0 0.4%Swale 12.2 0.0 -0.3% 0.0 0.1%Thanet 13.4 0.0 -0.2% 0.0 0.3%Tonbridge and Malling 6.5 0.1 1.4% 0.0 0.1%Tunbridge Wells 6.5 0.1 1.5% 0.0 0.5%
202

Formula Grant Before Floor DampingLocal Authority
(£ million) (£ million) (%) (£ million) (%)
Difference from 2010-11 Indicative 2010-11 Indicative Allocation
Option CAS1 Option CAS2
LANCASHIREBurnley 11.8 -0.1 -0.9% 0.0 0.3%Chorley 8.6 -0.1 -0.9% -0.1 -0.6%Fylde 6.0 0.0 0.0% 0.0 -0.1%Hyndburn 10.3 -0.1 -1.2% 0.0 0.0%Lancaster 16.8 -0.2 -1.2% 0.0 -0.2%Pendle 11.2 -0.1 -1.0% 0.0 0.1%Preston 15.8 -0.1 -0.9% 0.0 0.1%Ribble Valley 4.3 0.0 -0.2% 0.0 -0.4%Rossendale 6.2 0.0 -0.7% 0.0 -0.2%South Ribble 7.6 0.0 -0.7% -0.1 -0.8%West Lancashire 9.6 -0.1 -0.6% 0.0 -0.2%Wyre 10.8 -0.1 -0.8% 0.0 -0.2%
LEICESTERSHIREBlaby 6.6 -0.1 -1.1% -0.1 -1.1%Charnwood 12.7 -0.1 -0.9% -0.1 -0.6%Harborough 5.6 0.0 0.1% 0.0 -0.4%Hinckley and Bosworth 7.6 0.0 -0.5% 0.0 -0.6%Melton 4.0 0.0 -0.2% 0.0 -0.1%North West Leicestershire 7.3 -0.1 -0.8% 0.0 -0.6%Oadby and Wigston 4.7 -0.1 -1.1% 0.0 -0.7%
LINCOLNSHIREBoston 7.4 -0.1 -0.7% 0.0 0.2%East Lindsey 17.9 -0.1 -0.8% 0.0 0.2%Lincoln 10.3 -0.1 -1.0% 0.0 0.0%North Kesteven 9.0 -0.1 -0.9% -0.1 -0.6%South Holland 9.3 -0.1 -0.9% 0.0 -0.1%South Kesteven 10.2 0.0 -0.5% 0.0 -0.4%West Lindsey 8.4 0.0 -0.5% 0.0 0.0%
NORFOLKBreckland 11.6 -0.1 -1.0% -0.1 -0.5%Broadland 8.7 0.0 -0.5% -0.1 -0.7%Great Yarmouth 10.9 -0.1 -0.7% 0.0 0.1%King's Lynn and West Norfolk 15.8 -0.1 -0.5% 0.0 0.2%North Norfolk 9.1 0.0 0.3% 0.0 0.4%Norwich 16.0 -0.1 -0.7% 0.0 0.3%South Norfolk 8.6 0.0 -0.2% 0.0 -0.4%
NORTH YORKSHIRECraven 4.3 0.0 0.5% 0.0 0.3%Hambleton 5.9 0.0 0.8% 0.0 0.2%Harrogate 11.5 0.0 0.3% 0.0 0.0%Richmondshire 4.4 0.0 -0.6% 0.0 -0.4%Ryedale 4.7 0.0 0.2% 0.0 0.4%Scarborough 12.6 0.0 -0.2% 0.1 0.6%Selby 6.8 0.0 -0.1% 0.0 0.1%
NORTHAMPTONSHIRECorby 5.6 0.0 -0.8% 0.0 0.0%Daventry 6.4 0.0 -0.4% 0.0 -0.3%East Northamptonshire 6.9 0.0 -0.6% 0.0 -0.5%Kettering 7.4 0.0 -0.5% 0.0 -0.3%Northampton 18.9 -0.1 -0.6% 0.0 0.0%South Northamptonshire 6.1 0.0 -0.2% 0.0 -0.6%Wellingborough 7.1 -0.1 -0.9% 0.0 -0.4%
203

Formula Grant Before Floor DampingLocal Authority
(£ million) (£ million) (%) (£ million) (%)
Difference from 2010-11 Indicative 2010-11 Indicative Allocation
Option CAS1 Option CAS2
NOTTINGHAMSHIREAshfield 11.6 -0.2 -1.3% -0.1 -0.5%Bassetlaw 11.4 -0.1 -1.0% 0.0 -0.3%Broxtowe 9.1 -0.1 -1.2% -0.1 -0.9%Gedling 9.4 -0.1 -0.8% 0.0 -0.4%Mansfield 10.3 -0.1 -0.8% 0.0 -0.1%Newark and Sherwood 10.5 -0.1 -0.7% 0.0 -0.2%Rushcliffe 7.3 0.0 -0.1% 0.0 -0.5%
OXFORDSHIRECherwell 11.2 0.0 -0.4% 0.0 -0.3%Oxford 16.9 -0.2 -1.0% 0.0 -0.1%South Oxfordshire 7.8 0.1 1.5% 0.0 0.4%Vale of White Horse 7.2 0.1 0.8% 0.0 0.0%West Oxfordshire 6.1 0.1 1.4% 0.0 0.3%
SOMERSETMendip 8.5 0.0 -0.2% 0.0 -0.2%Sedgemoor 10.3 0.0 -0.4% 0.0 0.0%South Somerset 11.2 0.0 0.0% 0.0 -0.2%Taunton Deane 8.9 0.0 -0.4% 0.0 -0.3%West Somerset 3.3 0.0 0.5% 0.0 0.7%
STAFFORDSHIRECannock Chase 8.6 -0.1 -1.1% 0.0 -0.5%East Staffordshire 9.6 -0.1 -0.7% 0.0 -0.3%Lichfield 6.1 0.0 0.6% 0.0 -0.1%Newcastle-under-Lyme 11.3 -0.1 -1.3% -0.1 -0.6%South Staffordshire 7.2 0.0 0.0% 0.0 -0.3%Stafford 8.8 0.0 -0.2% 0.0 -0.4%Staffordshire Moorlands 7.6 0.0 -0.2% 0.0 -0.1%Tamworth 6.9 -0.1 -1.1% 0.0 -0.5%
SUFFOLKBabergh 6.4 0.0 -0.1% 0.0 -0.3%Forest Heath 5.5 -0.1 -1.9% -0.1 -1.1%Ipswich 11.9 -0.1 -0.6% 0.0 0.0%Mid Suffolk 6.2 0.0 0.5% 0.0 0.0%St Edmundsbury 7.1 0.0 0.0% 0.0 -0.3%Suffolk Coastal 8.4 0.0 0.5% 0.0 0.0%Waveney 12.0 -0.1 -0.8% 0.0 -0.1%
SURREYElmbridge 6.5 0.2 3.1% 0.1 0.9%Epsom and Ewell 4.0 0.1 2.3% 0.0 0.8%Guildford 8.6 0.1 1.3% 0.0 0.5%Mole Valley 3.3 0.2 5.4% 0.1 1.9%Reigate and Banstead 6.9 0.2 2.5% 0.1 0.7%Runnymede 5.8 0.1 1.0% 0.0 0.5%Spelthorne 5.7 0.1 2.0% 0.1 0.9%Surrey Heath 4.7 0.1 2.4% 0.0 0.9%Tandridge 4.0 0.1 3.2% 0.0 1.0%Waverley 5.4 0.2 3.4% 0.1 1.0%Woking 5.8 0.1 2.0% 0.1 0.9%
WARWICKSHIRENorth Warwickshire 5.5 0.0 -0.7% 0.0 -0.2%Nuneaton and Bedworth 11.4 -0.1 -0.9% 0.0 -0.3%Rugby 6.6 0.0 0.4% 0.0 0.1%Stratford-on-Avon 6.9 0.1 1.9% 0.0 0.6%Warwick 10.5 0.0 0.1% 0.0 0.0%
204

Formula Grant Before Floor DampingLocal Authority
(£ million) (£ million) (%) (£ million) (%)
Difference from 2010-11 Indicative 2010-11 Indicative Allocation
Option CAS1 Option CAS2
WEST SUSSEXAdur 5.0 0.0 -0.1% 0.0 0.0%Arun 10.5 0.1 0.6% 0.0 0.1%Chichester 5.9 0.2 2.6% 0.1 0.9%Crawley 10.5 0.0 -0.3% 0.0 0.4%Horsham 6.0 0.1 2.3% 0.0 0.1%Mid Sussex 5.3 0.2 3.0% 0.0 0.2%Worthing 7.9 0.0 0.1% 0.0 0.1%
WORCESTERSHIREBromsgrove 5.2 0.0 0.7% 0.0 -0.5%Malvern Hills 5.2 0.0 0.6% 0.0 0.1%Redditch 6.4 0.0 -0.5% 0.0 -0.3%Worcester 7.8 0.0 -0.4% 0.0 -0.2%Wychavon 8.0 0.0 0.3% 0.0 -0.1%Wyre Forest 8.1 0.0 -0.3% 0.0 -0.1%
205

Formula Grant Before Floor DampingLocal Authority
(£ million) (£ million) (%) (£ million) (%)
Difference from 2010-11 Indicative 2010-11 Indicative Allocation
Option CAS1 Option CAS2
SHIRE POLICE AUTHORITIES
Avon & Somerset Police 197.6 -0.1 0.0% -0.6 -0.3%Bedfordshire Police 76.6 -0.1 -0.1% -0.2 -0.3%Cambridgeshire Police 86.2 0.0 0.0% -0.4 -0.5%Cheshire Police 114.1 0.2 0.2% -0.4 -0.3%Cleveland Police 99.0 -0.3 -0.3% 0.1 0.1%
Cumbria Police 56.1 0.0 0.0% -0.2 -0.4%Derbyshire Police 120.7 -0.3 -0.3% -0.5 -0.4%Devon & Cornwall Police 191.7 0.0 0.0% -0.8 -0.4%Dorset Police 64.3 0.4 0.6% -0.3 -0.5%Durham Police 87.0 -0.2 -0.2% -0.1 -0.1%
Essex Police 187.3 0.4 0.2% -0.6 -0.3%Gloucestershire Police 58.5 0.1 0.2% -0.3 -0.5%Hampshire Police 215.0 0.3 0.1% -0.7 -0.3%Hertfordshire Police 128.9 0.6 0.5% -0.1 -0.1%Humberside Police 132.9 -0.5 -0.4% -0.3 -0.2%
Kent Police 200.2 0.3 0.2% -0.5 -0.2%Lancashire Police 212.3 -0.6 -0.3% -0.4 -0.2%Leicestershire Police 124.2 -0.3 -0.2% -0.4 -0.3%Lincolnshire Police 69.0 -0.2 -0.3% -0.6 -0.9%Norfolk Police 88.5 -0.1 -0.1% -0.5 -0.6%
North Yorkshire Police 73.1 0.1 0.1% -0.5 -0.7%Northamptonshire Police 78.4 -0.1 -0.1% -0.3 -0.4%Nottinghamshire Police 152.7 -0.5 -0.3% -0.3 -0.2%Staffordshire Police 125.1 -0.2 -0.2% -0.5 -0.4%Suffolk Police 71.0 0.0 0.0% -0.5 -0.6%
Surrey Police 101.3 1.1 1.1% -0.2 -0.2%Sussex Police 167.1 0.7 0.4% -0.5 -0.3%Thames Valley Police 248.5 1.0 0.4% -0.5 -0.2%Warwickshire Police 56.1 0.1 0.2% -0.2 -0.4%West Mercia Police 114.3 0.1 0.1% -0.8 -0.7%
Wiltshire Police 64.1 0.2 0.3% -0.3 -0.5%
206

Formula Grant Before Floor DampingLocal Authority
(£ million) (£ million) (%) (£ million) (%)
Difference from 2010-11 Indicative 2010-11 Indicative Allocation
Option CAS1 Option CAS2
SHIRE FIRE AUTHORITIES
Avon Fire 24.6 0.0 -0.1% -0.1 -0.3%Bedfordshire Fire 11.7 0.0 -0.2% -0.1 -0.8%Berkshire Fire Auhtority 13.0 0.2 1.5% 0.0 -0.2%Buckinghamshire Fire 9.1 0.2 1.8% -0.1 -1.0%Cambridgeshire Fire 15.1 0.0 0.0% -0.1 -0.6%
Cheshire Fire 19.3 0.1 0.5% -0.1 -0.4%Cleveland Fire 21.7 -0.1 -0.5% 0.1 0.5%Derbyshire Fire 20.6 -0.1 -0.5% -0.2 -0.8%Devon and Somerset Fire 32.1 0.1 0.2% -0.2 -0.5%Dorset Fire 11.1 0.2 1.6% 0.0 -0.3%
Durham Fire 14.9 -0.1 -0.5% 0.0 -0.3%East Sussex Fire 15.0 0.1 0.8% 0.0 -0.1%Essex Fire Auhtority 33.3 0.2 0.6% -0.1 -0.2%Hampshire Fire 29.9 0.1 0.4% -0.2 -0.7%Hereford & Worcester Fire 10.8 0.1 0.7% -0.1 -1.1%
Humberside Fire 28.2 -0.2 -0.6% 0.0 0.0%Kent Fire 30.2 0.2 0.6% -0.1 -0.5%Lancashire Fire 32.6 -0.2 -0.6% -0.2 -0.7%Leicestershire Fire 19.2 -0.1 -0.5% -0.2 -0.9%North Yorkshire Fire 11.6 0.1 0.5% -0.1 -1.3%
Nottinghamshire Fire 26.3 -0.2 -0.7% -0.1 -0.5%Shropshire Fire 8.6 0.0 -0.2% -0.1 -0.8%Staffordshire Fire 19.1 -0.1 -0.3% -0.2 -1.1%Wiltshire Fire 9.7 0.1 1.0% -0.1 -0.8%
207

208
Chapter 11 Floor Damping Levels 1. In 2001-02, floor damping was introduced for authorities with education and social service responsibility. The following year, i.e. 2002-03, this was introduced for all authorities. To ensure stability in the financing of local services, Government sets a “floor” or lower limit to any authority’s change in their Formula Grant allocation year-on-year. This floor works on a like-for-like basis i.e. after adjusting for changes in funding and function. The floor is paid for by scaling back the change above the floor for other authorities1.
2. Authorities are split into four groups as follows:
• authorities with responsibility for education and personal social services (“education/PSS authorities”);
• police authorities (except the City of London and the Metropolitan Police Authority) and the Greater London Authority (police part);
• fire authorities (except the London Fire and Civil Defence Authority) and the Greater London Authority (fire part); and
• shire districts in two tier shire areas (i.e. those shire districts which do not have responsibility for education and personal social services).
3. The floor damping system is self-financing within each group of authorities. Authorities in one group do not cross-subsidise the floor for authorities in another group.
4. The reduction in grant for authorities above the floor is calculated by applying a constant re-scaling factor to each authority’s change in grant above their floor level (not their total grant change). The re-scaling factor is calculated so that when it is applied to all authorities within the group, the saving exactly offsets the net cost of the floor. The fact that the scaling factor is only applied to changes above the floor level means that no authority can move from the ‘scaled’ group to the floor group.
5. The diagram overleaf is a visual interpretation of how this system worked for shire districts in 2010-11 when the floor level was an increase of 0.5%. As can be seen, the net cost of the floor is met by a reduction for the scaled authorities. This is demonstrated by the vertical gap between the scaled authorities grant changes before and after the application of the floors damping scheme. 1 Prior to 2005/06, the cost of the floor was partially paid for by limiting the change in formula grant year-on-year on a like-for-like basis to a maximum (the ‘ceiling’) and partially through the scaling factor. The ceiling was abolished in 2005/06.
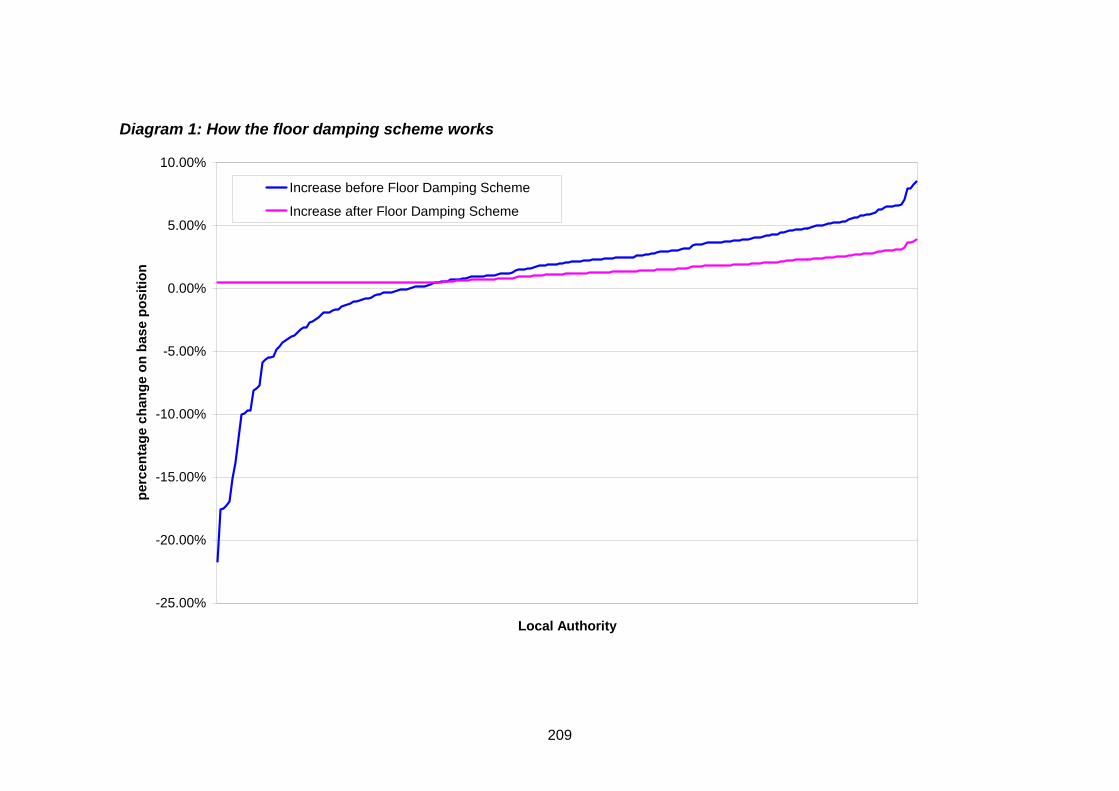
209
Diagram 1: How the floor damping scheme works
-25.00%
-20.00%
-15.00%
-10.00%
-5.00%
0.00%
5.00%
10.00%
Local Authority
perc
enta
ge c
hang
e on
bas
e po
sitio
n
Increase before Floor Damping Scheme
Increase after Floor Damping Scheme
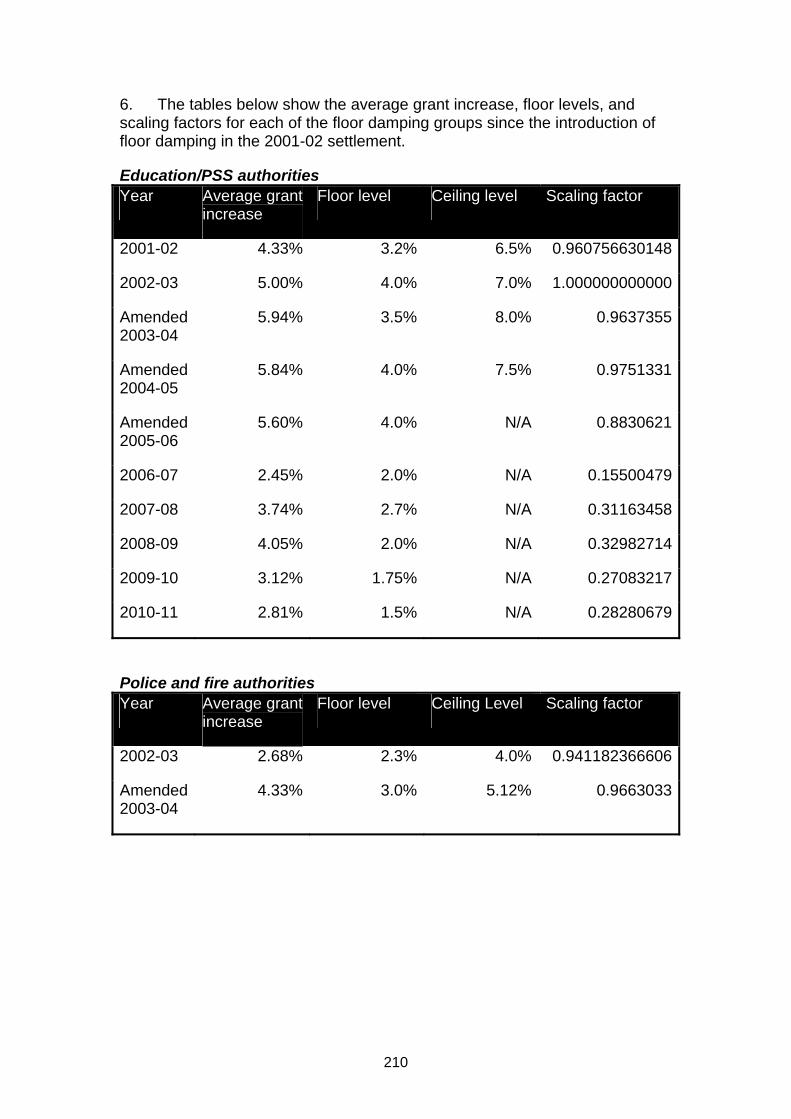
210
6. The tables below show the average grant increase, floor levels, and scaling factors for each of the floor damping groups since the introduction of floor damping in the 2001-02 settlement.
Education/PSS authorities Year Average grant
increase Floor level Ceiling level Scaling factor
2001-02 4.33% 3.2% 6.5% 0.960756630148
2002-03 5.00% 4.0% 7.0% 1.000000000000
Amended 2003-04
5.94% 3.5% 8.0% 0.9637355
Amended 2004-05
5.84% 4.0% 7.5% 0.9751331
Amended 2005-06
5.60% 4.0% N/A 0.8830621
2006-07 2.45% 2.0% N/A 0.15500479
2007-08 3.74% 2.7% N/A 0.31163458
2008-09 4.05% 2.0% N/A 0.32982714
2009-10 3.12% 1.75% N/A 0.27083217
2010-11 2.81% 1.5% N/A 0.28280679
Police and fire authorities Year Average grant
increase Floor level Ceiling Level Scaling factor
2002-03 2.68% 2.3% 4.0% 0.941182366606
Amended 2003-04
4.33% 3.0% 5.12% 0.9663033

211
Police authorities Year Average grant
increase Floor level Ceiling level Scaling factor
Amended 2004-05
3.255% 3.25% 25.0% 0.0029163
Amended 2005-06
4.68% 3.75% N/A 0.4196641
2006-07 3.155% 3.1% N/A 0.02836451
2007-08 3.639% 3.6% N/A 0.02078029
2008-09 2.781% 2.5% N/A 0.12032127
2009-10 2.769% 2.5% N/A 0.12651676
2010-11 2.768% 2.5% N/A 0.13761671
Fire authorities
Average grant increase
Floor level Ceiling Level Scaling factor
Amended 2004-05
4.65% 3.5% 5.8% 0.9386219
Amended 2005-06
3.62% 2.5% N/A 0.5752055
2006-07 1.91% 1.5% N/A 0.12824803
2007-08 2.96% 2.7% N/A 0.08891056
2008-09 2.36% 1.0% N/A 0.36115776
2009-10 1.42% 0.5% N/A 0.33235550
2010-11 1.42% 0.5% N/A 0.40857380

212
Shire district authorities Year Average grant
increase Floor level Ceiling level Scaling factor
2002-03 3.90% 2.3% 10.0% 0.925944151969
Amended 2003-04
7.42% 3.0% 12.5% 0.9618019
Amended 2004-05
3.93% 3.0% 50.0% 0.2874417
Amended 2005-06
3.58% 2.5% N/A 0.3515565
2006-07 4.67% 3.1% N/A 0.49038101
2007-08 4.70% 2.7% N/A 0.61588206
2008-09 1.67% 1.0% N/A 0.27366508
2009-10 1.35% 0.5% N/A 0.37558387
2010-11 1.35% 0.5% N/A 0.42121570
7. Over the next Spending Review period it would still be possible to set a range of floor levels, including setting negative floors.
8. Where the scaling factor is higher more of the formula change will come through for authorities above the floor than if the scaling factor was lower. For the same average grant change for the floor group the only way of making the scaling factor higher is to lower the level of the floor. Therefore if the floor is set very close to the average it means that the distribution of formula grant will be very similar to that for the adjusted prior year’s grant. Whereas if the floor is set further away from the average more of the formula change will come through for authorities above the floor.
Questions
Question 17: Over the next Spending Review period do you think that the floor level should be set close to the average change or such that it allows some formula change to come through for authorities above the floor?

213
Chapter 12 Transfers and Adjustments 1. A transfer occurs when money either moves in to or moves out of the settlement due to changes in funding or function. Changes in funding typically involve transfers into formula grant of funds previously distributed to local government via a specific grant route; or vice versa. Changes in function typically involve local authorities taking on extra duties or responsibilities, or the transfer of these away from local government to another body.
2. Once we have identified the transfers that will be occurring, we then have to consider:
(i) what is the most appropriate Relative Needs Formula (RNF) for the service to which the transfer relates;
(ii) whether we need to adjust this formula to take into account the different relative need to spend between authorities of the function being transferred in; and
(iii) how to notionally adjust the base position for the purposes of floor damping. (A description of floor damping can be found at Chapter 13.)
3. In deciding what is the most appropriate RNF for a new service to be reflected in, we need to consider:
(i) the type of service that is being transferred; and
(ii) what tier of government will be providing the service.
For example, if this new service is going to be provided by shire districts in two-tier areas then we would normally transfer this into the District-level EPCS RNF.
4. Where a service is being transferred out of formula grant, we already know which RNF reflects the relative need to spend on this service.
5. In deciding whether or not to adjust distribution of the most appropriate RNF, we consider both the size of the transfer and the distribution of relative needs for the service being transferred.
6. If the distribution of relative needs for the service being transferred is similar to the existing formula then there is no need to amend the formula. If, on the other hand, the distribution of the new service is sufficiently different from the existing distribution, and the size of the transfer is sufficiently large to warrant changing the formula, then we need to consider whether to amend the formula appropriately. If the size of the transfer is very small compared to the size of the services being supported through the RNF then any adjustments to the formula would have virtually no effect on the final

214
distribution of formula grant – in such cases we would probably not amend the formula.
7. For example, in 2006-07 when an additional £350 million was transferred into formula grant to reflect the additional costs of implementing the free-fare concessionary fares scheme, we increased the weighting on only some of the indicators used in the district-level EPCS RNF – incapacity benefit and severe disablement allowance, elderly on income support/income based jobseeker’s allowance and population density.
8. In order to make a like-for-like comparison between financial years for floor purposes, the grant figure for the preceding financial year (also known as the ‘base year’) is notionally adjusted (if necessary) to allow for changes in funding or function. A notional adjustment for these purposes to the base year is calculated both in aggregate for local government as a whole, and for individual authorities that are affected by the adjustment.
9. So, for example, to calculate the grant increase for 2010-11 for floor purposes, the 2009-10 grant figure for each authority is notionally adjusted. It is important to note that this does not change in any way the actual formula grant that authorities receive for 2009-10. Instead it is simply a calculation which is carried out in for the purposes of operating the floor mechanism for 2010-11. The adjustment is only calculated once, and applied to the year before that in which the change in funding or function occurs.
10. Adjustments for floor purposes are not generally made for the majority of funding increases in Spending Reviews as these reflect a broad assessment of spending pressures, efficiencies and affordability.
11. There are two main ways used to calculate an adjustment to the base for a transfer into formula grant:
(i) where an existing specific grant has been transferred into formula grant, allocations of that specific grant in the base year are used in calculating the amount of the adjustment. For example, in 2008-09 when the Delayed Discharges Grant was transferred into formula grant, we adjusted the 2007-08 base position by the 2007-08 allocations of the Delayed Discharges Grant.
(ii) where there is not a previous specific grant, the adjustment for each authority is calculated by multiplying the England total for the adjustment by that authority’s proportion of the England total for the relevant RNF. For example, in 2008-09 when funding for law enforcement on animal feed was transferred into formula grant, we adjusted the 2007-08 base position proportional to share of the County-level EPCS RNF.
12. There are two main ways used to calculate the adjustment to the base for a transfer out of formula grant:

215
(iii) where separate expenditure data on the service being transferred out of formula grant exists, the adjustment is generally pro-rata to that expenditure data. For example, in 2006-07 when schools were transferred out of formula grant, we adjusted the 2005-06 base position proportional to the 2005-06 schools budget.
(iv) where there is not separate expenditure data on the service being transferred out of formula grant, the adjustment for each authority is calculated by multiplying the England total for the adjustment by that authority’s proportion of the England total for the relevant RNF.
Police Funding
13. With effect from 2006/07, four specific grants were converted to special formula grants under an additional Rule 2 in the Police Grant Report. This change gave police authorities more control over specific grants and enabled them to operate more flexibly.
14. In 2008-09 a further specific grant was added to Rule 2.
15. The effect of this change has been that the grants continue to be paid as before to police authorities but they became unhypothecated. The grants in question, and the original amounts for 2010-11, are:
Rural Policing Fund £30m Forensic Grant £45.6m Special Priority Payments Grant £69m London/SE Allowances Grant £47.9m Integrated Police Learning and Development Programme £16.2m
Total £208.8m
16. The 2010-11 Additional Rule 2 allocations were amended by the Police Grant Report (England and Wales) 2010/11: Amending Report 2010/11, the amended total for these grants is £93.8 m.
216
Option POL3: Rolling part of the Additional Rule 2 grant into principal formula Police Grant
Amount of grant to be transferred
17. The amended total of the Forensic Grant, the Special Priority Payments Grant and the Integrated Police Learning and Development Programme for 2010-11 less the reduction in 2010-11, where possible, has been added to the principal formula Police Grant. The amended total for these grants is £23.2 m.
Changes to the formula
18. The police formula has not been altered for this transfer.
Adjusting the base position
19. We have notionally adjusted the 2009-10 formula grant by adding in the Forensic Grant, the Special Priority Payments and the Integrated Police Learning and Development Programme elements of the 2009-10 Additional Rule 2.
20. As the 2010-11 Additional Rule 2 allocations were amended by the Police Grant Report (England and Wales) 2010/11: Amending Report 2010/11, the amount of grant rolled in was much less than the notional adjustment to the base position. For this reason the average grant increase on a like-for-like basis for police authorities has decreased from 2.77% to 1.42%. We have therefore adjusted the level of the floor from 2.5% to 1.2% which gives broadly the same scaling factor as at settlement.
Option POL4: Rolling Additional Rule 2 grant into principal formula Police Grant
21. Amount of grant to be transferred The amended total of the Additional Rule 2 funding for 2010-11 has been added to the principal formula Police Grant.
Changes to the formula
22. The police formula has not been altered for this transfer.
Adjusting the base position
23. We have notionally adjusted the 2009-10 formula grant by adding in the 2009-10 Additional Rule 2 allocations.
24. As the 2010-11 Additional Rule 2 allocations were amended by the Police Grant Report (England and Wales) 2010/11: Amending Report 2010/11, the amount of grant rolled in was much less than the notional adjustment to the base position. For this reason the average grant increase on a like-for-like basis for police authorities has decreased from 2.77% to 1.33%. We have therefore adjusted the level of the floor from 2.5% to 1.0% which gives broadly the same scaling factor as at settlement.
217
Concessionary Travel
25. Concessionary travel is one of the services currently covered by the district-level EPCS formula. Since the original judgements on weightings were reached for 2003-04, there have been two further substantial policy changes in the area of this sub-block.
26. First, the Budget 2005 announced a free concessionary bus fare scheme for people aged over 60 and disabled people, which was funded by an extra £350 million added to formula grant in 2006-07. This led to us increasing the judgemental weightings on population density, pensioners on income support and incapacity benefit/severe disablement allowance.
27. Second, the Budget 2006 announced a further extension of this scheme starting in 2008-09 to enable concessionaires to travel for free anywhere in England. The extra funding for this extension is currently distributed through a special grant.
28. From 1 April 2011 responsibility for concessionary travel in two-tier areas will move from the district councils to the county councils. In order to reflect this in the Local Government Finance Settlement we will move concessionary fares from the district-level formula to the county-level formula. This can be thought of as a two transfers – a transfer out of formula grant for shire districts and a transfer in to formula grant for shire counties.
Amount of grant to be transferred
29. The amount of grant transferred is likely to be decided during the Spending Review. For the purposes of the exemplifications we have used the 2008-09 Net Revenue Expenditure for Concessionary Travel ie £813.388 million.
Removing concessionary travel from the district-level EPCS RNF
30. There are two basic options.
31. In the first option the district-level EPCS RNF control total would be reduced by an amount to reflect the concessionary travel NRE. No other changes to the formula would be made.
32. However, Budget 2005 announced a free concessionary bus fare scheme for people aged 60 and disabled people, which was funded by an extra £350 million added to the district-level EPCS sub-block.
33. The district-level EPCS formula was re-weighted, increasing the weighting on:
• population density from £5.88 to £5.90; • pensioners on Income Support from £131.82 to £240.00; and

218
• Incapacity Benefit / Severe Disablement Allowance from £131.82 to £240.00.
34. The second option is therefore to reverse this change to the weightings.
Adjusting the base position for lower-tier authorities
35. Again there are two basic options.
36. We could notionally adjust the prior year’s formula grant based on each authority’s net revenue expenditure on concessionary travel or prorata to the change to the district-level EPCS RNF.
37. This therefore leads to four potential options for transferring concessionary travel from the lower-tier authorities.
Option CONCF1
38. We have kept the district-level EPCS formula unchanged and adjusted the base position by the 2008-09 Concessionary Travel Net Revenue Expenditure. This is the same data we have used for the concessionary travel control total.
39. The average grant increase on a like-for-like basis for authorities with responsibility for education and personal social services has increased from 2.81% to 3.23%. We have therefore adjusted the level of the floor from 1.5% to 1.9% which gives broadly the same scaling factor as at settlement.
40. The reason for this increase is in the way we determine how much grant should go to each of the four floor damping groups. We set the shares of taxbase such that the percentage increase in formula grant is broadly proportional to the percentage increase in RNFs for the four groups on a like-for-like basis.
41. The average grant increase on a like-for-like basis for shire districts has decreased from 1.35% to -1.82%. We have therefore adjusted the level of the floor from 0.5% to -3.3% which gives broadly the same scaling factor as at settlement.
Option CONCF2
42. We have kept the district-level EPCS formula unchanged and adjusted the base position prorata to the district-level EPCS formula.
43. The average grant increase on a like-for-like basis for authorities with responsibility for education and personal social services has increased from 2.81% to 2.90%. We have therefore adjusted the level of the floor from 1.6% to 1.9% which gives broadly the same scaling factor as at settlement.
44. The average grant increase on a like-for-like basis for shire districts has remained broadly the same and we have therefore left the floor level unchanged.

219
Option CONCF3
45. We have used the 2005-06 district-level EPCS formula and adjusted the base position by the 2008-09 Concessionary Travel Net Revenue Expenditure.
46. The average grant increase on a like-for-like basis for authorities with responsibility for education and personal social services has increased from 2.81% to 3.29%. We have therefore adjusted the level of the floor from 1.5% to 2.1% which gives broadly the same scaling factor as at settlement.
47. The average grant increase on a like-for-like basis for shire districts has decreased from 1.35% to -2.41%. We have therefore adjusted the level of the floor from 0.5% to -4.0% which gives broadly the same scaling factor as at settlement.
Option CONCF4
48. We have used the 2005-06 district-level EPCS formula and adjusted the base position prorata to the district-level EPCS formula.
49. The average grant increase on a like-for-like basis for authorities with responsibility for education and personal social services has increased from 2.81% to 3.02%. We have therefore adjusted the level of the floor from 1.5% to 1.7% which gives broadly the same scaling factor as at settlement.
50. The average grant increase on a like-for-like basis for shire districts has decreased from 1.35% to 0.15%. We have therefore adjusted the level of the floor from 0.5% to -0.9% which gives broadly the same scaling factor as at settlement.
Adding concessionary travel to the county-level EPCS RNF
51. There are three basic options.
52. The first two options are based on regressions against past expenditure (the 2008-09 Concessionary Travel Net Current Expenditure) and the third is based on regression against the estimated concessionary travel trips data.
53. The partial formula for the first of the regressions against past expenditure is given below.
Basic amount
COUNTY SERVICES
EPCS BASIC AMOUNT
1.3006
Top-ups
COUNTY SERVICES
EPCS
17.5151 multiplied by INCOME SUPPORT/ INCOME BASED
JOBSEEKER’S ALLOWANCE/ GUARANTEE ELEMENT OF

220
DEPRIVATION TOP-UP
PENSION CREDIT CLAIMANTS; minus 3.3142 multiplied by WEALTHY ACHIEVERS
COUNTY SERVICES
EPCS CAR OWNERSHIP TOP-UP
3.1365 multiplied by SICK AND DISABLED PEOPLE IN
HOUSEHOLDS WITH NO CAR OR VAN
54. The partial formula for the second of the regressions against past expenditure is given below.
Basic amount
COUNTY SERVICES
EPCS BASIC AMOUNT
1.4533
Top-ups
COUNTY SERVICES
EPCS DENSITY TOP-UP
-2.5719 multiplied by POPULATION SPARSITY FOR PEOPLE AGED
60 AND OVER
COUNTY SERVICES
EPCS DEPRIVATION TOP-UP
17.1294 multiplied by INCAPACITY BENEFIT AND SEVERE
DISABLEMENT ALLOWANCE
COUNTY SERVICES
EPCS CAR OWNERSHIP TOP-UP
5.1353 multiplied by PEOPLE AGED 60 AND OVER WITH NO CAR
OR VAN
55. The concessionary trip estimates for county councils, unitary authorities, metropolitan transport authorities and London were derived by applying an estimate of the proportion of journeys that are concessionary (older/disabled/young people) derived from the 2008/09 PSV survey to the National Indicator figures of total patronage.
56. The concessionary trip data has been provided for the following modes of transport:
• Buses; • London Underground; • and light rail.
221
57. The partial formula for the regression against estimated concessionary trips is given below.
Top-ups
COUNTY SERVICES
EPCS DEPRIVATION TOP-UP
22.8808 multiplied by COUNTRY OF BIRTH OF RESIDENTS; minus 3.6705 multiplied by WEALTHY ACHIEVERS
COUNTY SERVICES
EPCS CAR OWNERSHIP TOP-UP
6.8381 multiplied by SICK AND DISABLED PEOPLE IN
HOUSEHOLDS WITH NO CAR OR VAN
58. We are additionally considering another independent variable – a measure of bus service density from the Department for Transport’s National Public Transport Data Repository. If this data meets the conditions for use in formula grant we will test this against the dependent variables.
Adjusting the base position for upper-tier authorities
59. There are two parts to the transfer into the county-level EPCS – the first part reflects the Net Revenue Expenditure (NRE) which is being transferred from the district-level EPCS and the second part reflects the transfer of the concessionary travel special grant into formula grant.
60. For the transfer from the districts, we believe that the adjustment to the base position for the upper-tier authorities should simply be the same as the transfer from the lower-tier authorities, summed where appropriate.
61. For the transfer from special grant there are two options – adjusting the base position by the allocation of the special grant or adjusting the base position pro-rata to the new concessionary fare formula. The 2010-11 Concessionary Travel Special Grant was revised on 3 March 2010; the 2009-10 allocations therefore differ from the revised 2010-11 allocations. This should be born in mind when looking at the exemplifications.
62. In illustrating these options we have used a separate Concessionary Travel RNF for convenience. However in practice there is no reason that the concessionary travel coefficients could not be simply added to the county-level EPCS coefficients to provide a single formula that allocates concessionary travel along with the other upper-tier EPCS services.
63. We have previously shown 4 options for transferring concessionary fares out of the lower-tier authorities. Since there are 6 options (3 formula options x 2 special grant transfer options) this means that there are a total of 24 potential concessionary travel combinations. Due to resource constraints it is not possible to exemplify all 24 options within this consultation paper. We are therefore intending to choose one lower-tier transfer option – Option CONCF3 – and exemplify the six upper-tier transfer options against this.

222
Option CONCF5
64. We have used the first formula derived from regression against Net Current expenditure and adjusted the base position for the Special Grant transfer by the 2009-10 Special Grant allocation.
65. The average grant increase on a like-for-like basis for authorities with responsibility for education and personal social services has increased from 2.78% to 3.02%. We have therefore adjusted the level of the floor from 1.5% to 1.8% which gives broadly the same scaling factor as at settlement.
66. The average grant increase on a like-for-like basis for shire districts has decreased from 1.34% to -1.86%. We have therefore adjusted the level of the floor from 0.5% to -3.5% which gives broadly the same scaling factor as at settlement.
Option CONCF6
67. We have used the first formula derived from regression against Net Current expenditure and adjusted the base position for the Special Grant transfer prorata to the new concessionary travel formula.
68. The average grant increase on a like-for-like basis for authorities with responsibility for education and personal social services has increased from 2.78% to 3.02%. We have therefore adjusted the level of the floor from 1.5% to 1.8% which gives broadly the same scaling factor as at settlement.
69. The average grant increase on a like-for-like basis for shire districts has decreased from 1.34% to -1.86%. We have therefore adjusted the level of the floor from 0.5% to -3.5% which gives broadly the same scaling factor as at settlement.
Option CONCF7
70. We have used the second formula derived from regression against Net Current expenditure and adjusted the base position for the Special Grant transfer by the 2009-10 Special Grant allocation.
71. The average grant increase on a like-for-like basis for authorities with responsibility for education and personal social services has increased from 2.78% to 3.02%. We have therefore adjusted the level of the floor from 1.5% to 1.8% which gives broadly the same scaling factor as at settlement.
72. The average grant increase on a like-for-like basis for shire districts has decreased from 1.34% to -1.84%. We have therefore adjusted the level of the floor from 0.5% to -3.4% which gives broadly the same scaling factor as at settlement.
Option CONCF8

223
73. We have used the second formula derived from regression against Net Current expenditure and adjusted the base position for the Special Grant transfer prorata to the new concessionary travel formula.
74. The average grant increase on a like-for-like basis for authorities with responsibility for education and personal social services has increased from 2.78% to 3.02%. We have therefore adjusted the level of the floor from 1.5% to 1.8% which gives broadly the same scaling factor as at settlement.
75. The average grant increase on a like-for-like basis for shire districts has decreased from 1.34% to -1.84%. We have therefore adjusted the level of the floor from 0.5% to -3.4% which gives broadly the same scaling factor as at settlement.
Option CONCF9
76. We have used the formula derived from regression against estimated concessionary trip data and adjusted the base position for the Special Grant transfer by the 2009-10 Special Grant allocation.
77. The average grant increase on a like-for-like basis for authorities with responsibility for education and personal social services has increased from 2.78% to 3.02%. We have therefore adjusted the level of the floor from 1.5% to 2.0% which gives broadly the same scaling factor as at settlement.
78. The average grant increase on a like-for-like basis for shire districts has decreased from 1.34% to -1.87%. We have therefore adjusted the level of the floor from 0.5% to -3.5% which gives broadly the same scaling factor as at settlement.
Option CONCF10
79. We have used the formula derived from regression against estimated concessionary trip data and adjusted the base position for the Special Grant transfer prorata to the new concessionary travel formula.
80. The average grant increase on a like-for-like basis for authorities with responsibility for education and personal social services has increased from 2.78% to 3.02%. We have therefore adjusted the level of the floor from 1.5% to 1.9% which gives broadly the same scaling factor as at settlement.
81. The average grant increase on a like-for-like basis for shire districts has decreased from 1.34% to -1.87%. We have therefore adjusted the level of the floor from 0.5% to -3.5% which gives broadly the same scaling factor as at settlement.
Unadopted Drains
Local authorities have in the past incurred costs where they have acted in default of the owner (of the sewer) or where the authority is an owner itself.

224
Under the Flood and Water Management Act, it is proposed to transfer such responsibility for “private sewers” from local authorities to sewerage and water companies. If a transfer from Formula Grant occurs, we propose to remove funding from the Lower Tier EPCS sub-block. Amount of grant to be transferred
82. The amount of grant, if any, transferred is likely to be decided during the Spending Review.
Changes to the formula
83. The lower-tier EPCS formula will not be altered for this transfer.
Adjusting the base position
84. We propose to adjust the base position prorata to the number of properties in each authority. This data will be calculated from the CTB1 form.
Questions
Question 4: Do you agree that the three elements of Additional Rule 2 Grant mentioned in Chapter 4 ‘Police’ paragraph 19 should be rolled into Principal Formula Police Grant (Main Grant) and therefore distributed as through the Police Allocation Formula (POL3)?
Question 5: Do you agree with that the whole of the Rule 2 grant should be rolled into Principal Formula Police Grant (Main Grant) and therefore distributed as through the Police Allocation Formula (POL4)?
Question 18: Which of the four options for removing concessionary travel from lower-tier authorities do you prefer (CONCF1, CONCF2, CONCF3, CONCF4)?
Question 19: Which of the six options for rolling in concessionary travel to upper-tier authorities do you prefer (CONCF5, CONCF6, CONCF7, CONCF8, CONCF9, CONCF10)?
Question 20: Should concessionary travel have its own sub-block?
Question 21: Do you agree with the methodology for adjusting the base position for unadopted drains?
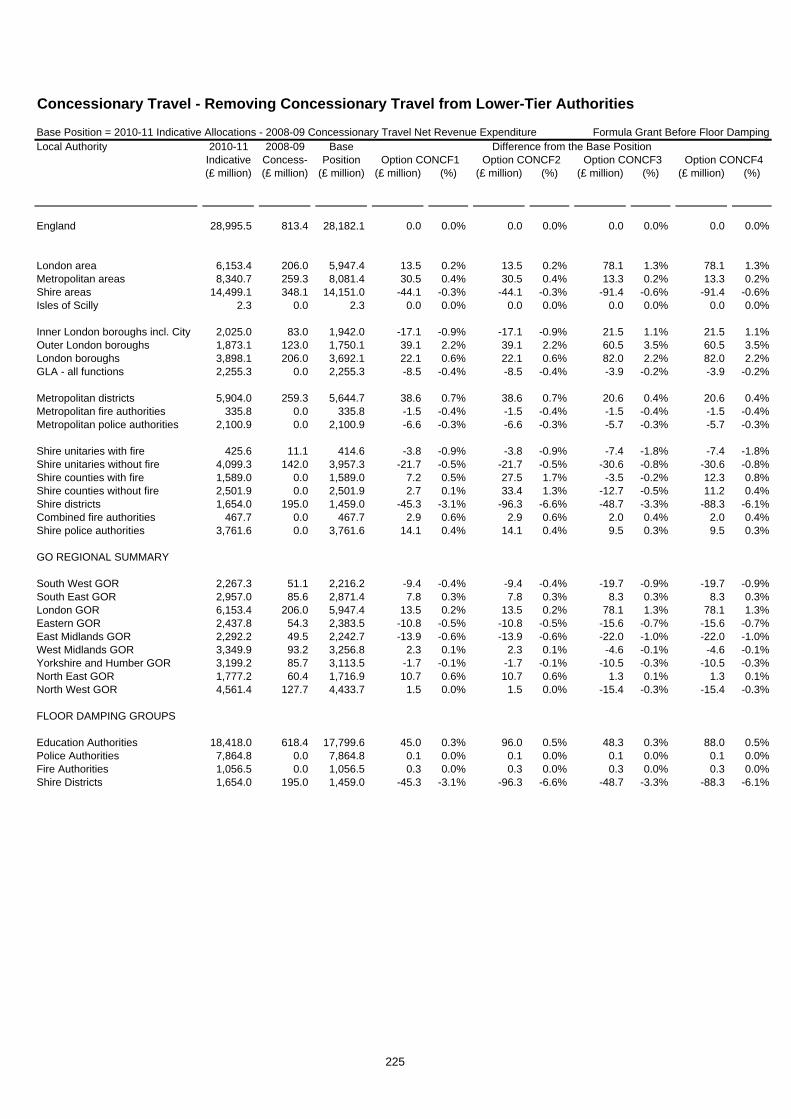
Base Position = 2010-11 Indicative Allocations - 2008-09 Concessionary Travel Net Revenue Expenditure Formula Grant Before Floor DampingLocal Authority
(£ million) (£ million) (£ million) (£ million) (%) (£ million) (%) (£ million) (%) (£ million) (%)
England 28,995.5 813.4 28,182.1 0.0 0.0% 0.0 0.0% 0.0 0.0% 0.0 0.0%
London area 6,153.4 206.0 5,947.4 13.5 0.2% 13.5 0.2% 78.1 1.3% 78.1 1.3%Metropolitan areas 8,340.7 259.3 8,081.4 30.5 0.4% 30.5 0.4% 13.3 0.2% 13.3 0.2%Shire areas 14,499.1 348.1 14,151.0 -44.1 -0.3% -44.1 -0.3% -91.4 -0.6% -91.4 -0.6%Isles of Scilly 2.3 0.0 2.3 0.0 0.0% 0.0 0.0% 0.0 0.0% 0.0 0.0%
Inner London boroughs incl. City 2,025.0 83.0 1,942.0 -17.1 -0.9% -17.1 -0.9% 21.5 1.1% 21.5 1.1%Outer London boroughs 1,873.1 123.0 1,750.1 39.1 2.2% 39.1 2.2% 60.5 3.5% 60.5 3.5%London boroughs 3,898.1 206.0 3,692.1 22.1 0.6% 22.1 0.6% 82.0 2.2% 82.0 2.2%GLA - all functions 2,255.3 0.0 2,255.3 -8.5 -0.4% -8.5 -0.4% -3.9 -0.2% -3.9 -0.2%
Metropolitan districts 5,904.0 259.3 5,644.7 38.6 0.7% 38.6 0.7% 20.6 0.4% 20.6 0.4%Metropolitan fire authorities 335.8 0.0 335.8 -1.5 -0.4% -1.5 -0.4% -1.5 -0.4% -1.5 -0.4%Metropolitan police authorities 2,100.9 0.0 2,100.9 -6.6 -0.3% -6.6 -0.3% -5.7 -0.3% -5.7 -0.3%
Shire unitaries with fire 425.6 11.1 414.6 -3.8 -0.9% -3.8 -0.9% -7.4 -1.8% -7.4 -1.8%Shire unitaries without fire 4,099.3 142.0 3,957.3 -21.7 -0.5% -21.7 -0.5% -30.6 -0.8% -30.6 -0.8%Shire counties with fire 1,589.0 0.0 1,589.0 7.2 0.5% 27.5 1.7% -3.5 -0.2% 12.3 0.8%Shire counties without fire 2,501.9 0.0 2,501.9 2.7 0.1% 33.4 1.3% -12.7 -0.5% 11.2 0.4%Shire districts 1,654.0 195.0 1,459.0 -45.3 -3.1% -96.3 -6.6% -48.7 -3.3% -88.3 -6.1%Combined fire authorities 467.7 0.0 467.7 2.9 0.6% 2.9 0.6% 2.0 0.4% 2.0 0.4%Shire police authorities 3,761.6 0.0 3,761.6 14.1 0.4% 14.1 0.4% 9.5 0.3% 9.5 0.3%
GO REGIONAL SUMMARY
South West GOR 2,267.3 51.1 2,216.2 -9.4 -0.4% -9.4 -0.4% -19.7 -0.9% -19.7 -0.9%South East GOR 2,957.0 85.6 2,871.4 7.8 0.3% 7.8 0.3% 8.3 0.3% 8.3 0.3%London GOR 6,153.4 206.0 5,947.4 13.5 0.2% 13.5 0.2% 78.1 1.3% 78.1 1.3%Eastern GOR 2,437.8 54.3 2,383.5 -10.8 -0.5% -10.8 -0.5% -15.6 -0.7% -15.6 -0.7%East Midlands GOR 2,292.2 49.5 2,242.7 -13.9 -0.6% -13.9 -0.6% -22.0 -1.0% -22.0 -1.0%West Midlands GOR 3,349.9 93.2 3,256.8 2.3 0.1% 2.3 0.1% -4.6 -0.1% -4.6 -0.1%Yorkshire and Humber GOR 3,199.2 85.7 3,113.5 -1.7 -0.1% -1.7 -0.1% -10.5 -0.3% -10.5 -0.3%North East GOR 1,777.2 60.4 1,716.9 10.7 0.6% 10.7 0.6% 1.3 0.1% 1.3 0.1%North West GOR 4,561.4 127.7 4,433.7 1.5 0.0% 1.5 0.0% -15.4 -0.3% -15.4 -0.3%
FLOOR DAMPING GROUPS
Education Authorities 18,418.0 618.4 17,799.6 45.0 0.3% 96.0 0.5% 48.3 0.3% 88.0 0.5%Police Authorities 7,864.8 0.0 7,864.8 0.1 0.0% 0.1 0.0% 0.1 0.0% 0.1 0.0%Fire Authorities 1,056.5 0.0 1,056.5 0.3 0.0% 0.3 0.0% 0.3 0.0% 0.3 0.0%Shire Districts 1,654.0 195.0 1,459.0 -45.3 -3.1% -96.3 -6.6% -48.7 -3.3% -88.3 -6.1%
Concessionary Travel - Removing Concessionary Travel from Lower-Tier Authorities
Option CONCF4Difference from the Base Position2010-11
Indicative 2008-09
Concess-Base
Position Option CONCF1 Option CONCF2 Option CONCF3
225

Base Position = 2010-11 Indicative Allocations - 2008-09 Concessionary Travel Net Revenue Expenditure Formula Grant Before Floor DampingLocal Authority
(£ million) (£ million) (£ million) (£ million) (%) (£ million) (%) (£ million) (%) (£ million) (%)Option CONCF4
Difference from the Base Position2010-11 Indicative
2008-09 Concess-
Base Position Option CONCF1 Option CONCF2 Option CONCF3
GREATER LONDON
City of London 91.1 0.4 90.7 -2.7 -3.0% -2.7 -3.0% -1.1 -1.2% -1.1 -1.2%
Camden 171.0 8.4 162.6 -1.0 -0.6% -1.0 -0.6% 3.0 1.8% 3.0 1.8%Greenwich 170.1 5.2 164.9 -1.6 -0.9% -1.6 -0.9% -0.2 -0.1% -0.2 -0.1%Hackney 201.8 6.6 195.2 -2.1 -1.1% -2.1 -1.1% 0.4 0.2% 0.4 0.2%Hammersmith and Fulham 94.3 6.2 88.1 0.8 1.0% 0.8 1.0% 3.1 3.5% 3.1 3.5%Islington 133.8 6.8 127.0 0.1 0.1% 0.1 0.1% 2.0 1.6% 2.0 1.6%Kensington and Chelsea 95.9 6.0 90.0 -0.6 -0.7% -0.6 -0.7% 3.4 3.8% 3.4 3.8%
Lambeth 180.3 8.5 171.8 0.1 0.0% 0.1 0.0% 2.7 1.6% 2.7 1.6%Lewisham 174.9 6.7 168.2 -0.6 -0.3% -0.6 -0.3% 1.2 0.7% 1.2 0.7%Southwark 210.2 6.9 203.3 -3.1 -1.5% -3.1 -1.5% 0.4 0.2% 0.4 0.2%Tower Hamlets 224.3 5.2 219.2 -5.2 -2.4% -5.2 -2.4% -1.3 -0.6% -1.3 -0.6%Wandsworth 98.6 7.9 90.7 2.0 2.2% 2.0 2.2% 4.5 5.0% 4.5 5.0%Westminster 178.8 8.4 170.4 -3.3 -1.9% -3.3 -1.9% 3.3 1.9% 3.3 1.9%
Barking and Dagenham 108.2 3.6 104.6 -0.7 -0.6% -0.7 -0.6% -0.2 -0.2% -0.2 -0.2%Barnet 97.9 9.6 88.2 4.8 5.5% 4.8 5.5% 6.3 7.2% 6.3 7.2%Bexley 64.5 4.1 60.4 1.3 2.1% 1.3 2.1% 1.8 3.0% 1.8 3.0%Brent 157.0 9.2 147.8 2.4 1.6% 2.4 1.6% 4.3 2.9% 4.3 2.9%Bromley 45.7 5.8 39.9 3.4 8.4% 3.4 8.4% 3.8 9.4% 3.8 9.4%
Croydon 118.4 7.0 111.4 1.8 1.6% 1.8 1.6% 3.2 2.8% 3.2 2.8%Ealing 129.0 9.8 119.1 3.9 3.3% 3.9 3.3% 5.6 4.7% 5.6 4.7%Enfield 126.7 7.2 119.5 1.8 1.5% 1.8 1.5% 2.9 2.5% 2.9 2.5%Haringey 137.6 8.5 129.0 2.7 2.1% 2.7 2.1% 4.3 3.3% 4.3 3.3%Harrow 66.6 6.1 60.4 3.0 5.0% 3.0 5.0% 3.9 6.5% 3.9 6.5%
Havering 52.3 5.1 47.2 2.6 5.5% 2.6 5.5% 2.6 5.5% 2.6 5.5%Hillingdon 85.6 5.6 80.0 1.8 2.2% 1.8 2.2% 2.6 3.2% 2.6 3.2%Hounslow 77.3 5.4 71.8 1.8 2.6% 1.8 2.6% 2.7 3.8% 2.7 3.8%Kingston upon Thames 32.6 2.9 29.7 1.1 3.8% 1.1 3.8% 1.8 6.0% 1.8 6.0%Merton 61.2 5.3 55.8 2.2 4.0% 2.2 4.0% 3.5 6.2% 3.5 6.2%
Newham 231.3 7.2 224.1 -1.9 -0.8% -1.9 -0.8% 0.8 0.4% 0.8 0.4%Redbridge 102.6 6.3 96.3 1.7 1.8% 1.7 1.8% 2.8 3.0% 2.8 3.0%Richmond upon Thames 9.6 4.7 4.9 3.4 70.2% 3.4 70.2% 4.1 83.6% 4.1 83.6%Sutton 45.1 3.4 41.7 1.2 2.8% 1.2 2.8% 1.7 4.2% 1.7 4.2%Waltham Forest 124.0 5.9 118.2 0.6 0.5% 0.6 0.5% 1.9 1.6% 1.9 1.6%
GLA - all functions 2,255.3 0.0 2,255.3 -8.5 -0.4% -8.5 -0.4% -3.9 -0.2% -3.9 -0.2%
GLA - police 2,002.3 0.0 2,002.3 -7.4 -0.4% -7.4 -0.4% -3.7 -0.2% -3.7 -0.2%GLA - fire 253.0 0.0 253.0 -1.1 -0.4% -1.1 -0.4% -0.2 -0.1% -0.2 -0.1%
226

Base Position = 2010-11 Indicative Allocations - 2008-09 Concessionary Travel Net Revenue Expenditure Formula Grant Before Floor DampingLocal Authority
(£ million) (£ million) (£ million) (£ million) (%) (£ million) (%) (£ million) (%) (£ million) (%)Option CONCF4
Difference from the Base Position2010-11 Indicative
2008-09 Concess-
Base Position Option CONCF1 Option CONCF2 Option CONCF3
GREATER MANCHESTERBolton 132.6 4.8 127.8 -0.2 -0.2% -0.2 -0.2% -0.8 -0.6% -0.8 -0.6%Bury 67.5 3.3 64.1 0.6 1.0% 0.6 1.0% 0.3 0.4% 0.3 0.4%Manchester 346.1 8.4 337.6 -4.6 -1.4% -4.6 -1.4% -4.6 -1.3% -4.6 -1.3%Oldham 127.6 4.0 123.6 -0.7 -0.6% -0.7 -0.6% -1.0 -0.8% -1.0 -0.8%Rochdale 114.9 3.8 111.1 -0.6 -0.5% -0.6 -0.5% -1.1 -1.0% -1.1 -1.0%Salford 131.2 4.0 127.2 -0.8 -0.6% -0.8 -0.6% -1.6 -1.2% -1.6 -1.2%Stockport 85.2 5.1 80.1 1.7 2.1% 1.7 2.1% 1.3 1.6% 1.3 1.6%Tameside 109.5 3.9 105.6 -0.2 -0.2% -0.2 -0.2% -0.8 -0.8% -0.8 -0.8%Trafford 67.3 3.9 63.4 1.1 1.8% 1.1 1.8% 1.0 1.5% 1.0 1.5%Wigan 138.6 5.6 133.0 0.2 0.2% 0.2 0.2% -1.1 -0.8% -1.1 -0.8%Greater Manchester Fire 76.1 0.0 76.1 -0.3 -0.4% -0.3 -0.4% -0.3 -0.4% -0.3 -0.4%Greater Manchester Police 485.7 0.0 485.7 -1.6 -0.3% -1.6 -0.3% -1.3 -0.3% -1.3 -0.3%
MERSEYSIDEKnowsley 114.6 4.7 109.9 0.6 0.6% 0.6 0.6% 0.0 0.0% 0.0 0.0%Liverpool 318.0 13.5 304.5 1.5 0.5% 1.5 0.5% 0.0 0.0% 0.0 0.0%Sefton 127.6 8.6 119.0 3.7 3.1% 3.7 3.1% 2.8 2.4% 2.8 2.4%St Helens 90.9 5.5 85.4 2.1 2.5% 2.1 2.5% 1.5 1.7% 1.5 1.7%Wirral 165.2 9.6 155.6 3.6 2.3% 3.6 2.3% 2.8 1.8% 2.8 1.8%Merseyside Fire 46.1 0.0 46.1 -0.3 -0.6% -0.3 -0.6% -0.2 -0.5% -0.2 -0.5%Merseyside Police 275.5 0.0 275.5 -1.1 -0.4% -1.1 -0.4% -0.8 -0.3% -0.8 -0.3%
SOUTH YORKSHIREBarnsley 114.3 5.0 109.3 0.9 0.9% 0.9 0.9% -0.2 -0.2% -0.2 -0.2%Doncaster 149.1 6.5 142.6 1.1 0.8% 1.1 0.8% 0.2 0.1% 0.2 0.1%Rotherham 130.1 5.7 124.5 1.0 0.8% 1.0 0.8% 0.3 0.2% 0.3 0.2%Sheffield 280.0 11.9 268.0 1.6 0.6% 1.6 0.6% 1.1 0.4% 1.1 0.4%South Yorkshire Fire 37.4 0.0 37.4 -0.1 -0.4% -0.1 -0.4% -0.2 -0.5% -0.2 -0.5%South Yorkshire Police 209.2 0.0 209.2 -0.4 -0.2% -0.4 -0.2% -0.5 -0.2% -0.5 -0.2%
TYNE AND WEARGateshead 102.7 6.8 95.9 3.0 3.1% 3.0 3.1% 2.2 2.3% 2.2 2.3%Newcastle upon Tyne 157.2 9.8 147.5 3.7 2.5% 3.7 2.5% 3.4 2.3% 3.4 2.3%North Tyneside 87.4 7.0 80.4 3.7 4.6% 3.7 4.6% 3.2 3.9% 3.2 3.9%South Tyneside 89.3 5.4 83.9 2.1 2.5% 2.1 2.5% 1.6 1.9% 1.6 1.9%Sunderland 158.9 10.0 148.8 4.1 2.8% 4.1 2.8% 2.9 1.9% 2.9 1.9%Tyne and Wear Fire 35.9 0.0 35.9 -0.2 -0.6% -0.2 -0.6% -0.2 -0.6% -0.2 -0.6%Northumbria Police 219.9 0.0 219.9 -0.4 -0.2% -0.4 -0.2% -0.4 -0.2% -0.4 -0.2%
WEST MIDLANDSBirmingham 698.9 25.6 673.3 0.2 0.0% 0.2 0.0% 1.7 0.2% 1.7 0.2%Coventry 156.6 7.8 148.8 1.8 1.2% 1.8 1.2% 1.7 1.1% 1.7 1.1%Dudley 130.4 7.7 122.7 2.8 2.3% 2.8 2.3% 2.3 1.9% 2.3 1.9%Sandwell 190.3 7.3 183.0 0.5 0.3% 0.5 0.3% 0.2 0.1% 0.2 0.1%Solihull 49.1 5.2 43.9 3.1 7.1% 3.1 7.1% 3.0 6.8% 3.0 6.8%Walsall 142.3 6.4 135.9 1.3 0.9% 1.3 0.9% 0.9 0.6% 0.9 0.6%Wolverhampton 145.6 5.9 139.6 0.7 0.5% 0.7 0.5% 0.4 0.3% 0.4 0.3%West Midlands Fire 81.6 0.0 81.6 -0.4 -0.5% -0.4 -0.5% -0.4 -0.5% -0.4 -0.5%West Midlands Police 542.2 0.0 542.2 -2.3 -0.4% -2.3 -0.4% -1.8 -0.3% -1.8 -0.3%
WEST YORKSHIREBradford 283.4 8.3 275.1 -2.2 -0.8% -2.2 -0.8% -2.0 -0.7% -2.0 -0.7%Calderdale 84.1 3.3 80.8 0.2 0.2% 0.2 0.2% -0.1 -0.1% -0.1 -0.1%Kirklees 164.9 6.7 158.2 0.5 0.3% 0.5 0.3% 0.0 0.0% 0.0 0.0%Leeds 305.9 12.8 293.1 0.5 0.2% 0.5 0.2% 0.5 0.2% 0.5 0.2%Wakefield 146.7 5.3 141.4 -0.1 -0.1% -0.1 -0.1% -1.2 -0.9% -1.2 -0.9%West Yorkshire Fire 58.7 0.0 58.7 -0.1 -0.2% -0.1 -0.2% -0.2 -0.3% -0.2 -0.3%West Yorkshire Police 368.2 0.0 368.2 -0.8 -0.2% -0.8 -0.2% -0.8 -0.2% -0.8 -0.2%
227

Base Position = 2010-11 Indicative Allocations - 2008-09 Concessionary Travel Net Revenue Expenditure Formula Grant Before Floor DampingLocal Authority
(£ million) (£ million) (£ million) (£ million) (%) (£ million) (%) (£ million) (%) (£ million) (%)Option CONCF4
Difference from the Base Position2010-11 Indicative
2008-09 Concess-
Base Position Option CONCF1 Option CONCF2 Option CONCF3
ALL PURPOSE AUTHORITIES
Bath & North East Somerset 44.1 3.0 41.1 1.1 2.6% 1.1 2.6% 1.0 2.4% 1.0 2.4%Bedford 55.4 1.7 53.7 -0.6 -1.1% -0.6 -1.1% -0.5 -0.9% -0.5 -0.9%Blackburn with Darwen 88.5 2.4 86.1 -0.9 -1.0% -0.9 -1.0% -1.0 -1.2% -1.0 -1.2%Blackpool 86.9 3.7 83.2 0.3 0.4% 0.3 0.4% -0.1 -0.2% -0.1 -0.2%Bournemouth 49.4 2.8 46.6 0.7 1.6% 0.7 1.6% 0.3 0.7% 0.3 0.7%
Bracknell Forest 22.6 0.7 21.9 -0.5 -2.3% -0.5 -2.3% -0.2 -0.7% -0.2 -0.7%Brighton & Hove 89.8 5.8 83.9 1.6 1.9% 1.6 1.9% 2.0 2.3% 2.0 2.3%Bristol 171.2 5.8 165.4 -1.4 -0.8% -1.4 -0.8% -1.2 -0.7% -1.2 -0.7%Central Bedfordshire 51.9 1.5 50.5 -0.9 -1.7% -0.9 -1.7% -1.0 -1.9% -1.0 -1.9%Cheshire East 64.5 2.4 62.0 -0.5 -0.8% -0.5 -0.8% -1.2 -1.9% -1.2 -1.9%
Cheshire West & Chester 94.9 3.3 91.6 -0.6 -0.6% -0.6 -0.6% -1.3 -1.4% -1.3 -1.4%Cornwall 227.6 3.4 224.1 -4.5 -2.0% -4.5 -2.0% -6.6 -2.9% -6.6 -2.9%Darlington 40.1 2.8 37.4 1.2 3.2% 1.2 3.2% 1.0 2.5% 1.0 2.5%Derby 114.5 5.8 108.7 1.5 1.4% 1.5 1.4% 1.5 1.4% 1.5 1.4%Durham 238.7 7.6 231.1 -1.3 -0.6% -1.3 -0.6% -4.3 -1.9% -4.3 -1.9%
East Riding of Yorkshire 109.2 3.2 105.9 -1.1 -1.0% -1.1 -1.0% -1.9 -1.8% -1.9 -1.8%Halton 65.5 1.7 63.8 -0.7 -1.0% -0.7 -1.0% -1.1 -1.7% -1.1 -1.7%Hartlepool 54.0 1.3 52.7 -0.8 -1.4% -0.8 -1.4% -1.1 -2.2% -1.1 -2.2%Herefordshire 61.2 1.6 59.6 -0.8 -1.4% -0.8 -1.4% -1.4 -2.3% -1.4 -2.3%Isle of Wight Council 65.0 4.9 60.1 2.7 4.5% 2.7 4.5% 2.4 3.9% 2.4 3.9%
Kingston upon Hull 159.2 5.3 153.9 -0.7 -0.5% -0.7 -0.5% -1.0 -0.6% -1.0 -0.6%Leicester 188.4 5.4 183.0 -1.9 -1.0% -1.9 -1.0% -1.2 -0.6% -1.2 -0.6%Luton 94.6 3.3 91.3 -0.4 -0.4% -0.4 -0.4% 0.2 0.2% 0.2 0.2%Medway 89.5 3.0 86.5 -0.6 -0.7% -0.6 -0.7% -0.3 -0.3% -0.3 -0.3%Middlesbrough 85.4 2.3 83.1 -0.8 -1.0% -0.8 -1.0% -1.2 -1.4% -1.2 -1.4%
Milton Keynes 91.6 1.8 89.8 -1.6 -1.8% -1.6 -1.8% -1.2 -1.3% -1.2 -1.3%North East Lincolnshire 76.9 1.6 75.3 -1.3 -1.7% -1.3 -1.7% -1.5 -1.9% -1.5 -1.9%North Lincolnshire 66.3 1.3 64.9 -1.1 -1.8% -1.1 -1.8% -1.5 -2.4% -1.5 -2.4%North Somerset 54.6 2.0 52.5 -0.3 -0.5% -0.3 -0.5% -0.6 -1.2% -0.6 -1.2%Northumberland 133.1 2.7 130.4 -2.0 -1.5% -2.0 -1.5% -3.2 -2.4% -3.2 -2.4%
Nottingham 179.5 7.5 172.1 0.6 0.3% 0.6 0.3% 0.7 0.4% 0.7 0.4%Peterborough 80.9 2.1 78.8 -0.8 -1.0% -0.8 -1.0% -0.8 -1.0% -0.8 -1.0%Plymouth 108.7 3.9 104.8 -0.3 -0.3% -0.3 -0.3% -0.6 -0.6% -0.6 -0.6%Poole 25.6 2.0 23.6 1.0 4.1% 1.0 4.1% 0.8 3.4% 0.8 3.4%Portsmouth 87.8 3.1 84.7 -0.9 -1.1% -0.9 -1.1% -0.2 -0.2% -0.2 -0.2%
Reading 48.0 2.1 45.9 0.0 -0.1% 0.0 -0.1% 0.4 0.9% 0.4 0.9%Redcar and Cleveland 71.4 2.1 69.3 -0.6 -0.8% -0.6 -0.8% -1.0 -1.4% -1.0 -1.4%Rutland 8.6 0.0 8.6 -0.4 -4.5% -0.4 -4.5% -0.5 -5.4% -0.5 -5.4%Shropshire 97.4 1.9 95.5 -1.8 -1.9% -1.8 -1.9% -2.8 -2.9% -2.8 -2.9%Slough 52.8 1.8 51.0 -0.5 -0.9% -0.5 -0.9% 0.0 0.0% 0.0 0.0%
South Gloucestershire 64.0 1.8 62.2 -0.9 -1.5% -0.9 -1.5% -0.9 -1.5% -0.9 -1.5%Southampton 101.2 2.5 98.7 -1.7 -1.7% -1.7 -1.7% -1.4 -1.4% -1.4 -1.4%Southend-on-Sea 62.3 1.7 60.6 -0.8 -1.3% -0.8 -1.3% -0.8 -1.3% -0.8 -1.3%Stockton-on-Tees 80.6 2.5 78.1 -0.6 -0.8% -0.6 -0.8% -1.0 -1.2% -1.0 -1.2%Stoke-on-Trent 133.5 4.0 129.5 -1.0 -0.7% -1.0 -0.7% -1.9 -1.5% -1.9 -1.5%
Swindon 43.7 2.0 41.7 0.0 0.1% 0.0 0.1% 0.1 0.2% 0.1 0.2%Telford and the Wrekin 76.0 1.6 74.4 -1.1 -1.5% -1.1 -1.5% -1.4 -1.9% -1.4 -1.9%Thurrock 62.1 0.8 61.2 -1.6 -2.6% -1.6 -2.6% -1.4 -2.3% -1.4 -2.3%Torbay 64.2 3.1 61.1 0.7 1.2% 0.7 1.2% 0.3 0.6% 0.3 0.6%Warrington 52.7 3.0 49.7 0.8 1.6% 0.8 1.6% 0.4 0.9% 0.4 0.9%
228

Base Position = 2010-11 Indicative Allocations - 2008-09 Concessionary Travel Net Revenue Expenditure Formula Grant Before Floor DampingLocal Authority
(£ million) (£ million) (£ million) (£ million) (%) (£ million) (%) (£ million) (%) (£ million) (%)Option CONCF4
Difference from the Base Position2010-11 Indicative
2008-09 Concess-
Base Position Option CONCF1 Option CONCF2 Option CONCF3
West Berkshire 23.1 0.5 22.6 -0.7 -3.0% -0.7 -3.0% -0.7 -3.0% -0.7 -3.0%Wiltshire 102.1 3.3 98.8 -1.1 -1.1% -1.1 -1.1% -1.8 -1.8% -1.8 -1.8%Windsor and Maidenhead 10.1 1.0 9.1 0.2 2.5% 0.2 2.5% 0.4 4.2% 0.4 4.2%Wokingham 8.4 1.1 7.2 0.4 6.2% 0.4 6.2% 0.7 9.1% 0.7 9.1%York 45.8 3.5 42.3 1.4 3.3% 1.4 3.3% 1.4 3.3% 1.4 3.3%
Isles of Scilly 2.3 0.0 2.3 0.0 0.0% 0.0 0.0% 0.0 0.0% 0.0 0.0%
229
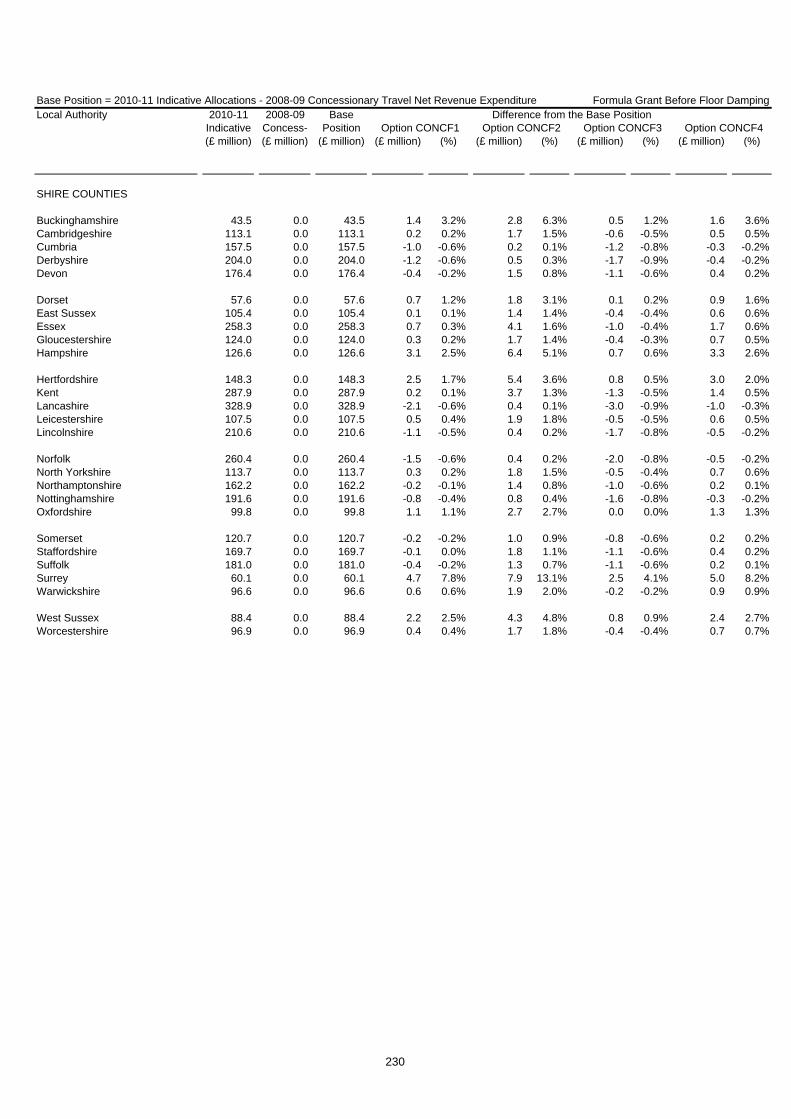
Base Position = 2010-11 Indicative Allocations - 2008-09 Concessionary Travel Net Revenue Expenditure Formula Grant Before Floor DampingLocal Authority
(£ million) (£ million) (£ million) (£ million) (%) (£ million) (%) (£ million) (%) (£ million) (%)Option CONCF4
Difference from the Base Position2010-11 Indicative
2008-09 Concess-
Base Position Option CONCF1 Option CONCF2 Option CONCF3
SHIRE COUNTIES
Buckinghamshire 43.5 0.0 43.5 1.4 3.2% 2.8 6.3% 0.5 1.2% 1.6 3.6%Cambridgeshire 113.1 0.0 113.1 0.2 0.2% 1.7 1.5% -0.6 -0.5% 0.5 0.5%Cumbria 157.5 0.0 157.5 -1.0 -0.6% 0.2 0.1% -1.2 -0.8% -0.3 -0.2%Derbyshire 204.0 0.0 204.0 -1.2 -0.6% 0.5 0.3% -1.7 -0.9% -0.4 -0.2%Devon 176.4 0.0 176.4 -0.4 -0.2% 1.5 0.8% -1.1 -0.6% 0.4 0.2%
Dorset 57.6 0.0 57.6 0.7 1.2% 1.8 3.1% 0.1 0.2% 0.9 1.6%East Sussex 105.4 0.0 105.4 0.1 0.1% 1.4 1.4% -0.4 -0.4% 0.6 0.6%Essex 258.3 0.0 258.3 0.7 0.3% 4.1 1.6% -1.0 -0.4% 1.7 0.6%Gloucestershire 124.0 0.0 124.0 0.3 0.2% 1.7 1.4% -0.4 -0.3% 0.7 0.5%Hampshire 126.6 0.0 126.6 3.1 2.5% 6.4 5.1% 0.7 0.6% 3.3 2.6%
Hertfordshire 148.3 0.0 148.3 2.5 1.7% 5.4 3.6% 0.8 0.5% 3.0 2.0%Kent 287.9 0.0 287.9 0.2 0.1% 3.7 1.3% -1.3 -0.5% 1.4 0.5%Lancashire 328.9 0.0 328.9 -2.1 -0.6% 0.4 0.1% -3.0 -0.9% -1.0 -0.3%Leicestershire 107.5 0.0 107.5 0.5 0.4% 1.9 1.8% -0.5 -0.5% 0.6 0.5%Lincolnshire 210.6 0.0 210.6 -1.1 -0.5% 0.4 0.2% -1.7 -0.8% -0.5 -0.2%
Norfolk 260.4 0.0 260.4 -1.5 -0.6% 0.4 0.2% -2.0 -0.8% -0.5 -0.2%North Yorkshire 113.7 0.0 113.7 0.3 0.2% 1.8 1.5% -0.5 -0.4% 0.7 0.6%Northamptonshire 162.2 0.0 162.2 -0.2 -0.1% 1.4 0.8% -1.0 -0.6% 0.2 0.1%Nottinghamshire 191.6 0.0 191.6 -0.8 -0.4% 0.8 0.4% -1.6 -0.8% -0.3 -0.2%Oxfordshire 99.8 0.0 99.8 1.1 1.1% 2.7 2.7% 0.0 0.0% 1.3 1.3%
Somerset 120.7 0.0 120.7 -0.2 -0.2% 1.0 0.9% -0.8 -0.6% 0.2 0.2%Staffordshire 169.7 0.0 169.7 -0.1 0.0% 1.8 1.1% -1.1 -0.6% 0.4 0.2%Suffolk 181.0 0.0 181.0 -0.4 -0.2% 1.3 0.7% -1.1 -0.6% 0.2 0.1%Surrey 60.1 0.0 60.1 4.7 7.8% 7.9 13.1% 2.5 4.1% 5.0 8.2%Warwickshire 96.6 0.0 96.6 0.6 0.6% 1.9 2.0% -0.2 -0.2% 0.9 0.9%
West Sussex 88.4 0.0 88.4 2.2 2.5% 4.3 4.8% 0.8 0.9% 2.4 2.7%Worcestershire 96.9 0.0 96.9 0.4 0.4% 1.7 1.8% -0.4 -0.4% 0.7 0.7%
230

Base Position = 2010-11 Indicative Allocations - 2008-09 Concessionary Travel Net Revenue Expenditure Formula Grant Before Floor DampingLocal Authority
(£ million) (£ million) (£ million) (£ million) (%) (£ million) (%) (£ million) (%) (£ million) (%)Option CONCF4
Difference from the Base Position2010-11 Indicative
2008-09 Concess-
Base Position Option CONCF1 Option CONCF2 Option CONCF3
BUCKINGHAMSHIREAylesbury Vale 12.1 1.2 10.9 -0.7 -6.7% -1.2 -10.7% -0.5 -4.5% -0.8 -7.6%Chiltern 3.2 1.1 2.2 0.3 14.8% 0.0 1.8% 0.5 23.8% 0.3 13.6%South Bucks 2.3 0.7 1.6 0.2 11.4% 0.0 -1.4% 0.3 20.4% 0.2 10.4%Wycombe 9.5 2.5 7.0 0.9 12.5% 0.4 6.2% 1.3 18.2% 0.9 13.3%
CAMBRIDGESHIRECambridge 12.0 2.1 9.9 0.5 5.1% 0.2 2.4% 1.0 10.3% 0.8 8.2%East Cambridgeshire 6.8 0.1 6.7 -0.9 -13.0% -1.1 -15.8% -0.9 -14.0% -1.1 -16.2%Fenland 9.9 0.3 9.6 -1.0 -10.2% -1.2 -12.3% -1.2 -12.8% -1.4 -14.4%Huntingdonshire 13.4 0.7 12.6 -1.2 -9.3% -1.6 -12.4% -1.0 -7.9% -1.3 -10.3%South Cambridgeshire 7.9 0.3 7.6 -1.1 -14.4% -1.5 -19.4% -1.1 -13.8% -1.3 -17.7%
CUMBRIAAllerdale 10.4 1.2 9.2 -0.1 -1.1% -0.3 -3.3% -0.5 -5.3% -0.7 -7.1%Barrow-in-Furness 9.1 0.7 8.4 -0.4 -5.1% -0.6 -6.8% -0.7 -8.7% -0.8 -10.0%Carlisle 10.2 2.0 8.3 0.6 7.0% 0.3 4.2% 0.3 4.0% 0.2 1.8%Copeland 7.2 0.5 6.6 -0.4 -5.8% -0.5 -8.0% -0.7 -10.4% -0.8 -12.1%Eden 4.7 0.1 4.6 -0.6 -12.4% -0.7 -15.3% -0.7 -15.9% -0.8 -18.1%South Lakeland 6.8 0.8 6.0 -0.3 -5.0% -0.6 -9.8% -0.5 -7.6% -0.7 -11.4%
DERBYSHIREAmber Valley 10.0 1.5 8.5 0.1 1.1% -0.2 -2.0% -0.2 -1.8% -0.4 -4.2%Bolsover 8.0 0.7 7.2 -0.3 -3.7% -0.4 -5.7% -0.6 -8.8% -0.8 -10.4%Chesterfield 10.2 3.1 7.1 1.7 24.5% 1.5 21.4% 1.4 19.3% 1.2 16.9%Derbyshire Dales 4.7 0.4 4.3 -0.4 -8.1% -0.5 -12.5% -0.5 -11.7% -0.7 -15.0%Erewash 9.7 1.8 7.9 0.5 5.7% 0.2 2.8% 0.4 4.9% 0.2 2.6%High Peak 7.2 1.0 6.2 -0.1 -1.0% -0.3 -4.4% -0.1 -2.3% -0.3 -5.0%North East Derbyshire 7.9 0.9 7.0 -0.2 -3.2% -0.4 -6.3% -0.5 -7.4% -0.7 -9.8%South Derbyshire 7.5 0.5 7.0 -0.6 -8.4% -0.8 -11.3% -0.7 -9.6% -0.8 -11.8%
DEVONEast Devon 8.4 1.1 7.3 -0.3 -4.2% -0.7 -9.2% -0.5 -6.4% -0.8 -10.3%Exeter 12.1 2.6 9.5 1.0 10.7% 0.8 8.0% 1.2 12.6% 1.0 10.5%Mid Devon 6.3 0.3 6.0 -0.6 -10.2% -0.8 -13.3% -0.8 -13.2% -0.9 -15.7%North Devon 8.5 0.1 8.4 -1.1 -13.1% -1.3 -15.7% -1.3 -16.1% -1.5 -18.1%South Hams 5.6 0.3 5.3 -0.6 -11.3% -0.8 -15.7% -0.8 -14.8% -1.0 -18.2%Teignbridge 10.1 1.0 9.1 -0.5 -5.6% -0.8 -9.1% -0.7 -8.1% -1.0 -10.8%Torridge 6.6 0.2 6.4 -0.7 -10.5% -0.8 -12.9% -0.9 -14.2% -1.0 -16.1%West Devon 4.4 0.2 4.2 -0.5 -10.8% -0.6 -13.9% -0.6 -15.0% -0.7 -17.4%
DORSETChristchurch 2.9 0.5 2.4 0.1 4.9% 0.0 -0.7% 0.1 4.0% 0.0 -0.3%East Dorset 3.8 0.4 3.4 -0.3 -9.8% -0.6 -17.0% -0.3 -9.1% -0.5 -14.7%North Dorset 4.7 0.1 4.6 -0.6 -13.6% -0.8 -17.5% -0.7 -15.2% -0.8 -18.2%Purbeck 3.3 0.3 3.0 -0.2 -6.3% -0.3 -10.4% -0.2 -8.2% -0.3 -11.4%West Dorset 7.9 0.4 7.6 -0.7 -9.9% -1.0 -13.6% -0.9 -12.5% -1.2 -15.4%Weymouth and Portland 6.1 0.8 5.3 0.0 -0.8% -0.2 -3.6% -0.1 -2.5% -0.2 -4.7%
EAST SUSSEXEastbourne 10.5 1.9 8.6 0.6 6.4% 0.3 3.6% 0.6 7.2% 0.4 5.0%Hastings 10.6 1.2 9.4 -0.2 -1.7% -0.4 -3.8% -0.3 -3.7% -0.5 -5.3%Lewes 6.6 0.7 5.8 -0.3 -4.8% -0.5 -9.0% -0.3 -4.9% -0.5 -8.2%Rother 6.5 0.3 6.2 -0.7 -11.1% -0.9 -15.1% -0.9 -14.5% -1.1 -17.6%Wealden 8.4 0.6 7.8 -0.8 -10.3% -1.2 -15.4% -0.9 -10.9% -1.2 -14.8%
231

Base Position = 2010-11 Indicative Allocations - 2008-09 Concessionary Travel Net Revenue Expenditure Formula Grant Before Floor DampingLocal Authority
(£ million) (£ million) (£ million) (£ million) (%) (£ million) (%) (£ million) (%) (£ million) (%)Option CONCF4
Difference from the Base Position2010-11 Indicative
2008-09 Concess-
Base Position Option CONCF1 Option CONCF2 Option CONCF3
ESSEXBasildon 16.1 1.8 14.3 -0.5 -3.3% -0.9 -6.1% -0.4 -3.0% -0.7 -5.2%Braintree 10.6 1.2 9.4 -0.4 -4.7% -0.8 -8.4% -0.5 -5.1% -0.8 -8.0%Brentwood 4.4 0.5 3.9 -0.2 -4.3% -0.4 -9.7% -0.1 -1.5% -0.2 -5.7%Castle Point 6.8 0.9 5.9 -0.1 -1.1% -0.3 -4.6% 0.0 -0.1% -0.2 -2.9%Chelmsford 10.7 1.9 8.8 0.3 2.9% -0.2 -1.9% 0.6 7.0% 0.3 3.2%Colchester 13.1 2.5 10.7 0.5 5.0% 0.1 1.2% 0.7 6.2% 0.3 3.2%Epping Forest 9.4 0.5 8.8 -0.9 -9.7% -1.2 -13.6% -0.7 -8.2% -1.0 -11.4%Harlow 8.2 1.4 6.8 0.3 4.8% 0.1 2.1% 0.4 6.1% 0.3 4.0%Maldon 4.6 0.5 4.1 -0.2 -5.0% -0.4 -8.9% -0.2 -6.0% -0.4 -9.1%Rochford 5.2 0.8 4.5 -0.1 -1.5% -0.3 -6.1% 0.0 0.3% -0.1 -3.2%Tendring 14.6 1.6 13.0 -0.3 -2.7% -0.7 -5.3% -0.8 -6.0% -1.0 -8.0%Uttlesford 3.9 0.2 3.6 -0.5 -12.9% -0.7 -18.7% -0.5 -13.2% -0.6 -17.7%
GLOUCESTERSHIRECheltenham 8.7 1.4 7.3 0.1 0.9% -0.2 -2.8% 0.3 3.9% 0.1 1.0%Cotswold 5.5 0.1 5.3 -0.8 -14.8% -1.0 -19.2% -0.9 -16.5% -1.1 -20.0%Forest of Dean 7.0 0.6 6.4 -0.4 -6.3% -0.6 -9.2% -0.6 -10.1% -0.8 -12.4%Gloucester 10.8 1.2 9.6 -0.3 -3.0% -0.5 -5.6% -0.2 -2.1% -0.4 -4.2%Stroud 7.3 0.8 6.5 -0.3 -5.1% -0.6 -9.4% -0.4 -6.3% -0.6 -9.6%Tewkesbury 5.4 0.6 4.8 -0.3 -6.1% -0.5 -10.3% -0.3 -5.8% -0.4 -9.0%
HAMPSHIREBasingstoke and Deane 10.3 2.3 8.0 0.6 8.0% 0.2 2.9% 1.0 11.8% 0.6 7.9%East Hampshire 5.9 0.5 5.4 -0.5 -9.5% -0.8 -15.1% -0.4 -7.5% -0.6 -11.9%Eastleigh 7.8 1.1 6.8 -0.1 -1.9% -0.4 -6.2% 0.1 2.0% -0.1 -1.3%Fareham 6.1 1.5 4.6 0.4 9.3% 0.2 3.3% 0.7 15.1% 0.5 10.4%Gosport 7.1 1.2 6.0 0.2 3.2% 0.0 0.1% 0.4 6.5% 0.2 4.1%Hart 3.9 0.2 3.7 -0.6 -16.0% -0.8 -22.8% -0.3 -8.2% -0.5 -13.4%Havant 9.9 1.2 8.7 -0.1 -1.7% -0.4 -4.9% -0.1 -1.5% -0.4 -4.0%New Forest 11.8 1.0 10.8 -0.8 -7.6% -1.3 -11.9% -0.8 -7.2% -1.1 -10.5%Rushmoor 6.3 0.8 5.5 -0.2 -3.2% -0.4 -7.0% 0.1 1.9% -0.1 -1.1%Test Valley 7.3 1.0 6.4 -0.2 -3.8% -0.5 -8.4% -0.1 -1.9% -0.4 -5.5%Winchester 6.7 0.9 5.8 -0.2 -3.7% -0.5 -9.0% -0.1 -1.3% -0.3 -5.5%
HERTFORDSHIREBroxbourne 7.0 1.1 5.9 0.0 0.6% -0.2 -3.6% 0.2 3.8% 0.0 0.6%Dacorum 9.5 1.8 7.7 0.3 3.3% -0.1 -1.5% 0.5 7.0% 0.3 3.3%East Hertfordshire 8.1 0.9 7.2 -0.4 -6.2% -0.8 -11.5% -0.2 -2.8% -0.5 -6.9%Hertsmere 6.8 0.6 6.2 -0.5 -7.5% -0.7 -11.9% -0.2 -4.0% -0.5 -7.4%North Hertfordshire 8.3 1.0 7.2 -0.3 -4.2% -0.6 -8.5% -0.1 -2.0% -0.4 -5.4%St Albans 7.0 0.3 6.8 -1.0 -15.4% -1.4 -21.2% -0.6 -9.3% -0.9 -13.8%Stevenage 7.6 1.6 6.1 0.6 9.2% 0.4 6.1% 0.7 11.4% 0.6 9.1%Three Rivers 5.1 0.8 4.3 -0.1 -1.5% -0.3 -7.2% 0.2 3.8% 0.0 -0.6%Watford 7.2 1.2 6.0 0.2 2.8% 0.0 -0.7% 0.5 7.8% 0.3 5.1%Welwyn Hatfield 8.2 1.0 7.2 -0.2 -2.9% -0.5 -6.8% 0.0 0.2% -0.2 -2.8%
KENTAshford 8.6 0.8 7.7 -0.5 -5.9% -0.7 -9.7% -0.5 -6.1% -0.7 -9.0%Canterbury 13.6 2.4 11.2 0.5 4.7% 0.2 1.7% 0.6 5.1% 0.3 2.7%Dartford 7.6 0.9 6.6 -0.2 -2.5% -0.4 -6.0% 0.0 0.6% -0.1 -2.1%Dover 9.9 1.3 8.6 -0.1 -0.7% -0.3 -3.7% -0.2 -2.5% -0.4 -4.9%Gravesham 8.5 1.3 7.3 0.0 0.6% -0.2 -2.6% 0.2 2.5% 0.0 0.1%Maidstone 9.0 2.0 7.0 0.5 7.7% 0.2 2.3% 0.7 9.6% 0.4 5.3%Sevenoaks 6.1 0.7 5.5 -0.5 -8.4% -0.8 -14.3% -0.4 -6.5% -0.6 -11.1%Shepway 10.1 1.5 8.5 0.2 2.2% -0.1 -0.7% 0.1 0.7% -0.1 -1.6%Swale 12.2 0.9 11.3 -0.8 -6.8% -1.1 -9.6% -0.8 -7.4% -1.1 -9.5%Thanet 13.4 1.6 11.8 -0.3 -2.2% -0.6 -4.8% -0.6 -4.7% -0.8 -6.7%Tonbridge and Malling 6.5 0.8 5.8 -0.3 -5.7% -0.6 -11.1% -0.2 -3.0% -0.4 -7.2%Tunbridge Wells 6.5 1.3 5.3 0.2 3.6% -0.1 -1.9% 0.3 5.7% 0.1 1.4%
232
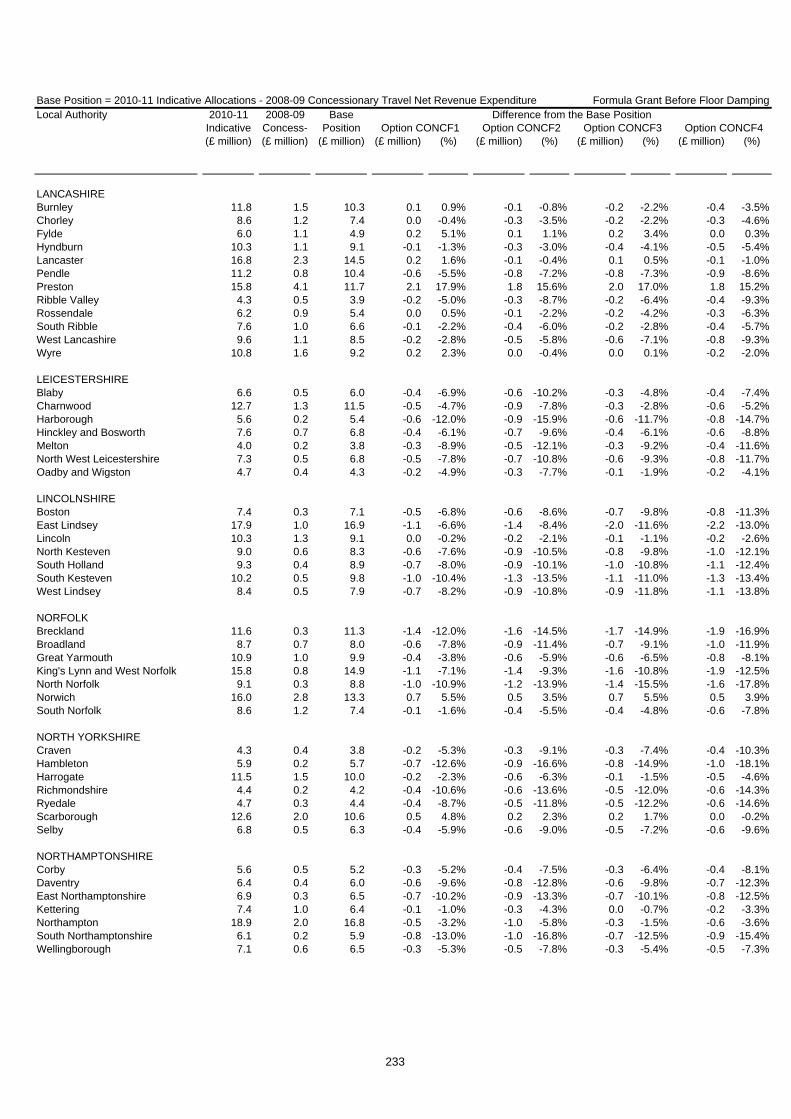
Base Position = 2010-11 Indicative Allocations - 2008-09 Concessionary Travel Net Revenue Expenditure Formula Grant Before Floor DampingLocal Authority
(£ million) (£ million) (£ million) (£ million) (%) (£ million) (%) (£ million) (%) (£ million) (%)Option CONCF4
Difference from the Base Position2010-11 Indicative
2008-09 Concess-
Base Position Option CONCF1 Option CONCF2 Option CONCF3
LANCASHIREBurnley 11.8 1.5 10.3 0.1 0.9% -0.1 -0.8% -0.2 -2.2% -0.4 -3.5%Chorley 8.6 1.2 7.4 0.0 -0.4% -0.3 -3.5% -0.2 -2.2% -0.3 -4.6%Fylde 6.0 1.1 4.9 0.2 5.1% 0.1 1.1% 0.2 3.4% 0.0 0.3%Hyndburn 10.3 1.1 9.1 -0.1 -1.3% -0.3 -3.0% -0.4 -4.1% -0.5 -5.4%Lancaster 16.8 2.3 14.5 0.2 1.6% -0.1 -0.4% 0.1 0.5% -0.1 -1.0%Pendle 11.2 0.8 10.4 -0.6 -5.5% -0.8 -7.2% -0.8 -7.3% -0.9 -8.6%Preston 15.8 4.1 11.7 2.1 17.9% 1.8 15.6% 2.0 17.0% 1.8 15.2%Ribble Valley 4.3 0.5 3.9 -0.2 -5.0% -0.3 -8.7% -0.2 -6.4% -0.4 -9.3%Rossendale 6.2 0.9 5.4 0.0 0.5% -0.1 -2.2% -0.2 -4.2% -0.3 -6.3%South Ribble 7.6 1.0 6.6 -0.1 -2.2% -0.4 -6.0% -0.2 -2.8% -0.4 -5.7%West Lancashire 9.6 1.1 8.5 -0.2 -2.8% -0.5 -5.8% -0.6 -7.1% -0.8 -9.3%Wyre 10.8 1.6 9.2 0.2 2.3% 0.0 -0.4% 0.0 0.1% -0.2 -2.0%
LEICESTERSHIREBlaby 6.6 0.5 6.0 -0.4 -6.9% -0.6 -10.2% -0.3 -4.8% -0.4 -7.4%Charnwood 12.7 1.3 11.5 -0.5 -4.7% -0.9 -7.8% -0.3 -2.8% -0.6 -5.2%Harborough 5.6 0.2 5.4 -0.6 -12.0% -0.9 -15.9% -0.6 -11.7% -0.8 -14.7%Hinckley and Bosworth 7.6 0.7 6.8 -0.4 -6.1% -0.7 -9.6% -0.4 -6.1% -0.6 -8.8%Melton 4.0 0.2 3.8 -0.3 -8.9% -0.5 -12.1% -0.3 -9.2% -0.4 -11.6%North West Leicestershire 7.3 0.5 6.8 -0.5 -7.8% -0.7 -10.8% -0.6 -9.3% -0.8 -11.7%Oadby and Wigston 4.7 0.4 4.3 -0.2 -4.9% -0.3 -7.7% -0.1 -1.9% -0.2 -4.1%
LINCOLNSHIREBoston 7.4 0.3 7.1 -0.5 -6.8% -0.6 -8.6% -0.7 -9.8% -0.8 -11.3%East Lindsey 17.9 1.0 16.9 -1.1 -6.6% -1.4 -8.4% -2.0 -11.6% -2.2 -13.0%Lincoln 10.3 1.3 9.1 0.0 -0.2% -0.2 -2.1% -0.1 -1.1% -0.2 -2.6%North Kesteven 9.0 0.6 8.3 -0.6 -7.6% -0.9 -10.5% -0.8 -9.8% -1.0 -12.1%South Holland 9.3 0.4 8.9 -0.7 -8.0% -0.9 -10.1% -1.0 -10.8% -1.1 -12.4%South Kesteven 10.2 0.5 9.8 -1.0 -10.4% -1.3 -13.5% -1.1 -11.0% -1.3 -13.4%West Lindsey 8.4 0.5 7.9 -0.7 -8.2% -0.9 -10.8% -0.9 -11.8% -1.1 -13.8%
NORFOLKBreckland 11.6 0.3 11.3 -1.4 -12.0% -1.6 -14.5% -1.7 -14.9% -1.9 -16.9%Broadland 8.7 0.7 8.0 -0.6 -7.8% -0.9 -11.4% -0.7 -9.1% -1.0 -11.9%Great Yarmouth 10.9 1.0 9.9 -0.4 -3.8% -0.6 -5.9% -0.6 -6.5% -0.8 -8.1%King's Lynn and West Norfolk 15.8 0.8 14.9 -1.1 -7.1% -1.4 -9.3% -1.6 -10.8% -1.9 -12.5%North Norfolk 9.1 0.3 8.8 -1.0 -10.9% -1.2 -13.9% -1.4 -15.5% -1.6 -17.8%Norwich 16.0 2.8 13.3 0.7 5.5% 0.5 3.5% 0.7 5.5% 0.5 3.9%South Norfolk 8.6 1.2 7.4 -0.1 -1.6% -0.4 -5.5% -0.4 -4.8% -0.6 -7.8%
NORTH YORKSHIRECraven 4.3 0.4 3.8 -0.2 -5.3% -0.3 -9.1% -0.3 -7.4% -0.4 -10.3%Hambleton 5.9 0.2 5.7 -0.7 -12.6% -0.9 -16.6% -0.8 -14.9% -1.0 -18.1%Harrogate 11.5 1.5 10.0 -0.2 -2.3% -0.6 -6.3% -0.1 -1.5% -0.5 -4.6%Richmondshire 4.4 0.2 4.2 -0.4 -10.6% -0.6 -13.6% -0.5 -12.0% -0.6 -14.3%Ryedale 4.7 0.3 4.4 -0.4 -8.7% -0.5 -11.8% -0.5 -12.2% -0.6 -14.6%Scarborough 12.6 2.0 10.6 0.5 4.8% 0.2 2.3% 0.2 1.7% 0.0 -0.2%Selby 6.8 0.5 6.3 -0.4 -5.9% -0.6 -9.0% -0.5 -7.2% -0.6 -9.6%
NORTHAMPTONSHIRECorby 5.6 0.5 5.2 -0.3 -5.2% -0.4 -7.5% -0.3 -6.4% -0.4 -8.1%Daventry 6.4 0.4 6.0 -0.6 -9.6% -0.8 -12.8% -0.6 -9.8% -0.7 -12.3%East Northamptonshire 6.9 0.3 6.5 -0.7 -10.2% -0.9 -13.3% -0.7 -10.1% -0.8 -12.5%Kettering 7.4 1.0 6.4 -0.1 -1.0% -0.3 -4.3% 0.0 -0.7% -0.2 -3.3%Northampton 18.9 2.0 16.8 -0.5 -3.2% -1.0 -5.8% -0.3 -1.5% -0.6 -3.6%South Northamptonshire 6.1 0.2 5.9 -0.8 -13.0% -1.0 -16.8% -0.7 -12.5% -0.9 -15.4%Wellingborough 7.1 0.6 6.5 -0.3 -5.3% -0.5 -7.8% -0.3 -5.4% -0.5 -7.3%
233

Base Position = 2010-11 Indicative Allocations - 2008-09 Concessionary Travel Net Revenue Expenditure Formula Grant Before Floor DampingLocal Authority
(£ million) (£ million) (£ million) (£ million) (%) (£ million) (%) (£ million) (%) (£ million) (%)Option CONCF4
Difference from the Base Position2010-11 Indicative
2008-09 Concess-
Base Position Option CONCF1 Option CONCF2 Option CONCF3
NOTTINGHAMSHIREAshfield 11.6 1.3 10.3 -0.2 -1.9% -0.4 -4.2% -0.5 -4.9% -0.7 -6.6%Bassetlaw 11.4 1.2 10.3 -0.3 -3.3% -0.6 -5.6% -0.8 -7.4% -0.9 -9.2%Broxtowe 9.1 0.9 8.1 -0.3 -4.2% -0.6 -7.0% -0.3 -3.8% -0.5 -6.1%Gedling 9.4 1.2 8.2 -0.1 -1.6% -0.4 -4.6% -0.1 -1.3% -0.3 -3.6%Mansfield 10.3 1.3 9.0 0.0 0.2% -0.2 -2.1% -0.4 -3.9% -0.5 -5.7%Newark and Sherwood 10.5 1.0 9.6 -0.5 -4.7% -0.7 -7.4% -0.7 -7.1% -0.9 -9.2%Rushcliffe 7.3 0.6 6.7 -0.5 -7.5% -0.8 -11.4% -0.4 -5.8% -0.6 -8.9%
OXFORDSHIRECherwell 11.2 0.9 10.3 -0.8 -7.5% -1.1 -10.7% -0.6 -5.5% -0.8 -8.0%Oxford 16.9 3.2 13.7 1.0 6.9% 0.6 4.6% 1.6 11.9% 1.4 10.1%South Oxfordshire 7.8 0.6 7.2 -0.7 -10.0% -1.1 -14.9% -0.5 -7.5% -0.8 -11.3%Vale of White Horse 7.2 0.7 6.5 -0.5 -7.1% -0.8 -11.9% -0.3 -4.6% -0.5 -8.3%West Oxfordshire 6.1 0.7 5.4 -0.4 -6.8% -0.6 -11.9% -0.3 -5.3% -0.5 -9.3%
SOMERSETMendip 8.5 1.0 7.5 -0.3 -3.7% -0.5 -7.2% -0.4 -5.6% -0.6 -8.3%Sedgemoor 10.3 0.9 9.3 -0.4 -4.6% -0.7 -7.4% -0.6 -6.8% -0.8 -9.0%South Somerset 11.2 1.6 9.6 -0.1 -1.2% -0.5 -5.3% -0.3 -3.6% -0.6 -6.8%Taunton Deane 8.9 1.5 7.4 0.2 3.1% 0.0 -0.4% 0.1 1.8% -0.1 -0.9%West Somerset 3.3 0.1 3.2 -0.4 -12.0% -0.5 -14.9% -0.5 -16.7% -0.6 -19.0%
STAFFORDSHIRECannock Chase 8.6 1.1 7.5 -0.1 -1.2% -0.3 -3.9% -0.2 -3.0% -0.4 -5.1%East Staffordshire 9.6 1.4 8.2 0.1 0.8% -0.2 -2.2% 0.0 0.6% -0.1 -1.7%Lichfield 6.1 0.5 5.6 -0.5 -8.6% -0.7 -13.0% -0.5 -9.2% -0.7 -12.7%Newcastle-under-Lyme 11.3 1.4 9.9 -0.2 -1.6% -0.4 -4.1% -0.4 -4.4% -0.6 -6.4%South Staffordshire 7.2 1.1 6.2 -0.1 -1.0% -0.3 -5.2% -0.1 -2.3% -0.3 -5.5%Stafford 8.8 1.6 7.2 0.3 4.1% 0.0 -0.1% 0.2 2.8% 0.0 -0.4%Staffordshire Moorlands 7.6 0.7 6.9 -0.4 -5.4% -0.6 -8.7% -0.6 -9.4% -0.8 -11.9%Tamworth 6.9 0.6 6.3 -0.3 -4.6% -0.4 -7.1% -0.3 -4.8% -0.4 -6.7%
SUFFOLKBabergh 6.4 0.8 5.5 -0.1 -2.0% -0.3 -5.9% -0.2 -3.7% -0.4 -6.7%Forest Heath 5.5 0.4 5.1 -0.3 -6.1% -0.4 -8.3% -0.3 -5.7% -0.4 -7.4%Ipswich 11.9 2.9 9.1 1.3 14.4% 1.0 11.4% 1.4 15.1% 1.2 12.7%Mid Suffolk 6.2 0.7 5.5 -0.3 -4.9% -0.5 -9.3% -0.4 -7.3% -0.6 -10.7%St Edmundsbury 7.1 0.9 6.2 -0.2 -2.9% -0.4 -7.0% -0.2 -3.7% -0.4 -6.8%Suffolk Coastal 8.4 1.1 7.3 -0.1 -2.0% -0.5 -6.4% -0.2 -3.3% -0.5 -6.7%Waveney 12.0 1.5 10.5 -0.1 -0.9% -0.4 -3.3% -0.3 -3.0% -0.5 -4.9%
SURREYElmbridge 6.5 0.2 6.4 -1.1 -17.4% -1.5 -23.8% -0.6 -9.0% -0.9 -14.0%Epsom and Ewell 4.0 0.2 3.8 -0.5 -12.1% -0.7 -17.6% -0.2 -4.9% -0.3 -9.2%Guildford 8.6 1.2 7.4 -0.2 -2.5% -0.5 -7.5% 0.2 2.6% -0.1 -1.3%Mole Valley 3.3 0.3 3.0 -0.4 -14.4% -0.7 -23.1% -0.3 -9.8% -0.5 -16.7%Reigate and Banstead 6.9 0.7 6.2 -0.6 -9.7% -1.0 -15.8% -0.2 -3.9% -0.5 -8.7%Runnymede 5.8 0.3 5.5 -0.6 -10.6% -0.8 -14.6% -0.3 -5.7% -0.5 -8.8%Spelthorne 5.7 0.4 5.2 -0.5 -9.9% -0.8 -14.8% -0.2 -4.5% -0.4 -8.3%Surrey Heath 4.7 0.6 4.1 -0.2 -4.1% -0.4 -10.0% 0.1 3.4% -0.1 -1.2%Tandridge 4.0 0.3 3.7 -0.5 -13.7% -0.8 -20.3% -0.4 -10.7% -0.6 -15.9%Waverley 5.4 0.6 4.8 -0.5 -10.3% -0.8 -17.5% -0.3 -6.7% -0.6 -12.4%Woking 5.8 0.7 5.2 -0.3 -5.8% -0.6 -10.9% 0.0 0.5% -0.2 -3.5%
WARWICKSHIRENorth Warwickshire 5.5 0.4 5.1 -0.4 -7.4% -0.5 -10.0% -0.5 -9.9% -0.6 -12.0%Nuneaton and Bedworth 11.4 1.6 9.8 0.0 0.2% -0.2 -2.4% -0.1 -1.1% -0.3 -3.1%Rugby 6.6 0.9 5.7 -0.1 -2.6% -0.4 -6.6% -0.1 -1.6% -0.3 -4.8%Stratford-on-Avon 6.9 0.7 6.2 -0.6 -8.9% -0.9 -14.2% -0.6 -10.0% -0.9 -14.3%Warwick 10.5 1.4 9.0 -0.1 -1.3% -0.5 -5.1% 0.1 1.6% -0.1 -1.4%
234

Base Position = 2010-11 Indicative Allocations - 2008-09 Concessionary Travel Net Revenue Expenditure Formula Grant Before Floor DampingLocal Authority
(£ million) (£ million) (£ million) (£ million) (%) (£ million) (%) (£ million) (%) (£ million) (%)Option CONCF4
Difference from the Base Position2010-11 Indicative
2008-09 Concess-
Base Position Option CONCF1 Option CONCF2 Option CONCF3
WEST SUSSEXAdur 5.0 0.7 4.4 0.0 -0.7% -0.2 -4.0% 0.0 -0.2% -0.1 -2.8%Arun 10.5 1.6 8.8 0.0 0.0% -0.4 -4.4% 0.0 0.0% -0.3 -3.4%Chichester 5.9 1.2 4.8 0.1 2.5% -0.2 -4.4% 0.1 1.8% -0.2 -3.6%Crawley 10.5 1.7 8.8 0.2 2.7% 0.0 0.1% 0.6 6.9% 0.4 4.9%Horsham 6.0 0.9 5.1 -0.2 -4.4% -0.6 -11.7% 0.0 -0.3% -0.3 -6.0%Mid Sussex 5.3 0.7 4.6 -0.4 -7.7% -0.7 -15.7% -0.1 -2.8% -0.4 -9.1%Worthing 7.9 1.8 6.1 0.6 10.6% 0.4 6.5% 0.7 11.6% 0.5 8.5%
WORCESTERSHIREBromsgrove 5.2 0.5 4.6 -0.4 -8.0% -0.6 -13.2% -0.3 -6.9% -0.5 -10.9%Malvern Hills 5.2 0.3 4.9 -0.5 -10.7% -0.7 -14.5% -0.7 -14.1% -0.8 -17.2%Redditch 6.4 1.2 5.2 0.3 5.4% 0.1 2.0% 0.3 5.2% 0.1 2.5%Worcester 7.8 1.7 6.2 0.6 9.4% 0.4 6.0% 0.6 10.3% 0.5 7.6%Wychavon 8.0 0.6 7.4 -0.6 -8.3% -0.9 -12.3% -0.7 -9.7% -1.0 -12.9%Wyre Forest 8.1 0.7 7.4 -0.4 -6.0% -0.7 -9.1% -0.6 -8.0% -0.8 -10.4%
235

Base Position = 2010-11 Indicative Allocations - 2008-09 Concessionary Travel Net Revenue Expenditure Formula Grant Before Floor DampingLocal Authority
(£ million) (£ million) (£ million) (£ million) (%) (£ million) (%) (£ million) (%) (£ million) (%)Option CONCF4
Difference from the Base Position2010-11 Indicative
2008-09 Concess-
Base Position Option CONCF1 Option CONCF2 Option CONCF3
SHIRE POLICE AUTHORITIES
Avon & Somerset Police 197.6 0.0 197.6 0.5 0.2% 0.5 0.2% 0.3 0.1% 0.3 0.1%Bedfordshire Police 76.6 0.0 76.6 0.1 0.2% 0.1 0.2% 0.1 0.1% 0.1 0.1%Cambridgeshire Police 86.2 0.0 86.2 0.4 0.4% 0.4 0.4% 0.2 0.3% 0.2 0.3%Cheshire Police 114.1 0.0 114.1 0.5 0.4% 0.5 0.4% 0.4 0.3% 0.4 0.3%Cleveland Police 99.0 0.0 99.0 -0.3 -0.3% -0.3 -0.3% -0.3 -0.3% -0.3 -0.3%
Cumbria Police 56.1 0.0 56.1 0.2 0.4% 0.2 0.4% 0.1 0.2% 0.1 0.2%Derbyshire Police 120.7 0.0 120.7 0.3 0.2% 0.3 0.2% 0.1 0.1% 0.1 0.1%Devon & Cornwall Police 191.7 0.0 191.7 0.8 0.4% 0.8 0.4% 0.5 0.3% 0.5 0.3%Dorset Police 64.3 0.0 64.3 0.6 1.0% 0.6 1.0% 0.5 0.8% 0.5 0.8%Durham Police 87.0 0.0 87.0 0.0 0.0% 0.0 0.0% -0.1 -0.1% -0.1 -0.1%
Essex Police 187.3 0.0 187.3 1.0 0.5% 1.0 0.5% 0.7 0.4% 0.7 0.4%Gloucestershire Police 58.5 0.0 58.5 0.4 0.7% 0.4 0.7% 0.3 0.5% 0.3 0.5%Hampshire Police 215.0 0.0 215.0 0.9 0.4% 0.9 0.4% 0.6 0.3% 0.6 0.3%Hertfordshire Police 128.9 0.0 128.9 0.6 0.5% 0.6 0.5% 0.6 0.4% 0.6 0.4%Humberside Police 132.9 0.0 132.9 -0.1 -0.1% -0.1 -0.1% -0.2 -0.1% -0.2 -0.1%
Kent Police 200.2 0.0 200.2 0.7 0.4% 0.7 0.4% 0.6 0.3% 0.6 0.3%Lancashire Police 212.3 0.0 212.3 -0.1 0.0% -0.1 0.0% -0.2 -0.1% -0.2 -0.1%Leicestershire Police 124.2 0.0 124.2 0.2 0.1% 0.2 0.1% 0.0 0.0% 0.0 0.0%Lincolnshire Police 69.0 0.0 69.0 0.4 0.6% 0.4 0.6% 0.2 0.3% 0.2 0.3%Norfolk Police 88.5 0.0 88.5 0.5 0.5% 0.5 0.5% 0.3 0.3% 0.3 0.3%
North Yorkshire Police 73.1 0.0 73.1 0.6 0.8% 0.6 0.8% 0.4 0.6% 0.4 0.6%Northamptonshire Police 78.4 0.0 78.4 0.3 0.4% 0.3 0.4% 0.1 0.2% 0.1 0.2%Nottinghamshire Police 152.7 0.0 152.7 -0.1 0.0% -0.1 0.0% -0.2 -0.1% -0.2 -0.1%Staffordshire Police 125.1 0.0 125.1 0.4 0.3% 0.4 0.3% 0.2 0.1% 0.2 0.1%Suffolk Police 71.0 0.0 71.0 0.5 0.6% 0.5 0.6% 0.3 0.4% 0.3 0.4%
Surrey Police 101.3 0.0 101.3 1.1 1.1% 1.1 1.1% 1.0 1.0% 1.0 1.0%Sussex Police 167.1 0.0 167.1 1.0 0.6% 1.0 0.6% 0.9 0.5% 0.9 0.5%Thames Valley Police 248.5 0.0 248.5 1.2 0.5% 1.2 0.5% 1.1 0.4% 1.1 0.4%Warwickshire Police 56.1 0.0 56.1 0.3 0.6% 0.3 0.6% 0.2 0.4% 0.2 0.4%West Mercia Police 114.3 0.0 114.3 0.8 0.7% 0.8 0.7% 0.5 0.5% 0.5 0.5%
Wiltshire Police 64.1 0.0 64.1 0.5 0.7% 0.5 0.7% 0.4 0.6% 0.4 0.6%
236

Base Position = 2010-11 Indicative Allocations - 2008-09 Concessionary Travel Net Revenue Expenditure Formula Grant Before Floor DampingLocal Authority
(£ million) (£ million) (£ million) (£ million) (%) (£ million) (%) (£ million) (%) (£ million) (%)Option CONCF4
Difference from the Base Position2010-11 Indicative
2008-09 Concess-
Base Position Option CONCF1 Option CONCF2 Option CONCF3
SHIRE FIRE AUTHORITIES
Avon Fire 24.6 0.0 24.6 0.0 0.2% 0.0 0.2% 0.0 0.1% 0.0 0.1%Bedfordshire Fire 11.7 0.0 11.7 0.1 0.7% 0.1 0.7% 0.0 0.3% 0.0 0.3%Berkshire Fire Auhtority 13.0 0.0 13.0 0.2 1.5% 0.2 1.5% 0.2 1.4% 0.2 1.4%Buckinghamshire Fire 9.1 0.0 9.1 0.2 2.5% 0.2 2.5% 0.2 2.1% 0.2 2.1%Cambridgeshire Fire 15.1 0.0 15.1 0.1 0.7% 0.1 0.7% 0.1 0.4% 0.1 0.4%
Cheshire Fire 19.3 0.0 19.3 0.1 0.8% 0.1 0.8% 0.1 0.6% 0.1 0.6%Cleveland Fire 21.7 0.0 21.7 -0.2 -0.8% -0.2 -0.8% -0.1 -0.7% -0.1 -0.7%Derbyshire Fire 20.6 0.0 20.6 0.1 0.4% 0.1 0.4% 0.0 0.1% 0.0 0.1%Devon and Somerset Fire 32.1 0.0 32.1 0.2 0.8% 0.2 0.8% 0.2 0.6% 0.2 0.6%Dorset Fire 11.1 0.0 11.1 0.2 1.6% 0.2 1.6% 0.2 1.5% 0.2 1.5%
Durham Fire 14.9 0.0 14.9 0.0 -0.1% 0.0 -0.1% 0.0 -0.2% 0.0 -0.2%East Sussex Fire 15.0 0.0 15.0 0.1 0.8% 0.1 0.8% 0.1 0.7% 0.1 0.7%Essex Fire Auhtority 33.3 0.0 33.3 0.2 0.7% 0.2 0.7% 0.2 0.6% 0.2 0.6%Hampshire Fire 29.9 0.0 29.9 0.3 1.0% 0.3 1.0% 0.2 0.8% 0.2 0.8%Hereford & Worcester Fire 10.8 0.0 10.8 0.2 1.7% 0.2 1.7% 0.1 1.3% 0.1 1.3%
Humberside Fire 28.2 0.0 28.2 -0.1 -0.5% -0.1 -0.5% -0.1 -0.5% -0.1 -0.5%Kent Fire 30.2 0.0 30.2 0.3 1.0% 0.3 1.0% 0.2 0.8% 0.2 0.8%Lancashire Fire 32.6 0.0 32.6 0.1 0.2% 0.1 0.2% 0.0 0.0% 0.0 0.0%Leicestershire Fire 19.2 0.0 19.2 0.1 0.5% 0.1 0.5% 0.0 0.2% 0.0 0.2%North Yorkshire Fire 11.6 0.0 11.6 0.2 1.7% 0.2 1.7% 0.1 1.2% 0.1 1.2%
Nottinghamshire Fire 26.3 0.0 26.3 0.0 0.0% 0.0 0.0% -0.1 -0.2% -0.1 -0.2%Shropshire Fire 8.6 0.0 8.6 0.1 0.7% 0.1 0.7% 0.0 0.4% 0.0 0.4%Staffordshire Fire 19.1 0.0 19.1 0.2 0.8% 0.2 0.8% 0.1 0.4% 0.1 0.4%Wiltshire Fire 9.7 0.0 9.7 0.2 1.7% 0.2 1.7% 0.1 1.4% 0.1 1.4%
237
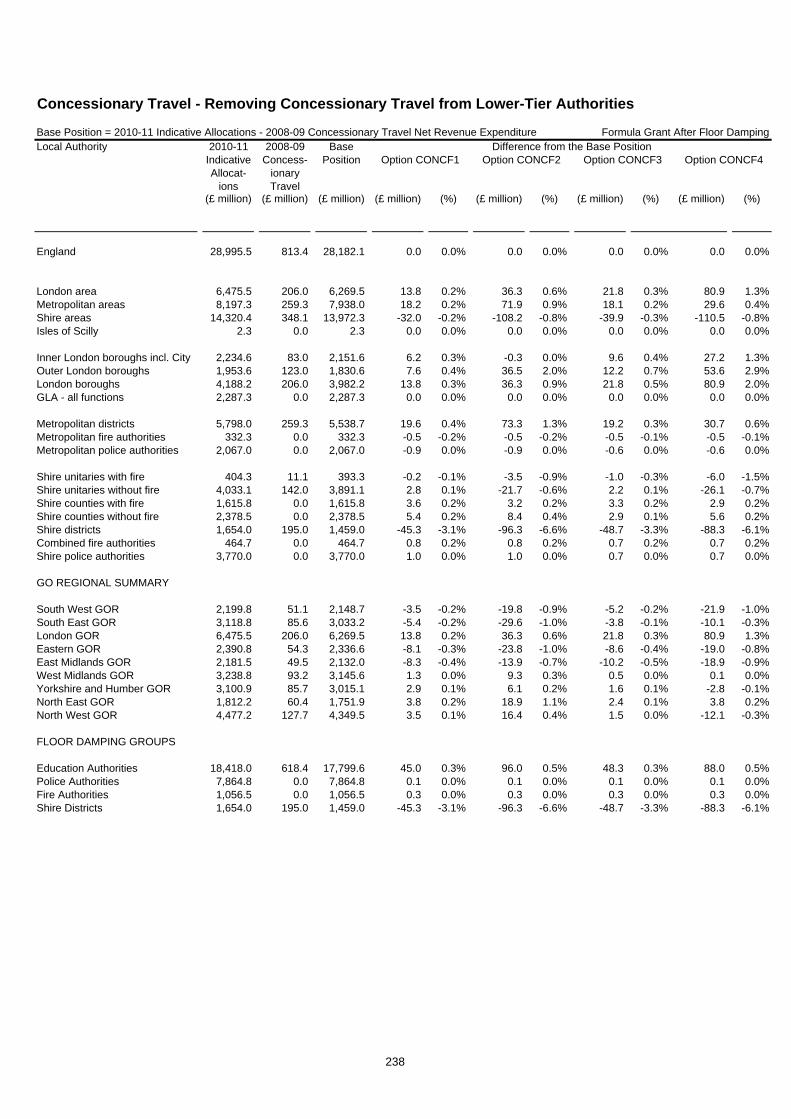
Base Position = 2010-11 Indicative Allocations - 2008-09 Concessionary Travel Net Revenue Expenditure Formula Grant After Floor DampingLocal Authority
(£ million) (£ million) (£ million) (£ million) (%) (£ million) (%) (£ million) (%) (£ million) (%)
England 28,995.5 813.4 28,182.1 0.0 0.0% 0.0 0.0% 0.0 0.0% 0.0 0.0%
London area 6,475.5 206.0 6,269.5 13.8 0.2% 36.3 0.6% 21.8 0.3% 80.9 1.3%Metropolitan areas 8,197.3 259.3 7,938.0 18.2 0.2% 71.9 0.9% 18.1 0.2% 29.6 0.4%Shire areas 14,320.4 348.1 13,972.3 -32.0 -0.2% -108.2 -0.8% -39.9 -0.3% -110.5 -0.8%Isles of Scilly 2.3 0.0 2.3 0.0 0.0% 0.0 0.0% 0.0 0.0% 0.0 0.0%
Inner London boroughs incl. City 2,234.6 83.0 2,151.6 6.2 0.3% -0.3 0.0% 9.6 0.4% 27.2 1.3%Outer London boroughs 1,953.6 123.0 1,830.6 7.6 0.4% 36.5 2.0% 12.2 0.7% 53.6 2.9%London boroughs 4,188.2 206.0 3,982.2 13.8 0.3% 36.3 0.9% 21.8 0.5% 80.9 2.0%GLA - all functions 2,287.3 0.0 2,287.3 0.0 0.0% 0.0 0.0% 0.0 0.0% 0.0 0.0%
Metropolitan districts 5,798.0 259.3 5,538.7 19.6 0.4% 73.3 1.3% 19.2 0.3% 30.7 0.6%Metropolitan fire authorities 332.3 0.0 332.3 -0.5 -0.2% -0.5 -0.2% -0.5 -0.1% -0.5 -0.1%Metropolitan police authorities 2,067.0 0.0 2,067.0 -0.9 0.0% -0.9 0.0% -0.6 0.0% -0.6 0.0%
Shire unitaries with fire 404.3 11.1 393.3 -0.2 -0.1% -3.5 -0.9% -1.0 -0.3% -6.0 -1.5%Shire unitaries without fire 4,033.1 142.0 3,891.1 2.8 0.1% -21.7 -0.6% 2.2 0.1% -26.1 -0.7%Shire counties with fire 1,615.8 0.0 1,615.8 3.6 0.2% 3.2 0.2% 3.3 0.2% 2.9 0.2%Shire counties without fire 2,378.5 0.0 2,378.5 5.4 0.2% 8.4 0.4% 2.9 0.1% 5.6 0.2%Shire districts 1,654.0 195.0 1,459.0 -45.3 -3.1% -96.3 -6.6% -48.7 -3.3% -88.3 -6.1%Combined fire authorities 464.7 0.0 464.7 0.8 0.2% 0.8 0.2% 0.7 0.2% 0.7 0.2%Shire police authorities 3,770.0 0.0 3,770.0 1.0 0.0% 1.0 0.0% 0.7 0.0% 0.7 0.0%
GO REGIONAL SUMMARY
South West GOR 2,199.8 51.1 2,148.7 -3.5 -0.2% -19.8 -0.9% -5.2 -0.2% -21.9 -1.0%South East GOR 3,118.8 85.6 3,033.2 -5.4 -0.2% -29.6 -1.0% -3.8 -0.1% -10.1 -0.3%London GOR 6,475.5 206.0 6,269.5 13.8 0.2% 36.3 0.6% 21.8 0.3% 80.9 1.3%Eastern GOR 2,390.8 54.3 2,336.6 -8.1 -0.3% -23.8 -1.0% -8.6 -0.4% -19.0 -0.8%East Midlands GOR 2,181.5 49.5 2,132.0 -8.3 -0.4% -13.9 -0.7% -10.2 -0.5% -18.9 -0.9%West Midlands GOR 3,238.8 93.2 3,145.6 1.3 0.0% 9.3 0.3% 0.5 0.0% 0.1 0.0%Yorkshire and Humber GOR 3,100.9 85.7 3,015.1 2.9 0.1% 6.1 0.2% 1.6 0.1% -2.8 -0.1%North East GOR 1,812.2 60.4 1,751.9 3.8 0.2% 18.9 1.1% 2.4 0.1% 3.8 0.2%North West GOR 4,477.2 127.7 4,349.5 3.5 0.1% 16.4 0.4% 1.5 0.0% -12.1 -0.3%
FLOOR DAMPING GROUPS
Education Authorities 18,418.0 618.4 17,799.6 45.0 0.3% 96.0 0.5% 48.3 0.3% 88.0 0.5%Police Authorities 7,864.8 0.0 7,864.8 0.1 0.0% 0.1 0.0% 0.1 0.0% 0.1 0.0%Fire Authorities 1,056.5 0.0 1,056.5 0.3 0.0% 0.3 0.0% 0.3 0.0% 0.3 0.0%Shire Districts 1,654.0 195.0 1,459.0 -45.3 -3.1% -96.3 -6.6% -48.7 -3.3% -88.3 -6.1%
2010-11 Indicative Allocat-
ions
2008-09 Concess-
ionary Travel
Base Position
Concessionary Travel - Removing Concessionary Travel from Lower-Tier Authorities
Option CONCF2 Option CONCF3 Option CONCF4Difference from the Base Position
Option CONCF1
238

Base Position = 2010-11 Indicative Allocations - 2008-09 Concessionary Travel Net Revenue Expenditure Formula Grant After Floor DampingLocal Authority
(£ million) (£ million) (£ million) (£ million) (%) (£ million) (%) (£ million) (%) (£ million) (%)
2010-11 Indicative Allocat-
ions
2008-09 Concess-
ionary Travel
Base Position Option CONCF2 Option CONCF3 Option CONCF4
Difference from the Base PositionOption CONCF1
GREATER LONDON
City of London 104.7 0.4 104.3 0.4 0.4% -1.3 -1.2% 0.5 0.5% 0.5 0.4%
Camden 167.3 8.4 158.9 0.1 0.0% 0.1 0.1% 1.2 0.8% 3.4 2.2%Greenwich 166.8 5.2 161.6 -0.1 0.0% -0.2 -0.1% 0.4 0.3% 0.5 0.3%Hackney 220.0 6.6 213.4 0.7 0.3% 0.6 0.3% 1.0 0.4% 1.2 0.5%Hammersmith and Fulham 120.9 6.2 114.7 0.4 0.3% 1.1 1.0% 0.5 0.4% 2.9 2.5%Islington 160.2 6.8 153.5 0.5 0.3% 1.2 0.8% 0.7 0.4% 1.9 1.2%Kensington and Chelsea 106.0 6.0 100.0 0.3 0.3% -0.6 -0.6% 0.4 0.4% 3.1 3.1%
Lambeth 213.9 8.5 205.4 0.7 0.3% 1.5 0.8% 0.9 0.4% 2.9 1.4%Lewisham 180.2 6.7 173.5 0.6 0.3% 1.2 0.7% 0.8 0.4% 1.9 1.1%Southwark 230.7 6.9 223.9 0.8 0.3% -0.7 -0.3% 1.0 0.4% 1.4 0.6%Tower Hamlets 232.2 5.2 227.1 0.8 0.4% -2.3 -1.0% 1.0 0.5% -0.1 0.0%Wandsworth 150.2 7.9 142.3 0.4 0.3% 1.4 1.0% 0.6 0.4% 3.6 2.5%Westminster 181.5 8.4 173.1 0.6 0.3% -2.2 -1.3% 0.7 0.4% 4.1 2.3%
Barking and Dagenham 102.8 3.6 99.2 0.0 0.0% 0.1 0.1% 0.2 0.2% 0.3 0.3%Barnet 94.6 9.6 85.0 1.5 1.7% 4.2 4.9% 1.9 2.2% 5.5 6.5%Bexley 65.6 4.1 61.5 0.2 0.3% 0.8 1.2% 0.4 0.6% 1.6 2.6%Brent 164.5 9.2 155.3 0.5 0.3% 3.6 2.3% 0.6 0.4% 4.1 2.7%Bromley 65.1 5.8 59.3 0.1 0.2% 1.5 2.4% 0.2 0.3% 2.5 4.2%
Croydon 118.5 7.0 111.5 0.7 0.6% 1.5 1.3% 1.2 1.0% 2.8 2.5%Ealing 144.4 9.8 134.6 0.4 0.3% 4.0 3.0% 0.5 0.4% 4.8 3.6%Enfield 121.9 7.2 114.7 0.7 0.6% 1.9 1.7% 1.1 0.9% 2.7 2.3%Haringey 144.6 8.5 136.1 0.4 0.3% 3.7 2.7% 0.5 0.4% 4.1 3.0%Harrow 67.8 6.1 61.6 0.6 1.0% 2.5 4.1% 0.9 1.5% 3.1 5.1%
Havering 55.3 5.1 50.2 0.1 0.2% 1.7 3.4% 0.2 0.3% 2.0 3.9%Hillingdon 84.4 5.6 78.9 0.7 0.8% 1.5 2.0% 0.9 1.2% 2.4 3.1%Hounslow 91.4 5.4 86.0 0.3 0.3% 1.6 1.8% 0.3 0.4% 2.1 2.4%Kingston upon Thames 37.2 2.9 34.3 0.1 0.3% 0.4 1.2% 0.1 0.4% 1.5 4.3%Merton 67.7 5.3 62.4 0.2 0.3% 1.8 2.9% 0.2 0.4% 3.2 5.2%
Newham 224.0 7.2 216.8 0.0 0.0% 0.4 0.2% 0.8 0.4% 1.9 0.9%Redbridge 98.0 6.3 91.8 0.6 0.7% 1.8 2.0% 1.0 1.1% 2.7 3.0%Richmond upon Thames 28.0 4.7 23.3 0.0 0.1% 1.8 7.6% 0.0 0.2% 3.0 12.9%Sutton 54.5 3.4 51.1 0.1 0.3% 0.5 0.9% 0.2 0.4% 1.3 2.6%Waltham Forest 123.0 5.9 117.1 0.4 0.4% 1.3 1.1% 0.9 0.7% 2.0 1.7%
GLA - all functions 2,287.3 0.0 2,287.3 0.0 0.0% 0.0 0.0% 0.0 0.0% 0.0 0.0%
GLA - police 2,027.7 0.0 2,027.7 0.0 0.0% 0.0 0.0% 0.0 0.0% 0.0 0.0%GLA - fire 259.6 0.0 259.6 0.0 0.0% 0.0 0.0% 0.0 0.0% 0.0 0.0%
239

Base Position = 2010-11 Indicative Allocations - 2008-09 Concessionary Travel Net Revenue Expenditure Formula Grant After Floor DampingLocal Authority
(£ million) (£ million) (£ million) (£ million) (%) (£ million) (%) (£ million) (%) (£ million) (%)
2010-11 Indicative Allocat-
ions
2008-09 Concess-
ionary Travel
Base Position Option CONCF2 Option CONCF3 Option CONCF4
Difference from the Base PositionOption CONCF1
GREATER MANCHESTERBolton 127.6 4.8 122.8 0.2 0.2% 0.4 0.3% 0.1 0.1% -0.7 -0.6%Bury 66.2 3.3 62.8 0.3 0.5% 0.7 1.0% 0.2 0.4% 0.1 0.2%Manchester 342.5 8.4 334.0 -0.2 -0.1% -1.6 -0.5% 0.1 0.0% -3.5 -1.0%Oldham 121.6 4.0 117.6 0.0 0.0% 0.1 0.1% 0.0 0.0% -0.6 -0.5%Rochdale 109.7 3.8 106.0 0.1 0.1% 0.1 0.1% 0.0 0.0% -1.0 -0.9%Salford 130.2 4.0 126.2 0.1 0.1% 0.1 0.0% 0.2 0.1% -1.5 -1.2%Stockport 83.5 5.1 78.3 0.6 0.8% 1.3 1.7% 0.6 0.7% 1.0 1.3%Tameside 105.5 3.9 101.6 0.2 0.2% 0.4 0.4% 0.0 0.0% -0.8 -0.8%Trafford 69.8 3.9 66.0 0.2 0.3% 0.8 1.2% 0.3 0.4% 0.6 0.9%Wigan 133.1 5.6 127.5 0.3 0.3% 0.7 0.6% 0.0 0.0% -1.2 -0.9%Greater Manchester Fire 75.3 0.0 75.3 -0.1 -0.2% -0.1 -0.2% -0.1 -0.2% -0.1 -0.2%Greater Manchester Police 472.5 0.0 472.5 -0.2 0.0% -0.2 0.0% -0.2 0.0% -0.2 0.0%
MERSEYSIDEKnowsley 118.5 4.7 113.8 0.4 0.3% 2.1 1.8% 0.5 0.4% 0.4 0.4%Liverpool 325.1 13.5 311.6 1.0 0.3% 5.2 1.7% 1.3 0.4% 0.4 0.1%Sefton 124.7 8.6 116.1 1.2 1.1% 4.1 3.5% 1.1 0.9% 2.7 2.3%St Helens 88.0 5.5 82.5 0.8 0.9% 2.6 3.1% 0.6 0.7% 1.5 1.8%Wirral 157.9 9.6 148.3 1.3 0.9% 4.4 3.0% 1.1 0.7% 2.9 1.9%Merseyside Fire 46.3 0.0 46.3 0.0 0.0% 0.0 0.0% 0.0 0.0% 0.0 0.0%Merseyside Police 274.3 0.0 274.3 -0.2 -0.1% -0.2 -0.1% -0.1 0.0% -0.1 0.0%
SOUTH YORKSHIREBarnsley 109.9 5.0 104.9 0.5 0.5% 1.5 1.4% 0.2 0.2% -0.3 -0.2%Doncaster 143.2 6.5 136.7 0.6 0.4% 1.9 1.4% 0.4 0.3% 0.7 0.5%Rotherham 123.4 5.7 117.7 0.5 0.4% 1.7 1.4% 0.3 0.3% 0.7 0.6%Sheffield 277.6 11.9 265.7 1.0 0.4% 3.2 1.2% 1.1 0.4% 1.9 0.7%South Yorkshire Fire 36.8 0.0 36.8 -0.1 -0.2% -0.1 -0.2% -0.1 -0.2% -0.1 -0.2%South Yorkshire Police 209.2 0.0 209.2 0.0 0.0% 0.0 0.0% 0.0 0.0% 0.0 0.0%
TYNE AND WEARGateshead 105.8 6.8 99.0 0.3 0.3% 3.8 3.8% 0.4 0.4% 2.2 2.2%Newcastle upon Tyne 167.0 9.8 157.2 0.5 0.3% 5.2 3.3% 0.6 0.4% 3.9 2.5%North Tyneside 87.9 7.0 80.9 1.1 1.3% 4.1 5.0% 1.0 1.2% 3.1 3.8%South Tyneside 90.3 5.4 84.9 0.5 0.6% 2.9 3.5% 0.4 0.5% 1.7 2.0%Sunderland 157.5 10.0 147.5 1.4 1.0% 5.1 3.5% 1.2 0.8% 3.0 2.0%Tyne and Wear Fire 35.6 0.0 35.6 -0.1 -0.3% -0.1 -0.3% -0.1 -0.2% -0.1 -0.2%Northumbria Police 256.2 0.0 256.2 0.0 0.0% 0.0 0.0% 0.0 0.0% 0.0 0.0%
WEST MIDLANDSBirmingham 678.1 25.6 652.5 1.5 0.2% 5.9 0.9% 2.2 0.3% 4.3 0.7%Coventry 153.0 7.8 145.3 0.8 0.5% 2.6 1.8% 0.9 0.6% 2.0 1.4%Dudley 125.6 7.7 117.9 1.0 0.9% 3.2 2.7% 0.9 0.8% 2.4 2.1%Sandwell 183.3 7.3 176.1 0.5 0.3% 2.0 1.1% 0.5 0.3% 0.7 0.4%Solihull 54.6 5.2 49.5 0.1 0.2% 2.4 4.8% 0.2 0.3% 2.6 5.2%Walsall 137.3 6.4 130.8 0.6 0.5% 2.2 1.6% 0.6 0.4% 1.2 0.9%Wolverhampton 144.1 5.9 138.2 0.5 0.4% 1.7 1.3% 0.5 0.4% 0.7 0.5%West Midlands Fire 80.8 0.0 80.8 -0.2 -0.2% -0.2 -0.2% -0.2 -0.2% -0.2 -0.2%West Midlands Police 504.3 0.0 504.3 -0.4 -0.1% -0.4 -0.1% -0.2 0.0% -0.2 0.0%
WEST YORKSHIREBradford 272.0 8.3 263.7 0.0 0.0% -0.3 -0.1% 0.2 0.1% -1.0 -0.4%Calderdale 81.5 3.3 78.2 0.2 0.3% 0.4 0.5% 0.2 0.2% 0.1 0.1%Kirklees 157.2 6.7 150.5 0.5 0.3% 0.9 0.6% 0.4 0.2% 0.2 0.2%Leeds 303.5 12.8 290.7 0.8 0.3% 1.2 0.4% 1.0 0.3% 1.1 0.4%Wakefield 141.3 5.3 135.9 0.3 0.2% 0.5 0.3% 0.0 0.0% -1.0 -0.8%West Yorkshire Fire 57.5 0.0 57.5 -0.1 -0.1% -0.1 -0.1% -0.1 -0.1% -0.1 -0.1%West Yorkshire Police 350.5 0.0 350.5 -0.1 0.0% -0.1 0.0% -0.1 0.0% -0.1 0.0%
240
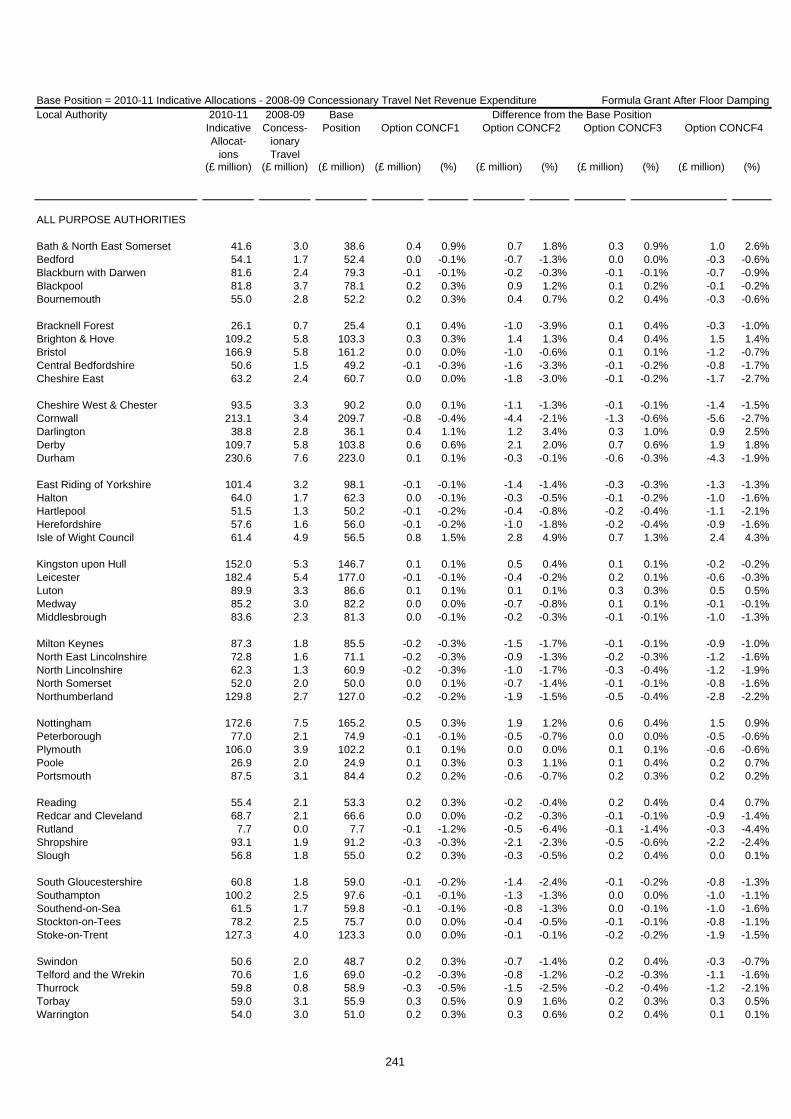
Base Position = 2010-11 Indicative Allocations - 2008-09 Concessionary Travel Net Revenue Expenditure Formula Grant After Floor DampingLocal Authority
(£ million) (£ million) (£ million) (£ million) (%) (£ million) (%) (£ million) (%) (£ million) (%)
2010-11 Indicative Allocat-
ions
2008-09 Concess-
ionary Travel
Base Position Option CONCF2 Option CONCF3 Option CONCF4
Difference from the Base PositionOption CONCF1
ALL PURPOSE AUTHORITIES
Bath & North East Somerset 41.6 3.0 38.6 0.4 0.9% 0.7 1.8% 0.3 0.9% 1.0 2.6%Bedford 54.1 1.7 52.4 0.0 -0.1% -0.7 -1.3% 0.0 0.0% -0.3 -0.6%Blackburn with Darwen 81.6 2.4 79.3 -0.1 -0.1% -0.2 -0.3% -0.1 -0.1% -0.7 -0.9%Blackpool 81.8 3.7 78.1 0.2 0.3% 0.9 1.2% 0.1 0.2% -0.1 -0.2%Bournemouth 55.0 2.8 52.2 0.2 0.3% 0.4 0.7% 0.2 0.4% -0.3 -0.6%
Bracknell Forest 26.1 0.7 25.4 0.1 0.4% -1.0 -3.9% 0.1 0.4% -0.3 -1.0%Brighton & Hove 109.2 5.8 103.3 0.3 0.3% 1.4 1.3% 0.4 0.4% 1.5 1.4%Bristol 166.9 5.8 161.2 0.0 0.0% -1.0 -0.6% 0.1 0.1% -1.2 -0.7%Central Bedfordshire 50.6 1.5 49.2 -0.1 -0.3% -1.6 -3.3% -0.1 -0.2% -0.8 -1.7%Cheshire East 63.2 2.4 60.7 0.0 0.0% -1.8 -3.0% -0.1 -0.2% -1.7 -2.7%
Cheshire West & Chester 93.5 3.3 90.2 0.0 0.1% -1.1 -1.3% -0.1 -0.1% -1.4 -1.5%Cornwall 213.1 3.4 209.7 -0.8 -0.4% -4.4 -2.1% -1.3 -0.6% -5.6 -2.7%Darlington 38.8 2.8 36.1 0.4 1.1% 1.2 3.4% 0.3 1.0% 0.9 2.5%Derby 109.7 5.8 103.8 0.6 0.6% 2.1 2.0% 0.7 0.6% 1.9 1.8%Durham 230.6 7.6 223.0 0.1 0.1% -0.3 -0.1% -0.6 -0.3% -4.3 -1.9%
East Riding of Yorkshire 101.4 3.2 98.1 -0.1 -0.1% -1.4 -1.4% -0.3 -0.3% -1.3 -1.3%Halton 64.0 1.7 62.3 0.0 -0.1% -0.3 -0.5% -0.1 -0.2% -1.0 -1.6%Hartlepool 51.5 1.3 50.2 -0.1 -0.2% -0.4 -0.8% -0.2 -0.4% -1.1 -2.1%Herefordshire 57.6 1.6 56.0 -0.1 -0.2% -1.0 -1.8% -0.2 -0.4% -0.9 -1.6%Isle of Wight Council 61.4 4.9 56.5 0.8 1.5% 2.8 4.9% 0.7 1.3% 2.4 4.3%
Kingston upon Hull 152.0 5.3 146.7 0.1 0.1% 0.5 0.4% 0.1 0.1% -0.2 -0.2%Leicester 182.4 5.4 177.0 -0.1 -0.1% -0.4 -0.2% 0.2 0.1% -0.6 -0.3%Luton 89.9 3.3 86.6 0.1 0.1% 0.1 0.1% 0.3 0.3% 0.5 0.5%Medway 85.2 3.0 82.2 0.0 0.0% -0.7 -0.8% 0.1 0.1% -0.1 -0.1%Middlesbrough 83.6 2.3 81.3 0.0 -0.1% -0.2 -0.3% -0.1 -0.1% -1.0 -1.3%
Milton Keynes 87.3 1.8 85.5 -0.2 -0.3% -1.5 -1.7% -0.1 -0.1% -0.9 -1.0%North East Lincolnshire 72.8 1.6 71.1 -0.2 -0.3% -0.9 -1.3% -0.2 -0.3% -1.2 -1.6%North Lincolnshire 62.3 1.3 60.9 -0.2 -0.3% -1.0 -1.7% -0.3 -0.4% -1.2 -1.9%North Somerset 52.0 2.0 50.0 0.0 0.1% -0.7 -1.4% -0.1 -0.1% -0.8 -1.6%Northumberland 129.8 2.7 127.0 -0.2 -0.2% -1.9 -1.5% -0.5 -0.4% -2.8 -2.2%
Nottingham 172.6 7.5 165.2 0.5 0.3% 1.9 1.2% 0.6 0.4% 1.5 0.9%Peterborough 77.0 2.1 74.9 -0.1 -0.1% -0.5 -0.7% 0.0 0.0% -0.5 -0.6%Plymouth 106.0 3.9 102.2 0.1 0.1% 0.0 0.0% 0.1 0.1% -0.6 -0.6%Poole 26.9 2.0 24.9 0.1 0.3% 0.3 1.1% 0.1 0.4% 0.2 0.7%Portsmouth 87.5 3.1 84.4 0.2 0.2% -0.6 -0.7% 0.2 0.3% 0.2 0.2%
Reading 55.4 2.1 53.3 0.2 0.3% -0.2 -0.4% 0.2 0.4% 0.4 0.7%Redcar and Cleveland 68.7 2.1 66.6 0.0 0.0% -0.2 -0.3% -0.1 -0.1% -0.9 -1.4%Rutland 7.7 0.0 7.7 -0.1 -1.2% -0.5 -6.4% -0.1 -1.4% -0.3 -4.4%Shropshire 93.1 1.9 91.2 -0.3 -0.3% -2.1 -2.3% -0.5 -0.6% -2.2 -2.4%Slough 56.8 1.8 55.0 0.2 0.3% -0.3 -0.5% 0.2 0.4% 0.0 0.1%
South Gloucestershire 60.8 1.8 59.0 -0.1 -0.2% -1.4 -2.4% -0.1 -0.2% -0.8 -1.3%Southampton 100.2 2.5 97.6 -0.1 -0.1% -1.3 -1.3% 0.0 0.0% -1.0 -1.1%Southend-on-Sea 61.5 1.7 59.8 -0.1 -0.1% -0.8 -1.3% 0.0 -0.1% -1.0 -1.6%Stockton-on-Tees 78.2 2.5 75.7 0.0 0.0% -0.4 -0.5% -0.1 -0.1% -0.8 -1.1%Stoke-on-Trent 127.3 4.0 123.3 0.0 0.0% -0.1 -0.1% -0.2 -0.2% -1.9 -1.5%
Swindon 50.6 2.0 48.7 0.2 0.3% -0.7 -1.4% 0.2 0.4% -0.3 -0.7%Telford and the Wrekin 70.6 1.6 69.0 -0.2 -0.3% -0.8 -1.2% -0.2 -0.3% -1.1 -1.6%Thurrock 59.8 0.8 58.9 -0.3 -0.5% -1.5 -2.5% -0.2 -0.4% -1.2 -2.1%Torbay 59.0 3.1 55.9 0.3 0.5% 0.9 1.6% 0.2 0.3% 0.3 0.5%Warrington 54.0 3.0 51.0 0.2 0.3% 0.3 0.6% 0.2 0.4% 0.1 0.1%
241

Base Position = 2010-11 Indicative Allocations - 2008-09 Concessionary Travel Net Revenue Expenditure Formula Grant After Floor DampingLocal Authority
(£ million) (£ million) (£ million) (£ million) (%) (£ million) (%) (£ million) (%) (£ million) (%)
2010-11 Indicative Allocat-
ions
2008-09 Concess-
ionary Travel
Base Position Option CONCF2 Option CONCF3 Option CONCF4
Difference from the Base PositionOption CONCF1
West Berkshire 29.2 0.5 28.7 0.1 0.4% -1.6 -5.4% 0.1 0.5% -0.8 -2.7%Wiltshire 102.2 3.3 98.9 0.3 0.3% -2.4 -2.4% 0.4 0.4% -1.2 -1.2%Windsor and Maidenhead 18.8 1.0 17.8 0.1 0.3% -0.9 -5.3% 0.1 0.4% -0.2 -1.1%Wokingham 19.6 1.1 18.4 0.1 0.3% -0.8 -4.4% 0.1 0.4% 0.2 1.0%York 44.6 3.5 41.1 0.5 1.1% 1.0 2.3% 0.5 1.2% 1.4 3.5%
Isles of Scilly 2.3 0.0 2.3 0.0 0.0% 0.0 0.0% 0.0 0.0% 0.0 0.0%
242
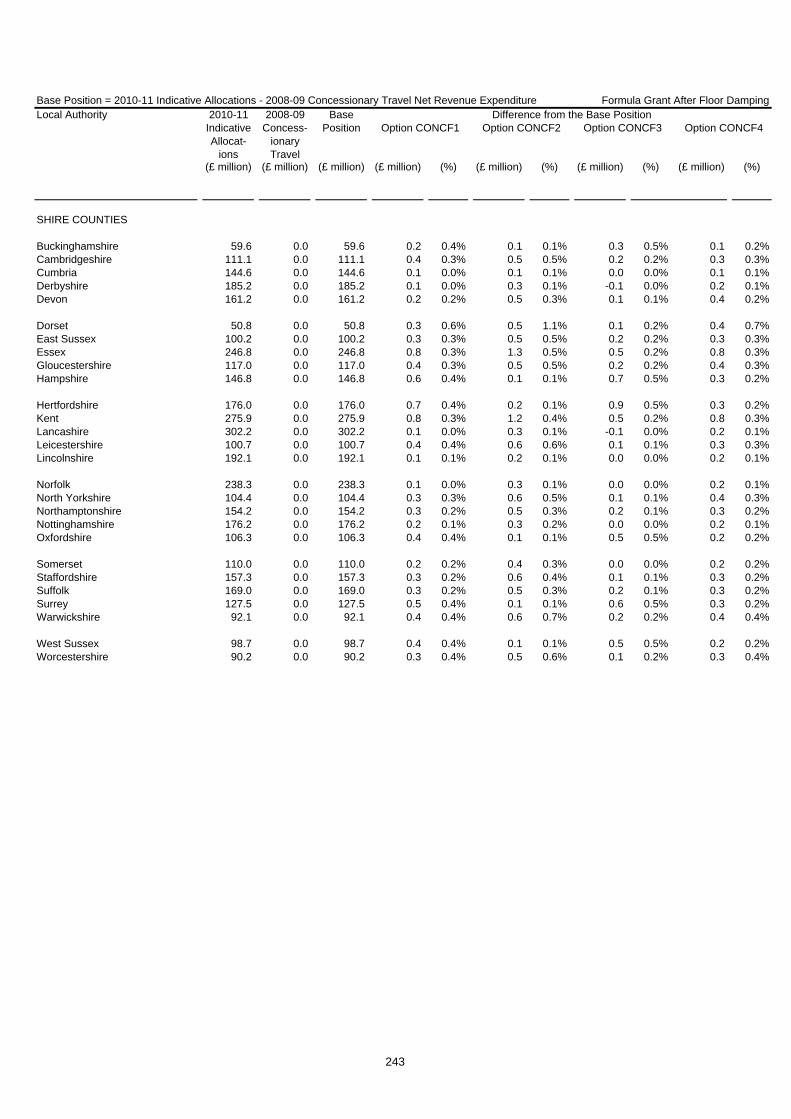
Base Position = 2010-11 Indicative Allocations - 2008-09 Concessionary Travel Net Revenue Expenditure Formula Grant After Floor DampingLocal Authority
(£ million) (£ million) (£ million) (£ million) (%) (£ million) (%) (£ million) (%) (£ million) (%)
2010-11 Indicative Allocat-
ions
2008-09 Concess-
ionary Travel
Base Position Option CONCF2 Option CONCF3 Option CONCF4
Difference from the Base PositionOption CONCF1
SHIRE COUNTIES
Buckinghamshire 59.6 0.0 59.6 0.2 0.4% 0.1 0.1% 0.3 0.5% 0.1 0.2%Cambridgeshire 111.1 0.0 111.1 0.4 0.3% 0.5 0.5% 0.2 0.2% 0.3 0.3%Cumbria 144.6 0.0 144.6 0.1 0.0% 0.1 0.1% 0.0 0.0% 0.1 0.1%Derbyshire 185.2 0.0 185.2 0.1 0.0% 0.3 0.1% -0.1 0.0% 0.2 0.1%Devon 161.2 0.0 161.2 0.2 0.2% 0.5 0.3% 0.1 0.1% 0.4 0.2%
Dorset 50.8 0.0 50.8 0.3 0.6% 0.5 1.1% 0.1 0.2% 0.4 0.7%East Sussex 100.2 0.0 100.2 0.3 0.3% 0.5 0.5% 0.2 0.2% 0.3 0.3%Essex 246.8 0.0 246.8 0.8 0.3% 1.3 0.5% 0.5 0.2% 0.8 0.3%Gloucestershire 117.0 0.0 117.0 0.4 0.3% 0.5 0.5% 0.2 0.2% 0.4 0.3%Hampshire 146.8 0.0 146.8 0.6 0.4% 0.1 0.1% 0.7 0.5% 0.3 0.2%
Hertfordshire 176.0 0.0 176.0 0.7 0.4% 0.2 0.1% 0.9 0.5% 0.3 0.2%Kent 275.9 0.0 275.9 0.8 0.3% 1.2 0.4% 0.5 0.2% 0.8 0.3%Lancashire 302.2 0.0 302.2 0.1 0.0% 0.3 0.1% -0.1 0.0% 0.2 0.1%Leicestershire 100.7 0.0 100.7 0.4 0.4% 0.6 0.6% 0.1 0.1% 0.3 0.3%Lincolnshire 192.1 0.0 192.1 0.1 0.1% 0.2 0.1% 0.0 0.0% 0.2 0.1%
Norfolk 238.3 0.0 238.3 0.1 0.0% 0.3 0.1% 0.0 0.0% 0.2 0.1%North Yorkshire 104.4 0.0 104.4 0.3 0.3% 0.6 0.5% 0.1 0.1% 0.4 0.3%Northamptonshire 154.2 0.0 154.2 0.3 0.2% 0.5 0.3% 0.2 0.1% 0.3 0.2%Nottinghamshire 176.2 0.0 176.2 0.2 0.1% 0.3 0.2% 0.0 0.0% 0.2 0.1%Oxfordshire 106.3 0.0 106.3 0.4 0.4% 0.1 0.1% 0.5 0.5% 0.2 0.2%
Somerset 110.0 0.0 110.0 0.2 0.2% 0.4 0.3% 0.0 0.0% 0.2 0.2%Staffordshire 157.3 0.0 157.3 0.3 0.2% 0.6 0.4% 0.1 0.1% 0.3 0.2%Suffolk 169.0 0.0 169.0 0.3 0.2% 0.5 0.3% 0.2 0.1% 0.3 0.2%Surrey 127.5 0.0 127.5 0.5 0.4% 0.1 0.1% 0.6 0.5% 0.3 0.2%Warwickshire 92.1 0.0 92.1 0.4 0.4% 0.6 0.7% 0.2 0.2% 0.4 0.4%
West Sussex 98.7 0.0 98.7 0.4 0.4% 0.1 0.1% 0.5 0.5% 0.2 0.2%Worcestershire 90.2 0.0 90.2 0.3 0.4% 0.5 0.6% 0.1 0.2% 0.3 0.4%
243

Base Position = 2010-11 Indicative Allocations - 2008-09 Concessionary Travel Net Revenue Expenditure Formula Grant After Floor DampingLocal Authority
(£ million) (£ million) (£ million) (£ million) (%) (£ million) (%) (£ million) (%) (£ million) (%)
2010-11 Indicative Allocat-
ions
2008-09 Concess-
ionary Travel
Base Position Option CONCF2 Option CONCF3 Option CONCF4
Difference from the Base PositionOption CONCF1
BUCKINGHAMSHIREAylesbury Vale 11.9 1.2 10.7 -0.5 -4.7% -1.2 -11.0% -0.4 -4.1% -0.6 -5.3%Chiltern 4.0 1.1 2.9 -0.1 -3.8% -0.1 -2.7% -0.1 -4.1% 0.3 10.1%South Bucks 3.0 0.7 2.3 -0.1 -3.7% -0.1 -4.6% -0.1 -4.0% 0.2 8.2%Wycombe 10.1 2.5 7.6 -0.1 -0.7% 0.3 4.4% 0.1 1.3% 0.9 11.7%
CAMBRIDGESHIRECambridge 12.4 2.1 10.3 -0.2 -1.9% 0.3 2.9% 0.0 0.0% 0.7 7.0%East Cambridgeshire 6.8 0.1 6.7 -0.3 -4.1% -1.1 -15.8% -0.3 -4.4% -0.9 -12.8%Fenland 9.6 0.3 9.4 -0.5 -5.6% -1.1 -12.2% -0.6 -5.9% -1.4 -14.9%Huntingdonshire 12.9 0.7 12.2 -0.7 -6.0% -1.5 -12.6% -0.7 -5.6% -1.1 -8.8%South Cambridgeshire 7.8 0.3 7.6 -0.3 -4.0% -1.5 -20.1% -0.3 -4.3% -1.0 -12.9%
CUMBRIAAllerdale 10.6 1.2 9.4 -0.3 -3.6% -0.2 -2.6% -0.4 -3.9% -0.7 -6.9%Barrow-in-Furness 9.1 0.7 8.4 -0.3 -4.0% -0.5 -6.3% -0.4 -4.3% -1.1 -12.6%Carlisle 10.4 2.0 8.4 0.0 -0.1% 0.4 4.7% -0.1 -1.4% 0.1 1.2%Copeland 7.2 0.5 6.7 -0.2 -3.6% -0.5 -7.3% -0.3 -3.9% -0.9 -13.0%Eden 4.6 0.1 4.5 -0.2 -4.7% -0.7 -15.3% -0.2 -5.0% -0.6 -12.8%South Lakeland 6.9 0.8 6.1 -0.2 -3.6% -0.6 -10.4% -0.2 -3.9% -0.5 -8.0%
DERBYSHIREAmber Valley 9.9 1.5 8.4 -0.1 -1.6% -0.2 -1.8% -0.3 -3.0% -0.4 -5.2%Bolsover 7.9 0.7 7.2 -0.3 -3.6% -0.4 -5.3% -0.3 -4.3% -0.9 -12.3%Chesterfield 10.2 3.1 7.1 0.6 7.9% 1.6 22.1% 0.4 5.7% 1.0 13.7%Derbyshire Dales 4.8 0.4 4.4 -0.2 -3.6% -0.6 -12.8% -0.2 -3.9% -0.4 -9.9%Erewash 9.7 1.8 7.9 0.0 0.2% 0.2 3.1% 0.0 -0.3% 0.1 1.5%High Peak 7.1 1.0 6.2 -0.2 -2.6% -0.3 -4.4% -0.2 -3.3% -0.3 -5.3%North East Derbyshire 7.9 0.9 7.0 -0.2 -3.5% -0.4 -6.2% -0.3 -4.3% -0.8 -11.0%South Derbyshire 7.3 0.5 6.8 -0.4 -5.6% -0.8 -11.4% -0.4 -5.9% -0.8 -11.3%
DEVONEast Devon 8.2 1.1 7.1 -0.3 -3.9% -0.7 -9.9% -0.4 -5.0% -0.7 -9.9%Exeter 12.1 2.6 9.5 0.2 2.3% 0.8 8.5% 0.3 2.9% 0.9 9.2%Mid Devon 6.2 0.3 5.9 -0.3 -5.2% -0.8 -13.5% -0.3 -5.4% -0.8 -13.8%North Devon 8.3 0.1 8.2 -0.4 -5.2% -1.3 -15.9% -0.5 -5.5% -1.5 -18.1%South Hams 5.5 0.3 5.2 -0.2 -4.3% -0.9 -16.2% -0.2 -4.6% -0.9 -17.2%Teignbridge 9.9 1.0 8.9 -0.4 -4.4% -0.8 -9.2% -0.5 -5.3% -1.0 -11.4%Torridge 6.4 0.2 6.2 -0.4 -5.8% -0.8 -13.0% -0.4 -6.1% -0.9 -14.8%West Devon 4.3 0.2 4.2 -0.2 -4.8% -0.6 -14.1% -0.2 -5.1% -0.6 -15.2%
DORSETChristchurch 2.9 0.5 2.4 0.0 -0.4% 0.0 -1.5% 0.0 -0.9% -0.1 -3.8%East Dorset 3.7 0.4 3.3 -0.2 -5.2% -0.6 -18.7% -0.2 -5.4% -0.5 -14.7%North Dorset 4.6 0.1 4.4 -0.2 -5.4% -0.8 -18.1% -0.3 -5.7% -0.7 -15.8%Purbeck 3.3 0.3 3.0 -0.1 -3.6% -0.3 -10.5% -0.1 -3.9% -0.3 -9.8%West Dorset 8.3 0.4 7.9 -0.3 -3.6% -1.0 -13.2% -0.3 -3.9% -1.0 -12.4%Weymouth and Portland 6.0 0.8 5.3 -0.1 -2.4% -0.2 -3.4% -0.2 -3.3% -0.4 -6.8%
EAST SUSSEXEastbourne 10.4 1.9 8.5 0.0 0.5% 0.3 4.0% 0.1 0.7% 0.3 3.0%Hastings 10.4 1.2 9.3 -0.3 -2.8% -0.3 -3.3% -0.4 -3.8% -0.7 -7.9%Lewes 6.4 0.7 5.7 -0.2 -4.1% -0.5 -9.5% -0.2 -4.3% -0.5 -8.9%Rother 6.6 0.3 6.3 -0.2 -3.6% -1.0 -15.4% -0.2 -3.9% -1.1 -17.4%Wealden 8.3 0.6 7.6 -0.4 -5.3% -1.3 -16.4% -0.4 -5.6% -1.0 -13.7%
244

Base Position = 2010-11 Indicative Allocations - 2008-09 Concessionary Travel Net Revenue Expenditure Formula Grant After Floor DampingLocal Authority
(£ million) (£ million) (£ million) (£ million) (%) (£ million) (%) (£ million) (%) (£ million) (%)
2010-11 Indicative Allocat-
ions
2008-09 Concess-
ionary Travel
Base Position Option CONCF2 Option CONCF3 Option CONCF4
Difference from the Base PositionOption CONCF1
ESSEXBasildon 15.9 1.8 14.1 -0.5 -3.5% -0.8 -6.0% -0.5 -3.5% -1.0 -6.8%Braintree 10.2 1.2 9.1 -0.4 -4.1% -0.8 -8.7% -0.4 -4.4% -0.7 -7.5%Brentwood 5.2 0.5 4.7 -0.2 -3.6% -0.4 -9.0% -0.2 -3.9% -0.3 -5.9%Castle Point 6.6 0.9 5.7 -0.1 -2.5% -0.3 -4.7% -0.1 -2.3% -0.3 -4.5%Chelmsford 10.5 1.9 8.5 -0.1 -0.9% -0.2 -2.2% 0.1 0.7% 0.3 3.5%Colchester 12.9 2.5 10.4 0.0 0.0% 0.1 1.3% 0.0 0.3% 0.3 3.0%Epping Forest 9.4 0.5 8.9 -0.3 -3.6% -1.2 -14.0% -0.3 -3.9% -1.1 -11.9%Harlow 8.9 1.4 7.5 -0.3 -3.7% 0.2 2.4% -0.3 -4.0% 0.1 1.1%Maldon 4.4 0.5 4.0 -0.2 -4.2% -0.4 -9.3% -0.2 -4.8% -0.3 -8.1%Rochford 5.1 0.8 4.4 -0.1 -2.7% -0.3 -6.5% -0.1 -2.1% -0.2 -3.8%Tendring 14.2 1.6 12.6 -0.4 -3.2% -0.6 -5.0% -0.6 -4.8% -1.2 -9.8%Uttlesford 4.1 0.2 3.9 -0.1 -3.6% -0.7 -18.9% -0.2 -3.9% -0.4 -10.1%
GLOUCESTERSHIRECheltenham 8.8 1.4 7.5 -0.2 -2.7% -0.2 -2.9% -0.1 -1.6% -0.1 -1.4%Cotswold 5.4 0.1 5.2 -0.3 -4.9% -1.0 -20.0% -0.3 -5.2% -0.8 -15.6%Forest of Dean 6.8 0.6 6.3 -0.3 -4.7% -0.6 -9.3% -0.3 -5.4% -0.7 -11.6%Gloucester 10.9 1.2 9.7 -0.4 -3.6% -0.5 -5.1% -0.3 -3.5% -0.6 -5.9%Stroud 7.2 0.8 6.4 -0.3 -4.3% -0.6 -9.8% -0.3 -4.9% -0.6 -9.0%Tewkesbury 5.3 0.6 4.8 -0.2 -4.3% -0.5 -10.6% -0.2 -4.6% -0.3 -7.2%
HAMPSHIREBasingstoke and Deane 10.1 2.3 7.8 0.1 1.3% 0.2 2.7% 0.2 2.8% 0.7 9.4%East Hampshire 6.2 0.5 5.7 -0.2 -3.6% -0.9 -15.7% -0.2 -3.9% -0.5 -9.0%Eastleigh 7.8 1.1 6.7 -0.2 -2.9% -0.4 -6.4% -0.1 -1.4% -0.1 -1.7%Fareham 6.2 1.5 4.8 0.0 -0.1% 0.1 1.9% 0.1 2.1% 0.4 9.3%Gosport 7.3 1.2 6.1 -0.1 -2.1% 0.0 0.4% -0.1 -0.9% 0.1 2.0%Hart 3.9 0.2 3.7 -0.2 -4.1% -0.9 -24.1% -0.2 -4.4% -0.4 -10.7%Havant 9.9 1.2 8.7 -0.2 -2.8% -0.4 -4.8% -0.3 -2.9% -0.5 -5.7%New Forest 11.6 1.0 10.6 -0.5 -4.5% -1.3 -12.4% -0.5 -4.8% -1.1 -10.5%Rushmoor 7.0 0.8 6.3 -0.2 -3.6% -0.4 -6.5% -0.2 -3.9% -0.1 -2.4%Test Valley 7.1 1.0 6.1 -0.2 -3.7% -0.6 -9.1% -0.2 -3.0% -0.2 -3.9%Winchester 7.0 0.9 6.1 -0.2 -3.7% -0.6 -9.5% -0.2 -4.0% -0.1 -2.3%
HERTFORDSHIREBroxbourne 7.0 1.1 5.8 -0.1 -1.9% -0.2 -3.7% 0.0 -0.7% -0.1 -0.9%Dacorum 9.7 1.8 7.9 -0.2 -2.0% -0.2 -2.2% 0.0 -0.6% 0.2 2.5%East Hertfordshire 8.2 0.9 7.2 -0.3 -3.6% -0.9 -12.4% -0.3 -3.8% -0.4 -4.8%Hertsmere 7.9 0.6 7.3 -0.3 -3.6% -0.8 -10.5% -0.3 -3.9% -0.6 -8.3%North Hertfordshire 8.1 1.0 7.0 -0.3 -3.8% -0.6 -9.0% -0.2 -3.1% -0.4 -5.3%St Albans 7.7 0.3 7.4 -0.3 -3.6% -1.5 -20.8% -0.3 -3.9% -1.0 -13.9%Stevenage 7.9 1.6 6.3 0.0 0.1% 0.4 6.4% 0.1 0.8% 0.4 6.6%Three Rivers 5.7 0.8 4.9 -0.2 -3.7% -0.4 -7.4% -0.2 -4.0% -0.1 -1.9%Watford 8.1 1.2 6.8 -0.3 -3.7% 0.0 -0.5% -0.3 -4.0% 0.1 1.9%Welwyn Hatfield 7.9 1.0 6.9 -0.2 -3.3% -0.5 -7.1% -0.1 -2.1% -0.2 -3.4%
KENTAshford 8.3 0.8 7.5 -0.3 -4.6% -0.7 -10.0% -0.4 -4.8% -0.6 -8.0%Canterbury 13.2 2.4 10.9 0.0 -0.1% 0.2 2.1% 0.0 0.0% 0.3 2.4%Dartford 7.5 0.9 6.6 -0.2 -3.2% -0.4 -6.0% -0.1 -2.0% -0.2 -2.8%Dover 10.2 1.3 8.9 -0.3 -3.7% -0.3 -3.2% -0.4 -4.0% -0.5 -5.9%Gravesham 8.4 1.3 7.2 -0.1 -1.9% -0.2 -2.4% -0.1 -1.2% -0.1 -1.1%Maidstone 9.5 2.0 7.5 -0.1 -1.9% 0.1 1.3% -0.1 -1.3% 0.4 4.7%Sevenoaks 6.3 0.7 5.7 -0.2 -3.6% -0.9 -15.2% -0.2 -3.9% -0.5 -9.1%Shepway 10.0 1.5 8.5 -0.1 -1.2% 0.0 -0.4% -0.2 -2.0% -0.2 -2.9%Swale 12.1 0.9 11.2 -0.5 -4.2% -1.1 -9.4% -0.5 -4.5% -1.1 -10.1%Thanet 13.3 1.6 11.7 -0.4 -3.0% -0.5 -4.6% -0.5 -4.2% -1.1 -9.5%Tonbridge and Malling 6.5 0.8 5.8 -0.2 -3.7% -0.7 -11.8% -0.2 -3.5% -0.4 -6.7%Tunbridge Wells 7.0 1.3 5.7 -0.2 -3.7% -0.2 -2.7% -0.2 -3.4% 0.1 1.3%
245

Base Position = 2010-11 Indicative Allocations - 2008-09 Concessionary Travel Net Revenue Expenditure Formula Grant After Floor DampingLocal Authority
(£ million) (£ million) (£ million) (£ million) (%) (£ million) (%) (£ million) (%) (£ million) (%)
2010-11 Indicative Allocat-
ions
2008-09 Concess-
ionary Travel
Base Position Option CONCF2 Option CONCF3 Option CONCF4
Difference from the Base PositionOption CONCF1
LANCASHIREBurnley 11.9 1.5 10.4 -0.2 -2.0% 0.0 0.3% -0.4 -3.5% -0.7 -6.2%Chorley 8.5 1.2 7.3 -0.2 -2.3% -0.2 -3.4% -0.2 -3.2% -0.4 -5.8%Fylde 5.9 1.1 4.7 0.0 0.1% 0.1 1.2% 0.0 -0.8% 0.0 -0.8%Hyndburn 10.2 1.1 9.0 -0.2 -2.6% -0.2 -2.4% -0.4 -4.0% -0.7 -7.7%Lancaster 16.4 2.3 14.1 -0.2 -1.4% 0.0 0.3% -0.3 -2.0% -0.2 -1.8%Pendle 11.1 0.8 10.3 -0.4 -4.1% -0.7 -6.7% -0.5 -4.4% -1.1 -10.5%Preston 16.0 4.1 11.9 0.5 4.4% 2.0 16.4% 0.5 3.9% 1.4 12.1%Ribble Valley 4.1 0.5 3.7 -0.2 -4.2% -0.3 -9.1% -0.2 -5.0% -0.3 -7.6%Rossendale 6.3 0.9 5.4 -0.1 -2.3% -0.1 -1.7% -0.2 -4.0% -0.5 -8.8%South Ribble 7.5 1.0 6.5 -0.2 -3.1% -0.4 -6.1% -0.2 -3.4% -0.5 -7.0%West Lancashire 9.6 1.1 8.4 -0.3 -3.3% -0.5 -5.6% -0.3 -4.0% -0.9 -10.5%Wyre 10.4 1.6 8.8 -0.1 -1.1% 0.0 0.0% -0.2 -2.2% -0.3 -3.3%
LEICESTERSHIREBlaby 6.4 0.5 5.9 -0.3 -5.0% -0.6 -10.4% -0.3 -4.3% -0.4 -7.4%Charnwood 12.5 1.3 11.2 -0.5 -4.1% -0.9 -7.8% -0.4 -3.4% -0.6 -5.3%Harborough 5.4 0.2 5.2 -0.3 -5.7% -0.9 -16.5% -0.3 -6.0% -0.6 -12.2%Hinckley and Bosworth 7.4 0.7 6.7 -0.3 -4.6% -0.7 -9.8% -0.3 -4.8% -0.6 -8.5%Melton 3.9 0.2 3.7 -0.2 -4.6% -0.5 -12.2% -0.2 -4.9% -0.3 -8.0%North West Leicestershire 7.1 0.5 6.6 -0.3 -5.0% -0.7 -10.9% -0.3 -5.3% -0.8 -11.5%Oadby and Wigston 4.6 0.4 4.2 -0.2 -4.2% -0.3 -7.6% -0.1 -3.1% -0.2 -5.0%
LINCOLNSHIREBoston 7.3 0.3 6.9 -0.3 -4.9% -0.6 -8.2% -0.4 -5.6% -0.8 -11.7%East Lindsey 17.4 1.0 16.4 -0.8 -4.9% -1.3 -8.0% -1.0 -6.2% -2.1 -13.1%Lincoln 10.6 1.3 9.3 -0.3 -3.3% -0.1 -1.2% -0.4 -3.9% -0.5 -5.2%North Kesteven 8.8 0.6 8.1 -0.4 -5.3% -0.9 -10.5% -0.5 -5.8% -0.8 -10.1%South Holland 9.0 0.4 8.6 -0.5 -5.5% -0.9 -9.9% -0.5 -6.3% -1.0 -11.8%South Kesteven 10.1 0.5 9.7 -0.4 -4.3% -1.3 -13.6% -0.4 -4.6% -1.2 -12.4%West Lindsey 8.2 0.5 7.7 -0.4 -5.2% -0.8 -10.7% -0.4 -5.5% -0.9 -12.2%
NORFOLKBreckland 11.3 0.3 11.0 -0.6 -5.3% -1.6 -14.6% -0.6 -5.6% -1.7 -15.5%Broadland 8.5 0.7 7.8 -0.4 -5.4% -0.9 -11.8% -0.5 -5.8% -0.9 -11.4%Great Yarmouth 10.8 1.0 9.8 -0.4 -3.7% -0.5 -5.5% -0.5 -5.0% -1.0 -9.9%King's Lynn and West Norfolk 15.4 0.8 14.5 -0.7 -5.1% -1.3 -9.1% -0.8 -5.6% -1.7 -12.0%North Norfolk 9.0 0.3 8.7 -0.4 -4.6% -1.2 -14.0% -0.4 -4.9% -1.5 -17.2%Norwich 15.9 2.8 13.2 0.0 0.2% 0.5 4.1% 0.0 0.0% 0.3 2.3%South Norfolk 8.4 1.2 7.2 -0.2 -2.8% -0.4 -5.7% -0.3 -4.3% -0.4 -5.3%
NORTH YORKSHIRECraven 4.2 0.4 3.8 -0.2 -4.3% -0.4 -9.3% -0.2 -5.0% -0.3 -8.2%Hambleton 5.8 0.2 5.6 -0.3 -4.9% -1.0 -17.2% -0.3 -5.2% -0.8 -13.9%Harrogate 11.3 1.5 9.8 -0.3 -3.1% -0.6 -6.5% -0.3 -2.9% -0.3 -3.2%Richmondshire 4.3 0.2 4.1 -0.2 -6.1% -0.6 -13.8% -0.3 -6.4% -0.4 -10.5%Ryedale 4.5 0.3 4.2 -0.2 -5.8% -0.5 -12.0% -0.3 -6.4% -0.5 -11.4%Scarborough 12.5 2.0 10.5 0.0 -0.1% 0.3 2.8% -0.2 -1.6% -0.1 -1.3%Selby 6.8 0.5 6.2 -0.3 -4.5% -0.6 -9.0% -0.3 -4.8% -0.5 -7.8%
NORTHAMPTONSHIRECorby 5.7 0.5 5.3 -0.2 -3.6% -0.4 -6.8% -0.2 -3.9% -0.5 -9.9%Daventry 6.2 0.4 5.8 -0.4 -6.1% -0.8 -13.1% -0.4 -6.3% -0.6 -9.5%East Northamptonshire 6.7 0.3 6.3 -0.4 -5.8% -0.9 -13.5% -0.4 -6.1% -0.7 -11.5%Kettering 7.3 1.0 6.3 -0.2 -2.5% -0.3 -4.2% -0.2 -2.6% -0.2 -3.7%Northampton 18.9 2.0 16.9 -0.6 -3.6% -0.9 -5.3% -0.5 -3.1% -0.9 -5.1%South Northamptonshire 5.8 0.2 5.6 -0.4 -6.7% -1.0 -17.6% -0.4 -7.0% -0.7 -12.3%Wellingborough 7.0 0.6 6.4 -0.3 -4.3% -0.5 -7.6% -0.3 -4.5% -0.5 -8.0%
246

Base Position = 2010-11 Indicative Allocations - 2008-09 Concessionary Travel Net Revenue Expenditure Formula Grant After Floor DampingLocal Authority
(£ million) (£ million) (£ million) (£ million) (%) (£ million) (%) (£ million) (%) (£ million) (%)
2010-11 Indicative Allocat-
ions
2008-09 Concess-
ionary Travel
Base Position Option CONCF2 Option CONCF3 Option CONCF4
Difference from the Base PositionOption CONCF1
NOTTINGHAMSHIREAshfield 11.5 1.3 10.1 -0.3 -2.9% -0.4 -3.7% -0.4 -4.3% -0.9 -8.5%Bassetlaw 11.3 1.2 10.1 -0.4 -3.5% -0.5 -5.3% -0.5 -4.7% -1.0 -9.8%Broxtowe 8.9 0.9 7.9 -0.3 -3.8% -0.6 -7.0% -0.3 -3.9% -0.6 -7.3%Gedling 9.3 1.2 8.1 -0.2 -2.8% -0.4 -4.5% -0.2 -2.8% -0.4 -4.7%Mansfield 10.4 1.3 9.0 -0.2 -2.3% -0.1 -1.4% -0.4 -4.0% -0.8 -8.7%Newark and Sherwood 10.3 1.0 9.4 -0.4 -4.1% -0.7 -7.2% -0.5 -5.3% -0.8 -9.0%Rushcliffe 7.2 0.6 6.6 -0.3 -5.1% -0.8 -11.9% -0.3 -4.7% -0.5 -8.0%
OXFORDSHIRECherwell 10.9 0.9 10.0 -0.5 -5.3% -1.1 -10.9% -0.5 -4.6% -0.7 -6.6%Oxford 16.8 3.2 13.6 0.1 0.8% 0.7 5.3% 0.4 2.7% 1.3 9.7%South Oxfordshire 7.9 0.6 7.3 -0.3 -3.6% -1.1 -15.7% -0.3 -3.9% -0.6 -7.6%Vale of White Horse 7.1 0.7 6.4 -0.3 -4.7% -0.8 -12.5% -0.3 -4.2% -0.4 -6.1%West Oxfordshire 6.1 0.7 5.4 -0.2 -3.7% -0.7 -12.5% -0.2 -4.0% -0.3 -4.8%
SOMERSETMendip 8.4 1.0 7.4 -0.3 -3.6% -0.5 -7.2% -0.3 -4.6% -0.5 -7.2%Sedgemoor 10.1 0.9 9.1 -0.4 -4.0% -0.7 -7.3% -0.5 -5.1% -0.8 -9.0%South Somerset 11.1 1.6 9.5 -0.2 -2.6% -0.5 -5.5% -0.4 -3.8% -0.5 -5.6%Taunton Deane 8.7 1.5 7.2 -0.1 -0.8% 0.0 -0.2% -0.1 -1.5% -0.1 -0.8%West Somerset 3.3 0.1 3.2 -0.1 -3.8% -0.5 -14.8% -0.1 -4.1% -0.6 -18.0%
STAFFORDSHIRECannock Chase 8.5 1.1 7.4 -0.2 -2.6% -0.3 -3.6% -0.3 -3.6% -0.5 -7.0%East Staffordshire 9.5 1.4 8.1 -0.1 -1.8% -0.2 -1.9% -0.2 -2.1% -0.1 -1.7%Lichfield 6.1 0.5 5.6 -0.2 -4.1% -0.8 -13.5% -0.2 -4.3% -0.7 -13.0%Newcastle-under-Lyme 11.1 1.4 9.7 -0.3 -2.8% -0.4 -3.9% -0.4 -4.1% -0.8 -8.1%South Staffordshire 7.2 1.1 6.1 -0.2 -2.6% -0.3 -5.4% -0.2 -3.2% -0.3 -5.4%Stafford 8.8 1.6 7.1 0.0 -0.5% 0.0 -0.2% -0.1 -1.2% 0.0 0.0%Staffordshire Moorlands 7.6 0.7 6.9 -0.3 -3.6% -0.6 -8.7% -0.3 -3.9% -0.8 -12.3%Tamworth 6.8 0.6 6.2 -0.3 -4.0% -0.4 -6.8% -0.3 -4.3% -0.5 -8.1%
SUFFOLKBabergh 6.2 0.8 5.4 -0.2 -3.0% -0.3 -6.1% -0.2 -3.8% -0.3 -4.7%Forest Heath 5.6 0.4 5.2 -0.2 -3.6% -0.4 -7.5% -0.2 -3.9% -0.3 -4.9%Ipswich 11.9 2.9 9.0 0.3 3.8% 1.1 11.8% 0.4 3.9% 1.0 10.9%Mid Suffolk 6.3 0.7 5.6 -0.2 -3.6% -0.5 -9.6% -0.2 -3.9% -0.2 -4.3%St Edmundsbury 7.1 0.9 6.2 -0.2 -3.4% -0.4 -7.2% -0.2 -3.8% -0.3 -4.8%Suffolk Coastal 8.3 1.1 7.1 -0.2 -3.0% -0.5 -6.8% -0.3 -3.6% -0.4 -5.1%Waveney 11.7 1.5 10.2 -0.2 -2.4% -0.3 -3.0% -0.4 -3.5% -0.6 -5.9%
SURREYElmbridge 6.5 0.2 6.3 -0.3 -4.3% -1.6 -25.1% -0.3 -4.6% -0.9 -14.8%Epsom and Ewell 4.2 0.2 3.9 -0.1 -3.6% -0.7 -17.9% -0.2 -3.9% -0.4 -10.6%Guildford 8.5 1.2 7.3 -0.2 -3.2% -0.6 -8.0% -0.1 -1.2% 0.0 -0.5%Mole Valley 4.0 0.3 3.7 -0.1 -3.6% -0.8 -21.4% -0.1 -3.9% -0.5 -12.9%Reigate and Banstead 6.9 0.7 6.3 -0.2 -3.6% -1.1 -17.0% -0.2 -3.9% -0.6 -10.0%Runnymede 5.6 0.3 5.3 -0.3 -5.6% -0.8 -15.2% -0.2 -4.6% -0.5 -9.2%Spelthorne 5.7 0.4 5.3 -0.2 -3.6% -0.8 -15.5% -0.2 -3.9% -0.5 -9.7%Surrey Heath 4.8 0.6 4.3 -0.2 -3.6% -0.5 -11.0% -0.1 -2.7% 0.0 -0.9%Tandridge 4.2 0.3 4.0 -0.1 -3.6% -0.8 -21.0% -0.2 -3.9% -0.5 -13.6%Waverley 6.1 0.6 5.5 -0.2 -3.6% -1.0 -17.6% -0.2 -3.9% -0.5 -10.0%Woking 6.6 0.7 6.0 -0.2 -3.6% -0.6 -10.2% -0.2 -3.9% -0.3 -4.9%
WARWICKSHIRENorth Warwickshire 5.4 0.4 5.1 -0.2 -4.5% -0.5 -9.9% -0.2 -4.8% -0.6 -11.8%Nuneaton and Bedworth 11.4 1.6 9.8 -0.2 -2.1% -0.2 -1.9% -0.3 -2.8% -0.5 -4.9%Rugby 7.0 0.9 6.2 -0.2 -3.6% -0.4 -6.5% -0.2 -3.9% -0.3 -4.6%Stratford-on-Avon 7.0 0.7 6.3 -0.2 -3.6% -1.0 -15.2% -0.2 -3.9% -0.6 -10.0%Warwick 10.5 1.4 9.0 -0.2 -2.7% -0.5 -5.1% -0.1 -1.7% -0.1 -1.5%
247

Base Position = 2010-11 Indicative Allocations - 2008-09 Concessionary Travel Net Revenue Expenditure Formula Grant After Floor DampingLocal Authority
(£ million) (£ million) (£ million) (£ million) (%) (£ million) (%) (£ million) (%) (£ million) (%)
2010-11 Indicative Allocat-
ions
2008-09 Concess-
ionary Travel
Base Position Option CONCF2 Option CONCF3 Option CONCF4
Difference from the Base PositionOption CONCF1
WEST SUSSEXAdur 5.0 0.7 4.4 -0.1 -2.4% -0.2 -3.9% -0.1 -2.4% -0.2 -4.6%Arun 10.3 1.6 8.7 -0.2 -2.1% -0.4 -4.7% -0.2 -2.3% -0.5 -5.4%Chichester 7.2 1.2 6.0 -0.2 -3.7% -0.3 -4.9% -0.2 -4.0% -0.1 -0.9%Crawley 10.5 1.7 8.8 -0.1 -1.0% 0.0 0.5% 0.0 0.6% 0.4 4.0%Horsham 6.2 0.9 5.3 -0.2 -3.7% -0.7 -13.4% -0.2 -3.7% -0.1 -2.7%Mid Sussex 6.5 0.7 5.8 -0.2 -3.6% -0.9 -14.8% -0.2 -3.9% -0.4 -7.3%Worthing 7.9 1.8 6.1 0.1 2.0% 0.4 6.5% 0.1 2.3% 0.3 5.7%
WORCESTERSHIREBromsgrove 5.0 0.5 4.5 -0.2 -5.2% -0.6 -14.1% -0.2 -5.2% -0.5 -11.0%Malvern Hills 5.2 0.3 4.9 -0.2 -4.4% -0.7 -14.9% -0.2 -4.7% -0.7 -15.4%Redditch 6.5 1.2 5.3 0.0 -0.2% 0.1 2.1% 0.0 -0.4% 0.0 0.4%Worcester 8.2 1.7 6.5 0.0 -0.6% 0.4 5.9% 0.0 -0.5% 0.3 4.2%Wychavon 7.8 0.6 7.1 -0.4 -5.6% -0.9 -13.0% -0.5 -6.4% -0.8 -11.7%Wyre Forest 8.1 0.7 7.4 -0.3 -4.2% -0.7 -9.1% -0.3 -4.5% -0.9 -11.9%
248

Base Position = 2010-11 Indicative Allocations - 2008-09 Concessionary Travel Net Revenue Expenditure Formula Grant After Floor DampingLocal Authority
(£ million) (£ million) (£ million) (£ million) (%) (£ million) (%) (£ million) (%) (£ million) (%)
2010-11 Indicative Allocat-
ions
2008-09 Concess-
ionary Travel
Base Position Option CONCF2 Option CONCF3 Option CONCF4
Difference from the Base PositionOption CONCF1
SHIRE POLICE AUTHORITIES
Avon & Somerset Police 186.1 0.0 186.1 0.1 0.0% 0.1 0.0% 0.0 0.0% 0.0 0.0%Bedfordshire Police 73.1 0.0 73.1 0.0 0.0% 0.0 0.0% 0.0 0.0% 0.0 0.0%Cambridgeshire Police 83.5 0.0 83.5 0.0 0.1% 0.0 0.1% 0.0 0.0% 0.0 0.0%Cheshire Police 123.5 0.0 123.5 0.0 0.0% 0.0 0.0% 0.0 0.0% 0.0 0.0%Cleveland Police 100.1 0.0 100.1 0.0 0.0% 0.0 0.0% 0.0 0.0% 0.0 0.0%
Cumbria Police 68.9 0.0 68.9 0.0 0.0% 0.0 0.0% 0.0 0.0% 0.0 0.0%Derbyshire Police 116.2 0.0 116.2 0.0 0.0% 0.0 0.0% 0.0 0.0% 0.0 0.0%Devon & Cornwall Police 191.2 0.0 191.2 0.1 0.1% 0.1 0.1% 0.1 0.0% 0.1 0.0%Dorset Police 66.9 0.0 66.9 0.0 0.0% 0.0 0.0% 0.0 0.0% 0.0 0.0%Durham Police 93.7 0.0 93.7 0.0 0.0% 0.0 0.0% 0.0 0.0% 0.0 0.0%
Essex Police 183.0 0.0 183.0 0.1 0.1% 0.1 0.1% 0.1 0.1% 0.1 0.1%Gloucestershire Police 60.8 0.0 60.8 0.0 0.0% 0.0 0.0% 0.0 0.0% 0.0 0.0%Hampshire Police 213.0 0.0 213.0 0.1 0.1% 0.1 0.1% 0.1 0.0% 0.1 0.0%Hertfordshire Police 124.8 0.0 124.8 0.1 0.1% 0.1 0.1% 0.1 0.1% 0.1 0.1%Humberside Police 131.8 0.0 131.8 0.0 0.0% 0.0 0.0% 0.0 0.0% 0.0 0.0%
Kent Police 197.4 0.0 197.4 0.1 0.0% 0.1 0.0% 0.1 0.0% 0.1 0.0%Lancashire Police 209.7 0.0 209.7 0.0 0.0% 0.0 0.0% 0.0 0.0% 0.0 0.0%Leicestershire Police 121.4 0.0 121.4 0.0 0.0% 0.0 0.0% 0.0 0.0% 0.0 0.0%Lincolnshire Police 66.3 0.0 66.3 0.1 0.1% 0.1 0.1% 0.0 0.0% 0.0 0.0%Norfolk Police 89.8 0.0 89.8 0.0 0.0% 0.0 0.0% 0.0 0.0% 0.0 0.0%
North Yorkshire Police 78.6 0.0 78.6 0.0 0.0% 0.0 0.0% 0.0 0.0% 0.0 0.0%Northamptonshire Police 77.5 0.0 77.5 0.0 0.0% 0.0 0.0% 0.0 0.0% 0.0 0.0%Nottinghamshire Police 146.0 0.0 146.0 0.0 0.0% 0.0 0.0% 0.0 0.0% 0.0 0.0%Staffordshire Police 123.8 0.0 123.8 0.0 0.0% 0.0 0.0% 0.0 0.0% 0.0 0.0%Suffolk Police 72.7 0.0 72.7 0.0 0.0% 0.0 0.0% 0.0 0.0% 0.0 0.0%
Surrey Police 104.4 0.0 104.4 0.0 0.0% 0.0 0.0% 0.0 0.0% 0.0 0.0%Sussex Police 174.1 0.0 174.1 0.0 0.0% 0.0 0.0% 0.0 0.0% 0.0 0.0%Thames Valley Police 244.7 0.0 244.7 0.2 0.1% 0.2 0.1% 0.1 0.1% 0.1 0.1%Warwickshire Police 55.6 0.0 55.6 0.0 0.1% 0.0 0.1% 0.0 0.1% 0.0 0.1%West Mercia Police 124.9 0.0 124.9 0.0 0.0% 0.0 0.0% 0.0 0.0% 0.0 0.0%
Wiltshire Police 66.8 0.0 66.8 0.0 0.0% 0.0 0.0% 0.0 0.0% 0.0 0.0%
249

Base Position = 2010-11 Indicative Allocations - 2008-09 Concessionary Travel Net Revenue Expenditure Formula Grant After Floor DampingLocal Authority
(£ million) (£ million) (£ million) (£ million) (%) (£ million) (%) (£ million) (%) (£ million) (%)
2010-11 Indicative Allocat-
ions
2008-09 Concess-
ionary Travel
Base Position Option CONCF2 Option CONCF3 Option CONCF4
Difference from the Base PositionOption CONCF1
SHIRE FIRE AUTHORITIES
Avon Fire 24.9 0.0 24.9 0.0 0.0% 0.0 0.0% 0.0 0.0% 0.0 0.0%Bedfordshire Fire 11.4 0.0 11.4 0.0 0.2% 0.0 0.2% 0.0 0.2% 0.0 0.2%Berkshire Fire Auhtority 15.4 0.0 15.4 0.0 0.0% 0.0 0.0% 0.0 0.0% 0.0 0.0%Buckinghamshire Fire 11.5 0.0 11.5 0.0 0.0% 0.0 0.0% 0.0 0.0% 0.0 0.0%Cambridgeshire Fire 14.4 0.0 14.4 0.0 0.2% 0.0 0.2% 0.0 0.2% 0.0 0.2%
Cheshire Fire 18.6 0.0 18.6 0.0 0.3% 0.0 0.3% 0.1 0.3% 0.1 0.3%Cleveland Fire 22.4 0.0 22.4 0.0 0.0% 0.0 0.0% 0.0 0.0% 0.0 0.0%Derbyshire Fire 19.7 0.0 19.7 0.0 0.1% 0.0 0.1% 0.0 0.1% 0.0 0.1%Devon and Somerset Fire 31.2 0.0 31.2 0.1 0.3% 0.1 0.3% 0.1 0.3% 0.1 0.3%Dorset Fire 11.0 0.0 11.0 0.1 0.6% 0.1 0.6% 0.1 0.6% 0.1 0.6%
Durham Fire 14.5 0.0 14.5 0.0 -0.1% 0.0 -0.1% 0.0 0.0% 0.0 0.0%East Sussex Fire 14.7 0.0 14.7 0.0 0.3% 0.0 0.3% 0.0 0.3% 0.0 0.3%Essex Fire Auhtority 32.4 0.0 32.4 0.1 0.3% 0.1 0.3% 0.1 0.3% 0.1 0.3%Hampshire Fire 29.3 0.0 29.3 0.1 0.4% 0.1 0.4% 0.1 0.4% 0.1 0.4%Hereford & Worcester Fire 10.7 0.0 10.7 0.1 0.7% 0.1 0.7% 0.1 0.5% 0.1 0.5%
Humberside Fire 27.2 0.0 27.2 -0.1 -0.2% -0.1 -0.2% 0.0 -0.2% 0.0 -0.2%Kent Fire 29.6 0.0 29.6 0.1 0.4% 0.1 0.4% 0.1 0.3% 0.1 0.3%Lancashire Fire 32.6 0.0 32.6 0.0 0.1% 0.0 0.1% 0.0 0.0% 0.0 0.0%Leicestershire Fire 18.8 0.0 18.8 0.0 0.2% 0.0 0.2% 0.0 0.1% 0.0 0.1%North Yorkshire Fire 13.0 0.0 13.0 0.0 0.0% 0.0 0.0% 0.0 0.0% 0.0 0.0%
Nottinghamshire Fire 25.0 0.0 25.0 0.0 -0.1% 0.0 -0.1% 0.0 0.0% 0.0 0.0%Shropshire Fire 8.3 0.0 8.3 0.0 0.2% 0.0 0.2% 0.0 0.2% 0.0 0.2%Staffordshire Fire 18.6 0.0 18.6 0.1 0.3% 0.1 0.3% 0.0 0.2% 0.0 0.2%Wiltshire Fire 9.6 0.0 9.6 0.1 0.6% 0.1 0.6% 0.1 0.6% 0.1 0.6%
250

Concessionary Travel - Adding into Upper-Tier Authorities
Formula Grant Before Floor Damping
(£ million) (£ million) (£ million) (£ million) (£ million) (£ million) (%) (£ million) (%)
England 28,995.5 813.4 813.4 223.0 29,218.5 0.0 0.0% 0.0 0.0%
London area 6,153.4 206.0 206.0 28.1 6,181.5 52.4 0.8% 52.4 0.8%Metropolitan areas 8,340.7 259.3 259.3 52.3 8,393.0 10.5 0.1% 10.5 0.1%Shire areas 14,499.1 348.1 348.1 142.6 14,641.7 -62.9 -0.4% -62.9 -0.4%Isles of Scilly 2.3 0.0 0.0 0.1 2.3 0.0 0.0% 0.0 0.0%
Inner London boroughs incl. City 2,025.0 83.0 83.0 11.3 2,036.3 28.2 1.4% 28.2 1.4%Outer London boroughs 1,873.1 123.0 123.0 16.8 1,889.9 38.5 2.0% 38.5 2.0%London boroughs 3,898.1 206.0 206.0 28.1 3,926.2 66.7 1.7% 66.7 1.7%GLA - all functions 2,255.3 0.0 0.0 0.0 2,255.3 -14.3 -0.6% -14.3 -0.6%
Metropolitan districts 5,904.0 259.3 259.3 52.3 5,956.3 11.4 0.2% 11.4 0.2%Metropolitan fire authorities 335.8 0.0 0.0 0.0 335.8 0.4 0.1% 0.4 0.1%Metropolitan police authorities 2,100.9 0.0 0.0 0.0 2,100.9 -1.3 -0.1% -1.3 -0.1%
Shire unitaries with fire 425.6 11.1 11.1 6.5 432.1 -9.7 -2.3% -9.7 -2.3%Shire unitaries without fire 4,099.3 142.0 142.0 55.0 4,154.4 -9.4 -0.2% -9.4 -0.2%Shire counties with fire 1,589.0 0.0 70.2 0.0 1,659.2 33.6 2.0% 33.6 2.0%Shire counties without fire 2,501.9 0.0 124.8 0.0 2,626.7 37.1 1.4% 37.1 1.4%Shire districts 1,654.0 195.0 0.0 81.0 1,540.0 -129.7 -8.4% -129.7 -8.4%Combined fire authorities 467.7 0.0 0.0 0.0 467.7 2.4 0.5% 2.4 0.5%Shire police authorities 3,761.6 0.0 0.0 0.0 3,761.6 12.9 0.3% 12.9 0.3%
GO REGIONAL SUMMARY
South West GOR 2,267.3 51.1 51.1 23.3 2,290.6 -16.6 -0.7% -16.6 -0.7%South East GOR 2,957.0 85.6 85.6 32.0 2,989.1 -0.1 0.0% -0.1 0.0%London GOR 6,153.4 206.0 206.0 28.1 6,181.5 52.4 0.8% 52.4 0.8%Eastern GOR 2,437.8 54.3 54.3 21.9 2,459.7 -6.1 -0.2% -6.1 -0.2%East Midlands GOR 2,292.2 49.5 49.5 24.7 2,316.9 -13.4 -0.6% -13.4 -0.6%West Midlands GOR 3,349.9 93.2 93.2 22.4 3,372.4 -4.6 -0.1% -4.6 -0.1%Yorkshire and Humber GOR 3,199.2 85.7 85.7 23.8 3,223.1 3.9 0.1% 3.9 0.1%North East GOR 1,777.2 60.4 60.4 11.9 1,789.1 -3.1 -0.2% -3.1 -0.2%North West GOR 4,561.4 127.7 127.7 34.8 4,596.2 -12.3 -0.3% -12.3 -0.3%
FLOOR DAMPING GROUPS
Education Authorities 18,418.0 618.4 813.4 222.9 18,835.9 48.7 0.3% 48.7 0.3%Police Authorities 7,864.8 0.0 0.0 0.0 7,864.8 0.1 0.0% 0.1 0.0%Fire Authorities 1,056.5 0.0 0.0 0.0 1,056.5 -0.1 0.0% -0.1 0.0%Shire Districts 1,654.0 195.0 0.0 0.0 1,459.0 -48.7 -3.3% -48.7 -3.3%
Option CONCF5Difference from Base Position
Option CONCF6
Base Position = 2010-11 Agreed Position - 2008-09 Concessionary Travel NRE + 2008-09 Aggregated Concessionary Travel NRE + Aggregated 2010-11 Concessionary Travel Special Grant
2010-11 Indicative
Allocations
2008-09 Concess-
ionary Travel NRE
Aggreg-ated
2008-09 Concess-
ionary Travel NRE
Aggreg-ated
2010-11 Concess-
ionary Travel Special Grant
Base Position
251
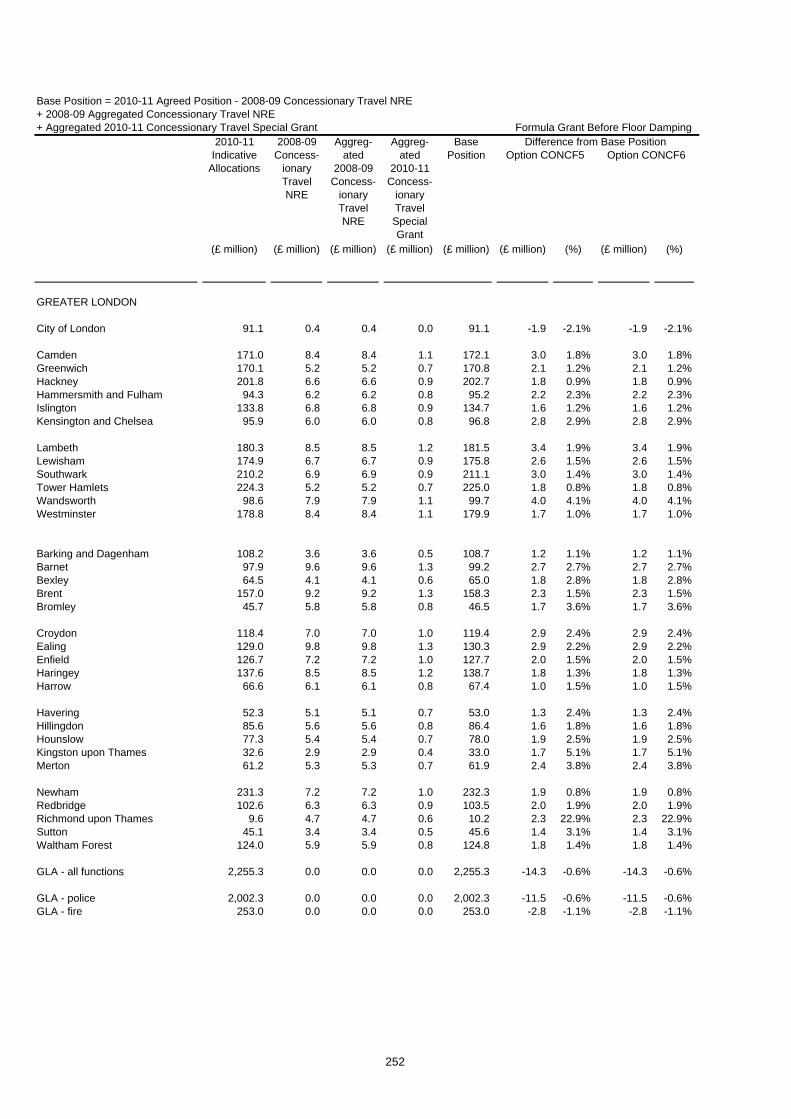
Formula Grant Before Floor Damping
(£ million) (£ million) (£ million) (£ million) (£ million) (£ million) (%) (£ million) (%)
Option CONCF5Difference from Base Position
Option CONCF6
Base Position = 2010-11 Agreed Position - 2008-09 Concessionary Travel NRE + 2008-09 Aggregated Concessionary Travel NRE + Aggregated 2010-11 Concessionary Travel Special Grant
2010-11 Indicative
Allocations
2008-09 Concess-
ionary Travel NRE
Aggreg-ated
2008-09 Concess-
ionary Travel NRE
Aggreg-ated
2010-11 Concess-
ionary Travel Special Grant
Base Position
GREATER LONDON
City of London 91.1 0.4 0.4 0.0 91.1 -1.9 -2.1% -1.9 -2.1%
Camden 171.0 8.4 8.4 1.1 172.1 3.0 1.8% 3.0 1.8%Greenwich 170.1 5.2 5.2 0.7 170.8 2.1 1.2% 2.1 1.2%Hackney 201.8 6.6 6.6 0.9 202.7 1.8 0.9% 1.8 0.9%Hammersmith and Fulham 94.3 6.2 6.2 0.8 95.2 2.2 2.3% 2.2 2.3%Islington 133.8 6.8 6.8 0.9 134.7 1.6 1.2% 1.6 1.2%Kensington and Chelsea 95.9 6.0 6.0 0.8 96.8 2.8 2.9% 2.8 2.9%
Lambeth 180.3 8.5 8.5 1.2 181.5 3.4 1.9% 3.4 1.9%Lewisham 174.9 6.7 6.7 0.9 175.8 2.6 1.5% 2.6 1.5%Southwark 210.2 6.9 6.9 0.9 211.1 3.0 1.4% 3.0 1.4%Tower Hamlets 224.3 5.2 5.2 0.7 225.0 1.8 0.8% 1.8 0.8%Wandsworth 98.6 7.9 7.9 1.1 99.7 4.0 4.1% 4.0 4.1%Westminster 178.8 8.4 8.4 1.1 179.9 1.7 1.0% 1.7 1.0%
Barking and Dagenham 108.2 3.6 3.6 0.5 108.7 1.2 1.1% 1.2 1.1%Barnet 97.9 9.6 9.6 1.3 99.2 2.7 2.7% 2.7 2.7%Bexley 64.5 4.1 4.1 0.6 65.0 1.8 2.8% 1.8 2.8%Brent 157.0 9.2 9.2 1.3 158.3 2.3 1.5% 2.3 1.5%Bromley 45.7 5.8 5.8 0.8 46.5 1.7 3.6% 1.7 3.6%
Croydon 118.4 7.0 7.0 1.0 119.4 2.9 2.4% 2.9 2.4%Ealing 129.0 9.8 9.8 1.3 130.3 2.9 2.2% 2.9 2.2%Enfield 126.7 7.2 7.2 1.0 127.7 2.0 1.5% 2.0 1.5%Haringey 137.6 8.5 8.5 1.2 138.7 1.8 1.3% 1.8 1.3%Harrow 66.6 6.1 6.1 0.8 67.4 1.0 1.5% 1.0 1.5%
Havering 52.3 5.1 5.1 0.7 53.0 1.3 2.4% 1.3 2.4%Hillingdon 85.6 5.6 5.6 0.8 86.4 1.6 1.8% 1.6 1.8%Hounslow 77.3 5.4 5.4 0.7 78.0 1.9 2.5% 1.9 2.5%Kingston upon Thames 32.6 2.9 2.9 0.4 33.0 1.7 5.1% 1.7 5.1%Merton 61.2 5.3 5.3 0.7 61.9 2.4 3.8% 2.4 3.8%
Newham 231.3 7.2 7.2 1.0 232.3 1.9 0.8% 1.9 0.8%Redbridge 102.6 6.3 6.3 0.9 103.5 2.0 1.9% 2.0 1.9%Richmond upon Thames 9.6 4.7 4.7 0.6 10.2 2.3 22.9% 2.3 22.9%Sutton 45.1 3.4 3.4 0.5 45.6 1.4 3.1% 1.4 3.1%Waltham Forest 124.0 5.9 5.9 0.8 124.8 1.8 1.4% 1.8 1.4%
GLA - all functions 2,255.3 0.0 0.0 0.0 2,255.3 -14.3 -0.6% -14.3 -0.6%
GLA - police 2,002.3 0.0 0.0 0.0 2,002.3 -11.5 -0.6% -11.5 -0.6%GLA - fire 253.0 0.0 0.0 0.0 253.0 -2.8 -1.1% -2.8 -1.1%
252

Formula Grant Before Floor Damping
(£ million) (£ million) (£ million) (£ million) (£ million) (£ million) (%) (£ million) (%)
Option CONCF5Difference from Base Position
Option CONCF6
Base Position = 2010-11 Agreed Position - 2008-09 Concessionary Travel NRE + 2008-09 Aggregated Concessionary Travel NRE + Aggregated 2010-11 Concessionary Travel Special Grant
2010-11 Indicative
Allocations
2008-09 Concess-
ionary Travel NRE
Aggreg-ated
2008-09 Concess-
ionary Travel NRE
Aggreg-ated
2010-11 Concess-
ionary Travel Special Grant
Base Position
GREATER MANCHESTERBolton 132.6 4.8 4.8 1.1 133.7 0.0 0.0% 0.0 0.0%Bury 67.5 3.3 3.3 0.8 68.2 0.2 0.3% 0.2 0.3%Manchester 346.1 8.4 8.4 2.0 348.1 2.3 0.7% 2.3 0.7%Oldham 127.6 4.0 4.0 0.9 128.5 0.3 0.2% 0.3 0.2%Rochdale 114.9 3.8 3.8 0.9 115.8 0.2 0.2% 0.2 0.2%Salford 131.2 4.0 4.0 1.0 132.2 0.0 0.0% 0.0 0.0%Stockport 85.2 5.1 5.1 1.2 86.4 0.1 0.1% 0.1 0.1%Tameside 109.5 3.9 3.9 0.9 110.5 0.2 0.2% 0.2 0.2%Trafford 67.3 3.9 3.9 0.9 68.2 0.3 0.4% 0.3 0.4%Wigan 138.6 5.6 5.6 1.3 139.9 -0.8 -0.6% -0.8 -0.6%Greater Manchester Fire 76.1 0.0 0.0 0.0 76.1 0.1 0.1% 0.1 0.1%Greater Manchester Police 485.7 0.0 0.0 0.0 485.7 -0.5 -0.1% -0.5 -0.1%
MERSEYSIDEKnowsley 114.6 4.7 4.7 0.9 115.5 -0.5 -0.5% -0.5 -0.5%Liverpool 318.0 13.5 13.5 2.6 320.6 -0.8 -0.2% -0.8 -0.2%Sefton 127.6 8.6 8.6 1.6 129.2 -0.8 -0.6% -0.8 -0.6%St Helens 90.9 5.5 5.5 1.1 92.0 -0.7 -0.8% -0.7 -0.8%Wirral 165.2 9.6 9.6 1.8 167.0 -1.1 -0.6% -1.1 -0.6%Merseyside Fire 46.1 0.0 0.0 0.0 46.1 -0.1 -0.3% -0.1 -0.3%Merseyside Police 275.5 0.0 0.0 0.0 275.5 -0.6 -0.2% -0.6 -0.2%
SOUTH YORKSHIREBarnsley 114.3 5.0 5.0 0.9 115.3 -0.9 -0.8% -0.9 -0.8%Doncaster 149.1 6.5 6.5 1.2 150.3 -0.7 -0.4% -0.7 -0.4%Rotherham 130.1 5.7 5.7 1.1 131.2 -0.1 -0.1% -0.1 -0.1%Sheffield 280.0 11.9 11.9 2.2 282.2 1.3 0.5% 1.3 0.5%South Yorkshire Fire 37.4 0.0 0.0 0.0 37.4 0.1 0.4% 0.1 0.4%South Yorkshire Police 209.2 0.0 0.0 0.0 209.2 0.4 0.2% 0.4 0.2%
TYNE AND WEARGateshead 102.7 6.8 6.8 1.0 103.7 0.0 0.0% 0.0 0.0%Newcastle upon Tyne 157.2 9.8 9.8 1.4 158.6 0.7 0.4% 0.7 0.4%North Tyneside 87.4 7.0 7.0 1.0 88.5 0.3 0.4% 0.3 0.4%South Tyneside 89.3 5.4 5.4 0.8 90.1 0.1 0.1% 0.1 0.1%Sunderland 158.9 10.0 10.0 1.5 160.3 -0.4 -0.2% -0.4 -0.2%Tyne and Wear Fire 35.9 0.0 0.0 0.0 35.9 0.0 -0.1% 0.0 -0.1%Northumbria Police 219.9 0.0 0.0 0.0 219.9 0.3 0.1% 0.3 0.1%
WEST MIDLANDSBirmingham 698.9 25.6 25.6 5.0 704.0 3.4 0.5% 3.4 0.5%Coventry 156.6 7.8 7.8 1.5 158.1 1.2 0.8% 1.2 0.8%Dudley 130.4 7.7 7.7 1.5 131.9 0.0 0.0% 0.0 0.0%Sandwell 190.3 7.3 7.3 1.4 191.7 0.3 0.2% 0.3 0.2%Solihull 49.1 5.2 5.2 1.0 50.1 -0.5 -0.9% -0.5 -0.9%Walsall 142.3 6.4 6.4 1.3 143.6 -0.1 -0.1% -0.1 -0.1%Wolverhampton 145.6 5.9 5.9 1.2 146.7 0.1 0.1% 0.1 0.1%West Midlands Fire 81.6 0.0 0.0 0.0 81.6 0.1 0.1% 0.1 0.1%West Midlands Police 542.2 0.0 0.0 0.0 542.2 -1.1 -0.2% -1.1 -0.2%
253

Formula Grant Before Floor Damping
(£ million) (£ million) (£ million) (£ million) (£ million) (£ million) (%) (£ million) (%)
Option CONCF5Difference from Base Position
Option CONCF6
Base Position = 2010-11 Agreed Position - 2008-09 Concessionary Travel NRE + 2008-09 Aggregated Concessionary Travel NRE + Aggregated 2010-11 Concessionary Travel Special Grant
2010-11 Indicative
Allocations
2008-09 Concess-
ionary Travel NRE
Aggreg-ated
2008-09 Concess-
ionary Travel NRE
Aggreg-ated
2010-11 Concess-
ionary Travel Special Grant
Base Position
WEST YORKSHIREBradford 283.4 8.3 8.3 2.1 285.4 1.9 0.6% 1.9 0.6%Calderdale 84.1 3.3 3.3 0.8 84.9 0.7 0.8% 0.7 0.8%Kirklees 164.9 6.7 6.7 1.7 166.5 1.5 0.9% 1.5 0.9%Leeds 305.9 12.8 12.8 3.2 309.1 3.8 1.2% 3.8 1.2%Wakefield 146.7 5.3 5.3 1.3 148.1 -0.2 -0.1% -0.2 -0.1%West Yorkshire Fire 58.7 0.0 0.0 0.0 58.7 0.3 0.5% 0.3 0.5%West Yorkshire Police 368.2 0.0 0.0 0.0 368.2 0.3 0.1% 0.3 0.1%
254
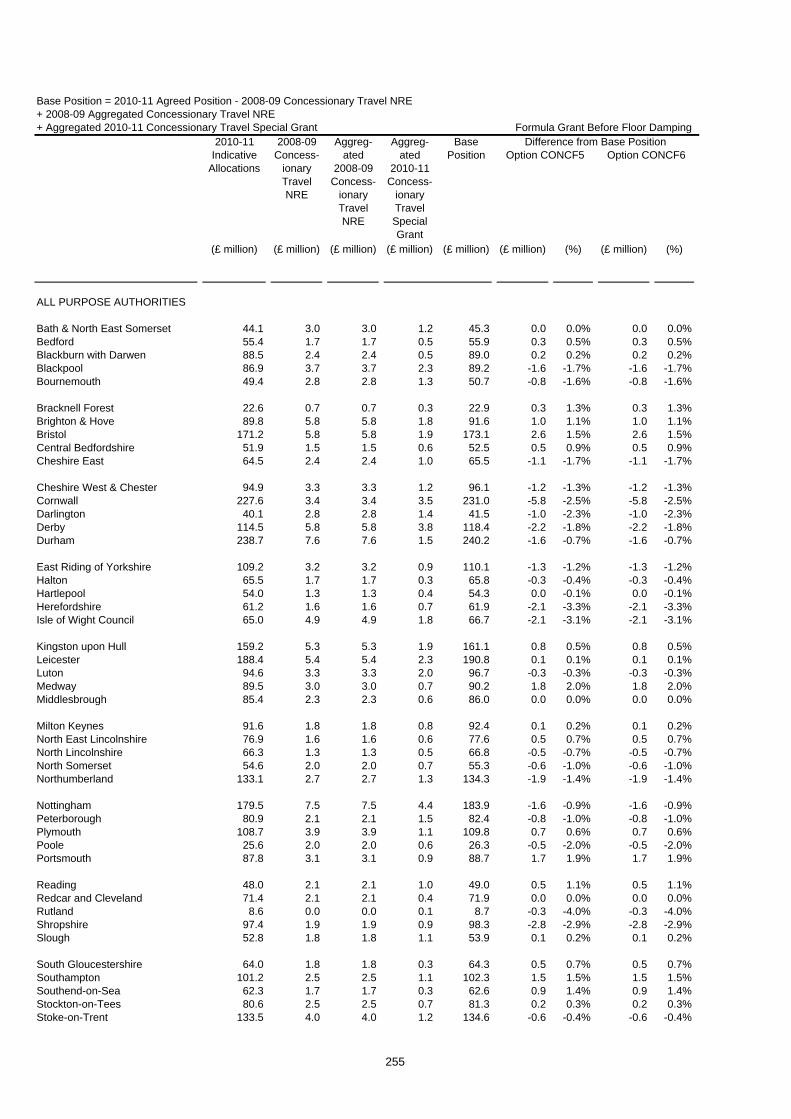
Formula Grant Before Floor Damping
(£ million) (£ million) (£ million) (£ million) (£ million) (£ million) (%) (£ million) (%)
Option CONCF5Difference from Base Position
Option CONCF6
Base Position = 2010-11 Agreed Position - 2008-09 Concessionary Travel NRE + 2008-09 Aggregated Concessionary Travel NRE + Aggregated 2010-11 Concessionary Travel Special Grant
2010-11 Indicative
Allocations
2008-09 Concess-
ionary Travel NRE
Aggreg-ated
2008-09 Concess-
ionary Travel NRE
Aggreg-ated
2010-11 Concess-
ionary Travel Special Grant
Base Position
ALL PURPOSE AUTHORITIES
Bath & North East Somerset 44.1 3.0 3.0 1.2 45.3 0.0 0.0% 0.0 0.0%Bedford 55.4 1.7 1.7 0.5 55.9 0.3 0.5% 0.3 0.5%Blackburn with Darwen 88.5 2.4 2.4 0.5 89.0 0.2 0.2% 0.2 0.2%Blackpool 86.9 3.7 3.7 2.3 89.2 -1.6 -1.7% -1.6 -1.7%Bournemouth 49.4 2.8 2.8 1.3 50.7 -0.8 -1.6% -0.8 -1.6%
Bracknell Forest 22.6 0.7 0.7 0.3 22.9 0.3 1.3% 0.3 1.3%Brighton & Hove 89.8 5.8 5.8 1.8 91.6 1.0 1.1% 1.0 1.1%Bristol 171.2 5.8 5.8 1.9 173.1 2.6 1.5% 2.6 1.5%Central Bedfordshire 51.9 1.5 1.5 0.6 52.5 0.5 0.9% 0.5 0.9%Cheshire East 64.5 2.4 2.4 1.0 65.5 -1.1 -1.7% -1.1 -1.7%
Cheshire West & Chester 94.9 3.3 3.3 1.2 96.1 -1.2 -1.3% -1.2 -1.3%Cornwall 227.6 3.4 3.4 3.5 231.0 -5.8 -2.5% -5.8 -2.5%Darlington 40.1 2.8 2.8 1.4 41.5 -1.0 -2.3% -1.0 -2.3%Derby 114.5 5.8 5.8 3.8 118.4 -2.2 -1.8% -2.2 -1.8%Durham 238.7 7.6 7.6 1.5 240.2 -1.6 -0.7% -1.6 -0.7%
East Riding of Yorkshire 109.2 3.2 3.2 0.9 110.1 -1.3 -1.2% -1.3 -1.2%Halton 65.5 1.7 1.7 0.3 65.8 -0.3 -0.4% -0.3 -0.4%Hartlepool 54.0 1.3 1.3 0.4 54.3 0.0 -0.1% 0.0 -0.1%Herefordshire 61.2 1.6 1.6 0.7 61.9 -2.1 -3.3% -2.1 -3.3%Isle of Wight Council 65.0 4.9 4.9 1.8 66.7 -2.1 -3.1% -2.1 -3.1%
Kingston upon Hull 159.2 5.3 5.3 1.9 161.1 0.8 0.5% 0.8 0.5%Leicester 188.4 5.4 5.4 2.3 190.8 0.1 0.1% 0.1 0.1%Luton 94.6 3.3 3.3 2.0 96.7 -0.3 -0.3% -0.3 -0.3%Medway 89.5 3.0 3.0 0.7 90.2 1.8 2.0% 1.8 2.0%Middlesbrough 85.4 2.3 2.3 0.6 86.0 0.0 0.0% 0.0 0.0%
Milton Keynes 91.6 1.8 1.8 0.8 92.4 0.1 0.2% 0.1 0.2%North East Lincolnshire 76.9 1.6 1.6 0.6 77.6 0.5 0.7% 0.5 0.7%North Lincolnshire 66.3 1.3 1.3 0.5 66.8 -0.5 -0.7% -0.5 -0.7%North Somerset 54.6 2.0 2.0 0.7 55.3 -0.6 -1.0% -0.6 -1.0%Northumberland 133.1 2.7 2.7 1.3 134.3 -1.9 -1.4% -1.9 -1.4%
Nottingham 179.5 7.5 7.5 4.4 183.9 -1.6 -0.9% -1.6 -0.9%Peterborough 80.9 2.1 2.1 1.5 82.4 -0.8 -1.0% -0.8 -1.0%Plymouth 108.7 3.9 3.9 1.1 109.8 0.7 0.6% 0.7 0.6%Poole 25.6 2.0 2.0 0.6 26.3 -0.5 -2.0% -0.5 -2.0%Portsmouth 87.8 3.1 3.1 0.9 88.7 1.7 1.9% 1.7 1.9%
Reading 48.0 2.1 2.1 1.0 49.0 0.5 1.1% 0.5 1.1%Redcar and Cleveland 71.4 2.1 2.1 0.4 71.9 0.0 0.0% 0.0 0.0%Rutland 8.6 0.0 0.0 0.1 8.7 -0.3 -4.0% -0.3 -4.0%Shropshire 97.4 1.9 1.9 0.9 98.3 -2.8 -2.9% -2.8 -2.9%Slough 52.8 1.8 1.8 1.1 53.9 0.1 0.2% 0.1 0.2%
South Gloucestershire 64.0 1.8 1.8 0.3 64.3 0.5 0.7% 0.5 0.7%Southampton 101.2 2.5 2.5 1.1 102.3 1.5 1.5% 1.5 1.5%Southend-on-Sea 62.3 1.7 1.7 0.3 62.6 0.9 1.4% 0.9 1.4%Stockton-on-Tees 80.6 2.5 2.5 0.7 81.3 0.2 0.3% 0.2 0.3%Stoke-on-Trent 133.5 4.0 4.0 1.2 134.6 -0.6 -0.4% -0.6 -0.4%
255

Formula Grant Before Floor Damping
(£ million) (£ million) (£ million) (£ million) (£ million) (£ million) (%) (£ million) (%)
Option CONCF5Difference from Base Position
Option CONCF6
Base Position = 2010-11 Agreed Position - 2008-09 Concessionary Travel NRE + 2008-09 Aggregated Concessionary Travel NRE + Aggregated 2010-11 Concessionary Travel Special Grant
2010-11 Indicative
Allocations
2008-09 Concess-
ionary Travel NRE
Aggreg-ated
2008-09 Concess-
ionary Travel NRE
Aggreg-ated
2010-11 Concess-
ionary Travel Special Grant
Base Position
Swindon 43.7 2.0 2.0 0.8 44.4 0.6 1.4% 0.6 1.4%Telford and the Wrekin 76.0 1.6 1.6 0.5 76.5 -0.2 -0.2% -0.2 -0.2%Thurrock 62.1 0.8 0.8 0.2 62.3 0.9 1.4% 0.9 1.4%Torbay 64.2 3.1 3.1 1.6 65.8 -1.1 -1.7% -1.1 -1.7%Warrington 52.7 3.0 3.0 1.2 53.9 -0.7 -1.2% -0.7 -1.2%
West Berkshire 23.1 0.5 0.5 0.2 23.3 -0.3 -1.4% -0.3 -1.4%Wiltshire 102.1 3.3 3.3 1.2 103.3 -1.6 -1.5% -1.6 -1.5%Windsor and Maidenhead 10.1 1.0 1.0 0.3 10.4 0.0 -0.4% 0.0 -0.4%Wokingham 8.4 1.1 1.1 0.2 8.6 -0.6 -6.5% -0.6 -6.5%York 45.8 3.5 3.5 1.5 47.3 0.3 0.7% 0.3 0.7%
Isles of Scilly 2.3 0.0 0.0 0.1 2.3 0.0 0.0% 0.0 0.0%
256

Formula Grant Before Floor Damping
(£ million) (£ million) (£ million) (£ million) (£ million) (£ million) (%) (£ million) (%)
Option CONCF5Difference from Base Position
Option CONCF6
Base Position = 2010-11 Agreed Position - 2008-09 Concessionary Travel NRE + 2008-09 Aggregated Concessionary Travel NRE + Aggregated 2010-11 Concessionary Travel Special Grant
2010-11 Indicative
Allocations
2008-09 Concess-
ionary Travel NRE
Aggreg-ated
2008-09 Concess-
ionary Travel NRE
Aggreg-ated
2010-11 Concess-
ionary Travel Special Grant
Base Position
SHIRE COUNTIES
Buckinghamshire 43.5 0.0 5.5 0.0 49.0 -1.2 -2.4% -1.2 -2.4%Cambridgeshire 113.1 0.0 3.5 0.0 116.6 3.3 2.9% 3.3 2.9%Cumbria 157.5 0.0 5.3 0.0 162.8 1.6 1.0% 1.6 1.0%Derbyshire 204.0 0.0 9.8 0.0 213.8 1.1 0.5% 1.1 0.5%Devon 176.4 0.0 5.8 0.0 182.2 2.1 1.2% 2.1 1.2%
Dorset 57.6 0.0 2.5 0.0 60.1 1.4 2.4% 1.4 2.4%East Sussex 105.4 0.0 4.7 0.0 110.1 2.6 2.3% 2.6 2.3%Essex 258.3 0.0 13.9 0.0 272.1 4.8 1.8% 4.8 1.8%Gloucestershire 124.0 0.0 4.6 0.0 128.6 2.6 2.0% 2.6 2.0%Hampshire 126.6 0.0 11.5 0.0 138.2 2.9 2.1% 2.9 2.1%
Hertfordshire 148.3 0.0 10.4 0.0 158.7 6.2 3.9% 6.2 3.9%Kent 287.9 0.0 15.4 0.0 303.3 5.7 1.9% 5.7 1.9%Lancashire 328.9 0.0 17.2 0.0 346.0 2.8 0.8% 2.8 0.8%Leicestershire 107.5 0.0 3.9 0.0 111.5 3.3 2.9% 3.3 2.9%Lincolnshire 210.6 0.0 4.5 0.0 215.1 2.5 1.2% 2.5 1.2%
Norfolk 260.4 0.0 7.0 0.0 267.5 2.5 0.9% 2.5 0.9%North Yorkshire 113.7 0.0 5.2 0.0 118.9 1.0 0.8% 1.0 0.8%Northamptonshire 162.2 0.0 5.0 0.0 167.2 4.9 2.9% 4.9 2.9%Nottinghamshire 191.6 0.0 7.5 0.0 199.1 3.2 1.6% 3.2 1.6%Oxfordshire 99.8 0.0 6.1 0.0 105.9 2.8 2.7% 2.8 2.7%
Somerset 120.7 0.0 5.1 0.0 125.8 0.7 0.5% 0.7 0.5%Staffordshire 169.7 0.0 8.4 0.0 178.1 1.9 1.1% 1.9 1.1%Suffolk 181.0 0.0 8.4 0.0 189.3 -0.1 0.0% -0.1 0.0%Surrey 60.1 0.0 5.4 0.0 65.6 6.1 9.3% 6.1 9.3%Warwickshire 96.6 0.0 4.9 0.0 101.5 2.3 2.3% 2.3 2.3%
West Sussex 88.4 0.0 8.6 0.0 96.9 2.1 2.1% 2.1 2.1%Worcestershire 96.9 0.0 5.0 0.0 101.9 1.6 1.5% 1.6 1.5%
257
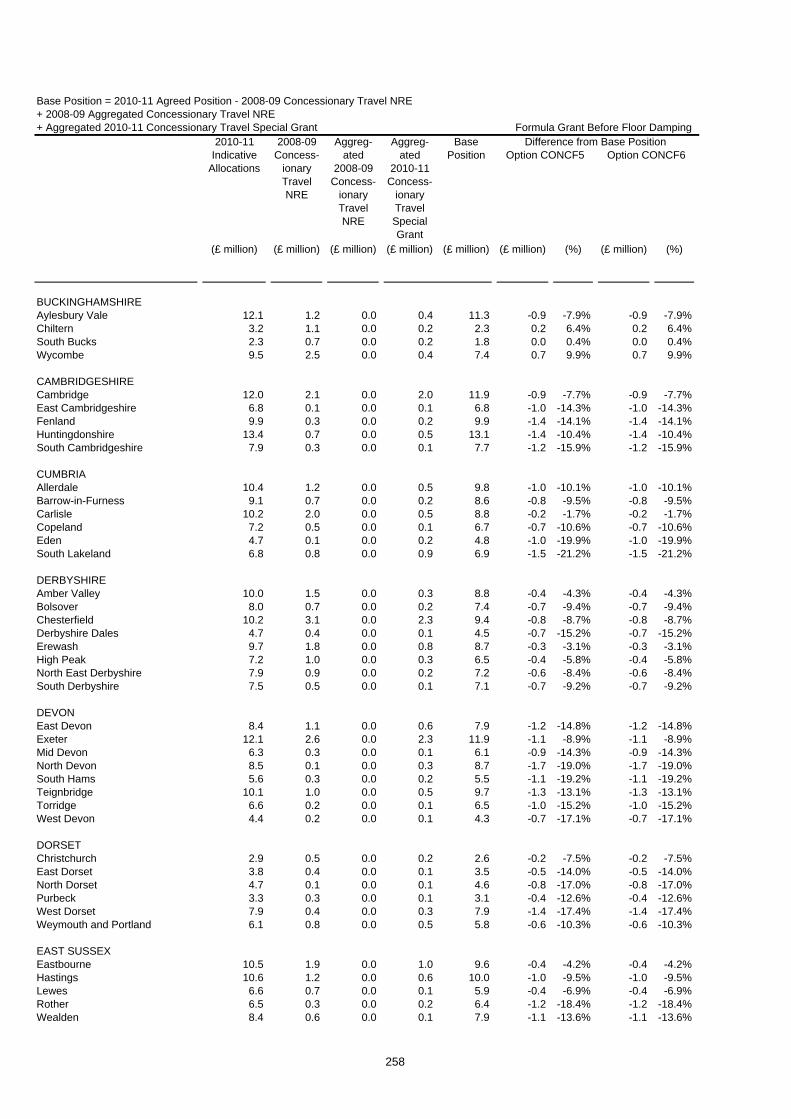
Formula Grant Before Floor Damping
(£ million) (£ million) (£ million) (£ million) (£ million) (£ million) (%) (£ million) (%)
Option CONCF5Difference from Base Position
Option CONCF6
Base Position = 2010-11 Agreed Position - 2008-09 Concessionary Travel NRE + 2008-09 Aggregated Concessionary Travel NRE + Aggregated 2010-11 Concessionary Travel Special Grant
2010-11 Indicative
Allocations
2008-09 Concess-
ionary Travel NRE
Aggreg-ated
2008-09 Concess-
ionary Travel NRE
Aggreg-ated
2010-11 Concess-
ionary Travel Special Grant
Base Position
BUCKINGHAMSHIREAylesbury Vale 12.1 1.2 0.0 0.4 11.3 -0.9 -7.9% -0.9 -7.9%Chiltern 3.2 1.1 0.0 0.2 2.3 0.2 6.4% 0.2 6.4%South Bucks 2.3 0.7 0.0 0.2 1.8 0.0 0.4% 0.0 0.4%Wycombe 9.5 2.5 0.0 0.4 7.4 0.7 9.9% 0.7 9.9%
CAMBRIDGESHIRECambridge 12.0 2.1 0.0 2.0 11.9 -0.9 -7.7% -0.9 -7.7%East Cambridgeshire 6.8 0.1 0.0 0.1 6.8 -1.0 -14.3% -1.0 -14.3%Fenland 9.9 0.3 0.0 0.2 9.9 -1.4 -14.1% -1.4 -14.1%Huntingdonshire 13.4 0.7 0.0 0.5 13.1 -1.4 -10.4% -1.4 -10.4%South Cambridgeshire 7.9 0.3 0.0 0.1 7.7 -1.2 -15.9% -1.2 -15.9%
CUMBRIAAllerdale 10.4 1.2 0.0 0.5 9.8 -1.0 -10.1% -1.0 -10.1%Barrow-in-Furness 9.1 0.7 0.0 0.2 8.6 -0.8 -9.5% -0.8 -9.5%Carlisle 10.2 2.0 0.0 0.5 8.8 -0.2 -1.7% -0.2 -1.7%Copeland 7.2 0.5 0.0 0.1 6.7 -0.7 -10.6% -0.7 -10.6%Eden 4.7 0.1 0.0 0.2 4.8 -1.0 -19.9% -1.0 -19.9%South Lakeland 6.8 0.8 0.0 0.9 6.9 -1.5 -21.2% -1.5 -21.2%
DERBYSHIREAmber Valley 10.0 1.5 0.0 0.3 8.8 -0.4 -4.3% -0.4 -4.3%Bolsover 8.0 0.7 0.0 0.2 7.4 -0.7 -9.4% -0.7 -9.4%Chesterfield 10.2 3.1 0.0 2.3 9.4 -0.8 -8.7% -0.8 -8.7%Derbyshire Dales 4.7 0.4 0.0 0.1 4.5 -0.7 -15.2% -0.7 -15.2%Erewash 9.7 1.8 0.0 0.8 8.7 -0.3 -3.1% -0.3 -3.1%High Peak 7.2 1.0 0.0 0.3 6.5 -0.4 -5.8% -0.4 -5.8%North East Derbyshire 7.9 0.9 0.0 0.2 7.2 -0.6 -8.4% -0.6 -8.4%South Derbyshire 7.5 0.5 0.0 0.1 7.1 -0.7 -9.2% -0.7 -9.2%
DEVONEast Devon 8.4 1.1 0.0 0.6 7.9 -1.2 -14.8% -1.2 -14.8%Exeter 12.1 2.6 0.0 2.3 11.9 -1.1 -8.9% -1.1 -8.9%Mid Devon 6.3 0.3 0.0 0.1 6.1 -0.9 -14.3% -0.9 -14.3%North Devon 8.5 0.1 0.0 0.3 8.7 -1.7 -19.0% -1.7 -19.0%South Hams 5.6 0.3 0.0 0.2 5.5 -1.1 -19.2% -1.1 -19.2%Teignbridge 10.1 1.0 0.0 0.5 9.7 -1.3 -13.1% -1.3 -13.1%Torridge 6.6 0.2 0.0 0.1 6.5 -1.0 -15.2% -1.0 -15.2%West Devon 4.4 0.2 0.0 0.1 4.3 -0.7 -17.1% -0.7 -17.1%
DORSETChristchurch 2.9 0.5 0.0 0.2 2.6 -0.2 -7.5% -0.2 -7.5%East Dorset 3.8 0.4 0.0 0.1 3.5 -0.5 -14.0% -0.5 -14.0%North Dorset 4.7 0.1 0.0 0.1 4.6 -0.8 -17.0% -0.8 -17.0%Purbeck 3.3 0.3 0.0 0.1 3.1 -0.4 -12.6% -0.4 -12.6%West Dorset 7.9 0.4 0.0 0.3 7.9 -1.4 -17.4% -1.4 -17.4%Weymouth and Portland 6.1 0.8 0.0 0.5 5.8 -0.6 -10.3% -0.6 -10.3%
EAST SUSSEXEastbourne 10.5 1.9 0.0 1.0 9.6 -0.4 -4.2% -0.4 -4.2%Hastings 10.6 1.2 0.0 0.6 10.0 -1.0 -9.5% -1.0 -9.5%Lewes 6.6 0.7 0.0 0.1 5.9 -0.4 -6.9% -0.4 -6.9%Rother 6.5 0.3 0.0 0.2 6.4 -1.2 -18.4% -1.2 -18.4%Wealden 8.4 0.6 0.0 0.1 7.9 -1.1 -13.6% -1.1 -13.6%
258

Formula Grant Before Floor Damping
(£ million) (£ million) (£ million) (£ million) (£ million) (£ million) (%) (£ million) (%)
Option CONCF5Difference from Base Position
Option CONCF6
Base Position = 2010-11 Agreed Position - 2008-09 Concessionary Travel NRE + 2008-09 Aggregated Concessionary Travel NRE + Aggregated 2010-11 Concessionary Travel Special Grant
2010-11 Indicative
Allocations
2008-09 Concess-
ionary Travel NRE
Aggreg-ated
2008-09 Concess-
ionary Travel NRE
Aggreg-ated
2010-11 Concess-
ionary Travel Special Grant
Base Position
ESSEXBasildon 16.1 1.8 0.0 0.5 14.8 -0.9 -6.1% -0.9 -6.1%Braintree 10.6 1.2 0.0 0.3 9.7 -0.7 -7.6% -0.7 -7.6%Brentwood 4.4 0.5 0.0 0.2 4.0 -0.3 -8.3% -0.3 -8.3%Castle Point 6.8 0.9 0.0 0.2 6.1 -0.2 -3.2% -0.2 -3.2%Chelmsford 10.7 1.9 0.0 0.8 9.5 -0.2 -2.1% -0.2 -2.1%Colchester 13.1 2.5 0.0 0.6 11.2 0.2 1.5% 0.2 1.5%Epping Forest 9.4 0.5 0.0 0.1 8.9 -1.0 -11.2% -1.0 -11.2%Harlow 8.2 1.4 0.0 0.4 7.1 0.0 0.5% 0.0 0.5%Maldon 4.6 0.5 0.0 0.1 4.2 -0.4 -9.1% -0.4 -9.1%Rochford 5.2 0.8 0.0 0.1 4.6 -0.1 -3.1% -0.1 -3.1%Tendring 14.6 1.6 0.0 0.5 13.5 -1.2 -8.9% -1.2 -8.9%Uttlesford 3.9 0.2 0.0 0.1 3.7 -0.7 -18.0% -0.7 -18.0%
GLOUCESTERSHIRECheltenham 8.7 1.4 0.0 0.6 7.9 -0.4 -4.7% -0.4 -4.7%Cotswold 5.5 0.1 0.0 0.2 5.5 -1.2 -21.4% -1.2 -21.4%Forest of Dean 7.0 0.6 0.0 0.2 6.6 -0.8 -12.0% -0.8 -12.0%Gloucester 10.8 1.2 0.0 0.5 10.1 -0.7 -6.6% -0.7 -6.6%Stroud 7.3 0.8 0.0 0.2 6.7 -0.7 -9.9% -0.7 -9.9%Tewkesbury 5.4 0.6 0.0 0.1 4.9 -0.4 -8.7% -0.4 -8.7%
HAMPSHIREBasingstoke and Deane 10.3 2.3 0.0 0.4 8.4 0.5 6.4% 0.5 6.4%East Hampshire 5.9 0.5 0.0 0.1 5.5 -0.6 -10.9% -0.6 -10.9%Eastleigh 7.8 1.1 0.0 0.3 7.1 -0.2 -2.3% -0.2 -2.3%Fareham 6.1 1.5 0.0 0.7 5.3 -0.1 -1.1% -0.1 -1.1%Gosport 7.1 1.2 0.0 0.2 6.2 0.2 3.0% 0.2 3.0%Hart 3.9 0.2 0.0 0.1 3.8 -0.4 -11.4% -0.4 -11.4%Havant 9.9 1.2 0.0 0.3 9.0 -0.5 -5.1% -0.5 -5.1%New Forest 11.8 1.0 0.0 0.5 11.3 -1.4 -12.4% -1.4 -12.4%Rushmoor 6.3 0.8 0.0 0.4 5.9 -0.3 -5.0% -0.3 -5.0%Test Valley 7.3 1.0 0.0 0.3 6.6 -0.4 -6.1% -0.4 -6.1%Winchester 6.7 0.9 0.0 0.3 6.0 -0.5 -7.5% -0.5 -7.5%
HERTFORDSHIREBroxbourne 7.0 1.1 0.0 0.4 6.3 -0.3 -4.1% -0.3 -4.1%Dacorum 9.5 1.8 0.0 0.3 8.0 0.1 1.4% 0.1 1.4%East Hertfordshire 8.1 0.9 0.0 0.3 7.5 -0.6 -8.5% -0.6 -8.5%Hertsmere 6.8 0.6 0.0 0.2 6.4 -0.6 -9.2% -0.6 -9.2%North Hertfordshire 8.3 1.0 0.0 0.3 7.5 -0.5 -6.1% -0.5 -6.1%St Albans 7.0 0.3 0.0 0.7 7.4 -1.5 -19.8% -1.5 -19.8%Stevenage 7.6 1.6 0.0 0.4 6.4 0.4 5.5% 0.4 5.5%Three Rivers 5.1 0.8 0.0 0.1 4.4 -0.1 -1.3% -0.1 -1.3%Watford 7.2 1.2 0.0 0.6 6.6 -0.2 -3.0% -0.2 -3.0%Welwyn Hatfield 8.2 1.0 0.0 0.3 7.5 -0.3 -4.3% -0.3 -4.3%
259

Formula Grant Before Floor Damping
(£ million) (£ million) (£ million) (£ million) (£ million) (£ million) (%) (£ million) (%)
Option CONCF5Difference from Base Position
Option CONCF6
Base Position = 2010-11 Agreed Position - 2008-09 Concessionary Travel NRE + 2008-09 Aggregated Concessionary Travel NRE + Aggregated 2010-11 Concessionary Travel Special Grant
2010-11 Indicative
Allocations
2008-09 Concess-
ionary Travel NRE
Aggreg-ated
2008-09 Concess-
ionary Travel NRE
Aggreg-ated
2010-11 Concess-
ionary Travel Special Grant
Base Position
KENTAshford 8.6 0.8 0.0 0.2 7.9 -0.7 -8.3% -0.7 -8.3%Canterbury 13.6 2.4 0.0 0.8 12.1 -0.2 -1.3% -0.2 -1.3%Dartford 7.6 0.9 0.0 0.4 7.1 -0.4 -5.8% -0.4 -5.8%Dover 9.9 1.3 0.0 0.3 8.9 -0.5 -6.1% -0.5 -6.1%Gravesham 8.5 1.3 0.0 0.4 7.7 -0.2 -3.2% -0.2 -3.2%Maidstone 9.0 2.0 0.0 0.5 7.5 0.1 1.7% 0.1 1.7%Sevenoaks 6.1 0.7 0.0 0.1 5.6 -0.6 -10.6% -0.6 -10.6%Shepway 10.1 1.5 0.0 0.4 8.9 -0.4 -4.0% -0.4 -4.0%Swale 12.2 0.9 0.0 0.1 11.5 -0.9 -8.1% -0.9 -8.1%Thanet 13.4 1.6 0.0 0.8 12.6 -1.4 -10.7% -1.4 -10.7%Tonbridge and Malling 6.5 0.8 0.0 0.1 5.9 -0.4 -6.3% -0.4 -6.3%Tunbridge Wells 6.5 1.3 0.0 0.4 5.7 -0.3 -4.4% -0.3 -4.4%
LANCASHIREBurnley 11.8 1.5 0.0 0.5 10.8 -0.6 -5.8% -0.6 -5.8%Chorley 8.6 1.2 0.0 0.7 8.2 -0.8 -9.8% -0.8 -9.8%Fylde 6.0 1.1 0.0 0.7 5.5 -0.5 -8.8% -0.5 -8.8%Hyndburn 10.3 1.1 0.0 0.3 9.5 -0.6 -6.3% -0.6 -6.3%Lancaster 16.8 2.3 0.0 1.2 15.7 -0.9 -5.9% -0.9 -5.9%Pendle 11.2 0.8 0.0 0.1 10.5 -0.8 -7.2% -0.8 -7.2%Preston 15.8 4.1 0.0 1.9 13.6 0.2 1.4% 0.2 1.4%Ribble Valley 4.3 0.5 0.0 0.2 4.0 -0.4 -9.7% -0.4 -9.7%Rossendale 6.2 0.9 0.0 0.2 5.6 -0.4 -7.1% -0.4 -7.1%South Ribble 7.6 1.0 0.0 0.1 6.7 -0.2 -3.3% -0.2 -3.3%West Lancashire 9.6 1.1 0.0 0.3 8.8 -0.8 -9.7% -0.8 -9.7%Wyre 10.8 1.6 0.0 0.4 9.6 -0.4 -3.7% -0.4 -3.7%
LEICESTERSHIREBlaby 6.6 0.5 0.0 0.3 6.3 -0.5 -8.1% -0.5 -8.1%Charnwood 12.7 1.3 0.0 0.6 12.0 -0.8 -6.3% -0.8 -6.3%Harborough 5.6 0.2 0.0 0.1 5.5 -0.7 -12.9% -0.7 -12.9%Hinckley and Bosworth 7.6 0.7 0.0 0.4 7.3 -0.8 -10.8% -0.8 -10.8%Melton 4.0 0.2 0.0 0.1 3.9 -0.4 -11.5% -0.4 -11.5%North West Leicestershire 7.3 0.5 0.0 0.2 7.0 -0.8 -10.9% -0.8 -10.9%Oadby and Wigston 4.7 0.4 0.0 0.3 4.6 -0.3 -6.8% -0.3 -6.8%
LINCOLNSHIREBoston 7.4 0.3 0.0 0.2 7.3 -0.9 -12.0% -0.9 -12.0%East Lindsey 17.9 1.0 0.0 1.0 17.9 -2.8 -15.6% -2.8 -15.6%Lincoln 10.3 1.3 0.0 0.8 9.9 -0.8 -7.8% -0.8 -7.8%North Kesteven 9.0 0.6 0.0 0.2 8.5 -0.9 -10.2% -0.9 -10.2%South Holland 9.3 0.4 0.0 0.2 9.1 -1.1 -11.8% -1.1 -11.8%South Kesteven 10.2 0.5 0.0 0.4 10.2 -1.4 -13.9% -1.4 -13.9%West Lindsey 8.4 0.5 0.0 0.1 8.0 -1.0 -12.0% -1.0 -12.0%
NORFOLKBreckland 11.6 0.3 0.0 0.1 11.4 -1.7 -14.7% -1.7 -14.7%Broadland 8.7 0.7 0.0 0.1 8.1 -0.8 -9.2% -0.8 -9.2%Great Yarmouth 10.9 1.0 0.0 1.0 10.9 -1.6 -14.7% -1.6 -14.7%King's Lynn and West Norfolk 15.8 0.8 0.0 0.5 15.4 -2.1 -13.4% -2.1 -13.4%North Norfolk 9.1 0.3 0.0 0.2 9.1 -1.7 -18.2% -1.7 -18.2%Norwich 16.0 2.8 0.0 2.3 15.6 -1.5 -9.7% -1.5 -9.7%South Norfolk 8.6 1.2 0.0 0.4 7.8 -0.8 -9.8% -0.8 -9.8%
260

Formula Grant Before Floor Damping
(£ million) (£ million) (£ million) (£ million) (£ million) (£ million) (%) (£ million) (%)
Option CONCF5Difference from Base Position
Option CONCF6
Base Position = 2010-11 Agreed Position - 2008-09 Concessionary Travel NRE + 2008-09 Aggregated Concessionary Travel NRE + Aggregated 2010-11 Concessionary Travel Special Grant
2010-11 Indicative
Allocations
2008-09 Concess-
ionary Travel NRE
Aggreg-ated
2008-09 Concess-
ionary Travel NRE
Aggreg-ated
2010-11 Concess-
ionary Travel Special Grant
Base Position
NORTH YORKSHIRECraven 4.3 0.4 0.0 0.3 4.1 -0.6 -14.2% -0.6 -14.2%Hambleton 5.9 0.2 0.0 0.3 5.9 -1.2 -19.5% -1.2 -19.5%Harrogate 11.5 1.5 0.0 1.5 11.5 -1.7 -14.5% -1.7 -14.5%Richmondshire 4.4 0.2 0.0 0.2 4.4 -0.7 -15.0% -0.7 -15.0%Ryedale 4.7 0.3 0.0 0.2 4.6 -0.8 -17.0% -0.8 -17.0%Scarborough 12.6 2.0 0.0 1.2 11.8 -1.0 -8.6% -1.0 -8.6%Selby 6.8 0.5 0.0 0.2 6.5 -0.6 -9.8% -0.6 -9.8%
NORTHAMPTONSHIRECorby 5.6 0.5 0.0 0.3 5.5 -0.6 -10.5% -0.6 -10.5%Daventry 6.4 0.4 0.0 0.2 6.2 -0.8 -12.1% -0.8 -12.1%East Northamptonshire 6.9 0.3 0.0 0.3 6.8 -0.9 -12.7% -0.9 -12.7%Kettering 7.4 1.0 0.0 0.6 7.0 -0.6 -8.6% -0.6 -8.6%Northampton 18.9 2.0 0.0 0.7 17.6 -0.9 -5.0% -0.9 -5.0%South Northamptonshire 6.1 0.2 0.0 0.1 5.9 -0.8 -13.0% -0.8 -13.0%Wellingborough 7.1 0.6 0.0 0.3 6.8 -0.6 -9.1% -0.6 -9.1%
NOTTINGHAMSHIREAshfield 11.6 1.3 0.0 0.4 10.8 -0.8 -7.3% -0.8 -7.3%Bassetlaw 11.4 1.2 0.0 0.3 10.6 -0.9 -8.8% -0.9 -8.8%Broxtowe 9.1 0.9 0.0 0.3 8.5 -0.5 -6.0% -0.5 -6.0%Gedling 9.4 1.2 0.0 0.3 8.5 -0.3 -4.0% -0.3 -4.0%Mansfield 10.3 1.3 0.0 0.7 9.6 -1.0 -9.9% -1.0 -9.9%Newark and Sherwood 10.5 1.0 0.0 0.3 9.9 -0.9 -9.1% -0.9 -9.1%Rushcliffe 7.3 0.6 0.0 0.2 6.9 -0.6 -8.6% -0.6 -8.6%
OXFORDSHIRECherwell 11.2 0.9 0.0 0.2 10.5 -0.7 -6.5% -0.7 -6.5%Oxford 16.9 3.2 0.0 3.1 16.9 -1.3 -8.0% -1.3 -8.0%South Oxfordshire 7.8 0.6 0.0 0.2 7.4 -0.8 -11.4% -0.8 -11.4%Vale of White Horse 7.2 0.7 0.0 0.5 7.0 -0.8 -12.2% -0.8 -12.2%West Oxfordshire 6.1 0.7 0.0 0.1 5.5 -0.5 -8.8% -0.5 -8.8%
SOMERSETMendip 8.5 1.0 0.0 0.3 7.9 -0.7 -9.3% -0.7 -9.3%Sedgemoor 10.3 0.9 0.0 0.4 9.7 -1.0 -10.1% -1.0 -10.1%South Somerset 11.2 1.6 0.0 0.4 10.0 -0.7 -7.4% -0.7 -7.4%Taunton Deane 8.9 1.5 0.0 0.4 7.8 -0.2 -2.9% -0.2 -2.9%West Somerset 3.3 0.1 0.0 0.1 3.4 -0.7 -20.5% -0.7 -20.5%
STAFFORDSHIRECannock Chase 8.6 1.1 0.0 0.3 7.9 -0.5 -5.9% -0.5 -5.9%East Staffordshire 9.6 1.4 0.0 0.4 8.6 -0.3 -3.6% -0.3 -3.6%Lichfield 6.1 0.5 0.0 0.2 5.8 -0.8 -13.1% -0.8 -13.1%Newcastle-under-Lyme 11.3 1.4 0.0 0.4 10.3 -0.6 -6.2% -0.6 -6.2%South Staffordshire 7.2 1.1 0.0 0.2 6.3 -0.3 -4.4% -0.3 -4.4%Stafford 8.8 1.6 0.0 0.5 7.7 -0.3 -4.0% -0.3 -4.0%Staffordshire Moorlands 7.6 0.7 0.0 0.3 7.1 -0.9 -12.5% -0.9 -12.5%Tamworth 6.9 0.6 0.0 0.3 6.6 -0.5 -8.3% -0.5 -8.3%
261

Formula Grant Before Floor Damping
(£ million) (£ million) (£ million) (£ million) (£ million) (£ million) (%) (£ million) (%)
Option CONCF5Difference from Base Position
Option CONCF6
Base Position = 2010-11 Agreed Position - 2008-09 Concessionary Travel NRE + 2008-09 Aggregated Concessionary Travel NRE + Aggregated 2010-11 Concessionary Travel Special Grant
2010-11 Indicative
Allocations
2008-09 Concess-
ionary Travel NRE
Aggreg-ated
2008-09 Concess-
ionary Travel NRE
Aggreg-ated
2010-11 Concess-
ionary Travel Special Grant
Base Position
SUFFOLKBabergh 6.4 0.8 0.0 0.1 5.6 -0.3 -5.0% -0.3 -5.0%Forest Heath 5.5 0.4 0.0 0.1 5.2 -0.3 -5.1% -0.3 -5.1%Ipswich 11.9 2.9 0.0 0.6 9.7 0.8 8.3% 0.8 8.3%Mid Suffolk 6.2 0.7 0.0 0.1 5.7 -0.6 -10.2% -0.6 -10.2%St Edmundsbury 7.1 0.9 0.0 0.2 6.4 -0.4 -6.3% -0.4 -6.3%Suffolk Coastal 8.4 1.1 0.0 0.1 7.4 -0.4 -5.5% -0.4 -5.5%Waveney 12.0 1.5 0.0 0.6 11.1 -0.8 -7.2% -0.8 -7.2%
SURREYElmbridge 6.5 0.2 0.0 0.1 6.5 -0.9 -14.1% -0.9 -14.1%Epsom and Ewell 4.0 0.2 0.0 0.1 3.8 -0.4 -9.9% -0.4 -9.9%Guildford 8.6 1.2 0.0 0.9 8.3 -0.8 -9.9% -0.8 -9.9%Mole Valley 3.3 0.3 0.0 0.1 3.1 -0.6 -19.0% -0.6 -19.0%Reigate and Banstead 6.9 0.7 0.0 0.3 6.5 -0.7 -10.8% -0.7 -10.8%Runnymede 5.8 0.3 0.0 0.1 5.5 -0.5 -8.3% -0.5 -8.3%Spelthorne 5.7 0.4 0.0 0.1 5.3 -0.5 -8.8% -0.5 -8.8%Surrey Heath 4.7 0.6 0.0 0.5 4.6 -0.5 -10.6% -0.5 -10.6%Tandridge 4.0 0.3 0.0 0.1 3.8 -0.6 -15.8% -0.6 -15.8%Waverley 5.4 0.6 0.0 0.3 5.1 -0.8 -15.8% -0.8 -15.8%Woking 5.8 0.7 0.0 0.3 5.5 -0.5 -8.2% -0.5 -8.2%
WARWICKSHIRENorth Warwickshire 5.5 0.4 0.0 0.1 5.2 -0.6 -10.6% -0.6 -10.6%Nuneaton and Bedworth 11.4 1.6 0.0 0.4 10.2 -0.4 -3.5% -0.4 -3.5%Rugby 6.6 0.9 0.0 0.2 6.0 -0.3 -5.9% -0.3 -5.9%Stratford-on-Avon 6.9 0.7 0.0 0.5 6.7 -1.2 -18.4% -1.2 -18.4%Warwick 10.5 1.4 0.0 0.4 9.4 -0.3 -3.0% -0.3 -3.0%
WEST SUSSEXAdur 5.0 0.7 0.0 0.1 4.5 -0.1 -1.7% -0.1 -1.7%Arun 10.5 1.6 0.0 0.6 9.5 -0.7 -7.2% -0.7 -7.2%Chichester 5.9 1.2 0.0 0.7 5.5 -0.8 -14.9% -0.8 -14.9%Crawley 10.5 1.7 0.0 0.3 9.2 0.3 2.9% 0.3 2.9%Horsham 6.0 0.9 0.0 0.5 5.6 -0.7 -12.0% -0.7 -12.0%Mid Sussex 5.3 0.7 0.0 0.3 4.9 -0.6 -11.8% -0.6 -11.8%Worthing 7.9 1.8 0.0 1.0 7.2 -0.3 -4.7% -0.3 -4.7%
WORCESTERSHIREBromsgrove 5.2 0.5 0.0 0.3 4.9 -0.6 -12.5% -0.6 -12.5%Malvern Hills 5.2 0.3 0.0 0.2 5.1 -0.9 -17.9% -0.9 -17.9%Redditch 6.4 1.2 0.0 0.2 5.5 0.1 1.3% 0.1 1.3%Worcester 7.8 1.7 0.0 0.5 6.7 0.1 1.9% 0.1 1.9%Wychavon 8.0 0.6 0.0 0.3 7.7 -1.1 -13.8% -1.1 -13.8%Wyre Forest 8.1 0.7 0.0 0.3 7.7 -0.9 -11.2% -0.9 -11.2%
262

Formula Grant Before Floor Damping
(£ million) (£ million) (£ million) (£ million) (£ million) (£ million) (%) (£ million) (%)
Option CONCF5Difference from Base Position
Option CONCF6
Base Position = 2010-11 Agreed Position - 2008-09 Concessionary Travel NRE + 2008-09 Aggregated Concessionary Travel NRE + Aggregated 2010-11 Concessionary Travel Special Grant
2010-11 Indicative
Allocations
2008-09 Concess-
ionary Travel NRE
Aggreg-ated
2008-09 Concess-
ionary Travel NRE
Aggreg-ated
2010-11 Concess-
ionary Travel Special Grant
Base Position
SHIRE POLICE AUTHORITIES
Avon & Somerset Police 197.6 0.0 0.0 0.0 197.6 0.6 0.3% 0.6 0.3%Bedfordshire Police 76.6 0.0 0.0 0.0 76.6 0.3 0.3% 0.3 0.3%Cambridgeshire Police 86.2 0.0 0.0 0.0 86.2 0.4 0.5% 0.4 0.5%Cheshire Police 114.1 0.0 0.0 0.0 114.1 0.4 0.3% 0.4 0.3%Cleveland Police 99.0 0.0 0.0 0.0 99.0 0.0 0.0% 0.0 0.0%
Cumbria Police 56.1 0.0 0.0 0.0 56.1 0.3 0.5% 0.3 0.5%Derbyshire Police 120.7 0.0 0.0 0.0 120.7 0.6 0.5% 0.6 0.5%Devon & Cornwall Police 191.7 0.0 0.0 0.0 191.7 0.8 0.4% 0.8 0.4%Dorset Police 64.3 0.0 0.0 0.0 64.3 0.2 0.4% 0.2 0.4%Durham Police 87.0 0.0 0.0 0.0 87.0 0.2 0.2% 0.2 0.2%
Essex Police 187.3 0.0 0.0 0.0 187.3 0.6 0.3% 0.6 0.3%Gloucestershire Police 58.5 0.0 0.0 0.0 58.5 0.3 0.5% 0.3 0.5%Hampshire Police 215.0 0.0 0.0 0.0 215.0 0.6 0.3% 0.6 0.3%Hertfordshire Police 128.9 0.0 0.0 0.0 128.9 -0.1 -0.1% -0.1 -0.1%Humberside Police 132.9 0.0 0.0 0.0 132.9 0.4 0.3% 0.4 0.3%
Kent Police 200.2 0.0 0.0 0.0 200.2 0.4 0.2% 0.4 0.2%Lancashire Police 212.3 0.0 0.0 0.0 212.3 0.6 0.3% 0.6 0.3%Leicestershire Police 124.2 0.0 0.0 0.0 124.2 0.5 0.4% 0.5 0.4%Lincolnshire Police 69.0 0.0 0.0 0.0 69.0 0.7 1.0% 0.7 1.0%Norfolk Police 88.5 0.0 0.0 0.0 88.5 0.6 0.7% 0.6 0.7%
North Yorkshire Police 73.1 0.0 0.0 0.0 73.1 0.6 0.8% 0.6 0.8%Northamptonshire Police 78.4 0.0 0.0 0.0 78.4 0.4 0.5% 0.4 0.5%Nottinghamshire Police 152.7 0.0 0.0 0.0 152.7 0.5 0.3% 0.5 0.3%Staffordshire Police 125.1 0.0 0.0 0.0 125.1 0.6 0.5% 0.6 0.5%Suffolk Police 71.0 0.0 0.0 0.0 71.0 0.5 0.7% 0.5 0.7%
Surrey Police 101.3 0.0 0.0 0.0 101.3 0.0 0.0% 0.0 0.0%Sussex Police 167.1 0.0 0.0 0.0 167.1 0.3 0.2% 0.3 0.2%Thames Valley Police 248.5 0.0 0.0 0.0 248.5 0.3 0.1% 0.3 0.1%Warwickshire Police 56.1 0.0 0.0 0.0 56.1 0.2 0.4% 0.2 0.4%West Mercia Police 114.3 0.0 0.0 0.0 114.3 0.8 0.7% 0.8 0.7%
Wiltshire Police 64.1 0.0 0.0 0.0 64.1 0.3 0.4% 0.3 0.4%
263
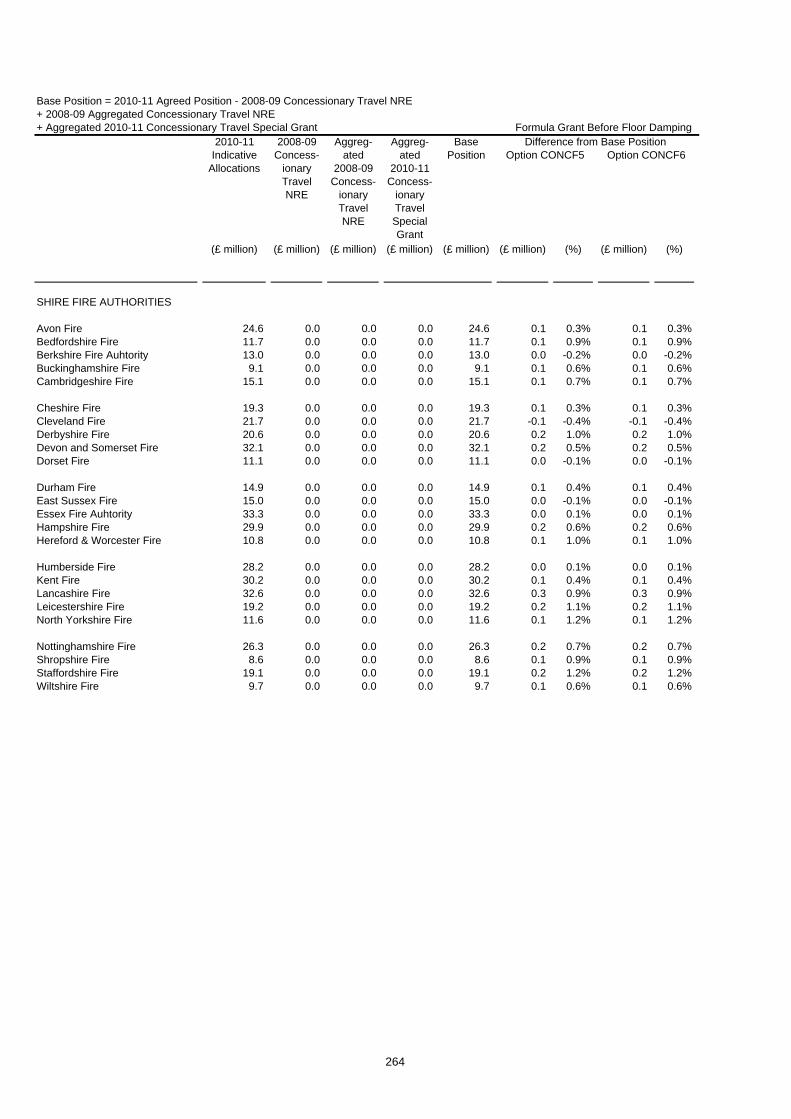
Formula Grant Before Floor Damping
(£ million) (£ million) (£ million) (£ million) (£ million) (£ million) (%) (£ million) (%)
Option CONCF5Difference from Base Position
Option CONCF6
Base Position = 2010-11 Agreed Position - 2008-09 Concessionary Travel NRE + 2008-09 Aggregated Concessionary Travel NRE + Aggregated 2010-11 Concessionary Travel Special Grant
2010-11 Indicative
Allocations
2008-09 Concess-
ionary Travel NRE
Aggreg-ated
2008-09 Concess-
ionary Travel NRE
Aggreg-ated
2010-11 Concess-
ionary Travel Special Grant
Base Position
SHIRE FIRE AUTHORITIES
Avon Fire 24.6 0.0 0.0 0.0 24.6 0.1 0.3% 0.1 0.3%Bedfordshire Fire 11.7 0.0 0.0 0.0 11.7 0.1 0.9% 0.1 0.9%Berkshire Fire Auhtority 13.0 0.0 0.0 0.0 13.0 0.0 -0.2% 0.0 -0.2%Buckinghamshire Fire 9.1 0.0 0.0 0.0 9.1 0.1 0.6% 0.1 0.6%Cambridgeshire Fire 15.1 0.0 0.0 0.0 15.1 0.1 0.7% 0.1 0.7%
Cheshire Fire 19.3 0.0 0.0 0.0 19.3 0.1 0.3% 0.1 0.3%Cleveland Fire 21.7 0.0 0.0 0.0 21.7 -0.1 -0.4% -0.1 -0.4%Derbyshire Fire 20.6 0.0 0.0 0.0 20.6 0.2 1.0% 0.2 1.0%Devon and Somerset Fire 32.1 0.0 0.0 0.0 32.1 0.2 0.5% 0.2 0.5%Dorset Fire 11.1 0.0 0.0 0.0 11.1 0.0 -0.1% 0.0 -0.1%
Durham Fire 14.9 0.0 0.0 0.0 14.9 0.1 0.4% 0.1 0.4%East Sussex Fire 15.0 0.0 0.0 0.0 15.0 0.0 -0.1% 0.0 -0.1%Essex Fire Auhtority 33.3 0.0 0.0 0.0 33.3 0.0 0.1% 0.0 0.1%Hampshire Fire 29.9 0.0 0.0 0.0 29.9 0.2 0.6% 0.2 0.6%Hereford & Worcester Fire 10.8 0.0 0.0 0.0 10.8 0.1 1.0% 0.1 1.0%
Humberside Fire 28.2 0.0 0.0 0.0 28.2 0.0 0.1% 0.0 0.1%Kent Fire 30.2 0.0 0.0 0.0 30.2 0.1 0.4% 0.1 0.4%Lancashire Fire 32.6 0.0 0.0 0.0 32.6 0.3 0.9% 0.3 0.9%Leicestershire Fire 19.2 0.0 0.0 0.0 19.2 0.2 1.1% 0.2 1.1%North Yorkshire Fire 11.6 0.0 0.0 0.0 11.6 0.1 1.2% 0.1 1.2%
Nottinghamshire Fire 26.3 0.0 0.0 0.0 26.3 0.2 0.7% 0.2 0.7%Shropshire Fire 8.6 0.0 0.0 0.0 8.6 0.1 0.9% 0.1 0.9%Staffordshire Fire 19.1 0.0 0.0 0.0 19.1 0.2 1.2% 0.2 1.2%Wiltshire Fire 9.7 0.0 0.0 0.0 9.7 0.1 0.6% 0.1 0.6%
264
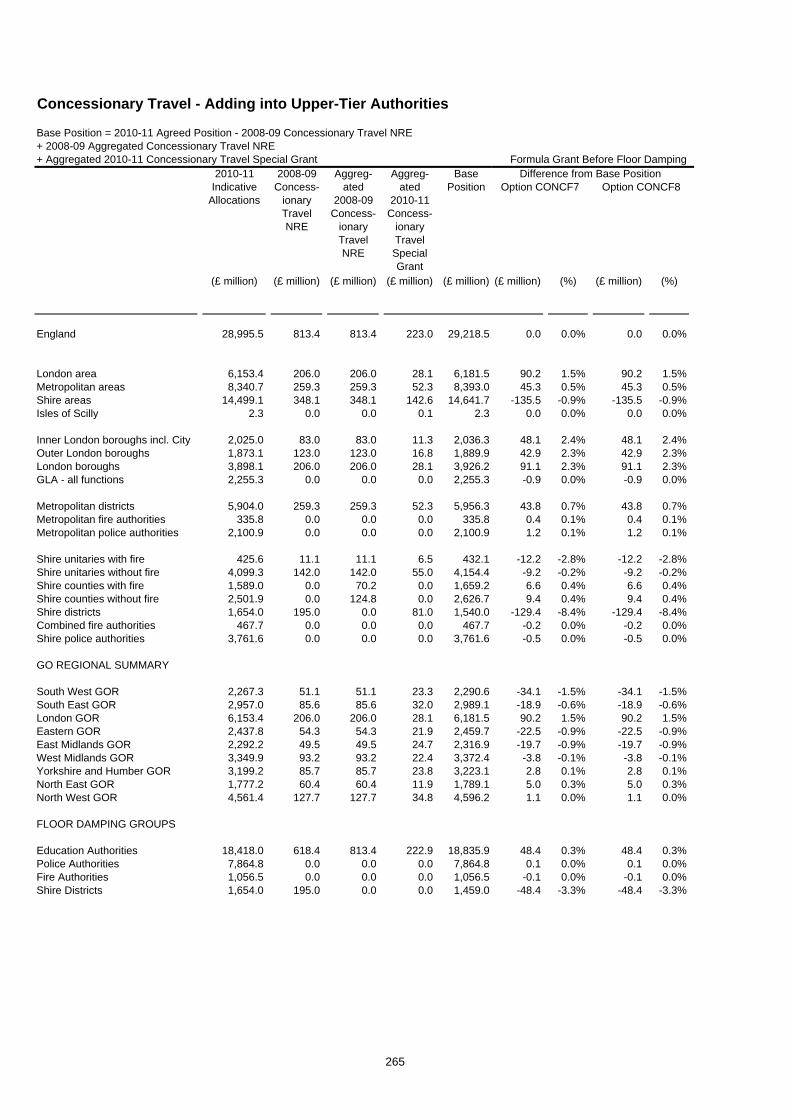
Concessionary Travel - Adding into Upper-Tier Authorities
(£ million) (£ million) (£ million) (£ million) (£ million)
England 28,995.5 813.4 813.4 223.0 29,218.5
London area 6,153.4 206.0 206.0 28.1 6,181.5Metropolitan areas 8,340.7 259.3 259.3 52.3 8,393.0Shire areas 14,499.1 348.1 348.1 142.6 14,641.7Isles of Scilly 2.3 0.0 0.0 0.1 2.3
Inner London boroughs incl. City 2,025.0 83.0 83.0 11.3 2,036.3Outer London boroughs 1,873.1 123.0 123.0 16.8 1,889.9London boroughs 3,898.1 206.0 206.0 28.1 3,926.2GLA - all functions 2,255.3 0.0 0.0 0.0 2,255.3
Metropolitan districts 5,904.0 259.3 259.3 52.3 5,956.3Metropolitan fire authorities 335.8 0.0 0.0 0.0 335.8Metropolitan police authorities 2,100.9 0.0 0.0 0.0 2,100.9
Shire unitaries with fire 425.6 11.1 11.1 6.5 432.1Shire unitaries without fire 4,099.3 142.0 142.0 55.0 4,154.4Shire counties with fire 1,589.0 0.0 70.2 0.0 1,659.2Shire counties without fire 2,501.9 0.0 124.8 0.0 2,626.7Shire districts 1,654.0 195.0 0.0 81.0 1,540.0Combined fire authorities 467.7 0.0 0.0 0.0 467.7Shire police authorities 3,761.6 0.0 0.0 0.0 3,761.6
GO REGIONAL SUMMARY
South West GOR 2,267.3 51.1 51.1 23.3 2,290.6South East GOR 2,957.0 85.6 85.6 32.0 2,989.1London GOR 6,153.4 206.0 206.0 28.1 6,181.5Eastern GOR 2,437.8 54.3 54.3 21.9 2,459.7East Midlands GOR 2,292.2 49.5 49.5 24.7 2,316.9West Midlands GOR 3,349.9 93.2 93.2 22.4 3,372.4Yorkshire and Humber GOR 3,199.2 85.7 85.7 23.8 3,223.1North East GOR 1,777.2 60.4 60.4 11.9 1,789.1North West GOR 4,561.4 127.7 127.7 34.8 4,596.2
FLOOR DAMPING GROUPS
Education Authorities 18,418.0 618.4 813.4 222.9 18,835.9Police Authorities 7,864.8 0.0 0.0 0.0 7,864.8Fire Authorities 1,056.5 0.0 0.0 0.0 1,056.5Shire Districts 1,654.0 195.0 0.0 0.0 1,459.0
Base Position = 2010-11 Agreed Position - 2008-09 Concessionary Travel NRE + 2008-09 Aggregated Concessionary Travel NRE + Aggregated 2010-11 Concessionary Travel Special Grant
2010-11 Indicative
Allocations
2008-09 Concess-
ionary Travel NRE
Aggreg-ated
2008-09 Concess-
ionary Travel NRE
Aggreg-ated
2010-11 Concess-
ionary Travel Special Grant
Base Position
Formula Grant Before Floor Damping
(£ million) (%) (£ million) (%)
0.0 0.0% 0.0 0.0%
90.2 1.5% 90.2 1.5%45.3 0.5% 45.3 0.5%
-135.5 -0.9% -135.5 -0.9%0.0 0.0% 0.0 0.0%
48.1 2.4% 48.1 2.4%42.9 2.3% 42.9 2.3%91.1 2.3% 91.1 2.3%-0.9 0.0% -0.9 0.0%
43.8 0.7% 43.8 0.7%0.4 0.1% 0.4 0.1%1.2 0.1% 1.2 0.1%
-12.2 -2.8% -12.2 -2.8%-9.2 -0.2% -9.2 -0.2%6.6 0.4% 6.6 0.4%9.4 0.4% 9.4 0.4%
-129.4 -8.4% -129.4 -8.4%-0.2 0.0% -0.2 0.0%-0.5 0.0% -0.5 0.0%
-34.1 -1.5% -34.1 -1.5%-18.9 -0.6% -18.9 -0.6%90.2 1.5% 90.2 1.5%
-22.5 -0.9% -22.5 -0.9%-19.7 -0.9% -19.7 -0.9%-3.8 -0.1% -3.8 -0.1%2.8 0.1% 2.8 0.1%5.0 0.3% 5.0 0.3%1.1 0.0% 1.1 0.0%
48.4 0.3% 48.4 0.3%0.1 0.0% 0.1 0.0%
-0.1 0.0% -0.1 0.0%-48.4 -3.3% -48.4 -3.3%
Difference from Base PositionOption CONCF7 Option CONCF8
265

(£ million) (£ million) (£ million) (£ million) (£ million)
Base Position = 2010-11 Agreed Position - 2008-09 Concessionary Travel NRE + 2008-09 Aggregated Concessionary Travel NRE + Aggregated 2010-11 Concessionary Travel Special Grant
2010-11 Indicative
Allocations
2008-09 Concess-
ionary Travel NRE
Aggreg-ated
2008-09 Concess-
ionary Travel NRE
Aggreg-ated
2010-11 Concess-
ionary Travel Special Grant
Base Position
GREATER LONDON
City of London 91.1 0.4 0.4 0.0 91.1
Camden 171.0 8.4 8.4 1.1 172.1Greenwich 170.1 5.2 5.2 0.7 170.8Hackney 201.8 6.6 6.6 0.9 202.7Hammersmith and Fulham 94.3 6.2 6.2 0.8 95.2Islington 133.8 6.8 6.8 0.9 134.7Kensington and Chelsea 95.9 6.0 6.0 0.8 96.8
Lambeth 180.3 8.5 8.5 1.2 181.5Lewisham 174.9 6.7 6.7 0.9 175.8Southwark 210.2 6.9 6.9 0.9 211.1Tower Hamlets 224.3 5.2 5.2 0.7 225.0Wandsworth 98.6 7.9 7.9 1.1 99.7Westminster 178.8 8.4 8.4 1.1 179.9
Barking and Dagenham 108.2 3.6 3.6 0.5 108.7Barnet 97.9 9.6 9.6 1.3 99.2Bexley 64.5 4.1 4.1 0.6 65.0Brent 157.0 9.2 9.2 1.3 158.3Bromley 45.7 5.8 5.8 0.8 46.5
Croydon 118.4 7.0 7.0 1.0 119.4Ealing 129.0 9.8 9.8 1.3 130.3Enfield 126.7 7.2 7.2 1.0 127.7Haringey 137.6 8.5 8.5 1.2 138.7Harrow 66.6 6.1 6.1 0.8 67.4
Havering 52.3 5.1 5.1 0.7 53.0Hillingdon 85.6 5.6 5.6 0.8 86.4Hounslow 77.3 5.4 5.4 0.7 78.0Kingston upon Thames 32.6 2.9 2.9 0.4 33.0Merton 61.2 5.3 5.3 0.7 61.9
Newham 231.3 7.2 7.2 1.0 232.3Redbridge 102.6 6.3 6.3 0.9 103.5Richmond upon Thames 9.6 4.7 4.7 0.6 10.2Sutton 45.1 3.4 3.4 0.5 45.6Waltham Forest 124.0 5.9 5.9 0.8 124.8
GLA - all functions 2,255.3 0.0 0.0 0.0 2,255.3
GLA - police 2,002.3 0.0 0.0 0.0 2,002.3GLA - fire 253.0 0.0 0.0 0.0 253.0
Formula Grant Before Floor Damping
(£ million) (%) (£ million) (%)
Difference from Base PositionOption CONCF7 Option CONCF8
-0.3 -0.4% -0.3 -0.4%
4.2 2.4% 4.2 2.4%3.3 2.0% 3.3 2.0%4.0 2.0% 4.0 2.0%3.2 3.4% 3.2 3.4%3.1 2.3% 3.1 2.3%3.8 3.9% 3.8 3.9%
4.7 2.6% 4.7 2.6%3.9 2.2% 3.9 2.2%5.0 2.4% 5.0 2.4%4.4 1.9% 4.4 1.9%4.5 4.5% 4.5 4.5%4.5 2.5% 4.5 2.5%
2.0 1.9% 2.0 1.9%2.4 2.5% 2.4 2.5%2.0 3.1% 2.0 3.1%2.6 1.7% 2.6 1.7%1.6 3.4% 1.6 3.4%
2.9 2.4% 2.9 2.4%3.0 2.3% 3.0 2.3%2.2 1.7% 2.2 1.7%2.3 1.6% 2.3 1.6%1.5 2.2% 1.5 2.2%
1.3 2.5% 1.3 2.5%1.5 1.7% 1.5 1.7%1.8 2.3% 1.8 2.3%1.7 5.1% 1.7 5.1%2.4 3.8% 2.4 3.8%
4.0 1.7% 4.0 1.7%2.2 2.1% 2.2 2.1%1.6 15.2% 1.6 15.2%1.7 3.8% 1.7 3.8%2.3 1.9% 2.3 1.9%
-0.9 0.0% -0.9 0.0%
-0.6 0.0% -0.6 0.0%-0.3 -0.1% -0.3 -0.1%
266

(£ million) (£ million) (£ million) (£ million) (£ million)
Base Position = 2010-11 Agreed Position - 2008-09 Concessionary Travel NRE + 2008-09 Aggregated Concessionary Travel NRE + Aggregated 2010-11 Concessionary Travel Special Grant
2010-11 Indicative
Allocations
2008-09 Concess-
ionary Travel NRE
Aggreg-ated
2008-09 Concess-
ionary Travel NRE
Aggreg-ated
2010-11 Concess-
ionary Travel Special Grant
Base Position
GREATER MANCHESTERBolton 132.6 4.8 4.8 1.1 133.7Bury 67.5 3.3 3.3 0.8 68.2Manchester 346.1 8.4 8.4 2.0 348.1Oldham 127.6 4.0 4.0 0.9 128.5Rochdale 114.9 3.8 3.8 0.9 115.8Salford 131.2 4.0 4.0 1.0 132.2Stockport 85.2 5.1 5.1 1.2 86.4Tameside 109.5 3.9 3.9 0.9 110.5Trafford 67.3 3.9 3.9 0.9 68.2Wigan 138.6 5.6 5.6 1.3 139.9Greater Manchester Fire 76.1 0.0 0.0 0.0 76.1Greater Manchester Police 485.7 0.0 0.0 0.0 485.7
MERSEYSIDEKnowsley 114.6 4.7 4.7 0.9 115.5Liverpool 318.0 13.5 13.5 2.6 320.6Sefton 127.6 8.6 8.6 1.6 129.2St Helens 90.9 5.5 5.5 1.1 92.0Wirral 165.2 9.6 9.6 1.8 167.0Merseyside Fire 46.1 0.0 0.0 0.0 46.1Merseyside Police 275.5 0.0 0.0 0.0 275.5
SOUTH YORKSHIREBarnsley 114.3 5.0 5.0 0.9 115.3Doncaster 149.1 6.5 6.5 1.2 150.3Rotherham 130.1 5.7 5.7 1.1 131.2Sheffield 280.0 11.9 11.9 2.2 282.2South Yorkshire Fire 37.4 0.0 0.0 0.0 37.4South Yorkshire Police 209.2 0.0 0.0 0.0 209.2
TYNE AND WEARGateshead 102.7 6.8 6.8 1.0 103.7Newcastle upon Tyne 157.2 9.8 9.8 1.4 158.6North Tyneside 87.4 7.0 7.0 1.0 88.5South Tyneside 89.3 5.4 5.4 0.8 90.1Sunderland 158.9 10.0 10.0 1.5 160.3Tyne and Wear Fire 35.9 0.0 0.0 0.0 35.9Northumbria Police 219.9 0.0 0.0 0.0 219.9
WEST MIDLANDSBirmingham 698.9 25.6 25.6 5.0 704.0Coventry 156.6 7.8 7.8 1.5 158.1Dudley 130.4 7.7 7.7 1.5 131.9Sandwell 190.3 7.3 7.3 1.4 191.7Solihull 49.1 5.2 5.2 1.0 50.1Walsall 142.3 6.4 6.4 1.3 143.6Wolverhampton 145.6 5.9 5.9 1.2 146.7West Midlands Fire 81.6 0.0 0.0 0.0 81.6West Midlands Police 542.2 0.0 0.0 0.0 542.2
Formula Grant Before Floor Damping
(£ million) (%) (£ million) (%)
Difference from Base PositionOption CONCF7 Option CONCF8
1.0 0.8% 1.0 0.8%0.4 0.6% 0.4 0.6%4.1 1.2% 4.1 1.2%1.2 1.0% 1.2 1.0%0.9 0.8% 0.9 0.8%1.1 0.8% 1.1 0.8%0.7 0.8% 0.7 0.8%1.1 1.0% 1.1 1.0%0.8 1.1% 0.8 1.1%0.7 0.5% 0.7 0.5%0.1 0.1% 0.1 0.1%0.2 0.0% 0.2 0.0%
0.3 0.3% 0.3 0.3%1.7 0.5% 1.7 0.5%0.1 0.1% 0.1 0.1%0.1 0.1% 0.1 0.1%0.1 0.1% 0.1 0.1%0.0 0.1% 0.0 0.1%0.1 0.0% 0.1 0.0%
0.2 0.2% 0.2 0.2%0.4 0.2% 0.4 0.2%0.5 0.4% 0.5 0.4%3.1 1.1% 3.1 1.1%0.1 0.2% 0.1 0.2%0.2 0.1% 0.2 0.1%
0.9 0.9% 0.9 0.9%1.8 1.1% 1.8 1.1%1.0 1.2% 1.0 1.2%0.8 0.8% 0.8 0.8%1.2 0.8% 1.2 0.8%0.0 0.1% 0.0 0.1%0.1 0.1% 0.1 0.1%
6.5 0.9% 6.5 0.9%1.4 0.9% 1.4 0.9%0.8 0.6% 0.8 0.6%1.6 0.8% 1.6 0.8%
-0.1 -0.3% -0.1 -0.3%0.5 0.4% 0.5 0.4%1.0 0.7% 1.0 0.7%0.1 0.1% 0.1 0.1%0.3 0.1% 0.3 0.1%
267

(£ million) (£ million) (£ million) (£ million) (£ million)
Base Position = 2010-11 Agreed Position - 2008-09 Concessionary Travel NRE + 2008-09 Aggregated Concessionary Travel NRE + Aggregated 2010-11 Concessionary Travel Special Grant
2010-11 Indicative
Allocations
2008-09 Concess-
ionary Travel NRE
Aggreg-ated
2008-09 Concess-
ionary Travel NRE
Aggreg-ated
2010-11 Concess-
ionary Travel Special Grant
Base Position
WEST YORKSHIREBradford 283.4 8.3 8.3 2.1 285.4Calderdale 84.1 3.3 3.3 0.8 84.9Kirklees 164.9 6.7 6.7 1.7 166.5Leeds 305.9 12.8 12.8 3.2 309.1Wakefield 146.7 5.3 5.3 1.3 148.1West Yorkshire Fire 58.7 0.0 0.0 0.0 58.7West Yorkshire Police 368.2 0.0 0.0 0.0 368.2
Formula Grant Before Floor Damping
(£ million) (%) (£ million) (%)
Difference from Base PositionOption CONCF7 Option CONCF8
2.2 0.8% 2.2 0.8%0.3 0.3% 0.3 0.3%0.9 0.5% 0.9 0.5%3.8 1.2% 3.8 1.2%0.8 0.5% 0.8 0.5%0.1 0.1% 0.1 0.1%0.2 0.1% 0.2 0.1%
268

(£ million) (£ million) (£ million) (£ million) (£ million)
Base Position = 2010-11 Agreed Position - 2008-09 Concessionary Travel NRE + 2008-09 Aggregated Concessionary Travel NRE + Aggregated 2010-11 Concessionary Travel Special Grant
2010-11 Indicative
Allocations
2008-09 Concess-
ionary Travel NRE
Aggreg-ated
2008-09 Concess-
ionary Travel NRE
Aggreg-ated
2010-11 Concess-
ionary Travel Special Grant
Base Position
ALL PURPOSE AUTHORITIES
Bath & North East Somerset 44.1 3.0 3.0 1.2 45.3Bedford 55.4 1.7 1.7 0.5 55.9Blackburn with Darwen 88.5 2.4 2.4 0.5 89.0Blackpool 86.9 3.7 3.7 2.3 89.2Bournemouth 49.4 2.8 2.8 1.3 50.7
Bracknell Forest 22.6 0.7 0.7 0.3 22.9Brighton & Hove 89.8 5.8 5.8 1.8 91.6Bristol 171.2 5.8 5.8 1.9 173.1Central Bedfordshire 51.9 1.5 1.5 0.6 52.5Cheshire East 64.5 2.4 2.4 1.0 65.5
Cheshire West & Chester 94.9 3.3 3.3 1.2 96.1Cornwall 227.6 3.4 3.4 3.5 231.0Darlington 40.1 2.8 2.8 1.4 41.5Derby 114.5 5.8 5.8 3.8 118.4Durham 238.7 7.6 7.6 1.5 240.2
East Riding of Yorkshire 109.2 3.2 3.2 0.9 110.1Halton 65.5 1.7 1.7 0.3 65.8Hartlepool 54.0 1.3 1.3 0.4 54.3Herefordshire 61.2 1.6 1.6 0.7 61.9Isle of Wight Council 65.0 4.9 4.9 1.8 66.7
Kingston upon Hull 159.2 5.3 5.3 1.9 161.1Leicester 188.4 5.4 5.4 2.3 190.8Luton 94.6 3.3 3.3 2.0 96.7Medway 89.5 3.0 3.0 0.7 90.2Middlesbrough 85.4 2.3 2.3 0.6 86.0
Milton Keynes 91.6 1.8 1.8 0.8 92.4North East Lincolnshire 76.9 1.6 1.6 0.6 77.6North Lincolnshire 66.3 1.3 1.3 0.5 66.8North Somerset 54.6 2.0 2.0 0.7 55.3Northumberland 133.1 2.7 2.7 1.3 134.3
Nottingham 179.5 7.5 7.5 4.4 183.9Peterborough 80.9 2.1 2.1 1.5 82.4Plymouth 108.7 3.9 3.9 1.1 109.8Poole 25.6 2.0 2.0 0.6 26.3Portsmouth 87.8 3.1 3.1 0.9 88.7
Reading 48.0 2.1 2.1 1.0 49.0Redcar and Cleveland 71.4 2.1 2.1 0.4 71.9Rutland 8.6 0.0 0.0 0.1 8.7Shropshire 97.4 1.9 1.9 0.9 98.3Slough 52.8 1.8 1.8 1.1 53.9
South Gloucestershire 64.0 1.8 1.8 0.3 64.3Southampton 101.2 2.5 2.5 1.1 102.3Southend-on-Sea 62.3 1.7 1.7 0.3 62.6Stockton-on-Tees 80.6 2.5 2.5 0.7 81.3Stoke-on-Trent 133.5 4.0 4.0 1.2 134.6
Formula Grant Before Floor Damping
(£ million) (%) (£ million) (%)
Difference from Base PositionOption CONCF7 Option CONCF8
-0.9 -1.9% -0.9 -1.9%-0.3 -0.6% -0.3 -0.6%0.5 0.5% 0.5 0.5%
-1.2 -1.4% -1.2 -1.4%-0.3 -0.6% -0.3 -0.6%
0.3 1.1% 0.3 1.1%1.0 1.1% 1.0 1.1%2.3 1.3% 2.3 1.3%
-1.0 -1.9% -1.0 -1.9%-1.6 -2.4% -1.6 -2.4%
-1.4 -1.5% -1.4 -1.5%-8.1 -3.5% -8.1 -3.5%-0.7 -1.8% -0.7 -1.8%-1.6 -1.3% -1.6 -1.3%-0.6 -0.2% -0.6 -0.2%
-2.0 -1.8% -2.0 -1.8%0.3 0.5% 0.3 0.5%0.5 0.9% 0.5 0.9%
-3.1 -5.1% -3.1 -5.1%-2.0 -3.0% -2.0 -3.0%
1.2 0.8% 1.2 0.8%1.0 0.5% 1.0 0.5%0.0 0.0% 0.0 0.0%1.5 1.6% 1.5 1.6%0.7 0.8% 0.7 0.8%
0.2 0.2% 0.2 0.2%0.4 0.5% 0.4 0.5%
-0.8 -1.2% -0.8 -1.2%-0.6 -1.2% -0.6 -1.2%-2.1 -1.6% -2.1 -1.6%
-0.7 -0.4% -0.7 -0.4%-0.6 -0.7% -0.6 -0.7%1.1 1.0% 1.1 1.0%
-0.1 -0.2% -0.1 -0.2%1.9 2.1% 1.9 2.1%
0.7 1.5% 0.7 1.5%0.4 0.5% 0.4 0.5%
-0.7 -8.0% -0.7 -8.0%-4.1 -4.2% -4.1 -4.2%0.4 0.7% 0.4 0.7%
0.4 0.6% 0.4 0.6%1.8 1.8% 1.8 1.8%1.1 1.8% 1.1 1.8%0.9 1.1% 0.9 1.1%0.8 0.6% 0.8 0.6%
269

(£ million) (£ million) (£ million) (£ million) (£ million)
Base Position = 2010-11 Agreed Position - 2008-09 Concessionary Travel NRE + 2008-09 Aggregated Concessionary Travel NRE + Aggregated 2010-11 Concessionary Travel Special Grant
2010-11 Indicative
Allocations
2008-09 Concess-
ionary Travel NRE
Aggreg-ated
2008-09 Concess-
ionary Travel NRE
Aggreg-ated
2010-11 Concess-
ionary Travel Special Grant
Base Position
Swindon 43.7 2.0 2.0 0.8 44.4Telford and the Wrekin 76.0 1.6 1.6 0.5 76.5Thurrock 62.1 0.8 0.8 0.2 62.3Torbay 64.2 3.1 3.1 1.6 65.8Warrington 52.7 3.0 3.0 1.2 53.9
West Berkshire 23.1 0.5 0.5 0.2 23.3Wiltshire 102.1 3.3 3.3 1.2 103.3Windsor and Maidenhead 10.1 1.0 1.0 0.3 10.4Wokingham 8.4 1.1 1.1 0.2 8.6York 45.8 3.5 3.5 1.5 47.3
Isles of Scilly 2.3 0.0 0.0 0.1 2.3
Formula Grant Before Floor Damping
(£ million) (%) (£ million) (%)
Difference from Base PositionOption CONCF7 Option CONCF8
0.5 1.0% 0.5 1.0%-0.1 -0.1% -0.1 -0.1%0.9 1.4% 0.9 1.4%
-1.0 -1.5% -1.0 -1.5%-0.4 -0.7% -0.4 -0.7%
-1.0 -4.2% -1.0 -4.2%-4.3 -4.1% -4.3 -4.1%-0.3 -3.2% -0.3 -3.2%-0.2 -2.4% -0.2 -2.4%-0.1 -0.1% -0.1 -0.1%
0.0 0.0% 0.0 0.0%
270
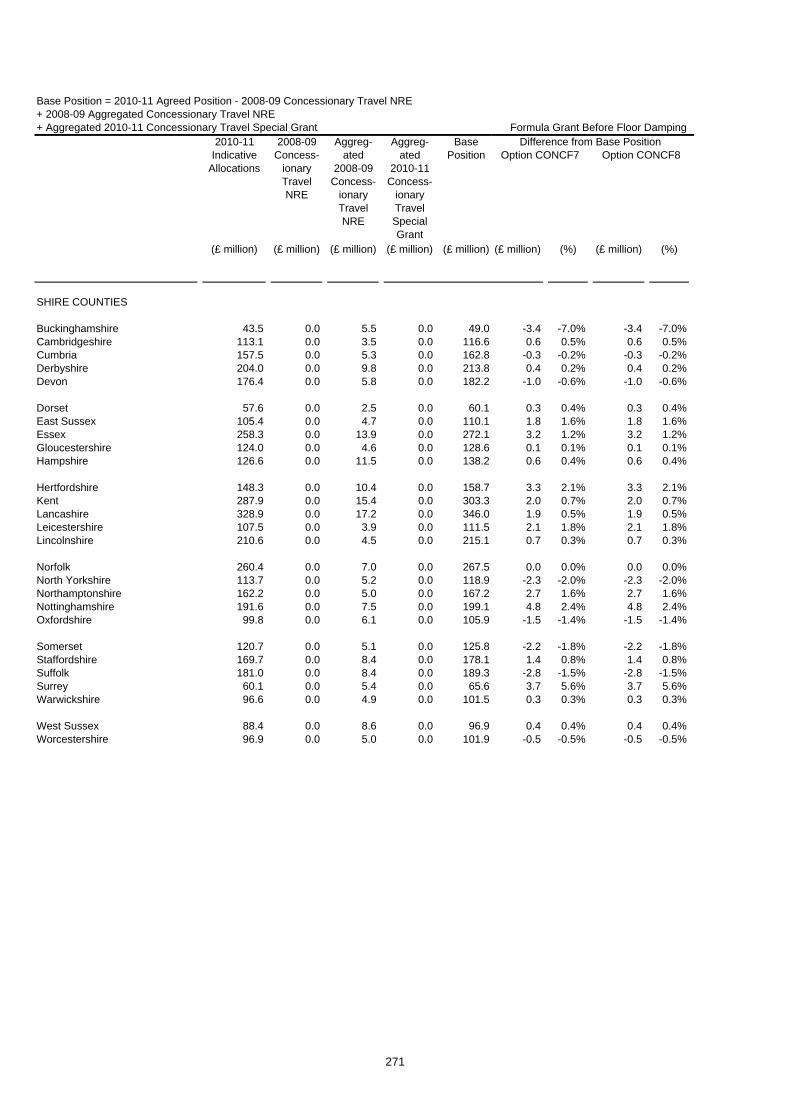
(£ million) (£ million) (£ million) (£ million) (£ million)
Base Position = 2010-11 Agreed Position - 2008-09 Concessionary Travel NRE + 2008-09 Aggregated Concessionary Travel NRE + Aggregated 2010-11 Concessionary Travel Special Grant
2010-11 Indicative
Allocations
2008-09 Concess-
ionary Travel NRE
Aggreg-ated
2008-09 Concess-
ionary Travel NRE
Aggreg-ated
2010-11 Concess-
ionary Travel Special Grant
Base Position
SHIRE COUNTIES
Buckinghamshire 43.5 0.0 5.5 0.0 49.0Cambridgeshire 113.1 0.0 3.5 0.0 116.6Cumbria 157.5 0.0 5.3 0.0 162.8Derbyshire 204.0 0.0 9.8 0.0 213.8Devon 176.4 0.0 5.8 0.0 182.2
Dorset 57.6 0.0 2.5 0.0 60.1East Sussex 105.4 0.0 4.7 0.0 110.1Essex 258.3 0.0 13.9 0.0 272.1Gloucestershire 124.0 0.0 4.6 0.0 128.6Hampshire 126.6 0.0 11.5 0.0 138.2
Hertfordshire 148.3 0.0 10.4 0.0 158.7Kent 287.9 0.0 15.4 0.0 303.3Lancashire 328.9 0.0 17.2 0.0 346.0Leicestershire 107.5 0.0 3.9 0.0 111.5Lincolnshire 210.6 0.0 4.5 0.0 215.1
Norfolk 260.4 0.0 7.0 0.0 267.5North Yorkshire 113.7 0.0 5.2 0.0 118.9Northamptonshire 162.2 0.0 5.0 0.0 167.2Nottinghamshire 191.6 0.0 7.5 0.0 199.1Oxfordshire 99.8 0.0 6.1 0.0 105.9
Somerset 120.7 0.0 5.1 0.0 125.8Staffordshire 169.7 0.0 8.4 0.0 178.1Suffolk 181.0 0.0 8.4 0.0 189.3Surrey 60.1 0.0 5.4 0.0 65.6Warwickshire 96.6 0.0 4.9 0.0 101.5
West Sussex 88.4 0.0 8.6 0.0 96.9Worcestershire 96.9 0.0 5.0 0.0 101.9
Formula Grant Before Floor Damping
(£ million) (%) (£ million) (%)
Difference from Base PositionOption CONCF7 Option CONCF8
-3.4 -7.0% -3.4 -7.0%0.6 0.5% 0.6 0.5%
-0.3 -0.2% -0.3 -0.2%0.4 0.2% 0.4 0.2%
-1.0 -0.6% -1.0 -0.6%
0.3 0.4% 0.3 0.4%1.8 1.6% 1.8 1.6%3.2 1.2% 3.2 1.2%0.1 0.1% 0.1 0.1%0.6 0.4% 0.6 0.4%
3.3 2.1% 3.3 2.1%2.0 0.7% 2.0 0.7%1.9 0.5% 1.9 0.5%2.1 1.8% 2.1 1.8%0.7 0.3% 0.7 0.3%
0.0 0.0% 0.0 0.0%-2.3 -2.0% -2.3 -2.0%2.7 1.6% 2.7 1.6%4.8 2.4% 4.8 2.4%
-1.5 -1.4% -1.5 -1.4%
-2.2 -1.8% -2.2 -1.8%1.4 0.8% 1.4 0.8%
-2.8 -1.5% -2.8 -1.5%3.7 5.6% 3.7 5.6%0.3 0.3% 0.3 0.3%
0.4 0.4% 0.4 0.4%-0.5 -0.5% -0.5 -0.5%
271

(£ million) (£ million) (£ million) (£ million) (£ million)
Base Position = 2010-11 Agreed Position - 2008-09 Concessionary Travel NRE + 2008-09 Aggregated Concessionary Travel NRE + Aggregated 2010-11 Concessionary Travel Special Grant
2010-11 Indicative
Allocations
2008-09 Concess-
ionary Travel NRE
Aggreg-ated
2008-09 Concess-
ionary Travel NRE
Aggreg-ated
2010-11 Concess-
ionary Travel Special Grant
Base Position
BUCKINGHAMSHIREAylesbury Vale 12.1 1.2 0.0 0.4 11.3Chiltern 3.2 1.1 0.0 0.2 2.3South Bucks 2.3 0.7 0.0 0.2 1.8Wycombe 9.5 2.5 0.0 0.4 7.4
CAMBRIDGESHIRECambridge 12.0 2.1 0.0 2.0 11.9East Cambridgeshire 6.8 0.1 0.0 0.1 6.8Fenland 9.9 0.3 0.0 0.2 9.9Huntingdonshire 13.4 0.7 0.0 0.5 13.1South Cambridgeshire 7.9 0.3 0.0 0.1 7.7
CUMBRIAAllerdale 10.4 1.2 0.0 0.5 9.8Barrow-in-Furness 9.1 0.7 0.0 0.2 8.6Carlisle 10.2 2.0 0.0 0.5 8.8Copeland 7.2 0.5 0.0 0.1 6.7Eden 4.7 0.1 0.0 0.2 4.8South Lakeland 6.8 0.8 0.0 0.9 6.9
DERBYSHIREAmber Valley 10.0 1.5 0.0 0.3 8.8Bolsover 8.0 0.7 0.0 0.2 7.4Chesterfield 10.2 3.1 0.0 2.3 9.4Derbyshire Dales 4.7 0.4 0.0 0.1 4.5Erewash 9.7 1.8 0.0 0.8 8.7High Peak 7.2 1.0 0.0 0.3 6.5North East Derbyshire 7.9 0.9 0.0 0.2 7.2South Derbyshire 7.5 0.5 0.0 0.1 7.1
DEVONEast Devon 8.4 1.1 0.0 0.6 7.9Exeter 12.1 2.6 0.0 2.3 11.9Mid Devon 6.3 0.3 0.0 0.1 6.1North Devon 8.5 0.1 0.0 0.3 8.7South Hams 5.6 0.3 0.0 0.2 5.5Teignbridge 10.1 1.0 0.0 0.5 9.7Torridge 6.6 0.2 0.0 0.1 6.5West Devon 4.4 0.2 0.0 0.1 4.3
DORSETChristchurch 2.9 0.5 0.0 0.2 2.6East Dorset 3.8 0.4 0.0 0.1 3.5North Dorset 4.7 0.1 0.0 0.1 4.6Purbeck 3.3 0.3 0.0 0.1 3.1West Dorset 7.9 0.4 0.0 0.3 7.9Weymouth and Portland 6.1 0.8 0.0 0.5 5.8
EAST SUSSEXEastbourne 10.5 1.9 0.0 1.0 9.6Hastings 10.6 1.2 0.0 0.6 10.0Lewes 6.6 0.7 0.0 0.1 5.9Rother 6.5 0.3 0.0 0.2 6.4Wealden 8.4 0.6 0.0 0.1 7.9
Formula Grant Before Floor Damping
(£ million) (%) (£ million) (%)
Difference from Base PositionOption CONCF7 Option CONCF8
-0.9 -7.9% -0.9 -7.9%0.2 8.9% 0.2 8.9%0.1 3.1% 0.1 3.1%0.8 10.7% 0.8 10.7%
-0.9 -7.5% -0.9 -7.5%-1.0 -14.6% -1.0 -14.6%-1.4 -14.1% -1.4 -14.1%-1.4 -10.9% -1.4 -10.9%-1.2 -15.8% -1.2 -15.8%
-1.0 -9.9% -1.0 -9.9%-0.8 -9.4% -0.8 -9.4%-0.2 -1.8% -0.2 -1.8%-0.7 -10.8% -0.7 -10.8%-1.0 -19.7% -1.0 -19.7%-1.4 -20.9% -1.4 -20.9%
-0.4 -5.0% -0.4 -5.0%-0.7 -9.9% -0.7 -9.9%-0.8 -9.0% -0.8 -9.0%-0.7 -14.8% -0.7 -14.8%-0.3 -3.9% -0.3 -3.9%-0.4 -6.2% -0.4 -6.2%-0.7 -9.1% -0.7 -9.1%-0.7 -9.9% -0.7 -9.9%
-1.1 -14.5% -1.1 -14.5%-1.1 -8.9% -1.1 -8.9%-0.9 -14.3% -0.9 -14.3%-1.7 -19.0% -1.7 -19.0%-1.0 -18.5% -1.0 -18.5%-1.3 -13.1% -1.3 -13.1%-1.0 -15.2% -1.0 -15.2%-0.7 -16.9% -0.7 -16.9%
-0.2 -6.2% -0.2 -6.2%-0.5 -13.9% -0.5 -13.9%-0.8 -17.0% -0.8 -17.0%-0.4 -12.0% -0.4 -12.0%-1.3 -16.4% -1.3 -16.4%-0.6 -10.3% -0.6 -10.3%
-0.3 -3.6% -0.3 -3.6%-0.9 -9.1% -0.9 -9.1%-0.4 -6.8% -0.4 -6.8%-1.1 -17.7% -1.1 -17.7%-1.1 -13.4% -1.1 -13.4%
272

(£ million) (£ million) (£ million) (£ million) (£ million)
Base Position = 2010-11 Agreed Position - 2008-09 Concessionary Travel NRE + 2008-09 Aggregated Concessionary Travel NRE + Aggregated 2010-11 Concessionary Travel Special Grant
2010-11 Indicative
Allocations
2008-09 Concess-
ionary Travel NRE
Aggreg-ated
2008-09 Concess-
ionary Travel NRE
Aggreg-ated
2010-11 Concess-
ionary Travel Special Grant
Base Position
ESSEXBasildon 16.1 1.8 0.0 0.5 14.8Braintree 10.6 1.2 0.0 0.3 9.7Brentwood 4.4 0.5 0.0 0.2 4.0Castle Point 6.8 0.9 0.0 0.2 6.1Chelmsford 10.7 1.9 0.0 0.8 9.5Colchester 13.1 2.5 0.0 0.6 11.2Epping Forest 9.4 0.5 0.0 0.1 8.9Harlow 8.2 1.4 0.0 0.4 7.1Maldon 4.6 0.5 0.0 0.1 4.2Rochford 5.2 0.8 0.0 0.1 4.6Tendring 14.6 1.6 0.0 0.5 13.5Uttlesford 3.9 0.2 0.0 0.1 3.7
GLOUCESTERSHIRECheltenham 8.7 1.4 0.0 0.6 7.9Cotswold 5.5 0.1 0.0 0.2 5.5Forest of Dean 7.0 0.6 0.0 0.2 6.6Gloucester 10.8 1.2 0.0 0.5 10.1Stroud 7.3 0.8 0.0 0.2 6.7Tewkesbury 5.4 0.6 0.0 0.1 4.9
HAMPSHIREBasingstoke and Deane 10.3 2.3 0.0 0.4 8.4East Hampshire 5.9 0.5 0.0 0.1 5.5Eastleigh 7.8 1.1 0.0 0.3 7.1Fareham 6.1 1.5 0.0 0.7 5.3Gosport 7.1 1.2 0.0 0.2 6.2Hart 3.9 0.2 0.0 0.1 3.8Havant 9.9 1.2 0.0 0.3 9.0New Forest 11.8 1.0 0.0 0.5 11.3Rushmoor 6.3 0.8 0.0 0.4 5.9Test Valley 7.3 1.0 0.0 0.3 6.6Winchester 6.7 0.9 0.0 0.3 6.0
HERTFORDSHIREBroxbourne 7.0 1.1 0.0 0.4 6.3Dacorum 9.5 1.8 0.0 0.3 8.0East Hertfordshire 8.1 0.9 0.0 0.3 7.5Hertsmere 6.8 0.6 0.0 0.2 6.4North Hertfordshire 8.3 1.0 0.0 0.3 7.5St Albans 7.0 0.3 0.0 0.7 7.4Stevenage 7.6 1.6 0.0 0.4 6.4Three Rivers 5.1 0.8 0.0 0.1 4.4Watford 7.2 1.2 0.0 0.6 6.6Welwyn Hatfield 8.2 1.0 0.0 0.3 7.5
Formula Grant Before Floor Damping
(£ million) (%) (£ million) (%)
Difference from Base PositionOption CONCF7 Option CONCF8
-0.9 -5.9% -0.9 -5.9%-0.8 -8.0% -0.8 -8.0%-0.3 -7.1% -0.3 -7.1%-0.2 -3.5% -0.2 -3.5%-0.2 -2.1% -0.2 -2.1%0.1 1.0% 0.1 1.0%
-0.9 -10.0% -0.9 -10.0%0.1 1.1% 0.1 1.1%
-0.4 -9.1% -0.4 -9.1%-0.2 -3.3% -0.2 -3.3%-1.2 -8.9% -1.2 -8.9%-0.6 -17.0% -0.6 -17.0%
-0.4 -4.5% -0.4 -4.5%-1.2 -20.8% -1.2 -20.8%-0.8 -12.3% -0.8 -12.3%-0.7 -6.7% -0.7 -6.7%-0.7 -10.2% -0.7 -10.2%-0.4 -8.8% -0.4 -8.8%
0.5 6.3% 0.5 6.3%-0.6 -10.5% -0.6 -10.5%-0.2 -2.7% -0.2 -2.7%-0.1 -1.6% -0.1 -1.6%0.2 3.3% 0.2 3.3%
-0.4 -11.5% -0.4 -11.5%-0.5 -5.1% -0.5 -5.1%-1.4 -12.0% -1.4 -12.0%-0.3 -4.9% -0.3 -4.9%-0.4 -6.2% -0.4 -6.2%-0.4 -6.9% -0.4 -6.9%
-0.2 -3.2% -0.2 -3.2%0.2 1.9% 0.2 1.9%
-0.6 -7.6% -0.6 -7.6%-0.5 -8.2% -0.5 -8.2%-0.5 -6.2% -0.5 -6.2%-1.4 -18.9% -1.4 -18.9%0.4 5.7% 0.4 5.7%0.0 -0.6% 0.0 -0.6%
-0.1 -2.1% -0.1 -2.1%-0.3 -3.7% -0.3 -3.7%
273
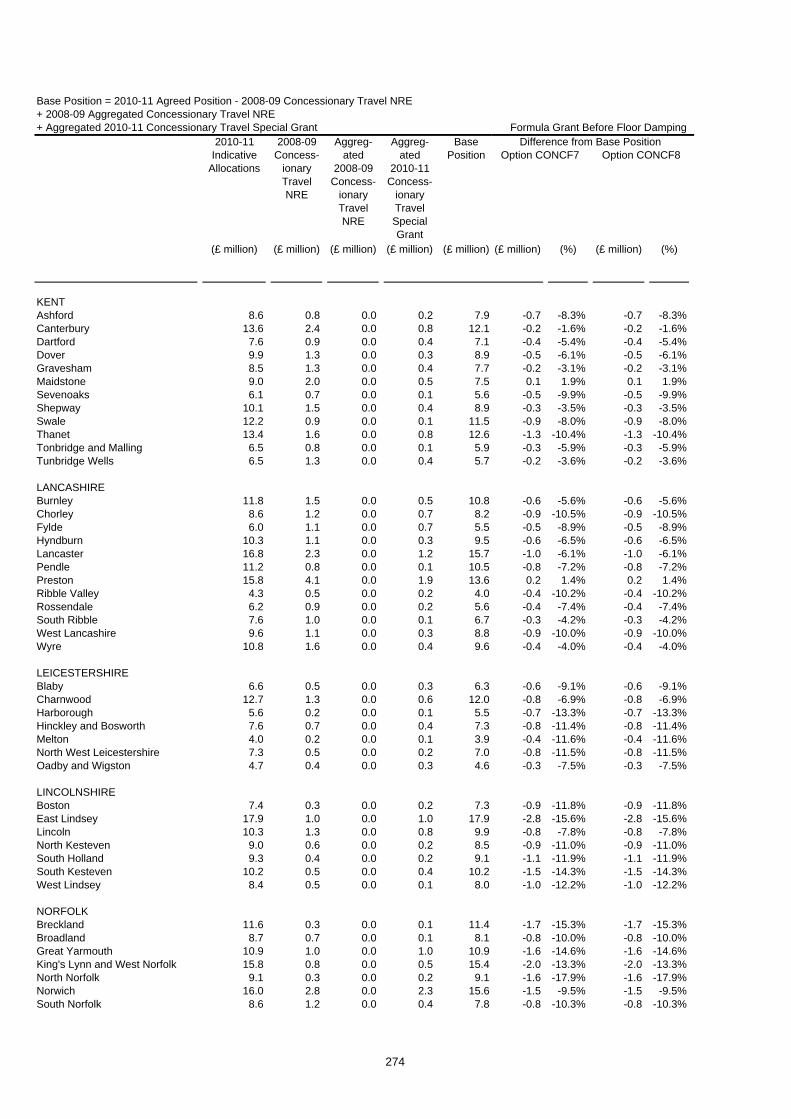
(£ million) (£ million) (£ million) (£ million) (£ million)
Base Position = 2010-11 Agreed Position - 2008-09 Concessionary Travel NRE + 2008-09 Aggregated Concessionary Travel NRE + Aggregated 2010-11 Concessionary Travel Special Grant
2010-11 Indicative
Allocations
2008-09 Concess-
ionary Travel NRE
Aggreg-ated
2008-09 Concess-
ionary Travel NRE
Aggreg-ated
2010-11 Concess-
ionary Travel Special Grant
Base Position
KENTAshford 8.6 0.8 0.0 0.2 7.9Canterbury 13.6 2.4 0.0 0.8 12.1Dartford 7.6 0.9 0.0 0.4 7.1Dover 9.9 1.3 0.0 0.3 8.9Gravesham 8.5 1.3 0.0 0.4 7.7Maidstone 9.0 2.0 0.0 0.5 7.5Sevenoaks 6.1 0.7 0.0 0.1 5.6Shepway 10.1 1.5 0.0 0.4 8.9Swale 12.2 0.9 0.0 0.1 11.5Thanet 13.4 1.6 0.0 0.8 12.6Tonbridge and Malling 6.5 0.8 0.0 0.1 5.9Tunbridge Wells 6.5 1.3 0.0 0.4 5.7
LANCASHIREBurnley 11.8 1.5 0.0 0.5 10.8Chorley 8.6 1.2 0.0 0.7 8.2Fylde 6.0 1.1 0.0 0.7 5.5Hyndburn 10.3 1.1 0.0 0.3 9.5Lancaster 16.8 2.3 0.0 1.2 15.7Pendle 11.2 0.8 0.0 0.1 10.5Preston 15.8 4.1 0.0 1.9 13.6Ribble Valley 4.3 0.5 0.0 0.2 4.0Rossendale 6.2 0.9 0.0 0.2 5.6South Ribble 7.6 1.0 0.0 0.1 6.7West Lancashire 9.6 1.1 0.0 0.3 8.8Wyre 10.8 1.6 0.0 0.4 9.6
LEICESTERSHIREBlaby 6.6 0.5 0.0 0.3 6.3Charnwood 12.7 1.3 0.0 0.6 12.0Harborough 5.6 0.2 0.0 0.1 5.5Hinckley and Bosworth 7.6 0.7 0.0 0.4 7.3Melton 4.0 0.2 0.0 0.1 3.9North West Leicestershire 7.3 0.5 0.0 0.2 7.0Oadby and Wigston 4.7 0.4 0.0 0.3 4.6
LINCOLNSHIREBoston 7.4 0.3 0.0 0.2 7.3East Lindsey 17.9 1.0 0.0 1.0 17.9Lincoln 10.3 1.3 0.0 0.8 9.9North Kesteven 9.0 0.6 0.0 0.2 8.5South Holland 9.3 0.4 0.0 0.2 9.1South Kesteven 10.2 0.5 0.0 0.4 10.2West Lindsey 8.4 0.5 0.0 0.1 8.0
NORFOLKBreckland 11.6 0.3 0.0 0.1 11.4Broadland 8.7 0.7 0.0 0.1 8.1Great Yarmouth 10.9 1.0 0.0 1.0 10.9King's Lynn and West Norfolk 15.8 0.8 0.0 0.5 15.4North Norfolk 9.1 0.3 0.0 0.2 9.1Norwich 16.0 2.8 0.0 2.3 15.6South Norfolk 8.6 1.2 0.0 0.4 7.8
Formula Grant Before Floor Damping
(£ million) (%) (£ million) (%)
Difference from Base PositionOption CONCF7 Option CONCF8
-0.7 -8.3% -0.7 -8.3%-0.2 -1.6% -0.2 -1.6%-0.4 -5.4% -0.4 -5.4%-0.5 -6.1% -0.5 -6.1%-0.2 -3.1% -0.2 -3.1%0.1 1.9% 0.1 1.9%
-0.5 -9.9% -0.5 -9.9%-0.3 -3.5% -0.3 -3.5%-0.9 -8.0% -0.9 -8.0%-1.3 -10.4% -1.3 -10.4%-0.3 -5.9% -0.3 -5.9%-0.2 -3.6% -0.2 -3.6%
-0.6 -5.6% -0.6 -5.6%-0.9 -10.5% -0.9 -10.5%-0.5 -8.9% -0.5 -8.9%-0.6 -6.5% -0.6 -6.5%-1.0 -6.1% -1.0 -6.1%-0.8 -7.2% -0.8 -7.2%0.2 1.4% 0.2 1.4%
-0.4 -10.2% -0.4 -10.2%-0.4 -7.4% -0.4 -7.4%-0.3 -4.2% -0.3 -4.2%-0.9 -10.0% -0.9 -10.0%-0.4 -4.0% -0.4 -4.0%
-0.6 -9.1% -0.6 -9.1%-0.8 -6.9% -0.8 -6.9%-0.7 -13.3% -0.7 -13.3%-0.8 -11.4% -0.8 -11.4%-0.4 -11.6% -0.4 -11.6%-0.8 -11.5% -0.8 -11.5%-0.3 -7.5% -0.3 -7.5%
-0.9 -11.8% -0.9 -11.8%-2.8 -15.6% -2.8 -15.6%-0.8 -7.8% -0.8 -7.8%-0.9 -11.0% -0.9 -11.0%-1.1 -11.9% -1.1 -11.9%-1.5 -14.3% -1.5 -14.3%-1.0 -12.2% -1.0 -12.2%
-1.7 -15.3% -1.7 -15.3%-0.8 -10.0% -0.8 -10.0%-1.6 -14.6% -1.6 -14.6%-2.0 -13.3% -2.0 -13.3%-1.6 -17.9% -1.6 -17.9%-1.5 -9.5% -1.5 -9.5%-0.8 -10.3% -0.8 -10.3%
274

(£ million) (£ million) (£ million) (£ million) (£ million)
Base Position = 2010-11 Agreed Position - 2008-09 Concessionary Travel NRE + 2008-09 Aggregated Concessionary Travel NRE + Aggregated 2010-11 Concessionary Travel Special Grant
2010-11 Indicative
Allocations
2008-09 Concess-
ionary Travel NRE
Aggreg-ated
2008-09 Concess-
ionary Travel NRE
Aggreg-ated
2010-11 Concess-
ionary Travel Special Grant
Base Position
NORTH YORKSHIRECraven 4.3 0.4 0.0 0.3 4.1Hambleton 5.9 0.2 0.0 0.3 5.9Harrogate 11.5 1.5 0.0 1.5 11.5Richmondshire 4.4 0.2 0.0 0.2 4.4Ryedale 4.7 0.3 0.0 0.2 4.6Scarborough 12.6 2.0 0.0 1.2 11.8Selby 6.8 0.5 0.0 0.2 6.5
NORTHAMPTONSHIRECorby 5.6 0.5 0.0 0.3 5.5Daventry 6.4 0.4 0.0 0.2 6.2East Northamptonshire 6.9 0.3 0.0 0.3 6.8Kettering 7.4 1.0 0.0 0.6 7.0Northampton 18.9 2.0 0.0 0.7 17.6South Northamptonshire 6.1 0.2 0.0 0.1 5.9Wellingborough 7.1 0.6 0.0 0.3 6.8
NOTTINGHAMSHIREAshfield 11.6 1.3 0.0 0.4 10.8Bassetlaw 11.4 1.2 0.0 0.3 10.6Broxtowe 9.1 0.9 0.0 0.3 8.5Gedling 9.4 1.2 0.0 0.3 8.5Mansfield 10.3 1.3 0.0 0.7 9.6Newark and Sherwood 10.5 1.0 0.0 0.3 9.9Rushcliffe 7.3 0.6 0.0 0.2 6.9
OXFORDSHIRECherwell 11.2 0.9 0.0 0.2 10.5Oxford 16.9 3.2 0.0 3.1 16.9South Oxfordshire 7.8 0.6 0.0 0.2 7.4Vale of White Horse 7.2 0.7 0.0 0.5 7.0West Oxfordshire 6.1 0.7 0.0 0.1 5.5
SOMERSETMendip 8.5 1.0 0.0 0.3 7.9Sedgemoor 10.3 0.9 0.0 0.4 9.7South Somerset 11.2 1.6 0.0 0.4 10.0Taunton Deane 8.9 1.5 0.0 0.4 7.8West Somerset 3.3 0.1 0.0 0.1 3.4
STAFFORDSHIRECannock Chase 8.6 1.1 0.0 0.3 7.9East Staffordshire 9.6 1.4 0.0 0.4 8.6Lichfield 6.1 0.5 0.0 0.2 5.8Newcastle-under-Lyme 11.3 1.4 0.0 0.4 10.3South Staffordshire 7.2 1.1 0.0 0.2 6.3Stafford 8.8 1.6 0.0 0.5 7.7Staffordshire Moorlands 7.6 0.7 0.0 0.3 7.1Tamworth 6.9 0.6 0.0 0.3 6.6
Formula Grant Before Floor Damping
(£ million) (%) (£ million) (%)
Difference from Base PositionOption CONCF7 Option CONCF8
-0.6 -13.8% -0.6 -13.8%-1.1 -19.3% -1.1 -19.3%-1.7 -14.5% -1.7 -14.5%-0.7 -15.4% -0.7 -15.4%-0.8 -16.7% -0.8 -16.7%-0.9 -8.1% -0.9 -8.1%-0.6 -9.7% -0.6 -9.7%
-0.6 -10.5% -0.6 -10.5%-0.8 -12.5% -0.8 -12.5%-0.9 -13.2% -0.9 -13.2%-0.6 -9.0% -0.6 -9.0%-0.9 -5.0% -0.9 -5.0%-0.8 -13.6% -0.8 -13.6%-0.6 -9.5% -0.6 -9.5%
-0.9 -7.9% -0.9 -7.9%-1.0 -9.3% -1.0 -9.3%-0.6 -6.9% -0.6 -6.9%-0.4 -4.5% -0.4 -4.5%-1.0 -10.1% -1.0 -10.1%-0.9 -9.4% -0.9 -9.4%-0.6 -9.0% -0.6 -9.0%
-0.7 -6.8% -0.7 -6.8%-1.4 -8.0% -1.4 -8.0%-0.8 -10.8% -0.8 -10.8%-0.8 -12.1% -0.8 -12.1%-0.5 -8.3% -0.5 -8.3%
-0.8 -9.5% -0.8 -9.5%-1.0 -10.1% -1.0 -10.1%-0.8 -7.7% -0.8 -7.7%-0.3 -3.3% -0.3 -3.3%-0.7 -19.9% -0.7 -19.9%
-0.5 -6.6% -0.5 -6.6%-0.3 -3.9% -0.3 -3.9%-0.8 -13.2% -0.8 -13.2%-0.7 -7.0% -0.7 -7.0%-0.3 -4.8% -0.3 -4.8%-0.3 -4.5% -0.3 -4.5%-0.9 -12.7% -0.9 -12.7%-0.6 -8.9% -0.6 -8.9%
275
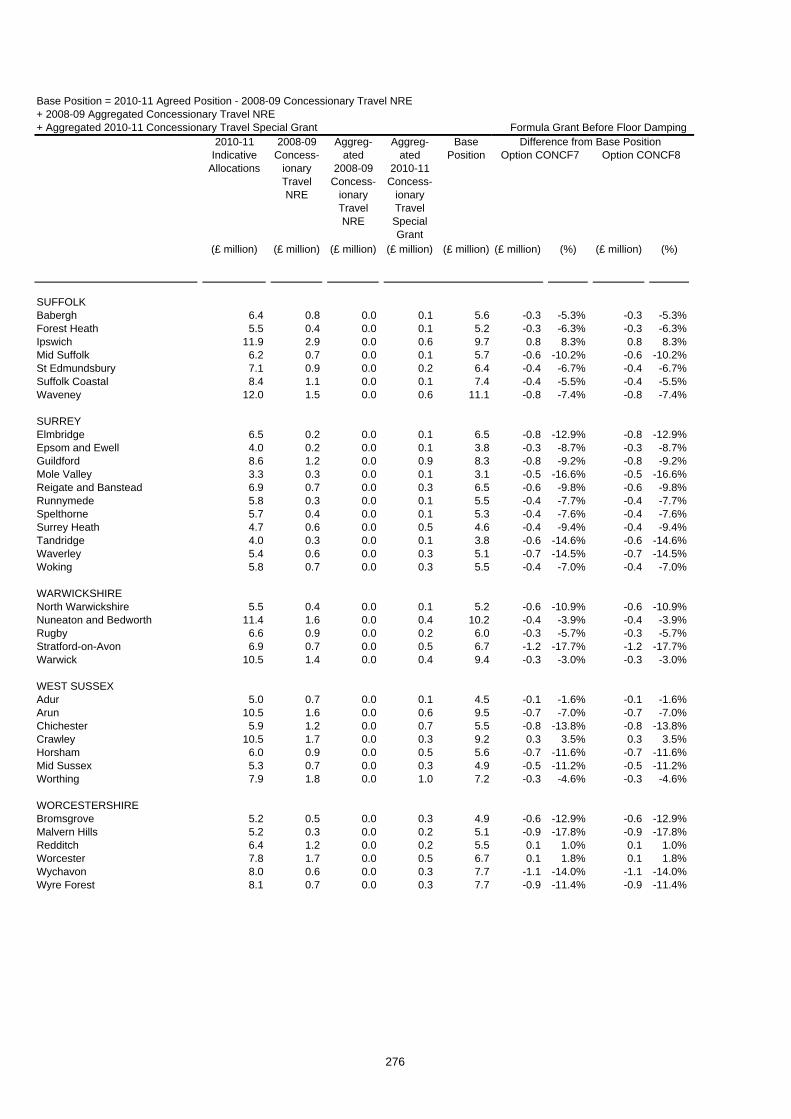
(£ million) (£ million) (£ million) (£ million) (£ million)
Base Position = 2010-11 Agreed Position - 2008-09 Concessionary Travel NRE + 2008-09 Aggregated Concessionary Travel NRE + Aggregated 2010-11 Concessionary Travel Special Grant
2010-11 Indicative
Allocations
2008-09 Concess-
ionary Travel NRE
Aggreg-ated
2008-09 Concess-
ionary Travel NRE
Aggreg-ated
2010-11 Concess-
ionary Travel Special Grant
Base Position
SUFFOLKBabergh 6.4 0.8 0.0 0.1 5.6Forest Heath 5.5 0.4 0.0 0.1 5.2Ipswich 11.9 2.9 0.0 0.6 9.7Mid Suffolk 6.2 0.7 0.0 0.1 5.7St Edmundsbury 7.1 0.9 0.0 0.2 6.4Suffolk Coastal 8.4 1.1 0.0 0.1 7.4Waveney 12.0 1.5 0.0 0.6 11.1
SURREYElmbridge 6.5 0.2 0.0 0.1 6.5Epsom and Ewell 4.0 0.2 0.0 0.1 3.8Guildford 8.6 1.2 0.0 0.9 8.3Mole Valley 3.3 0.3 0.0 0.1 3.1Reigate and Banstead 6.9 0.7 0.0 0.3 6.5Runnymede 5.8 0.3 0.0 0.1 5.5Spelthorne 5.7 0.4 0.0 0.1 5.3Surrey Heath 4.7 0.6 0.0 0.5 4.6Tandridge 4.0 0.3 0.0 0.1 3.8Waverley 5.4 0.6 0.0 0.3 5.1Woking 5.8 0.7 0.0 0.3 5.5
WARWICKSHIRENorth Warwickshire 5.5 0.4 0.0 0.1 5.2Nuneaton and Bedworth 11.4 1.6 0.0 0.4 10.2Rugby 6.6 0.9 0.0 0.2 6.0Stratford-on-Avon 6.9 0.7 0.0 0.5 6.7Warwick 10.5 1.4 0.0 0.4 9.4
WEST SUSSEXAdur 5.0 0.7 0.0 0.1 4.5Arun 10.5 1.6 0.0 0.6 9.5Chichester 5.9 1.2 0.0 0.7 5.5Crawley 10.5 1.7 0.0 0.3 9.2Horsham 6.0 0.9 0.0 0.5 5.6Mid Sussex 5.3 0.7 0.0 0.3 4.9Worthing 7.9 1.8 0.0 1.0 7.2
WORCESTERSHIREBromsgrove 5.2 0.5 0.0 0.3 4.9Malvern Hills 5.2 0.3 0.0 0.2 5.1Redditch 6.4 1.2 0.0 0.2 5.5Worcester 7.8 1.7 0.0 0.5 6.7Wychavon 8.0 0.6 0.0 0.3 7.7Wyre Forest 8.1 0.7 0.0 0.3 7.7
Formula Grant Before Floor Damping
(£ million) (%) (£ million) (%)
Difference from Base PositionOption CONCF7 Option CONCF8
-0.3 -5.3% -0.3 -5.3%-0.3 -6.3% -0.3 -6.3%0.8 8.3% 0.8 8.3%
-0.6 -10.2% -0.6 -10.2%-0.4 -6.7% -0.4 -6.7%-0.4 -5.5% -0.4 -5.5%-0.8 -7.4% -0.8 -7.4%
-0.8 -12.9% -0.8 -12.9%-0.3 -8.7% -0.3 -8.7%-0.8 -9.2% -0.8 -9.2%-0.5 -16.6% -0.5 -16.6%-0.6 -9.8% -0.6 -9.8%-0.4 -7.7% -0.4 -7.7%-0.4 -7.6% -0.4 -7.6%-0.4 -9.4% -0.4 -9.4%-0.6 -14.6% -0.6 -14.6%-0.7 -14.5% -0.7 -14.5%-0.4 -7.0% -0.4 -7.0%
-0.6 -10.9% -0.6 -10.9%-0.4 -3.9% -0.4 -3.9%-0.3 -5.7% -0.3 -5.7%-1.2 -17.7% -1.2 -17.7%-0.3 -3.0% -0.3 -3.0%
-0.1 -1.6% -0.1 -1.6%-0.7 -7.0% -0.7 -7.0%-0.8 -13.8% -0.8 -13.8%0.3 3.5% 0.3 3.5%
-0.7 -11.6% -0.7 -11.6%-0.5 -11.2% -0.5 -11.2%-0.3 -4.6% -0.3 -4.6%
-0.6 -12.9% -0.6 -12.9%-0.9 -17.8% -0.9 -17.8%0.1 1.0% 0.1 1.0%0.1 1.8% 0.1 1.8%
-1.1 -14.0% -1.1 -14.0%-0.9 -11.4% -0.9 -11.4%
276

(£ million) (£ million) (£ million) (£ million) (£ million)
Base Position = 2010-11 Agreed Position - 2008-09 Concessionary Travel NRE + 2008-09 Aggregated Concessionary Travel NRE + Aggregated 2010-11 Concessionary Travel Special Grant
2010-11 Indicative
Allocations
2008-09 Concess-
ionary Travel NRE
Aggreg-ated
2008-09 Concess-
ionary Travel NRE
Aggreg-ated
2010-11 Concess-
ionary Travel Special Grant
Base Position
SHIRE POLICE AUTHORITIES
Avon & Somerset Police 197.6 0.0 0.0 0.0 197.6Bedfordshire Police 76.6 0.0 0.0 0.0 76.6Cambridgeshire Police 86.2 0.0 0.0 0.0 86.2Cheshire Police 114.1 0.0 0.0 0.0 114.1Cleveland Police 99.0 0.0 0.0 0.0 99.0
Cumbria Police 56.1 0.0 0.0 0.0 56.1Derbyshire Police 120.7 0.0 0.0 0.0 120.7Devon & Cornwall Police 191.7 0.0 0.0 0.0 191.7Dorset Police 64.3 0.0 0.0 0.0 64.3Durham Police 87.0 0.0 0.0 0.0 87.0
Essex Police 187.3 0.0 0.0 0.0 187.3Gloucestershire Police 58.5 0.0 0.0 0.0 58.5Hampshire Police 215.0 0.0 0.0 0.0 215.0Hertfordshire Police 128.9 0.0 0.0 0.0 128.9Humberside Police 132.9 0.0 0.0 0.0 132.9
Kent Police 200.2 0.0 0.0 0.0 200.2Lancashire Police 212.3 0.0 0.0 0.0 212.3Leicestershire Police 124.2 0.0 0.0 0.0 124.2Lincolnshire Police 69.0 0.0 0.0 0.0 69.0Norfolk Police 88.5 0.0 0.0 0.0 88.5
North Yorkshire Police 73.1 0.0 0.0 0.0 73.1Northamptonshire Police 78.4 0.0 0.0 0.0 78.4Nottinghamshire Police 152.7 0.0 0.0 0.0 152.7Staffordshire Police 125.1 0.0 0.0 0.0 125.1Suffolk Police 71.0 0.0 0.0 0.0 71.0
Surrey Police 101.3 0.0 0.0 0.0 101.3Sussex Police 167.1 0.0 0.0 0.0 167.1Thames Valley Police 248.5 0.0 0.0 0.0 248.5Warwickshire Police 56.1 0.0 0.0 0.0 56.1West Mercia Police 114.3 0.0 0.0 0.0 114.3
Wiltshire Police 64.1 0.0 0.0 0.0 64.1
Formula Grant Before Floor Damping
(£ million) (%) (£ million) (%)
Difference from Base PositionOption CONCF7 Option CONCF8
0.0 0.0% 0.0 0.0%0.0 0.0% 0.0 0.0%0.0 0.0% 0.0 0.0%0.0 0.0% 0.0 0.0%0.1 0.1% 0.1 0.1%
0.0 0.0% 0.0 0.0%0.1 0.1% 0.1 0.1%0.0 0.0% 0.0 0.0%
-0.1 -0.1% -0.1 -0.1%0.0 0.0% 0.0 0.0%
-0.1 0.0% -0.1 0.0%0.0 0.0% 0.0 0.0%
-0.1 0.0% -0.1 0.0%-0.1 -0.1% -0.1 -0.1%0.1 0.1% 0.1 0.1%
-0.1 0.0% -0.1 0.0%0.1 0.1% 0.1 0.1%0.1 0.1% 0.1 0.1%0.0 0.1% 0.0 0.1%0.0 0.0% 0.0 0.0%
0.0 0.0% 0.0 0.0%0.0 0.0% 0.0 0.0%0.1 0.1% 0.1 0.1%0.0 0.0% 0.0 0.0%0.0 0.0% 0.0 0.0%
-0.2 -0.2% -0.2 -0.2%-0.1 -0.1% -0.1 -0.1%-0.2 -0.1% -0.2 -0.1%0.0 0.0% 0.0 0.0%0.0 0.0% 0.0 0.0%
0.0 -0.1% 0.0 -0.1%
277
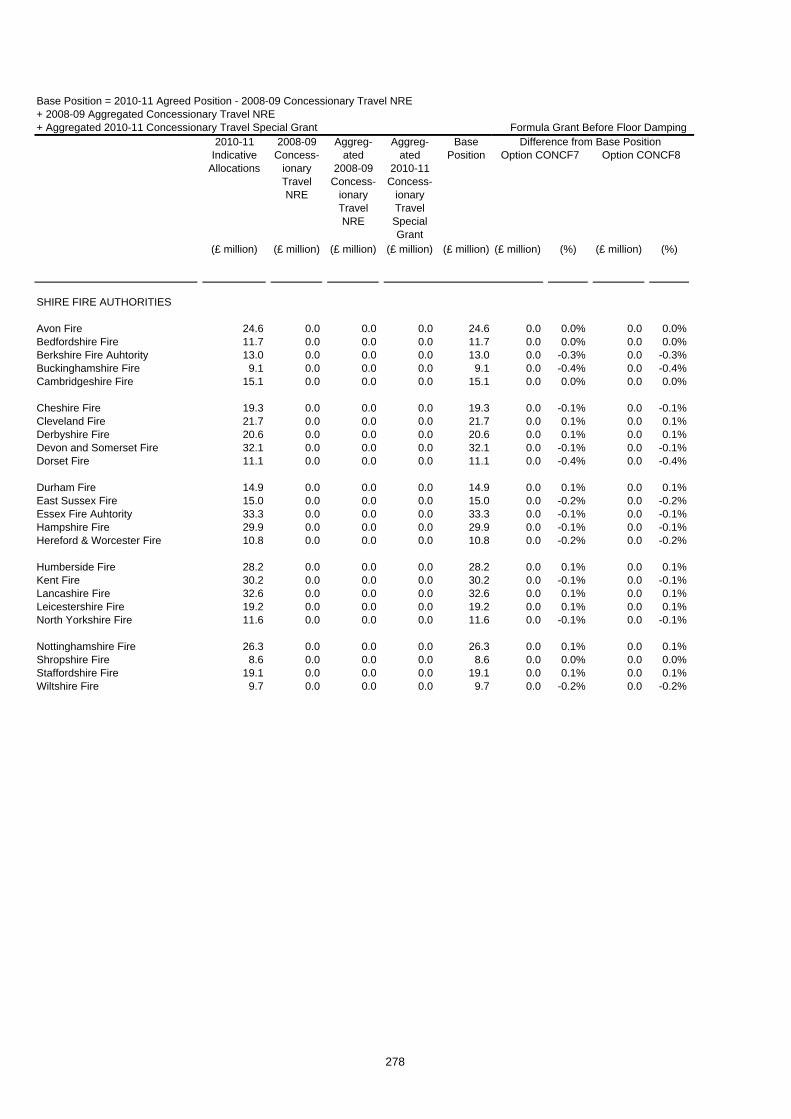
(£ million) (£ million) (£ million) (£ million) (£ million)
Base Position = 2010-11 Agreed Position - 2008-09 Concessionary Travel NRE + 2008-09 Aggregated Concessionary Travel NRE + Aggregated 2010-11 Concessionary Travel Special Grant
2010-11 Indicative
Allocations
2008-09 Concess-
ionary Travel NRE
Aggreg-ated
2008-09 Concess-
ionary Travel NRE
Aggreg-ated
2010-11 Concess-
ionary Travel Special Grant
Base Position
SHIRE FIRE AUTHORITIES
Avon Fire 24.6 0.0 0.0 0.0 24.6Bedfordshire Fire 11.7 0.0 0.0 0.0 11.7Berkshire Fire Auhtority 13.0 0.0 0.0 0.0 13.0Buckinghamshire Fire 9.1 0.0 0.0 0.0 9.1Cambridgeshire Fire 15.1 0.0 0.0 0.0 15.1
Cheshire Fire 19.3 0.0 0.0 0.0 19.3Cleveland Fire 21.7 0.0 0.0 0.0 21.7Derbyshire Fire 20.6 0.0 0.0 0.0 20.6Devon and Somerset Fire 32.1 0.0 0.0 0.0 32.1Dorset Fire 11.1 0.0 0.0 0.0 11.1
Durham Fire 14.9 0.0 0.0 0.0 14.9East Sussex Fire 15.0 0.0 0.0 0.0 15.0Essex Fire Auhtority 33.3 0.0 0.0 0.0 33.3Hampshire Fire 29.9 0.0 0.0 0.0 29.9Hereford & Worcester Fire 10.8 0.0 0.0 0.0 10.8
Humberside Fire 28.2 0.0 0.0 0.0 28.2Kent Fire 30.2 0.0 0.0 0.0 30.2Lancashire Fire 32.6 0.0 0.0 0.0 32.6Leicestershire Fire 19.2 0.0 0.0 0.0 19.2North Yorkshire Fire 11.6 0.0 0.0 0.0 11.6
Nottinghamshire Fire 26.3 0.0 0.0 0.0 26.3Shropshire Fire 8.6 0.0 0.0 0.0 8.6Staffordshire Fire 19.1 0.0 0.0 0.0 19.1Wiltshire Fire 9.7 0.0 0.0 0.0 9.7
Formula Grant Before Floor Damping
(£ million) (%) (£ million) (%)
Difference from Base PositionOption CONCF7 Option CONCF8
0.0 0.0% 0.0 0.0%0.0 0.0% 0.0 0.0%0.0 -0.3% 0.0 -0.3%0.0 -0.4% 0.0 -0.4%0.0 0.0% 0.0 0.0%
0.0 -0.1% 0.0 -0.1%0.0 0.1% 0.0 0.1%0.0 0.1% 0.0 0.1%0.0 -0.1% 0.0 -0.1%0.0 -0.4% 0.0 -0.4%
0.0 0.1% 0.0 0.1%0.0 -0.2% 0.0 -0.2%0.0 -0.1% 0.0 -0.1%0.0 -0.1% 0.0 -0.1%0.0 -0.2% 0.0 -0.2%
0.0 0.1% 0.0 0.1%0.0 -0.1% 0.0 -0.1%0.0 0.1% 0.0 0.1%0.0 0.1% 0.0 0.1%0.0 -0.1% 0.0 -0.1%
0.0 0.1% 0.0 0.1%0.0 0.0% 0.0 0.0%0.0 0.1% 0.0 0.1%0.0 -0.2% 0.0 -0.2%
278
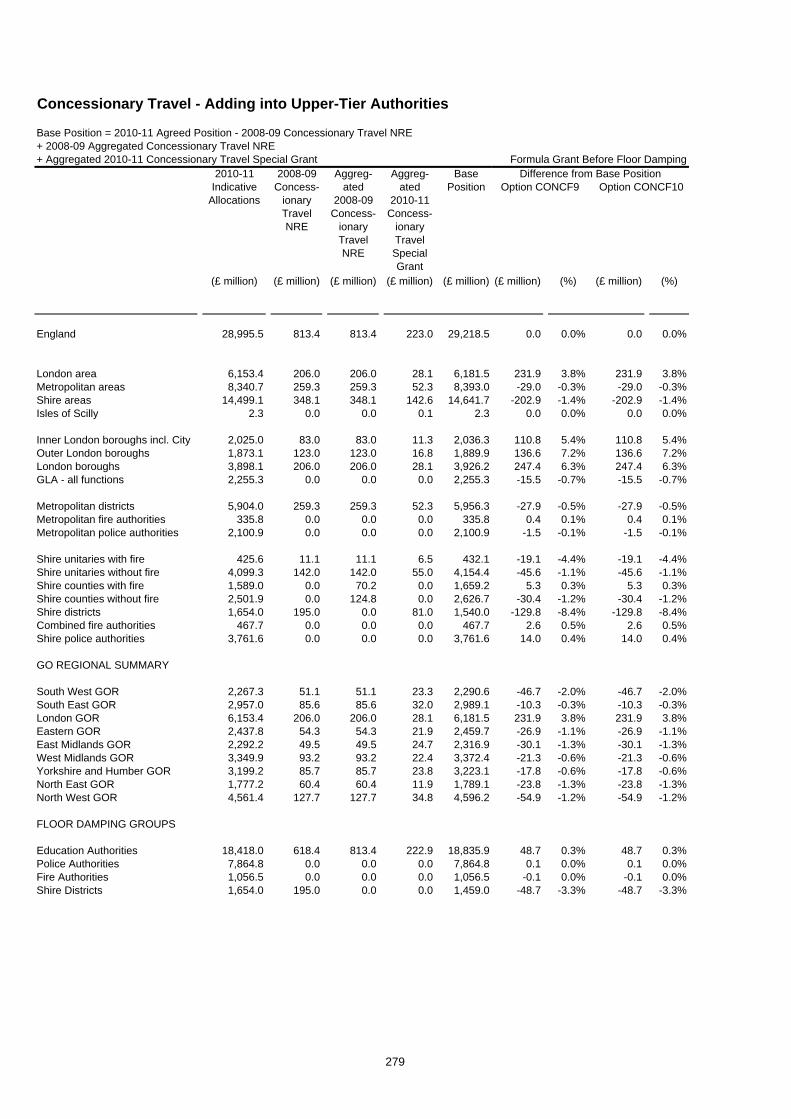
Concessionary Travel - Adding into Upper-Tier Authorities
(£ million) (£ million) (£ million) (£ million) (£ million)
England 28,995.5 813.4 813.4 223.0 29,218.5
London area 6,153.4 206.0 206.0 28.1 6,181.5Metropolitan areas 8,340.7 259.3 259.3 52.3 8,393.0Shire areas 14,499.1 348.1 348.1 142.6 14,641.7Isles of Scilly 2.3 0.0 0.0 0.1 2.3
Inner London boroughs incl. City 2,025.0 83.0 83.0 11.3 2,036.3Outer London boroughs 1,873.1 123.0 123.0 16.8 1,889.9London boroughs 3,898.1 206.0 206.0 28.1 3,926.2GLA - all functions 2,255.3 0.0 0.0 0.0 2,255.3
Metropolitan districts 5,904.0 259.3 259.3 52.3 5,956.3Metropolitan fire authorities 335.8 0.0 0.0 0.0 335.8Metropolitan police authorities 2,100.9 0.0 0.0 0.0 2,100.9
Shire unitaries with fire 425.6 11.1 11.1 6.5 432.1Shire unitaries without fire 4,099.3 142.0 142.0 55.0 4,154.4Shire counties with fire 1,589.0 0.0 70.2 0.0 1,659.2Shire counties without fire 2,501.9 0.0 124.8 0.0 2,626.7Shire districts 1,654.0 195.0 0.0 81.0 1,540.0Combined fire authorities 467.7 0.0 0.0 0.0 467.7Shire police authorities 3,761.6 0.0 0.0 0.0 3,761.6
GO REGIONAL SUMMARY
South West GOR 2,267.3 51.1 51.1 23.3 2,290.6South East GOR 2,957.0 85.6 85.6 32.0 2,989.1London GOR 6,153.4 206.0 206.0 28.1 6,181.5Eastern GOR 2,437.8 54.3 54.3 21.9 2,459.7East Midlands GOR 2,292.2 49.5 49.5 24.7 2,316.9West Midlands GOR 3,349.9 93.2 93.2 22.4 3,372.4Yorkshire and Humber GOR 3,199.2 85.7 85.7 23.8 3,223.1North East GOR 1,777.2 60.4 60.4 11.9 1,789.1North West GOR 4,561.4 127.7 127.7 34.8 4,596.2
FLOOR DAMPING GROUPS
Education Authorities 18,418.0 618.4 813.4 222.9 18,835.9Police Authorities 7,864.8 0.0 0.0 0.0 7,864.8Fire Authorities 1,056.5 0.0 0.0 0.0 1,056.5Shire Districts 1,654.0 195.0 0.0 0.0 1,459.0
Base Position = 2010-11 Agreed Position - 2008-09 Concessionary Travel NRE + 2008-09 Aggregated Concessionary Travel NRE + Aggregated 2010-11 Concessionary Travel Special Grant
2010-11 Indicative
Allocations
2008-09 Concess-
ionary Travel NRE
Aggreg-ated
2008-09 Concess-
ionary Travel NRE
Aggreg-ated
2010-11 Concess-
ionary Travel Special Grant
Base Position
Formula Grant Before Floor Damping
(£ million) (%) (£ million) (%)
0.0 0.0% 0.0 0.0%
231.9 3.8% 231.9 3.8%-29.0 -0.3% -29.0 -0.3%
-202.9 -1.4% -202.9 -1.4%0.0 0.0% 0.0 0.0%
110.8 5.4% 110.8 5.4%136.6 7.2% 136.6 7.2%247.4 6.3% 247.4 6.3%-15.5 -0.7% -15.5 -0.7%
-27.9 -0.5% -27.9 -0.5%0.4 0.1% 0.4 0.1%
-1.5 -0.1% -1.5 -0.1%
-19.1 -4.4% -19.1 -4.4%-45.6 -1.1% -45.6 -1.1%
5.3 0.3% 5.3 0.3%-30.4 -1.2% -30.4 -1.2%
-129.8 -8.4% -129.8 -8.4%2.6 0.5% 2.6 0.5%
14.0 0.4% 14.0 0.4%
-46.7 -2.0% -46.7 -2.0%-10.3 -0.3% -10.3 -0.3%231.9 3.8% 231.9 3.8%-26.9 -1.1% -26.9 -1.1%-30.1 -1.3% -30.1 -1.3%-21.3 -0.6% -21.3 -0.6%-17.8 -0.6% -17.8 -0.6%-23.8 -1.3% -23.8 -1.3%-54.9 -1.2% -54.9 -1.2%
48.7 0.3% 48.7 0.3%0.1 0.0% 0.1 0.0%
-0.1 0.0% -0.1 0.0%-48.7 -3.3% -48.7 -3.3%
Difference from Base PositionOption CONCF9 Option CONCF10
279
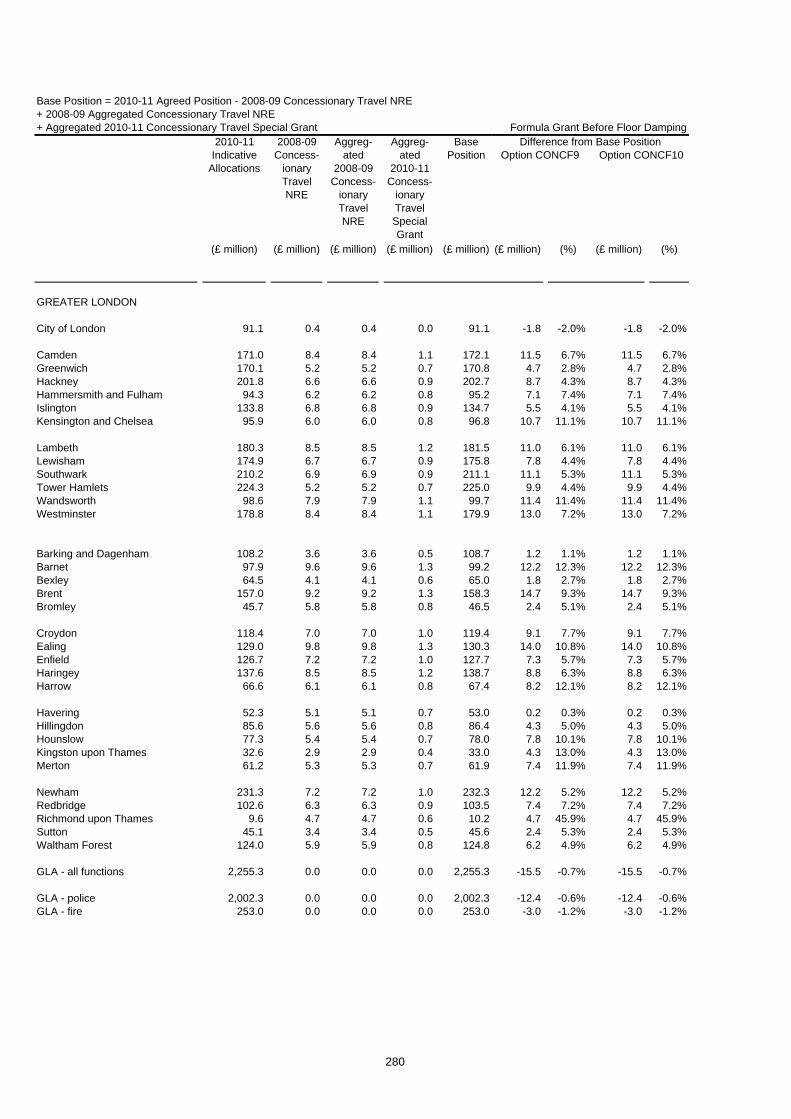
(£ million) (£ million) (£ million) (£ million) (£ million)
Base Position = 2010-11 Agreed Position - 2008-09 Concessionary Travel NRE + 2008-09 Aggregated Concessionary Travel NRE + Aggregated 2010-11 Concessionary Travel Special Grant
2010-11 Indicative
Allocations
2008-09 Concess-
ionary Travel NRE
Aggreg-ated
2008-09 Concess-
ionary Travel NRE
Aggreg-ated
2010-11 Concess-
ionary Travel Special Grant
Base Position
GREATER LONDON
City of London 91.1 0.4 0.4 0.0 91.1
Camden 171.0 8.4 8.4 1.1 172.1Greenwich 170.1 5.2 5.2 0.7 170.8Hackney 201.8 6.6 6.6 0.9 202.7Hammersmith and Fulham 94.3 6.2 6.2 0.8 95.2Islington 133.8 6.8 6.8 0.9 134.7Kensington and Chelsea 95.9 6.0 6.0 0.8 96.8
Lambeth 180.3 8.5 8.5 1.2 181.5Lewisham 174.9 6.7 6.7 0.9 175.8Southwark 210.2 6.9 6.9 0.9 211.1Tower Hamlets 224.3 5.2 5.2 0.7 225.0Wandsworth 98.6 7.9 7.9 1.1 99.7Westminster 178.8 8.4 8.4 1.1 179.9
Barking and Dagenham 108.2 3.6 3.6 0.5 108.7Barnet 97.9 9.6 9.6 1.3 99.2Bexley 64.5 4.1 4.1 0.6 65.0Brent 157.0 9.2 9.2 1.3 158.3Bromley 45.7 5.8 5.8 0.8 46.5
Croydon 118.4 7.0 7.0 1.0 119.4Ealing 129.0 9.8 9.8 1.3 130.3Enfield 126.7 7.2 7.2 1.0 127.7Haringey 137.6 8.5 8.5 1.2 138.7Harrow 66.6 6.1 6.1 0.8 67.4
Havering 52.3 5.1 5.1 0.7 53.0Hillingdon 85.6 5.6 5.6 0.8 86.4Hounslow 77.3 5.4 5.4 0.7 78.0Kingston upon Thames 32.6 2.9 2.9 0.4 33.0Merton 61.2 5.3 5.3 0.7 61.9
Newham 231.3 7.2 7.2 1.0 232.3Redbridge 102.6 6.3 6.3 0.9 103.5Richmond upon Thames 9.6 4.7 4.7 0.6 10.2Sutton 45.1 3.4 3.4 0.5 45.6Waltham Forest 124.0 5.9 5.9 0.8 124.8
GLA - all functions 2,255.3 0.0 0.0 0.0 2,255.3
GLA - police 2,002.3 0.0 0.0 0.0 2,002.3GLA - fire 253.0 0.0 0.0 0.0 253.0
Formula Grant Before Floor Damping
(£ million) (%) (£ million) (%)
Difference from Base PositionOption CONCF9 Option CONCF10
-1.8 -2.0% -1.8 -2.0%
11.5 6.7% 11.5 6.7%4.7 2.8% 4.7 2.8%8.7 4.3% 8.7 4.3%7.1 7.4% 7.1 7.4%5.5 4.1% 5.5 4.1%
10.7 11.1% 10.7 11.1%
11.0 6.1% 11.0 6.1%7.8 4.4% 7.8 4.4%
11.1 5.3% 11.1 5.3%9.9 4.4% 9.9 4.4%
11.4 11.4% 11.4 11.4%13.0 7.2% 13.0 7.2%
1.2 1.1% 1.2 1.1%12.2 12.3% 12.2 12.3%1.8 2.7% 1.8 2.7%
14.7 9.3% 14.7 9.3%2.4 5.1% 2.4 5.1%
9.1 7.7% 9.1 7.7%14.0 10.8% 14.0 10.8%7.3 5.7% 7.3 5.7%8.8 6.3% 8.8 6.3%8.2 12.1% 8.2 12.1%
0.2 0.3% 0.2 0.3%4.3 5.0% 4.3 5.0%7.8 10.1% 7.8 10.1%4.3 13.0% 4.3 13.0%7.4 11.9% 7.4 11.9%
12.2 5.2% 12.2 5.2%7.4 7.2% 7.4 7.2%4.7 45.9% 4.7 45.9%2.4 5.3% 2.4 5.3%6.2 4.9% 6.2 4.9%
-15.5 -0.7% -15.5 -0.7%
-12.4 -0.6% -12.4 -0.6%-3.0 -1.2% -3.0 -1.2%
280

(£ million) (£ million) (£ million) (£ million) (£ million)
Base Position = 2010-11 Agreed Position - 2008-09 Concessionary Travel NRE + 2008-09 Aggregated Concessionary Travel NRE + Aggregated 2010-11 Concessionary Travel Special Grant
2010-11 Indicative
Allocations
2008-09 Concess-
ionary Travel NRE
Aggreg-ated
2008-09 Concess-
ionary Travel NRE
Aggreg-ated
2010-11 Concess-
ionary Travel Special Grant
Base Position
GREATER MANCHESTERBolton 132.6 4.8 4.8 1.1 133.7Bury 67.5 3.3 3.3 0.8 68.2Manchester 346.1 8.4 8.4 2.0 348.1Oldham 127.6 4.0 4.0 0.9 128.5Rochdale 114.9 3.8 3.8 0.9 115.8Salford 131.2 4.0 4.0 1.0 132.2Stockport 85.2 5.1 5.1 1.2 86.4Tameside 109.5 3.9 3.9 0.9 110.5Trafford 67.3 3.9 3.9 0.9 68.2Wigan 138.6 5.6 5.6 1.3 139.9Greater Manchester Fire 76.1 0.0 0.0 0.0 76.1Greater Manchester Police 485.7 0.0 0.0 0.0 485.7
MERSEYSIDEKnowsley 114.6 4.7 4.7 0.9 115.5Liverpool 318.0 13.5 13.5 2.6 320.6Sefton 127.6 8.6 8.6 1.6 129.2St Helens 90.9 5.5 5.5 1.1 92.0Wirral 165.2 9.6 9.6 1.8 167.0Merseyside Fire 46.1 0.0 0.0 0.0 46.1Merseyside Police 275.5 0.0 0.0 0.0 275.5
SOUTH YORKSHIREBarnsley 114.3 5.0 5.0 0.9 115.3Doncaster 149.1 6.5 6.5 1.2 150.3Rotherham 130.1 5.7 5.7 1.1 131.2Sheffield 280.0 11.9 11.9 2.2 282.2South Yorkshire Fire 37.4 0.0 0.0 0.0 37.4South Yorkshire Police 209.2 0.0 0.0 0.0 209.2
TYNE AND WEARGateshead 102.7 6.8 6.8 1.0 103.7Newcastle upon Tyne 157.2 9.8 9.8 1.4 158.6North Tyneside 87.4 7.0 7.0 1.0 88.5South Tyneside 89.3 5.4 5.4 0.8 90.1Sunderland 158.9 10.0 10.0 1.5 160.3Tyne and Wear Fire 35.9 0.0 0.0 0.0 35.9Northumbria Police 219.9 0.0 0.0 0.0 219.9
WEST MIDLANDSBirmingham 698.9 25.6 25.6 5.0 704.0Coventry 156.6 7.8 7.8 1.5 158.1Dudley 130.4 7.7 7.7 1.5 131.9Sandwell 190.3 7.3 7.3 1.4 191.7Solihull 49.1 5.2 5.2 1.0 50.1Walsall 142.3 6.4 6.4 1.3 143.6Wolverhampton 145.6 5.9 5.9 1.2 146.7West Midlands Fire 81.6 0.0 0.0 0.0 81.6West Midlands Police 542.2 0.0 0.0 0.0 542.2
Formula Grant Before Floor Damping
(£ million) (%) (£ million) (%)
Difference from Base PositionOption CONCF9 Option CONCF10
-0.8 -0.6% -0.8 -0.6%-0.5 -0.8% -0.5 -0.8%3.3 0.9% 3.3 0.9%0.2 0.1% 0.2 0.1%
-0.4 -0.3% -0.4 -0.3%-1.7 -1.2% -1.7 -1.2%-1.1 -1.3% -1.1 -1.3%-1.0 -0.9% -1.0 -0.9%-0.1 -0.1% -0.1 -0.1%-4.0 -2.8% -4.0 -2.8%0.1 0.1% 0.1 0.1%
-0.6 -0.1% -0.6 -0.1%
-2.8 -2.4% -2.8 -2.4%-5.6 -1.7% -5.6 -1.7%-3.5 -2.7% -3.5 -2.7%-2.7 -2.9% -2.7 -2.9%-4.3 -2.6% -4.3 -2.6%-0.1 -0.3% -0.1 -0.3%-0.7 -0.2% -0.7 -0.2%
-3.2 -2.8% -3.2 -2.8%-3.3 -2.2% -3.3 -2.2%-2.3 -1.7% -2.3 -1.7%-0.1 -0.1% -0.1 -0.1%0.2 0.4% 0.2 0.4%0.4 0.2% 0.4 0.2%
-1.4 -1.3% -1.4 -1.3%0.2 0.1% 0.2 0.1%
-1.1 -1.2% -1.1 -1.2%-1.3 -1.4% -1.3 -1.4%-3.0 -1.9% -3.0 -1.9%0.0 -0.1% 0.0 -0.1%0.3 0.1% 0.3 0.1%
9.7 1.4% 9.7 1.4%2.0 1.2% 2.0 1.2%
-2.3 -1.7% -2.3 -1.7%-0.3 -0.1% -0.3 -0.1%-1.4 -2.8% -1.4 -2.8%-1.3 -0.9% -1.3 -0.9%0.1 0.1% 0.1 0.1%0.1 0.1% 0.1 0.1%
-1.2 -0.2% -1.2 -0.2%
281

(£ million) (£ million) (£ million) (£ million) (£ million)
Base Position = 2010-11 Agreed Position - 2008-09 Concessionary Travel NRE + 2008-09 Aggregated Concessionary Travel NRE + Aggregated 2010-11 Concessionary Travel Special Grant
2010-11 Indicative
Allocations
2008-09 Concess-
ionary Travel NRE
Aggreg-ated
2008-09 Concess-
ionary Travel NRE
Aggreg-ated
2010-11 Concess-
ionary Travel Special Grant
Base Position
WEST YORKSHIREBradford 283.4 8.3 8.3 2.1 285.4Calderdale 84.1 3.3 3.3 0.8 84.9Kirklees 164.9 6.7 6.7 1.7 166.5Leeds 305.9 12.8 12.8 3.2 309.1Wakefield 146.7 5.3 5.3 1.3 148.1West Yorkshire Fire 58.7 0.0 0.0 0.0 58.7West Yorkshire Police 368.2 0.0 0.0 0.0 368.2
Formula Grant Before Floor Damping
(£ million) (%) (£ million) (%)
Difference from Base PositionOption CONCF9 Option CONCF10
4.1 1.5% 4.1 1.5%0.1 0.1% 0.1 0.1%1.6 0.9% 1.6 0.9%3.1 1.0% 3.1 1.0%
-2.9 -1.9% -2.9 -1.9%0.3 0.5% 0.3 0.5%0.3 0.1% 0.3 0.1%
282

(£ million) (£ million) (£ million) (£ million) (£ million)
Base Position = 2010-11 Agreed Position - 2008-09 Concessionary Travel NRE + 2008-09 Aggregated Concessionary Travel NRE + Aggregated 2010-11 Concessionary Travel Special Grant
2010-11 Indicative
Allocations
2008-09 Concess-
ionary Travel NRE
Aggreg-ated
2008-09 Concess-
ionary Travel NRE
Aggreg-ated
2010-11 Concess-
ionary Travel Special Grant
Base Position
ALL PURPOSE AUTHORITIES
Bath & North East Somerset 44.1 3.0 3.0 1.2 45.3Bedford 55.4 1.7 1.7 0.5 55.9Blackburn with Darwen 88.5 2.4 2.4 0.5 89.0Blackpool 86.9 3.7 3.7 2.3 89.2Bournemouth 49.4 2.8 2.8 1.3 50.7
Bracknell Forest 22.6 0.7 0.7 0.3 22.9Brighton & Hove 89.8 5.8 5.8 1.8 91.6Bristol 171.2 5.8 5.8 1.9 173.1Central Bedfordshire 51.9 1.5 1.5 0.6 52.5Cheshire East 64.5 2.4 2.4 1.0 65.5
Cheshire West & Chester 94.9 3.3 3.3 1.2 96.1Cornwall 227.6 3.4 3.4 3.5 231.0Darlington 40.1 2.8 2.8 1.4 41.5Derby 114.5 5.8 5.8 3.8 118.4Durham 238.7 7.6 7.6 1.5 240.2
East Riding of Yorkshire 109.2 3.2 3.2 0.9 110.1Halton 65.5 1.7 1.7 0.3 65.8Hartlepool 54.0 1.3 1.3 0.4 54.3Herefordshire 61.2 1.6 1.6 0.7 61.9Isle of Wight Council 65.0 4.9 4.9 1.8 66.7
Kingston upon Hull 159.2 5.3 5.3 1.9 161.1Leicester 188.4 5.4 5.4 2.3 190.8Luton 94.6 3.3 3.3 2.0 96.7Medway 89.5 3.0 3.0 0.7 90.2Middlesbrough 85.4 2.3 2.3 0.6 86.0
Milton Keynes 91.6 1.8 1.8 0.8 92.4North East Lincolnshire 76.9 1.6 1.6 0.6 77.6North Lincolnshire 66.3 1.3 1.3 0.5 66.8North Somerset 54.6 2.0 2.0 0.7 55.3Northumberland 133.1 2.7 2.7 1.3 134.3
Nottingham 179.5 7.5 7.5 4.4 183.9Peterborough 80.9 2.1 2.1 1.5 82.4Plymouth 108.7 3.9 3.9 1.1 109.8Poole 25.6 2.0 2.0 0.6 26.3Portsmouth 87.8 3.1 3.1 0.9 88.7
Reading 48.0 2.1 2.1 1.0 49.0Redcar and Cleveland 71.4 2.1 2.1 0.4 71.9Rutland 8.6 0.0 0.0 0.1 8.7Shropshire 97.4 1.9 1.9 0.9 98.3Slough 52.8 1.8 1.8 1.1 53.9
South Gloucestershire 64.0 1.8 1.8 0.3 64.3Southampton 101.2 2.5 2.5 1.1 102.3Southend-on-Sea 62.3 1.7 1.7 0.3 62.6Stockton-on-Tees 80.6 2.5 2.5 0.7 81.3Stoke-on-Trent 133.5 4.0 4.0 1.2 134.6
Formula Grant Before Floor Damping
(£ million) (%) (£ million) (%)
Difference from Base PositionOption CONCF9 Option CONCF10
-0.3 -0.6% -0.3 -0.6%0.8 1.4% 0.8 1.4%0.5 0.5% 0.5 0.5%
-3.1 -3.5% -3.1 -3.5%-1.6 -3.2% -1.6 -3.2%
0.5 2.0% 0.5 2.0%1.1 1.2% 1.1 1.2%2.0 1.2% 2.0 1.2%
-0.7 -1.3% -0.7 -1.3%-3.2 -4.8% -3.2 -4.8%
-3.5 -3.7% -3.5 -3.7%-11.1 -4.8% -11.1 -4.8%-1.7 -4.1% -1.7 -4.1%-2.3 -1.9% -2.3 -1.9%-6.6 -2.7% -6.6 -2.7%
-4.0 -3.6% -4.0 -3.6%-1.8 -2.7% -1.8 -2.7%-1.1 -2.0% -1.1 -2.0%-3.5 -5.7% -3.5 -5.7%-3.4 -5.1% -3.4 -5.1%
-1.6 -1.0% -1.6 -1.0%5.0 2.6% 5.0 2.6%1.9 2.0% 1.9 2.0%1.1 1.2% 1.1 1.2%
-1.1 -1.3% -1.1 -1.3%
0.4 0.5% 0.4 0.5%-0.8 -1.1% -0.8 -1.1%-1.7 -2.6% -1.7 -2.6%-1.9 -3.4% -1.9 -3.4%-4.5 -3.4% -4.5 -3.4%
-1.5 -0.8% -1.5 -0.8%-1.0 -1.2% -1.0 -1.2%-0.8 -0.7% -0.8 -0.7%-1.4 -5.3% -1.4 -5.3%1.8 2.0% 1.8 2.0%
1.6 3.3% 1.6 3.3%-1.4 -2.0% -1.4 -2.0%-0.5 -6.0% -0.5 -6.0%-5.2 -5.3% -5.2 -5.3%2.7 5.0% 2.7 5.0%
-1.2 -1.9% -1.2 -1.9%1.6 1.6% 1.6 1.6%0.1 0.2% 0.1 0.2%
-1.2 -1.5% -1.2 -1.5%-2.6 -1.9% -2.6 -1.9%
283

(£ million) (£ million) (£ million) (£ million) (£ million)
Base Position = 2010-11 Agreed Position - 2008-09 Concessionary Travel NRE + 2008-09 Aggregated Concessionary Travel NRE + Aggregated 2010-11 Concessionary Travel Special Grant
2010-11 Indicative
Allocations
2008-09 Concess-
ionary Travel NRE
Aggreg-ated
2008-09 Concess-
ionary Travel NRE
Aggreg-ated
2010-11 Concess-
ionary Travel Special Grant
Base Position
Swindon 43.7 2.0 2.0 0.8 44.4Telford and the Wrekin 76.0 1.6 1.6 0.5 76.5Thurrock 62.1 0.8 0.8 0.2 62.3Torbay 64.2 3.1 3.1 1.6 65.8Warrington 52.7 3.0 3.0 1.2 53.9
West Berkshire 23.1 0.5 0.5 0.2 23.3Wiltshire 102.1 3.3 3.3 1.2 103.3Windsor and Maidenhead 10.1 1.0 1.0 0.3 10.4Wokingham 8.4 1.1 1.1 0.2 8.6York 45.8 3.5 3.5 1.5 47.3
Isles of Scilly 2.3 0.0 0.0 0.1 2.3
Formula Grant Before Floor Damping
(£ million) (%) (£ million) (%)
Difference from Base PositionOption CONCF9 Option CONCF10
0.5 1.1% 0.5 1.1%-1.3 -1.7% -1.3 -1.7%0.1 0.1% 0.1 0.1%
-2.5 -3.9% -2.5 -3.9%-2.0 -3.7% -2.0 -3.7%
-0.7 -3.0% -0.7 -3.0%-3.5 -3.4% -3.5 -3.4%0.4 4.3% 0.4 4.3%
-0.6 -6.8% -0.6 -6.8%0.0 0.1% 0.0 0.1%
0.0 0.0% 0.0 0.0%
284

(£ million) (£ million) (£ million) (£ million) (£ million)
Base Position = 2010-11 Agreed Position - 2008-09 Concessionary Travel NRE + 2008-09 Aggregated Concessionary Travel NRE + Aggregated 2010-11 Concessionary Travel Special Grant
2010-11 Indicative
Allocations
2008-09 Concess-
ionary Travel NRE
Aggreg-ated
2008-09 Concess-
ionary Travel NRE
Aggreg-ated
2010-11 Concess-
ionary Travel Special Grant
Base Position
SHIRE COUNTIES
Buckinghamshire 43.5 0.0 5.5 0.0 49.0Cambridgeshire 113.1 0.0 3.5 0.0 116.6Cumbria 157.5 0.0 5.3 0.0 162.8Derbyshire 204.0 0.0 9.8 0.0 213.8Devon 176.4 0.0 5.8 0.0 182.2
Dorset 57.6 0.0 2.5 0.0 60.1East Sussex 105.4 0.0 4.7 0.0 110.1Essex 258.3 0.0 13.9 0.0 272.1Gloucestershire 124.0 0.0 4.6 0.0 128.6Hampshire 126.6 0.0 11.5 0.0 138.2
Hertfordshire 148.3 0.0 10.4 0.0 158.7Kent 287.9 0.0 15.4 0.0 303.3Lancashire 328.9 0.0 17.2 0.0 346.0Leicestershire 107.5 0.0 3.9 0.0 111.5Lincolnshire 210.6 0.0 4.5 0.0 215.1
Norfolk 260.4 0.0 7.0 0.0 267.5North Yorkshire 113.7 0.0 5.2 0.0 118.9Northamptonshire 162.2 0.0 5.0 0.0 167.2Nottinghamshire 191.6 0.0 7.5 0.0 199.1Oxfordshire 99.8 0.0 6.1 0.0 105.9
Somerset 120.7 0.0 5.1 0.0 125.8Staffordshire 169.7 0.0 8.4 0.0 178.1Suffolk 181.0 0.0 8.4 0.0 189.3Surrey 60.1 0.0 5.4 0.0 65.6Warwickshire 96.6 0.0 4.9 0.0 101.5
West Sussex 88.4 0.0 8.6 0.0 96.9Worcestershire 96.9 0.0 5.0 0.0 101.9
Formula Grant Before Floor Damping
(£ million) (%) (£ million) (%)
Difference from Base PositionOption CONCF9 Option CONCF10
-0.6 -1.3% -0.6 -1.3%2.0 1.7% 2.0 1.7%
-2.2 -1.4% -2.2 -1.4%-5.2 -2.4% -5.2 -2.4%-3.2 -1.8% -3.2 -1.8%
-1.2 -2.0% -1.2 -2.0%0.0 0.0% 0.0 0.0%
-3.2 -1.2% -3.2 -1.2%-0.2 -0.1% -0.2 -0.1%-1.3 -0.9% -1.3 -0.9%
6.3 4.0% 6.3 4.0%-1.1 -0.3% -1.1 -0.3%-3.5 -1.0% -3.5 -1.0%1.0 0.9% 1.0 0.9%
-3.7 -1.7% -3.7 -1.7%
-4.6 -1.7% -4.6 -1.7%-2.7 -2.3% -2.7 -2.3%3.0 1.8% 3.0 1.8%
-2.1 -1.0% -2.1 -1.0%3.5 3.3% 3.5 3.3%
-3.0 -2.4% -3.0 -2.4%-4.2 -2.3% -4.2 -2.3%-4.5 -2.4% -4.5 -2.4%7.6 11.6% 7.6 11.6%0.1 0.1% 0.1 0.1%
0.1 0.1% 0.1 0.1%-2.0 -2.0% -2.0 -2.0%
285
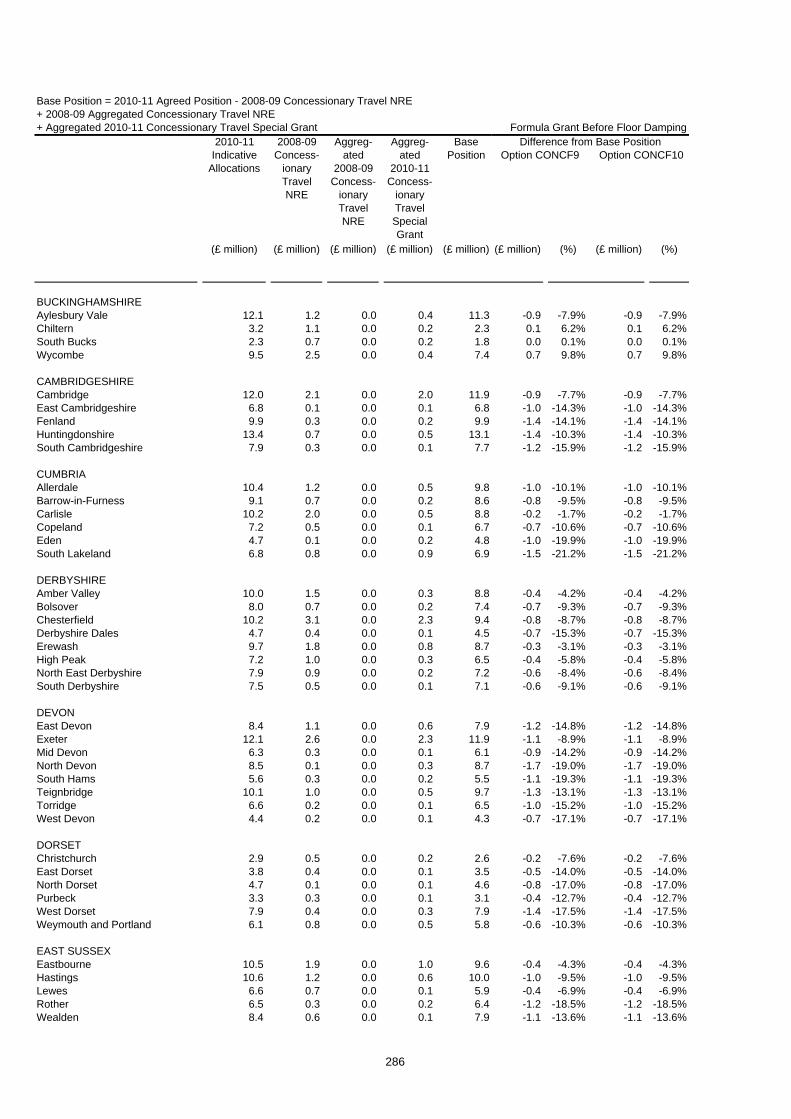
(£ million) (£ million) (£ million) (£ million) (£ million)
Base Position = 2010-11 Agreed Position - 2008-09 Concessionary Travel NRE + 2008-09 Aggregated Concessionary Travel NRE + Aggregated 2010-11 Concessionary Travel Special Grant
2010-11 Indicative
Allocations
2008-09 Concess-
ionary Travel NRE
Aggreg-ated
2008-09 Concess-
ionary Travel NRE
Aggreg-ated
2010-11 Concess-
ionary Travel Special Grant
Base Position
BUCKINGHAMSHIREAylesbury Vale 12.1 1.2 0.0 0.4 11.3Chiltern 3.2 1.1 0.0 0.2 2.3South Bucks 2.3 0.7 0.0 0.2 1.8Wycombe 9.5 2.5 0.0 0.4 7.4
CAMBRIDGESHIRECambridge 12.0 2.1 0.0 2.0 11.9East Cambridgeshire 6.8 0.1 0.0 0.1 6.8Fenland 9.9 0.3 0.0 0.2 9.9Huntingdonshire 13.4 0.7 0.0 0.5 13.1South Cambridgeshire 7.9 0.3 0.0 0.1 7.7
CUMBRIAAllerdale 10.4 1.2 0.0 0.5 9.8Barrow-in-Furness 9.1 0.7 0.0 0.2 8.6Carlisle 10.2 2.0 0.0 0.5 8.8Copeland 7.2 0.5 0.0 0.1 6.7Eden 4.7 0.1 0.0 0.2 4.8South Lakeland 6.8 0.8 0.0 0.9 6.9
DERBYSHIREAmber Valley 10.0 1.5 0.0 0.3 8.8Bolsover 8.0 0.7 0.0 0.2 7.4Chesterfield 10.2 3.1 0.0 2.3 9.4Derbyshire Dales 4.7 0.4 0.0 0.1 4.5Erewash 9.7 1.8 0.0 0.8 8.7High Peak 7.2 1.0 0.0 0.3 6.5North East Derbyshire 7.9 0.9 0.0 0.2 7.2South Derbyshire 7.5 0.5 0.0 0.1 7.1
DEVONEast Devon 8.4 1.1 0.0 0.6 7.9Exeter 12.1 2.6 0.0 2.3 11.9Mid Devon 6.3 0.3 0.0 0.1 6.1North Devon 8.5 0.1 0.0 0.3 8.7South Hams 5.6 0.3 0.0 0.2 5.5Teignbridge 10.1 1.0 0.0 0.5 9.7Torridge 6.6 0.2 0.0 0.1 6.5West Devon 4.4 0.2 0.0 0.1 4.3
DORSETChristchurch 2.9 0.5 0.0 0.2 2.6East Dorset 3.8 0.4 0.0 0.1 3.5North Dorset 4.7 0.1 0.0 0.1 4.6Purbeck 3.3 0.3 0.0 0.1 3.1West Dorset 7.9 0.4 0.0 0.3 7.9Weymouth and Portland 6.1 0.8 0.0 0.5 5.8
EAST SUSSEXEastbourne 10.5 1.9 0.0 1.0 9.6Hastings 10.6 1.2 0.0 0.6 10.0Lewes 6.6 0.7 0.0 0.1 5.9Rother 6.5 0.3 0.0 0.2 6.4Wealden 8.4 0.6 0.0 0.1 7.9
Formula Grant Before Floor Damping
(£ million) (%) (£ million) (%)
Difference from Base PositionOption CONCF9 Option CONCF10
-0.9 -7.9% -0.9 -7.9%0.1 6.2% 0.1 6.2%0.0 0.1% 0.0 0.1%0.7 9.8% 0.7 9.8%
-0.9 -7.7% -0.9 -7.7%-1.0 -14.3% -1.0 -14.3%-1.4 -14.1% -1.4 -14.1%-1.4 -10.3% -1.4 -10.3%-1.2 -15.9% -1.2 -15.9%
-1.0 -10.1% -1.0 -10.1%-0.8 -9.5% -0.8 -9.5%-0.2 -1.7% -0.2 -1.7%-0.7 -10.6% -0.7 -10.6%-1.0 -19.9% -1.0 -19.9%-1.5 -21.2% -1.5 -21.2%
-0.4 -4.2% -0.4 -4.2%-0.7 -9.3% -0.7 -9.3%-0.8 -8.7% -0.8 -8.7%-0.7 -15.3% -0.7 -15.3%-0.3 -3.1% -0.3 -3.1%-0.4 -5.8% -0.4 -5.8%-0.6 -8.4% -0.6 -8.4%-0.6 -9.1% -0.6 -9.1%
-1.2 -14.8% -1.2 -14.8%-1.1 -8.9% -1.1 -8.9%-0.9 -14.2% -0.9 -14.2%-1.7 -19.0% -1.7 -19.0%-1.1 -19.3% -1.1 -19.3%-1.3 -13.1% -1.3 -13.1%-1.0 -15.2% -1.0 -15.2%-0.7 -17.1% -0.7 -17.1%
-0.2 -7.6% -0.2 -7.6%-0.5 -14.0% -0.5 -14.0%-0.8 -17.0% -0.8 -17.0%-0.4 -12.7% -0.4 -12.7%-1.4 -17.5% -1.4 -17.5%-0.6 -10.3% -0.6 -10.3%
-0.4 -4.3% -0.4 -4.3%-1.0 -9.5% -1.0 -9.5%-0.4 -6.9% -0.4 -6.9%-1.2 -18.5% -1.2 -18.5%-1.1 -13.6% -1.1 -13.6%
286

(£ million) (£ million) (£ million) (£ million) (£ million)
Base Position = 2010-11 Agreed Position - 2008-09 Concessionary Travel NRE + 2008-09 Aggregated Concessionary Travel NRE + Aggregated 2010-11 Concessionary Travel Special Grant
2010-11 Indicative
Allocations
2008-09 Concess-
ionary Travel NRE
Aggreg-ated
2008-09 Concess-
ionary Travel NRE
Aggreg-ated
2010-11 Concess-
ionary Travel Special Grant
Base Position
ESSEXBasildon 16.1 1.8 0.0 0.5 14.8Braintree 10.6 1.2 0.0 0.3 9.7Brentwood 4.4 0.5 0.0 0.2 4.0Castle Point 6.8 0.9 0.0 0.2 6.1Chelmsford 10.7 1.9 0.0 0.8 9.5Colchester 13.1 2.5 0.0 0.6 11.2Epping Forest 9.4 0.5 0.0 0.1 8.9Harlow 8.2 1.4 0.0 0.4 7.1Maldon 4.6 0.5 0.0 0.1 4.2Rochford 5.2 0.8 0.0 0.1 4.6Tendring 14.6 1.6 0.0 0.5 13.5Uttlesford 3.9 0.2 0.0 0.1 3.7
GLOUCESTERSHIRECheltenham 8.7 1.4 0.0 0.6 7.9Cotswold 5.5 0.1 0.0 0.2 5.5Forest of Dean 7.0 0.6 0.0 0.2 6.6Gloucester 10.8 1.2 0.0 0.5 10.1Stroud 7.3 0.8 0.0 0.2 6.7Tewkesbury 5.4 0.6 0.0 0.1 4.9
HAMPSHIREBasingstoke and Deane 10.3 2.3 0.0 0.4 8.4East Hampshire 5.9 0.5 0.0 0.1 5.5Eastleigh 7.8 1.1 0.0 0.3 7.1Fareham 6.1 1.5 0.0 0.7 5.3Gosport 7.1 1.2 0.0 0.2 6.2Hart 3.9 0.2 0.0 0.1 3.8Havant 9.9 1.2 0.0 0.3 9.0New Forest 11.8 1.0 0.0 0.5 11.3Rushmoor 6.3 0.8 0.0 0.4 5.9Test Valley 7.3 1.0 0.0 0.3 6.6Winchester 6.7 0.9 0.0 0.3 6.0
HERTFORDSHIREBroxbourne 7.0 1.1 0.0 0.4 6.3Dacorum 9.5 1.8 0.0 0.3 8.0East Hertfordshire 8.1 0.9 0.0 0.3 7.5Hertsmere 6.8 0.6 0.0 0.2 6.4North Hertfordshire 8.3 1.0 0.0 0.3 7.5St Albans 7.0 0.3 0.0 0.7 7.4Stevenage 7.6 1.6 0.0 0.4 6.4Three Rivers 5.1 0.8 0.0 0.1 4.4Watford 7.2 1.2 0.0 0.6 6.6Welwyn Hatfield 8.2 1.0 0.0 0.3 7.5
Formula Grant Before Floor Damping
(£ million) (%) (£ million) (%)
Difference from Base PositionOption CONCF9 Option CONCF10
-0.9 -6.1% -0.9 -6.1%-0.7 -7.5% -0.7 -7.5%-0.3 -8.4% -0.3 -8.4%-0.2 -3.2% -0.2 -3.2%-0.2 -2.1% -0.2 -2.1%0.2 1.5% 0.2 1.5%
-1.0 -11.3% -1.0 -11.3%0.0 0.5% 0.0 0.5%
-0.4 -9.1% -0.4 -9.1%-0.1 -3.1% -0.1 -3.1%-1.2 -8.8% -1.2 -8.8%-0.7 -18.1% -0.7 -18.1%
-0.4 -4.7% -0.4 -4.7%-1.2 -21.5% -1.2 -21.5%-0.8 -11.9% -0.8 -11.9%-0.7 -6.6% -0.7 -6.6%-0.7 -9.8% -0.7 -9.8%-0.4 -8.6% -0.4 -8.6%
0.5 6.4% 0.5 6.4%-0.6 -10.9% -0.6 -10.9%-0.2 -2.3% -0.2 -2.3%-0.1 -1.1% -0.1 -1.1%0.2 3.0% 0.2 3.0%
-0.4 -11.4% -0.4 -11.4%-0.5 -5.1% -0.5 -5.1%-1.4 -12.4% -1.4 -12.4%-0.3 -5.0% -0.3 -5.0%-0.4 -6.1% -0.4 -6.1%-0.5 -7.5% -0.5 -7.5%
-0.3 -4.2% -0.3 -4.2%0.1 1.4% 0.1 1.4%
-0.6 -8.5% -0.6 -8.5%-0.6 -9.2% -0.6 -9.2%-0.5 -6.1% -0.5 -6.1%-1.5 -19.9% -1.5 -19.9%0.4 5.5% 0.4 5.5%
-0.1 -1.3% -0.1 -1.3%-0.2 -3.0% -0.2 -3.0%-0.3 -4.3% -0.3 -4.3%
287

(£ million) (£ million) (£ million) (£ million) (£ million)
Base Position = 2010-11 Agreed Position - 2008-09 Concessionary Travel NRE + 2008-09 Aggregated Concessionary Travel NRE + Aggregated 2010-11 Concessionary Travel Special Grant
2010-11 Indicative
Allocations
2008-09 Concess-
ionary Travel NRE
Aggreg-ated
2008-09 Concess-
ionary Travel NRE
Aggreg-ated
2010-11 Concess-
ionary Travel Special Grant
Base Position
KENTAshford 8.6 0.8 0.0 0.2 7.9Canterbury 13.6 2.4 0.0 0.8 12.1Dartford 7.6 0.9 0.0 0.4 7.1Dover 9.9 1.3 0.0 0.3 8.9Gravesham 8.5 1.3 0.0 0.4 7.7Maidstone 9.0 2.0 0.0 0.5 7.5Sevenoaks 6.1 0.7 0.0 0.1 5.6Shepway 10.1 1.5 0.0 0.4 8.9Swale 12.2 0.9 0.0 0.1 11.5Thanet 13.4 1.6 0.0 0.8 12.6Tonbridge and Malling 6.5 0.8 0.0 0.1 5.9Tunbridge Wells 6.5 1.3 0.0 0.4 5.7
LANCASHIREBurnley 11.8 1.5 0.0 0.5 10.8Chorley 8.6 1.2 0.0 0.7 8.2Fylde 6.0 1.1 0.0 0.7 5.5Hyndburn 10.3 1.1 0.0 0.3 9.5Lancaster 16.8 2.3 0.0 1.2 15.7Pendle 11.2 0.8 0.0 0.1 10.5Preston 15.8 4.1 0.0 1.9 13.6Ribble Valley 4.3 0.5 0.0 0.2 4.0Rossendale 6.2 0.9 0.0 0.2 5.6South Ribble 7.6 1.0 0.0 0.1 6.7West Lancashire 9.6 1.1 0.0 0.3 8.8Wyre 10.8 1.6 0.0 0.4 9.6
LEICESTERSHIREBlaby 6.6 0.5 0.0 0.3 6.3Charnwood 12.7 1.3 0.0 0.6 12.0Harborough 5.6 0.2 0.0 0.1 5.5Hinckley and Bosworth 7.6 0.7 0.0 0.4 7.3Melton 4.0 0.2 0.0 0.1 3.9North West Leicestershire 7.3 0.5 0.0 0.2 7.0Oadby and Wigston 4.7 0.4 0.0 0.3 4.6
LINCOLNSHIREBoston 7.4 0.3 0.0 0.2 7.3East Lindsey 17.9 1.0 0.0 1.0 17.9Lincoln 10.3 1.3 0.0 0.8 9.9North Kesteven 9.0 0.6 0.0 0.2 8.5South Holland 9.3 0.4 0.0 0.2 9.1South Kesteven 10.2 0.5 0.0 0.4 10.2West Lindsey 8.4 0.5 0.0 0.1 8.0
NORFOLKBreckland 11.6 0.3 0.0 0.1 11.4Broadland 8.7 0.7 0.0 0.1 8.1Great Yarmouth 10.9 1.0 0.0 1.0 10.9King's Lynn and West Norfolk 15.8 0.8 0.0 0.5 15.4North Norfolk 9.1 0.3 0.0 0.2 9.1Norwich 16.0 2.8 0.0 2.3 15.6South Norfolk 8.6 1.2 0.0 0.4 7.8
Formula Grant Before Floor Damping
(£ million) (%) (£ million) (%)
Difference from Base PositionOption CONCF9 Option CONCF10
-0.7 -8.3% -0.7 -8.3%-0.2 -1.3% -0.2 -1.3%-0.4 -5.9% -0.4 -5.9%-0.5 -6.1% -0.5 -6.1%-0.2 -3.2% -0.2 -3.2%0.1 1.7% 0.1 1.7%
-0.6 -10.7% -0.6 -10.7%-0.4 -4.1% -0.4 -4.1%-0.9 -8.1% -0.9 -8.1%-1.4 -10.8% -1.4 -10.8%-0.4 -6.3% -0.4 -6.3%-0.3 -4.4% -0.3 -4.4%
-0.6 -5.8% -0.6 -5.8%-0.8 -9.8% -0.8 -9.8%-0.5 -8.8% -0.5 -8.8%-0.6 -6.3% -0.6 -6.3%-0.9 -5.9% -0.9 -5.9%-0.8 -7.2% -0.8 -7.2%0.2 1.4% 0.2 1.4%
-0.4 -9.7% -0.4 -9.7%-0.4 -7.1% -0.4 -7.1%-0.2 -3.2% -0.2 -3.2%-0.8 -9.6% -0.8 -9.6%-0.4 -3.7% -0.4 -3.7%
-0.5 -8.0% -0.5 -8.0%-0.7 -6.2% -0.7 -6.2%-0.7 -12.9% -0.7 -12.9%-0.8 -10.7% -0.8 -10.7%-0.4 -11.5% -0.4 -11.5%-0.8 -10.8% -0.8 -10.8%-0.3 -6.7% -0.3 -6.7%
-0.9 -12.0% -0.9 -12.0%-2.8 -15.7% -2.8 -15.7%-0.8 -7.7% -0.8 -7.7%-0.9 -10.2% -0.9 -10.2%-1.1 -11.8% -1.1 -11.8%-1.4 -13.8% -1.4 -13.8%-1.0 -12.0% -1.0 -12.0%
-1.7 -14.6% -1.7 -14.6%-0.7 -9.2% -0.7 -9.2%-1.6 -14.7% -1.6 -14.7%-2.1 -13.4% -2.1 -13.4%-1.7 -18.3% -1.7 -18.3%-1.5 -9.7% -1.5 -9.7%-0.8 -9.8% -0.8 -9.8%
288

(£ million) (£ million) (£ million) (£ million) (£ million)
Base Position = 2010-11 Agreed Position - 2008-09 Concessionary Travel NRE + 2008-09 Aggregated Concessionary Travel NRE + Aggregated 2010-11 Concessionary Travel Special Grant
2010-11 Indicative
Allocations
2008-09 Concess-
ionary Travel NRE
Aggreg-ated
2008-09 Concess-
ionary Travel NRE
Aggreg-ated
2010-11 Concess-
ionary Travel Special Grant
Base Position
NORTH YORKSHIRECraven 4.3 0.4 0.0 0.3 4.1Hambleton 5.9 0.2 0.0 0.3 5.9Harrogate 11.5 1.5 0.0 1.5 11.5Richmondshire 4.4 0.2 0.0 0.2 4.4Ryedale 4.7 0.3 0.0 0.2 4.6Scarborough 12.6 2.0 0.0 1.2 11.8Selby 6.8 0.5 0.0 0.2 6.5
NORTHAMPTONSHIRECorby 5.6 0.5 0.0 0.3 5.5Daventry 6.4 0.4 0.0 0.2 6.2East Northamptonshire 6.9 0.3 0.0 0.3 6.8Kettering 7.4 1.0 0.0 0.6 7.0Northampton 18.9 2.0 0.0 0.7 17.6South Northamptonshire 6.1 0.2 0.0 0.1 5.9Wellingborough 7.1 0.6 0.0 0.3 6.8
NOTTINGHAMSHIREAshfield 11.6 1.3 0.0 0.4 10.8Bassetlaw 11.4 1.2 0.0 0.3 10.6Broxtowe 9.1 0.9 0.0 0.3 8.5Gedling 9.4 1.2 0.0 0.3 8.5Mansfield 10.3 1.3 0.0 0.7 9.6Newark and Sherwood 10.5 1.0 0.0 0.3 9.9Rushcliffe 7.3 0.6 0.0 0.2 6.9
OXFORDSHIRECherwell 11.2 0.9 0.0 0.2 10.5Oxford 16.9 3.2 0.0 3.1 16.9South Oxfordshire 7.8 0.6 0.0 0.2 7.4Vale of White Horse 7.2 0.7 0.0 0.5 7.0West Oxfordshire 6.1 0.7 0.0 0.1 5.5
SOMERSETMendip 8.5 1.0 0.0 0.3 7.9Sedgemoor 10.3 0.9 0.0 0.4 9.7South Somerset 11.2 1.6 0.0 0.4 10.0Taunton Deane 8.9 1.5 0.0 0.4 7.8West Somerset 3.3 0.1 0.0 0.1 3.4
STAFFORDSHIRECannock Chase 8.6 1.1 0.0 0.3 7.9East Staffordshire 9.6 1.4 0.0 0.4 8.6Lichfield 6.1 0.5 0.0 0.2 5.8Newcastle-under-Lyme 11.3 1.4 0.0 0.4 10.3South Staffordshire 7.2 1.1 0.0 0.2 6.3Stafford 8.8 1.6 0.0 0.5 7.7Staffordshire Moorlands 7.6 0.7 0.0 0.3 7.1Tamworth 6.9 0.6 0.0 0.3 6.6
Formula Grant Before Floor Damping
(£ million) (%) (£ million) (%)
Difference from Base PositionOption CONCF9 Option CONCF10
-0.6 -14.2% -0.6 -14.2%-1.2 -19.5% -1.2 -19.5%-1.7 -14.5% -1.7 -14.5%-0.7 -14.9% -0.7 -14.9%-0.8 -17.1% -0.8 -17.1%-1.0 -8.7% -1.0 -8.7%-0.6 -9.8% -0.6 -9.8%
-0.6 -10.4% -0.6 -10.4%-0.8 -12.1% -0.8 -12.1%-0.9 -12.6% -0.9 -12.6%-0.6 -8.6% -0.6 -8.6%-0.9 -5.0% -0.9 -5.0%-0.8 -13.0% -0.8 -13.0%-0.6 -9.1% -0.6 -9.1%
-0.8 -7.2% -0.8 -7.2%-0.9 -8.8% -0.9 -8.8%-0.5 -5.9% -0.5 -5.9%-0.3 -4.0% -0.3 -4.0%-1.0 -9.9% -1.0 -9.9%-0.9 -9.0% -0.9 -9.0%-0.6 -8.5% -0.6 -8.5%
-0.7 -6.5% -0.7 -6.5%-1.3 -8.0% -1.3 -8.0%-0.8 -11.5% -0.8 -11.5%-0.9 -12.2% -0.9 -12.2%-0.5 -8.8% -0.5 -8.8%
-0.7 -9.3% -0.7 -9.3%-1.0 -10.1% -1.0 -10.1%-0.7 -7.3% -0.7 -7.3%-0.2 -2.9% -0.2 -2.9%-0.7 -20.6% -0.7 -20.6%
-0.5 -5.9% -0.5 -5.9%-0.3 -3.5% -0.3 -3.5%-0.8 -13.1% -0.8 -13.1%-0.6 -6.1% -0.6 -6.1%-0.3 -4.4% -0.3 -4.4%-0.3 -4.0% -0.3 -4.0%-0.9 -12.5% -0.9 -12.5%-0.5 -8.3% -0.5 -8.3%
289
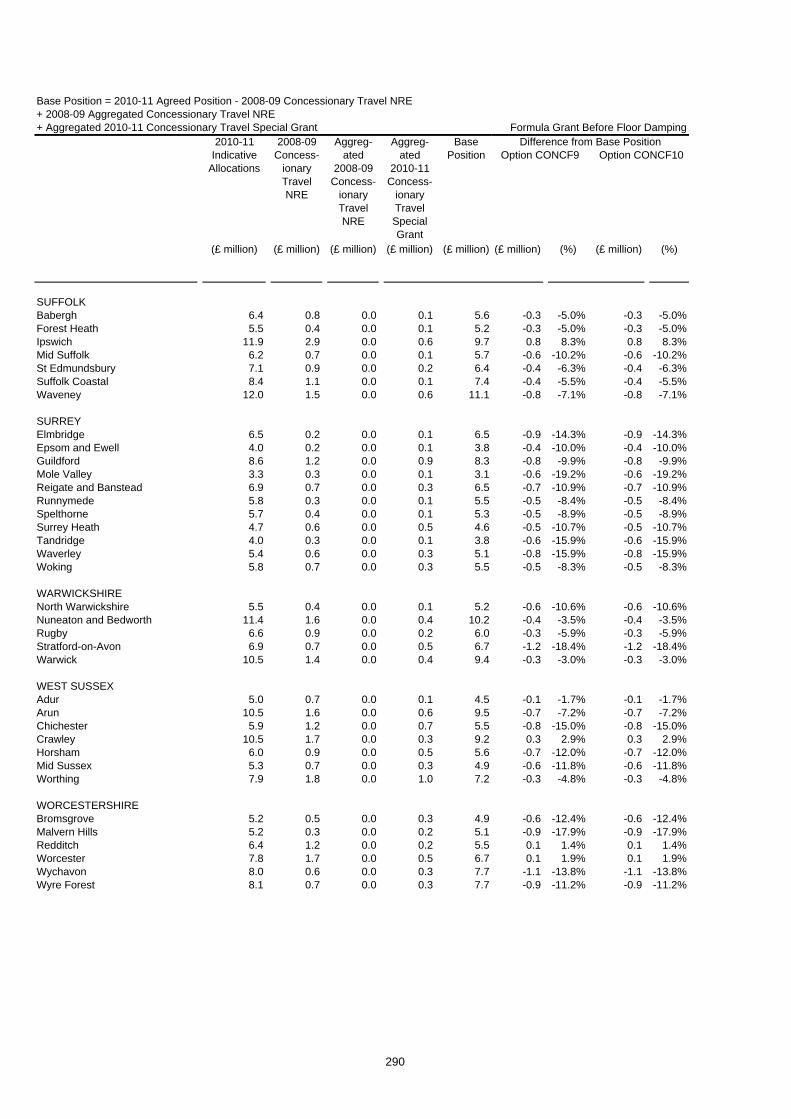
(£ million) (£ million) (£ million) (£ million) (£ million)
Base Position = 2010-11 Agreed Position - 2008-09 Concessionary Travel NRE + 2008-09 Aggregated Concessionary Travel NRE + Aggregated 2010-11 Concessionary Travel Special Grant
2010-11 Indicative
Allocations
2008-09 Concess-
ionary Travel NRE
Aggreg-ated
2008-09 Concess-
ionary Travel NRE
Aggreg-ated
2010-11 Concess-
ionary Travel Special Grant
Base Position
SUFFOLKBabergh 6.4 0.8 0.0 0.1 5.6Forest Heath 5.5 0.4 0.0 0.1 5.2Ipswich 11.9 2.9 0.0 0.6 9.7Mid Suffolk 6.2 0.7 0.0 0.1 5.7St Edmundsbury 7.1 0.9 0.0 0.2 6.4Suffolk Coastal 8.4 1.1 0.0 0.1 7.4Waveney 12.0 1.5 0.0 0.6 11.1
SURREYElmbridge 6.5 0.2 0.0 0.1 6.5Epsom and Ewell 4.0 0.2 0.0 0.1 3.8Guildford 8.6 1.2 0.0 0.9 8.3Mole Valley 3.3 0.3 0.0 0.1 3.1Reigate and Banstead 6.9 0.7 0.0 0.3 6.5Runnymede 5.8 0.3 0.0 0.1 5.5Spelthorne 5.7 0.4 0.0 0.1 5.3Surrey Heath 4.7 0.6 0.0 0.5 4.6Tandridge 4.0 0.3 0.0 0.1 3.8Waverley 5.4 0.6 0.0 0.3 5.1Woking 5.8 0.7 0.0 0.3 5.5
WARWICKSHIRENorth Warwickshire 5.5 0.4 0.0 0.1 5.2Nuneaton and Bedworth 11.4 1.6 0.0 0.4 10.2Rugby 6.6 0.9 0.0 0.2 6.0Stratford-on-Avon 6.9 0.7 0.0 0.5 6.7Warwick 10.5 1.4 0.0 0.4 9.4
WEST SUSSEXAdur 5.0 0.7 0.0 0.1 4.5Arun 10.5 1.6 0.0 0.6 9.5Chichester 5.9 1.2 0.0 0.7 5.5Crawley 10.5 1.7 0.0 0.3 9.2Horsham 6.0 0.9 0.0 0.5 5.6Mid Sussex 5.3 0.7 0.0 0.3 4.9Worthing 7.9 1.8 0.0 1.0 7.2
WORCESTERSHIREBromsgrove 5.2 0.5 0.0 0.3 4.9Malvern Hills 5.2 0.3 0.0 0.2 5.1Redditch 6.4 1.2 0.0 0.2 5.5Worcester 7.8 1.7 0.0 0.5 6.7Wychavon 8.0 0.6 0.0 0.3 7.7Wyre Forest 8.1 0.7 0.0 0.3 7.7
Formula Grant Before Floor Damping
(£ million) (%) (£ million) (%)
Difference from Base PositionOption CONCF9 Option CONCF10
-0.3 -5.0% -0.3 -5.0%-0.3 -5.0% -0.3 -5.0%0.8 8.3% 0.8 8.3%
-0.6 -10.2% -0.6 -10.2%-0.4 -6.3% -0.4 -6.3%-0.4 -5.5% -0.4 -5.5%-0.8 -7.1% -0.8 -7.1%
-0.9 -14.3% -0.9 -14.3%-0.4 -10.0% -0.4 -10.0%-0.8 -9.9% -0.8 -9.9%-0.6 -19.2% -0.6 -19.2%-0.7 -10.9% -0.7 -10.9%-0.5 -8.4% -0.5 -8.4%-0.5 -8.9% -0.5 -8.9%-0.5 -10.7% -0.5 -10.7%-0.6 -15.9% -0.6 -15.9%-0.8 -15.9% -0.8 -15.9%-0.5 -8.3% -0.5 -8.3%
-0.6 -10.6% -0.6 -10.6%-0.4 -3.5% -0.4 -3.5%-0.3 -5.9% -0.3 -5.9%-1.2 -18.4% -1.2 -18.4%-0.3 -3.0% -0.3 -3.0%
-0.1 -1.7% -0.1 -1.7%-0.7 -7.2% -0.7 -7.2%-0.8 -15.0% -0.8 -15.0%0.3 2.9% 0.3 2.9%
-0.7 -12.0% -0.7 -12.0%-0.6 -11.8% -0.6 -11.8%-0.3 -4.8% -0.3 -4.8%
-0.6 -12.4% -0.6 -12.4%-0.9 -17.9% -0.9 -17.9%0.1 1.4% 0.1 1.4%0.1 1.9% 0.1 1.9%
-1.1 -13.8% -1.1 -13.8%-0.9 -11.2% -0.9 -11.2%
290

(£ million) (£ million) (£ million) (£ million) (£ million)
Base Position = 2010-11 Agreed Position - 2008-09 Concessionary Travel NRE + 2008-09 Aggregated Concessionary Travel NRE + Aggregated 2010-11 Concessionary Travel Special Grant
2010-11 Indicative
Allocations
2008-09 Concess-
ionary Travel NRE
Aggreg-ated
2008-09 Concess-
ionary Travel NRE
Aggreg-ated
2010-11 Concess-
ionary Travel Special Grant
Base Position
SHIRE POLICE AUTHORITIES
Avon & Somerset Police 197.6 0.0 0.0 0.0 197.6Bedfordshire Police 76.6 0.0 0.0 0.0 76.6Cambridgeshire Police 86.2 0.0 0.0 0.0 86.2Cheshire Police 114.1 0.0 0.0 0.0 114.1Cleveland Police 99.0 0.0 0.0 0.0 99.0
Cumbria Police 56.1 0.0 0.0 0.0 56.1Derbyshire Police 120.7 0.0 0.0 0.0 120.7Devon & Cornwall Police 191.7 0.0 0.0 0.0 191.7Dorset Police 64.3 0.0 0.0 0.0 64.3Durham Police 87.0 0.0 0.0 0.0 87.0
Essex Police 187.3 0.0 0.0 0.0 187.3Gloucestershire Police 58.5 0.0 0.0 0.0 58.5Hampshire Police 215.0 0.0 0.0 0.0 215.0Hertfordshire Police 128.9 0.0 0.0 0.0 128.9Humberside Police 132.9 0.0 0.0 0.0 132.9
Kent Police 200.2 0.0 0.0 0.0 200.2Lancashire Police 212.3 0.0 0.0 0.0 212.3Leicestershire Police 124.2 0.0 0.0 0.0 124.2Lincolnshire Police 69.0 0.0 0.0 0.0 69.0Norfolk Police 88.5 0.0 0.0 0.0 88.5
North Yorkshire Police 73.1 0.0 0.0 0.0 73.1Northamptonshire Police 78.4 0.0 0.0 0.0 78.4Nottinghamshire Police 152.7 0.0 0.0 0.0 152.7Staffordshire Police 125.1 0.0 0.0 0.0 125.1Suffolk Police 71.0 0.0 0.0 0.0 71.0
Surrey Police 101.3 0.0 0.0 0.0 101.3Sussex Police 167.1 0.0 0.0 0.0 167.1Thames Valley Police 248.5 0.0 0.0 0.0 248.5Warwickshire Police 56.1 0.0 0.0 0.0 56.1West Mercia Police 114.3 0.0 0.0 0.0 114.3
Wiltshire Police 64.1 0.0 0.0 0.0 64.1
Formula Grant Before Floor Damping
(£ million) (%) (£ million) (%)
Difference from Base PositionOption CONCF9 Option CONCF10
0.7 0.3% 0.7 0.3%0.3 0.4% 0.3 0.4%0.5 0.5% 0.5 0.5%0.4 0.3% 0.4 0.3%0.0 0.0% 0.0 0.0%
0.3 0.5% 0.3 0.5%0.7 0.6% 0.7 0.6%0.9 0.5% 0.9 0.5%0.3 0.4% 0.3 0.4%0.2 0.2% 0.2 0.2%
0.6 0.3% 0.6 0.3%0.3 0.5% 0.3 0.5%0.7 0.3% 0.7 0.3%
-0.1 -0.1% -0.1 -0.1%0.5 0.4% 0.5 0.4%
0.4 0.2% 0.4 0.2%0.6 0.3% 0.6 0.3%0.6 0.4% 0.6 0.4%0.7 1.1% 0.7 1.1%0.7 0.8% 0.7 0.8%
0.6 0.8% 0.6 0.8%0.4 0.5% 0.4 0.5%0.5 0.3% 0.5 0.3%0.7 0.5% 0.7 0.5%0.5 0.7% 0.5 0.7%
0.0 0.0% 0.0 0.0%0.4 0.2% 0.4 0.2%0.3 0.1% 0.3 0.1%0.2 0.4% 0.2 0.4%0.9 0.8% 0.9 0.8%
0.3 0.5% 0.3 0.5%
291

(£ million) (£ million) (£ million) (£ million) (£ million)
Base Position = 2010-11 Agreed Position - 2008-09 Concessionary Travel NRE + 2008-09 Aggregated Concessionary Travel NRE + Aggregated 2010-11 Concessionary Travel Special Grant
2010-11 Indicative
Allocations
2008-09 Concess-
ionary Travel NRE
Aggreg-ated
2008-09 Concess-
ionary Travel NRE
Aggreg-ated
2010-11 Concess-
ionary Travel Special Grant
Base Position
SHIRE FIRE AUTHORITIES
Avon Fire 24.6 0.0 0.0 0.0 24.6Bedfordshire Fire 11.7 0.0 0.0 0.0 11.7Berkshire Fire Auhtority 13.0 0.0 0.0 0.0 13.0Buckinghamshire Fire 9.1 0.0 0.0 0.0 9.1Cambridgeshire Fire 15.1 0.0 0.0 0.0 15.1
Cheshire Fire 19.3 0.0 0.0 0.0 19.3Cleveland Fire 21.7 0.0 0.0 0.0 21.7Derbyshire Fire 20.6 0.0 0.0 0.0 20.6Devon and Somerset Fire 32.1 0.0 0.0 0.0 32.1Dorset Fire 11.1 0.0 0.0 0.0 11.1
Durham Fire 14.9 0.0 0.0 0.0 14.9East Sussex Fire 15.0 0.0 0.0 0.0 15.0Essex Fire Auhtority 33.3 0.0 0.0 0.0 33.3Hampshire Fire 29.9 0.0 0.0 0.0 29.9Hereford & Worcester Fire 10.8 0.0 0.0 0.0 10.8
Humberside Fire 28.2 0.0 0.0 0.0 28.2Kent Fire 30.2 0.0 0.0 0.0 30.2Lancashire Fire 32.6 0.0 0.0 0.0 32.6Leicestershire Fire 19.2 0.0 0.0 0.0 19.2North Yorkshire Fire 11.6 0.0 0.0 0.0 11.6
Nottinghamshire Fire 26.3 0.0 0.0 0.0 26.3Shropshire Fire 8.6 0.0 0.0 0.0 8.6Staffordshire Fire 19.1 0.0 0.0 0.0 19.1Wiltshire Fire 9.7 0.0 0.0 0.0 9.7
Formula Grant Before Floor Damping
(£ million) (%) (£ million) (%)
Difference from Base PositionOption CONCF9 Option CONCF10
0.1 0.3% 0.1 0.3%0.1 1.0% 0.1 1.0%0.0 -0.1% 0.0 -0.1%0.1 0.7% 0.1 0.7%0.1 0.7% 0.1 0.7%
0.1 0.3% 0.1 0.3%-0.1 -0.4% -0.1 -0.4%0.2 1.1% 0.2 1.1%0.2 0.5% 0.2 0.5%0.0 -0.1% 0.0 -0.1%
0.1 0.5% 0.1 0.5%0.0 -0.1% 0.0 -0.1%0.0 0.1% 0.0 0.1%0.2 0.7% 0.2 0.7%0.1 1.1% 0.1 1.1%
0.0 0.1% 0.0 0.1%0.1 0.4% 0.1 0.4%0.3 1.0% 0.3 1.0%0.2 1.2% 0.2 1.2%0.2 1.3% 0.2 1.3%
0.2 0.7% 0.2 0.7%0.1 1.0% 0.1 1.0%0.3 1.3% 0.3 1.3%0.1 0.7% 0.1 0.7%
292

Concessionary Travel - Adding into Upper-Tier Authorities
Formula Grant After Floor Damping
(£ million) (£ million) (£ million) (£ million) (£ million) (£ million) (%) (£ million) (%)
England 28,995.5 813.4 813.4 223.0 29,218.5 0.0 0.0% 0.0 0.0%
London area 6,475.5 206.0 206.0 28.1 6,503.6 44.1 0.7% 40.1 0.6%Metropolitan areas 8,197.3 259.3 259.3 52.3 8,249.6 14.0 0.2% 22.8 0.3%Shire areas 14,320.4 348.1 348.1 142.6 14,463.0 -58.2 -0.4% -62.8 -0.4%Isles of Scilly 2.3 0.0 0.0 0.1 2.3 0.0 0.0% 0.0 0.0%
Inner London boroughs incl. City 2,234.6 83.0 83.0 11.3 2,245.9 19.2 0.9% 21.7 1.0%Outer London boroughs 1,953.6 123.0 123.0 16.8 1,970.4 25.0 1.3% 18.4 0.9%London boroughs 4,188.2 206.0 206.0 28.1 4,216.3 44.1 1.0% 40.1 1.0%GLA - all functions 2,287.3 0.0 0.0 0.0 2,287.3 0.0 0.0% 0.0 0.0%
Metropolitan districts 5,798.0 259.3 259.3 52.3 5,850.3 14.8 0.3% 23.5 0.4%Metropolitan fire authorities 332.3 0.0 0.0 0.0 332.3 -0.1 0.0% -0.1 0.0%Metropolitan police authorities 2,067.0 0.0 0.0 0.0 2,067.0 -0.7 0.0% -0.7 0.0%
Shire unitaries with fire 404.3 11.1 11.1 6.5 410.8 -2.7 -0.7% -4.3 -1.0%Shire unitaries without fire 4,033.1 142.0 142.0 55.0 4,088.1 -3.1 -0.1% -1.5 0.0%Shire counties with fire 1,615.8 0.0 70.2 0.0 1,686.0 31.0 1.8% 28.6 1.7%Shire counties without fire 2,378.5 0.0 124.8 0.0 2,503.4 45.6 1.8% 43.3 1.7%Shire districts 1,654.0 195.0 0.0 81.0 1,540.0 -129.7 -8.4% -129.7 -8.4%Combined fire authorities 464.7 0.0 0.0 0.0 464.7 0.0 0.0% 0.0 0.0%Shire police authorities 3,770.0 0.0 0.0 0.0 3,770.0 0.7 0.0% 0.7 0.0%
GO REGIONAL SUMMARY
South West GOR 2,199.8 51.1 51.1 23.3 2,223.1 -5.5 -0.2% -10.0 -0.4%South East GOR 3,118.8 85.6 85.6 32.0 3,150.8 -9.6 -0.3% -10.9 -0.3%London GOR 6,475.5 206.0 206.0 28.1 6,503.6 44.1 0.7% 40.1 0.6%Eastern GOR 2,390.8 54.3 54.3 21.9 2,412.7 -11.1 -0.5% -10.4 -0.4%East Midlands GOR 2,181.5 49.5 49.5 24.7 2,206.2 -16.3 -0.7% -15.9 -0.7%West Midlands GOR 3,238.8 93.2 93.2 22.4 3,261.2 -1.0 0.0% 0.5 0.0%Yorkshire and Humber GOR 3,100.9 85.7 85.7 23.8 3,124.7 2.0 0.1% 3.7 0.1%North East GOR 1,812.2 60.4 60.4 11.9 1,824.1 0.8 0.0% 3.1 0.2%North West GOR 4,477.2 127.7 127.7 34.8 4,512.0 -3.5 -0.1% -0.2 0.0%
FLOOR DAMPING GROUPS
Education Authorities 18,418.0 618.4 813.4 222.9 18,835.9 48.7 0.3% 48.7 0.3%Police Authorities 7,864.8 0.0 0.0 0.0 7,864.8 0.1 0.0% 0.1 0.0%Fire Authorities 1,056.5 0.0 0.0 0.0 1,056.5 -0.1 0.0% -0.1 0.0%Shire Districts 1,654.0 195.0 0.0 0.0 1,459.0 -48.7 -3.3% -48.7 -3.3%
Base Position = 2010-11 Agreed Position - 2008-09 Concessionary Travel NRE + 2008-09 Aggregated Concessionary Travel NRE + Aggregated 2010-11 Concessionary Travel Special Grant
2010-11 Indicative
Allocations
2008-09 Concess-
ionary Travel NRE
Aggreg-ated 2008-
09 Concess-
ionary Travel NRE
Aggreg-ated 2010-
11 Concess-
ionary Travel Special Grant
Base Position Option CONCF5 Option CONCF6
Difference from Base Position
293

Formula Grant After Floor Damping
(£ million) (£ million) (£ million) (£ million) (£ million) (£ million) (%) (£ million) (%)
Base Position = 2010-11 Agreed Position - 2008-09 Concessionary Travel NRE + 2008-09 Aggregated Concessionary Travel NRE + Aggregated 2010-11 Concessionary Travel Special Grant
2010-11 Indicative
Allocations
2008-09 Concess-
ionary Travel NRE
Aggreg-ated 2008-
09 Concess-
ionary Travel NRE
Aggreg-ated 2010-
11 Concess-
ionary Travel Special Grant
Base Position Option CONCF5 Option CONCF6
Difference from Base Position
GREATER LONDON
City of London 104.7 0.4 0.4 0.0 104.7 0.4 0.3% 0.3 0.3%
Camden 167.3 8.4 8.4 1.1 168.4 2.1 1.2% 2.1 1.2%Greenwich 166.8 5.2 5.2 0.7 167.5 1.5 0.9% 1.8 1.1%Hackney 220.0 6.6 6.6 0.9 220.9 1.6 0.7% 2.0 0.9%Hammersmith and Fulham 120.9 6.2 6.2 0.8 121.8 1.2 1.0% 1.1 0.9%Islington 160.2 6.8 6.8 0.9 161.2 1.4 0.9% 1.5 0.9%Kensington and Chelsea 106.0 6.0 6.0 0.8 106.8 1.2 1.1% 1.2 1.1%
Lambeth 213.9 8.5 8.5 1.2 215.1 1.9 0.9% 2.0 0.9%Lewisham 180.2 6.7 6.7 0.9 181.1 1.5 0.8% 1.7 1.0%Southwark 230.7 6.9 6.9 0.9 231.7 1.7 0.7% 2.3 1.0%Tower Hamlets 232.2 5.2 5.2 0.7 232.9 1.4 0.6% 2.3 1.0%Wandsworth 150.2 7.9 7.9 1.1 151.3 1.6 1.0% 1.6 1.0%Westminster 181.5 8.4 8.4 1.1 182.6 1.7 1.0% 1.7 1.0%
Barking and Dagenham 102.8 3.6 3.6 0.5 103.3 0.9 0.9% 1.1 1.0%Barnet 94.6 9.6 9.6 1.3 95.9 1.9 2.0% 1.3 1.3%Bexley 65.6 4.1 4.1 0.6 66.2 0.8 1.2% 0.7 1.0%Brent 164.5 9.2 9.2 1.3 165.7 1.8 1.1% 1.2 0.7%Bromley 65.1 5.8 5.8 0.8 65.9 1.0 1.6% 0.6 0.8%
Croydon 118.5 7.0 7.0 1.0 119.5 1.8 1.5% 1.6 1.3%Ealing 144.4 9.8 9.8 1.3 145.8 1.8 1.3% 1.1 0.7%Enfield 121.9 7.2 7.2 1.0 122.9 1.5 1.3% 1.3 1.1%Haringey 144.6 8.5 8.5 1.2 145.8 1.7 1.1% 1.1 0.7%Harrow 67.8 6.1 6.1 0.8 68.6 1.1 1.6% 0.3 0.5%
Havering 55.3 5.1 5.1 0.7 56.0 0.9 1.6% 0.5 0.8%Hillingdon 84.4 5.6 5.6 0.8 85.2 1.2 1.4% 1.0 1.1%Hounslow 91.4 5.4 5.4 0.7 92.2 1.1 1.1% 0.8 0.9%Kingston upon Thames 37.2 2.9 2.9 0.4 37.6 0.5 1.4% 0.4 1.1%Merton 67.7 5.3 5.3 0.7 68.5 1.0 1.4% 0.6 0.8%
Newham 224.0 7.2 7.2 1.0 225.0 1.7 0.8% 1.8 0.8%Redbridge 98.0 6.3 6.3 0.9 98.9 1.4 1.4% 1.1 1.1%Richmond upon Thames 28.0 4.7 4.7 0.6 28.7 0.8 2.6% 0.4 1.3%Sutton 54.5 3.4 3.4 0.5 55.0 0.7 1.2% 0.5 0.9%Waltham Forest 123.0 5.9 5.9 0.8 123.8 1.4 1.1% 1.3 1.0%
GLA - all functions 2,287.3 0.0 0.0 0.0 2,287.3 0.0 0.0% 0.0 0.0%
GLA - police 2,027.7 0.0 0.0 0.0 2,027.7 0.0 0.0% 0.0 0.0%GLA - fire 259.6 0.0 0.0 0.0 259.6 0.0 0.0% 0.0 0.0%
294
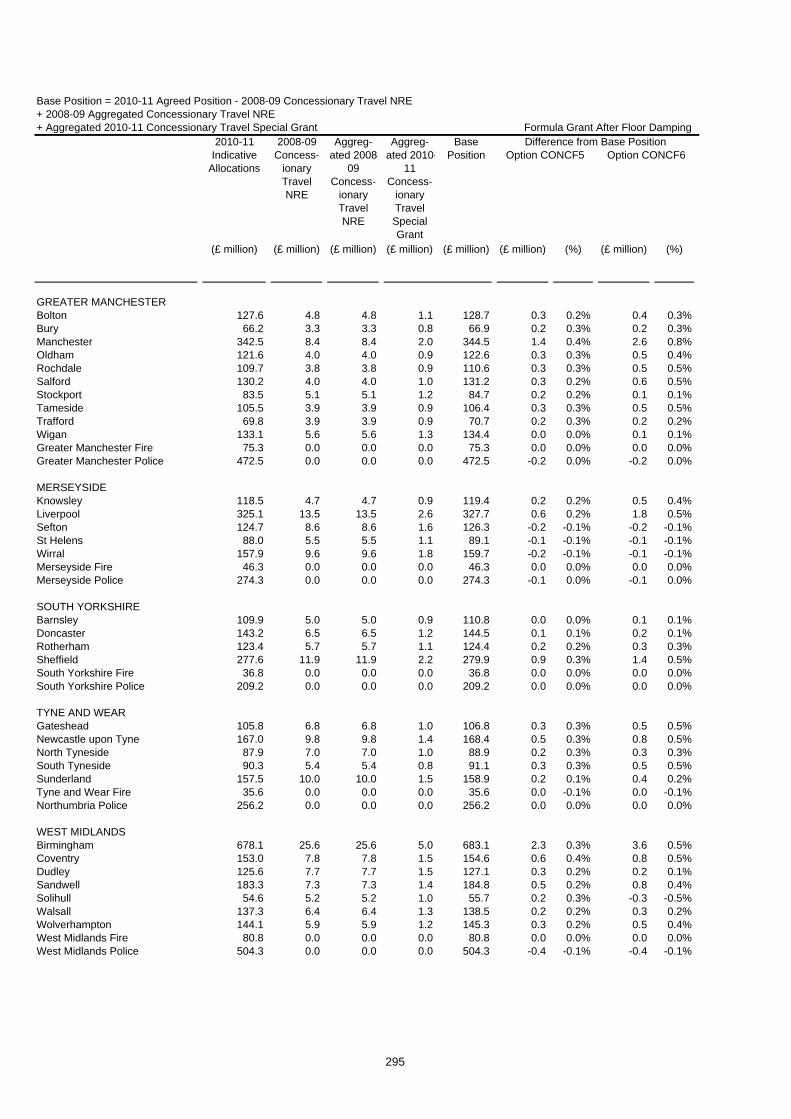
Formula Grant After Floor Damping
(£ million) (£ million) (£ million) (£ million) (£ million) (£ million) (%) (£ million) (%)
Base Position = 2010-11 Agreed Position - 2008-09 Concessionary Travel NRE + 2008-09 Aggregated Concessionary Travel NRE + Aggregated 2010-11 Concessionary Travel Special Grant
2010-11 Indicative
Allocations
2008-09 Concess-
ionary Travel NRE
Aggreg-ated 2008-
09 Concess-
ionary Travel NRE
Aggreg-ated 2010-
11 Concess-
ionary Travel Special Grant
Base Position Option CONCF5 Option CONCF6
Difference from Base Position
GREATER MANCHESTERBolton 127.6 4.8 4.8 1.1 128.7 0.3 0.2% 0.4 0.3%Bury 66.2 3.3 3.3 0.8 66.9 0.2 0.3% 0.2 0.3%Manchester 342.5 8.4 8.4 2.0 344.5 1.4 0.4% 2.6 0.8%Oldham 121.6 4.0 4.0 0.9 122.6 0.3 0.3% 0.5 0.4%Rochdale 109.7 3.8 3.8 0.9 110.6 0.3 0.3% 0.5 0.5%Salford 130.2 4.0 4.0 1.0 131.2 0.3 0.2% 0.6 0.5%Stockport 83.5 5.1 5.1 1.2 84.7 0.2 0.2% 0.1 0.1%Tameside 105.5 3.9 3.9 0.9 106.4 0.3 0.3% 0.5 0.5%Trafford 69.8 3.9 3.9 0.9 70.7 0.2 0.3% 0.2 0.2%Wigan 133.1 5.6 5.6 1.3 134.4 0.0 0.0% 0.1 0.1%Greater Manchester Fire 75.3 0.0 0.0 0.0 75.3 0.0 0.0% 0.0 0.0%Greater Manchester Police 472.5 0.0 0.0 0.0 472.5 -0.2 0.0% -0.2 0.0%
MERSEYSIDEKnowsley 118.5 4.7 4.7 0.9 119.4 0.2 0.2% 0.5 0.4%Liverpool 325.1 13.5 13.5 2.6 327.7 0.6 0.2% 1.8 0.5%Sefton 124.7 8.6 8.6 1.6 126.3 -0.2 -0.1% -0.2 -0.1%St Helens 88.0 5.5 5.5 1.1 89.1 -0.1 -0.1% -0.1 -0.1%Wirral 157.9 9.6 9.6 1.8 159.7 -0.2 -0.1% -0.1 -0.1%Merseyside Fire 46.3 0.0 0.0 0.0 46.3 0.0 0.0% 0.0 0.0%Merseyside Police 274.3 0.0 0.0 0.0 274.3 -0.1 0.0% -0.1 0.0%
SOUTH YORKSHIREBarnsley 109.9 5.0 5.0 0.9 110.8 0.0 0.0% 0.1 0.1%Doncaster 143.2 6.5 6.5 1.2 144.5 0.1 0.1% 0.2 0.1%Rotherham 123.4 5.7 5.7 1.1 124.4 0.2 0.2% 0.3 0.3%Sheffield 277.6 11.9 11.9 2.2 279.9 0.9 0.3% 1.4 0.5%South Yorkshire Fire 36.8 0.0 0.0 0.0 36.8 0.0 0.0% 0.0 0.0%South Yorkshire Police 209.2 0.0 0.0 0.0 209.2 0.0 0.0% 0.0 0.0%
TYNE AND WEARGateshead 105.8 6.8 6.8 1.0 106.8 0.3 0.3% 0.5 0.5%Newcastle upon Tyne 167.0 9.8 9.8 1.4 168.4 0.5 0.3% 0.8 0.5%North Tyneside 87.9 7.0 7.0 1.0 88.9 0.2 0.3% 0.3 0.3%South Tyneside 90.3 5.4 5.4 0.8 91.1 0.3 0.3% 0.5 0.5%Sunderland 157.5 10.0 10.0 1.5 158.9 0.2 0.1% 0.4 0.2%Tyne and Wear Fire 35.6 0.0 0.0 0.0 35.6 0.0 -0.1% 0.0 -0.1%Northumbria Police 256.2 0.0 0.0 0.0 256.2 0.0 0.0% 0.0 0.0%
WEST MIDLANDSBirmingham 678.1 25.6 25.6 5.0 683.1 2.3 0.3% 3.6 0.5%Coventry 153.0 7.8 7.8 1.5 154.6 0.6 0.4% 0.8 0.5%Dudley 125.6 7.7 7.7 1.5 127.1 0.3 0.2% 0.2 0.1%Sandwell 183.3 7.3 7.3 1.4 184.8 0.5 0.2% 0.8 0.4%Solihull 54.6 5.2 5.2 1.0 55.7 0.2 0.3% -0.3 -0.5%Walsall 137.3 6.4 6.4 1.3 138.5 0.2 0.2% 0.3 0.2%Wolverhampton 144.1 5.9 5.9 1.2 145.3 0.3 0.2% 0.5 0.4%West Midlands Fire 80.8 0.0 0.0 0.0 80.8 0.0 0.0% 0.0 0.0%West Midlands Police 504.3 0.0 0.0 0.0 504.3 -0.4 -0.1% -0.4 -0.1%
295

Formula Grant After Floor Damping
(£ million) (£ million) (£ million) (£ million) (£ million) (£ million) (%) (£ million) (%)
Base Position = 2010-11 Agreed Position - 2008-09 Concessionary Travel NRE + 2008-09 Aggregated Concessionary Travel NRE + Aggregated 2010-11 Concessionary Travel Special Grant
2010-11 Indicative
Allocations
2008-09 Concess-
ionary Travel NRE
Aggreg-ated 2008-
09 Concess-
ionary Travel NRE
Aggreg-ated 2010-
11 Concess-
ionary Travel Special Grant
Base Position Option CONCF5 Option CONCF6
Difference from Base Position
WEST YORKSHIREBradford 272.0 8.3 8.3 2.1 274.1 1.1 0.4% 1.6 0.6%Calderdale 81.5 3.3 3.3 0.8 82.4 0.3 0.4% 0.5 0.6%Kirklees 157.2 6.7 6.7 1.7 158.8 0.7 0.5% 0.9 0.6%Leeds 303.5 12.8 12.8 3.2 306.7 1.7 0.5% 2.1 0.7%Wakefield 141.3 5.3 5.3 1.3 142.6 0.2 0.2% 0.3 0.2%West Yorkshire Fire 57.5 0.0 0.0 0.0 57.5 0.0 0.0% 0.0 0.0%West Yorkshire Police 350.5 0.0 0.0 0.0 350.5 -0.1 0.0% -0.1 0.0%
296

Formula Grant After Floor Damping
(£ million) (£ million) (£ million) (£ million) (£ million) (£ million) (%) (£ million) (%)
Base Position = 2010-11 Agreed Position - 2008-09 Concessionary Travel NRE + 2008-09 Aggregated Concessionary Travel NRE + Aggregated 2010-11 Concessionary Travel Special Grant
2010-11 Indicative
Allocations
2008-09 Concess-
ionary Travel NRE
Aggreg-ated 2008-
09 Concess-
ionary Travel NRE
Aggreg-ated 2010-
11 Concess-
ionary Travel Special Grant
Base Position Option CONCF5 Option CONCF6
Difference from Base Position
ALL PURPOSE AUTHORITIES
Bath & North East Somerset 41.6 3.0 3.0 1.2 42.8 -0.3 -0.6% -0.3 -0.8%Bedford 54.1 1.7 1.7 0.5 54.6 0.2 0.3% 0.3 0.5%Blackburn with Darwen 81.6 2.4 2.4 0.5 82.2 0.2 0.2% 0.4 0.5%Blackpool 81.8 3.7 3.7 2.3 84.1 -0.9 -1.1% -1.2 -1.5%Bournemouth 55.0 2.8 2.8 1.3 56.3 0.1 0.1% -0.4 -0.8%
Bracknell Forest 26.1 0.7 0.7 0.3 26.4 0.1 0.3% 0.1 0.4%Brighton & Hove 109.2 5.8 5.8 1.8 111.0 0.3 0.3% 0.0 0.0%Bristol 166.9 5.8 5.8 1.9 168.9 1.1 0.6% 1.4 0.8%Central Bedfordshire 50.6 1.5 1.5 0.6 51.2 0.2 0.5% 0.3 0.6%Cheshire East 63.2 2.4 2.4 1.0 64.2 -0.2 -0.3% -0.4 -0.6%
Cheshire West & Chester 93.5 3.3 3.3 1.2 94.7 -0.2 -0.2% -0.3 -0.3%Cornwall 213.1 3.4 3.4 3.5 216.6 -1.2 -0.6% -2.6 -1.2%Darlington 38.8 2.8 2.8 1.4 40.2 -0.8 -2.0% -0.8 -2.0%Derby 109.7 5.8 5.8 3.8 113.5 -2.5 -2.2% -2.3 -2.1%Durham 230.6 7.6 7.6 1.5 232.2 0.0 0.0% 0.6 0.3%
East Riding of Yorkshire 101.4 3.2 3.2 0.9 102.3 -0.2 -0.2% -0.2 -0.2%Halton 64.0 1.7 1.7 0.3 64.3 0.0 0.1% 0.2 0.4%Hartlepool 51.5 1.3 1.3 0.4 51.9 0.1 0.2% 0.2 0.5%Herefordshire 57.6 1.6 1.6 0.7 58.3 -0.6 -1.0% -0.7 -1.2%Isle of Wight Council 61.4 4.9 4.9 1.8 63.2 -1.1 -1.7% -1.3 -2.1%
Kingston upon Hull 152.0 5.3 5.3 1.9 153.9 0.1 0.0% 0.4 0.3%Leicester 182.4 5.4 5.4 2.3 184.7 -0.1 -0.1% 0.0 0.0%Luton 89.9 3.3 3.3 2.0 91.9 -1.0 -1.1% -0.6 -0.7%Medway 85.2 3.0 3.0 0.7 85.9 0.7 0.8% 1.0 1.2%Middlesbrough 83.6 2.3 2.3 0.6 84.2 0.2 0.2% 0.4 0.4%
Milton Keynes 87.3 1.8 1.8 0.8 88.1 0.2 0.2% 0.3 0.3%North East Lincolnshire 72.8 1.6 1.6 0.6 73.4 0.3 0.4% 0.4 0.6%North Lincolnshire 62.3 1.3 1.3 0.5 62.8 -0.1 -0.1% 0.0 0.0%North Somerset 52.0 2.0 2.0 0.7 52.7 -0.2 -0.3% -0.2 -0.3%Northumberland 129.8 2.7 2.7 1.3 131.0 -0.4 -0.3% -0.4 -0.3%
Nottingham 172.6 7.5 7.5 4.4 177.0 -1.8 -1.0% -1.9 -1.1%Peterborough 77.0 2.1 2.1 1.5 78.5 -0.6 -0.8% -0.6 -0.8%Plymouth 106.0 3.9 3.9 1.1 107.2 0.4 0.4% 0.5 0.5%Poole 26.9 2.0 2.0 0.6 27.5 0.1 0.3% -0.2 -0.7%Portsmouth 87.5 3.1 3.1 0.9 88.4 0.7 0.7% 0.8 1.0%
Reading 55.4 2.1 2.1 1.0 56.3 0.2 0.3% -0.1 -0.2%Redcar and Cleveland 68.7 2.1 2.1 0.4 69.2 0.1 0.1% 0.3 0.5%Rutland 7.7 0.0 0.0 0.1 7.8 -0.1 -1.1% -0.1 -1.5%Shropshire 93.1 1.9 1.9 0.9 94.1 -0.6 -0.7% -0.8 -0.9%Slough 56.8 1.8 1.8 1.1 57.8 -0.5 -0.9% -0.3 -0.5%
South Gloucestershire 60.8 1.8 1.8 0.3 61.1 0.5 0.9% 0.5 0.8%Southampton 100.2 2.5 2.5 1.1 101.3 0.6 0.6% 0.7 0.7%Southend-on-Sea 61.5 1.7 1.7 0.3 61.8 0.6 1.1% 0.8 1.3%Stockton-on-Tees 78.2 2.5 2.5 0.7 78.9 0.2 0.3% 0.3 0.4%Stoke-on-Trent 127.3 4.0 4.0 1.2 128.5 -0.1 0.0% 0.2 0.2%
297

Formula Grant After Floor Damping
(£ million) (£ million) (£ million) (£ million) (£ million) (£ million) (%) (£ million) (%)
Base Position = 2010-11 Agreed Position - 2008-09 Concessionary Travel NRE + 2008-09 Aggregated Concessionary Travel NRE + Aggregated 2010-11 Concessionary Travel Special Grant
2010-11 Indicative
Allocations
2008-09 Concess-
ionary Travel NRE
Aggreg-ated 2008-
09 Concess-
ionary Travel NRE
Aggreg-ated 2010-
11 Concess-
ionary Travel Special Grant
Base Position Option CONCF5 Option CONCF6
Difference from Base Position
Swindon 50.6 2.0 2.0 0.8 51.4 0.1 0.3% 0.1 0.3%Telford and the Wrekin 70.6 1.6 1.6 0.5 71.1 0.1 0.1% 0.2 0.2%Thurrock 59.8 0.8 0.8 0.2 60.0 0.6 0.9% 0.7 1.2%Torbay 59.0 3.1 3.1 1.6 60.6 -0.6 -1.0% -0.9 -1.4%Warrington 54.0 3.0 3.0 1.2 55.2 -0.4 -0.6% -0.4 -0.7%
West Berkshire 29.2 0.5 0.5 0.2 29.5 0.2 0.7% 0.2 0.5%Wiltshire 102.2 3.3 3.3 1.2 103.4 0.3 0.3% 0.1 0.1%Windsor and Maidenhead 18.8 1.0 1.0 0.3 19.1 0.1 0.3% 0.0 0.1%Wokingham 19.6 1.1 1.1 0.2 19.8 0.1 0.3% -0.1 -0.6%York 44.6 3.5 3.5 1.5 46.1 -0.1 -0.2% -0.4 -0.8%
Isles of Scilly 2.3 0.0 0.0 0.1 2.3 0.0 0.0% 0.0 0.0%
298

Formula Grant After Floor Damping
(£ million) (£ million) (£ million) (£ million) (£ million) (£ million) (%) (£ million) (%)
Base Position = 2010-11 Agreed Position - 2008-09 Concessionary Travel NRE + 2008-09 Aggregated Concessionary Travel NRE + Aggregated 2010-11 Concessionary Travel Special Grant
2010-11 Indicative
Allocations
2008-09 Concess-
ionary Travel NRE
Aggreg-ated 2008-
09 Concess-
ionary Travel NRE
Aggreg-ated 2010-
11 Concess-
ionary Travel Special Grant
Base Position Option CONCF5 Option CONCF6
Difference from Base Position
SHIRE COUNTIES
Buckinghamshire 59.6 0.0 5.5 0.0 65.1 1.4 2.1% 1.2 1.8%Cambridgeshire 111.1 0.0 3.5 0.0 114.6 2.4 2.1% 2.2 2.0%Cumbria 144.6 0.0 5.3 0.0 149.9 2.9 1.9% 2.1 1.4%Derbyshire 185.2 0.0 9.8 0.0 195.1 2.3 1.2% 2.6 1.3%Devon 161.2 0.0 5.8 0.0 167.0 3.5 2.1% 2.4 1.4%
Dorset 50.8 0.0 2.5 0.0 53.3 1.8 3.4% 1.2 2.2%East Sussex 100.2 0.0 4.7 0.0 104.9 2.2 2.1% 2.2 2.1%Essex 246.8 0.0 13.9 0.0 260.7 4.7 1.8% 5.0 1.9%Gloucestershire 117.0 0.0 4.6 0.0 121.6 2.4 2.0% 2.2 1.8%Hampshire 146.8 0.0 11.5 0.0 158.4 3.8 2.4% 3.4 2.1%
Hertfordshire 176.0 0.0 10.4 0.0 186.4 3.6 1.9% 4.3 2.3%Kent 275.9 0.0 15.4 0.0 291.2 5.6 1.9% 5.8 2.0%Lancashire 302.2 0.0 17.2 0.0 319.4 4.4 1.4% 4.9 1.5%Leicestershire 100.7 0.0 3.9 0.0 104.6 2.1 2.1% 2.2 2.1%Lincolnshire 192.1 0.0 4.5 0.0 196.7 3.0 1.5% 2.3 1.2%
Norfolk 238.3 0.0 7.0 0.0 245.4 3.8 1.6% 3.0 1.2%North Yorkshire 104.4 0.0 5.2 0.0 109.6 2.3 2.1% 1.5 1.4%Northamptonshire 154.2 0.0 5.0 0.0 159.2 3.0 1.9% 3.3 2.1%Nottinghamshire 176.2 0.0 7.5 0.0 183.7 2.8 1.5% 3.0 1.7%Oxfordshire 106.3 0.0 6.1 0.0 112.4 2.6 2.3% 2.2 2.0%
Somerset 110.0 0.0 5.1 0.0 115.1 1.8 1.5% 1.5 1.3%Staffordshire 157.3 0.0 8.4 0.0 165.7 2.6 1.6% 2.5 1.5%Suffolk 169.0 0.0 8.4 0.0 177.4 2.0 1.1% 1.8 1.0%Surrey 127.5 0.0 5.4 0.0 132.9 3.1 2.4% 2.8 2.1%Warwickshire 92.1 0.0 4.9 0.0 97.0 1.9 2.0% 2.0 2.1%
West Sussex 98.7 0.0 8.6 0.0 107.3 2.7 2.5% 2.6 2.4%Worcestershire 90.2 0.0 5.0 0.0 95.2 1.8 1.9% 1.7 1.8%
299

Formula Grant After Floor Damping
(£ million) (£ million) (£ million) (£ million) (£ million) (£ million) (%) (£ million) (%)
Base Position = 2010-11 Agreed Position - 2008-09 Concessionary Travel NRE + 2008-09 Aggregated Concessionary Travel NRE + Aggregated 2010-11 Concessionary Travel Special Grant
2010-11 Indicative
Allocations
2008-09 Concess-
ionary Travel NRE
Aggreg-ated 2008-
09 Concess-
ionary Travel NRE
Aggreg-ated 2010-
11 Concess-
ionary Travel Special Grant
Base Position Option CONCF5 Option CONCF6
Difference from Base Position
BUCKINGHAMSHIREAylesbury Vale 11.9 1.2 0.0 0.4 11.1 -0.8 -7.6% -0.8 -7.6%Chiltern 4.0 1.1 0.0 0.2 3.1 -0.3 -9.6% -0.3 -9.6%South Bucks 3.0 0.7 0.0 0.2 2.5 -0.3 -10.9% -0.3 -10.9%Wycombe 10.1 2.5 0.0 0.4 8.0 -0.4 -4.5% -0.4 -4.5%
CAMBRIDGESHIRECambridge 12.4 2.1 0.0 2.0 12.3 -2.0 -16.0% -2.0 -16.0%East Cambridgeshire 6.8 0.1 0.0 0.1 6.7 -0.4 -5.4% -0.4 -5.4%Fenland 9.6 0.3 0.0 0.2 9.6 -0.8 -8.2% -0.8 -8.2%Huntingdonshire 12.9 0.7 0.0 0.5 12.7 -1.1 -8.8% -1.1 -8.8%South Cambridgeshire 7.8 0.3 0.0 0.1 7.6 -0.4 -5.4% -0.4 -5.4%
CUMBRIAAllerdale 10.6 1.2 0.0 0.5 10.0 -0.9 -9.2% -0.9 -9.2%Barrow-in-Furness 9.1 0.7 0.0 0.2 8.5 -0.5 -6.1% -0.5 -6.1%Carlisle 10.4 2.0 0.0 0.5 9.0 -0.6 -7.2% -0.6 -7.2%Copeland 7.2 0.5 0.0 0.1 6.8 -0.4 -5.3% -0.4 -5.3%Eden 4.6 0.1 0.0 0.2 4.8 -0.5 -9.5% -0.5 -9.5%South Lakeland 6.9 0.8 0.0 0.9 7.0 -1.2 -16.8% -1.2 -16.8%
DERBYSHIREAmber Valley 9.9 1.5 0.0 0.3 8.7 -0.6 -6.3% -0.6 -6.3%Bolsover 7.9 0.7 0.0 0.2 7.4 -0.5 -6.6% -0.5 -6.6%Chesterfield 10.2 3.1 0.0 2.3 9.4 -1.8 -19.7% -1.8 -19.7%Derbyshire Dales 4.8 0.4 0.0 0.1 4.5 -0.3 -6.6% -0.3 -6.6%Erewash 9.7 1.8 0.0 0.8 8.7 -0.8 -8.8% -0.8 -8.8%High Peak 7.1 1.0 0.0 0.3 6.5 -0.5 -7.2% -0.5 -7.2%North East Derbyshire 7.9 0.9 0.0 0.2 7.1 -0.5 -6.5% -0.5 -6.5%South Derbyshire 7.3 0.5 0.0 0.1 6.9 -0.5 -6.7% -0.5 -6.7%
DEVONEast Devon 8.2 1.1 0.0 0.6 7.7 -1.0 -13.0% -1.0 -13.0%Exeter 12.1 2.6 0.0 2.3 11.8 -2.0 -17.2% -2.0 -17.2%Mid Devon 6.2 0.3 0.0 0.1 5.9 -0.4 -6.8% -0.4 -6.8%North Devon 8.3 0.1 0.0 0.3 8.5 -0.8 -9.3% -0.8 -9.3%South Hams 5.5 0.3 0.0 0.2 5.4 -0.4 -7.9% -0.4 -7.9%Teignbridge 9.9 1.0 0.0 0.5 9.5 -1.0 -10.6% -1.0 -10.6%Torridge 6.4 0.2 0.0 0.1 6.3 -0.5 -7.8% -0.5 -7.8%West Devon 4.3 0.2 0.0 0.1 4.3 -0.3 -7.3% -0.3 -7.3%
DORSETChristchurch 2.9 0.5 0.0 0.2 2.6 -0.3 -10.5% -0.3 -10.5%East Dorset 3.7 0.4 0.0 0.1 3.4 -0.3 -8.1% -0.3 -8.1%North Dorset 4.6 0.1 0.0 0.1 4.5 -0.3 -7.4% -0.3 -7.4%Purbeck 3.3 0.3 0.0 0.1 3.1 -0.2 -7.3% -0.2 -7.3%West Dorset 8.3 0.4 0.0 0.3 8.2 -0.6 -7.4% -0.6 -7.4%Weymouth and Portland 6.0 0.8 0.0 0.5 5.8 -0.7 -11.5% -0.7 -11.5%
EAST SUSSEXEastbourne 10.4 1.9 0.0 1.0 9.5 -1.0 -10.0% -1.0 -10.0%Hastings 10.4 1.2 0.0 0.6 9.9 -1.0 -10.0% -1.0 -10.0%Lewes 6.4 0.7 0.0 0.1 5.8 -0.4 -6.1% -0.4 -6.1%Rother 6.6 0.3 0.0 0.2 6.4 -0.4 -6.6% -0.4 -6.6%Wealden 8.3 0.6 0.0 0.1 7.7 -0.6 -7.1% -0.6 -7.1%
300

Formula Grant After Floor Damping
(£ million) (£ million) (£ million) (£ million) (£ million) (£ million) (%) (£ million) (%)
Base Position = 2010-11 Agreed Position - 2008-09 Concessionary Travel NRE + 2008-09 Aggregated Concessionary Travel NRE + Aggregated 2010-11 Concessionary Travel Special Grant
2010-11 Indicative
Allocations
2008-09 Concess-
ionary Travel NRE
Aggreg-ated 2008-
09 Concess-
ionary Travel NRE
Aggreg-ated 2010-
11 Concess-
ionary Travel Special Grant
Base Position Option CONCF5 Option CONCF6
Difference from Base Position
ESSEXBasildon 15.9 1.8 0.0 0.5 14.6 -1.0 -6.8% -1.0 -6.8%Braintree 10.2 1.2 0.0 0.3 9.3 -0.7 -7.3% -0.7 -7.3%Brentwood 5.2 0.5 0.0 0.2 4.9 -0.4 -7.3% -0.4 -7.3%Castle Point 6.6 0.9 0.0 0.2 5.9 -0.3 -5.8% -0.3 -5.8%Chelmsford 10.5 1.9 0.0 0.8 9.3 -0.7 -7.8% -0.7 -7.8%Colchester 12.9 2.5 0.0 0.6 11.0 -0.5 -4.6% -0.5 -4.6%Epping Forest 9.4 0.5 0.0 0.1 9.0 -0.5 -5.1% -0.5 -5.1%Harlow 8.9 1.4 0.0 0.4 7.9 -0.7 -8.6% -0.7 -8.6%Maldon 4.4 0.5 0.0 0.1 4.1 -0.3 -8.0% -0.3 -8.0%Rochford 5.1 0.8 0.0 0.1 4.5 -0.2 -5.5% -0.2 -5.5%Tendring 14.2 1.6 0.0 0.5 13.1 -1.1 -8.2% -1.1 -8.2%Uttlesford 4.1 0.2 0.0 0.1 4.0 -0.2 -6.0% -0.2 -6.0%
GLOUCESTERSHIRECheltenham 8.8 1.4 0.0 0.6 8.1 -0.8 -9.6% -0.8 -9.6%Cotswold 5.4 0.1 0.0 0.2 5.4 -0.5 -9.0% -0.5 -9.0%Forest of Dean 6.8 0.6 0.0 0.2 6.4 -0.5 -8.1% -0.5 -8.1%Gloucester 10.9 1.2 0.0 0.5 10.2 -0.8 -8.3% -0.8 -8.3%Stroud 7.2 0.8 0.0 0.2 6.6 -0.6 -8.6% -0.6 -8.6%Tewkesbury 5.3 0.6 0.0 0.1 4.9 -0.4 -7.4% -0.4 -7.4%
HAMPSHIREBasingstoke and Deane 10.1 2.3 0.0 0.4 8.2 -0.2 -2.2% -0.2 -2.2%East Hampshire 6.2 0.5 0.0 0.1 5.8 -0.3 -5.6% -0.3 -5.6%Eastleigh 7.8 1.1 0.0 0.3 7.0 -0.4 -5.9% -0.4 -5.9%Fareham 6.2 1.5 0.0 0.7 5.5 -0.7 -11.8% -0.7 -11.8%Gosport 7.3 1.2 0.0 0.2 6.3 -0.3 -4.1% -0.3 -4.1%Hart 3.9 0.2 0.0 0.1 3.8 -0.2 -6.0% -0.2 -6.0%Havant 9.9 1.2 0.0 0.3 9.0 -0.6 -6.6% -0.6 -6.6%New Forest 11.6 1.0 0.0 0.5 11.2 -1.0 -9.3% -1.0 -9.3%Rushmoor 7.0 0.8 0.0 0.4 6.6 -0.6 -9.6% -0.6 -9.6%Test Valley 7.1 1.0 0.0 0.3 6.4 -0.5 -7.2% -0.5 -7.2%Winchester 7.0 0.9 0.0 0.3 6.4 -0.5 -8.1% -0.5 -8.1%
HERTFORDSHIREBroxbourne 7.0 1.1 0.0 0.4 6.2 -0.5 -7.7% -0.5 -7.7%Dacorum 9.7 1.8 0.0 0.3 8.2 -0.4 -5.2% -0.4 -5.2%East Hertfordshire 8.2 0.9 0.0 0.3 7.5 -0.6 -7.6% -0.6 -7.6%Hertsmere 7.9 0.6 0.0 0.2 7.5 -0.5 -6.9% -0.5 -6.9%North Hertfordshire 8.1 1.0 0.0 0.3 7.3 -0.5 -7.2% -0.5 -7.2%St Albans 7.7 0.3 0.0 0.7 8.1 -0.9 -11.8% -0.9 -11.8%Stevenage 7.9 1.6 0.0 0.4 6.6 -0.3 -4.6% -0.3 -4.6%Three Rivers 5.7 0.8 0.0 0.1 5.0 -0.3 -6.6% -0.3 -6.6%Watford 8.1 1.2 0.0 0.6 7.4 -0.9 -11.8% -0.9 -11.8%Welwyn Hatfield 7.9 1.0 0.0 0.3 7.1 -0.4 -6.2% -0.4 -6.2%
301

Formula Grant After Floor Damping
(£ million) (£ million) (£ million) (£ million) (£ million) (£ million) (%) (£ million) (%)
Base Position = 2010-11 Agreed Position - 2008-09 Concessionary Travel NRE + 2008-09 Aggregated Concessionary Travel NRE + Aggregated 2010-11 Concessionary Travel Special Grant
2010-11 Indicative
Allocations
2008-09 Concess-
ionary Travel NRE
Aggreg-ated 2008-
09 Concess-
ionary Travel NRE
Aggreg-ated 2010-
11 Concess-
ionary Travel Special Grant
Base Position Option CONCF5 Option CONCF6
Difference from Base Position
KENTAshford 8.3 0.8 0.0 0.2 7.7 -0.5 -7.1% -0.5 -7.1%Canterbury 13.2 2.4 0.0 0.8 11.7 -0.8 -6.9% -0.8 -6.9%Dartford 7.5 0.9 0.0 0.4 7.0 -0.6 -8.2% -0.6 -8.2%Dover 10.2 1.3 0.0 0.3 9.3 -0.7 -7.7% -0.7 -7.7%Gravesham 8.4 1.3 0.0 0.4 7.6 -0.5 -7.0% -0.5 -7.0%Maidstone 9.5 2.0 0.0 0.5 8.0 -0.6 -7.6% -0.6 -7.6%Sevenoaks 6.3 0.7 0.0 0.1 5.8 -0.3 -5.7% -0.3 -5.7%Shepway 10.0 1.5 0.0 0.4 8.9 -0.6 -6.6% -0.6 -6.6%Swale 12.1 0.9 0.0 0.1 11.4 -0.6 -5.7% -0.6 -5.7%Thanet 13.3 1.6 0.0 0.8 12.5 -1.3 -10.5% -1.3 -10.5%Tonbridge and Malling 6.5 0.8 0.0 0.1 5.9 -0.3 -5.8% -0.3 -5.8%Tunbridge Wells 7.0 1.3 0.0 0.4 6.2 -0.7 -10.9% -0.7 -10.9%
LANCASHIREBurnley 11.9 1.5 0.0 0.5 10.9 -0.8 -7.6% -0.8 -7.6%Chorley 8.5 1.2 0.0 0.7 8.0 -0.9 -11.6% -0.9 -11.6%Fylde 5.9 1.1 0.0 0.7 5.4 -0.7 -12.9% -0.7 -12.9%Hyndburn 10.2 1.1 0.0 0.3 9.4 -0.7 -7.1% -0.7 -7.1%Lancaster 16.4 2.3 0.0 1.2 15.3 -1.4 -9.3% -1.4 -9.3%Pendle 11.1 0.8 0.0 0.1 10.5 -0.6 -5.5% -0.6 -5.5%Preston 16.0 4.1 0.0 1.9 13.8 -1.4 -10.3% -1.4 -10.3%Ribble Valley 4.1 0.5 0.0 0.2 3.8 -0.3 -8.8% -0.3 -8.8%Rossendale 6.3 0.9 0.0 0.2 5.6 -0.4 -7.7% -0.4 -7.7%South Ribble 7.5 1.0 0.0 0.1 6.7 -0.3 -4.7% -0.3 -4.7%West Lancashire 9.6 1.1 0.0 0.3 8.8 -0.7 -7.6% -0.7 -7.6%Wyre 10.4 1.6 0.0 0.4 9.2 -0.6 -6.6% -0.6 -6.6%
LEICESTERSHIREBlaby 6.4 0.5 0.0 0.3 6.2 -0.5 -8.6% -0.5 -8.6%Charnwood 12.5 1.3 0.0 0.6 11.8 -0.9 -7.6% -0.9 -7.6%Harborough 5.4 0.2 0.0 0.1 5.3 -0.4 -7.6% -0.4 -7.6%Hinckley and Bosworth 7.4 0.7 0.0 0.4 7.1 -0.7 -10.2% -0.7 -10.2%Melton 3.9 0.2 0.0 0.1 3.8 -0.3 -7.8% -0.3 -7.8%North West Leicestershire 7.1 0.5 0.0 0.2 6.8 -0.6 -8.1% -0.6 -8.1%Oadby and Wigston 4.6 0.4 0.0 0.3 4.5 -0.4 -8.8% -0.4 -8.8%
LINCOLNSHIREBoston 7.3 0.3 0.0 0.2 7.1 -0.6 -8.7% -0.6 -8.7%East Lindsey 17.4 1.0 0.0 1.0 17.3 -2.0 -11.4% -2.0 -11.4%Lincoln 10.6 1.3 0.0 0.8 10.1 -1.1 -10.8% -1.1 -10.8%North Kesteven 8.8 0.6 0.0 0.2 8.3 -0.6 -7.6% -0.6 -7.6%South Holland 9.0 0.4 0.0 0.2 8.8 -0.7 -8.4% -0.7 -8.4%South Kesteven 10.1 0.5 0.0 0.4 10.1 -0.9 -8.5% -0.9 -8.5%West Lindsey 8.2 0.5 0.0 0.1 7.8 -0.5 -6.4% -0.5 -6.4%
NORFOLKBreckland 11.3 0.3 0.0 0.1 11.2 -0.7 -6.7% -0.7 -6.7%Broadland 8.5 0.7 0.0 0.1 7.9 -0.5 -6.9% -0.5 -6.9%Great Yarmouth 10.8 1.0 0.0 1.0 10.8 -1.5 -13.9% -1.5 -13.9%King's Lynn and West Norfolk 15.4 0.8 0.0 0.5 15.1 -1.4 -9.0% -1.4 -9.0%North Norfolk 9.0 0.3 0.0 0.2 9.0 -0.7 -7.6% -0.7 -7.6%Norwich 15.9 2.8 0.0 2.3 15.5 -2.3 -14.9% -2.3 -14.9%South Norfolk 8.4 1.2 0.0 0.4 7.7 -0.7 -9.7% -0.7 -9.7%
302
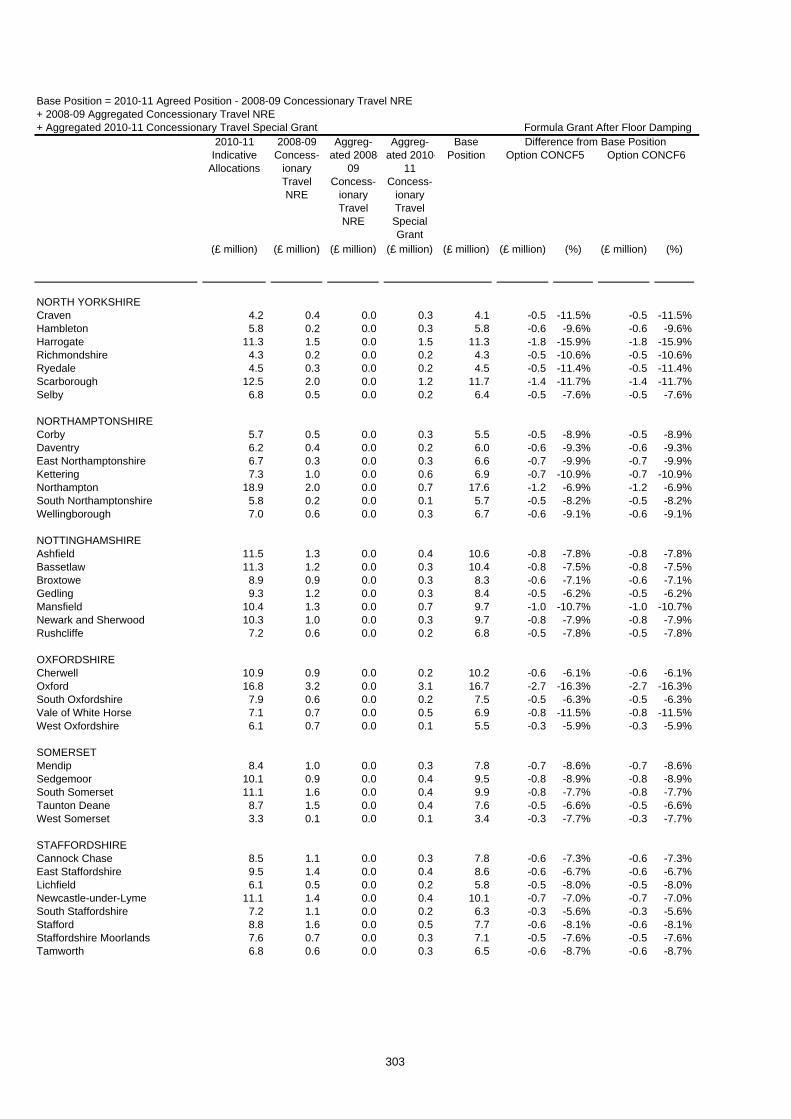
Formula Grant After Floor Damping
(£ million) (£ million) (£ million) (£ million) (£ million) (£ million) (%) (£ million) (%)
Base Position = 2010-11 Agreed Position - 2008-09 Concessionary Travel NRE + 2008-09 Aggregated Concessionary Travel NRE + Aggregated 2010-11 Concessionary Travel Special Grant
2010-11 Indicative
Allocations
2008-09 Concess-
ionary Travel NRE
Aggreg-ated 2008-
09 Concess-
ionary Travel NRE
Aggreg-ated 2010-
11 Concess-
ionary Travel Special Grant
Base Position Option CONCF5 Option CONCF6
Difference from Base Position
NORTH YORKSHIRECraven 4.2 0.4 0.0 0.3 4.1 -0.5 -11.5% -0.5 -11.5%Hambleton 5.8 0.2 0.0 0.3 5.8 -0.6 -9.6% -0.6 -9.6%Harrogate 11.3 1.5 0.0 1.5 11.3 -1.8 -15.9% -1.8 -15.9%Richmondshire 4.3 0.2 0.0 0.2 4.3 -0.5 -10.6% -0.5 -10.6%Ryedale 4.5 0.3 0.0 0.2 4.5 -0.5 -11.4% -0.5 -11.4%Scarborough 12.5 2.0 0.0 1.2 11.7 -1.4 -11.7% -1.4 -11.7%Selby 6.8 0.5 0.0 0.2 6.4 -0.5 -7.6% -0.5 -7.6%
NORTHAMPTONSHIRECorby 5.7 0.5 0.0 0.3 5.5 -0.5 -8.9% -0.5 -8.9%Daventry 6.2 0.4 0.0 0.2 6.0 -0.6 -9.3% -0.6 -9.3%East Northamptonshire 6.7 0.3 0.0 0.3 6.6 -0.7 -9.9% -0.7 -9.9%Kettering 7.3 1.0 0.0 0.6 6.9 -0.7 -10.9% -0.7 -10.9%Northampton 18.9 2.0 0.0 0.7 17.6 -1.2 -6.9% -1.2 -6.9%South Northamptonshire 5.8 0.2 0.0 0.1 5.7 -0.5 -8.2% -0.5 -8.2%Wellingborough 7.0 0.6 0.0 0.3 6.7 -0.6 -9.1% -0.6 -9.1%
NOTTINGHAMSHIREAshfield 11.5 1.3 0.0 0.4 10.6 -0.8 -7.8% -0.8 -7.8%Bassetlaw 11.3 1.2 0.0 0.3 10.4 -0.8 -7.5% -0.8 -7.5%Broxtowe 8.9 0.9 0.0 0.3 8.3 -0.6 -7.1% -0.6 -7.1%Gedling 9.3 1.2 0.0 0.3 8.4 -0.5 -6.2% -0.5 -6.2%Mansfield 10.4 1.3 0.0 0.7 9.7 -1.0 -10.7% -1.0 -10.7%Newark and Sherwood 10.3 1.0 0.0 0.3 9.7 -0.8 -7.9% -0.8 -7.9%Rushcliffe 7.2 0.6 0.0 0.2 6.8 -0.5 -7.8% -0.5 -7.8%
OXFORDSHIRECherwell 10.9 0.9 0.0 0.2 10.2 -0.6 -6.1% -0.6 -6.1%Oxford 16.8 3.2 0.0 3.1 16.7 -2.7 -16.3% -2.7 -16.3%South Oxfordshire 7.9 0.6 0.0 0.2 7.5 -0.5 -6.3% -0.5 -6.3%Vale of White Horse 7.1 0.7 0.0 0.5 6.9 -0.8 -11.5% -0.8 -11.5%West Oxfordshire 6.1 0.7 0.0 0.1 5.5 -0.3 -5.9% -0.3 -5.9%
SOMERSETMendip 8.4 1.0 0.0 0.3 7.8 -0.7 -8.6% -0.7 -8.6%Sedgemoor 10.1 0.9 0.0 0.4 9.5 -0.8 -8.9% -0.8 -8.9%South Somerset 11.1 1.6 0.0 0.4 9.9 -0.8 -7.7% -0.8 -7.7%Taunton Deane 8.7 1.5 0.0 0.4 7.6 -0.5 -6.6% -0.5 -6.6%West Somerset 3.3 0.1 0.0 0.1 3.4 -0.3 -7.7% -0.3 -7.7%
STAFFORDSHIRECannock Chase 8.5 1.1 0.0 0.3 7.8 -0.6 -7.3% -0.6 -7.3%East Staffordshire 9.5 1.4 0.0 0.4 8.6 -0.6 -6.7% -0.6 -6.7%Lichfield 6.1 0.5 0.0 0.2 5.8 -0.5 -8.0% -0.5 -8.0%Newcastle-under-Lyme 11.1 1.4 0.0 0.4 10.1 -0.7 -7.0% -0.7 -7.0%South Staffordshire 7.2 1.1 0.0 0.2 6.3 -0.3 -5.6% -0.3 -5.6%Stafford 8.8 1.6 0.0 0.5 7.7 -0.6 -8.1% -0.6 -8.1%Staffordshire Moorlands 7.6 0.7 0.0 0.3 7.1 -0.5 -7.6% -0.5 -7.6%Tamworth 6.8 0.6 0.0 0.3 6.5 -0.6 -8.7% -0.6 -8.7%
303

Formula Grant After Floor Damping
(£ million) (£ million) (£ million) (£ million) (£ million) (£ million) (%) (£ million) (%)
Base Position = 2010-11 Agreed Position - 2008-09 Concessionary Travel NRE + 2008-09 Aggregated Concessionary Travel NRE + Aggregated 2010-11 Concessionary Travel Special Grant
2010-11 Indicative
Allocations
2008-09 Concess-
ionary Travel NRE
Aggreg-ated 2008-
09 Concess-
ionary Travel NRE
Aggreg-ated 2010-
11 Concess-
ionary Travel Special Grant
Base Position Option CONCF5 Option CONCF6
Difference from Base Position
SUFFOLKBabergh 6.2 0.8 0.0 0.1 5.5 -0.3 -5.4% -0.3 -5.4%Forest Heath 5.6 0.4 0.0 0.1 5.3 -0.3 -5.8% -0.3 -5.8%Ipswich 11.9 2.9 0.0 0.6 9.6 -0.3 -2.6% -0.3 -2.6%Mid Suffolk 6.3 0.7 0.0 0.1 5.7 -0.4 -6.5% -0.4 -6.5%St Edmundsbury 7.1 0.9 0.0 0.2 6.3 -0.4 -6.6% -0.4 -6.6%Suffolk Coastal 8.3 1.1 0.0 0.1 7.2 -0.4 -5.7% -0.4 -5.7%Waveney 11.7 1.5 0.0 0.6 10.8 -0.9 -8.4% -0.9 -8.4%
SURREYElmbridge 6.5 0.2 0.0 0.1 6.4 -0.4 -6.4% -0.4 -6.4%Epsom and Ewell 4.2 0.2 0.0 0.1 4.0 -0.2 -6.2% -0.2 -6.2%Guildford 8.5 1.2 0.0 0.9 8.1 -1.0 -12.5% -1.0 -12.5%Mole Valley 4.0 0.3 0.0 0.1 3.8 -0.2 -6.4% -0.2 -6.4%Reigate and Banstead 6.9 0.7 0.0 0.3 6.5 -0.5 -8.0% -0.5 -8.0%Runnymede 5.6 0.3 0.0 0.1 5.4 -0.4 -6.7% -0.4 -6.7%Spelthorne 5.7 0.4 0.0 0.1 5.4 -0.3 -5.9% -0.3 -5.9%Surrey Heath 4.8 0.6 0.0 0.5 4.7 -0.7 -14.0% -0.7 -14.0%Tandridge 4.2 0.3 0.0 0.1 4.0 -0.2 -5.5% -0.2 -5.5%Waverley 6.1 0.6 0.0 0.3 5.7 -0.5 -8.7% -0.5 -8.7%Woking 6.6 0.7 0.0 0.3 6.3 -0.6 -9.3% -0.6 -9.3%
WARWICKSHIRENorth Warwickshire 5.4 0.4 0.0 0.1 5.2 -0.3 -6.5% -0.3 -6.5%Nuneaton and Bedworth 11.4 1.6 0.0 0.4 10.2 -0.6 -5.8% -0.6 -5.8%Rugby 7.0 0.9 0.0 0.2 6.4 -0.5 -7.4% -0.5 -7.4%Stratford-on-Avon 7.0 0.7 0.0 0.5 6.8 -0.7 -10.6% -0.7 -10.6%Warwick 10.5 1.4 0.0 0.4 9.4 -0.6 -6.1% -0.6 -6.1%
WEST SUSSEXAdur 5.0 0.7 0.0 0.1 4.4 -0.2 -4.0% -0.2 -4.0%Arun 10.3 1.6 0.0 0.6 9.3 -0.8 -9.1% -0.8 -9.1%Chichester 7.2 1.2 0.0 0.7 6.7 -1.0 -14.5% -1.0 -14.5%Crawley 10.5 1.7 0.0 0.3 9.1 -0.3 -3.3% -0.3 -3.3%Horsham 6.2 0.9 0.0 0.5 5.8 -0.7 -12.6% -0.7 -12.6%Mid Sussex 6.5 0.7 0.0 0.3 6.1 -0.5 -8.6% -0.5 -8.6%Worthing 7.9 1.8 0.0 1.0 7.2 -0.9 -12.6% -0.9 -12.6%
WORCESTERSHIREBromsgrove 5.0 0.5 0.0 0.3 4.8 -0.5 -10.7% -0.5 -10.7%Malvern Hills 5.2 0.3 0.0 0.2 5.1 -0.4 -8.4% -0.4 -8.4%Redditch 6.5 1.2 0.0 0.2 5.5 -0.2 -4.5% -0.2 -4.5%Worcester 8.2 1.7 0.0 0.5 7.1 -0.6 -7.9% -0.6 -7.9%Wychavon 7.8 0.6 0.0 0.3 7.5 -0.8 -10.7% -0.8 -10.7%Wyre Forest 8.1 0.7 0.0 0.3 7.7 -0.6 -8.4% -0.6 -8.4%
304
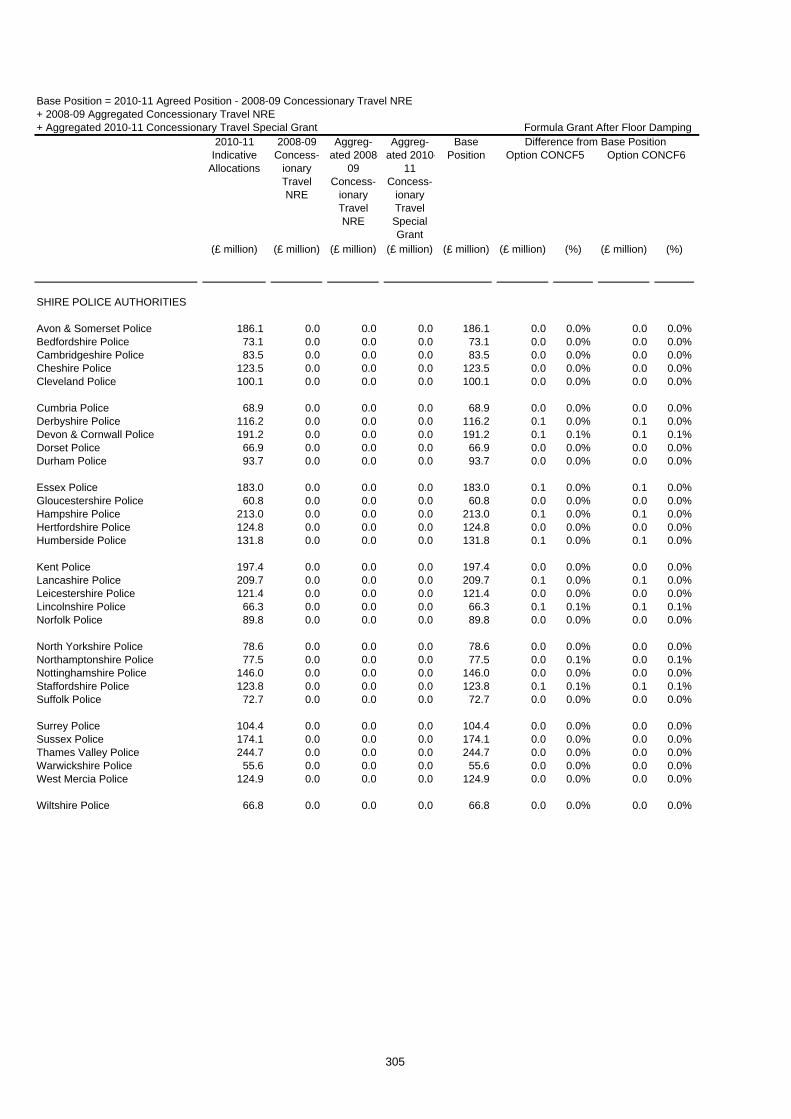
Formula Grant After Floor Damping
(£ million) (£ million) (£ million) (£ million) (£ million) (£ million) (%) (£ million) (%)
Base Position = 2010-11 Agreed Position - 2008-09 Concessionary Travel NRE + 2008-09 Aggregated Concessionary Travel NRE + Aggregated 2010-11 Concessionary Travel Special Grant
2010-11 Indicative
Allocations
2008-09 Concess-
ionary Travel NRE
Aggreg-ated 2008-
09 Concess-
ionary Travel NRE
Aggreg-ated 2010-
11 Concess-
ionary Travel Special Grant
Base Position Option CONCF5 Option CONCF6
Difference from Base Position
SHIRE POLICE AUTHORITIES
Avon & Somerset Police 186.1 0.0 0.0 0.0 186.1 0.0 0.0% 0.0 0.0%Bedfordshire Police 73.1 0.0 0.0 0.0 73.1 0.0 0.0% 0.0 0.0%Cambridgeshire Police 83.5 0.0 0.0 0.0 83.5 0.0 0.0% 0.0 0.0%Cheshire Police 123.5 0.0 0.0 0.0 123.5 0.0 0.0% 0.0 0.0%Cleveland Police 100.1 0.0 0.0 0.0 100.1 0.0 0.0% 0.0 0.0%
Cumbria Police 68.9 0.0 0.0 0.0 68.9 0.0 0.0% 0.0 0.0%Derbyshire Police 116.2 0.0 0.0 0.0 116.2 0.1 0.0% 0.1 0.0%Devon & Cornwall Police 191.2 0.0 0.0 0.0 191.2 0.1 0.1% 0.1 0.1%Dorset Police 66.9 0.0 0.0 0.0 66.9 0.0 0.0% 0.0 0.0%Durham Police 93.7 0.0 0.0 0.0 93.7 0.0 0.0% 0.0 0.0%
Essex Police 183.0 0.0 0.0 0.0 183.0 0.1 0.0% 0.1 0.0%Gloucestershire Police 60.8 0.0 0.0 0.0 60.8 0.0 0.0% 0.0 0.0%Hampshire Police 213.0 0.0 0.0 0.0 213.0 0.1 0.0% 0.1 0.0%Hertfordshire Police 124.8 0.0 0.0 0.0 124.8 0.0 0.0% 0.0 0.0%Humberside Police 131.8 0.0 0.0 0.0 131.8 0.1 0.0% 0.1 0.0%
Kent Police 197.4 0.0 0.0 0.0 197.4 0.0 0.0% 0.0 0.0%Lancashire Police 209.7 0.0 0.0 0.0 209.7 0.1 0.0% 0.1 0.0%Leicestershire Police 121.4 0.0 0.0 0.0 121.4 0.0 0.0% 0.0 0.0%Lincolnshire Police 66.3 0.0 0.0 0.0 66.3 0.1 0.1% 0.1 0.1%Norfolk Police 89.8 0.0 0.0 0.0 89.8 0.0 0.0% 0.0 0.0%
North Yorkshire Police 78.6 0.0 0.0 0.0 78.6 0.0 0.0% 0.0 0.0%Northamptonshire Police 77.5 0.0 0.0 0.0 77.5 0.0 0.1% 0.0 0.1%Nottinghamshire Police 146.0 0.0 0.0 0.0 146.0 0.0 0.0% 0.0 0.0%Staffordshire Police 123.8 0.0 0.0 0.0 123.8 0.1 0.1% 0.1 0.1%Suffolk Police 72.7 0.0 0.0 0.0 72.7 0.0 0.0% 0.0 0.0%
Surrey Police 104.4 0.0 0.0 0.0 104.4 0.0 0.0% 0.0 0.0%Sussex Police 174.1 0.0 0.0 0.0 174.1 0.0 0.0% 0.0 0.0%Thames Valley Police 244.7 0.0 0.0 0.0 244.7 0.0 0.0% 0.0 0.0%Warwickshire Police 55.6 0.0 0.0 0.0 55.6 0.0 0.0% 0.0 0.0%West Mercia Police 124.9 0.0 0.0 0.0 124.9 0.0 0.0% 0.0 0.0%
Wiltshire Police 66.8 0.0 0.0 0.0 66.8 0.0 0.0% 0.0 0.0%
305

Formula Grant After Floor Damping
(£ million) (£ million) (£ million) (£ million) (£ million) (£ million) (%) (£ million) (%)
Base Position = 2010-11 Agreed Position - 2008-09 Concessionary Travel NRE + 2008-09 Aggregated Concessionary Travel NRE + Aggregated 2010-11 Concessionary Travel Special Grant
2010-11 Indicative
Allocations
2008-09 Concess-
ionary Travel NRE
Aggreg-ated 2008-
09 Concess-
ionary Travel NRE
Aggreg-ated 2010-
11 Concess-
ionary Travel Special Grant
Base Position Option CONCF5 Option CONCF6
Difference from Base Position
SHIRE FIRE AUTHORITIES
Avon Fire 24.9 0.0 0.0 0.0 24.9 0.0 0.0% 0.0 0.0%Bedfordshire Fire 11.4 0.0 0.0 0.0 11.4 0.0 0.2% 0.0 0.2%Berkshire Fire Auhtority 15.4 0.0 0.0 0.0 15.4 0.0 0.0% 0.0 0.0%Buckinghamshire Fire 11.5 0.0 0.0 0.0 11.5 0.0 0.0% 0.0 0.0%Cambridgeshire Fire 14.4 0.0 0.0 0.0 14.4 0.0 -0.1% 0.0 -0.1%
Cheshire Fire 18.6 0.0 0.0 0.0 18.6 0.0 -0.2% 0.0 -0.2%Cleveland Fire 22.4 0.0 0.0 0.0 22.4 0.0 0.0% 0.0 0.0%Derbyshire Fire 19.7 0.0 0.0 0.0 19.7 0.0 0.0% 0.0 0.0%Devon and Somerset Fire 31.2 0.0 0.0 0.0 31.2 0.0 0.0% 0.0 0.0%Dorset Fire 11.0 0.0 0.0 0.0 11.0 0.0 -0.1% 0.0 -0.1%
Durham Fire 14.5 0.0 0.0 0.0 14.5 0.0 0.0% 0.0 0.0%East Sussex Fire 14.7 0.0 0.0 0.0 14.7 0.0 -0.2% 0.0 -0.2%Essex Fire Auhtority 32.4 0.0 0.0 0.0 32.4 -0.1 -0.2% -0.1 -0.2%Hampshire Fire 29.3 0.0 0.0 0.0 29.3 0.0 0.1% 0.0 0.1%Hereford & Worcester Fire 10.7 0.0 0.0 0.0 10.7 0.0 0.3% 0.0 0.3%
Humberside Fire 27.2 0.0 0.0 0.0 27.2 -0.1 -0.2% -0.1 -0.2%Kent Fire 29.6 0.0 0.0 0.0 29.6 0.0 0.0% 0.0 0.0%Lancashire Fire 32.6 0.0 0.0 0.0 32.6 0.1 0.3% 0.1 0.3%Leicestershire Fire 18.8 0.0 0.0 0.0 18.8 0.1 0.3% 0.1 0.3%North Yorkshire Fire 13.0 0.0 0.0 0.0 13.0 0.0 0.0% 0.0 0.0%
Nottinghamshire Fire 25.0 0.0 0.0 0.0 25.0 0.0 -0.1% 0.0 -0.1%Shropshire Fire 8.3 0.0 0.0 0.0 8.3 0.0 0.0% 0.0 0.0%Staffordshire Fire 18.6 0.0 0.0 0.0 18.6 0.0 0.2% 0.0 0.2%Wiltshire Fire 9.6 0.0 0.0 0.0 9.6 0.0 0.1% 0.0 0.1%
306

Concessionary Travel - Adding into Upper-Tier Authorities
(£ million) (£ million) (£ million) (£ million) (£ million)
England 28,995.5 813.4 813.4 223.0 29,218.5
London area 6,475.5 206.0 206.0 28.1 6,503.6Metropolitan areas 8,197.3 259.3 259.3 52.3 8,249.6Shire areas 14,320.4 348.1 348.1 142.6 14,463.0Isles of Scilly 2.3 0.0 0.0 0.1 2.3
Inner London boroughs incl. City 2,234.6 83.0 83.0 11.3 2,245.9Outer London boroughs 1,953.6 123.0 123.0 16.8 1,970.4London boroughs 4,188.2 206.0 206.0 28.1 4,216.3GLA - all functions 2,287.3 0.0 0.0 0.0 2,287.3
Metropolitan districts 5,798.0 259.3 259.3 52.3 5,850.3Metropolitan fire authorities 332.3 0.0 0.0 0.0 332.3Metropolitan police authorities 2,067.0 0.0 0.0 0.0 2,067.0
Shire unitaries with fire 404.3 11.1 11.1 6.5 410.8Shire unitaries without fire 4,033.1 142.0 142.0 55.0 4,088.1Shire counties with fire 1,615.8 0.0 70.2 0.0 1,686.0Shire counties without fire 2,378.5 0.0 124.8 0.0 2,503.4Shire districts 1,654.0 195.0 0.0 81.0 1,540.0Combined fire authorities 464.7 0.0 0.0 0.0 464.7Shire police authorities 3,770.0 0.0 0.0 0.0 3,770.0
GO REGIONAL SUMMARY
South West GOR 2,199.8 51.1 51.1 23.3 2,223.1South East GOR 3,118.8 85.6 85.6 32.0 3,150.8London GOR 6,475.5 206.0 206.0 28.1 6,503.6Eastern GOR 2,390.8 54.3 54.3 21.9 2,412.7East Midlands GOR 2,181.5 49.5 49.5 24.7 2,206.2West Midlands GOR 3,238.8 93.2 93.2 22.4 3,261.2Yorkshire and Humber GOR 3,100.9 85.7 85.7 23.8 3,124.7North East GOR 1,812.2 60.4 60.4 11.9 1,824.1North West GOR 4,477.2 127.7 127.7 34.8 4,512.0
FLOOR DAMPING GROUPS
Education Authorities 18,418.0 618.4 813.4 222.9 18,835.9Police Authorities 7,864.8 0.0 0.0 0.0 7,864.8Fire Authorities 1,056.5 0.0 0.0 0.0 1,056.5Shire Districts 1,654.0 195.0 0.0 0.0 1,459.0
Base Position = 2010-11 Agreed Position - 2008-09 Concessionary Travel NRE + 2008-09 Aggregated Concessionary Travel NRE + Aggregated 2010-11 Concessionary Travel Special Grant
2010-11 Indicative
Allocations
2008-09 Concess-
ionary Travel NRE
Aggreg-ated 2008-
09 Concess-
ionary Travel NRE
Aggreg-ated 2010-
11 Concess-
ionary Travel Special Grant
Base Position
Formula Grant After Floor Damping
(£ million) (%) (£ million) (%)
0.0 0.0% 0.0 0.0%
46.0 0.7% 40.4 0.6%22.7 0.3% 32.3 0.4%
-68.7 -0.5% -72.7 -0.5%0.0 0.0% 0.0 0.0%
19.9 0.9% 21.0 0.9%26.1 1.3% 19.4 1.0%46.0 1.1% 40.4 1.0%0.0 0.0% 0.0 0.0%
22.5 0.4% 32.1 0.5%0.1 0.0% 0.1 0.0%0.1 0.0% 0.1 0.0%
-3.4 -0.8% -5.4 -1.3%-2.0 0.0% 0.4 0.0%26.8 1.6% 23.9 1.4%39.5 1.6% 38.0 1.5%
-129.4 -8.4% -129.4 -8.4%-0.2 0.0% -0.2 0.0%0.0 0.0% 0.0 0.0%
-9.0 -0.4% -14.4 -0.6%-10.6 -0.3% -10.2 -0.3%46.0 0.7% 40.4 0.6%
-14.0 -0.6% -13.6 -0.6%-17.0 -0.8% -16.3 -0.7%
0.0 0.0% 1.1 0.0%2.6 0.1% 4.1 0.1%2.5 0.1% 5.2 0.3%
-0.4 0.0% 3.6 0.1%
48.4 0.3% 48.4 0.3%0.1 0.0% 0.1 0.0%
-0.1 0.0% -0.1 0.0%-48.4 -3.3% -48.4 -3.3%
Option CONCF8Option CONCF7Difference from Base Position
307

(£ million) (£ million) (£ million) (£ million) (£ million)
Base Position = 2010-11 Agreed Position - 2008-09 Concessionary Travel NRE + 2008-09 Aggregated Concessionary Travel NRE + Aggregated 2010-11 Concessionary Travel Special Grant
2010-11 Indicative
Allocations
2008-09 Concess-
ionary Travel NRE
Aggreg-ated 2008-
09 Concess-
ionary Travel NRE
Aggreg-ated 2010-
11 Concess-
ionary Travel Special Grant
Base Position
GREATER LONDON
City of London 104.7 0.4 0.4 0.0 104.7
Camden 167.3 8.4 8.4 1.1 168.4Greenwich 166.8 5.2 5.2 0.7 167.5Hackney 220.0 6.6 6.6 0.9 220.9Hammersmith and Fulham 120.9 6.2 6.2 0.8 121.8Islington 160.2 6.8 6.8 0.9 161.2Kensington and Chelsea 106.0 6.0 6.0 0.8 106.8
Lambeth 213.9 8.5 8.5 1.2 215.1Lewisham 180.2 6.7 6.7 0.9 181.1Southwark 230.7 6.9 6.9 0.9 231.7Tower Hamlets 232.2 5.2 5.2 0.7 232.9Wandsworth 150.2 7.9 7.9 1.1 151.3Westminster 181.5 8.4 8.4 1.1 182.6
Barking and Dagenham 102.8 3.6 3.6 0.5 103.3Barnet 94.6 9.6 9.6 1.3 95.9Bexley 65.6 4.1 4.1 0.6 66.2Brent 164.5 9.2 9.2 1.3 165.7Bromley 65.1 5.8 5.8 0.8 65.9
Croydon 118.5 7.0 7.0 1.0 119.5Ealing 144.4 9.8 9.8 1.3 145.8Enfield 121.9 7.2 7.2 1.0 122.9Haringey 144.6 8.5 8.5 1.2 145.8Harrow 67.8 6.1 6.1 0.8 68.6
Havering 55.3 5.1 5.1 0.7 56.0Hillingdon 84.4 5.6 5.6 0.8 85.2Hounslow 91.4 5.4 5.4 0.7 92.2Kingston upon Thames 37.2 2.9 2.9 0.4 37.6Merton 67.7 5.3 5.3 0.7 68.5
Newham 224.0 7.2 7.2 1.0 225.0Redbridge 98.0 6.3 6.3 0.9 98.9Richmond upon Thames 28.0 4.7 4.7 0.6 28.7Sutton 54.5 3.4 3.4 0.5 55.0Waltham Forest 123.0 5.9 5.9 0.8 123.8
GLA - all functions 2,287.3 0.0 0.0 0.0 2,287.3
GLA - police 2,027.7 0.0 0.0 0.0 2,027.7GLA - fire 259.6 0.0 0.0 0.0 259.6
Formula Grant After Floor Damping
(£ million) (%) (£ million) (%)
Option CONCF8Option CONCF7Difference from Base Position
0.4 0.3% 0.3 0.3%
2.4 1.4% 2.3 1.3%1.8 1.1% 2.1 1.2%1.6 0.7% 1.8 0.8%1.2 1.0% 1.1 0.9%1.4 0.9% 1.4 0.9%1.2 1.1% 1.2 1.1%
1.9 0.9% 1.8 0.9%1.5 0.8% 1.6 0.9%1.7 0.7% 2.1 0.9%1.4 0.6% 2.1 0.9%1.6 1.0% 1.5 1.0%1.8 1.0% 1.7 1.0%
1.2 1.1% 1.3 1.2%1.9 2.0% 1.2 1.2%0.8 1.3% 0.8 1.2%1.8 1.1% 1.0 0.6%1.0 1.6% 0.7 1.1%
1.8 1.5% 1.6 1.3%1.8 1.3% 1.0 0.7%1.6 1.3% 1.3 1.1%1.7 1.1% 0.8 0.6%1.1 1.6% 0.5 0.7%
0.9 1.6% 0.6 1.1%1.2 1.4% 0.9 1.1%1.1 1.1% 0.7 0.8%0.5 1.4% 0.5 1.4%1.0 1.4% 0.6 0.9%
2.4 1.0% 2.3 1.0%1.5 1.5% 1.2 1.2%0.8 2.6% 0.4 1.3%0.7 1.2% 0.7 1.2%1.5 1.2% 1.4 1.1%
0.0 0.0% 0.0 0.0%
0.0 0.0% 0.0 0.0%0.0 0.0% 0.0 0.0%
308
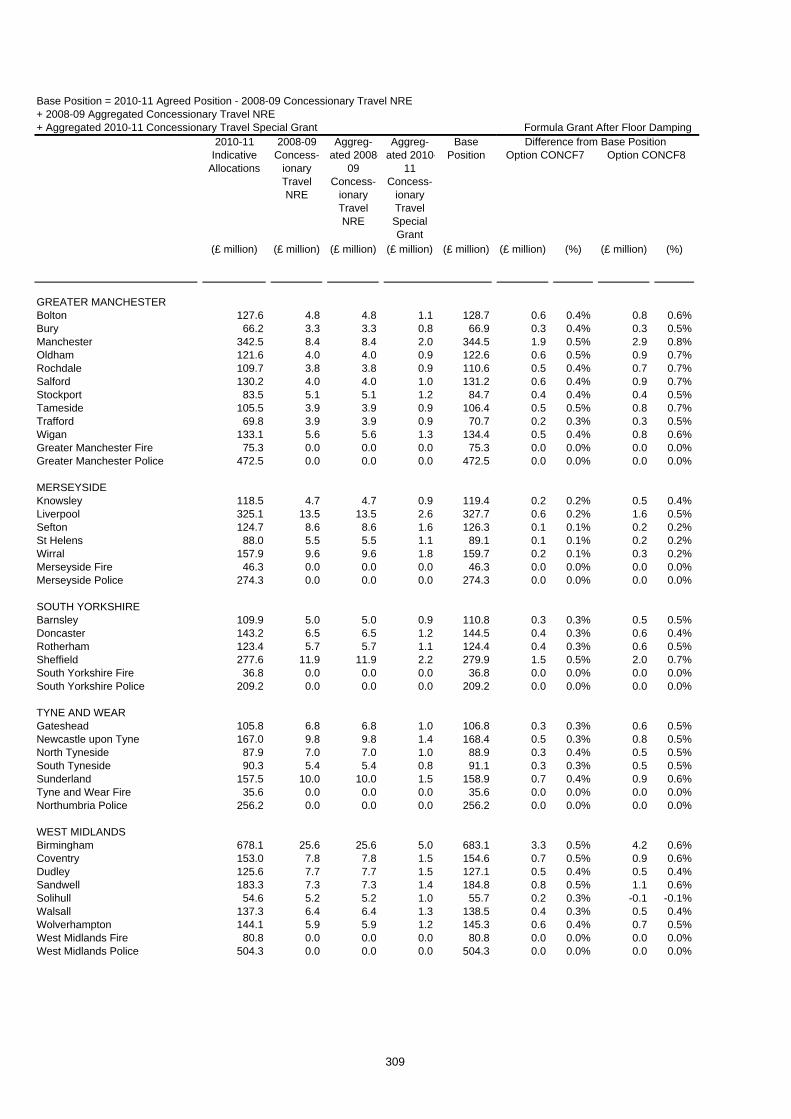
(£ million) (£ million) (£ million) (£ million) (£ million)
Base Position = 2010-11 Agreed Position - 2008-09 Concessionary Travel NRE + 2008-09 Aggregated Concessionary Travel NRE + Aggregated 2010-11 Concessionary Travel Special Grant
2010-11 Indicative
Allocations
2008-09 Concess-
ionary Travel NRE
Aggreg-ated 2008-
09 Concess-
ionary Travel NRE
Aggreg-ated 2010-
11 Concess-
ionary Travel Special Grant
Base Position
GREATER MANCHESTERBolton 127.6 4.8 4.8 1.1 128.7Bury 66.2 3.3 3.3 0.8 66.9Manchester 342.5 8.4 8.4 2.0 344.5Oldham 121.6 4.0 4.0 0.9 122.6Rochdale 109.7 3.8 3.8 0.9 110.6Salford 130.2 4.0 4.0 1.0 131.2Stockport 83.5 5.1 5.1 1.2 84.7Tameside 105.5 3.9 3.9 0.9 106.4Trafford 69.8 3.9 3.9 0.9 70.7Wigan 133.1 5.6 5.6 1.3 134.4Greater Manchester Fire 75.3 0.0 0.0 0.0 75.3Greater Manchester Police 472.5 0.0 0.0 0.0 472.5
MERSEYSIDEKnowsley 118.5 4.7 4.7 0.9 119.4Liverpool 325.1 13.5 13.5 2.6 327.7Sefton 124.7 8.6 8.6 1.6 126.3St Helens 88.0 5.5 5.5 1.1 89.1Wirral 157.9 9.6 9.6 1.8 159.7Merseyside Fire 46.3 0.0 0.0 0.0 46.3Merseyside Police 274.3 0.0 0.0 0.0 274.3
SOUTH YORKSHIREBarnsley 109.9 5.0 5.0 0.9 110.8Doncaster 143.2 6.5 6.5 1.2 144.5Rotherham 123.4 5.7 5.7 1.1 124.4Sheffield 277.6 11.9 11.9 2.2 279.9South Yorkshire Fire 36.8 0.0 0.0 0.0 36.8South Yorkshire Police 209.2 0.0 0.0 0.0 209.2
TYNE AND WEARGateshead 105.8 6.8 6.8 1.0 106.8Newcastle upon Tyne 167.0 9.8 9.8 1.4 168.4North Tyneside 87.9 7.0 7.0 1.0 88.9South Tyneside 90.3 5.4 5.4 0.8 91.1Sunderland 157.5 10.0 10.0 1.5 158.9Tyne and Wear Fire 35.6 0.0 0.0 0.0 35.6Northumbria Police 256.2 0.0 0.0 0.0 256.2
WEST MIDLANDSBirmingham 678.1 25.6 25.6 5.0 683.1Coventry 153.0 7.8 7.8 1.5 154.6Dudley 125.6 7.7 7.7 1.5 127.1Sandwell 183.3 7.3 7.3 1.4 184.8Solihull 54.6 5.2 5.2 1.0 55.7Walsall 137.3 6.4 6.4 1.3 138.5Wolverhampton 144.1 5.9 5.9 1.2 145.3West Midlands Fire 80.8 0.0 0.0 0.0 80.8West Midlands Police 504.3 0.0 0.0 0.0 504.3
Formula Grant After Floor Damping
(£ million) (%) (£ million) (%)
Option CONCF8Option CONCF7Difference from Base Position
0.6 0.4% 0.8 0.6%0.3 0.4% 0.3 0.5%1.9 0.5% 2.9 0.8%0.6 0.5% 0.9 0.7%0.5 0.4% 0.7 0.7%0.6 0.4% 0.9 0.7%0.4 0.4% 0.4 0.5%0.5 0.5% 0.8 0.7%0.2 0.3% 0.3 0.5%0.5 0.4% 0.8 0.6%0.0 0.0% 0.0 0.0%0.0 0.0% 0.0 0.0%
0.2 0.2% 0.5 0.4%0.6 0.2% 1.6 0.5%0.1 0.1% 0.2 0.2%0.1 0.1% 0.2 0.2%0.2 0.1% 0.3 0.2%0.0 0.0% 0.0 0.0%0.0 0.0% 0.0 0.0%
0.3 0.3% 0.5 0.5%0.4 0.3% 0.6 0.4%0.4 0.3% 0.6 0.5%1.5 0.5% 2.0 0.7%0.0 0.0% 0.0 0.0%0.0 0.0% 0.0 0.0%
0.3 0.3% 0.6 0.5%0.5 0.3% 0.8 0.5%0.3 0.4% 0.5 0.5%0.3 0.3% 0.5 0.5%0.7 0.4% 0.9 0.6%0.0 0.0% 0.0 0.0%0.0 0.0% 0.0 0.0%
3.3 0.5% 4.2 0.6%0.7 0.5% 0.9 0.6%0.5 0.4% 0.5 0.4%0.8 0.5% 1.1 0.6%0.2 0.3% -0.1 -0.1%0.4 0.3% 0.5 0.4%0.6 0.4% 0.7 0.5%0.0 0.0% 0.0 0.0%0.0 0.0% 0.0 0.0%
309

(£ million) (£ million) (£ million) (£ million) (£ million)
Base Position = 2010-11 Agreed Position - 2008-09 Concessionary Travel NRE + 2008-09 Aggregated Concessionary Travel NRE + Aggregated 2010-11 Concessionary Travel Special Grant
2010-11 Indicative
Allocations
2008-09 Concess-
ionary Travel NRE
Aggreg-ated 2008-
09 Concess-
ionary Travel NRE
Aggreg-ated 2010-
11 Concess-
ionary Travel Special Grant
Base Position
WEST YORKSHIREBradford 272.0 8.3 8.3 2.1 274.1Calderdale 81.5 3.3 3.3 0.8 82.4Kirklees 157.2 6.7 6.7 1.7 158.8Leeds 303.5 12.8 12.8 3.2 306.7Wakefield 141.3 5.3 5.3 1.3 142.6West Yorkshire Fire 57.5 0.0 0.0 0.0 57.5West Yorkshire Police 350.5 0.0 0.0 0.0 350.5
Formula Grant After Floor Damping
(£ million) (%) (£ million) (%)
Option CONCF8Option CONCF7Difference from Base Position
1.2 0.4% 1.6 0.6%0.3 0.3% 0.3 0.4%0.6 0.4% 0.7 0.4%1.7 0.6% 2.2 0.7%0.5 0.4% 0.8 0.5%0.0 0.0% 0.0 0.0%0.0 0.0% 0.0 0.0%
310

(£ million) (£ million) (£ million) (£ million) (£ million)
Base Position = 2010-11 Agreed Position - 2008-09 Concessionary Travel NRE + 2008-09 Aggregated Concessionary Travel NRE + Aggregated 2010-11 Concessionary Travel Special Grant
2010-11 Indicative
Allocations
2008-09 Concess-
ionary Travel NRE
Aggreg-ated 2008-
09 Concess-
ionary Travel NRE
Aggreg-ated 2010-
11 Concess-
ionary Travel Special Grant
Base Position
ALL PURPOSE AUTHORITIES
Bath & North East Somerset 41.6 3.0 3.0 1.2 42.8Bedford 54.1 1.7 1.7 0.5 54.6Blackburn with Darwen 81.6 2.4 2.4 0.5 82.2Blackpool 81.8 3.7 3.7 2.3 84.1Bournemouth 55.0 2.8 2.8 1.3 56.3
Bracknell Forest 26.1 0.7 0.7 0.3 26.4Brighton & Hove 109.2 5.8 5.8 1.8 111.0Bristol 166.9 5.8 5.8 1.9 168.9Central Bedfordshire 50.6 1.5 1.5 0.6 51.2Cheshire East 63.2 2.4 2.4 1.0 64.2
Cheshire West & Chester 93.5 3.3 3.3 1.2 94.7Cornwall 213.1 3.4 3.4 3.5 216.6Darlington 38.8 2.8 2.8 1.4 40.2Derby 109.7 5.8 5.8 3.8 113.5Durham 230.6 7.6 7.6 1.5 232.2
East Riding of Yorkshire 101.4 3.2 3.2 0.9 102.3Halton 64.0 1.7 1.7 0.3 64.3Hartlepool 51.5 1.3 1.3 0.4 51.9Herefordshire 57.6 1.6 1.6 0.7 58.3Isle of Wight Council 61.4 4.9 4.9 1.8 63.2
Kingston upon Hull 152.0 5.3 5.3 1.9 153.9Leicester 182.4 5.4 5.4 2.3 184.7Luton 89.9 3.3 3.3 2.0 91.9Medway 85.2 3.0 3.0 0.7 85.9Middlesbrough 83.6 2.3 2.3 0.6 84.2
Milton Keynes 87.3 1.8 1.8 0.8 88.1North East Lincolnshire 72.8 1.6 1.6 0.6 73.4North Lincolnshire 62.3 1.3 1.3 0.5 62.8North Somerset 52.0 2.0 2.0 0.7 52.7Northumberland 129.8 2.7 2.7 1.3 131.0
Nottingham 172.6 7.5 7.5 4.4 177.0Peterborough 77.0 2.1 2.1 1.5 78.5Plymouth 106.0 3.9 3.9 1.1 107.2Poole 26.9 2.0 2.0 0.6 27.5Portsmouth 87.5 3.1 3.1 0.9 88.4
Reading 55.4 2.1 2.1 1.0 56.3Redcar and Cleveland 68.7 2.1 2.1 0.4 69.2Rutland 7.7 0.0 0.0 0.1 7.8Shropshire 93.1 1.9 1.9 0.9 94.1Slough 56.8 1.8 1.8 1.1 57.8
South Gloucestershire 60.8 1.8 1.8 0.3 61.1Southampton 100.2 2.5 2.5 1.1 101.3Southend-on-Sea 61.5 1.7 1.7 0.3 61.8Stockton-on-Tees 78.2 2.5 2.5 0.7 78.9Stoke-on-Trent 127.3 4.0 4.0 1.2 128.5
Formula Grant After Floor Damping
(£ million) (%) (£ million) (%)
Option CONCF8Option CONCF7Difference from Base Position
-0.5 -1.2% -0.6 -1.4%0.0 0.0% 0.0 0.1%0.3 0.4% 0.5 0.6%
-0.8 -1.0% -1.2 -1.4%0.1 0.1% -0.3 -0.5%
0.1 0.3% 0.2 0.7%0.3 0.3% 0.0 0.0%1.0 0.6% 1.3 0.7%
-0.2 -0.3% -0.2 -0.3%-0.3 -0.5% -0.3 -0.5%
-0.2 -0.2% -0.3 -0.3%-1.9 -0.9% -3.5 -1.6%-0.7 -1.8% -0.7 -1.8%-2.3 -2.0% -2.1 -1.8%0.3 0.1% 1.0 0.4%
-0.4 -0.3% -0.3 -0.3%0.2 0.3% 0.4 0.7%0.2 0.5% 0.4 0.8%
-0.9 -1.5% -1.1 -2.0%-1.1 -1.7% -1.4 -2.1%
0.2 0.1% 0.5 0.3%0.1 0.1% 0.2 0.1%
-0.9 -1.0% -0.6 -0.6%0.6 0.7% 0.9 1.1%0.4 0.4% 0.6 0.7%
0.2 0.3% 0.3 0.3%0.3 0.4% 0.4 0.5%
-0.1 -0.2% -0.1 -0.1%-0.2 -0.4% -0.1 -0.2%-0.4 -0.3% -0.5 -0.4%
-1.5 -0.8% -1.6 -0.9%-0.5 -0.6% -0.5 -0.7%0.5 0.5% 0.7 0.6%0.1 0.3% 0.0 -0.1%0.7 0.8% 0.9 1.0%
0.2 0.3% -0.1 -0.1%0.2 0.3% 0.5 0.7%
-0.2 -2.3% -0.2 -3.1%-1.0 -1.0% -1.3 -1.4%-0.5 -0.9% -0.3 -0.4%
0.5 0.8% 0.6 1.0%0.7 0.7% 0.9 0.9%0.7 1.2% 0.9 1.4%0.4 0.5% 0.6 0.8%0.3 0.3% 0.7 0.5%
311

(£ million) (£ million) (£ million) (£ million) (£ million)
Base Position = 2010-11 Agreed Position - 2008-09 Concessionary Travel NRE + 2008-09 Aggregated Concessionary Travel NRE + Aggregated 2010-11 Concessionary Travel Special Grant
2010-11 Indicative
Allocations
2008-09 Concess-
ionary Travel NRE
Aggreg-ated 2008-
09 Concess-
ionary Travel NRE
Aggreg-ated 2010-
11 Concess-
ionary Travel Special Grant
Base Position
Swindon 50.6 2.0 2.0 0.8 51.4Telford and the Wrekin 70.6 1.6 1.6 0.5 71.1Thurrock 59.8 0.8 0.8 0.2 60.0Torbay 59.0 3.1 3.1 1.6 60.6Warrington 54.0 3.0 3.0 1.2 55.2
West Berkshire 29.2 0.5 0.5 0.2 29.5Wiltshire 102.2 3.3 3.3 1.2 103.4Windsor and Maidenhead 18.8 1.0 1.0 0.3 19.1Wokingham 19.6 1.1 1.1 0.2 19.8York 44.6 3.5 3.5 1.5 46.1
Isles of Scilly 2.3 0.0 0.0 0.1 2.3
Formula Grant After Floor Damping
(£ million) (%) (£ million) (%)
Option CONCF8Option CONCF7Difference from Base Position
0.1 0.3% 0.2 0.4%0.1 0.2% 0.2 0.3%0.6 0.9% 0.7 1.2%
-0.6 -0.9% -0.8 -1.3%-0.4 -0.6% -0.2 -0.4%
0.2 0.7% 0.1 0.4%0.3 0.3% -0.2 -0.1%0.1 0.3% 0.1 0.4%0.1 0.3% 0.2 0.8%
-0.2 -0.4% -0.4 -0.9%
0.0 0.0% 0.0 0.0%
312
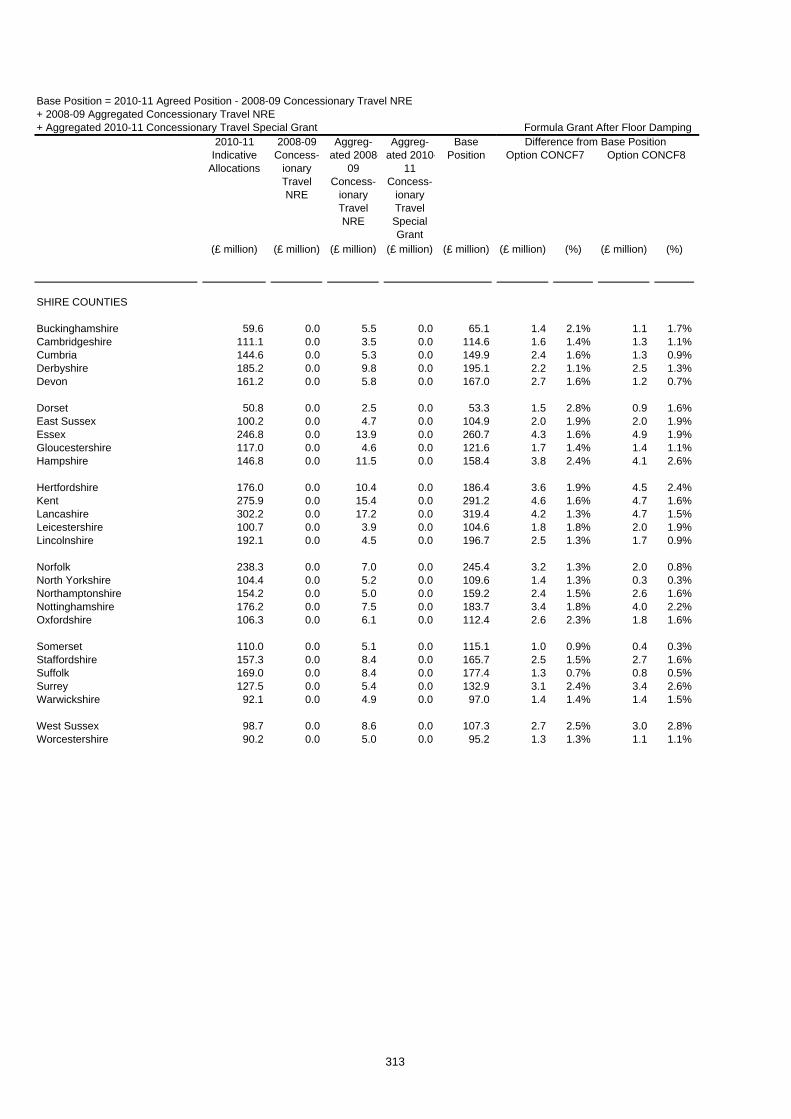
(£ million) (£ million) (£ million) (£ million) (£ million)
Base Position = 2010-11 Agreed Position - 2008-09 Concessionary Travel NRE + 2008-09 Aggregated Concessionary Travel NRE + Aggregated 2010-11 Concessionary Travel Special Grant
2010-11 Indicative
Allocations
2008-09 Concess-
ionary Travel NRE
Aggreg-ated 2008-
09 Concess-
ionary Travel NRE
Aggreg-ated 2010-
11 Concess-
ionary Travel Special Grant
Base Position
SHIRE COUNTIES
Buckinghamshire 59.6 0.0 5.5 0.0 65.1Cambridgeshire 111.1 0.0 3.5 0.0 114.6Cumbria 144.6 0.0 5.3 0.0 149.9Derbyshire 185.2 0.0 9.8 0.0 195.1Devon 161.2 0.0 5.8 0.0 167.0
Dorset 50.8 0.0 2.5 0.0 53.3East Sussex 100.2 0.0 4.7 0.0 104.9Essex 246.8 0.0 13.9 0.0 260.7Gloucestershire 117.0 0.0 4.6 0.0 121.6Hampshire 146.8 0.0 11.5 0.0 158.4
Hertfordshire 176.0 0.0 10.4 0.0 186.4Kent 275.9 0.0 15.4 0.0 291.2Lancashire 302.2 0.0 17.2 0.0 319.4Leicestershire 100.7 0.0 3.9 0.0 104.6Lincolnshire 192.1 0.0 4.5 0.0 196.7
Norfolk 238.3 0.0 7.0 0.0 245.4North Yorkshire 104.4 0.0 5.2 0.0 109.6Northamptonshire 154.2 0.0 5.0 0.0 159.2Nottinghamshire 176.2 0.0 7.5 0.0 183.7Oxfordshire 106.3 0.0 6.1 0.0 112.4
Somerset 110.0 0.0 5.1 0.0 115.1Staffordshire 157.3 0.0 8.4 0.0 165.7Suffolk 169.0 0.0 8.4 0.0 177.4Surrey 127.5 0.0 5.4 0.0 132.9Warwickshire 92.1 0.0 4.9 0.0 97.0
West Sussex 98.7 0.0 8.6 0.0 107.3Worcestershire 90.2 0.0 5.0 0.0 95.2
Formula Grant After Floor Damping
(£ million) (%) (£ million) (%)
Option CONCF8Option CONCF7Difference from Base Position
1.4 2.1% 1.1 1.7%1.6 1.4% 1.3 1.1%2.4 1.6% 1.3 0.9%2.2 1.1% 2.5 1.3%2.7 1.6% 1.2 0.7%
1.5 2.8% 0.9 1.6%2.0 1.9% 2.0 1.9%4.3 1.6% 4.9 1.9%1.7 1.4% 1.4 1.1%3.8 2.4% 4.1 2.6%
3.6 1.9% 4.5 2.4%4.6 1.6% 4.7 1.6%4.2 1.3% 4.7 1.5%1.8 1.8% 2.0 1.9%2.5 1.3% 1.7 0.9%
3.2 1.3% 2.0 0.8%1.4 1.3% 0.3 0.3%2.4 1.5% 2.6 1.6%3.4 1.8% 4.0 2.2%2.6 2.3% 1.8 1.6%
1.0 0.9% 0.4 0.3%2.5 1.5% 2.7 1.6%1.3 0.7% 0.8 0.5%3.1 2.4% 3.4 2.6%1.4 1.4% 1.4 1.5%
2.7 2.5% 3.0 2.8%1.3 1.3% 1.1 1.1%
313

(£ million) (£ million) (£ million) (£ million) (£ million)
Base Position = 2010-11 Agreed Position - 2008-09 Concessionary Travel NRE + 2008-09 Aggregated Concessionary Travel NRE + Aggregated 2010-11 Concessionary Travel Special Grant
2010-11 Indicative
Allocations
2008-09 Concess-
ionary Travel NRE
Aggreg-ated 2008-
09 Concess-
ionary Travel NRE
Aggreg-ated 2010-
11 Concess-
ionary Travel Special Grant
Base Position
BUCKINGHAMSHIREAylesbury Vale 11.9 1.2 0.0 0.4 11.1Chiltern 4.0 1.1 0.0 0.2 3.1South Bucks 3.0 0.7 0.0 0.2 2.5Wycombe 10.1 2.5 0.0 0.4 8.0
CAMBRIDGESHIRECambridge 12.4 2.1 0.0 2.0 12.3East Cambridgeshire 6.8 0.1 0.0 0.1 6.7Fenland 9.6 0.3 0.0 0.2 9.6Huntingdonshire 12.9 0.7 0.0 0.5 12.7South Cambridgeshire 7.8 0.3 0.0 0.1 7.6
CUMBRIAAllerdale 10.6 1.2 0.0 0.5 10.0Barrow-in-Furness 9.1 0.7 0.0 0.2 8.5Carlisle 10.4 2.0 0.0 0.5 9.0Copeland 7.2 0.5 0.0 0.1 6.8Eden 4.6 0.1 0.0 0.2 4.8South Lakeland 6.9 0.8 0.0 0.9 7.0
DERBYSHIREAmber Valley 9.9 1.5 0.0 0.3 8.7Bolsover 7.9 0.7 0.0 0.2 7.4Chesterfield 10.2 3.1 0.0 2.3 9.4Derbyshire Dales 4.8 0.4 0.0 0.1 4.5Erewash 9.7 1.8 0.0 0.8 8.7High Peak 7.1 1.0 0.0 0.3 6.5North East Derbyshire 7.9 0.9 0.0 0.2 7.1South Derbyshire 7.3 0.5 0.0 0.1 6.9
DEVONEast Devon 8.2 1.1 0.0 0.6 7.7Exeter 12.1 2.6 0.0 2.3 11.8Mid Devon 6.2 0.3 0.0 0.1 5.9North Devon 8.3 0.1 0.0 0.3 8.5South Hams 5.5 0.3 0.0 0.2 5.4Teignbridge 9.9 1.0 0.0 0.5 9.5Torridge 6.4 0.2 0.0 0.1 6.3West Devon 4.3 0.2 0.0 0.1 4.3
DORSETChristchurch 2.9 0.5 0.0 0.2 2.6East Dorset 3.7 0.4 0.0 0.1 3.4North Dorset 4.6 0.1 0.0 0.1 4.5Purbeck 3.3 0.3 0.0 0.1 3.1West Dorset 8.3 0.4 0.0 0.3 8.2Weymouth and Portland 6.0 0.8 0.0 0.5 5.8
EAST SUSSEXEastbourne 10.4 1.9 0.0 1.0 9.5Hastings 10.4 1.2 0.0 0.6 9.9Lewes 6.4 0.7 0.0 0.1 5.8Rother 6.6 0.3 0.0 0.2 6.4Wealden 8.3 0.6 0.0 0.1 7.7
Formula Grant After Floor Damping
(£ million) (%) (£ million) (%)
Option CONCF8Option CONCF7Difference from Base Position
-0.8 -7.5% -0.8 -7.5%-0.3 -9.5% -0.3 -9.5%-0.3 -10.8% -0.3 -10.8%-0.3 -4.2% -0.3 -4.2%
-2.0 -16.0% -2.0 -16.0%-0.4 -5.3% -0.4 -5.3%-0.8 -8.1% -0.8 -8.1%-1.1 -9.0% -1.1 -9.0%-0.4 -5.3% -0.4 -5.3%
-0.9 -9.1% -0.9 -9.1%-0.5 -6.0% -0.5 -6.0%-0.6 -7.2% -0.6 -7.2%-0.3 -5.2% -0.3 -5.2%-0.4 -9.4% -0.4 -9.4%-1.2 -16.7% -1.2 -16.7%
-0.6 -6.6% -0.6 -6.6%-0.5 -6.5% -0.5 -6.5%-1.9 -19.9% -1.9 -19.9%-0.3 -6.5% -0.3 -6.5%-0.8 -9.1% -0.8 -9.1%-0.5 -7.3% -0.5 -7.3%-0.5 -6.4% -0.5 -6.4%-0.5 -6.7% -0.5 -6.7%
-1.0 -12.9% -1.0 -12.9%-2.0 -17.2% -2.0 -17.2%-0.4 -6.7% -0.4 -6.7%-0.8 -9.2% -0.8 -9.2%-0.4 -7.8% -0.4 -7.8%-1.0 -10.5% -1.0 -10.5%-0.5 -7.7% -0.5 -7.7%-0.3 -7.2% -0.3 -7.2%
-0.3 -9.9% -0.3 -9.9%-0.3 -8.0% -0.3 -8.0%-0.3 -7.3% -0.3 -7.3%-0.2 -7.2% -0.2 -7.2%-0.6 -7.3% -0.6 -7.3%-0.7 -11.4% -0.7 -11.4%
-0.9 -9.7% -0.9 -9.7%-1.0 -9.8% -1.0 -9.8%-0.3 -6.0% -0.3 -6.0%-0.4 -6.5% -0.4 -6.5%-0.5 -7.0% -0.5 -7.0%
314

(£ million) (£ million) (£ million) (£ million) (£ million)
Base Position = 2010-11 Agreed Position - 2008-09 Concessionary Travel NRE + 2008-09 Aggregated Concessionary Travel NRE + Aggregated 2010-11 Concessionary Travel Special Grant
2010-11 Indicative
Allocations
2008-09 Concess-
ionary Travel NRE
Aggreg-ated 2008-
09 Concess-
ionary Travel NRE
Aggreg-ated 2010-
11 Concess-
ionary Travel Special Grant
Base Position
ESSEXBasildon 15.9 1.8 0.0 0.5 14.6Braintree 10.2 1.2 0.0 0.3 9.3Brentwood 5.2 0.5 0.0 0.2 4.9Castle Point 6.6 0.9 0.0 0.2 5.9Chelmsford 10.5 1.9 0.0 0.8 9.3Colchester 12.9 2.5 0.0 0.6 11.0Epping Forest 9.4 0.5 0.0 0.1 9.0Harlow 8.9 1.4 0.0 0.4 7.9Maldon 4.4 0.5 0.0 0.1 4.1Rochford 5.1 0.8 0.0 0.1 4.5Tendring 14.2 1.6 0.0 0.5 13.1Uttlesford 4.1 0.2 0.0 0.1 4.0
GLOUCESTERSHIRECheltenham 8.8 1.4 0.0 0.6 8.1Cotswold 5.4 0.1 0.0 0.2 5.4Forest of Dean 6.8 0.6 0.0 0.2 6.4Gloucester 10.9 1.2 0.0 0.5 10.2Stroud 7.2 0.8 0.0 0.2 6.6Tewkesbury 5.3 0.6 0.0 0.1 4.9
HAMPSHIREBasingstoke and Deane 10.1 2.3 0.0 0.4 8.2East Hampshire 6.2 0.5 0.0 0.1 5.8Eastleigh 7.8 1.1 0.0 0.3 7.0Fareham 6.2 1.5 0.0 0.7 5.5Gosport 7.3 1.2 0.0 0.2 6.3Hart 3.9 0.2 0.0 0.1 3.8Havant 9.9 1.2 0.0 0.3 9.0New Forest 11.6 1.0 0.0 0.5 11.2Rushmoor 7.0 0.8 0.0 0.4 6.6Test Valley 7.1 1.0 0.0 0.3 6.4Winchester 7.0 0.9 0.0 0.3 6.4
HERTFORDSHIREBroxbourne 7.0 1.1 0.0 0.4 6.2Dacorum 9.7 1.8 0.0 0.3 8.2East Hertfordshire 8.2 0.9 0.0 0.3 7.5Hertsmere 7.9 0.6 0.0 0.2 7.5North Hertfordshire 8.1 1.0 0.0 0.3 7.3St Albans 7.7 0.3 0.0 0.7 8.1Stevenage 7.9 1.6 0.0 0.4 6.6Three Rivers 5.7 0.8 0.0 0.1 5.0Watford 8.1 1.2 0.0 0.6 7.4Welwyn Hatfield 7.9 1.0 0.0 0.3 7.1
Formula Grant After Floor Damping
(£ million) (%) (£ million) (%)
Option CONCF8Option CONCF7Difference from Base Position
-1.0 -6.6% -1.0 -6.6%-0.7 -7.5% -0.7 -7.5%-0.4 -7.3% -0.4 -7.3%-0.4 -5.9% -0.4 -5.9%-0.7 -7.9% -0.7 -7.9%-0.5 -4.9% -0.5 -4.9%-0.4 -5.0% -0.4 -5.0%-0.7 -8.5% -0.7 -8.5%-0.3 -7.9% -0.3 -7.9%-0.3 -5.6% -0.3 -5.6%-1.1 -8.2% -1.1 -8.2%-0.2 -5.9% -0.2 -5.9%
-0.8 -9.5% -0.8 -9.5%-0.5 -8.9% -0.5 -8.9%-0.5 -8.0% -0.5 -8.0%-0.8 -8.3% -0.8 -8.3%-0.6 -8.7% -0.6 -8.7%-0.4 -7.3% -0.4 -7.3%
-0.2 -2.4% -0.2 -2.4%-0.3 -5.5% -0.3 -5.5%-0.4 -6.1% -0.4 -6.1%-0.7 -12.1% -0.7 -12.1%-0.3 -4.0% -0.3 -4.0%-0.2 -5.9% -0.2 -5.9%-0.6 -6.6% -0.6 -6.6%-1.0 -9.2% -1.0 -9.2%-0.6 -9.5% -0.6 -9.5%-0.5 -7.2% -0.5 -7.2%-0.5 -8.0% -0.5 -8.0%
-0.5 -7.3% -0.5 -7.3%-0.4 -5.0% -0.4 -5.0%-0.6 -7.5% -0.6 -7.5%-0.5 -6.8% -0.5 -6.8%-0.5 -7.2% -0.5 -7.2%-0.9 -11.7% -0.9 -11.7%-0.3 -4.5% -0.3 -4.5%-0.3 -6.5% -0.3 -6.5%-0.9 -11.7% -0.9 -11.7%-0.4 -6.0% -0.4 -6.0%
315

(£ million) (£ million) (£ million) (£ million) (£ million)
Base Position = 2010-11 Agreed Position - 2008-09 Concessionary Travel NRE + 2008-09 Aggregated Concessionary Travel NRE + Aggregated 2010-11 Concessionary Travel Special Grant
2010-11 Indicative
Allocations
2008-09 Concess-
ionary Travel NRE
Aggreg-ated 2008-
09 Concess-
ionary Travel NRE
Aggreg-ated 2010-
11 Concess-
ionary Travel Special Grant
Base Position
KENTAshford 8.3 0.8 0.0 0.2 7.7Canterbury 13.2 2.4 0.0 0.8 11.7Dartford 7.5 0.9 0.0 0.4 7.0Dover 10.2 1.3 0.0 0.3 9.3Gravesham 8.4 1.3 0.0 0.4 7.6Maidstone 9.5 2.0 0.0 0.5 8.0Sevenoaks 6.3 0.7 0.0 0.1 5.8Shepway 10.0 1.5 0.0 0.4 8.9Swale 12.1 0.9 0.0 0.1 11.4Thanet 13.3 1.6 0.0 0.8 12.5Tonbridge and Malling 6.5 0.8 0.0 0.1 5.9Tunbridge Wells 7.0 1.3 0.0 0.4 6.2
LANCASHIREBurnley 11.9 1.5 0.0 0.5 10.9Chorley 8.5 1.2 0.0 0.7 8.0Fylde 5.9 1.1 0.0 0.7 5.4Hyndburn 10.2 1.1 0.0 0.3 9.4Lancaster 16.4 2.3 0.0 1.2 15.3Pendle 11.1 0.8 0.0 0.1 10.5Preston 16.0 4.1 0.0 1.9 13.8Ribble Valley 4.1 0.5 0.0 0.2 3.8Rossendale 6.3 0.9 0.0 0.2 5.6South Ribble 7.5 1.0 0.0 0.1 6.7West Lancashire 9.6 1.1 0.0 0.3 8.8Wyre 10.4 1.6 0.0 0.4 9.2
LEICESTERSHIREBlaby 6.4 0.5 0.0 0.3 6.2Charnwood 12.5 1.3 0.0 0.6 11.8Harborough 5.4 0.2 0.0 0.1 5.3Hinckley and Bosworth 7.4 0.7 0.0 0.4 7.1Melton 3.9 0.2 0.0 0.1 3.8North West Leicestershire 7.1 0.5 0.0 0.2 6.8Oadby and Wigston 4.6 0.4 0.0 0.3 4.5
LINCOLNSHIREBoston 7.3 0.3 0.0 0.2 7.1East Lindsey 17.4 1.0 0.0 1.0 17.3Lincoln 10.6 1.3 0.0 0.8 10.1North Kesteven 8.8 0.6 0.0 0.2 8.3South Holland 9.0 0.4 0.0 0.2 8.8South Kesteven 10.1 0.5 0.0 0.4 10.1West Lindsey 8.2 0.5 0.0 0.1 7.8
NORFOLKBreckland 11.3 0.3 0.0 0.1 11.2Broadland 8.5 0.7 0.0 0.1 7.9Great Yarmouth 10.8 1.0 0.0 1.0 10.8King's Lynn and West Norfolk 15.4 0.8 0.0 0.5 15.1North Norfolk 9.0 0.3 0.0 0.2 9.0Norwich 15.9 2.8 0.0 2.3 15.5South Norfolk 8.4 1.2 0.0 0.4 7.7
Formula Grant After Floor Damping
(£ million) (%) (£ million) (%)
Option CONCF8Option CONCF7Difference from Base Position
-0.5 -7.0% -0.5 -7.0%-0.8 -7.1% -0.8 -7.1%-0.6 -7.9% -0.6 -7.9%-0.7 -7.6% -0.7 -7.6%-0.5 -6.9% -0.5 -6.9%-0.6 -7.5% -0.6 -7.5%-0.3 -5.6% -0.3 -5.6%-0.6 -6.4% -0.6 -6.4%-0.6 -5.6% -0.6 -5.6%-1.3 -10.3% -1.3 -10.3%-0.3 -5.7% -0.3 -5.7%-0.7 -10.7% -0.7 -10.7%
-0.8 -7.5% -0.8 -7.5%-1.0 -11.9% -1.0 -11.9%-0.7 -13.0% -0.7 -13.0%-0.7 -7.1% -0.7 -7.1%-1.4 -9.4% -1.4 -9.4%-0.6 -5.4% -0.6 -5.4%-1.4 -10.4% -1.4 -10.4%-0.3 -9.0% -0.3 -9.0%-0.4 -7.7% -0.4 -7.7%-0.3 -5.0% -0.3 -5.0%-0.7 -7.5% -0.7 -7.5%-0.6 -6.8% -0.6 -6.8%
-0.6 -9.0% -0.6 -9.0%-0.9 -7.9% -0.9 -7.9%-0.4 -7.5% -0.4 -7.5%-0.7 -10.4% -0.7 -10.4%-0.3 -7.7% -0.3 -7.7%-0.5 -8.0% -0.5 -8.0%-0.4 -9.1% -0.4 -9.1%
-0.6 -8.6% -0.6 -8.6%-2.0 -11.3% -2.0 -11.3%-1.1 -10.8% -1.1 -10.8%-0.6 -7.6% -0.6 -7.6%-0.7 -8.3% -0.7 -8.3%-0.8 -8.4% -0.8 -8.4%-0.5 -6.3% -0.5 -6.3%
-0.7 -6.6% -0.7 -6.6%-0.5 -6.9% -0.5 -6.9%-1.5 -13.8% -1.5 -13.8%-1.3 -8.9% -1.3 -8.9%-0.7 -7.5% -0.7 -7.5%-2.3 -14.9% -2.3 -14.9%-0.8 -9.9% -0.8 -9.9%
316

(£ million) (£ million) (£ million) (£ million) (£ million)
Base Position = 2010-11 Agreed Position - 2008-09 Concessionary Travel NRE + 2008-09 Aggregated Concessionary Travel NRE + Aggregated 2010-11 Concessionary Travel Special Grant
2010-11 Indicative
Allocations
2008-09 Concess-
ionary Travel NRE
Aggreg-ated 2008-
09 Concess-
ionary Travel NRE
Aggreg-ated 2010-
11 Concess-
ionary Travel Special Grant
Base Position
NORTH YORKSHIRECraven 4.2 0.4 0.0 0.3 4.1Hambleton 5.8 0.2 0.0 0.3 5.8Harrogate 11.3 1.5 0.0 1.5 11.3Richmondshire 4.3 0.2 0.0 0.2 4.3Ryedale 4.5 0.3 0.0 0.2 4.5Scarborough 12.5 2.0 0.0 1.2 11.7Selby 6.8 0.5 0.0 0.2 6.4
NORTHAMPTONSHIRECorby 5.7 0.5 0.0 0.3 5.5Daventry 6.2 0.4 0.0 0.2 6.0East Northamptonshire 6.7 0.3 0.0 0.3 6.6Kettering 7.3 1.0 0.0 0.6 6.9Northampton 18.9 2.0 0.0 0.7 17.6South Northamptonshire 5.8 0.2 0.0 0.1 5.7Wellingborough 7.0 0.6 0.0 0.3 6.7
NOTTINGHAMSHIREAshfield 11.5 1.3 0.0 0.4 10.6Bassetlaw 11.3 1.2 0.0 0.3 10.4Broxtowe 8.9 0.9 0.0 0.3 8.3Gedling 9.3 1.2 0.0 0.3 8.4Mansfield 10.4 1.3 0.0 0.7 9.7Newark and Sherwood 10.3 1.0 0.0 0.3 9.7Rushcliffe 7.2 0.6 0.0 0.2 6.8
OXFORDSHIRECherwell 10.9 0.9 0.0 0.2 10.2Oxford 16.8 3.2 0.0 3.1 16.7South Oxfordshire 7.9 0.6 0.0 0.2 7.5Vale of White Horse 7.1 0.7 0.0 0.5 6.9West Oxfordshire 6.1 0.7 0.0 0.1 5.5
SOMERSETMendip 8.4 1.0 0.0 0.3 7.8Sedgemoor 10.1 0.9 0.0 0.4 9.5South Somerset 11.1 1.6 0.0 0.4 9.9Taunton Deane 8.7 1.5 0.0 0.4 7.6West Somerset 3.3 0.1 0.0 0.1 3.4
STAFFORDSHIRECannock Chase 8.5 1.1 0.0 0.3 7.8East Staffordshire 9.5 1.4 0.0 0.4 8.6Lichfield 6.1 0.5 0.0 0.2 5.8Newcastle-under-Lyme 11.1 1.4 0.0 0.4 10.1South Staffordshire 7.2 1.1 0.0 0.2 6.3Stafford 8.8 1.6 0.0 0.5 7.7Staffordshire Moorlands 7.6 0.7 0.0 0.3 7.1Tamworth 6.8 0.6 0.0 0.3 6.5
Formula Grant After Floor Damping
(£ million) (%) (£ million) (%)
Option CONCF8Option CONCF7Difference from Base Position
-0.5 -11.4% -0.5 -11.4%-0.6 -9.5% -0.6 -9.5%-1.8 -15.9% -1.8 -15.9%-0.4 -10.5% -0.4 -10.5%-0.5 -11.3% -0.5 -11.3%-1.3 -11.5% -1.3 -11.5%-0.5 -7.5% -0.5 -7.5%
-0.5 -8.8% -0.5 -8.8%-0.6 -9.4% -0.6 -9.4%-0.6 -9.8% -0.6 -9.8%-0.8 -11.0% -0.8 -11.0%-1.2 -6.8% -1.2 -6.8%-0.5 -8.1% -0.5 -8.1%-0.6 -9.2% -0.6 -9.2%
-0.8 -8.0% -0.8 -8.0%-0.8 -7.4% -0.8 -7.4%-0.6 -7.5% -0.6 -7.5%-0.5 -6.4% -0.5 -6.4%-1.0 -10.8% -1.0 -10.8%-0.8 -7.9% -0.8 -7.9%-0.5 -8.0% -0.5 -8.0%
-0.6 -6.2% -0.6 -6.2%-2.7 -16.3% -2.7 -16.3%-0.5 -6.2% -0.5 -6.2%-0.8 -11.4% -0.8 -11.4%-0.3 -5.8% -0.3 -5.8%
-0.7 -8.7% -0.7 -8.7%-0.8 -8.8% -0.8 -8.8%-0.8 -7.8% -0.8 -7.8%-0.5 -6.8% -0.5 -6.8%-0.3 -7.6% -0.3 -7.6%
-0.6 -7.6% -0.6 -7.6%-0.6 -6.8% -0.6 -6.8%-0.5 -7.9% -0.5 -7.9%-0.7 -7.3% -0.7 -7.3%-0.4 -5.7% -0.4 -5.7%-0.6 -8.3% -0.6 -8.3%-0.5 -7.5% -0.5 -7.5%-0.6 -8.9% -0.6 -8.9%
317

(£ million) (£ million) (£ million) (£ million) (£ million)
Base Position = 2010-11 Agreed Position - 2008-09 Concessionary Travel NRE + 2008-09 Aggregated Concessionary Travel NRE + Aggregated 2010-11 Concessionary Travel Special Grant
2010-11 Indicative
Allocations
2008-09 Concess-
ionary Travel NRE
Aggreg-ated 2008-
09 Concess-
ionary Travel NRE
Aggreg-ated 2010-
11 Concess-
ionary Travel Special Grant
Base Position
SUFFOLKBabergh 6.2 0.8 0.0 0.1 5.5Forest Heath 5.6 0.4 0.0 0.1 5.3Ipswich 11.9 2.9 0.0 0.6 9.6Mid Suffolk 6.3 0.7 0.0 0.1 5.7St Edmundsbury 7.1 0.9 0.0 0.2 6.3Suffolk Coastal 8.3 1.1 0.0 0.1 7.2Waveney 11.7 1.5 0.0 0.6 10.8
SURREYElmbridge 6.5 0.2 0.0 0.1 6.4Epsom and Ewell 4.2 0.2 0.0 0.1 4.0Guildford 8.5 1.2 0.0 0.9 8.1Mole Valley 4.0 0.3 0.0 0.1 3.8Reigate and Banstead 6.9 0.7 0.0 0.3 6.5Runnymede 5.6 0.3 0.0 0.1 5.4Spelthorne 5.7 0.4 0.0 0.1 5.4Surrey Heath 4.8 0.6 0.0 0.5 4.7Tandridge 4.2 0.3 0.0 0.1 4.0Waverley 6.1 0.6 0.0 0.3 5.7Woking 6.6 0.7 0.0 0.3 6.3
WARWICKSHIRENorth Warwickshire 5.4 0.4 0.0 0.1 5.2Nuneaton and Bedworth 11.4 1.6 0.0 0.4 10.2Rugby 7.0 0.9 0.0 0.2 6.4Stratford-on-Avon 7.0 0.7 0.0 0.5 6.8Warwick 10.5 1.4 0.0 0.4 9.4
WEST SUSSEXAdur 5.0 0.7 0.0 0.1 4.4Arun 10.3 1.6 0.0 0.6 9.3Chichester 7.2 1.2 0.0 0.7 6.7Crawley 10.5 1.7 0.0 0.3 9.1Horsham 6.2 0.9 0.0 0.5 5.8Mid Sussex 6.5 0.7 0.0 0.3 6.1Worthing 7.9 1.8 0.0 1.0 7.2
WORCESTERSHIREBromsgrove 5.0 0.5 0.0 0.3 4.8Malvern Hills 5.2 0.3 0.0 0.2 5.1Redditch 6.5 1.2 0.0 0.2 5.5Worcester 8.2 1.7 0.0 0.5 7.1Wychavon 7.8 0.6 0.0 0.3 7.5Wyre Forest 8.1 0.7 0.0 0.3 7.7
Formula Grant After Floor Damping
(£ million) (%) (£ million) (%)
Option CONCF8Option CONCF7Difference from Base Position
-0.3 -5.5% -0.3 -5.5%-0.3 -5.7% -0.3 -5.7%-0.3 -2.7% -0.3 -2.7%-0.4 -6.4% -0.4 -6.4%-0.4 -6.7% -0.4 -6.7%-0.4 -5.6% -0.4 -5.6%-0.9 -8.4% -0.9 -8.4%
-0.4 -6.3% -0.4 -6.3%-0.2 -6.1% -0.2 -6.1%-1.0 -12.3% -1.0 -12.3%-0.2 -6.3% -0.2 -6.3%-0.5 -8.0% -0.5 -8.0%-0.3 -6.4% -0.3 -6.4%-0.3 -5.8% -0.3 -5.8%-0.6 -13.5% -0.6 -13.5%-0.2 -5.4% -0.2 -5.4%-0.5 -8.6% -0.5 -8.6%-0.6 -9.2% -0.6 -9.2%
-0.3 -6.4% -0.3 -6.4%-0.6 -6.0% -0.6 -6.0%-0.5 -7.4% -0.5 -7.4%-0.7 -10.5% -0.7 -10.5%-0.6 -6.1% -0.6 -6.1%
-0.2 -3.9% -0.2 -3.9%-0.8 -9.0% -0.8 -9.0%-1.0 -14.4% -1.0 -14.4%-0.3 -3.1% -0.3 -3.1%-0.7 -12.5% -0.7 -12.5%-0.5 -8.5% -0.5 -8.5%-0.9 -12.6% -0.9 -12.6%
-0.5 -10.8% -0.5 -10.8%-0.4 -8.3% -0.4 -8.3%-0.3 -4.7% -0.3 -4.7%-0.6 -8.0% -0.6 -8.0%-0.8 -10.7% -0.8 -10.7%-0.6 -8.3% -0.6 -8.3%
318

(£ million) (£ million) (£ million) (£ million) (£ million)
Base Position = 2010-11 Agreed Position - 2008-09 Concessionary Travel NRE + 2008-09 Aggregated Concessionary Travel NRE + Aggregated 2010-11 Concessionary Travel Special Grant
2010-11 Indicative
Allocations
2008-09 Concess-
ionary Travel NRE
Aggreg-ated 2008-
09 Concess-
ionary Travel NRE
Aggreg-ated 2010-
11 Concess-
ionary Travel Special Grant
Base Position
SHIRE POLICE AUTHORITIES
Avon & Somerset Police 186.1 0.0 0.0 0.0 186.1Bedfordshire Police 73.1 0.0 0.0 0.0 73.1Cambridgeshire Police 83.5 0.0 0.0 0.0 83.5Cheshire Police 123.5 0.0 0.0 0.0 123.5Cleveland Police 100.1 0.0 0.0 0.0 100.1
Cumbria Police 68.9 0.0 0.0 0.0 68.9Derbyshire Police 116.2 0.0 0.0 0.0 116.2Devon & Cornwall Police 191.2 0.0 0.0 0.0 191.2Dorset Police 66.9 0.0 0.0 0.0 66.9Durham Police 93.7 0.0 0.0 0.0 93.7
Essex Police 183.0 0.0 0.0 0.0 183.0Gloucestershire Police 60.8 0.0 0.0 0.0 60.8Hampshire Police 213.0 0.0 0.0 0.0 213.0Hertfordshire Police 124.8 0.0 0.0 0.0 124.8Humberside Police 131.8 0.0 0.0 0.0 131.8
Kent Police 197.4 0.0 0.0 0.0 197.4Lancashire Police 209.7 0.0 0.0 0.0 209.7Leicestershire Police 121.4 0.0 0.0 0.0 121.4Lincolnshire Police 66.3 0.0 0.0 0.0 66.3Norfolk Police 89.8 0.0 0.0 0.0 89.8
North Yorkshire Police 78.6 0.0 0.0 0.0 78.6Northamptonshire Police 77.5 0.0 0.0 0.0 77.5Nottinghamshire Police 146.0 0.0 0.0 0.0 146.0Staffordshire Police 123.8 0.0 0.0 0.0 123.8Suffolk Police 72.7 0.0 0.0 0.0 72.7
Surrey Police 104.4 0.0 0.0 0.0 104.4Sussex Police 174.1 0.0 0.0 0.0 174.1Thames Valley Police 244.7 0.0 0.0 0.0 244.7Warwickshire Police 55.6 0.0 0.0 0.0 55.6West Mercia Police 124.9 0.0 0.0 0.0 124.9
Wiltshire Police 66.8 0.0 0.0 0.0 66.8
Formula Grant After Floor Damping
(£ million) (%) (£ million) (%)
Option CONCF8Option CONCF7Difference from Base Position
0.0 0.0% 0.0 0.0%0.0 0.0% 0.0 0.0%0.0 0.0% 0.0 0.0%0.0 0.0% 0.0 0.0%0.0 0.0% 0.0 0.0%
0.0 0.0% 0.0 0.0%0.0 0.0% 0.0 0.0%0.0 0.0% 0.0 0.0%0.0 0.0% 0.0 0.0%0.0 0.0% 0.0 0.0%
0.0 0.0% 0.0 0.0%0.0 0.0% 0.0 0.0%0.0 0.0% 0.0 0.0%0.0 0.0% 0.0 0.0%0.0 0.0% 0.0 0.0%
0.0 0.0% 0.0 0.0%0.0 0.0% 0.0 0.0%0.0 0.0% 0.0 0.0%0.0 0.0% 0.0 0.0%0.0 0.0% 0.0 0.0%
0.0 0.0% 0.0 0.0%0.0 0.0% 0.0 0.0%0.0 0.0% 0.0 0.0%0.0 0.0% 0.0 0.0%0.0 0.0% 0.0 0.0%
0.0 0.0% 0.0 0.0%0.0 0.0% 0.0 0.0%0.0 0.0% 0.0 0.0%0.0 0.0% 0.0 0.0%0.0 0.0% 0.0 0.0%
0.0 0.0% 0.0 0.0%
319

(£ million) (£ million) (£ million) (£ million) (£ million)
Base Position = 2010-11 Agreed Position - 2008-09 Concessionary Travel NRE + 2008-09 Aggregated Concessionary Travel NRE + Aggregated 2010-11 Concessionary Travel Special Grant
2010-11 Indicative
Allocations
2008-09 Concess-
ionary Travel NRE
Aggreg-ated 2008-
09 Concess-
ionary Travel NRE
Aggreg-ated 2010-
11 Concess-
ionary Travel Special Grant
Base Position
SHIRE FIRE AUTHORITIES
Avon Fire 24.9 0.0 0.0 0.0 24.9Bedfordshire Fire 11.4 0.0 0.0 0.0 11.4Berkshire Fire Auhtority 15.4 0.0 0.0 0.0 15.4Buckinghamshire Fire 11.5 0.0 0.0 0.0 11.5Cambridgeshire Fire 14.4 0.0 0.0 0.0 14.4
Cheshire Fire 18.6 0.0 0.0 0.0 18.6Cleveland Fire 22.4 0.0 0.0 0.0 22.4Derbyshire Fire 19.7 0.0 0.0 0.0 19.7Devon and Somerset Fire 31.2 0.0 0.0 0.0 31.2Dorset Fire 11.0 0.0 0.0 0.0 11.0
Durham Fire 14.5 0.0 0.0 0.0 14.5East Sussex Fire 14.7 0.0 0.0 0.0 14.7Essex Fire Auhtority 32.4 0.0 0.0 0.0 32.4Hampshire Fire 29.3 0.0 0.0 0.0 29.3Hereford & Worcester Fire 10.7 0.0 0.0 0.0 10.7
Humberside Fire 27.2 0.0 0.0 0.0 27.2Kent Fire 29.6 0.0 0.0 0.0 29.6Lancashire Fire 32.6 0.0 0.0 0.0 32.6Leicestershire Fire 18.8 0.0 0.0 0.0 18.8North Yorkshire Fire 13.0 0.0 0.0 0.0 13.0
Nottinghamshire Fire 25.0 0.0 0.0 0.0 25.0Shropshire Fire 8.3 0.0 0.0 0.0 8.3Staffordshire Fire 18.6 0.0 0.0 0.0 18.6Wiltshire Fire 9.6 0.0 0.0 0.0 9.6
Formula Grant After Floor Damping
(£ million) (%) (£ million) (%)
Option CONCF8Option CONCF7Difference from Base Position
0.0 0.0% 0.0 0.0%0.0 0.0% 0.0 0.0%0.0 0.0% 0.0 0.0%0.0 0.0% 0.0 0.0%0.0 -0.1% 0.0 -0.1%
0.0 -0.1% 0.0 -0.1%0.0 0.0% 0.0 0.0%0.0 0.0% 0.0 0.0%0.0 -0.1% 0.0 -0.1%0.0 -0.2% 0.0 -0.2%
0.0 0.0% 0.0 0.0%0.0 -0.1% 0.0 -0.1%0.0 -0.1% 0.0 -0.1%0.0 -0.1% 0.0 -0.1%0.0 -0.1% 0.0 -0.1%
0.0 0.0% 0.0 0.0%0.0 -0.1% 0.0 -0.1%0.0 0.0% 0.0 0.0%0.0 0.0% 0.0 0.0%0.0 0.0% 0.0 0.0%
0.0 0.0% 0.0 0.0%0.0 0.0% 0.0 0.0%0.0 0.0% 0.0 0.0%0.0 -0.1% 0.0 -0.1%
320
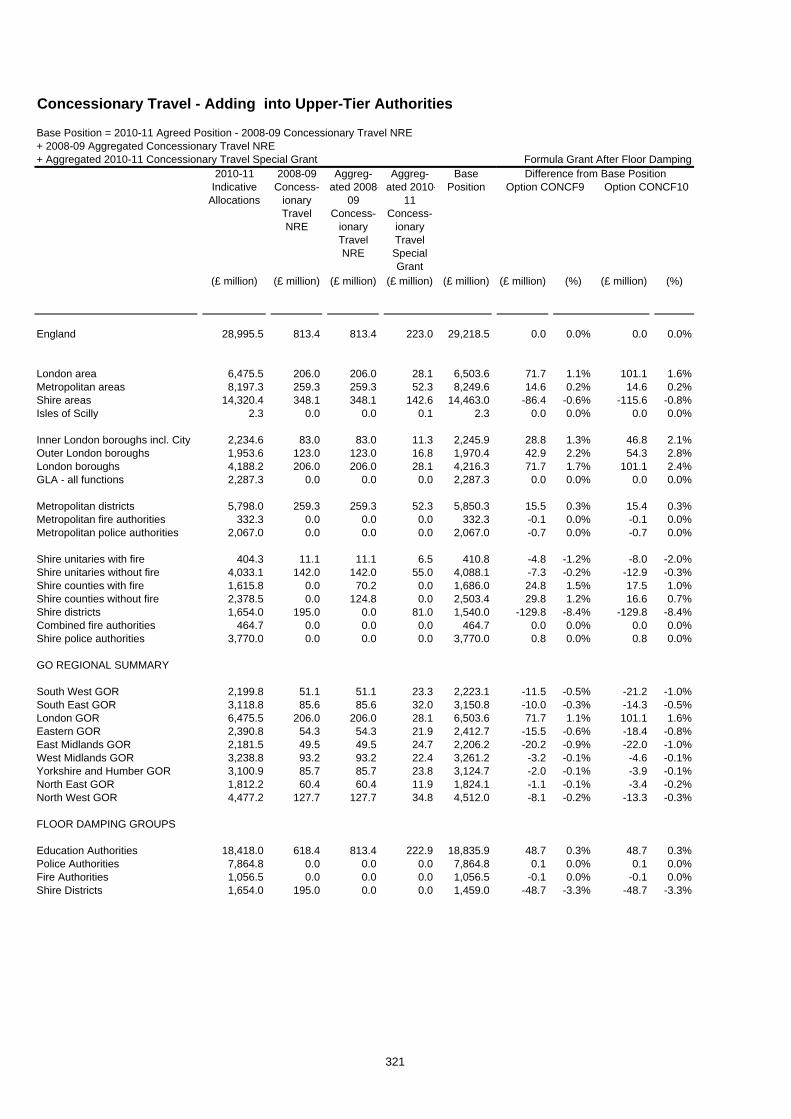
Concessionary Travel - Adding into Upper-Tier Authorities
(£ million) (£ million) (£ million) (£ million) (£ million)
England 28,995.5 813.4 813.4 223.0 29,218.5
London area 6,475.5 206.0 206.0 28.1 6,503.6Metropolitan areas 8,197.3 259.3 259.3 52.3 8,249.6Shire areas 14,320.4 348.1 348.1 142.6 14,463.0Isles of Scilly 2.3 0.0 0.0 0.1 2.3
Inner London boroughs incl. City 2,234.6 83.0 83.0 11.3 2,245.9Outer London boroughs 1,953.6 123.0 123.0 16.8 1,970.4London boroughs 4,188.2 206.0 206.0 28.1 4,216.3GLA - all functions 2,287.3 0.0 0.0 0.0 2,287.3
Metropolitan districts 5,798.0 259.3 259.3 52.3 5,850.3Metropolitan fire authorities 332.3 0.0 0.0 0.0 332.3Metropolitan police authorities 2,067.0 0.0 0.0 0.0 2,067.0
Shire unitaries with fire 404.3 11.1 11.1 6.5 410.8Shire unitaries without fire 4,033.1 142.0 142.0 55.0 4,088.1Shire counties with fire 1,615.8 0.0 70.2 0.0 1,686.0Shire counties without fire 2,378.5 0.0 124.8 0.0 2,503.4Shire districts 1,654.0 195.0 0.0 81.0 1,540.0Combined fire authorities 464.7 0.0 0.0 0.0 464.7Shire police authorities 3,770.0 0.0 0.0 0.0 3,770.0
GO REGIONAL SUMMARY
South West GOR 2,199.8 51.1 51.1 23.3 2,223.1South East GOR 3,118.8 85.6 85.6 32.0 3,150.8London GOR 6,475.5 206.0 206.0 28.1 6,503.6Eastern GOR 2,390.8 54.3 54.3 21.9 2,412.7East Midlands GOR 2,181.5 49.5 49.5 24.7 2,206.2West Midlands GOR 3,238.8 93.2 93.2 22.4 3,261.2Yorkshire and Humber GOR 3,100.9 85.7 85.7 23.8 3,124.7North East GOR 1,812.2 60.4 60.4 11.9 1,824.1North West GOR 4,477.2 127.7 127.7 34.8 4,512.0
FLOOR DAMPING GROUPS
Education Authorities 18,418.0 618.4 813.4 222.9 18,835.9Police Authorities 7,864.8 0.0 0.0 0.0 7,864.8Fire Authorities 1,056.5 0.0 0.0 0.0 1,056.5Shire Districts 1,654.0 195.0 0.0 0.0 1,459.0
Base Position = 2010-11 Agreed Position - 2008-09 Concessionary Travel NRE + 2008-09 Aggregated Concessionary Travel NRE + Aggregated 2010-11 Concessionary Travel Special Grant
2010-11 Indicative
Allocations
2008-09 Concess-
ionary Travel NRE
Aggreg-ated 2008-
09 Concess-
ionary Travel NRE
Aggreg-ated 2010-
11 Concess-
ionary Travel Special Grant
Base Position
Formula Grant After Floor Damping
(£ million) (%) (£ million) (%)
0.0 0.0% 0.0 0.0%
71.7 1.1% 101.1 1.6%14.6 0.2% 14.6 0.2%
-86.4 -0.6% -115.6 -0.8%0.0 0.0% 0.0 0.0%
28.8 1.3% 46.8 2.1%42.9 2.2% 54.3 2.8%71.7 1.7% 101.1 2.4%0.0 0.0% 0.0 0.0%
15.5 0.3% 15.4 0.3%-0.1 0.0% -0.1 0.0%-0.7 0.0% -0.7 0.0%
-4.8 -1.2% -8.0 -2.0%-7.3 -0.2% -12.9 -0.3%24.8 1.5% 17.5 1.0%29.8 1.2% 16.6 0.7%
-129.8 -8.4% -129.8 -8.4%0.0 0.0% 0.0 0.0%0.8 0.0% 0.8 0.0%
-11.5 -0.5% -21.2 -1.0%-10.0 -0.3% -14.3 -0.5%71.7 1.1% 101.1 1.6%
-15.5 -0.6% -18.4 -0.8%-20.2 -0.9% -22.0 -1.0%-3.2 -0.1% -4.6 -0.1%-2.0 -0.1% -3.9 -0.1%-1.1 -0.1% -3.4 -0.2%-8.1 -0.2% -13.3 -0.3%
48.7 0.3% 48.7 0.3%0.1 0.0% 0.1 0.0%
-0.1 0.0% -0.1 0.0%-48.7 -3.3% -48.7 -3.3%
Option CONCF9 Option CONCF10Difference from Base Position
321

(£ million) (£ million) (£ million) (£ million) (£ million)
Base Position = 2010-11 Agreed Position - 2008-09 Concessionary Travel NRE + 2008-09 Aggregated Concessionary Travel NRE + Aggregated 2010-11 Concessionary Travel Special Grant
2010-11 Indicative
Allocations
2008-09 Concess-
ionary Travel NRE
Aggreg-ated 2008-
09 Concess-
ionary Travel NRE
Aggreg-ated 2010-
11 Concess-
ionary Travel Special Grant
Base Position
GREATER LONDON
City of London 104.7 0.4 0.4 0.0 104.7
Camden 167.3 8.4 8.4 1.1 168.4Greenwich 166.8 5.2 5.2 0.7 167.5Hackney 220.0 6.6 6.6 0.9 220.9Hammersmith and Fulham 120.9 6.2 6.2 0.8 121.8Islington 160.2 6.8 6.8 0.9 161.2Kensington and Chelsea 106.0 6.0 6.0 0.8 106.8
Lambeth 213.9 8.5 8.5 1.2 215.1Lewisham 180.2 6.7 6.7 0.9 181.1Southwark 230.7 6.9 6.9 0.9 231.7Tower Hamlets 232.2 5.2 5.2 0.7 232.9Wandsworth 150.2 7.9 7.9 1.1 151.3Westminster 181.5 8.4 8.4 1.1 182.6
Barking and Dagenham 102.8 3.6 3.6 0.5 103.3Barnet 94.6 9.6 9.6 1.3 95.9Bexley 65.6 4.1 4.1 0.6 66.2Brent 164.5 9.2 9.2 1.3 165.7Bromley 65.1 5.8 5.8 0.8 65.9
Croydon 118.5 7.0 7.0 1.0 119.5Ealing 144.4 9.8 9.8 1.3 145.8Enfield 121.9 7.2 7.2 1.0 122.9Haringey 144.6 8.5 8.5 1.2 145.8Harrow 67.8 6.1 6.1 0.8 68.6
Havering 55.3 5.1 5.1 0.7 56.0Hillingdon 84.4 5.6 5.6 0.8 85.2Hounslow 91.4 5.4 5.4 0.7 92.2Kingston upon Thames 37.2 2.9 2.9 0.4 37.6Merton 67.7 5.3 5.3 0.7 68.5
Newham 224.0 7.2 7.2 1.0 225.0Redbridge 98.0 6.3 6.3 0.9 98.9Richmond upon Thames 28.0 4.7 4.7 0.6 28.7Sutton 54.5 3.4 3.4 0.5 55.0Waltham Forest 123.0 5.9 5.9 0.8 123.8
GLA - all functions 2,287.3 0.0 0.0 0.0 2,287.3
GLA - police 2,027.7 0.0 0.0 0.0 2,027.7GLA - fire 259.6 0.0 0.0 0.0 259.6
Formula Grant After Floor Damping
(£ million) (%) (£ million) (%)
Option CONCF9 Option CONCF10Difference from Base Position
0.6 0.5% 0.5 0.5%
4.6 2.7% 6.0 3.6%2.4 1.4% 3.2 1.9%2.0 0.9% 3.8 1.7%1.5 1.2% 2.3 1.9%1.8 1.1% 2.6 1.6%1.4 1.3% 3.1 2.9%
2.3 1.1% 4.0 1.9%2.0 1.1% 3.1 1.7%2.1 0.9% 4.3 1.9%1.9 0.8% 4.4 1.9%1.9 1.2% 3.3 2.2%4.3 2.4% 6.1 3.4%
1.0 1.0% 1.2 1.1%4.6 4.8% 5.6 5.8%0.9 1.4% 0.7 1.1%3.5 2.1% 5.0 3.0%1.2 1.8% 0.8 1.2%
3.6 3.0% 4.5 3.8%2.1 1.5% 3.7 2.5%3.1 2.5% 3.8 3.1%1.9 1.3% 2.8 1.9%2.8 4.1% 3.4 5.0%
1.0 1.8% 0.3 0.5%2.1 2.4% 2.3 2.6%1.2 1.3% 2.2 2.4%0.6 1.6% 1.0 2.7%1.1 1.6% 1.7 2.5%
4.8 2.1% 6.6 2.9%3.0 3.0% 3.7 3.7%0.8 2.9% 0.9 3.1%0.8 1.4% 0.8 1.4%2.7 2.2% 3.3 2.7%
0.0 0.0% 0.0 0.0%
0.0 0.0% 0.0 0.0%0.0 0.0% 0.0 0.0%
322

(£ million) (£ million) (£ million) (£ million) (£ million)
Base Position = 2010-11 Agreed Position - 2008-09 Concessionary Travel NRE + 2008-09 Aggregated Concessionary Travel NRE + Aggregated 2010-11 Concessionary Travel Special Grant
2010-11 Indicative
Allocations
2008-09 Concess-
ionary Travel NRE
Aggreg-ated 2008-
09 Concess-
ionary Travel NRE
Aggreg-ated 2010-
11 Concess-
ionary Travel Special Grant
Base Position
GREATER MANCHESTERBolton 127.6 4.8 4.8 1.1 128.7Bury 66.2 3.3 3.3 0.8 66.9Manchester 342.5 8.4 8.4 2.0 344.5Oldham 121.6 4.0 4.0 0.9 122.6Rochdale 109.7 3.8 3.8 0.9 110.6Salford 130.2 4.0 4.0 1.0 131.2Stockport 83.5 5.1 5.1 1.2 84.7Tameside 105.5 3.9 3.9 0.9 106.4Trafford 69.8 3.9 3.9 0.9 70.7Wigan 133.1 5.6 5.6 1.3 134.4Greater Manchester Fire 75.3 0.0 0.0 0.0 75.3Greater Manchester Police 472.5 0.0 0.0 0.0 472.5
MERSEYSIDEKnowsley 118.5 4.7 4.7 0.9 119.4Liverpool 325.1 13.5 13.5 2.6 327.7Sefton 124.7 8.6 8.6 1.6 126.3St Helens 88.0 5.5 5.5 1.1 89.1Wirral 157.9 9.6 9.6 1.8 159.7Merseyside Fire 46.3 0.0 0.0 0.0 46.3Merseyside Police 274.3 0.0 0.0 0.0 274.3
SOUTH YORKSHIREBarnsley 109.9 5.0 5.0 0.9 110.8Doncaster 143.2 6.5 6.5 1.2 144.5Rotherham 123.4 5.7 5.7 1.1 124.4Sheffield 277.6 11.9 11.9 2.2 279.9South Yorkshire Fire 36.8 0.0 0.0 0.0 36.8South Yorkshire Police 209.2 0.0 0.0 0.0 209.2
TYNE AND WEARGateshead 105.8 6.8 6.8 1.0 106.8Newcastle upon Tyne 167.0 9.8 9.8 1.4 168.4North Tyneside 87.9 7.0 7.0 1.0 88.9South Tyneside 90.3 5.4 5.4 0.8 91.1Sunderland 157.5 10.0 10.0 1.5 158.9Tyne and Wear Fire 35.6 0.0 0.0 0.0 35.6Northumbria Police 256.2 0.0 0.0 0.0 256.2
WEST MIDLANDSBirmingham 678.1 25.6 25.6 5.0 683.1Coventry 153.0 7.8 7.8 1.5 154.6Dudley 125.6 7.7 7.7 1.5 127.1Sandwell 183.3 7.3 7.3 1.4 184.8Solihull 54.6 5.2 5.2 1.0 55.7Walsall 137.3 6.4 6.4 1.3 138.5Wolverhampton 144.1 5.9 5.9 1.2 145.3West Midlands Fire 80.8 0.0 0.0 0.0 80.8West Midlands Police 504.3 0.0 0.0 0.0 504.3
Formula Grant After Floor Damping
(£ million) (%) (£ million) (%)
Option CONCF9 Option CONCF10Difference from Base Position
0.2 0.1% 0.2 0.2%0.1 0.1% -0.1 -0.1%2.1 0.6% 3.4 1.0%0.4 0.3% 0.6 0.5%0.2 0.2% 0.4 0.3%0.2 0.2% 0.2 0.2%0.0 -0.1% -0.4 -0.5%0.0 0.0% 0.0 0.0%0.3 0.5% 0.2 0.2%
-0.7 -0.5% -1.2 -0.9%0.0 0.0% 0.0 0.0%
-0.2 0.0% -0.2 0.0%
0.4 0.4% 0.2 0.1%1.2 0.4% 1.1 0.3%
-0.7 -0.6% -1.3 -1.0%-0.6 -0.6% -0.9 -1.0%-0.9 -0.6% -1.4 -0.9%0.0 0.0% 0.0 0.0%
-0.1 0.0% -0.1 0.0%
-0.6 -0.5% -0.8 -0.8%-0.5 -0.3% -0.9 -0.6%-0.3 -0.2% -0.5 -0.4%0.9 0.3% 1.0 0.3%0.0 0.0% 0.0 0.0%0.0 0.0% 0.0 0.0%
0.5 0.5% 0.3 0.3%0.8 0.5% 0.9 0.5%0.4 0.5% 0.1 0.1%0.4 0.5% 0.3 0.3%0.2 0.1% -0.3 -0.2%0.0 -0.1% 0.0 -0.1%0.0 0.0% 0.0 0.0%
4.7 0.7% 7.2 1.0%1.0 0.7% 1.3 0.8%
-0.3 -0.2% -0.7 -0.6%0.5 0.3% 0.7 0.4%0.3 0.5% -0.4 -0.8%0.1 0.0% 0.0 0.0%0.5 0.4% 0.6 0.4%0.0 -0.1% 0.0 -0.1%
-0.4 -0.1% -0.4 -0.1%
323

(£ million) (£ million) (£ million) (£ million) (£ million)
Base Position = 2010-11 Agreed Position - 2008-09 Concessionary Travel NRE + 2008-09 Aggregated Concessionary Travel NRE + Aggregated 2010-11 Concessionary Travel Special Grant
2010-11 Indicative
Allocations
2008-09 Concess-
ionary Travel NRE
Aggreg-ated 2008-
09 Concess-
ionary Travel NRE
Aggreg-ated 2010-
11 Concess-
ionary Travel Special Grant
Base Position
WEST YORKSHIREBradford 272.0 8.3 8.3 2.1 274.1Calderdale 81.5 3.3 3.3 0.8 82.4Kirklees 157.2 6.7 6.7 1.7 158.8Leeds 303.5 12.8 12.8 3.2 306.7Wakefield 141.3 5.3 5.3 1.3 142.6West Yorkshire Fire 57.5 0.0 0.0 0.0 57.5West Yorkshire Police 350.5 0.0 0.0 0.0 350.5
Formula Grant After Floor Damping
(£ million) (%) (£ million) (%)
Option CONCF9 Option CONCF10Difference from Base Position
1.9 0.7% 2.9 1.1%0.3 0.3% 0.3 0.4%0.9 0.5% 1.1 0.7%1.9 0.6% 2.1 0.7%
-0.4 -0.3% -0.7 -0.5%0.0 0.0% 0.0 0.0%
-0.1 0.0% -0.1 0.0%
324

(£ million) (£ million) (£ million) (£ million) (£ million)
Base Position = 2010-11 Agreed Position - 2008-09 Concessionary Travel NRE + 2008-09 Aggregated Concessionary Travel NRE + Aggregated 2010-11 Concessionary Travel Special Grant
2010-11 Indicative
Allocations
2008-09 Concess-
ionary Travel NRE
Aggreg-ated 2008-
09 Concess-
ionary Travel NRE
Aggreg-ated 2010-
11 Concess-
ionary Travel Special Grant
Base Position
ALL PURPOSE AUTHORITIES
Bath & North East Somerset 41.6 3.0 3.0 1.2 42.8Bedford 54.1 1.7 1.7 0.5 54.6Blackburn with Darwen 81.6 2.4 2.4 0.5 82.2Blackpool 81.8 3.7 3.7 2.3 84.1Bournemouth 55.0 2.8 2.8 1.3 56.3
Bracknell Forest 26.1 0.7 0.7 0.3 26.4Brighton & Hove 109.2 5.8 5.8 1.8 111.0Bristol 166.9 5.8 5.8 1.9 168.9Central Bedfordshire 50.6 1.5 1.5 0.6 51.2Cheshire East 63.2 2.4 2.4 1.0 64.2
Cheshire West & Chester 93.5 3.3 3.3 1.2 94.7Cornwall 213.1 3.4 3.4 3.5 216.6Darlington 38.8 2.8 2.8 1.4 40.2Derby 109.7 5.8 5.8 3.8 113.5Durham 230.6 7.6 7.6 1.5 232.2
East Riding of Yorkshire 101.4 3.2 3.2 0.9 102.3Halton 64.0 1.7 1.7 0.3 64.3Hartlepool 51.5 1.3 1.3 0.4 51.9Herefordshire 57.6 1.6 1.6 0.7 58.3Isle of Wight Council 61.4 4.9 4.9 1.8 63.2
Kingston upon Hull 152.0 5.3 5.3 1.9 153.9Leicester 182.4 5.4 5.4 2.3 184.7Luton 89.9 3.3 3.3 2.0 91.9Medway 85.2 3.0 3.0 0.7 85.9Middlesbrough 83.6 2.3 2.3 0.6 84.2
Milton Keynes 87.3 1.8 1.8 0.8 88.1North East Lincolnshire 72.8 1.6 1.6 0.6 73.4North Lincolnshire 62.3 1.3 1.3 0.5 62.8North Somerset 52.0 2.0 2.0 0.7 52.7Northumberland 129.8 2.7 2.7 1.3 131.0
Nottingham 172.6 7.5 7.5 4.4 177.0Peterborough 77.0 2.1 2.1 1.5 78.5Plymouth 106.0 3.9 3.9 1.1 107.2Poole 26.9 2.0 2.0 0.6 27.5Portsmouth 87.5 3.1 3.1 0.9 88.4
Reading 55.4 2.1 2.1 1.0 56.3Redcar and Cleveland 68.7 2.1 2.1 0.4 69.2Rutland 7.7 0.0 0.0 0.1 7.8Shropshire 93.1 1.9 1.9 0.9 94.1Slough 56.8 1.8 1.8 1.1 57.8
South Gloucestershire 60.8 1.8 1.8 0.3 61.1Southampton 100.2 2.5 2.5 1.1 101.3Southend-on-Sea 61.5 1.7 1.7 0.3 61.8Stockton-on-Tees 78.2 2.5 2.5 0.7 78.9Stoke-on-Trent 127.3 4.0 4.0 1.2 128.5
Formula Grant After Floor Damping
(£ million) (%) (£ million) (%)
Option CONCF9 Option CONCF10Difference from Base Position
-0.3 -0.8% -0.4 -1.0%0.4 0.7% 0.5 1.0%0.3 0.4% 0.7 0.8%
-1.3 -1.5% -1.8 -2.2%0.2 0.3% -0.6 -1.0%
0.1 0.5% 0.2 0.7%0.5 0.5% 0.1 0.1%1.1 0.6% 1.3 0.8%0.0 -0.1% -0.2 -0.3%
-0.2 -0.3% -1.0 -1.6%
-0.1 -0.1% -1.0 -1.0%-2.5 -1.2% -4.7 -2.2%-1.0 -2.4% -1.1 -2.8%-2.4 -2.1% -2.2 -2.0%-1.1 -0.5% -1.4 -0.6%
-0.9 -0.8% -1.3 -1.2%-0.3 -0.4% -0.4 -0.5%-0.1 -0.3% -0.2 -0.3%-0.9 -1.5% -1.3 -2.2%-1.4 -2.2% -1.9 -3.0%
-0.5 -0.3% -0.5 -0.3%1.4 0.8% 2.4 1.3%
-0.3 -0.4% 0.4 0.5%0.5 0.6% 0.8 0.9%0.0 0.0% -0.1 -0.1%
0.4 0.4% 0.5 0.6%0.0 0.0% -0.1 -0.1%
-0.4 -0.6% -0.5 -0.7%-0.5 -0.9% -0.7 -1.3%-0.8 -0.6% -1.4 -1.1%
-1.6 -0.9% -1.6 -0.9%-0.6 -0.7% -0.6 -0.7%0.1 0.1% 0.0 0.0%0.1 0.5% -0.4 -1.3%0.8 0.9% 1.0 1.1%
0.3 0.5% 0.2 0.3%-0.2 -0.3% -0.2 -0.3%-0.1 -1.6% -0.2 -2.4%-1.2 -1.2% -1.8 -2.0%-0.4 -0.7% 0.4 0.6%
0.1 0.2% -0.2 -0.3%0.8 0.8% 0.9 0.8%0.5 0.8% 0.5 0.8%
-0.1 -0.1% -0.2 -0.3%-0.5 -0.4% -0.6 -0.4%
325

(£ million) (£ million) (£ million) (£ million) (£ million)
Base Position = 2010-11 Agreed Position - 2008-09 Concessionary Travel NRE + 2008-09 Aggregated Concessionary Travel NRE + Aggregated 2010-11 Concessionary Travel Special Grant
2010-11 Indicative
Allocations
2008-09 Concess-
ionary Travel NRE
Aggreg-ated 2008-
09 Concess-
ionary Travel NRE
Aggreg-ated 2010-
11 Concess-
ionary Travel Special Grant
Base Position
Swindon 50.6 2.0 2.0 0.8 51.4Telford and the Wrekin 70.6 1.6 1.6 0.5 71.1Thurrock 59.8 0.8 0.8 0.2 60.0Torbay 59.0 3.1 3.1 1.6 60.6Warrington 54.0 3.0 3.0 1.2 55.2
West Berkshire 29.2 0.5 0.5 0.2 29.5Wiltshire 102.2 3.3 3.3 1.2 103.4Windsor and Maidenhead 18.8 1.0 1.0 0.3 19.1Wokingham 19.6 1.1 1.1 0.2 19.8York 44.6 3.5 3.5 1.5 46.1
Isles of Scilly 2.3 0.0 0.0 0.1 2.3
Formula Grant After Floor Damping
(£ million) (%) (£ million) (%)
Option CONCF9 Option CONCF10Difference from Base Position
0.2 0.5% 0.1 0.3%-0.2 -0.3% -0.3 -0.4%0.4 0.6% 0.4 0.7%
-1.0 -1.6% -1.4 -2.3%-0.2 -0.4% -0.6 -1.2%
0.3 0.9% 0.1 0.3%0.5 0.5% -0.3 -0.2%0.1 0.5% 0.1 0.7%0.1 0.5% -0.1 -0.6%
-0.1 -0.2% -0.5 -1.0%
0.0 0.0% 0.0 0.0%
326

(£ million) (£ million) (£ million) (£ million) (£ million)
Base Position = 2010-11 Agreed Position - 2008-09 Concessionary Travel NRE + 2008-09 Aggregated Concessionary Travel NRE + Aggregated 2010-11 Concessionary Travel Special Grant
2010-11 Indicative
Allocations
2008-09 Concess-
ionary Travel NRE
Aggreg-ated 2008-
09 Concess-
ionary Travel NRE
Aggreg-ated 2010-
11 Concess-
ionary Travel Special Grant
Base Position
SHIRE COUNTIES
Buckinghamshire 59.6 0.0 5.5 0.0 65.1Cambridgeshire 111.1 0.0 3.5 0.0 114.6Cumbria 144.6 0.0 5.3 0.0 149.9Derbyshire 185.2 0.0 9.8 0.0 195.1Devon 161.2 0.0 5.8 0.0 167.0
Dorset 50.8 0.0 2.5 0.0 53.3East Sussex 100.2 0.0 4.7 0.0 104.9Essex 246.8 0.0 13.9 0.0 260.7Gloucestershire 117.0 0.0 4.6 0.0 121.6Hampshire 146.8 0.0 11.5 0.0 158.4
Hertfordshire 176.0 0.0 10.4 0.0 186.4Kent 275.9 0.0 15.4 0.0 291.2Lancashire 302.2 0.0 17.2 0.0 319.4Leicestershire 100.7 0.0 3.9 0.0 104.6Lincolnshire 192.1 0.0 4.5 0.0 196.7
Norfolk 238.3 0.0 7.0 0.0 245.4North Yorkshire 104.4 0.0 5.2 0.0 109.6Northamptonshire 154.2 0.0 5.0 0.0 159.2Nottinghamshire 176.2 0.0 7.5 0.0 183.7Oxfordshire 106.3 0.0 6.1 0.0 112.4
Somerset 110.0 0.0 5.1 0.0 115.1Staffordshire 157.3 0.0 8.4 0.0 165.7Suffolk 169.0 0.0 8.4 0.0 177.4Surrey 127.5 0.0 5.4 0.0 132.9Warwickshire 92.1 0.0 4.9 0.0 97.0
West Sussex 98.7 0.0 8.6 0.0 107.3Worcestershire 90.2 0.0 5.0 0.0 95.2
Formula Grant After Floor Damping
(£ million) (%) (£ million) (%)
Option CONCF9 Option CONCF10Difference from Base Position
1.5 2.3% 1.3 2.0%2.1 1.9% 1.7 1.5%1.9 1.3% 0.5 0.4%0.6 0.3% 0.1 0.0%2.1 1.3% 0.2 0.1%
1.1 2.0% 0.1 0.1%1.6 1.6% 1.2 1.1%2.7 1.0% 1.7 0.6%1.7 1.4% 1.1 0.9%4.1 2.6% 2.5 1.6%
4.0 2.1% 4.4 2.4%4.0 1.4% 3.1 1.1%2.8 0.9% 2.5 0.8%1.6 1.5% 1.2 1.2%1.3 0.7% -0.2 -0.1%
1.9 0.8% 0.1 0.0%1.4 1.3% 0.0 0.0%2.5 1.6% 2.6 1.7%1.5 0.8% 0.9 0.5%2.8 2.5% 2.4 2.2%
0.8 0.7% -0.1 -0.1%1.0 0.6% 0.0 0.0%0.9 0.5% 0.0 0.0%3.4 2.6% 3.1 2.4%1.4 1.4% 1.1 1.1%
2.9 2.7% 2.2 2.1%0.9 0.9% 0.2 0.2%
327

(£ million) (£ million) (£ million) (£ million) (£ million)
Base Position = 2010-11 Agreed Position - 2008-09 Concessionary Travel NRE + 2008-09 Aggregated Concessionary Travel NRE + Aggregated 2010-11 Concessionary Travel Special Grant
2010-11 Indicative
Allocations
2008-09 Concess-
ionary Travel NRE
Aggreg-ated 2008-
09 Concess-
ionary Travel NRE
Aggreg-ated 2010-
11 Concess-
ionary Travel Special Grant
Base Position
BUCKINGHAMSHIREAylesbury Vale 11.9 1.2 0.0 0.4 11.1Chiltern 4.0 1.1 0.0 0.2 3.1South Bucks 3.0 0.7 0.0 0.2 2.5Wycombe 10.1 2.5 0.0 0.4 8.0
CAMBRIDGESHIRECambridge 12.4 2.1 0.0 2.0 12.3East Cambridgeshire 6.8 0.1 0.0 0.1 6.7Fenland 9.6 0.3 0.0 0.2 9.6Huntingdonshire 12.9 0.7 0.0 0.5 12.7South Cambridgeshire 7.8 0.3 0.0 0.1 7.6
CUMBRIAAllerdale 10.6 1.2 0.0 0.5 10.0Barrow-in-Furness 9.1 0.7 0.0 0.2 8.5Carlisle 10.4 2.0 0.0 0.5 9.0Copeland 7.2 0.5 0.0 0.1 6.8Eden 4.6 0.1 0.0 0.2 4.8South Lakeland 6.9 0.8 0.0 0.9 7.0
DERBYSHIREAmber Valley 9.9 1.5 0.0 0.3 8.7Bolsover 7.9 0.7 0.0 0.2 7.4Chesterfield 10.2 3.1 0.0 2.3 9.4Derbyshire Dales 4.8 0.4 0.0 0.1 4.5Erewash 9.7 1.8 0.0 0.8 8.7High Peak 7.1 1.0 0.0 0.3 6.5North East Derbyshire 7.9 0.9 0.0 0.2 7.1South Derbyshire 7.3 0.5 0.0 0.1 6.9
DEVONEast Devon 8.2 1.1 0.0 0.6 7.7Exeter 12.1 2.6 0.0 2.3 11.8Mid Devon 6.2 0.3 0.0 0.1 5.9North Devon 8.3 0.1 0.0 0.3 8.5South Hams 5.5 0.3 0.0 0.2 5.4Teignbridge 9.9 1.0 0.0 0.5 9.5Torridge 6.4 0.2 0.0 0.1 6.3West Devon 4.3 0.2 0.0 0.1 4.3
DORSETChristchurch 2.9 0.5 0.0 0.2 2.6East Dorset 3.7 0.4 0.0 0.1 3.4North Dorset 4.6 0.1 0.0 0.1 4.5Purbeck 3.3 0.3 0.0 0.1 3.1West Dorset 8.3 0.4 0.0 0.3 8.2Weymouth and Portland 6.0 0.8 0.0 0.5 5.8
EAST SUSSEXEastbourne 10.4 1.9 0.0 1.0 9.5Hastings 10.4 1.2 0.0 0.6 9.9Lewes 6.4 0.7 0.0 0.1 5.8Rother 6.6 0.3 0.0 0.2 6.4Wealden 8.3 0.6 0.0 0.1 7.7
Formula Grant After Floor Damping
(£ million) (%) (£ million) (%)
Option CONCF9 Option CONCF10Difference from Base Position
-0.8 -7.6% -0.8 -7.6%-0.3 -9.6% -0.3 -9.6%-0.3 -10.9% -0.3 -10.9%-0.4 -4.5% -0.4 -4.5%
-2.0 -16.0% -2.0 -16.0%-0.4 -5.4% -0.4 -5.4%-0.8 -8.2% -0.8 -8.2%-1.1 -8.8% -1.1 -8.8%-0.4 -5.4% -0.4 -5.4%
-0.9 -9.2% -0.9 -9.2%-0.5 -6.1% -0.5 -6.1%-0.6 -7.2% -0.6 -7.2%-0.4 -5.3% -0.4 -5.3%-0.5 -9.5% -0.5 -9.5%-1.2 -16.8% -1.2 -16.8%
-0.5 -6.3% -0.5 -6.3%-0.5 -6.6% -0.5 -6.6%-1.8 -19.7% -1.8 -19.7%-0.3 -6.6% -0.3 -6.6%-0.8 -8.8% -0.8 -8.8%-0.5 -7.2% -0.5 -7.2%-0.5 -6.5% -0.5 -6.5%-0.5 -6.7% -0.5 -6.7%
-1.0 -13.1% -1.0 -13.1%-2.0 -17.2% -2.0 -17.2%-0.4 -6.8% -0.4 -6.8%-0.8 -9.3% -0.8 -9.3%-0.4 -7.9% -0.4 -7.9%-1.0 -10.6% -1.0 -10.6%-0.5 -7.8% -0.5 -7.8%-0.3 -7.3% -0.3 -7.3%
-0.3 -10.5% -0.3 -10.5%-0.3 -8.1% -0.3 -8.1%-0.3 -7.4% -0.3 -7.4%-0.2 -7.3% -0.2 -7.3%-0.6 -7.4% -0.6 -7.4%-0.7 -11.5% -0.7 -11.5%
-1.0 -10.0% -1.0 -10.0%-1.0 -10.0% -1.0 -10.0%-0.4 -6.1% -0.4 -6.1%-0.4 -6.6% -0.4 -6.6%-0.6 -7.1% -0.6 -7.1%
328
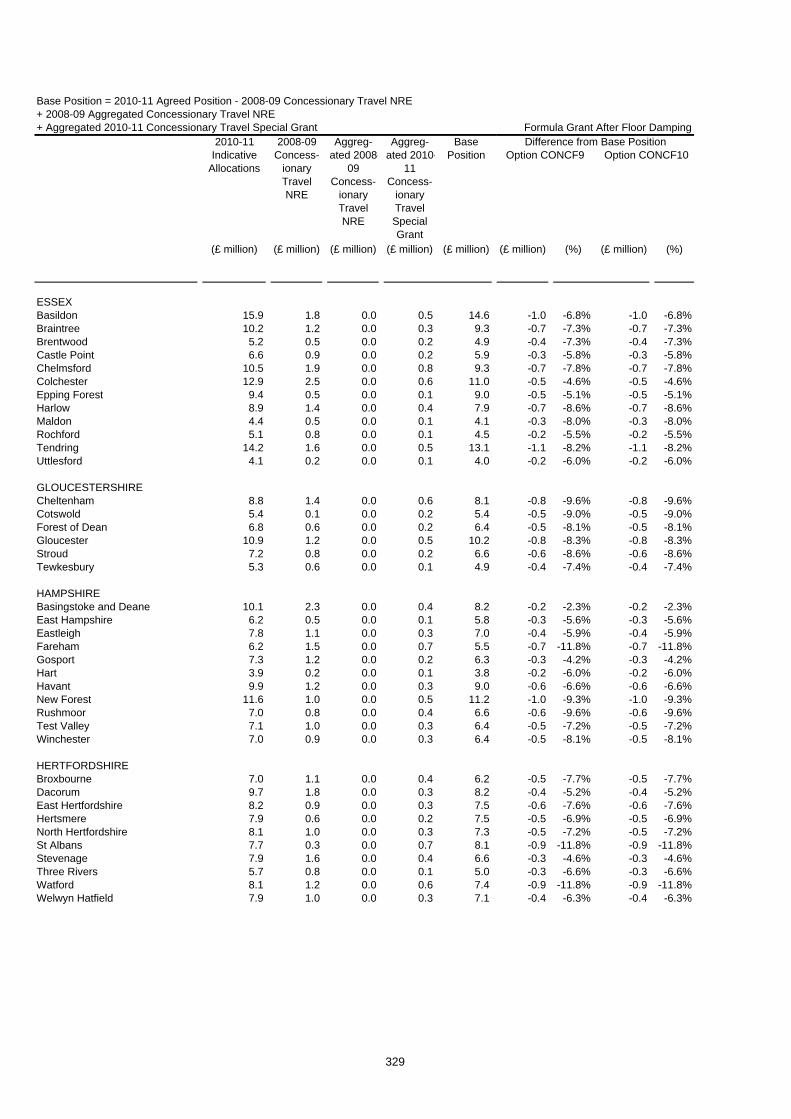
(£ million) (£ million) (£ million) (£ million) (£ million)
Base Position = 2010-11 Agreed Position - 2008-09 Concessionary Travel NRE + 2008-09 Aggregated Concessionary Travel NRE + Aggregated 2010-11 Concessionary Travel Special Grant
2010-11 Indicative
Allocations
2008-09 Concess-
ionary Travel NRE
Aggreg-ated 2008-
09 Concess-
ionary Travel NRE
Aggreg-ated 2010-
11 Concess-
ionary Travel Special Grant
Base Position
ESSEXBasildon 15.9 1.8 0.0 0.5 14.6Braintree 10.2 1.2 0.0 0.3 9.3Brentwood 5.2 0.5 0.0 0.2 4.9Castle Point 6.6 0.9 0.0 0.2 5.9Chelmsford 10.5 1.9 0.0 0.8 9.3Colchester 12.9 2.5 0.0 0.6 11.0Epping Forest 9.4 0.5 0.0 0.1 9.0Harlow 8.9 1.4 0.0 0.4 7.9Maldon 4.4 0.5 0.0 0.1 4.1Rochford 5.1 0.8 0.0 0.1 4.5Tendring 14.2 1.6 0.0 0.5 13.1Uttlesford 4.1 0.2 0.0 0.1 4.0
GLOUCESTERSHIRECheltenham 8.8 1.4 0.0 0.6 8.1Cotswold 5.4 0.1 0.0 0.2 5.4Forest of Dean 6.8 0.6 0.0 0.2 6.4Gloucester 10.9 1.2 0.0 0.5 10.2Stroud 7.2 0.8 0.0 0.2 6.6Tewkesbury 5.3 0.6 0.0 0.1 4.9
HAMPSHIREBasingstoke and Deane 10.1 2.3 0.0 0.4 8.2East Hampshire 6.2 0.5 0.0 0.1 5.8Eastleigh 7.8 1.1 0.0 0.3 7.0Fareham 6.2 1.5 0.0 0.7 5.5Gosport 7.3 1.2 0.0 0.2 6.3Hart 3.9 0.2 0.0 0.1 3.8Havant 9.9 1.2 0.0 0.3 9.0New Forest 11.6 1.0 0.0 0.5 11.2Rushmoor 7.0 0.8 0.0 0.4 6.6Test Valley 7.1 1.0 0.0 0.3 6.4Winchester 7.0 0.9 0.0 0.3 6.4
HERTFORDSHIREBroxbourne 7.0 1.1 0.0 0.4 6.2Dacorum 9.7 1.8 0.0 0.3 8.2East Hertfordshire 8.2 0.9 0.0 0.3 7.5Hertsmere 7.9 0.6 0.0 0.2 7.5North Hertfordshire 8.1 1.0 0.0 0.3 7.3St Albans 7.7 0.3 0.0 0.7 8.1Stevenage 7.9 1.6 0.0 0.4 6.6Three Rivers 5.7 0.8 0.0 0.1 5.0Watford 8.1 1.2 0.0 0.6 7.4Welwyn Hatfield 7.9 1.0 0.0 0.3 7.1
Formula Grant After Floor Damping
(£ million) (%) (£ million) (%)
Option CONCF9 Option CONCF10Difference from Base Position
-1.0 -6.8% -1.0 -6.8%-0.7 -7.3% -0.7 -7.3%-0.4 -7.3% -0.4 -7.3%-0.3 -5.8% -0.3 -5.8%-0.7 -7.8% -0.7 -7.8%-0.5 -4.6% -0.5 -4.6%-0.5 -5.1% -0.5 -5.1%-0.7 -8.6% -0.7 -8.6%-0.3 -8.0% -0.3 -8.0%-0.2 -5.5% -0.2 -5.5%-1.1 -8.2% -1.1 -8.2%-0.2 -6.0% -0.2 -6.0%
-0.8 -9.6% -0.8 -9.6%-0.5 -9.0% -0.5 -9.0%-0.5 -8.1% -0.5 -8.1%-0.8 -8.3% -0.8 -8.3%-0.6 -8.6% -0.6 -8.6%-0.4 -7.4% -0.4 -7.4%
-0.2 -2.3% -0.2 -2.3%-0.3 -5.6% -0.3 -5.6%-0.4 -5.9% -0.4 -5.9%-0.7 -11.8% -0.7 -11.8%-0.3 -4.2% -0.3 -4.2%-0.2 -6.0% -0.2 -6.0%-0.6 -6.6% -0.6 -6.6%-1.0 -9.3% -1.0 -9.3%-0.6 -9.6% -0.6 -9.6%-0.5 -7.2% -0.5 -7.2%-0.5 -8.1% -0.5 -8.1%
-0.5 -7.7% -0.5 -7.7%-0.4 -5.2% -0.4 -5.2%-0.6 -7.6% -0.6 -7.6%-0.5 -6.9% -0.5 -6.9%-0.5 -7.2% -0.5 -7.2%-0.9 -11.8% -0.9 -11.8%-0.3 -4.6% -0.3 -4.6%-0.3 -6.6% -0.3 -6.6%-0.9 -11.8% -0.9 -11.8%-0.4 -6.3% -0.4 -6.3%
329

(£ million) (£ million) (£ million) (£ million) (£ million)
Base Position = 2010-11 Agreed Position - 2008-09 Concessionary Travel NRE + 2008-09 Aggregated Concessionary Travel NRE + Aggregated 2010-11 Concessionary Travel Special Grant
2010-11 Indicative
Allocations
2008-09 Concess-
ionary Travel NRE
Aggreg-ated 2008-
09 Concess-
ionary Travel NRE
Aggreg-ated 2010-
11 Concess-
ionary Travel Special Grant
Base Position
KENTAshford 8.3 0.8 0.0 0.2 7.7Canterbury 13.2 2.4 0.0 0.8 11.7Dartford 7.5 0.9 0.0 0.4 7.0Dover 10.2 1.3 0.0 0.3 9.3Gravesham 8.4 1.3 0.0 0.4 7.6Maidstone 9.5 2.0 0.0 0.5 8.0Sevenoaks 6.3 0.7 0.0 0.1 5.8Shepway 10.0 1.5 0.0 0.4 8.9Swale 12.1 0.9 0.0 0.1 11.4Thanet 13.3 1.6 0.0 0.8 12.5Tonbridge and Malling 6.5 0.8 0.0 0.1 5.9Tunbridge Wells 7.0 1.3 0.0 0.4 6.2
LANCASHIREBurnley 11.9 1.5 0.0 0.5 10.9Chorley 8.5 1.2 0.0 0.7 8.0Fylde 5.9 1.1 0.0 0.7 5.4Hyndburn 10.2 1.1 0.0 0.3 9.4Lancaster 16.4 2.3 0.0 1.2 15.3Pendle 11.1 0.8 0.0 0.1 10.5Preston 16.0 4.1 0.0 1.9 13.8Ribble Valley 4.1 0.5 0.0 0.2 3.8Rossendale 6.3 0.9 0.0 0.2 5.6South Ribble 7.5 1.0 0.0 0.1 6.7West Lancashire 9.6 1.1 0.0 0.3 8.8Wyre 10.4 1.6 0.0 0.4 9.2
LEICESTERSHIREBlaby 6.4 0.5 0.0 0.3 6.2Charnwood 12.5 1.3 0.0 0.6 11.8Harborough 5.4 0.2 0.0 0.1 5.3Hinckley and Bosworth 7.4 0.7 0.0 0.4 7.1Melton 3.9 0.2 0.0 0.1 3.8North West Leicestershire 7.1 0.5 0.0 0.2 6.8Oadby and Wigston 4.6 0.4 0.0 0.3 4.5
LINCOLNSHIREBoston 7.3 0.3 0.0 0.2 7.1East Lindsey 17.4 1.0 0.0 1.0 17.3Lincoln 10.6 1.3 0.0 0.8 10.1North Kesteven 8.8 0.6 0.0 0.2 8.3South Holland 9.0 0.4 0.0 0.2 8.8South Kesteven 10.1 0.5 0.0 0.4 10.1West Lindsey 8.2 0.5 0.0 0.1 7.8
NORFOLKBreckland 11.3 0.3 0.0 0.1 11.2Broadland 8.5 0.7 0.0 0.1 7.9Great Yarmouth 10.8 1.0 0.0 1.0 10.8King's Lynn and West Norfolk 15.4 0.8 0.0 0.5 15.1North Norfolk 9.0 0.3 0.0 0.2 9.0Norwich 15.9 2.8 0.0 2.3 15.5South Norfolk 8.4 1.2 0.0 0.4 7.7
Formula Grant After Floor Damping
(£ million) (%) (£ million) (%)
Option CONCF9 Option CONCF10Difference from Base Position
-0.5 -7.1% -0.5 -7.1%-0.8 -6.9% -0.8 -6.9%-0.6 -8.2% -0.6 -8.2%-0.7 -7.7% -0.7 -7.7%-0.5 -7.0% -0.5 -7.0%-0.6 -7.6% -0.6 -7.6%-0.3 -5.7% -0.3 -5.7%-0.6 -6.6% -0.6 -6.6%-0.6 -5.7% -0.6 -5.7%-1.3 -10.5% -1.3 -10.5%-0.3 -5.8% -0.3 -5.8%-0.7 -10.9% -0.7 -10.9%
-0.8 -7.6% -0.8 -7.6%-0.9 -11.6% -0.9 -11.6%-0.7 -12.9% -0.7 -12.9%-0.7 -7.1% -0.7 -7.1%-1.4 -9.3% -1.4 -9.3%-0.6 -5.5% -0.6 -5.5%-1.4 -10.3% -1.4 -10.3%-0.3 -8.8% -0.3 -8.8%-0.4 -7.7% -0.4 -7.7%-0.3 -4.7% -0.3 -4.7%-0.7 -7.6% -0.7 -7.6%-0.6 -6.6% -0.6 -6.6%
-0.5 -8.6% -0.5 -8.6%-0.9 -7.6% -0.9 -7.6%-0.4 -7.6% -0.4 -7.6%-0.7 -10.2% -0.7 -10.2%-0.3 -7.8% -0.3 -7.8%-0.6 -8.1% -0.6 -8.1%-0.4 -8.8% -0.4 -8.8%
-0.6 -8.7% -0.6 -8.7%-2.0 -11.4% -2.0 -11.4%-1.1 -10.8% -1.1 -10.8%-0.6 -7.6% -0.6 -7.6%-0.7 -8.4% -0.7 -8.4%-0.9 -8.5% -0.9 -8.5%-0.5 -6.4% -0.5 -6.4%
-0.7 -6.7% -0.7 -6.7%-0.5 -6.9% -0.5 -6.9%-1.5 -13.9% -1.5 -13.9%-1.4 -9.0% -1.4 -9.0%-0.7 -7.6% -0.7 -7.6%-2.3 -15.0% -2.3 -15.0%-0.7 -9.7% -0.7 -9.7%
330

(£ million) (£ million) (£ million) (£ million) (£ million)
Base Position = 2010-11 Agreed Position - 2008-09 Concessionary Travel NRE + 2008-09 Aggregated Concessionary Travel NRE + Aggregated 2010-11 Concessionary Travel Special Grant
2010-11 Indicative
Allocations
2008-09 Concess-
ionary Travel NRE
Aggreg-ated 2008-
09 Concess-
ionary Travel NRE
Aggreg-ated 2010-
11 Concess-
ionary Travel Special Grant
Base Position
NORTH YORKSHIRECraven 4.2 0.4 0.0 0.3 4.1Hambleton 5.8 0.2 0.0 0.3 5.8Harrogate 11.3 1.5 0.0 1.5 11.3Richmondshire 4.3 0.2 0.0 0.2 4.3Ryedale 4.5 0.3 0.0 0.2 4.5Scarborough 12.5 2.0 0.0 1.2 11.7Selby 6.8 0.5 0.0 0.2 6.4
NORTHAMPTONSHIRECorby 5.7 0.5 0.0 0.3 5.5Daventry 6.2 0.4 0.0 0.2 6.0East Northamptonshire 6.7 0.3 0.0 0.3 6.6Kettering 7.3 1.0 0.0 0.6 6.9Northampton 18.9 2.0 0.0 0.7 17.6South Northamptonshire 5.8 0.2 0.0 0.1 5.7Wellingborough 7.0 0.6 0.0 0.3 6.7
NOTTINGHAMSHIREAshfield 11.5 1.3 0.0 0.4 10.6Bassetlaw 11.3 1.2 0.0 0.3 10.4Broxtowe 8.9 0.9 0.0 0.3 8.3Gedling 9.3 1.2 0.0 0.3 8.4Mansfield 10.4 1.3 0.0 0.7 9.7Newark and Sherwood 10.3 1.0 0.0 0.3 9.7Rushcliffe 7.2 0.6 0.0 0.2 6.8
OXFORDSHIRECherwell 10.9 0.9 0.0 0.2 10.2Oxford 16.8 3.2 0.0 3.1 16.7South Oxfordshire 7.9 0.6 0.0 0.2 7.5Vale of White Horse 7.1 0.7 0.0 0.5 6.9West Oxfordshire 6.1 0.7 0.0 0.1 5.5
SOMERSETMendip 8.4 1.0 0.0 0.3 7.8Sedgemoor 10.1 0.9 0.0 0.4 9.5South Somerset 11.1 1.6 0.0 0.4 9.9Taunton Deane 8.7 1.5 0.0 0.4 7.6West Somerset 3.3 0.1 0.0 0.1 3.4
STAFFORDSHIRECannock Chase 8.5 1.1 0.0 0.3 7.8East Staffordshire 9.5 1.4 0.0 0.4 8.6Lichfield 6.1 0.5 0.0 0.2 5.8Newcastle-under-Lyme 11.1 1.4 0.0 0.4 10.1South Staffordshire 7.2 1.1 0.0 0.2 6.3Stafford 8.8 1.6 0.0 0.5 7.7Staffordshire Moorlands 7.6 0.7 0.0 0.3 7.1Tamworth 6.8 0.6 0.0 0.3 6.5
Formula Grant After Floor Damping
(£ million) (%) (£ million) (%)
Option CONCF9 Option CONCF10Difference from Base Position
-0.5 -11.5% -0.5 -11.5%-0.6 -9.6% -0.6 -9.6%-1.8 -15.9% -1.8 -15.9%-0.5 -10.6% -0.5 -10.6%-0.5 -11.4% -0.5 -11.4%-1.4 -11.7% -1.4 -11.7%-0.5 -7.6% -0.5 -7.6%
-0.5 -8.9% -0.5 -8.9%-0.6 -9.3% -0.6 -9.3%-0.7 -9.9% -0.7 -9.9%-0.7 -10.9% -0.7 -10.9%-1.2 -6.9% -1.2 -6.9%-0.5 -8.2% -0.5 -8.2%-0.6 -9.1% -0.6 -9.1%
-0.8 -7.7% -0.8 -7.7%-0.8 -7.5% -0.8 -7.5%-0.6 -7.1% -0.6 -7.1%-0.5 -6.2% -0.5 -6.2%-1.0 -10.7% -1.0 -10.7%-0.8 -7.8% -0.8 -7.8%-0.5 -7.8% -0.5 -7.8%
-0.6 -6.1% -0.6 -6.1%-2.7 -16.3% -2.7 -16.3%-0.5 -6.3% -0.5 -6.3%-0.8 -11.5% -0.8 -11.5%-0.3 -5.9% -0.3 -5.9%
-0.7 -8.6% -0.7 -8.6%-0.8 -8.9% -0.8 -8.9%-0.8 -7.7% -0.8 -7.7%-0.5 -6.6% -0.5 -6.6%-0.3 -7.7% -0.3 -7.7%
-0.6 -7.3% -0.6 -7.3%-0.6 -6.7% -0.6 -6.7%-0.5 -8.0% -0.5 -8.0%-0.7 -6.9% -0.7 -6.9%-0.3 -5.5% -0.3 -5.5%-0.6 -8.1% -0.6 -8.1%-0.5 -7.6% -0.5 -7.6%-0.6 -8.7% -0.6 -8.7%
331

(£ million) (£ million) (£ million) (£ million) (£ million)
Base Position = 2010-11 Agreed Position - 2008-09 Concessionary Travel NRE + 2008-09 Aggregated Concessionary Travel NRE + Aggregated 2010-11 Concessionary Travel Special Grant
2010-11 Indicative
Allocations
2008-09 Concess-
ionary Travel NRE
Aggreg-ated 2008-
09 Concess-
ionary Travel NRE
Aggreg-ated 2010-
11 Concess-
ionary Travel Special Grant
Base Position
SUFFOLKBabergh 6.2 0.8 0.0 0.1 5.5Forest Heath 5.6 0.4 0.0 0.1 5.3Ipswich 11.9 2.9 0.0 0.6 9.6Mid Suffolk 6.3 0.7 0.0 0.1 5.7St Edmundsbury 7.1 0.9 0.0 0.2 6.3Suffolk Coastal 8.3 1.1 0.0 0.1 7.2Waveney 11.7 1.5 0.0 0.6 10.8
SURREYElmbridge 6.5 0.2 0.0 0.1 6.4Epsom and Ewell 4.2 0.2 0.0 0.1 4.0Guildford 8.5 1.2 0.0 0.9 8.1Mole Valley 4.0 0.3 0.0 0.1 3.8Reigate and Banstead 6.9 0.7 0.0 0.3 6.5Runnymede 5.6 0.3 0.0 0.1 5.4Spelthorne 5.7 0.4 0.0 0.1 5.4Surrey Heath 4.8 0.6 0.0 0.5 4.7Tandridge 4.2 0.3 0.0 0.1 4.0Waverley 6.1 0.6 0.0 0.3 5.7Woking 6.6 0.7 0.0 0.3 6.3
WARWICKSHIRENorth Warwickshire 5.4 0.4 0.0 0.1 5.2Nuneaton and Bedworth 11.4 1.6 0.0 0.4 10.2Rugby 7.0 0.9 0.0 0.2 6.4Stratford-on-Avon 7.0 0.7 0.0 0.5 6.8Warwick 10.5 1.4 0.0 0.4 9.4
WEST SUSSEXAdur 5.0 0.7 0.0 0.1 4.4Arun 10.3 1.6 0.0 0.6 9.3Chichester 7.2 1.2 0.0 0.7 6.7Crawley 10.5 1.7 0.0 0.3 9.1Horsham 6.2 0.9 0.0 0.5 5.8Mid Sussex 6.5 0.7 0.0 0.3 6.1Worthing 7.9 1.8 0.0 1.0 7.2
WORCESTERSHIREBromsgrove 5.0 0.5 0.0 0.3 4.8Malvern Hills 5.2 0.3 0.0 0.2 5.1Redditch 6.5 1.2 0.0 0.2 5.5Worcester 8.2 1.7 0.0 0.5 7.1Wychavon 7.8 0.6 0.0 0.3 7.5Wyre Forest 8.1 0.7 0.0 0.3 7.7
Formula Grant After Floor Damping
(£ million) (%) (£ million) (%)
Option CONCF9 Option CONCF10Difference from Base Position
-0.3 -5.4% -0.3 -5.4%-0.3 -5.8% -0.3 -5.8%-0.3 -2.6% -0.3 -2.6%-0.4 -6.5% -0.4 -6.5%-0.4 -6.6% -0.4 -6.6%-0.4 -5.7% -0.4 -5.7%-0.9 -8.4% -0.9 -8.4%
-0.4 -6.4% -0.4 -6.4%-0.2 -6.2% -0.2 -6.2%-1.0 -12.6% -1.0 -12.6%-0.2 -6.4% -0.2 -6.4%-0.5 -8.0% -0.5 -8.0%-0.4 -6.7% -0.4 -6.7%-0.3 -5.9% -0.3 -5.9%-0.7 -14.0% -0.7 -14.0%-0.2 -5.5% -0.2 -5.5%-0.5 -8.7% -0.5 -8.7%-0.6 -9.3% -0.6 -9.3%
-0.3 -6.5% -0.3 -6.5%-0.6 -5.8% -0.6 -5.8%-0.5 -7.4% -0.5 -7.4%-0.7 -10.6% -0.7 -10.6%-0.6 -6.1% -0.6 -6.1%
-0.2 -4.0% -0.2 -4.0%-0.9 -9.1% -0.9 -9.1%-1.0 -14.5% -1.0 -14.5%-0.3 -3.3% -0.3 -3.3%-0.7 -12.6% -0.7 -12.6%-0.5 -8.6% -0.5 -8.6%-0.9 -12.6% -0.9 -12.6%
-0.5 -10.7% -0.5 -10.7%-0.4 -8.4% -0.4 -8.4%-0.2 -4.5% -0.2 -4.5%-0.6 -8.0% -0.6 -8.0%-0.8 -10.7% -0.8 -10.7%-0.6 -8.4% -0.6 -8.4%
332

(£ million) (£ million) (£ million) (£ million) (£ million)
Base Position = 2010-11 Agreed Position - 2008-09 Concessionary Travel NRE + 2008-09 Aggregated Concessionary Travel NRE + Aggregated 2010-11 Concessionary Travel Special Grant
2010-11 Indicative
Allocations
2008-09 Concess-
ionary Travel NRE
Aggreg-ated 2008-
09 Concess-
ionary Travel NRE
Aggreg-ated 2010-
11 Concess-
ionary Travel Special Grant
Base Position
SHIRE POLICE AUTHORITIES
Avon & Somerset Police 186.1 0.0 0.0 0.0 186.1Bedfordshire Police 73.1 0.0 0.0 0.0 73.1Cambridgeshire Police 83.5 0.0 0.0 0.0 83.5Cheshire Police 123.5 0.0 0.0 0.0 123.5Cleveland Police 100.1 0.0 0.0 0.0 100.1
Cumbria Police 68.9 0.0 0.0 0.0 68.9Derbyshire Police 116.2 0.0 0.0 0.0 116.2Devon & Cornwall Police 191.2 0.0 0.0 0.0 191.2Dorset Police 66.9 0.0 0.0 0.0 66.9Durham Police 93.7 0.0 0.0 0.0 93.7
Essex Police 183.0 0.0 0.0 0.0 183.0Gloucestershire Police 60.8 0.0 0.0 0.0 60.8Hampshire Police 213.0 0.0 0.0 0.0 213.0Hertfordshire Police 124.8 0.0 0.0 0.0 124.8Humberside Police 131.8 0.0 0.0 0.0 131.8
Kent Police 197.4 0.0 0.0 0.0 197.4Lancashire Police 209.7 0.0 0.0 0.0 209.7Leicestershire Police 121.4 0.0 0.0 0.0 121.4Lincolnshire Police 66.3 0.0 0.0 0.0 66.3Norfolk Police 89.8 0.0 0.0 0.0 89.8
North Yorkshire Police 78.6 0.0 0.0 0.0 78.6Northamptonshire Police 77.5 0.0 0.0 0.0 77.5Nottinghamshire Police 146.0 0.0 0.0 0.0 146.0Staffordshire Police 123.8 0.0 0.0 0.0 123.8Suffolk Police 72.7 0.0 0.0 0.0 72.7
Surrey Police 104.4 0.0 0.0 0.0 104.4Sussex Police 174.1 0.0 0.0 0.0 174.1Thames Valley Police 244.7 0.0 0.0 0.0 244.7Warwickshire Police 55.6 0.0 0.0 0.0 55.6West Mercia Police 124.9 0.0 0.0 0.0 124.9
Wiltshire Police 66.8 0.0 0.0 0.0 66.8
Formula Grant After Floor Damping
(£ million) (%) (£ million) (%)
Option CONCF9 Option CONCF10Difference from Base Position
0.0 0.0% 0.0 0.0%0.0 0.0% 0.0 0.0%0.0 0.1% 0.0 0.1%0.0 0.0% 0.0 0.0%0.0 0.0% 0.0 0.0%
0.0 0.0% 0.0 0.0%0.1 0.1% 0.1 0.1%0.1 0.1% 0.1 0.1%0.0 0.0% 0.0 0.0%0.0 0.0% 0.0 0.0%
0.1 0.0% 0.1 0.0%0.0 0.0% 0.0 0.0%0.1 0.0% 0.1 0.0%0.0 0.0% 0.0 0.0%0.1 0.0% 0.1 0.0%
0.0 0.0% 0.0 0.0%0.1 0.0% 0.1 0.0%0.1 0.0% 0.1 0.0%0.1 0.1% 0.1 0.1%0.0 0.0% 0.0 0.0%
0.0 0.0% 0.0 0.0%0.0 0.1% 0.0 0.1%0.0 0.0% 0.0 0.0%0.1 0.1% 0.1 0.1%0.0 0.0% 0.0 0.0%
0.0 0.0% 0.0 0.0%0.0 0.0% 0.0 0.0%0.0 0.0% 0.0 0.0%0.0 0.1% 0.0 0.1%0.0 0.0% 0.0 0.0%
0.0 0.0% 0.0 0.0%
333

(£ million) (£ million) (£ million) (£ million) (£ million)
Base Position = 2010-11 Agreed Position - 2008-09 Concessionary Travel NRE + 2008-09 Aggregated Concessionary Travel NRE + Aggregated 2010-11 Concessionary Travel Special Grant
2010-11 Indicative
Allocations
2008-09 Concess-
ionary Travel NRE
Aggreg-ated 2008-
09 Concess-
ionary Travel NRE
Aggreg-ated 2010-
11 Concess-
ionary Travel Special Grant
Base Position
SHIRE FIRE AUTHORITIES
Avon Fire 24.9 0.0 0.0 0.0 24.9Bedfordshire Fire 11.4 0.0 0.0 0.0 11.4Berkshire Fire Auhtority 15.4 0.0 0.0 0.0 15.4Buckinghamshire Fire 11.5 0.0 0.0 0.0 11.5Cambridgeshire Fire 14.4 0.0 0.0 0.0 14.4
Cheshire Fire 18.6 0.0 0.0 0.0 18.6Cleveland Fire 22.4 0.0 0.0 0.0 22.4Derbyshire Fire 19.7 0.0 0.0 0.0 19.7Devon and Somerset Fire 31.2 0.0 0.0 0.0 31.2Dorset Fire 11.0 0.0 0.0 0.0 11.0
Durham Fire 14.5 0.0 0.0 0.0 14.5East Sussex Fire 14.7 0.0 0.0 0.0 14.7Essex Fire Auhtority 32.4 0.0 0.0 0.0 32.4Hampshire Fire 29.3 0.0 0.0 0.0 29.3Hereford & Worcester Fire 10.7 0.0 0.0 0.0 10.7
Humberside Fire 27.2 0.0 0.0 0.0 27.2Kent Fire 29.6 0.0 0.0 0.0 29.6Lancashire Fire 32.6 0.0 0.0 0.0 32.6Leicestershire Fire 18.8 0.0 0.0 0.0 18.8North Yorkshire Fire 13.0 0.0 0.0 0.0 13.0
Nottinghamshire Fire 25.0 0.0 0.0 0.0 25.0Shropshire Fire 8.3 0.0 0.0 0.0 8.3Staffordshire Fire 18.6 0.0 0.0 0.0 18.6Wiltshire Fire 9.6 0.0 0.0 0.0 9.6
Formula Grant After Floor Damping
(£ million) (%) (£ million) (%)
Option CONCF9 Option CONCF10Difference from Base Position
0.0 0.0% 0.0 0.0%0.0 0.2% 0.0 0.2%0.0 0.0% 0.0 0.0%0.0 0.0% 0.0 0.0%0.0 -0.1% 0.0 -0.1%
0.0 -0.2% 0.0 -0.2%0.0 0.0% 0.0 0.0%0.0 0.0% 0.0 0.0%0.0 0.0% 0.0 0.0%0.0 -0.1% 0.0 -0.1%
0.0 0.0% 0.0 0.0%0.0 -0.2% 0.0 -0.2%
-0.1 -0.2% -0.1 -0.2%0.0 0.1% 0.0 0.1%0.0 0.3% 0.0 0.3%
-0.1 -0.3% -0.1 -0.3%0.0 0.0% 0.0 0.0%0.1 0.3% 0.1 0.3%0.1 0.3% 0.1 0.3%0.0 0.0% 0.0 0.0%
0.0 -0.1% 0.0 -0.1%0.0 0.0% 0.0 0.0%0.0 0.3% 0.0 0.3%0.0 0.1% 0.0 0.1%
334
335
Chapter 13 The Incapacity Benefit and Severe Disablement Allowance indicator Background 1. The current EPCS formula uses an indicator of the average number of
people receiving Incapacity Benefit and Severe Disablement Allowance (IBSDA). It uses annual data from the Department for Work and Pensions (DWP) and is averaged over three years.
2. The current formulae for EPCS at both the district-level and the county-level are provided in Chapter 7.
Changes to the indicator
Inclusion of Employment and Support Allowance
3. Recent changes in the benefit system have seen the introduction of the Employment and Support Allowance (ESA). Since the 27 October 2008, ESA has been introduced to help people with an illness or disability move back into work. For new recipients, it has replaced Incapacity Benefit and Income Support paid because of an illness or disability. As a result, DWP have recommended that in future, we also include ESA data with the Incapacity Benefit and Severe Disablement Allowance data to create the IBSDA indicator. We intend to implement this change but are not able to exemplify this option because the period of data used in the indicator for the 2010-11 settlement was an average over the period 2004 and 2006 and therefore predates this change.
Quarterly based average
4. The current IBSDA indicator is an average over three years using annual data as at August each year. The data are sourced from the DWP’s Work and Pensions Longitudinal Study (WPLS).
5. Quarterly data are now available, and so we propose to use this data rather than the annual data to form the three year average. In doing so, we can use more up to date data than the annual data allows.
6. Indicators using other benefits data, such as income support, pension credit, and disability living allowance already use quarterly data rather than annual data. They also are sourced from the WPLS.
Option DATA1
7. The IBSDA indicator used in the 2008-09 to 2010-11 settlement used data for 2004 to 2006 taken at August each year. Option DATA1 uses quarterly data between May 2004 and February 2007.
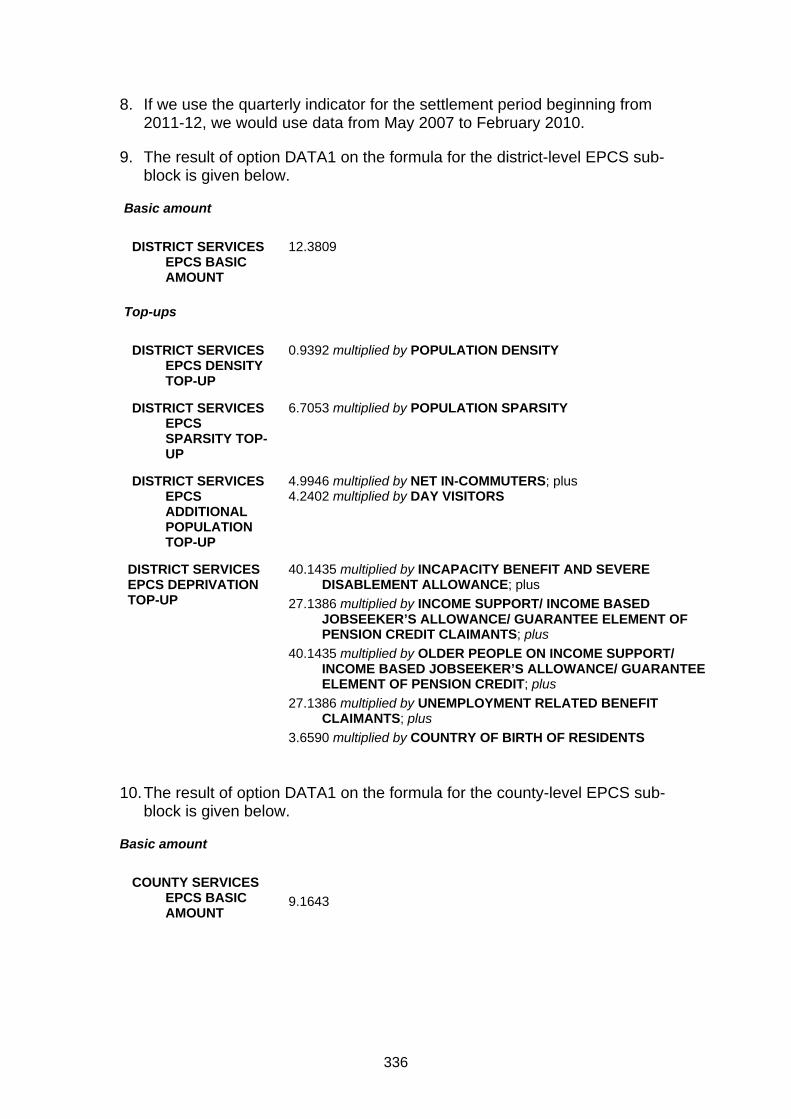
336
8. If we use the quarterly indicator for the settlement period beginning from 2011-12, we would use data from May 2007 to February 2010.
9. The result of option DATA1 on the formula for the district-level EPCS sub-block is given below.
Basic amount
DISTRICT SERVICES
EPCS BASIC AMOUNT
12.3809
Top-ups
DISTRICT SERVICES
EPCS DENSITY TOP-UP
0.9392 multiplied by POPULATION DENSITY
DISTRICT SERVICES
EPCS SPARSITY TOP-UP
6.7053 multiplied by POPULATION SPARSITY
DISTRICT SERVICES
EPCS ADDITIONAL POPULATION TOP-UP
4.9946 multiplied by NET IN-COMMUTERS; plus 4.2402 multiplied by DAY VISITORS
DISTRICT SERVICES EPCS DEPRIVATION TOP-UP
40.1435 multiplied by INCAPACITY BENEFIT AND SEVERE
DISABLEMENT ALLOWANCE; plus 27.1386 multiplied by INCOME SUPPORT/ INCOME BASED
JOBSEEKER’S ALLOWANCE/ GUARANTEE ELEMENT OF PENSION CREDIT CLAIMANTS; plus
40.1435 multiplied by OLDER PEOPLE ON INCOME SUPPORT/ INCOME BASED JOBSEEKER’S ALLOWANCE/ GUARANTEE ELEMENT OF PENSION CREDIT; plus
27.1386 multiplied by UNEMPLOYMENT RELATED BENEFIT CLAIMANTS; plus
3.6590 multiplied by COUNTRY OF BIRTH OF RESIDENTS
10. The result of option DATA1 on the formula for the county-level EPCS sub-block is given below.
Basic amount
COUNTY SERVICES
EPCS BASIC AMOUNT
9.1643
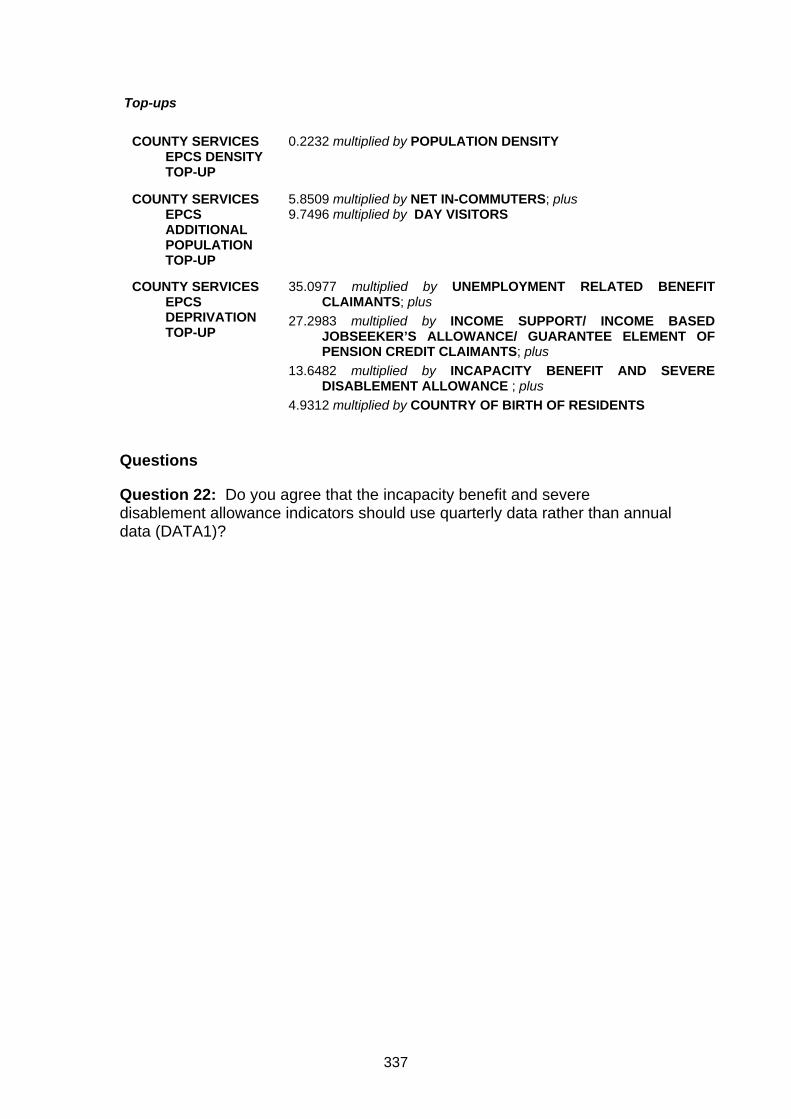
337
Top-ups
COUNTY SERVICES
EPCS DENSITY TOP-UP
0.2232 multiplied by POPULATION DENSITY
COUNTY SERVICES
EPCS ADDITIONAL POPULATION TOP-UP
5.8509 multiplied by NET IN-COMMUTERS; plus 9.7496 multiplied by DAY VISITORS
COUNTY SERVICES
EPCS DEPRIVATION TOP-UP
35.0977 multiplied by UNEMPLOYMENT RELATED BENEFIT
CLAIMANTS; plus 27.2983 multiplied by INCOME SUPPORT/ INCOME BASED
JOBSEEKER’S ALLOWANCE/ GUARANTEE ELEMENT OF PENSION CREDIT CLAIMANTS; plus
13.6482 multiplied by INCAPACITY BENEFIT AND SEVERE DISABLEMENT ALLOWANCE ; plus
4.9312 multiplied by COUNTRY OF BIRTH OF RESIDENTS
Questions
Question 22: Do you agree that the incapacity benefit and severe disablement allowance indicators should use quarterly data rather than annual data (DATA1)?
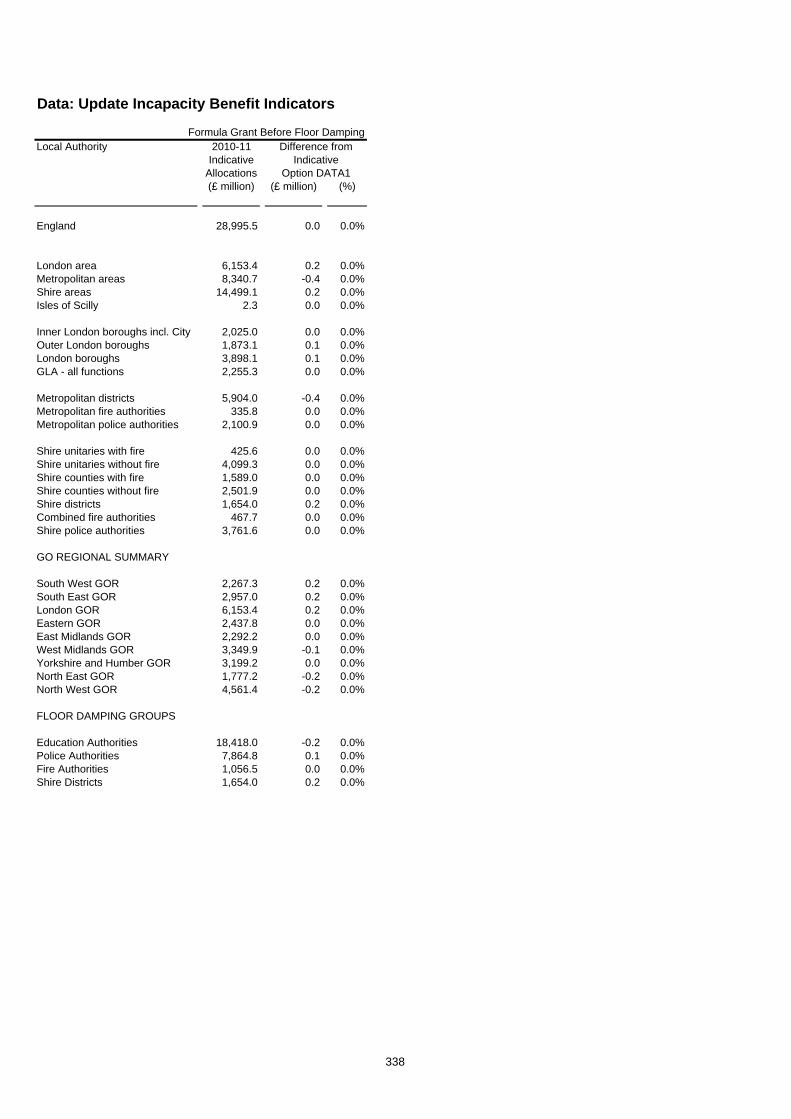
Formula Grant Before Floor DampingLocal Authority
(£ million) (£ million) (%)
England 28,995.5 0.0 0.0%
London area 6,153.4 0.2 0.0%Metropolitan areas 8,340.7 -0.4 0.0%Shire areas 14,499.1 0.2 0.0%Isles of Scilly 2.3 0.0 0.0%
Inner London boroughs incl. City 2,025.0 0.0 0.0%Outer London boroughs 1,873.1 0.1 0.0%London boroughs 3,898.1 0.1 0.0%GLA - all functions 2,255.3 0.0 0.0%
Metropolitan districts 5,904.0 -0.4 0.0%Metropolitan fire authorities 335.8 0.0 0.0%Metropolitan police authorities 2,100.9 0.0 0.0%
Shire unitaries with fire 425.6 0.0 0.0%Shire unitaries without fire 4,099.3 0.0 0.0%Shire counties with fire 1,589.0 0.0 0.0%Shire counties without fire 2,501.9 0.0 0.0%Shire districts 1,654.0 0.2 0.0%Combined fire authorities 467.7 0.0 0.0%Shire police authorities 3,761.6 0.0 0.0%
GO REGIONAL SUMMARY
South West GOR 2,267.3 0.2 0.0%South East GOR 2,957.0 0.2 0.0%London GOR 6,153.4 0.2 0.0%Eastern GOR 2,437.8 0.0 0.0%East Midlands GOR 2,292.2 0.0 0.0%West Midlands GOR 3,349.9 -0.1 0.0%Yorkshire and Humber GOR 3,199.2 0.0 0.0%North East GOR 1,777.2 -0.2 0.0%North West GOR 4,561.4 -0.2 0.0%
FLOOR DAMPING GROUPS
Education Authorities 18,418.0 -0.2 0.0%Police Authorities 7,864.8 0.1 0.0%Fire Authorities 1,056.5 0.0 0.0%Shire Districts 1,654.0 0.2 0.0%
Data: Update Incapacity Benefit Indicators
Difference from Indicative
2010-11 Indicative
Allocations Option DATA1
338

Formula Grant Before Floor DampingLocal Authority
(£ million) (£ million) (%)
Difference from Indicative
2010-11 Indicative
Allocations Option DATA1
GREATER LONDON
City of London 91.1 0.0 0.0%
Camden 171.0 0.0 0.0%Greenwich 170.1 0.0 0.0%Hackney 201.8 0.0 0.0%Hammersmith and Fulham 94.3 0.0 0.0%Islington 133.8 0.0 0.0%Kensington and Chelsea 95.9 0.0 0.0%
Lambeth 180.3 0.0 0.0%Lewisham 174.9 0.0 0.0%Southwark 210.2 0.0 0.0%Tower Hamlets 224.3 0.0 0.0%Wandsworth 98.6 0.0 0.0%Westminster 178.8 0.0 0.0%
Barking and Dagenham 108.2 0.0 0.0%Barnet 97.9 0.0 0.0%Bexley 64.5 0.0 0.0%Brent 157.0 0.0 0.0%Bromley 45.7 0.0 0.0%
Croydon 118.4 0.0 0.0%Ealing 129.0 0.0 0.0%Enfield 126.7 0.0 0.0%Haringey 137.6 0.0 0.0%Harrow 66.6 0.0 0.0%
Havering 52.3 0.0 0.0%Hillingdon 85.6 0.0 0.0%Hounslow 77.3 0.0 0.0%Kingston upon Thames 32.6 0.0 0.0%Merton 61.2 0.0 0.0%
Newham 231.3 0.0 0.0%Redbridge 102.6 0.0 0.0%Richmond upon Thames 9.6 0.0 0.0%Sutton 45.1 0.0 0.0%Waltham Forest 124.0 0.0 0.0%
GLA - all functions 2,255.3 0.0 0.0%
GLA - police 2,002.3 0.0 0.0%GLA - fire 253.0 0.0 0.0%
339
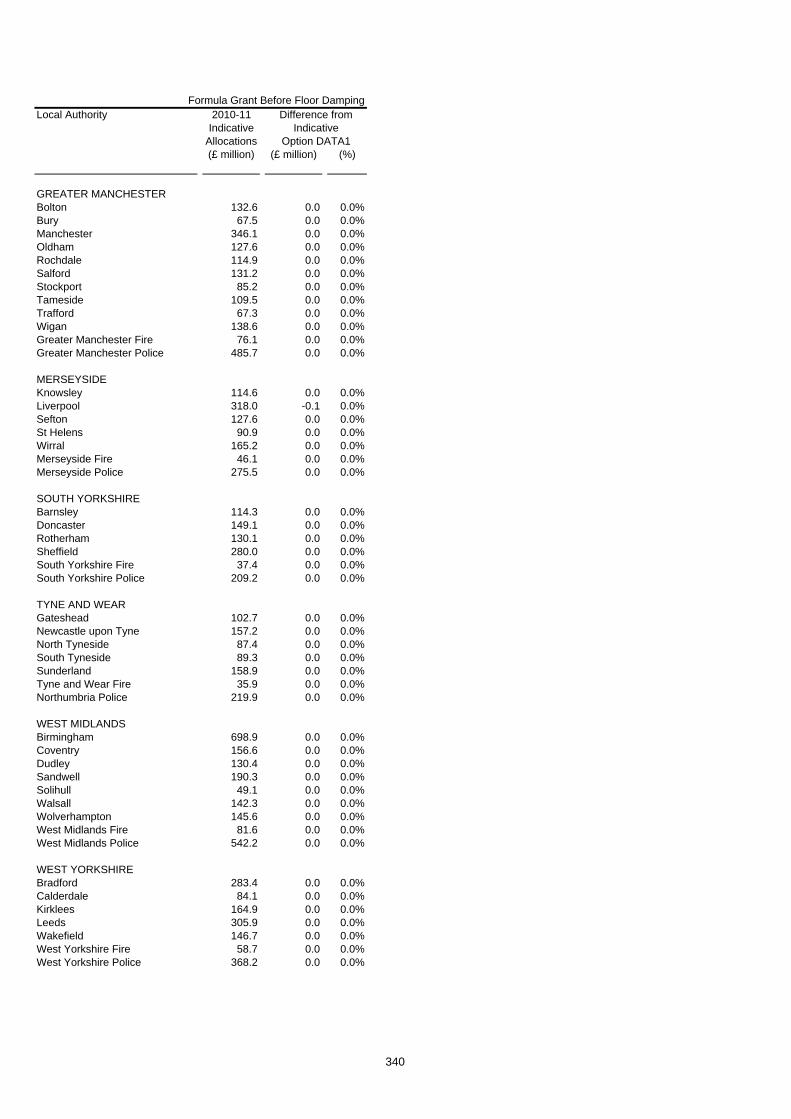
Formula Grant Before Floor DampingLocal Authority
(£ million) (£ million) (%)
Difference from Indicative
2010-11 Indicative
Allocations Option DATA1
GREATER MANCHESTERBolton 132.6 0.0 0.0%Bury 67.5 0.0 0.0%Manchester 346.1 0.0 0.0%Oldham 127.6 0.0 0.0%Rochdale 114.9 0.0 0.0%Salford 131.2 0.0 0.0%Stockport 85.2 0.0 0.0%Tameside 109.5 0.0 0.0%Trafford 67.3 0.0 0.0%Wigan 138.6 0.0 0.0%Greater Manchester Fire 76.1 0.0 0.0%Greater Manchester Police 485.7 0.0 0.0%
MERSEYSIDEKnowsley 114.6 0.0 0.0%Liverpool 318.0 -0.1 0.0%Sefton 127.6 0.0 0.0%St Helens 90.9 0.0 0.0%Wirral 165.2 0.0 0.0%Merseyside Fire 46.1 0.0 0.0%Merseyside Police 275.5 0.0 0.0%
SOUTH YORKSHIREBarnsley 114.3 0.0 0.0%Doncaster 149.1 0.0 0.0%Rotherham 130.1 0.0 0.0%Sheffield 280.0 0.0 0.0%South Yorkshire Fire 37.4 0.0 0.0%South Yorkshire Police 209.2 0.0 0.0%
TYNE AND WEARGateshead 102.7 0.0 0.0%Newcastle upon Tyne 157.2 0.0 0.0%North Tyneside 87.4 0.0 0.0%South Tyneside 89.3 0.0 0.0%Sunderland 158.9 0.0 0.0%Tyne and Wear Fire 35.9 0.0 0.0%Northumbria Police 219.9 0.0 0.0%
WEST MIDLANDSBirmingham 698.9 0.0 0.0%Coventry 156.6 0.0 0.0%Dudley 130.4 0.0 0.0%Sandwell 190.3 0.0 0.0%Solihull 49.1 0.0 0.0%Walsall 142.3 0.0 0.0%Wolverhampton 145.6 0.0 0.0%West Midlands Fire 81.6 0.0 0.0%West Midlands Police 542.2 0.0 0.0%
WEST YORKSHIREBradford 283.4 0.0 0.0%Calderdale 84.1 0.0 0.0%Kirklees 164.9 0.0 0.0%Leeds 305.9 0.0 0.0%Wakefield 146.7 0.0 0.0%West Yorkshire Fire 58.7 0.0 0.0%West Yorkshire Police 368.2 0.0 0.0%
340

Formula Grant Before Floor DampingLocal Authority
(£ million) (£ million) (%)
Difference from Indicative
2010-11 Indicative
Allocations Option DATA1
ALL PURPOSE AUTHORITIES
Bath & North East Somerset 44.1 0.0 0.0%Bedford 55.4 0.0 0.0%Blackburn with Darwen 88.5 0.0 0.0%Blackpool 86.9 0.0 0.0%Bournemouth 49.4 0.0 0.0%
Bracknell Forest 22.6 0.0 0.0%Brighton & Hove 89.8 0.0 0.0%Bristol 171.2 0.0 0.0%Central Bedfordshire 51.9 0.0 0.0%Cheshire East 64.5 0.0 0.0%
Cheshire West & Chester 94.9 0.0 0.0%Cornwall 227.6 0.0 0.0%Darlington 40.1 0.0 0.0%Derby 114.5 0.0 0.0%Durham 238.7 0.0 0.0%
East Riding of Yorkshire 109.2 0.0 0.0%Halton 65.5 0.0 0.0%Hartlepool 54.0 0.0 0.0%Herefordshire 61.2 0.0 0.0%Isle of Wight Council 65.0 0.0 0.0%
Kingston upon Hull 159.2 0.0 0.0%Leicester 188.4 0.0 0.0%Luton 94.6 0.0 0.0%Medway 89.5 0.0 0.0%Middlesbrough 85.4 0.0 0.0%
Milton Keynes 91.6 0.0 0.0%North East Lincolnshire 76.9 0.0 0.0%North Lincolnshire 66.3 0.0 0.0%North Somerset 54.6 0.0 0.0%Northumberland 133.1 0.0 0.0%
Nottingham 179.5 0.0 0.0%Peterborough 80.9 0.0 0.0%Plymouth 108.7 0.0 0.0%Poole 25.6 0.0 0.0%Portsmouth 87.8 0.0 0.0%
Reading 48.0 0.0 0.0%Redcar and Cleveland 71.4 0.0 0.0%Rutland 8.6 0.0 0.0%Shropshire 97.4 0.0 0.0%Slough 52.8 0.0 0.0%
South Gloucestershire 64.0 0.0 0.0%Southampton 101.2 0.0 0.0%Southend-on-Sea 62.3 0.0 0.0%Stockton-on-Tees 80.6 0.0 0.0%Stoke-on-Trent 133.5 0.0 0.0%
Swindon 43.7 0.0 0.0%Telford and the Wrekin 76.0 0.0 0.0%Thurrock 62.1 0.0 0.0%Torbay 64.2 0.0 0.0%Warrington 52.7 0.0 0.0%
341
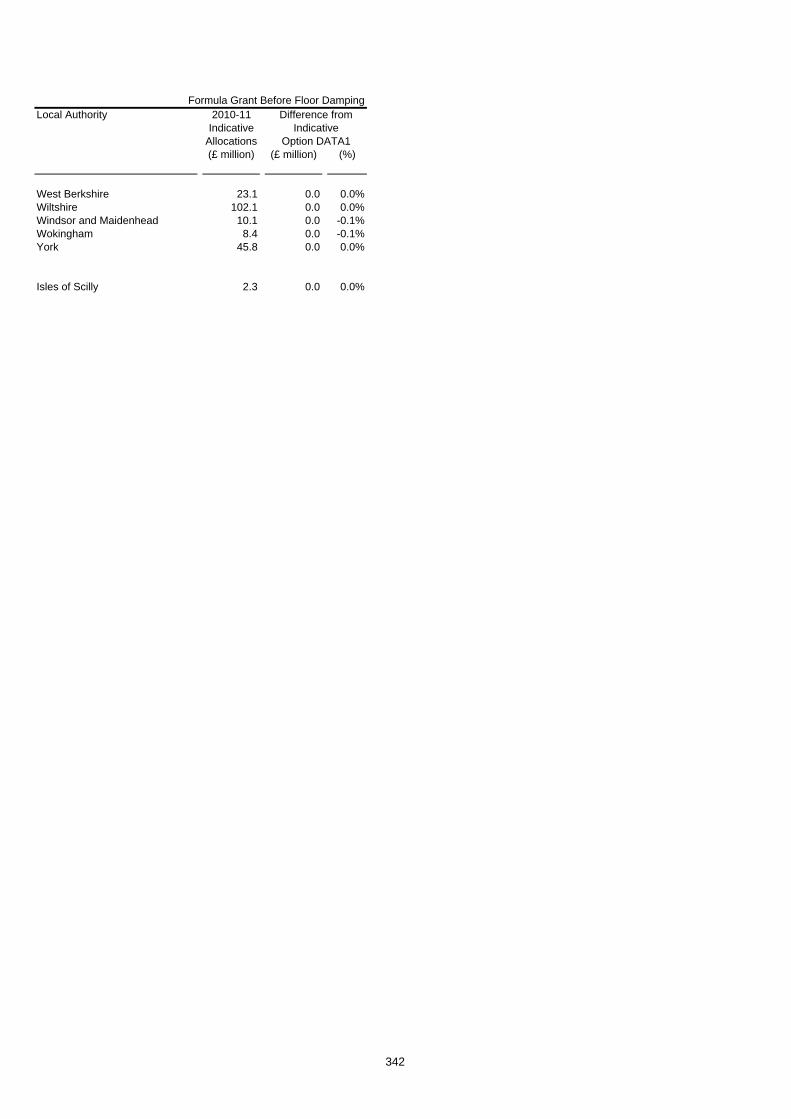
Formula Grant Before Floor DampingLocal Authority
(£ million) (£ million) (%)
Difference from Indicative
2010-11 Indicative
Allocations Option DATA1
West Berkshire 23.1 0.0 0.0%Wiltshire 102.1 0.0 0.0%Windsor and Maidenhead 10.1 0.0 -0.1%Wokingham 8.4 0.0 -0.1%York 45.8 0.0 0.0%
Isles of Scilly 2.3 0.0 0.0%
342

Formula Grant Before Floor DampingLocal Authority
(£ million) (£ million) (%)
Difference from Indicative
2010-11 Indicative
Allocations Option DATA1
SHIRE COUNTIES
Buckinghamshire 43.5 0.0 0.0%Cambridgeshire 113.1 0.0 0.0%Cumbria 157.5 0.0 0.0%Derbyshire 204.0 0.0 0.0%Devon 176.4 0.0 0.0%
Dorset 57.6 0.0 0.0%East Sussex 105.4 0.0 0.0%Essex 258.3 0.0 0.0%Gloucestershire 124.0 0.0 0.0%Hampshire 126.6 0.0 0.0%
Hertfordshire 148.3 0.0 0.0%Kent 287.9 0.0 0.0%Lancashire 328.9 0.0 0.0%Leicestershire 107.5 0.0 0.0%Lincolnshire 210.6 0.0 0.0%
Norfolk 260.4 0.0 0.0%North Yorkshire 113.7 0.0 0.0%Northamptonshire 162.2 0.0 0.0%Nottinghamshire 191.6 0.0 0.0%Oxfordshire 99.8 0.0 0.0%
Somerset 120.7 0.0 0.0%Staffordshire 169.7 0.0 0.0%Suffolk 181.0 0.0 0.0%Surrey 60.1 0.0 0.0%Warwickshire 96.6 0.0 0.0%
West Sussex 88.4 0.0 0.0%Worcestershire 96.9 0.0 0.0%
343

Formula Grant Before Floor DampingLocal Authority
(£ million) (£ million) (%)
Difference from Indicative
2010-11 Indicative
Allocations Option DATA1
BUCKINGHAMSHIREAylesbury Vale 12.1 0.0 0.0%Chiltern 3.2 0.0 0.0%South Bucks 2.3 0.0 -0.1%Wycombe 9.5 0.0 0.0%
CAMBRIDGESHIRECambridge 12.0 0.0 0.0%East Cambridgeshire 6.8 0.0 0.0%Fenland 9.9 0.0 0.1%Huntingdonshire 13.4 0.0 0.0%South Cambridgeshire 7.9 0.0 0.0%
CUMBRIAAllerdale 10.4 0.0 -0.1%Barrow-in-Furness 9.1 0.0 0.0%Carlisle 10.2 0.0 0.0%Copeland 7.2 0.0 -0.1%Eden 4.7 0.0 0.0%South Lakeland 6.8 0.0 0.0%
DERBYSHIREAmber Valley 10.0 0.0 0.0%Bolsover 8.0 0.0 0.0%Chesterfield 10.2 0.0 0.0%Derbyshire Dales 4.7 0.0 0.0%Erewash 9.7 0.0 0.0%High Peak 7.2 0.0 0.0%North East Derbyshire 7.9 0.0 0.0%South Derbyshire 7.5 0.0 0.0%
DEVONEast Devon 8.4 0.0 0.0%Exeter 12.1 0.0 0.0%Mid Devon 6.3 0.0 0.0%North Devon 8.5 0.0 0.0%South Hams 5.6 0.0 0.1%Teignbridge 10.1 0.0 0.0%Torridge 6.6 0.0 0.0%West Devon 4.4 0.0 -0.1%
DORSETChristchurch 2.9 0.0 0.0%East Dorset 3.8 0.0 0.0%North Dorset 4.7 0.0 0.1%Purbeck 3.3 0.0 0.0%West Dorset 7.9 0.0 0.0%Weymouth and Portland 6.1 0.0 0.0%
EAST SUSSEXEastbourne 10.5 0.0 0.0%Hastings 10.6 0.0 0.0%Lewes 6.6 0.0 0.0%Rother 6.5 0.0 0.0%Wealden 8.4 0.0 0.0%
344

Formula Grant Before Floor DampingLocal Authority
(£ million) (£ million) (%)
Difference from Indicative
2010-11 Indicative
Allocations Option DATA1
ESSEXBasildon 16.1 0.0 0.0%Braintree 10.6 0.0 0.0%Brentwood 4.4 0.0 0.0%Castle Point 6.8 0.0 0.0%Chelmsford 10.7 0.0 0.1%Colchester 13.1 0.0 0.0%Epping Forest 9.4 0.0 0.0%Harlow 8.2 0.0 0.1%Maldon 4.6 0.0 0.0%Rochford 5.2 0.0 0.0%Tendring 14.6 0.0 0.0%Uttlesford 3.9 0.0 0.0%
GLOUCESTERSHIRECheltenham 8.7 0.0 0.0%Cotswold 5.5 0.0 0.0%Forest of Dean 7.0 0.0 0.0%Gloucester 10.8 0.0 0.1%Stroud 7.3 0.0 0.1%Tewkesbury 5.4 0.0 0.0%
HAMPSHIREBasingstoke and Deane 10.3 0.0 0.0%East Hampshire 5.9 0.0 0.0%Eastleigh 7.8 0.0 0.1%Fareham 6.1 0.0 0.0%Gosport 7.1 0.0 0.1%Hart 3.9 0.0 0.1%Havant 9.9 0.0 0.1%New Forest 11.8 0.0 0.1%Rushmoor 6.3 0.0 0.0%Test Valley 7.3 0.0 0.1%Winchester 6.7 0.0 0.0%
HERTFORDSHIREBroxbourne 7.0 0.0 -0.1%Dacorum 9.5 0.0 0.0%East Hertfordshire 8.1 0.0 0.0%Hertsmere 6.8 0.0 0.0%North Hertfordshire 8.3 0.0 0.0%St Albans 7.0 0.0 -0.1%Stevenage 7.6 0.0 0.0%Three Rivers 5.1 0.0 0.0%Watford 7.2 0.0 0.0%Welwyn Hatfield 8.2 0.0 0.0%
KENTAshford 8.6 0.0 0.1%Canterbury 13.6 0.0 0.0%Dartford 7.6 0.0 0.0%Dover 9.9 0.0 0.0%Gravesham 8.5 0.0 0.1%Maidstone 9.0 0.0 0.0%Sevenoaks 6.1 0.0 0.0%Shepway 10.1 0.0 0.0%Swale 12.2 0.0 0.1%Thanet 13.4 0.0 0.0%Tonbridge and Malling 6.5 0.0 0.0%Tunbridge Wells 6.5 0.0 0.0%
345

Formula Grant Before Floor DampingLocal Authority
(£ million) (£ million) (%)
Difference from Indicative
2010-11 Indicative
Allocations Option DATA1
LANCASHIREBurnley 11.8 0.0 0.0%Chorley 8.6 0.0 0.0%Fylde 6.0 0.0 0.0%Hyndburn 10.3 0.0 0.0%Lancaster 16.8 0.0 0.0%Pendle 11.2 0.0 0.0%Preston 15.8 0.0 0.0%Ribble Valley 4.3 0.0 0.0%Rossendale 6.2 0.0 -0.1%South Ribble 7.6 0.0 0.0%West Lancashire 9.6 0.0 -0.1%Wyre 10.8 0.0 0.0%
LEICESTERSHIREBlaby 6.6 0.0 0.0%Charnwood 12.7 0.0 0.0%Harborough 5.6 0.0 0.0%Hinckley and Bosworth 7.6 0.0 0.0%Melton 4.0 0.0 0.0%North West Leicestershire 7.3 0.0 0.0%Oadby and Wigston 4.7 0.0 0.0%
LINCOLNSHIREBoston 7.4 0.0 0.0%East Lindsey 17.9 0.0 0.1%Lincoln 10.3 0.0 0.0%North Kesteven 9.0 0.0 0.0%South Holland 9.3 0.0 0.0%South Kesteven 10.2 0.0 0.0%West Lindsey 8.4 0.0 0.0%
NORFOLKBreckland 11.6 0.0 0.0%Broadland 8.7 0.0 0.0%Great Yarmouth 10.9 0.0 0.0%King's Lynn and West Norfolk 15.8 0.0 0.0%North Norfolk 9.1 0.0 0.0%Norwich 16.0 0.0 0.0%South Norfolk 8.6 0.0 0.0%
NORTH YORKSHIRECraven 4.3 0.0 0.0%Hambleton 5.9 0.0 0.0%Harrogate 11.5 0.0 0.0%Richmondshire 4.4 0.0 0.0%Ryedale 4.7 0.0 0.0%Scarborough 12.6 0.0 -0.1%Selby 6.8 0.0 0.0%
NORTHAMPTONSHIRECorby 5.6 0.0 0.0%Daventry 6.4 0.0 0.0%East Northamptonshire 6.9 0.0 0.0%Kettering 7.4 0.0 0.0%Northampton 18.9 0.0 0.0%South Northamptonshire 6.1 0.0 0.0%Wellingborough 7.1 0.0 0.0%
346
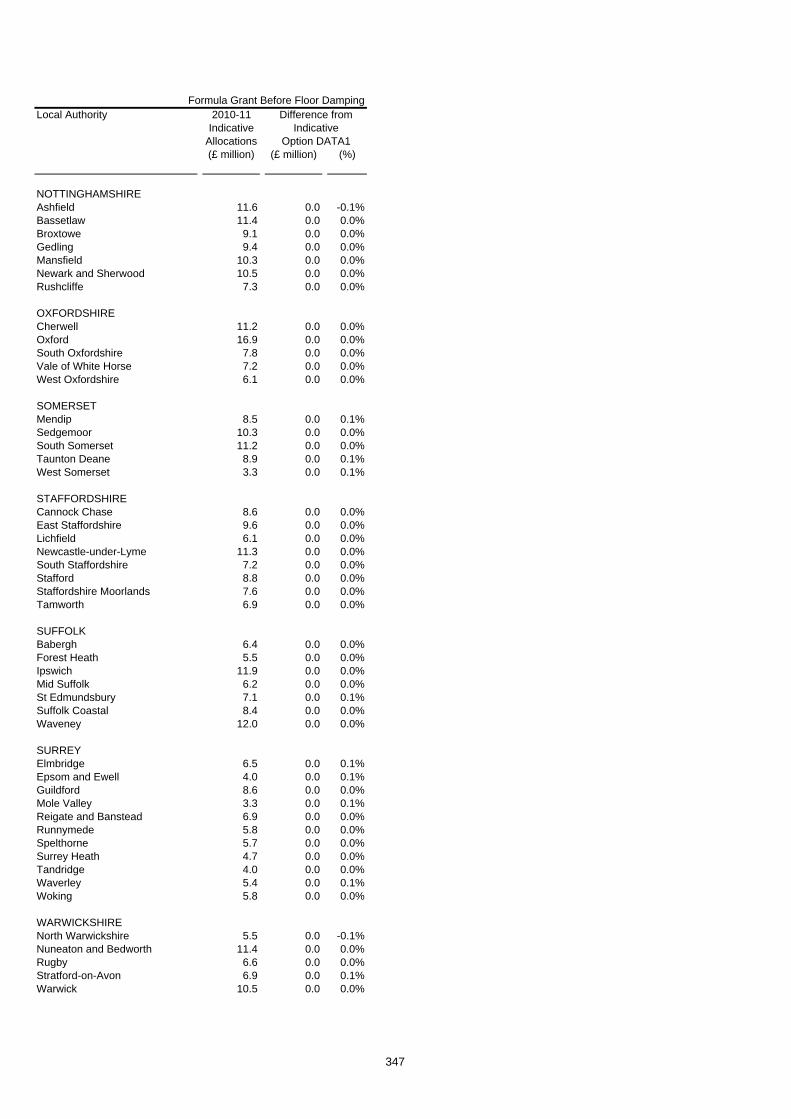
Formula Grant Before Floor DampingLocal Authority
(£ million) (£ million) (%)
Difference from Indicative
2010-11 Indicative
Allocations Option DATA1
NOTTINGHAMSHIREAshfield 11.6 0.0 -0.1%Bassetlaw 11.4 0.0 0.0%Broxtowe 9.1 0.0 0.0%Gedling 9.4 0.0 0.0%Mansfield 10.3 0.0 0.0%Newark and Sherwood 10.5 0.0 0.0%Rushcliffe 7.3 0.0 0.0%
OXFORDSHIRECherwell 11.2 0.0 0.0%Oxford 16.9 0.0 0.0%South Oxfordshire 7.8 0.0 0.0%Vale of White Horse 7.2 0.0 0.0%West Oxfordshire 6.1 0.0 0.0%
SOMERSETMendip 8.5 0.0 0.1%Sedgemoor 10.3 0.0 0.0%South Somerset 11.2 0.0 0.0%Taunton Deane 8.9 0.0 0.1%West Somerset 3.3 0.0 0.1%
STAFFORDSHIRECannock Chase 8.6 0.0 0.0%East Staffordshire 9.6 0.0 0.0%Lichfield 6.1 0.0 0.0%Newcastle-under-Lyme 11.3 0.0 0.0%South Staffordshire 7.2 0.0 0.0%Stafford 8.8 0.0 0.0%Staffordshire Moorlands 7.6 0.0 0.0%Tamworth 6.9 0.0 0.0%
SUFFOLKBabergh 6.4 0.0 0.0%Forest Heath 5.5 0.0 0.0%Ipswich 11.9 0.0 0.0%Mid Suffolk 6.2 0.0 0.0%St Edmundsbury 7.1 0.0 0.1%Suffolk Coastal 8.4 0.0 0.0%Waveney 12.0 0.0 0.0%
SURREYElmbridge 6.5 0.0 0.1%Epsom and Ewell 4.0 0.0 0.1%Guildford 8.6 0.0 0.0%Mole Valley 3.3 0.0 0.1%Reigate and Banstead 6.9 0.0 0.0%Runnymede 5.8 0.0 0.0%Spelthorne 5.7 0.0 0.0%Surrey Heath 4.7 0.0 0.0%Tandridge 4.0 0.0 0.0%Waverley 5.4 0.0 0.1%Woking 5.8 0.0 0.0%
WARWICKSHIRENorth Warwickshire 5.5 0.0 -0.1%Nuneaton and Bedworth 11.4 0.0 0.0%Rugby 6.6 0.0 0.0%Stratford-on-Avon 6.9 0.0 0.1%Warwick 10.5 0.0 0.0%
347

Formula Grant Before Floor DampingLocal Authority
(£ million) (£ million) (%)
Difference from Indicative
2010-11 Indicative
Allocations Option DATA1
WEST SUSSEXAdur 5.0 0.0 0.0%Arun 10.5 0.0 0.1%Chichester 5.9 0.0 0.1%Crawley 10.5 0.0 0.0%Horsham 6.0 0.0 0.0%Mid Sussex 5.3 0.0 0.1%Worthing 7.9 0.0 0.1%
WORCESTERSHIREBromsgrove 5.2 0.0 0.0%Malvern Hills 5.2 0.0 0.0%Redditch 6.4 0.0 0.1%Worcester 7.8 0.0 0.0%Wychavon 8.0 0.0 0.0%Wyre Forest 8.1 0.0 0.0%
348

Formula Grant Before Floor DampingLocal Authority
(£ million) (£ million) (%)
Difference from Indicative
2010-11 Indicative
Allocations Option DATA1
SHIRE POLICE AUTHORITIES
Avon & Somerset Police 197.6 0.0 0.0%Bedfordshire Police 76.6 0.0 0.0%Cambridgeshire Police 86.2 0.0 0.0%Cheshire Police 114.1 0.0 0.0%Cleveland Police 99.0 0.0 0.0%
Cumbria Police 56.1 0.0 0.0%Derbyshire Police 120.7 0.0 0.0%Devon & Cornwall Police 191.7 0.0 0.0%Dorset Police 64.3 0.0 0.0%Durham Police 87.0 0.0 0.0%
Essex Police 187.3 0.0 0.0%Gloucestershire Police 58.5 0.0 0.0%Hampshire Police 215.0 0.0 0.0%Hertfordshire Police 128.9 0.0 0.0%Humberside Police 132.9 0.0 0.0%
Kent Police 200.2 0.0 0.0%Lancashire Police 212.3 0.0 0.0%Leicestershire Police 124.2 0.0 0.0%Lincolnshire Police 69.0 0.0 0.0%Norfolk Police 88.5 0.0 0.0%
North Yorkshire Police 73.1 0.0 0.0%Northamptonshire Police 78.4 0.0 0.0%Nottinghamshire Police 152.7 0.0 0.0%Staffordshire Police 125.1 0.0 0.0%Suffolk Police 71.0 0.0 0.0%
Surrey Police 101.3 0.0 0.0%Sussex Police 167.1 0.0 0.0%Thames Valley Police 248.5 0.0 0.0%Warwickshire Police 56.1 0.0 0.0%West Mercia Police 114.3 0.0 0.0%
Wiltshire Police 64.1 0.0 0.0%
349

Formula Grant Before Floor DampingLocal Authority
(£ million) (£ million) (%)
Difference from Indicative
2010-11 Indicative
Allocations Option DATA1
SHIRE FIRE AUTHORITIES
Avon Fire 24.6 0.0 0.0%Bedfordshire Fire 11.7 0.0 0.0%Berkshire Fire Auhtority 13.0 0.0 0.0%Buckinghamshire Fire 9.1 0.0 0.0%Cambridgeshire Fire 15.1 0.0 0.0%
Cheshire Fire 19.3 0.0 0.0%Cleveland Fire 21.7 0.0 0.0%Derbyshire Fire 20.6 0.0 0.0%Devon and Somerset Fire 32.1 0.0 0.0%Dorset Fire 11.1 0.0 0.0%
Durham Fire 14.9 0.0 0.0%East Sussex Fire 15.0 0.0 0.0%Essex Fire Auhtority 33.3 0.0 0.0%Hampshire Fire 29.9 0.0 0.0%Hereford & Worcester Fire 10.8 0.0 0.0%
Humberside Fire 28.2 0.0 0.0%Kent Fire 30.2 0.0 0.0%Lancashire Fire 32.6 0.0 0.0%Leicestershire Fire 19.2 0.0 0.0%North Yorkshire Fire 11.6 0.0 0.0%
Nottinghamshire Fire 26.3 0.0 0.0%Shropshire Fire 8.6 0.0 0.0%Staffordshire Fire 19.1 0.0 0.0%Wiltshire Fire 9.7 0.0 0.0%
350

351
Chapter 14 Replacing the Children of Income Support claimants indicator Background 1. The current indicator on children of income support/income based
jobseekers allowance (IS/(IB)JSA) claimants (ISKID) has not been updated since the 2004-05 settlement, following the introduction of child tax credits. Data are no longer available, so that the number of children of IS/(IB)JSA claimants is averaged over a period between August 2000 and 2002, and the indicator is expressed as a proportion of the mid-2003 estimate of people aged 18 and under.
2. The indicator is currently used in the Youth and Community Relative Needs Formula (RNF), Local Authority Central Education Functions RNF and the Children’s Social Care RNF, which are sub-blocks within Children’s Services. The current formulae for these are shown below. The indicator is also used within the risk index in the Fire and Rescue RNF. The Fire and Rescue formula is provided in Chapter 5.
3. The current Youth and Community formula is
Basic amount
YOUTH AND
COMMUNITY BASIC AMOUNT
15.9208
Top-ups
YOUTH AND
COMMUNITY DEPRIVATION TOP-UP
59.9763 multiplied by CHILDREN OF INCOME SUPPORT /INCOME
BASED JOBSEEKER’S ALLOWANCE CLAIMANTS ABOVE THRESHOLD
YOUTH AND
COMMUNITY ETHNICITY TOP-UP
17.4653 multiplied by SECONDARY LOW ACHIEVING ETHNIC
GROUPS ABOVE THRESHOLD

352
The full formula used to calculate the Youth and Community element is:
Youth and Community
(a) PROJECTED POPULATION AGED 13 TO 19 IN 2010 multiplied by the result of: YOUTH AND COMMUNITY BASIC AMOUNT; plus YOUTH AND COMMUNITY DEPRIVATION TOP-UP; plus YOUTH AND COMMUNITY ETHNICITY TOP-UP
(b) The result of (a) is multiplied by AREA COST ADJUSTMENT FOR EDUCATION;
(c) The result of (b) is then multiplied by the scaling factor given in Annex F for the Youth and Community Services sub-block.
(d) The result of (c) is then divided by 10,000,000,000.
4. The current Local Authority Central Education Functions is
Basic amounts
PUPILS BASIC
AMOUNT
20.9997
RESIDENT PUPILS
BASIC AMOUNT
20.7832
Top-ups
PUPILS
DEPRIVATION TOP-UP
35.4154 multiplied by CHILDREN OF INCOME SUPPORT /INCOME
BASED JOBSEEKER’S ALLOWANCE CLAIMANTS ABOVE THRESHOLD
SPARSITY TOP-UP
27.6542 multiplied by WARD SPARSITY
RESIDENT PUPILS
DEPRIVATION TOP-UP
35.4154 multiplied by 0.66 multiplied by CHILDREN OF INCOME
SUPPORT /INCOME BASED JOBSEEKER’S ALLOWANCE CLAIMANTS ABOVE THRESHOLD
Fixed cost amount
CEF FIXED COST
AMOUNT
73,542.7448
The full formula used to calculate the Local Authority Central Education Functions element is:
Local Authority Central Education Functions
(a) PUPILS AGED 3 TO 18 multiplied by the result of: PUPILS BASIC AMOUNT; plus PUPILS DEPRIVATION TOP-UP
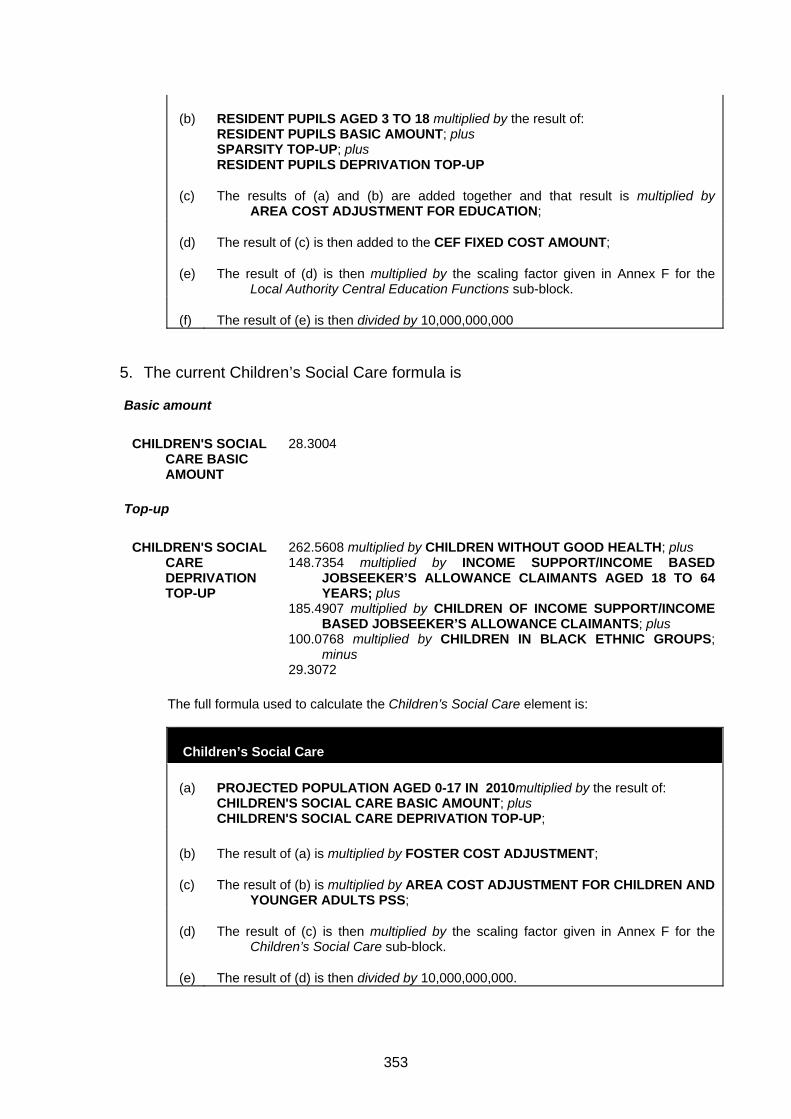
353
(b) RESIDENT PUPILS AGED 3 TO 18 multiplied by the result of: RESIDENT PUPILS BASIC AMOUNT; plus SPARSITY TOP-UP; plus RESIDENT PUPILS DEPRIVATION TOP-UP
(c) The results of (a) and (b) are added together and that result is multiplied by AREA COST ADJUSTMENT FOR EDUCATION;
(d) The result of (c) is then added to the CEF FIXED COST AMOUNT;
(e) The result of (d) is then multiplied by the scaling factor given in Annex F for the Local Authority Central Education Functions sub-block.
(f) The result of (e) is then divided by 10,000,000,000
5. The current Children’s Social Care formula is
Basic amount
CHILDREN'S SOCIAL
CARE BASIC AMOUNT
28.3004
Top-up
CHILDREN'S SOCIAL
CARE DEPRIVATION TOP-UP
262.5608 multiplied by CHILDREN WITHOUT GOOD HEALTH; plus 148.7354 multiplied by INCOME SUPPORT/INCOME BASED
JOBSEEKER’S ALLOWANCE CLAIMANTS AGED 18 TO 64 YEARS; plus
185.4907 multiplied by CHILDREN OF INCOME SUPPORT/INCOME BASED JOBSEEKER’S ALLOWANCE CLAIMANTS; plus
100.0768 multiplied by CHILDREN IN BLACK ETHNIC GROUPS; minus
29.3072
The full formula used to calculate the Children’s Social Care element is:
Children’s Social Care
(a) PROJECTED POPULATION AGED 0-17 IN 2010multiplied by the result of: CHILDREN'S SOCIAL CARE BASIC AMOUNT; plus CHILDREN'S SOCIAL CARE DEPRIVATION TOP-UP;
(b) The result of (a) is multiplied by FOSTER COST ADJUSTMENT;
(c) The result of (b) is multiplied by AREA COST ADJUSTMENT FOR CHILDREN AND YOUNGER ADULTS PSS;
(d) The result of (c) is then multiplied by the scaling factor given in Annex F for the Children’s Social Care sub-block.
(e) The result of (d) is then divided by 10,000,000,000.

354
Changes to the indicator
Using Child Tax Credit data
6. Child Tax Credit (CTC) provides support to families for the children (up until the 31 August after their 16th birthdays) and for "qualifying" young people (from 1 September after their 16th birthday, in full-time non-advanced education until their 20th birthday) for which they are responsible. This does not include young people entitled to, or in receipt of, Income Support or income based Jobseeker’s Allowance, or Incapacity Benefit. It is paid in addition to Child Benefit.
7. A family's daily entitlement to tax credits depends on their circumstances (hours worked, children, childcare costs, disabilities) on that day and their gross joint annual incomes in the current and previous tax years. In-work is defined as the adult, or at least one adult in a couple, worked for 16 or more hours per week. Out-of-work families are families with no adult working for more than 16 normal working hours per week.
8. Since May 2007, HM Revenue and Customs have published data for both in- and out-of- work families receiving CTC at a local authority level. Considering that we want to replace children of IS/(IB)JSA claimants, it seems more appropriate to use children of out-of-work families receiving CTC.
9. Comparing this proposed indicator, using an average over the period 2005-06 to 2007-08, with the existing children of IS/(IB)JSA claimants produced very strong relationship for both education providing authorities and for fire and rescue authorities.
Option DATA2
10. Option DATA2 proposes the use of the proportion of people aged 18 and under who are in out-of-work families receiving Child Tax Credit as a direct replacement of the current children of IS/(IB)JSA claimants.
11. The result of option DATA2 on the formula for the Youth and Community sub-block is given below.
Basic amount
YOUTH AND
COMMUNITY BASIC AMOUNT
16.4413
Top-ups
YOUTH AND
COMMUNITY DEPRIVATION TOP-UP
57.4933 multiplied by CHILDREN IN OUT-OF-WORK FAMILIES
RECEIVING CHILD TAX CREDIT ABOVE THRESHOLD
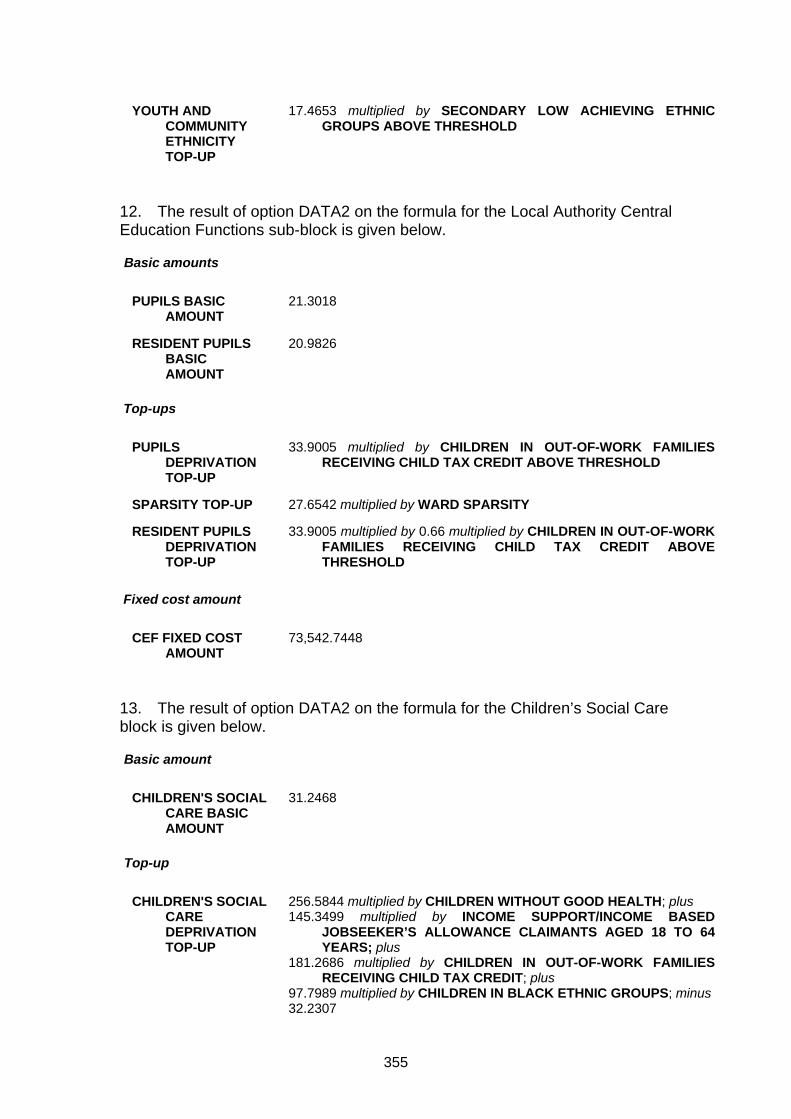
355
YOUTH AND
COMMUNITY ETHNICITY TOP-UP
17.4653 multiplied by SECONDARY LOW ACHIEVING ETHNIC
GROUPS ABOVE THRESHOLD
12. The result of option DATA2 on the formula for the Local Authority Central Education Functions sub-block is given below.
Basic amounts
PUPILS BASIC
AMOUNT
21.3018
RESIDENT PUPILS
BASIC AMOUNT
20.9826
Top-ups
PUPILS
DEPRIVATION TOP-UP
33.9005 multiplied by CHILDREN IN OUT-OF-WORK FAMILIES
RECEIVING CHILD TAX CREDIT ABOVE THRESHOLD
SPARSITY TOP-UP
27.6542 multiplied by WARD SPARSITY
RESIDENT PUPILS
DEPRIVATION TOP-UP
33.9005 multiplied by 0.66 multiplied by CHILDREN IN OUT-OF-WORK
FAMILIES RECEIVING CHILD TAX CREDIT ABOVE THRESHOLD
Fixed cost amount
CEF FIXED COST
AMOUNT
73,542.7448
13. The result of option DATA2 on the formula for the Children’s Social Care block is given below.
Basic amount
CHILDREN'S SOCIAL
CARE BASIC AMOUNT
31.2468
Top-up
CHILDREN'S SOCIAL
CARE DEPRIVATION TOP-UP
256.5844 multiplied by CHILDREN WITHOUT GOOD HEALTH; plus 145.3499 multiplied by INCOME SUPPORT/INCOME BASED
JOBSEEKER’S ALLOWANCE CLAIMANTS AGED 18 TO 64 YEARS; plus
181.2686 multiplied by CHILDREN IN OUT-OF-WORK FAMILIES RECEIVING CHILD TAX CREDIT; plus
97.7989 multiplied by CHILDREN IN BLACK ETHNIC GROUPS; minus 32.2307

356
14. The result of option DATA2 on the formula for the Fire and Rescue block is given below.
Basic amount
FIRE AND RESCUE BASIC AMOUNT
1.6373
Top-ups
FIRE AND RESCUE
COASTLINE TOP-UP
0.7615 multiplied by COASTLINE
FIRE AND RESCUE
DEPRIVATION TOP-UP
0.2286 multiplied by RISK INDEX
HIGH RISK TOP-UP
30,042.8570 multiplied by COMAH SITES
PROPERTY AND SOCIETAL RISK TOP-UP
PROPERTY AND SOCIETAL RISK
COMMUNITY FIRE SAFETY TOP-UP
COMMUNITY FIRE SAFETY
Questions
Question 23: Do you agree that children in out-of-work families receiving Child Tax Credit (CTC) should replace the current children of IS/(IB)JSA claimants (DATA2)?

Formula Grant Before Floor DampingLocal Authority
(£ million) (£ million) (%)
England 28,995.5 0.0 0.0%
London area 6,153.4 87.9 1.4%Metropolitan areas 8,340.7 -61.5 -0.7%Shire areas 14,499.1 -26.4 -0.2%Isles of Scilly 2.3 0.0 0.0%
Inner London boroughs incl. City 2,025.0 9.5 0.5%Outer London boroughs 1,873.1 57.2 3.1%London boroughs 3,898.1 66.6 1.7%GLA - all functions 2,255.3 21.2 0.9%
Metropolitan districts 5,904.0 -61.9 -1.0%Metropolitan fire authorities 335.8 -1.7 -0.5%Metropolitan police authorities 2,100.9 2.2 0.1%
Shire unitaries with fire 425.6 -2.2 -0.5%Shire unitaries without fire 4,099.3 -6.6 -0.2%Shire counties with fire 1,589.0 7.8 0.5%Shire counties without fire 2,501.9 -6.0 -0.2%Shire districts 1,654.0 0.1 0.0%Combined fire authorities 467.7 -9.0 -1.9%Shire police authorities 3,761.6 -10.4 -0.3%
GO REGIONAL SUMMARY
South West GOR 2,267.3 -1.6 -0.1%South East GOR 2,957.0 7.7 0.3%London GOR 6,153.4 87.9 1.4%Eastern GOR 2,437.8 10.1 0.4%East Midlands GOR 2,292.2 -7.5 -0.3%West Midlands GOR 3,349.9 4.6 0.1%Yorkshire and Humber GOR 3,199.2 -30.5 -1.0%North East GOR 1,777.2 -21.0 -1.2%North West GOR 4,561.4 -49.7 -1.1%
FLOOR DAMPING GROUPS
Education Authorities 18,418.0 -2.4 0.0%Police Authorities 7,864.8 0.1 0.0%Fire Authorities 1,056.5 2.2 0.2%Shire Districts 1,654.0 0.1 0.0%
Data: Children on Income Support
Difference from Indicative
Allocations
2010-11 Indicative
AllocationsOption DATA2
357

Formula Grant Before Floor DampingLocal Authority
(£ million) (£ million) (%)
Difference from Indicative
Allocations
2010-11 Indicative
AllocationsOption DATA2
GREATER LONDON
City of London 91.1 1.2 1.4%
Camden 171.0 -0.3 -0.2%Greenwich 170.1 1.7 1.0%Hackney 201.8 -0.3 -0.1%Hammersmith and Fulham 94.3 0.7 0.8%Islington 133.8 0.5 0.4%Kensington and Chelsea 95.9 -0.2 -0.3%
Lambeth 180.3 1.3 0.7%Lewisham 174.9 2.2 1.2%Southwark 210.2 -0.3 -0.1%Tower Hamlets 224.3 -0.9 -0.4%Wandsworth 98.6 0.7 0.7%Westminster 178.8 3.1 1.7%
Barking and Dagenham 108.2 4.7 4.4%Barnet 97.9 4.5 4.5%Bexley 64.5 0.1 0.2%Brent 157.0 5.4 3.5%Bromley 45.7 1.5 3.4%
Croydon 118.4 2.8 2.4%Ealing 129.0 3.7 2.9%Enfield 126.7 9.0 7.1%Haringey 137.6 1.9 1.4%Harrow 66.6 3.7 5.6%
Havering 52.3 0.7 1.4%Hillingdon 85.6 4.1 4.8%Hounslow 77.3 2.4 3.1%Kingston upon Thames 32.6 0.6 1.7%Merton 61.2 0.7 1.1%
Newham 231.3 2.1 0.9%Redbridge 102.6 5.3 5.1%Richmond upon Thames 9.6 -0.4 -4.2%Sutton 45.1 1.3 2.8%Waltham Forest 124.0 3.0 2.4%
GLA - all functions 2,255.3 21.2 0.9%
GLA - police 2,002.3 8.3 0.4%GLA - fire 253.0 12.9 5.1%
358

Formula Grant Before Floor DampingLocal Authority
(£ million) (£ million) (%)
Difference from Indicative
Allocations
2010-11 Indicative
AllocationsOption DATA2
GREATER MANCHESTERBolton 132.6 -0.7 -0.6%Bury 67.5 -1.2 -1.7%Manchester 346.1 -3.3 -1.0%Oldham 127.6 0.0 0.0%Rochdale 114.9 -0.9 -0.8%Salford 131.2 -1.2 -0.9%Stockport 85.2 -1.3 -1.5%Tameside 109.5 -0.6 -0.5%Trafford 67.3 -1.2 -1.8%Wigan 138.6 -1.0 -0.7%Greater Manchester Fire 76.1 -0.2 -0.3%Greater Manchester Police 485.7 0.6 0.1%
MERSEYSIDEKnowsley 114.6 -4.4 -3.8%Liverpool 318.0 -8.1 -2.6%Sefton 127.6 -3.3 -2.6%St Helens 90.9 -1.1 -1.3%Wirral 165.2 -4.6 -2.8%Merseyside Fire 46.1 -0.8 -1.8%Merseyside Police 275.5 0.6 0.2%
SOUTH YORKSHIREBarnsley 114.3 -2.3 -2.0%Doncaster 149.1 -2.6 -1.8%Rotherham 130.1 -2.1 -1.6%Sheffield 280.0 -2.4 -0.9%South Yorkshire Fire 37.4 -0.7 -1.8%South Yorkshire Police 209.2 -0.1 -0.1%
TYNE AND WEARGateshead 102.7 -1.8 -1.8%Newcastle upon Tyne 157.2 -2.8 -1.8%North Tyneside 87.4 -1.7 -1.9%South Tyneside 89.3 -2.0 -2.3%Sunderland 158.9 -2.7 -1.7%Tyne and Wear Fire 35.9 -0.6 -1.8%Northumbria Police 219.9 -0.1 0.0%
WEST MIDLANDSBirmingham 698.9 0.0 0.0%Coventry 156.6 1.9 1.2%Dudley 130.4 0.5 0.4%Sandwell 190.3 -0.6 -0.3%Solihull 49.1 0.1 0.1%Walsall 142.3 0.9 0.7%Wolverhampton 145.6 1.3 0.9%West Midlands Fire 81.6 1.6 1.9%West Midlands Police 542.2 1.1 0.2%
WEST YORKSHIREBradford 283.4 -4.7 -1.7%Calderdale 84.1 -1.8 -2.2%Kirklees 164.9 -2.2 -1.3%Leeds 305.9 -2.3 -0.8%Wakefield 146.7 -1.4 -1.0%West Yorkshire Fire 58.7 -0.8 -1.4%West Yorkshire Police 368.2 0.0 0.0%
359

Formula Grant Before Floor DampingLocal Authority
(£ million) (£ million) (%)
Difference from Indicative
Allocations
2010-11 Indicative
AllocationsOption DATA2
ALL PURPOSE AUTHORITIES
Bath & North East Somerset 44.1 -0.3 -0.6%Bedford 55.4 0.1 0.2%Blackburn with Darwen 88.5 -1.0 -1.1%Blackpool 86.9 0.6 0.7%Bournemouth 49.4 0.0 -0.1%
Bracknell Forest 22.6 0.4 1.9%Brighton & Hove 89.8 -0.6 -0.7%Bristol 171.2 0.2 0.1%Central Bedfordshire 51.9 1.1 2.1%Cheshire East 64.5 -0.5 -0.8%
Cheshire West & Chester 94.9 -0.8 -0.8%Cornwall 227.6 -1.4 -0.6%Darlington 40.1 -0.2 -0.5%Derby 114.5 -1.2 -1.0%Durham 238.7 -2.5 -1.0%
East Riding of Yorkshire 109.2 -1.3 -1.2%Halton 65.5 -1.9 -2.9%Hartlepool 54.0 -0.8 -1.5%Herefordshire 61.2 0.3 0.5%Isle of Wight Council 65.0 -0.3 -0.4%
Kingston upon Hull 159.2 -1.9 -1.2%Leicester 188.4 4.0 2.1%Luton 94.6 1.6 1.7%Medway 89.5 1.3 1.4%Middlesbrough 85.4 -1.6 -1.9%
Milton Keynes 91.6 2.3 2.6%North East Lincolnshire 76.9 -0.1 -0.1%North Lincolnshire 66.3 -0.3 -0.5%North Somerset 54.6 0.9 1.7%Northumberland 133.1 -0.5 -0.4%
Nottingham 179.5 -3.5 -2.0%Peterborough 80.9 -0.7 -0.8%Plymouth 108.7 -1.1 -1.0%Poole 25.6 0.0 0.0%Portsmouth 87.8 0.7 0.7%
Reading 48.0 0.8 1.6%Redcar and Cleveland 71.4 -1.1 -1.5%Rutland 8.6 0.0 0.1%Shropshire 97.4 0.4 0.4%Slough 52.8 2.3 4.3%
South Gloucestershire 64.0 -0.4 -0.6%Southampton 101.2 -0.1 -0.1%Southend-on-Sea 62.3 -0.2 -0.3%Stockton-on-Tees 80.6 -2.0 -2.5%Stoke-on-Trent 133.5 -0.7 -0.5%
Swindon 43.7 1.0 2.4%Telford and the Wrekin 76.0 0.1 0.1%Thurrock 62.1 0.3 0.4%Torbay 64.2 0.2 0.4%Warrington 52.7 -1.0 -2.0%
360
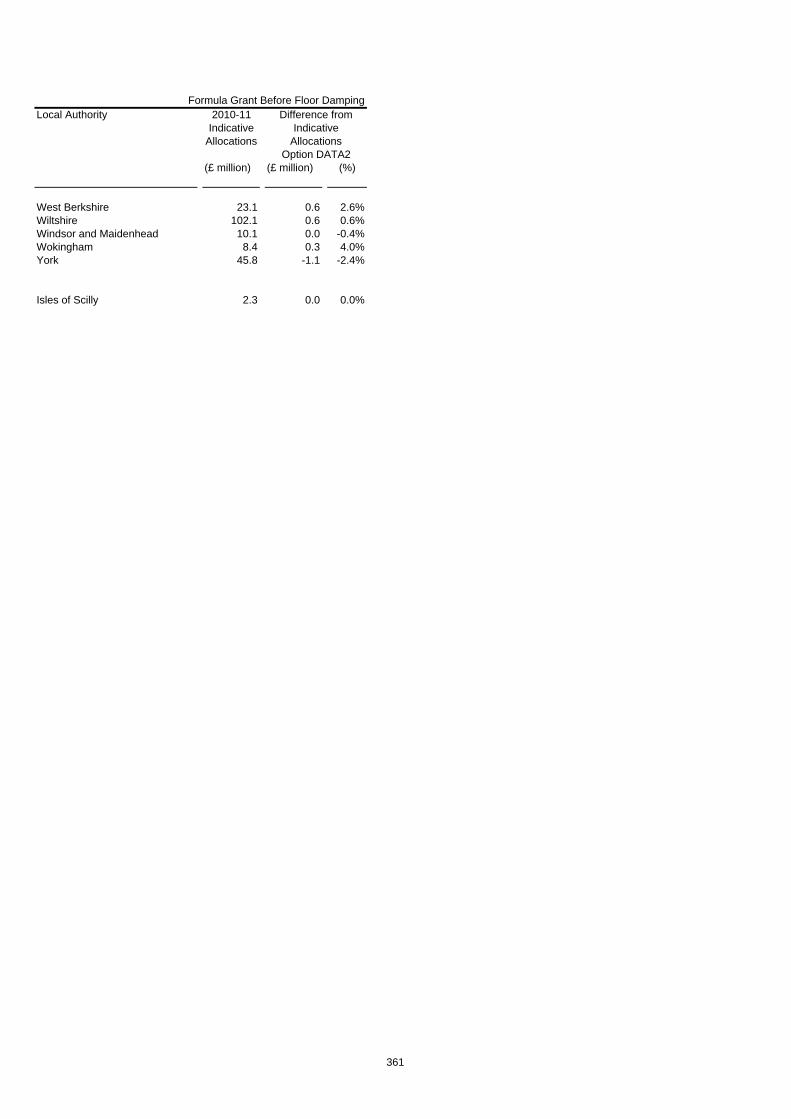
Formula Grant Before Floor DampingLocal Authority
(£ million) (£ million) (%)
Difference from Indicative
Allocations
2010-11 Indicative
AllocationsOption DATA2
West Berkshire 23.1 0.6 2.6%Wiltshire 102.1 0.6 0.6%Windsor and Maidenhead 10.1 0.0 -0.4%Wokingham 8.4 0.3 4.0%York 45.8 -1.1 -2.4%
Isles of Scilly 2.3 0.0 0.0%
361
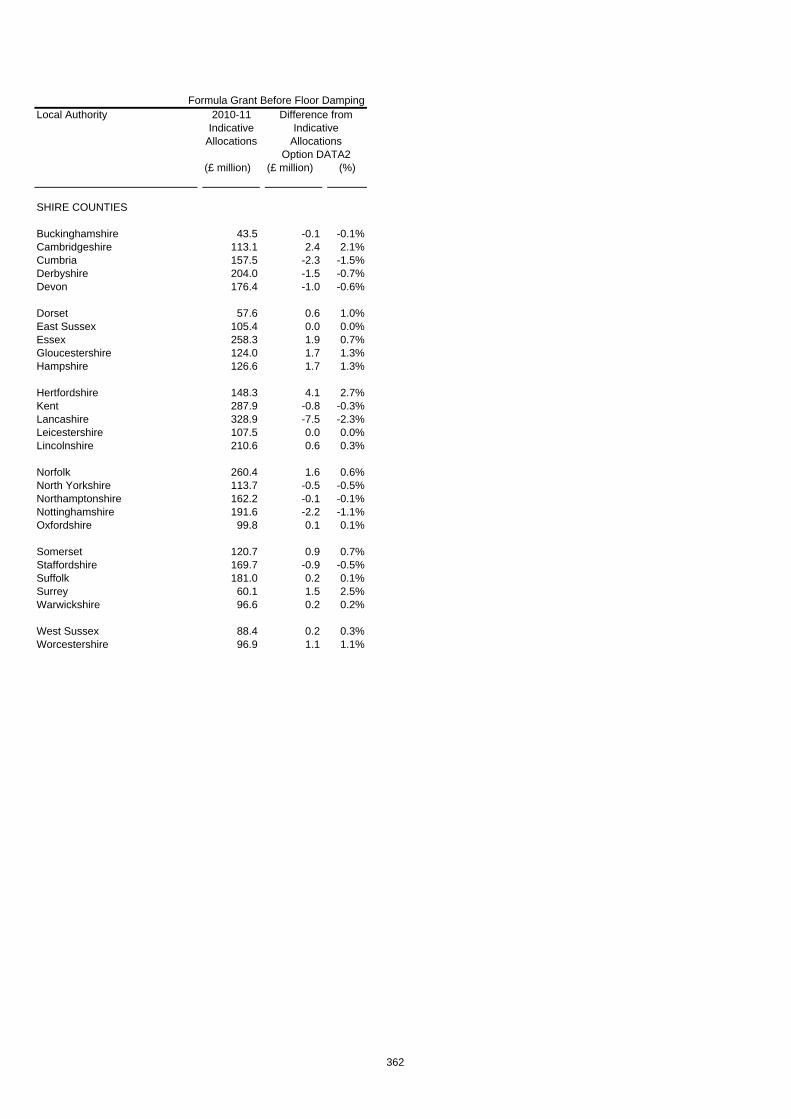
Formula Grant Before Floor DampingLocal Authority
(£ million) (£ million) (%)
Difference from Indicative
Allocations
2010-11 Indicative
AllocationsOption DATA2
SHIRE COUNTIES
Buckinghamshire 43.5 -0.1 -0.1%Cambridgeshire 113.1 2.4 2.1%Cumbria 157.5 -2.3 -1.5%Derbyshire 204.0 -1.5 -0.7%Devon 176.4 -1.0 -0.6%
Dorset 57.6 0.6 1.0%East Sussex 105.4 0.0 0.0%Essex 258.3 1.9 0.7%Gloucestershire 124.0 1.7 1.3%Hampshire 126.6 1.7 1.3%
Hertfordshire 148.3 4.1 2.7%Kent 287.9 -0.8 -0.3%Lancashire 328.9 -7.5 -2.3%Leicestershire 107.5 0.0 0.0%Lincolnshire 210.6 0.6 0.3%
Norfolk 260.4 1.6 0.6%North Yorkshire 113.7 -0.5 -0.5%Northamptonshire 162.2 -0.1 -0.1%Nottinghamshire 191.6 -2.2 -1.1%Oxfordshire 99.8 0.1 0.1%
Somerset 120.7 0.9 0.7%Staffordshire 169.7 -0.9 -0.5%Suffolk 181.0 0.2 0.1%Surrey 60.1 1.5 2.5%Warwickshire 96.6 0.2 0.2%
West Sussex 88.4 0.2 0.3%Worcestershire 96.9 1.1 1.1%
362

Formula Grant Before Floor DampingLocal Authority
(£ million) (£ million) (%)
Difference from Indicative
Allocations
2010-11 Indicative
AllocationsOption DATA2
BUCKINGHAMSHIREAylesbury Vale 12.1 0.0 -0.1%Chiltern 3.2 0.0 1.2%South Bucks 2.3 0.0 1.5%Wycombe 9.5 0.0 0.4%
CAMBRIDGESHIRECambridge 12.0 0.0 0.1%East Cambridgeshire 6.8 0.0 -0.2%Fenland 9.9 0.0 0.0%Huntingdonshire 13.4 -0.1 -0.5%South Cambridgeshire 7.9 0.0 0.0%
CUMBRIAAllerdale 10.4 0.0 0.2%Barrow-in-Furness 9.1 0.0 0.2%Carlisle 10.2 0.0 0.0%Copeland 7.2 0.0 0.0%Eden 4.7 0.0 0.2%South Lakeland 6.8 0.0 0.2%
DERBYSHIREAmber Valley 10.0 0.0 -0.4%Bolsover 8.0 0.0 -0.3%Chesterfield 10.2 0.0 -0.1%Derbyshire Dales 4.7 0.0 0.3%Erewash 9.7 -0.1 -0.5%High Peak 7.2 0.0 -0.3%North East Derbyshire 7.9 0.0 -0.4%South Derbyshire 7.5 0.0 -0.5%
DEVONEast Devon 8.4 0.0 0.2%Exeter 12.1 0.0 0.0%Mid Devon 6.3 0.0 0.0%North Devon 8.5 0.0 0.0%South Hams 5.6 0.0 0.6%Teignbridge 10.1 0.0 0.0%Torridge 6.6 0.0 0.1%West Devon 4.4 0.0 0.3%
DORSETChristchurch 2.9 0.0 0.9%East Dorset 3.8 0.0 0.0%North Dorset 4.7 0.0 0.0%Purbeck 3.3 0.0 0.5%West Dorset 7.9 0.1 0.8%Weymouth and Portland 6.1 0.0 0.0%
EAST SUSSEXEastbourne 10.5 0.1 0.5%Hastings 10.6 0.0 0.3%Lewes 6.6 0.0 0.0%Rother 6.5 0.0 0.7%Wealden 8.4 0.0 0.2%
363
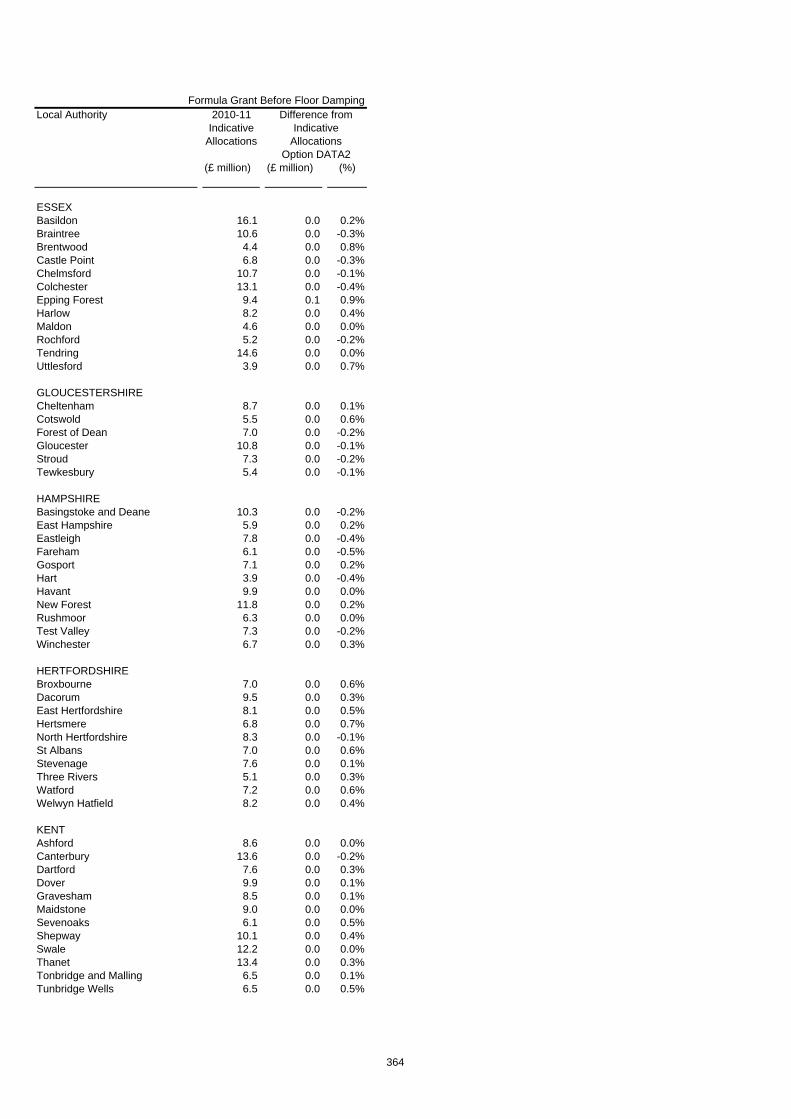
Formula Grant Before Floor DampingLocal Authority
(£ million) (£ million) (%)
Difference from Indicative
Allocations
2010-11 Indicative
AllocationsOption DATA2
ESSEXBasildon 16.1 0.0 0.2%Braintree 10.6 0.0 -0.3%Brentwood 4.4 0.0 0.8%Castle Point 6.8 0.0 -0.3%Chelmsford 10.7 0.0 -0.1%Colchester 13.1 0.0 -0.4%Epping Forest 9.4 0.1 0.9%Harlow 8.2 0.0 0.4%Maldon 4.6 0.0 0.0%Rochford 5.2 0.0 -0.2%Tendring 14.6 0.0 0.0%Uttlesford 3.9 0.0 0.7%
GLOUCESTERSHIRECheltenham 8.7 0.0 0.1%Cotswold 5.5 0.0 0.6%Forest of Dean 7.0 0.0 -0.2%Gloucester 10.8 0.0 -0.1%Stroud 7.3 0.0 -0.2%Tewkesbury 5.4 0.0 -0.1%
HAMPSHIREBasingstoke and Deane 10.3 0.0 -0.2%East Hampshire 5.9 0.0 0.2%Eastleigh 7.8 0.0 -0.4%Fareham 6.1 0.0 -0.5%Gosport 7.1 0.0 0.2%Hart 3.9 0.0 -0.4%Havant 9.9 0.0 0.0%New Forest 11.8 0.0 0.2%Rushmoor 6.3 0.0 0.0%Test Valley 7.3 0.0 -0.2%Winchester 6.7 0.0 0.3%
HERTFORDSHIREBroxbourne 7.0 0.0 0.6%Dacorum 9.5 0.0 0.3%East Hertfordshire 8.1 0.0 0.5%Hertsmere 6.8 0.0 0.7%North Hertfordshire 8.3 0.0 -0.1%St Albans 7.0 0.0 0.6%Stevenage 7.6 0.0 0.1%Three Rivers 5.1 0.0 0.3%Watford 7.2 0.0 0.6%Welwyn Hatfield 8.2 0.0 0.4%
KENTAshford 8.6 0.0 0.0%Canterbury 13.6 0.0 -0.2%Dartford 7.6 0.0 0.3%Dover 9.9 0.0 0.1%Gravesham 8.5 0.0 0.1%Maidstone 9.0 0.0 0.0%Sevenoaks 6.1 0.0 0.5%Shepway 10.1 0.0 0.4%Swale 12.2 0.0 0.0%Thanet 13.4 0.0 0.3%Tonbridge and Malling 6.5 0.0 0.1%Tunbridge Wells 6.5 0.0 0.5%
364
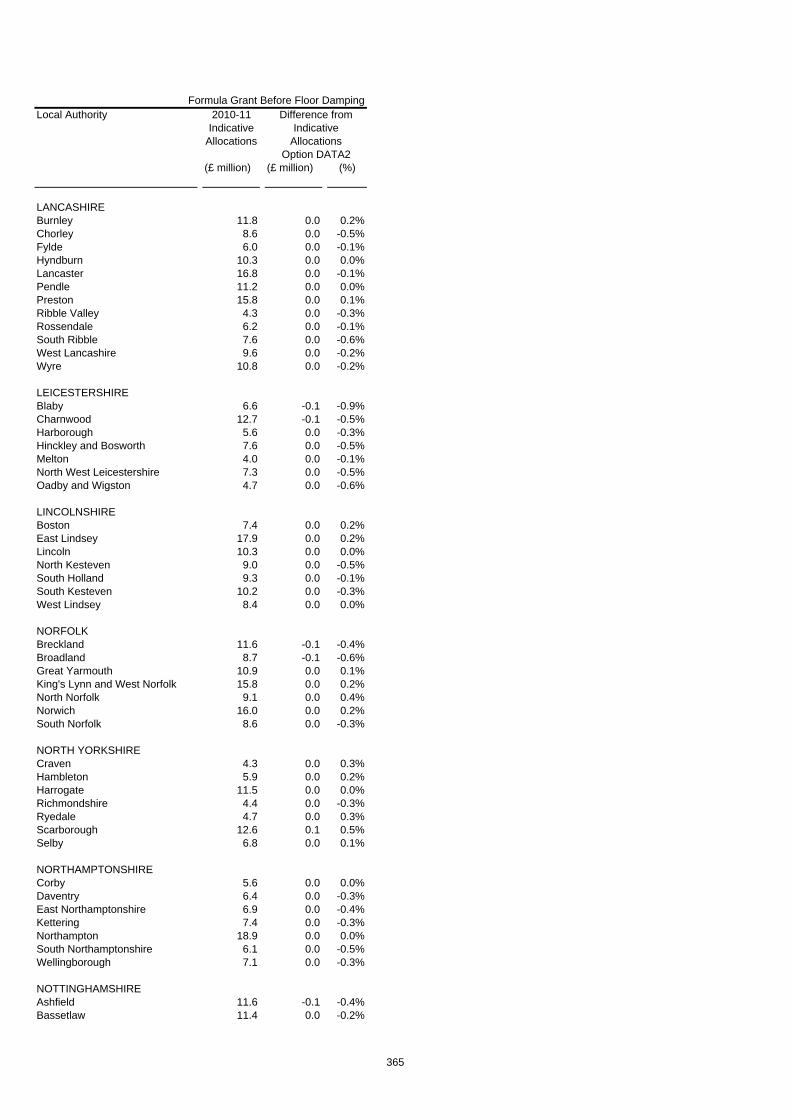
Formula Grant Before Floor DampingLocal Authority
(£ million) (£ million) (%)
Difference from Indicative
Allocations
2010-11 Indicative
AllocationsOption DATA2
LANCASHIREBurnley 11.8 0.0 0.2%Chorley 8.6 0.0 -0.5%Fylde 6.0 0.0 -0.1%Hyndburn 10.3 0.0 0.0%Lancaster 16.8 0.0 -0.1%Pendle 11.2 0.0 0.0%Preston 15.8 0.0 0.1%Ribble Valley 4.3 0.0 -0.3%Rossendale 6.2 0.0 -0.1%South Ribble 7.6 0.0 -0.6%West Lancashire 9.6 0.0 -0.2%Wyre 10.8 0.0 -0.2%
LEICESTERSHIREBlaby 6.6 -0.1 -0.9%Charnwood 12.7 -0.1 -0.5%Harborough 5.6 0.0 -0.3%Hinckley and Bosworth 7.6 0.0 -0.5%Melton 4.0 0.0 -0.1%North West Leicestershire 7.3 0.0 -0.5%Oadby and Wigston 4.7 0.0 -0.6%
LINCOLNSHIREBoston 7.4 0.0 0.2%East Lindsey 17.9 0.0 0.2%Lincoln 10.3 0.0 0.0%North Kesteven 9.0 0.0 -0.5%South Holland 9.3 0.0 -0.1%South Kesteven 10.2 0.0 -0.3%West Lindsey 8.4 0.0 0.0%
NORFOLKBreckland 11.6 -0.1 -0.4%Broadland 8.7 -0.1 -0.6%Great Yarmouth 10.9 0.0 0.1%King's Lynn and West Norfolk 15.8 0.0 0.2%North Norfolk 9.1 0.0 0.4%Norwich 16.0 0.0 0.2%South Norfolk 8.6 0.0 -0.3%
NORTH YORKSHIRECraven 4.3 0.0 0.3%Hambleton 5.9 0.0 0.2%Harrogate 11.5 0.0 0.0%Richmondshire 4.4 0.0 -0.3%Ryedale 4.7 0.0 0.3%Scarborough 12.6 0.1 0.5%Selby 6.8 0.0 0.1%
NORTHAMPTONSHIRECorby 5.6 0.0 0.0%Daventry 6.4 0.0 -0.3%East Northamptonshire 6.9 0.0 -0.4%Kettering 7.4 0.0 -0.3%Northampton 18.9 0.0 0.0%South Northamptonshire 6.1 0.0 -0.5%Wellingborough 7.1 0.0 -0.3%
NOTTINGHAMSHIREAshfield 11.6 -0.1 -0.4%Bassetlaw 11.4 0.0 -0.2%
365
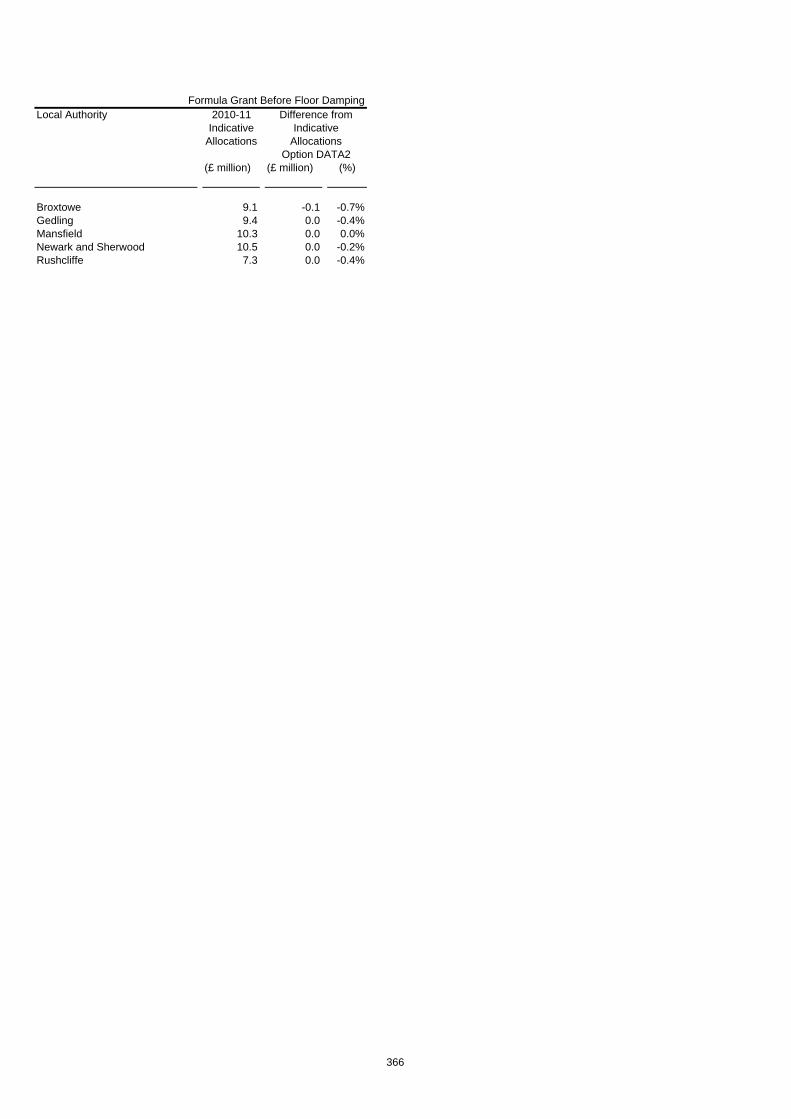
Formula Grant Before Floor DampingLocal Authority
(£ million) (£ million) (%)
Difference from Indicative
Allocations
2010-11 Indicative
AllocationsOption DATA2
Broxtowe 9.1 -0.1 -0.7%Gedling 9.4 0.0 -0.4%Mansfield 10.3 0.0 0.0%Newark and Sherwood 10.5 0.0 -0.2%Rushcliffe 7.3 0.0 -0.4%
366
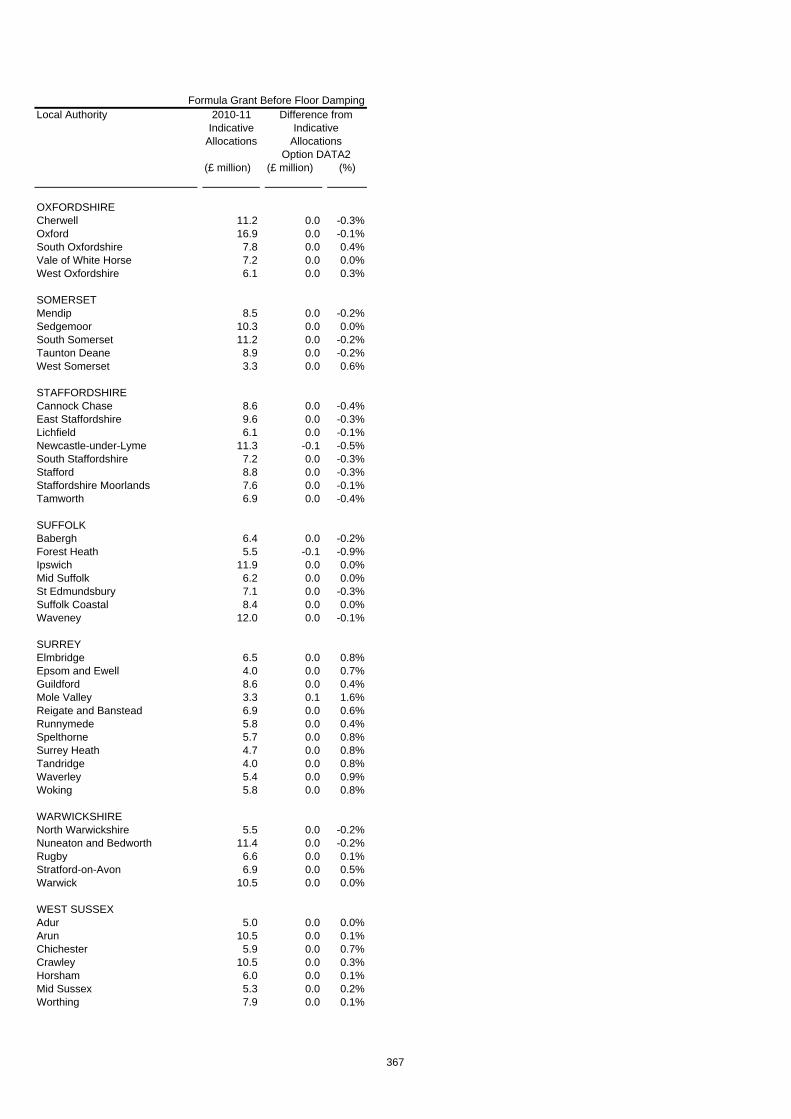
Formula Grant Before Floor DampingLocal Authority
(£ million) (£ million) (%)
Difference from Indicative
Allocations
2010-11 Indicative
AllocationsOption DATA2
OXFORDSHIRECherwell 11.2 0.0 -0.3%Oxford 16.9 0.0 -0.1%South Oxfordshire 7.8 0.0 0.4%Vale of White Horse 7.2 0.0 0.0%West Oxfordshire 6.1 0.0 0.3%
SOMERSETMendip 8.5 0.0 -0.2%Sedgemoor 10.3 0.0 0.0%South Somerset 11.2 0.0 -0.2%Taunton Deane 8.9 0.0 -0.2%West Somerset 3.3 0.0 0.6%
STAFFORDSHIRECannock Chase 8.6 0.0 -0.4%East Staffordshire 9.6 0.0 -0.3%Lichfield 6.1 0.0 -0.1%Newcastle-under-Lyme 11.3 -0.1 -0.5%South Staffordshire 7.2 0.0 -0.3%Stafford 8.8 0.0 -0.3%Staffordshire Moorlands 7.6 0.0 -0.1%Tamworth 6.9 0.0 -0.4%
SUFFOLKBabergh 6.4 0.0 -0.2%Forest Heath 5.5 -0.1 -0.9%Ipswich 11.9 0.0 0.0%Mid Suffolk 6.2 0.0 0.0%St Edmundsbury 7.1 0.0 -0.3%Suffolk Coastal 8.4 0.0 0.0%Waveney 12.0 0.0 -0.1%
SURREYElmbridge 6.5 0.0 0.8%Epsom and Ewell 4.0 0.0 0.7%Guildford 8.6 0.0 0.4%Mole Valley 3.3 0.1 1.6%Reigate and Banstead 6.9 0.0 0.6%Runnymede 5.8 0.0 0.4%Spelthorne 5.7 0.0 0.8%Surrey Heath 4.7 0.0 0.8%Tandridge 4.0 0.0 0.8%Waverley 5.4 0.0 0.9%Woking 5.8 0.0 0.8%
WARWICKSHIRENorth Warwickshire 5.5 0.0 -0.2%Nuneaton and Bedworth 11.4 0.0 -0.2%Rugby 6.6 0.0 0.1%Stratford-on-Avon 6.9 0.0 0.5%Warwick 10.5 0.0 0.0%
WEST SUSSEXAdur 5.0 0.0 0.0%Arun 10.5 0.0 0.1%Chichester 5.9 0.0 0.7%Crawley 10.5 0.0 0.3%Horsham 6.0 0.0 0.1%Mid Sussex 5.3 0.0 0.2%Worthing 7.9 0.0 0.1%
367

Formula Grant Before Floor DampingLocal Authority
(£ million) (£ million) (%)
Difference from Indicative
Allocations
2010-11 Indicative
AllocationsOption DATA2
WORCESTERSHIREBromsgrove 5.2 0.0 -0.4%Malvern Hills 5.2 0.0 0.1%Redditch 6.4 0.0 -0.3%Worcester 7.8 0.0 -0.1%Wychavon 8.0 0.0 -0.1%Wyre Forest 8.1 0.0 -0.1%
368

Formula Grant Before Floor DampingLocal Authority
(£ million) (£ million) (%)
Difference from Indicative
Allocations
2010-11 Indicative
AllocationsOption DATA2
SHIRE POLICE AUTHORITIES
Avon & Somerset Police 197.6 -0.5 -0.2%Bedfordshire Police 76.6 -0.2 -0.2%Cambridgeshire Police 86.2 -0.3 -0.4%Cheshire Police 114.1 -0.3 -0.3%Cleveland Police 99.0 0.1 0.1%
Cumbria Police 56.1 -0.2 -0.4%Derbyshire Police 120.7 -0.4 -0.4%Devon & Cornwall Police 191.7 -0.6 -0.3%Dorset Police 64.3 -0.3 -0.4%Durham Police 87.0 -0.1 -0.1%
Essex Police 187.3 -0.5 -0.3%Gloucestershire Police 58.5 -0.2 -0.4%Hampshire Police 215.0 -0.5 -0.3%Hertfordshire Police 128.9 -0.1 -0.1%Humberside Police 132.9 -0.2 -0.2%
Kent Police 200.2 -0.4 -0.2%Lancashire Police 212.3 -0.3 -0.1%Leicestershire Police 124.2 -0.3 -0.3%Lincolnshire Police 69.0 -0.5 -0.7%Norfolk Police 88.5 -0.5 -0.5%
North Yorkshire Police 73.1 -0.4 -0.6%Northamptonshire Police 78.4 -0.3 -0.4%Nottinghamshire Police 152.7 -0.3 -0.2%Staffordshire Police 125.1 -0.4 -0.3%Suffolk Police 71.0 -0.4 -0.5%
Surrey Police 101.3 -0.2 -0.2%Sussex Police 167.1 -0.4 -0.2%Thames Valley Police 248.5 -0.4 -0.2%Warwickshire Police 56.1 -0.2 -0.4%West Mercia Police 114.3 -0.6 -0.6%
Wiltshire Police 64.1 -0.3 -0.4%
369

Formula Grant Before Floor DampingLocal Authority
(£ million) (£ million) (%)
Difference from Indicative
Allocations
2010-11 Indicative
AllocationsOption DATA2
SHIRE FIRE AUTHORITIES
Avon Fire 24.6 -0.3 -1.2%Bedfordshire Fire 11.7 0.1 0.6%Berkshire Fire Auhtority 13.0 -0.1 -1.0%Buckinghamshire Fire 9.1 -0.3 -3.0%Cambridgeshire Fire 15.1 -0.3 -2.0%
Cheshire Fire 19.3 -0.8 -3.9%Cleveland Fire 21.7 -0.3 -1.2%Derbyshire Fire 20.6 -0.5 -2.6%Devon and Somerset Fire 32.1 -0.9 -2.7%Dorset Fire 11.1 -0.3 -2.3%
Durham Fire 14.9 -0.2 -1.6%East Sussex Fire 15.0 -0.1 -0.9%Essex Fire Auhtority 33.3 -0.3 -1.0%Hampshire Fire 29.9 -0.6 -2.1%Hereford & Worcester Fire 10.8 -0.3 -2.9%
Humberside Fire 28.2 -0.4 -1.3%Kent Fire 30.2 -0.3 -1.1%Lancashire Fire 32.6 -0.8 -2.6%Leicestershire Fire 19.2 -0.1 -0.4%North Yorkshire Fire 11.6 -0.7 -6.2%
Nottinghamshire Fire 26.3 -0.5 -1.7%Shropshire Fire 8.6 -0.2 -2.2%Staffordshire Fire 19.1 -0.5 -2.6%Wiltshire Fire 9.7 -0.3 -3.2%
370

371
Chapter 15 Student exemptions and the council taxbase Background 1. A local authority’s taxbase for Formula Grant purposes is a measure of its
potential capacity to raise council tax. It is defined as the number of Band D equivalent properties in a local authority’s area. With multi-year settlements, the taxbase is projected using a geometric mean of the two most recent year’s percentage increases for each billing authority to predict the taxbase for the following years.
2. The adjustment for student exemptions in the current calculation of the
taxbase projections uses an average of the number of Band D equivalent student homes based on data as at 31 May and early October.
Changes to the indicator
Use of May data only for the adjustment
3. Data on the number of student exempt properties as at the 31 May will better reflect the number of student exempt properties than may be shown by an early October count. This is because the data in October will be early into the academic year, and students may not have registered for council tax exemption at that point.
4. While there is a risk that using the May figure will overstate the level of student exemptions, as some properties may not be exempt from council tax for the entire year, Option DATA3 proposes that May data only is used in the adjustment.
Questions
Question 24: Would you prefer that May data only is used for the student exemptions adjustment in the taxbase projections (DATA3)?

Formula Grant Before Floor DampingLocal Authority
(£ million) (£ million) (%)
England 28,995.5 0.0 0.0%
London area 6,153.4 6.1 0.1%Metropolitan areas 8,340.7 -1.2 0.0%Shire areas 14,499.1 -4.9 0.0%Isles of Scilly 2.3 0.0 0.0%
Inner London boroughs incl. City 2,025.0 4.6 0.2%Outer London boroughs 1,873.1 0.7 0.0%London boroughs 3,898.1 5.3 0.1%GLA - all functions 2,255.3 0.8 0.0%
Metropolitan districts 5,904.0 -0.9 0.0%Metropolitan fire authorities 335.8 -0.1 0.0%Metropolitan police authorities 2,100.9 -0.2 0.0%
Shire unitaries with fire 425.6 -0.3 -0.1%Shire unitaries without fire 4,099.3 -0.4 0.0%Shire counties with fire 1,589.0 -1.2 -0.1%Shire counties without fire 2,501.9 -2.5 -0.1%Shire districts 1,654.0 0.1 0.0%Combined fire authorities 467.7 -0.1 0.0%Shire police authorities 3,761.6 -0.3 0.0%
GO REGIONAL SUMMARY
South West GOR 2,267.3 -0.8 0.0%South East GOR 2,957.0 -0.2 0.0%London GOR 6,153.4 6.1 0.1%Eastern GOR 2,437.8 -0.1 0.0%East Midlands GOR 2,292.2 -1.4 -0.1%West Midlands GOR 3,349.9 -1.0 0.0%Yorkshire and Humber GOR 3,199.2 -1.5 0.0%North East GOR 1,777.2 -0.6 0.0%North West GOR 4,561.4 -0.4 0.0%
FLOOR DAMPING GROUPS
Education Authorities 18,418.0 -0.2 0.0%Police Authorities 7,864.8 0.1 0.0%Fire Authorities 1,056.5 0.0 0.0%Shire Districts 1,654.0 0.1 0.0%
Data - Student Council Tax Exemptions
2010-11 Indicative Allocation
Difference from Indicative Allocation
Option DATA3
372

Local Authority
(£ million) (£ million) (%)
2010-11 Indicative Allocation
Difference from Indicative Allocation
Option DATA3
GREATER LONDON
City of London 91.1 0.1 0.1%
Camden 171.0 0.7 0.4%Greenwich 170.1 0.2 0.1%Hackney 201.8 0.3 0.1%Hammersmith and Fulham 94.3 0.4 0.4%Islington 133.8 -0.2 -0.1%Kensington and Chelsea 95.9 0.7 0.8%
Lambeth 180.3 0.3 0.2%Lewisham 174.9 0.0 0.0%Southwark 210.2 0.0 0.0%Tower Hamlets 224.3 0.6 0.3%Wandsworth 98.6 0.3 0.3%Westminster 178.8 1.2 0.7%
Barking and Dagenham 108.2 -0.2 -0.2%Barnet 97.9 0.2 0.2%Bexley 64.5 0.0 0.0%Brent 157.0 -0.1 -0.1%Bromley 45.7 0.0 -0.1%
Croydon 118.4 -0.1 -0.1%Ealing 129.0 -0.2 -0.1%Enfield 126.7 0.1 0.1%Haringey 137.6 0.3 0.2%Harrow 66.6 0.0 0.0%
Havering 52.3 -0.1 -0.1%Hillingdon 85.6 0.2 0.2%Hounslow 77.3 0.0 0.0%Kingston upon Thames 32.6 0.0 -0.1%Merton 61.2 -0.1 -0.1%
Newham 231.3 0.5 0.2%Redbridge 102.6 0.0 0.0%Richmond upon Thames 9.6 0.1 1.3%Sutton 45.1 0.0 0.0%Waltham Forest 124.0 0.1 0.1%
GLA - all functions 2,255.3 0.8 0.0%
GLA - police 2,002.3 0.6 0.0%GLA - fire 253.0 0.2 0.1%
373

Local Authority
(£ million) (£ million) (%)
2010-11 Indicative Allocation
Difference from Indicative Allocation
Option DATA3
GREATER MANCHESTERBolton 132.6 0.0 0.0%Bury 67.5 -0.1 -0.1%Manchester 346.1 1.0 0.3%Oldham 127.6 -0.1 -0.1%Rochdale 114.9 -0.1 -0.1%Salford 131.2 0.0 0.0%Stockport 85.2 -0.1 -0.1%Tameside 109.5 -0.1 -0.1%Trafford 67.3 0.0 0.0%Wigan 138.6 -0.1 -0.1%Greater Manchester Fire 76.1 0.0 0.0%Greater Manchester Police 485.7 0.0 0.0%
MERSEYSIDEKnowsley 114.6 -0.1 -0.1%Liverpool 318.0 0.1 0.0%Sefton 127.6 -0.1 -0.1%St Helens 90.9 -0.1 -0.1%Wirral 165.2 -0.1 -0.1%Merseyside Fire 46.1 0.0 0.0%Merseyside Police 275.5 0.0 0.0%
SOUTH YORKSHIREBarnsley 114.3 -0.1 -0.1%Doncaster 149.1 -0.1 -0.1%Rotherham 130.1 -0.1 -0.1%Sheffield 280.0 -0.2 -0.1%South Yorkshire Fire 37.4 0.0 -0.1%South Yorkshire Police 209.2 -0.1 0.0%
TYNE AND WEARGateshead 102.7 0.0 0.0%Newcastle upon Tyne 157.2 0.1 0.1%North Tyneside 87.4 0.0 0.0%South Tyneside 89.3 -0.1 -0.1%Sunderland 158.9 -0.1 0.0%Tyne and Wear Fire 35.9 0.0 0.0%Northumbria Police 219.9 0.0 0.0%
WEST MIDLANDSBirmingham 698.9 0.5 0.1%Coventry 156.6 0.0 0.0%Dudley 130.4 -0.1 -0.1%Sandwell 190.3 -0.1 0.0%Solihull 49.1 -0.1 -0.1%Walsall 142.3 -0.1 -0.1%Wolverhampton 145.6 0.0 0.0%West Midlands Fire 81.6 0.0 0.0%West Midlands Police 542.2 0.0 0.0%
WEST YORKSHIREBradford 283.4 -0.1 0.0%Calderdale 84.1 -0.1 -0.1%Kirklees 164.9 0.0 0.0%Leeds 305.9 -0.3 -0.1%Wakefield 146.7 -0.1 -0.1%West Yorkshire Fire 58.7 0.0 -0.1%West Yorkshire Police 368.2 -0.1 0.0%
374

Local Authority
(£ million) (£ million) (%)
2010-11 Indicative Allocation
Difference from Indicative Allocation
Option DATA3
ALL PURPOSE AUTHORITIES
Bath & North East Somerset 44.1 0.1 0.3%Bedford 55.4 0.0 0.0%Blackburn with Darwen 88.5 0.0 0.0%Blackpool 86.9 0.0 0.0%Bournemouth 49.4 0.2 0.5%
Bracknell Forest 22.6 0.0 -0.1%Brighton & Hove 89.8 0.8 0.8%Bristol 171.2 0.1 0.1%Central Bedfordshire 51.9 -0.1 -0.2%Cheshire East 64.5 -0.1 -0.1%
Cheshire West & Chester 94.9 -0.1 -0.1%Cornwall 227.6 -0.2 -0.1%Darlington 40.1 0.0 -0.1%Derby 114.5 0.0 0.0%Durham 238.7 -0.2 -0.1%
East Riding of Yorkshire 109.2 -0.1 -0.1%Halton 65.5 0.0 -0.1%Hartlepool 54.0 0.0 -0.1%Herefordshire 61.2 -0.1 -0.1%Isle of Wight Council 65.0 0.0 -0.1%
Kingston upon Hull 159.2 0.0 0.0%Leicester 188.4 0.0 0.0%Luton 94.6 0.2 0.2%Medway 89.5 0.0 0.0%Middlesbrough 85.4 0.0 0.0%
Milton Keynes 91.6 -0.1 -0.1%North East Lincolnshire 76.9 0.0 -0.1%North Lincolnshire 66.3 -0.1 -0.1%North Somerset 54.6 -0.1 -0.1%Northumberland 133.1 -0.1 -0.1%
Nottingham 179.5 -0.1 -0.1%Peterborough 80.9 -0.1 -0.1%Plymouth 108.7 -0.1 -0.1%Poole 25.6 0.0 0.0%Portsmouth 87.8 0.1 0.1%
Reading 48.0 0.1 0.2%Redcar and Cleveland 71.4 -0.1 -0.1%Rutland 8.6 0.0 -0.2%Shropshire 97.4 -0.1 -0.1%Slough 52.8 0.0 -0.1%
South Gloucestershire 64.0 0.0 -0.1%Southampton 101.2 -0.1 -0.1%Southend-on-Sea 62.3 0.0 -0.1%Stockton-on-Tees 80.6 0.0 0.0%Stoke-on-Trent 133.5 -0.1 -0.1%
Swindon 43.7 0.0 -0.1%Telford and the Wrekin 76.0 -0.1 -0.1%Thurrock 62.1 0.0 -0.1%Torbay 64.2 -0.1 -0.1%Warrington 52.7 -0.1 -0.1%
375

Local Authority
(£ million) (£ million) (%)
2010-11 Indicative Allocation
Difference from Indicative Allocation
Option DATA3
West Berkshire 23.1 0.0 -0.2%Wiltshire 102.1 -0.2 -0.1%Windsor and Maidenhead 10.1 0.0 -0.3%Wokingham 8.4 0.0 -0.2%York 45.8 0.2 0.4%
Isles of Scilly 2.3 0.0 0.0%
376

Local Authority
(£ million) (£ million) (%)
2010-11 Indicative Allocation
Difference from Indicative Allocation
Option DATA3
SHIRE COUNTIES
Buckinghamshire 43.5 -0.1 -0.2%Cambridgeshire 113.1 0.2 0.1%Cumbria 157.5 -0.1 -0.1%Derbyshire 204.0 -0.2 -0.1%Devon 176.4 -0.2 -0.1%
Dorset 57.6 -0.1 -0.2%East Sussex 105.4 -0.1 -0.1%Essex 258.3 -0.2 -0.1%Gloucestershire 124.0 -0.2 -0.1%Hampshire 126.6 -0.3 -0.2%
Hertfordshire 148.3 0.2 0.1%Kent 287.9 -0.4 -0.1%Lancashire 328.9 -0.2 -0.1%Leicestershire 107.5 -0.1 -0.1%Lincolnshire 210.6 -0.2 -0.1%
Norfolk 260.4 -0.1 -0.1%North Yorkshire 113.7 -0.1 -0.1%Northamptonshire 162.2 -0.2 -0.1%Nottinghamshire 191.6 -0.1 -0.1%Oxfordshire 99.8 0.2 0.2%
Somerset 120.7 -0.2 -0.1%Staffordshire 169.7 -0.3 -0.2%Suffolk 181.0 -0.2 -0.1%Surrey 60.1 -0.2 -0.3%Warwickshire 96.6 -0.2 -0.2%
West Sussex 88.4 -0.2 -0.2%Worcestershire 96.9 -0.2 -0.2%
377
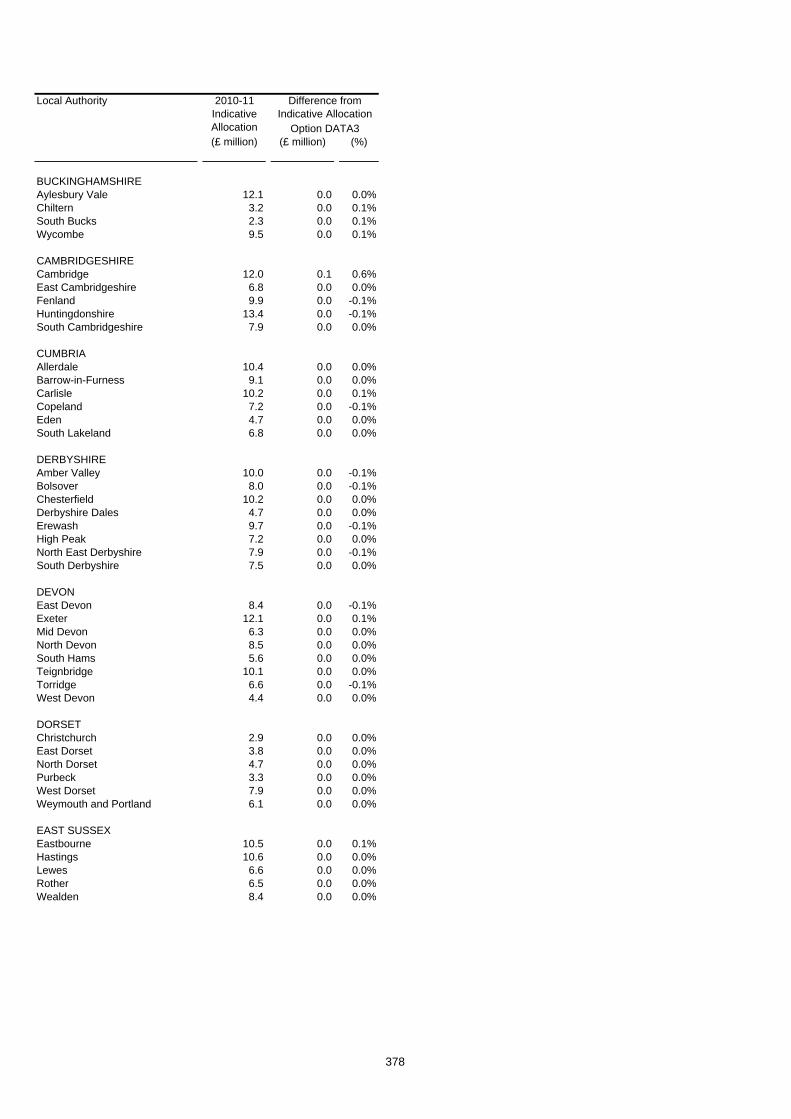
Local Authority
(£ million) (£ million) (%)
2010-11 Indicative Allocation
Difference from Indicative Allocation
Option DATA3
BUCKINGHAMSHIREAylesbury Vale 12.1 0.0 0.0%Chiltern 3.2 0.0 0.1%South Bucks 2.3 0.0 0.1%Wycombe 9.5 0.0 0.1%
CAMBRIDGESHIRECambridge 12.0 0.1 0.6%East Cambridgeshire 6.8 0.0 0.0%Fenland 9.9 0.0 -0.1%Huntingdonshire 13.4 0.0 -0.1%South Cambridgeshire 7.9 0.0 0.0%
CUMBRIAAllerdale 10.4 0.0 0.0%Barrow-in-Furness 9.1 0.0 0.0%Carlisle 10.2 0.0 0.1%Copeland 7.2 0.0 -0.1%Eden 4.7 0.0 0.0%South Lakeland 6.8 0.0 0.0%
DERBYSHIREAmber Valley 10.0 0.0 -0.1%Bolsover 8.0 0.0 -0.1%Chesterfield 10.2 0.0 0.0%Derbyshire Dales 4.7 0.0 0.0%Erewash 9.7 0.0 -0.1%High Peak 7.2 0.0 0.0%North East Derbyshire 7.9 0.0 -0.1%South Derbyshire 7.5 0.0 0.0%
DEVONEast Devon 8.4 0.0 -0.1%Exeter 12.1 0.0 0.1%Mid Devon 6.3 0.0 0.0%North Devon 8.5 0.0 0.0%South Hams 5.6 0.0 0.0%Teignbridge 10.1 0.0 0.0%Torridge 6.6 0.0 -0.1%West Devon 4.4 0.0 0.0%
DORSETChristchurch 2.9 0.0 0.0%East Dorset 3.8 0.0 0.0%North Dorset 4.7 0.0 0.0%Purbeck 3.3 0.0 0.0%West Dorset 7.9 0.0 0.0%Weymouth and Portland 6.1 0.0 0.0%
EAST SUSSEXEastbourne 10.5 0.0 0.1%Hastings 10.6 0.0 0.0%Lewes 6.6 0.0 0.0%Rother 6.5 0.0 0.0%Wealden 8.4 0.0 0.0%
378

Local Authority
(£ million) (£ million) (%)
2010-11 Indicative Allocation
Difference from Indicative Allocation
Option DATA3
ESSEXBasildon 16.1 0.0 0.0%Braintree 10.6 0.0 -0.1%Brentwood 4.4 0.0 0.0%Castle Point 6.8 0.0 -0.1%Chelmsford 10.7 0.0 0.0%Colchester 13.1 0.0 0.3%Epping Forest 9.4 0.0 0.1%Harlow 8.2 0.0 0.0%Maldon 4.6 0.0 0.0%Rochford 5.2 0.0 0.0%Tendring 14.6 0.0 -0.1%Uttlesford 3.9 0.0 0.0%
GLOUCESTERSHIRECheltenham 8.7 0.0 0.0%Cotswold 5.5 0.0 0.0%Forest of Dean 7.0 0.0 -0.1%Gloucester 10.8 0.0 0.0%Stroud 7.3 0.0 0.0%Tewkesbury 5.4 0.0 0.0%
HAMPSHIREBasingstoke and Deane 10.3 0.0 0.0%East Hampshire 5.9 0.0 0.0%Eastleigh 7.8 0.0 0.0%Fareham 6.1 0.0 0.0%Gosport 7.1 0.0 0.0%Hart 3.9 0.0 0.0%Havant 9.9 0.0 0.0%New Forest 11.8 0.0 0.0%Rushmoor 6.3 0.0 0.0%Test Valley 7.3 0.0 0.0%Winchester 6.7 0.0 0.4%
HERTFORDSHIREBroxbourne 7.0 0.0 0.0%Dacorum 9.5 0.0 0.0%East Hertfordshire 8.1 0.0 0.0%Hertsmere 6.8 0.0 0.1%North Hertfordshire 8.3 0.0 0.0%St Albans 7.0 0.0 0.1%Stevenage 7.6 0.0 0.0%Three Rivers 5.1 0.0 0.0%Watford 7.2 0.0 0.0%Welwyn Hatfield 8.2 0.1 1.1%
KENTAshford 8.6 0.0 0.0%Canterbury 13.6 0.0 -0.1%Dartford 7.6 0.0 0.0%Dover 9.9 0.0 0.0%Gravesham 8.5 0.0 0.0%Maidstone 9.0 0.0 0.1%Sevenoaks 6.1 0.0 0.0%Shepway 10.1 0.0 0.0%Swale 12.2 0.0 0.0%Thanet 13.4 0.0 0.0%Tonbridge and Malling 6.5 0.0 0.0%Tunbridge Wells 6.5 0.0 0.0%
379
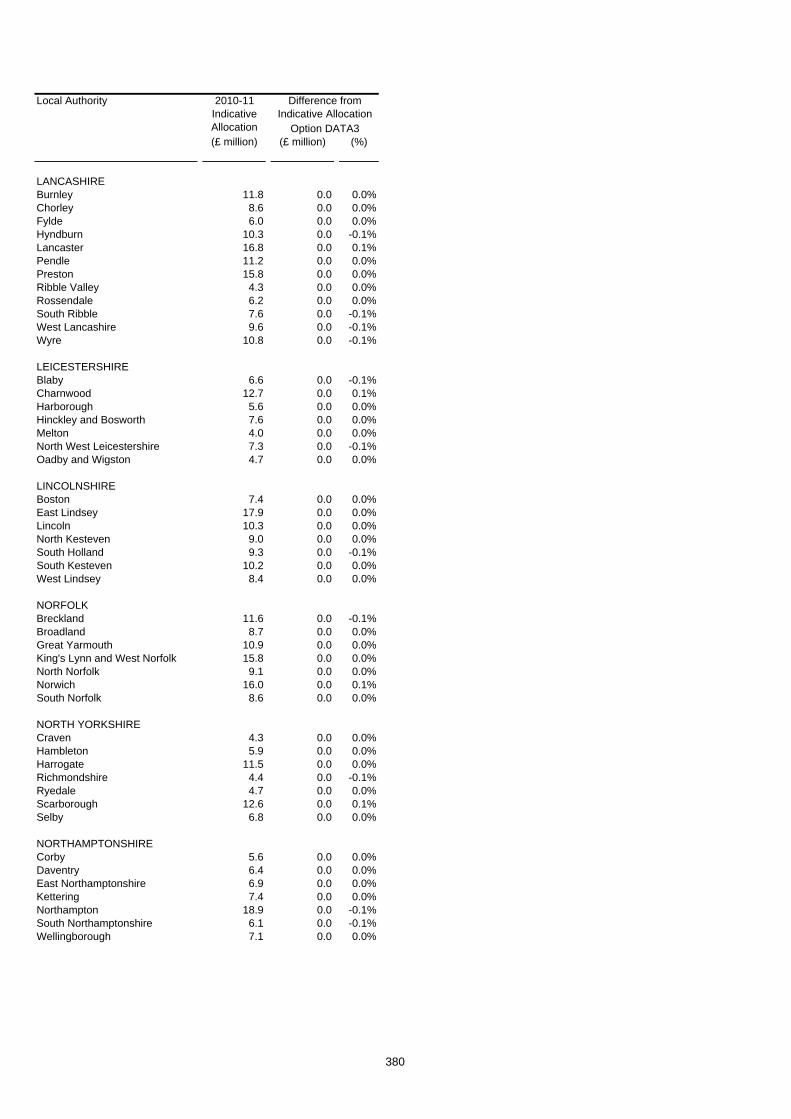
Local Authority
(£ million) (£ million) (%)
2010-11 Indicative Allocation
Difference from Indicative Allocation
Option DATA3
LANCASHIREBurnley 11.8 0.0 0.0%Chorley 8.6 0.0 0.0%Fylde 6.0 0.0 0.0%Hyndburn 10.3 0.0 -0.1%Lancaster 16.8 0.0 0.1%Pendle 11.2 0.0 0.0%Preston 15.8 0.0 0.0%Ribble Valley 4.3 0.0 0.0%Rossendale 6.2 0.0 0.0%South Ribble 7.6 0.0 -0.1%West Lancashire 9.6 0.0 -0.1%Wyre 10.8 0.0 -0.1%
LEICESTERSHIREBlaby 6.6 0.0 -0.1%Charnwood 12.7 0.0 0.1%Harborough 5.6 0.0 0.0%Hinckley and Bosworth 7.6 0.0 0.0%Melton 4.0 0.0 0.0%North West Leicestershire 7.3 0.0 -0.1%Oadby and Wigston 4.7 0.0 0.0%
LINCOLNSHIREBoston 7.4 0.0 0.0%East Lindsey 17.9 0.0 0.0%Lincoln 10.3 0.0 0.0%North Kesteven 9.0 0.0 0.0%South Holland 9.3 0.0 -0.1%South Kesteven 10.2 0.0 0.0%West Lindsey 8.4 0.0 0.0%
NORFOLKBreckland 11.6 0.0 -0.1%Broadland 8.7 0.0 0.0%Great Yarmouth 10.9 0.0 0.0%King's Lynn and West Norfolk 15.8 0.0 0.0%North Norfolk 9.1 0.0 0.0%Norwich 16.0 0.0 0.1%South Norfolk 8.6 0.0 0.0%
NORTH YORKSHIRECraven 4.3 0.0 0.0%Hambleton 5.9 0.0 0.0%Harrogate 11.5 0.0 0.0%Richmondshire 4.4 0.0 -0.1%Ryedale 4.7 0.0 0.0%Scarborough 12.6 0.0 0.1%Selby 6.8 0.0 0.0%
NORTHAMPTONSHIRECorby 5.6 0.0 0.0%Daventry 6.4 0.0 0.0%East Northamptonshire 6.9 0.0 0.0%Kettering 7.4 0.0 0.0%Northampton 18.9 0.0 -0.1%South Northamptonshire 6.1 0.0 -0.1%Wellingborough 7.1 0.0 0.0%
380
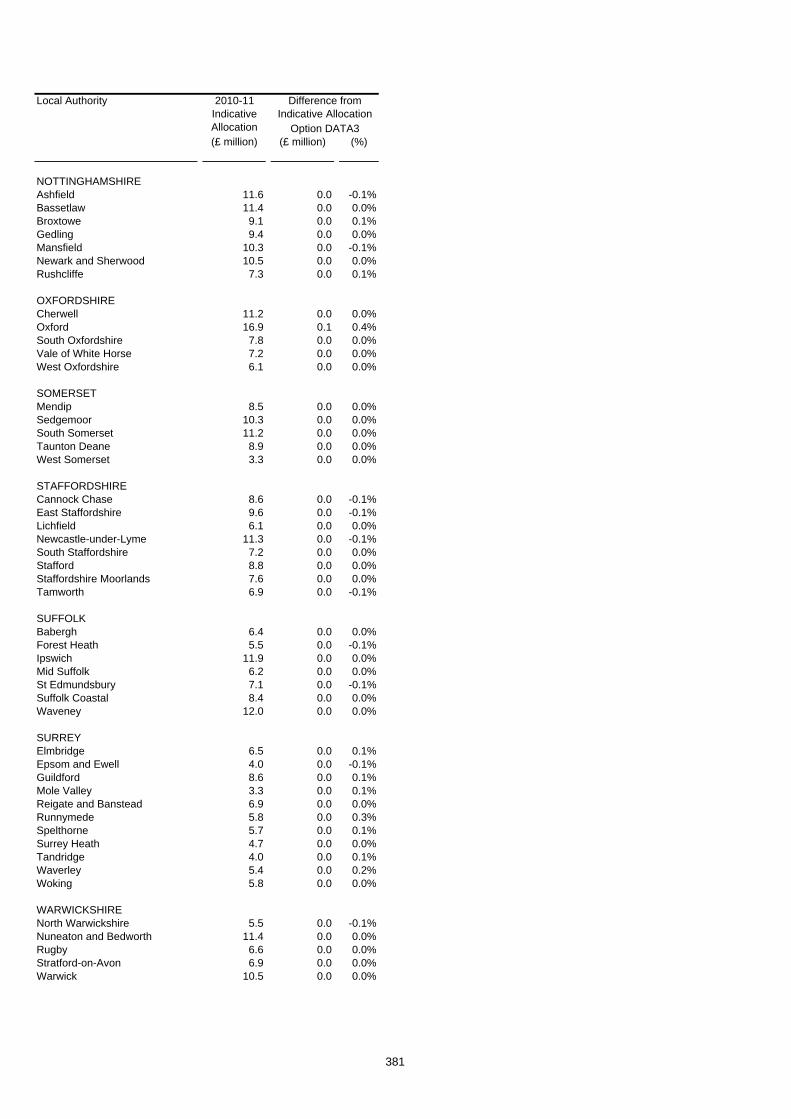
Local Authority
(£ million) (£ million) (%)
2010-11 Indicative Allocation
Difference from Indicative Allocation
Option DATA3
NOTTINGHAMSHIREAshfield 11.6 0.0 -0.1%Bassetlaw 11.4 0.0 0.0%Broxtowe 9.1 0.0 0.1%Gedling 9.4 0.0 0.0%Mansfield 10.3 0.0 -0.1%Newark and Sherwood 10.5 0.0 0.0%Rushcliffe 7.3 0.0 0.1%
OXFORDSHIRECherwell 11.2 0.0 0.0%Oxford 16.9 0.1 0.4%South Oxfordshire 7.8 0.0 0.0%Vale of White Horse 7.2 0.0 0.0%West Oxfordshire 6.1 0.0 0.0%
SOMERSETMendip 8.5 0.0 0.0%Sedgemoor 10.3 0.0 0.0%South Somerset 11.2 0.0 0.0%Taunton Deane 8.9 0.0 0.0%West Somerset 3.3 0.0 0.0%
STAFFORDSHIRECannock Chase 8.6 0.0 -0.1%East Staffordshire 9.6 0.0 -0.1%Lichfield 6.1 0.0 0.0%Newcastle-under-Lyme 11.3 0.0 -0.1%South Staffordshire 7.2 0.0 0.0%Stafford 8.8 0.0 0.0%Staffordshire Moorlands 7.6 0.0 0.0%Tamworth 6.9 0.0 -0.1%
SUFFOLKBabergh 6.4 0.0 0.0%Forest Heath 5.5 0.0 -0.1%Ipswich 11.9 0.0 0.0%Mid Suffolk 6.2 0.0 0.0%St Edmundsbury 7.1 0.0 -0.1%Suffolk Coastal 8.4 0.0 0.0%Waveney 12.0 0.0 0.0%
SURREYElmbridge 6.5 0.0 0.1%Epsom and Ewell 4.0 0.0 -0.1%Guildford 8.6 0.0 0.1%Mole Valley 3.3 0.0 0.1%Reigate and Banstead 6.9 0.0 0.0%Runnymede 5.8 0.0 0.3%Spelthorne 5.7 0.0 0.1%Surrey Heath 4.7 0.0 0.0%Tandridge 4.0 0.0 0.1%Waverley 5.4 0.0 0.2%Woking 5.8 0.0 0.0%
WARWICKSHIRENorth Warwickshire 5.5 0.0 -0.1%Nuneaton and Bedworth 11.4 0.0 0.0%Rugby 6.6 0.0 0.0%Stratford-on-Avon 6.9 0.0 0.0%Warwick 10.5 0.0 0.0%
381
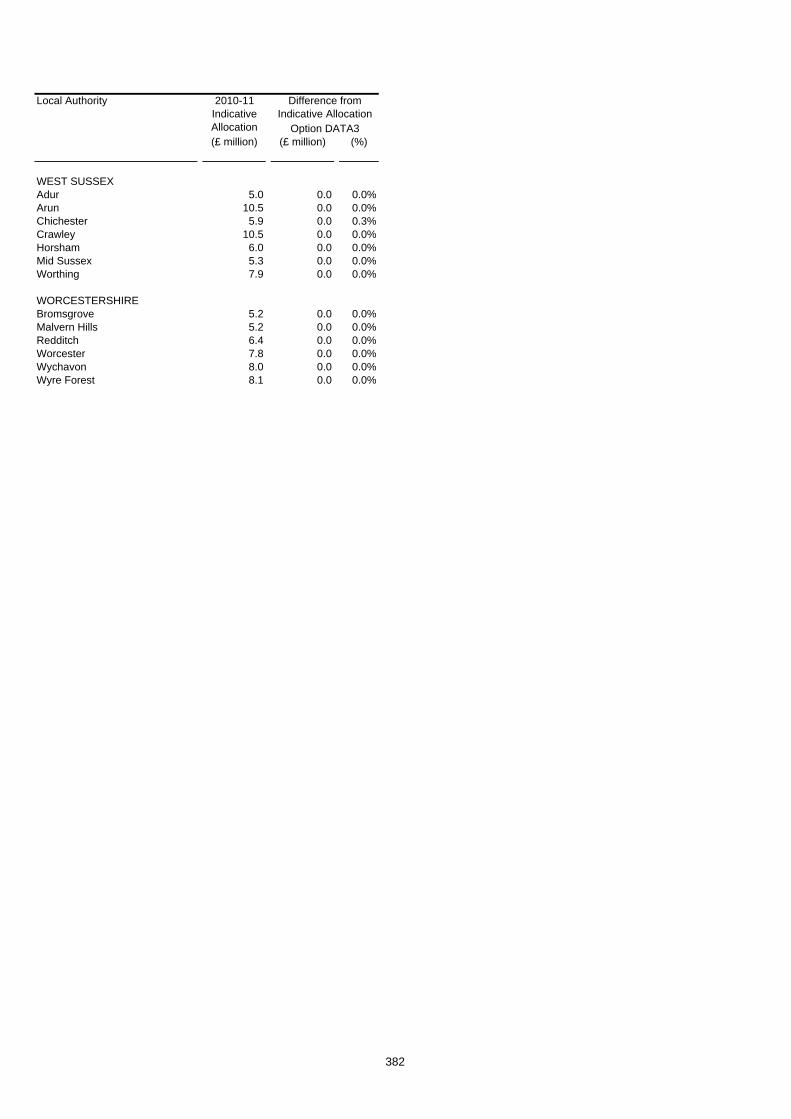
Local Authority
(£ million) (£ million) (%)
2010-11 Indicative Allocation
Difference from Indicative Allocation
Option DATA3
WEST SUSSEXAdur 5.0 0.0 0.0%Arun 10.5 0.0 0.0%Chichester 5.9 0.0 0.3%Crawley 10.5 0.0 0.0%Horsham 6.0 0.0 0.0%Mid Sussex 5.3 0.0 0.0%Worthing 7.9 0.0 0.0%
WORCESTERSHIREBromsgrove 5.2 0.0 0.0%Malvern Hills 5.2 0.0 0.0%Redditch 6.4 0.0 0.0%Worcester 7.8 0.0 0.0%Wychavon 8.0 0.0 0.0%Wyre Forest 8.1 0.0 0.0%
382
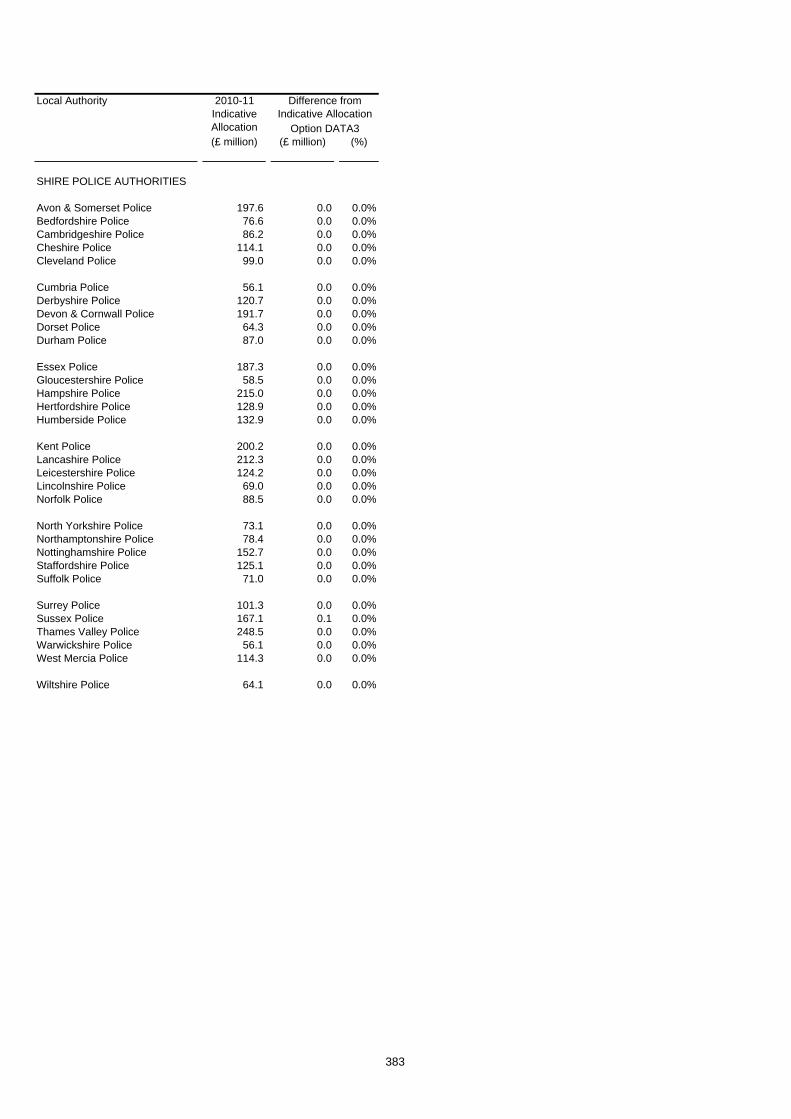
Local Authority
(£ million) (£ million) (%)
2010-11 Indicative Allocation
Difference from Indicative Allocation
Option DATA3
SHIRE POLICE AUTHORITIES
Avon & Somerset Police 197.6 0.0 0.0%Bedfordshire Police 76.6 0.0 0.0%Cambridgeshire Police 86.2 0.0 0.0%Cheshire Police 114.1 0.0 0.0%Cleveland Police 99.0 0.0 0.0%
Cumbria Police 56.1 0.0 0.0%Derbyshire Police 120.7 0.0 0.0%Devon & Cornwall Police 191.7 0.0 0.0%Dorset Police 64.3 0.0 0.0%Durham Police 87.0 0.0 0.0%
Essex Police 187.3 0.0 0.0%Gloucestershire Police 58.5 0.0 0.0%Hampshire Police 215.0 0.0 0.0%Hertfordshire Police 128.9 0.0 0.0%Humberside Police 132.9 0.0 0.0%
Kent Police 200.2 0.0 0.0%Lancashire Police 212.3 0.0 0.0%Leicestershire Police 124.2 0.0 0.0%Lincolnshire Police 69.0 0.0 0.0%Norfolk Police 88.5 0.0 0.0%
North Yorkshire Police 73.1 0.0 0.0%Northamptonshire Police 78.4 0.0 0.0%Nottinghamshire Police 152.7 0.0 0.0%Staffordshire Police 125.1 0.0 0.0%Suffolk Police 71.0 0.0 0.0%
Surrey Police 101.3 0.0 0.0%Sussex Police 167.1 0.1 0.0%Thames Valley Police 248.5 0.0 0.0%Warwickshire Police 56.1 0.0 0.0%West Mercia Police 114.3 0.0 0.0%
Wiltshire Police 64.1 0.0 0.0%
383

Local Authority
(£ million) (£ million) (%)
2010-11 Indicative Allocation
Difference from Indicative Allocation
Option DATA3
SHIRE FIRE AUTHORITIES
Avon Fire 24.6 0.0 0.0%Bedfordshire Fire 11.7 0.0 0.0%Berkshire Fire Auhtority 13.0 0.0 0.0%Buckinghamshire Fire 9.1 0.0 0.0%Cambridgeshire Fire 15.1 0.0 0.0%
Cheshire Fire 19.3 0.0 0.0%Cleveland Fire 21.7 0.0 0.0%Derbyshire Fire 20.6 0.0 -0.1%Devon and Somerset Fire 32.1 0.0 -0.1%Dorset Fire 11.1 0.0 0.1%
Durham Fire 14.9 0.0 -0.1%East Sussex Fire 15.0 0.0 0.2%Essex Fire Auhtority 33.3 0.0 0.0%Hampshire Fire 29.9 0.0 0.0%Hereford & Worcester Fire 10.8 0.0 -0.1%
Humberside Fire 28.2 0.0 0.0%Kent Fire 30.2 0.0 0.0%Lancashire Fire 32.6 0.0 -0.1%Leicestershire Fire 19.2 0.0 0.0%North Yorkshire Fire 11.6 0.0 0.0%
Nottinghamshire Fire 26.3 0.0 -0.1%Shropshire Fire 8.6 0.0 -0.1%Staffordshire Fire 19.1 0.0 -0.1%Wiltshire Fire 9.7 0.0 -0.1%
384

385
Chapter 16 The secondary school pupils in low achieving ethnic groups indicator Background 1. The current indicator of secondary school pupils in low achieving ethnic
groups indicator is used in the Youth and Community sub-block relative needs formula, which is within the Children’s Services block.
2. The current formula is as follows:
Basic amount
YOUTH AND
COMMUNITY BASIC AMOUNT
15.9208
Top-ups
YOUTH AND
COMMUNITY DEPRIVATION TOP-UP
59.9763 multiplied by CHILDREN OF INCOME SUPPORT /INCOME
BASED JOBSEEKER’S ALLOWANCE CLAIMANTS ABOVE THRESHOLD
YOUTH AND
COMMUNITY ETHNICITY TOP-UP
17.4653 multiplied by SECONDARY SCHOOL PUPILS IN LOW
ACHIEVING ETHNIC GROUPS ABOVE THRESHOLD
The full formula used to calculate the Youth and Community element is:
Youth and Community
(a) PROJECTED POPULATION AGED 13 TO 19 IN 2010 multiplied by the result of: YOUTH AND COMMUNITY BASIC AMOUNT; plus YOUTH AND COMMUNITY DEPRIVATION TOP-UP; plus YOUTH AND COMMUNITY ETHNICITY TOP-UP
(b) The result of (a) is multiplied by AREA COST ADJUSTMENT FOR EDUCATION;
(c) The result of (b) is then multiplied by the scaling factor given in Annex F for the Youth and Community Services sub-block.
(d) The result of (c) is then divided by 10,000,000,000.

386
Changes to the indicator
3. The current formula was introduced in 2003-04 and the definition of the secondary school pupils in low achieving ethnic groups indicator has been
“The number of pupils in secondary schools who are from ethnic groups which are considered by the Secretary of State for Children, Schools and Families to be low achieving divided by the number of pupils in secondary schools who had an ethnic group recorded.”
4. The low achieving ethnic groups comprised the following ethnic categories
a. Pakistani b. Bangladeshi c. Black African d. Black Caribbean e. Any ‘Other Black’ Background f. White and Black African g. White and Black Caribbean h. Traveller of Irish Heritage i. Any ‘Other ethnic’ background j. Gypsy / Roma
Option DATA4
5. The Department for Education have updated the definition of low achieving ethnic groups based on analysis of pupil attainment and progress data The low achieving ethnic groups now include:
a. Pakistani b. Black African c. Black Caribbean d. Any Other Black Background e. White and Black African f. White and Black Caribbean g. Traveller of Irish Heritage h. Any Other White Background i. Gypsy / Roma
6. This definition differs from that used in the current formula by the addition
of pupils who are in the Any ‘Other White’ Background group and the exclusion of the pupils who are in the Bangladeshi and Any ‘Other Ethnic’ background groups. This is based on an analysis of achievement and attainment data.
7. We would like to update the definition of low achieving ethnic groups in the 2011-12 settlement onwards.
8. The new basic amount and top-ups for Option DATA4 are given below:

387
Basic amount
YOUTH AND
COMMUNITY BASIC AMOUNT
15.9900
Top-ups
YOUTH AND
COMMUNITY DEPRIVATION TOP-UP
59.9763 multiplied by CHILDREN OF INCOME SUPPORT /INCOME
BASED JOBSEEKER’S ALLOWANCE CLAIMANTS ABOVE THRESHOLD
YOUTH AND
COMMUNITY ETHNICITY TOP-UP
15.3407 multiplied by SECONDARY SCHOOL PUPILS IN LOW
ACHIEVING ETHNIC GROUPS ABOVE THRESHOLD
Questions
Question 25: Do you agree that the new definition of secondary school pupils in low achieving ethnic groups should be used (DATA4)?

Formula Grant Before Floor DampingLocal Authority
(£ million) (£ million) (%)
England 28,995.5 0.0 0.0%
London area 6,153.4 -2.9 0.0%Metropolitan areas 8,340.7 -0.7 0.0%Shire areas 14,499.1 3.6 0.0%Isles of Scilly 2.3 0.0 0.0%
Inner London boroughs incl. City 2,025.0 -2.7 -0.1%Outer London boroughs 1,873.1 -0.3 0.0%London boroughs 3,898.1 -3.0 -0.1%GLA - all functions 2,255.3 0.1 0.0%
Metropolitan districts 5,904.0 -0.8 0.0%Metropolitan fire authorities 335.8 0.0 0.0%Metropolitan police authorities 2,100.9 0.0 0.0%
Shire unitaries with fire 425.6 0.1 0.0%Shire unitaries without fire 4,099.3 1.1 0.0%Shire counties with fire 1,589.0 1.4 0.1%Shire counties without fire 2,501.9 1.2 0.0%Shire districts 1,654.0 0.0 0.0%Combined fire authorities 467.7 0.0 0.0%Shire police authorities 3,761.6 -0.1 0.0%
GO REGIONAL SUMMARY
South West GOR 2,267.3 0.7 0.0%South East GOR 2,957.0 1.3 0.0%London GOR 6,153.4 -2.9 0.0%Eastern GOR 2,437.8 0.9 0.0%East Midlands GOR 2,292.2 0.3 0.0%West Midlands GOR 3,349.9 -0.4 0.0%Yorkshire and Humber GOR 3,199.2 0.1 0.0%North East GOR 1,777.2 0.0 0.0%North West GOR 4,561.4 0.0 0.0%
FLOOR DAMPING GROUPS
Education Authorities 18,418.0 0.0 0.0%Police Authorities 7,864.8 0.0 0.0%Fire Authorities 1,056.5 0.0 0.0%Shire Districts 1,654.0 0.0 0.0%
Data: Update Low Achieving Ethnic Groups
Difference from Indicative Allocations
2010-11 Indicative
Allocations Option DATA4
388

Formula Grant Before Floor DampingLocal Authority
(£ million) (£ million) (%)
Difference from Indicative Allocations
2010-11 Indicative
Allocations Option DATA4
GREATER LONDON
City of London 91.1 0.0 0.0%
Camden 171.0 -0.1 -0.1%Greenwich 170.1 0.0 0.0%Hackney 201.8 -0.1 -0.1%Hammersmith and Fulham 94.3 0.0 0.0%Islington 133.8 -0.2 -0.1%Kensington and Chelsea 95.9 -0.1 -0.1%
Lambeth 180.3 -0.1 0.0%Lewisham 174.9 -0.1 -0.1%Southwark 210.2 -0.3 -0.1%Tower Hamlets 224.3 -1.3 -0.6%Wandsworth 98.6 -0.1 -0.1%Westminster 178.8 -0.3 -0.2%
Barking and Dagenham 108.2 0.1 0.1%Barnet 97.9 0.1 0.1%Bexley 64.5 0.0 0.0%Brent 157.0 -0.1 0.0%Bromley 45.7 0.0 0.0%
Croydon 118.4 -0.1 -0.1%Ealing 129.0 -0.1 -0.1%Enfield 126.7 0.3 0.3%Haringey 137.6 0.1 0.0%Harrow 66.6 0.0 -0.1%
Havering 52.3 0.0 0.1%Hillingdon 85.6 0.0 -0.1%Hounslow 77.3 -0.1 -0.2%Kingston upon Thames 32.6 0.0 0.0%Merton 61.2 0.0 0.0%
Newham 231.3 -0.5 -0.2%Redbridge 102.6 0.0 0.0%Richmond upon Thames 9.6 0.0 0.3%Sutton 45.1 0.0 0.0%Waltham Forest 124.0 0.1 0.1%
GLA - all functions 2,255.3 0.1 0.0%
GLA - police 2,002.3 0.1 0.0%GLA - fire 253.0 0.0 0.0%
389

Formula Grant Before Floor DampingLocal Authority
(£ million) (£ million) (%)
Difference from Indicative Allocations
2010-11 Indicative
Allocations Option DATA4
GREATER MANCHESTERBolton 132.6 0.1 0.0%Bury 67.5 0.0 0.0%Manchester 346.1 -0.2 -0.1%Oldham 127.6 -0.1 -0.1%Rochdale 114.9 0.0 0.0%Salford 131.2 0.0 0.0%Stockport 85.2 0.0 0.0%Tameside 109.5 0.0 0.0%Trafford 67.3 0.0 0.0%Wigan 138.6 0.0 0.0%Greater Manchester Fire 76.1 0.0 0.0%Greater Manchester Police 485.7 0.0 0.0%
MERSEYSIDEKnowsley 114.6 0.0 0.0%Liverpool 318.0 0.0 0.0%Sefton 127.6 0.0 0.0%St Helens 90.9 0.0 0.0%Wirral 165.2 0.0 0.0%Merseyside Fire 46.1 0.0 0.0%Merseyside Police 275.5 0.0 0.0%
SOUTH YORKSHIREBarnsley 114.3 0.0 0.0%Doncaster 149.1 0.0 0.0%Rotherham 130.1 0.0 0.0%Sheffield 280.0 0.0 0.0%South Yorkshire Fire 37.4 0.0 0.0%South Yorkshire Police 209.2 0.0 0.0%
TYNE AND WEARGateshead 102.7 0.0 0.0%Newcastle upon Tyne 157.2 -0.1 -0.1%North Tyneside 87.4 0.0 0.0%South Tyneside 89.3 0.0 0.0%Sunderland 158.9 0.0 0.0%Tyne and Wear Fire 35.9 0.0 0.0%Northumbria Police 219.9 0.0 0.0%
WEST MIDLANDSBirmingham 698.9 -0.4 -0.1%Coventry 156.6 0.0 0.0%Dudley 130.4 0.0 0.0%Sandwell 190.3 -0.1 0.0%Solihull 49.1 0.0 0.0%Walsall 142.3 0.0 0.0%Wolverhampton 145.6 0.0 0.0%West Midlands Fire 81.6 0.0 0.0%West Midlands Police 542.2 0.0 0.0%
WEST YORKSHIREBradford 283.4 -0.2 -0.1%Calderdale 84.1 0.0 0.0%Kirklees 164.9 0.1 0.0%Leeds 305.9 0.0 0.0%Wakefield 146.7 0.0 0.0%West Yorkshire Fire 58.7 0.0 0.0%West Yorkshire Police 368.2 0.0 0.0%
390

Formula Grant Before Floor DampingLocal Authority
(£ million) (£ million) (%)
Difference from Indicative Allocations
2010-11 Indicative
Allocations Option DATA4
ALL PURPOSE AUTHORITIES
Bath & North East Somerset 44.1 0.0 0.0%Bedford 55.4 0.0 0.0%Blackburn with Darwen 88.5 0.0 0.0%Blackpool 86.9 0.0 0.0%Bournemouth 49.4 0.0 0.1%
Bracknell Forest 22.6 0.0 0.1%Brighton & Hove 89.8 0.0 0.0%Bristol 171.2 0.1 0.1%Central Bedfordshire 51.9 0.0 0.0%Cheshire East 64.5 0.0 0.1%
Cheshire West & Chester 94.9 0.0 0.0%Cornwall 227.6 0.1 0.0%Darlington 40.1 0.0 0.0%Derby 114.5 0.0 0.0%Durham 238.7 0.0 0.0%
East Riding of Yorkshire 109.2 0.0 0.0%Halton 65.5 0.0 0.0%Hartlepool 54.0 0.0 0.0%Herefordshire 61.2 0.0 0.0%Isle of Wight Council 65.0 0.0 0.0%
Kingston upon Hull 159.2 0.0 0.0%Leicester 188.4 0.0 0.0%Luton 94.6 -0.1 -0.1%Medway 89.5 0.0 0.0%Middlesbrough 85.4 0.0 0.0%
Milton Keynes 91.6 0.0 0.0%North East Lincolnshire 76.9 0.0 0.0%North Lincolnshire 66.3 0.0 0.0%North Somerset 54.6 0.0 0.0%Northumberland 133.1 0.0 0.0%
Nottingham 179.5 0.1 0.0%Peterborough 80.9 0.1 0.1%Plymouth 108.7 0.0 0.0%Poole 25.6 0.0 0.0%Portsmouth 87.8 0.0 0.0%
Reading 48.0 0.1 0.1%Redcar and Cleveland 71.4 0.0 0.0%Rutland 8.6 0.0 0.1%Shropshire 97.4 0.0 0.0%Slough 52.8 0.0 0.1%
South Gloucestershire 64.0 0.0 0.0%Southampton 101.2 0.1 0.1%Southend-on-Sea 62.3 0.0 0.0%Stockton-on-Tees 80.6 0.0 0.0%Stoke-on-Trent 133.5 0.0 0.0%
Swindon 43.7 0.0 0.0%Telford and the Wrekin 76.0 0.0 0.0%Thurrock 62.1 0.1 0.1%Torbay 64.2 0.0 0.0%Warrington 52.7 0.0 0.0%
391
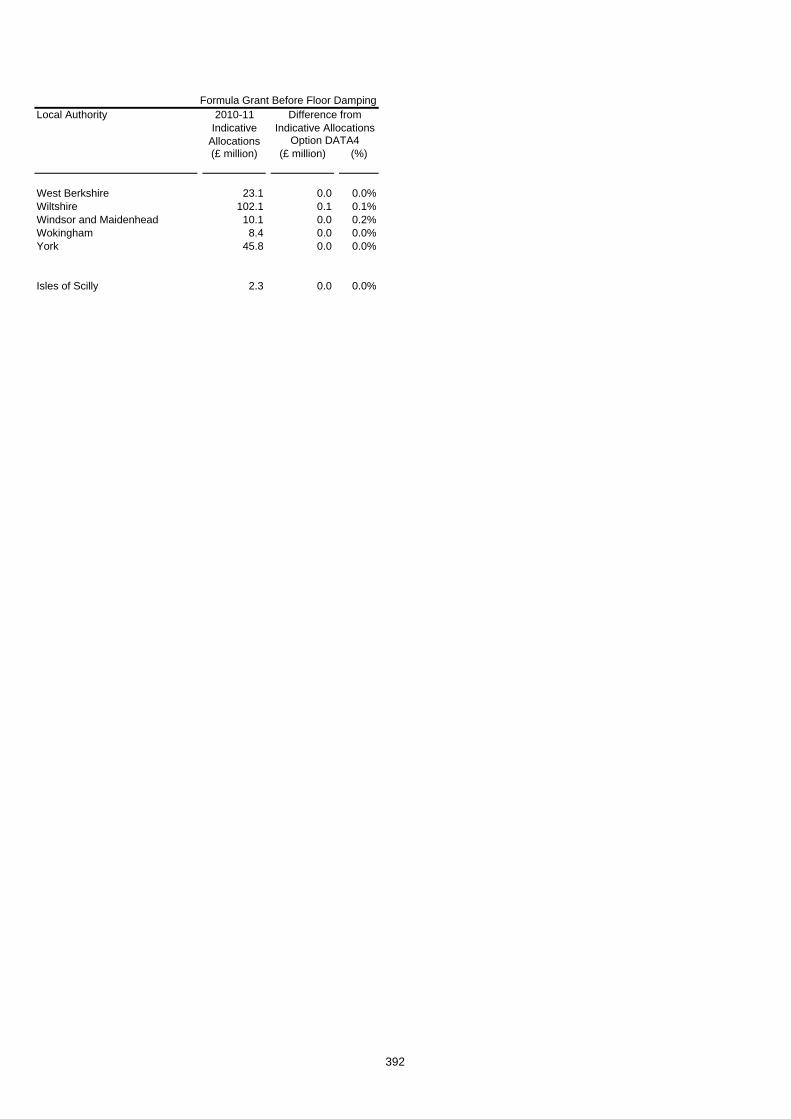
Formula Grant Before Floor DampingLocal Authority
(£ million) (£ million) (%)
Difference from Indicative Allocations
2010-11 Indicative
Allocations Option DATA4
West Berkshire 23.1 0.0 0.0%Wiltshire 102.1 0.1 0.1%Windsor and Maidenhead 10.1 0.0 0.2%Wokingham 8.4 0.0 0.0%York 45.8 0.0 0.0%
Isles of Scilly 2.3 0.0 0.0%
392

Formula Grant Before Floor DampingLocal Authority
(£ million) (£ million) (%)
Difference from Indicative Allocations
2010-11 Indicative
Allocations Option DATA4
SHIRE COUNTIES
Buckinghamshire 43.5 0.1 0.2%Cambridgeshire 113.1 0.1 0.1%Cumbria 157.5 0.0 0.0%Derbyshire 204.0 0.0 0.0%Devon 176.4 0.1 0.0%
Dorset 57.6 0.1 0.1%East Sussex 105.4 0.1 0.1%Essex 258.3 0.1 0.1%Gloucestershire 124.0 0.2 0.1%Hampshire 126.6 0.1 0.1%
Hertfordshire 148.3 0.3 0.2%Kent 287.9 0.3 0.1%Lancashire 328.9 0.0 0.0%Leicestershire 107.5 0.0 0.0%Lincolnshire 210.6 0.1 0.0%
Norfolk 260.4 0.2 0.1%North Yorkshire 113.7 0.0 0.0%Northamptonshire 162.2 0.0 0.0%Nottinghamshire 191.6 0.0 0.0%Oxfordshire 99.8 0.1 0.1%
Somerset 120.7 0.0 0.0%Staffordshire 169.7 0.0 0.0%Suffolk 181.0 0.1 0.1%Surrey 60.1 0.3 0.5%Warwickshire 96.6 0.0 0.0%
West Sussex 88.4 0.1 0.1%Worcestershire 96.9 0.0 0.0%
393

Formula Grant Before Floor DampingLocal Authority
(£ million) (£ million) (%)
Difference from Indicative Allocations
2010-11 Indicative
Allocations Option DATA4
BUCKINGHAMSHIREAylesbury Vale 12.1 0.0 0.0%Chiltern 3.2 0.0 0.0%South Bucks 2.3 0.0 0.0%Wycombe 9.5 0.0 0.0%
CAMBRIDGESHIRECambridge 12.0 0.0 0.0%East Cambridgeshire 6.8 0.0 0.0%Fenland 9.9 0.0 0.0%Huntingdonshire 13.4 0.0 0.0%South Cambridgeshire 7.9 0.0 0.0%
CUMBRIAAllerdale 10.4 0.0 0.0%Barrow-in-Furness 9.1 0.0 0.0%Carlisle 10.2 0.0 0.0%Copeland 7.2 0.0 0.0%Eden 4.7 0.0 0.0%South Lakeland 6.8 0.0 0.0%
DERBYSHIREAmber Valley 10.0 0.0 0.0%Bolsover 8.0 0.0 0.0%Chesterfield 10.2 0.0 0.0%Derbyshire Dales 4.7 0.0 0.0%Erewash 9.7 0.0 0.0%High Peak 7.2 0.0 0.0%North East Derbyshire 7.9 0.0 0.0%South Derbyshire 7.5 0.0 0.0%
DEVONEast Devon 8.4 0.0 0.0%Exeter 12.1 0.0 0.0%Mid Devon 6.3 0.0 0.0%North Devon 8.5 0.0 0.0%South Hams 5.6 0.0 0.0%Teignbridge 10.1 0.0 0.0%Torridge 6.6 0.0 0.0%West Devon 4.4 0.0 0.0%
DORSETChristchurch 2.9 0.0 0.0%East Dorset 3.8 0.0 0.0%North Dorset 4.7 0.0 0.0%Purbeck 3.3 0.0 0.0%West Dorset 7.9 0.0 0.0%Weymouth and Portland 6.1 0.0 0.0%
EAST SUSSEXEastbourne 10.5 0.0 0.0%Hastings 10.6 0.0 0.0%Lewes 6.6 0.0 0.0%Rother 6.5 0.0 0.0%Wealden 8.4 0.0 0.0%
394

Formula Grant Before Floor DampingLocal Authority
(£ million) (£ million) (%)
Difference from Indicative Allocations
2010-11 Indicative
Allocations Option DATA4
ESSEXBasildon 16.1 0.0 0.0%Braintree 10.6 0.0 0.0%Brentwood 4.4 0.0 0.0%Castle Point 6.8 0.0 0.0%Chelmsford 10.7 0.0 0.0%Colchester 13.1 0.0 0.0%Epping Forest 9.4 0.0 0.0%Harlow 8.2 0.0 0.0%Maldon 4.6 0.0 0.0%Rochford 5.2 0.0 0.0%Tendring 14.6 0.0 0.0%Uttlesford 3.9 0.0 0.0%
GLOUCESTERSHIRECheltenham 8.7 0.0 0.0%Cotswold 5.5 0.0 0.0%Forest of Dean 7.0 0.0 0.0%Gloucester 10.8 0.0 0.0%Stroud 7.3 0.0 0.0%Tewkesbury 5.4 0.0 0.0%
HAMPSHIREBasingstoke and Deane 10.3 0.0 0.0%East Hampshire 5.9 0.0 0.0%Eastleigh 7.8 0.0 0.0%Fareham 6.1 0.0 0.0%Gosport 7.1 0.0 0.0%Hart 3.9 0.0 0.0%Havant 9.9 0.0 0.0%New Forest 11.8 0.0 0.0%Rushmoor 6.3 0.0 0.0%Test Valley 7.3 0.0 0.0%Winchester 6.7 0.0 0.0%
HERTFORDSHIREBroxbourne 7.0 0.0 0.0%Dacorum 9.5 0.0 0.0%East Hertfordshire 8.1 0.0 0.0%Hertsmere 6.8 0.0 0.0%North Hertfordshire 8.3 0.0 0.0%St Albans 7.0 0.0 0.0%Stevenage 7.6 0.0 0.0%Three Rivers 5.1 0.0 0.0%Watford 7.2 0.0 0.0%Welwyn Hatfield 8.2 0.0 0.0%
KENTAshford 8.6 0.0 0.0%Canterbury 13.6 0.0 0.0%Dartford 7.6 0.0 0.0%Dover 9.9 0.0 0.0%Gravesham 8.5 0.0 0.0%Maidstone 9.0 0.0 0.0%Sevenoaks 6.1 0.0 0.0%Shepway 10.1 0.0 0.0%Swale 12.2 0.0 0.0%Thanet 13.4 0.0 0.0%Tonbridge and Malling 6.5 0.0 0.0%Tunbridge Wells 6.5 0.0 0.0%
395

Formula Grant Before Floor DampingLocal Authority
(£ million) (£ million) (%)
Difference from Indicative Allocations
2010-11 Indicative
Allocations Option DATA4
LANCASHIREBurnley 11.8 0.0 0.0%Chorley 8.6 0.0 0.0%Fylde 6.0 0.0 0.0%Hyndburn 10.3 0.0 0.0%Lancaster 16.8 0.0 0.0%Pendle 11.2 0.0 0.0%Preston 15.8 0.0 0.0%Ribble Valley 4.3 0.0 0.0%Rossendale 6.2 0.0 0.0%South Ribble 7.6 0.0 0.0%West Lancashire 9.6 0.0 0.0%Wyre 10.8 0.0 0.0%
LEICESTERSHIREBlaby 6.6 0.0 0.0%Charnwood 12.7 0.0 0.0%Harborough 5.6 0.0 0.0%Hinckley and Bosworth 7.6 0.0 0.0%Melton 4.0 0.0 0.0%North West Leicestershire 7.3 0.0 0.0%Oadby and Wigston 4.7 0.0 0.0%
LINCOLNSHIREBoston 7.4 0.0 0.0%East Lindsey 17.9 0.0 0.0%Lincoln 10.3 0.0 0.0%North Kesteven 9.0 0.0 0.0%South Holland 9.3 0.0 0.0%South Kesteven 10.2 0.0 0.0%West Lindsey 8.4 0.0 0.0%
NORFOLKBreckland 11.6 0.0 0.0%Broadland 8.7 0.0 0.0%Great Yarmouth 10.9 0.0 0.0%King's Lynn and West Norfolk 15.8 0.0 0.0%North Norfolk 9.1 0.0 0.0%Norwich 16.0 0.0 0.0%South Norfolk 8.6 0.0 0.0%
NORTH YORKSHIRECraven 4.3 0.0 0.0%Hambleton 5.9 0.0 0.0%Harrogate 11.5 0.0 0.0%Richmondshire 4.4 0.0 0.0%Ryedale 4.7 0.0 0.0%Scarborough 12.6 0.0 0.0%Selby 6.8 0.0 0.0%
NORTHAMPTONSHIRECorby 5.6 0.0 0.0%Daventry 6.4 0.0 0.0%East Northamptonshire 6.9 0.0 0.0%Kettering 7.4 0.0 0.0%Northampton 18.9 0.0 0.0%South Northamptonshire 6.1 0.0 0.0%Wellingborough 7.1 0.0 0.0%
396

Formula Grant Before Floor DampingLocal Authority
(£ million) (£ million) (%)
Difference from Indicative Allocations
2010-11 Indicative
Allocations Option DATA4
NOTTINGHAMSHIREAshfield 11.6 0.0 0.0%Bassetlaw 11.4 0.0 0.0%Broxtowe 9.1 0.0 0.0%Gedling 9.4 0.0 0.0%Mansfield 10.3 0.0 0.0%Newark and Sherwood 10.5 0.0 0.0%Rushcliffe 7.3 0.0 0.0%
OXFORDSHIRECherwell 11.2 0.0 0.0%Oxford 16.9 0.0 0.0%South Oxfordshire 7.8 0.0 0.0%Vale of White Horse 7.2 0.0 0.0%West Oxfordshire 6.1 0.0 0.0%
SOMERSETMendip 8.5 0.0 0.0%Sedgemoor 10.3 0.0 0.0%South Somerset 11.2 0.0 0.0%Taunton Deane 8.9 0.0 0.0%West Somerset 3.3 0.0 0.0%
STAFFORDSHIRECannock Chase 8.6 0.0 0.0%East Staffordshire 9.6 0.0 0.0%Lichfield 6.1 0.0 0.0%Newcastle-under-Lyme 11.3 0.0 0.0%South Staffordshire 7.2 0.0 0.0%Stafford 8.8 0.0 0.0%Staffordshire Moorlands 7.6 0.0 0.0%Tamworth 6.9 0.0 0.0%
SUFFOLKBabergh 6.4 0.0 0.0%Forest Heath 5.5 0.0 0.0%Ipswich 11.9 0.0 0.0%Mid Suffolk 6.2 0.0 0.0%St Edmundsbury 7.1 0.0 0.0%Suffolk Coastal 8.4 0.0 0.0%Waveney 12.0 0.0 0.0%
SURREYElmbridge 6.5 0.0 0.0%Epsom and Ewell 4.0 0.0 0.0%Guildford 8.6 0.0 0.0%Mole Valley 3.3 0.0 0.0%Reigate and Banstead 6.9 0.0 0.0%Runnymede 5.8 0.0 0.0%Spelthorne 5.7 0.0 0.0%Surrey Heath 4.7 0.0 0.0%Tandridge 4.0 0.0 0.0%Waverley 5.4 0.0 0.0%Woking 5.8 0.0 0.0%
WARWICKSHIRENorth Warwickshire 5.5 0.0 0.0%Nuneaton and Bedworth 11.4 0.0 0.0%Rugby 6.6 0.0 0.0%Stratford-on-Avon 6.9 0.0 0.0%Warwick 10.5 0.0 0.0%
397
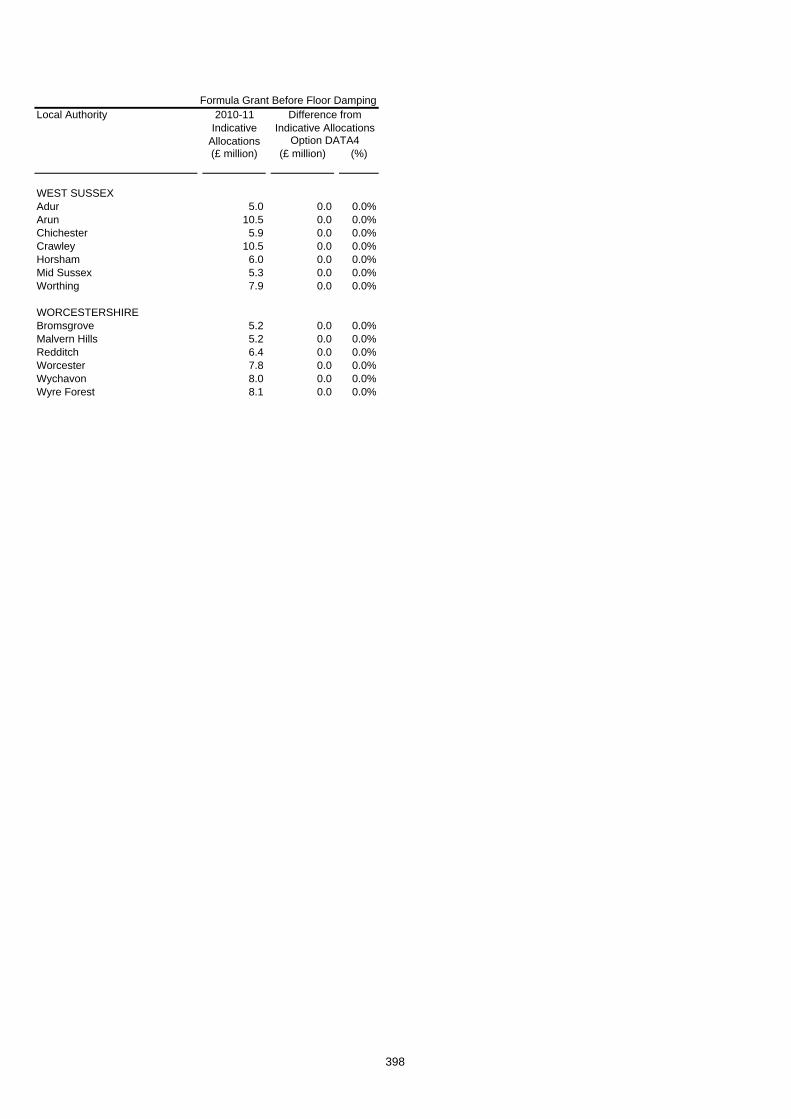
Formula Grant Before Floor DampingLocal Authority
(£ million) (£ million) (%)
Difference from Indicative Allocations
2010-11 Indicative
Allocations Option DATA4
WEST SUSSEXAdur 5.0 0.0 0.0%Arun 10.5 0.0 0.0%Chichester 5.9 0.0 0.0%Crawley 10.5 0.0 0.0%Horsham 6.0 0.0 0.0%Mid Sussex 5.3 0.0 0.0%Worthing 7.9 0.0 0.0%
WORCESTERSHIREBromsgrove 5.2 0.0 0.0%Malvern Hills 5.2 0.0 0.0%Redditch 6.4 0.0 0.0%Worcester 7.8 0.0 0.0%Wychavon 8.0 0.0 0.0%Wyre Forest 8.1 0.0 0.0%
398

Formula Grant Before Floor DampingLocal Authority
(£ million) (£ million) (%)
Difference from Indicative Allocations
2010-11 Indicative
Allocations Option DATA4
SHIRE POLICE AUTHORITIES
Avon & Somerset Police 197.6 0.0 0.0%Bedfordshire Police 76.6 0.0 0.0%Cambridgeshire Police 86.2 0.0 0.0%Cheshire Police 114.1 0.0 0.0%Cleveland Police 99.0 0.0 0.0%
Cumbria Police 56.1 0.0 0.0%Derbyshire Police 120.7 0.0 0.0%Devon & Cornwall Police 191.7 0.0 0.0%Dorset Police 64.3 0.0 0.0%Durham Police 87.0 0.0 0.0%
Essex Police 187.3 0.0 0.0%Gloucestershire Police 58.5 0.0 0.0%Hampshire Police 215.0 0.0 0.0%Hertfordshire Police 128.9 0.0 0.0%Humberside Police 132.9 0.0 0.0%
Kent Police 200.2 0.0 0.0%Lancashire Police 212.3 0.0 0.0%Leicestershire Police 124.2 0.0 0.0%Lincolnshire Police 69.0 0.0 0.0%Norfolk Police 88.5 0.0 0.0%
North Yorkshire Police 73.1 0.0 0.0%Northamptonshire Police 78.4 0.0 0.0%Nottinghamshire Police 152.7 0.0 0.0%Staffordshire Police 125.1 0.0 0.0%Suffolk Police 71.0 0.0 0.0%
Surrey Police 101.3 0.0 0.0%Sussex Police 167.1 0.0 0.0%Thames Valley Police 248.5 0.0 0.0%Warwickshire Police 56.1 0.0 0.0%West Mercia Police 114.3 0.0 0.0%
Wiltshire Police 64.1 0.0 0.0%
399

Formula Grant Before Floor DampingLocal Authority
(£ million) (£ million) (%)
Difference from Indicative Allocations
2010-11 Indicative
Allocations Option DATA4
SHIRE FIRE AUTHORITIES
Avon Fire 24.6 0.0 0.0%Bedfordshire Fire 11.7 0.0 0.0%Berkshire Fire Auhtority 13.0 0.0 0.0%Buckinghamshire Fire 9.1 0.0 0.0%Cambridgeshire Fire 15.1 0.0 0.0%
Cheshire Fire 19.3 0.0 0.0%Cleveland Fire 21.7 0.0 0.0%Derbyshire Fire 20.6 0.0 0.0%Devon and Somerset Fire 32.1 0.0 0.0%Dorset Fire 11.1 0.0 0.0%
Durham Fire 14.9 0.0 0.0%East Sussex Fire 15.0 0.0 0.0%Essex Fire Auhtority 33.3 0.0 0.0%Hampshire Fire 29.9 0.0 0.0%Hereford & Worcester Fire 10.8 0.0 0.0%
Humberside Fire 28.2 0.0 0.0%Kent Fire 30.2 0.0 0.0%Lancashire Fire 32.6 0.0 0.0%Leicestershire Fire 19.2 0.0 0.0%North Yorkshire Fire 11.6 0.0 0.0%
Nottinghamshire Fire 26.3 0.0 0.0%Shropshire Fire 8.6 0.0 0.0%Staffordshire Fire 19.1 0.0 0.0%Wiltshire Fire 9.7 0.0 0.0%
400

401
Section 5: Helpful Information Chapter 17 Shares of Taxbase used in Exemplifications 1. The table below shows the shares of taxbase used in the exemplifications. Upper-tier
services Police services
Fire services Lower-tier services
2006-07 Settlement 0.72103328 0.08672247 0.03378238 0.158461872007-08 Settlement 0.72012055 0.08707602 0.03432392 0.158479512008-09 Settlement 0.701408590 0.094044500 0.036637434 0.1679094762009-10 Settlement 0.711867721 0.091344847 0.034972733 0.1618146992010-11 Settlement 0.722079958 0.088692078 0.033356743 0.1558712212010-11 Indicative Allocations 0.721594004 0.088822815 0.033412625 0.156170556Option OPPSS1 0.721206160 0.088930731 0.033462172 0.156400937Option POL1 0.721633206 0.088826707 0.033404898 0.156135189Option POL2 0.721724094 0.088968172 0.033363338 0.155944396Option POL3 0.721592726 0.088823052 0.033412808 0.156171414Option POL4 0.721592623 0.088823098 0.033412818 0.156171461Option FIR1 0.723758345 0.088212952 0.033166109 0.154862594Option FIR2 0.723607803 0.088255944 0.033180544 0.154955709Option FIR3 0.721381415 0.088863329 0.033493515 0.156261741Option FIR4 0.722227204 0.088591767 0.033504526 0.155676503Option HM1 0.721829656 0.088757310 0.033382514 0.156030520Option HM2 0.721982825 0.088714759 0.033362940 0.155939476Option EPCS1 0.723749892 0.088323734 0.033183823 0.154742551Option EPCS2 0.721875185 0.088668670 0.033349805 0.156106340Option EPCS3 0.721585138 0.088794480 0.033403243 0.156217139Option ACA1 0.717318977 0.089959671 0.033933125 0.158788227Option CAS1 0.731491110 0.085405343 0.031933714 0.151169833Option CAS2 0.729632508 0.086620004 0.032382756 0.151364732Option CONCF1 0.726415197 0.088631810 0.033383228 0.151569765Option CONCF2 0.722115460 0.088631811 0.033383246 0.155869483Option CONCF3 0.729789624 0.087646283 0.032936093 0.149628000Option CONCF4 0.726356775 0.087646283 0.032936093 0.153060849Option CONCF5 0.716901580 0.092216959 0.034933938 0.155947523Option CONCF6 0.716901580 0.092216959 0.034933938 0.155947523Option CONCF7 0.726015937 0.089473179 0.033698484 0.150812400Option CONCF8 0.726015937 0.089473179 0.033698484 0.150812400Option CONCF9 0.716074258 0.092469267 0.035045706 0.156410769Option CONCF10 0.716074258 0.092469267 0.035045706 0.156410769Option DATA1 0.721604390 0.088814982 0.033410322 0.156170306Option DATA2 0.728337535 0.086955973 0.032597639 0.152108853Option DATA3 0.721992772 0.088703097 0.033365148 0.155938983Option DATA4 0.721694006 0.088795011 0.033399848 0.156111135

402
Chapter 18 List of Questions
Chapter 3 –Adults’ Personal Social Services
Question 1: Do you agree that we should update the Low Income Adjustment (OPPSS1)?
Chapter 4 - Police
Question 2: Do you agree the activity analysis should be updated and a three year average used instead of the current two year average (POL1)?
Question 3: Do you agree that the log of weighted bars per 100 hectares indicator should be used in place of log of bars per 100 hectares indicator (POL4)?
Question 4: Do you agree that the three elements of Additional Rule 2 Grant mentioned in Chapter 4 ‘Police’ paragraph 19 should be rolled into Principal Formula Police Grant (Main Grant) and therefore distributed as through the Police Allocation Formula (POL3)?
Question 5: Do you agree with that the whole of the Rule 2 grant should be rolled into Principal Formula Police Grant (Main Grant) and therefore distributed as through the Police Allocation Formula (POL4)?
Chapter 5 – Fire & Rescue
Question 6: Do you agree that the expenditure data used to determine the coefficients should be updated (FIR1)?
Question 7: Should annual cashable efficiency savings be added to the updated expenditure data used to determine the coefficients (FIR2)?
Question 8: Would you prefer either FIR3 or FIR4 as an alternative to the current risk index?
Chapter 6 – Highways Maintenance
Question 9: Do you agree that the daytime visitors component of daytime population per km should be removed? (HM1)

403
Question 10: Do you agree that the expenditure data used to determine the coefficients should be updated? (HM2)
Chapter 7 – Environmental, Protective and Cultural Services
Question 11: Do you agree that foreign visitor nights is a suitable replacement for day visitors in the district-level and county-level EPCS RNFs (EPCS1)?
Question 12: Do you agree that the new GIS–based flood defence formula should be used (EPCS2)?
Question 13: Do you agree that the new GIS–based coast protection formula should be used (EPCS3)?
Chapter 8 – Area Cost Adjustment
Question 14: Do you agree with the proposal to update the weights given to the labour cost adjustment (ACA 1)?
Chapter 10 – Scaling Factor
Question 15: Do you think that the scaling factor for the central allocation should be close to one, so that equal importance is attached to the amounts above and below the minima?
Question 16: If so, would you prefer Ministers to be able to set judgemental weights for the Relative Needs Amount, as in option CAS1, or the Relative Resource Amount, as in option CAS2?
Chapter 11 – Floor Damping Levels
Question 17: Over the next Spending Review period do you think that the floor level should be set close to the average change or such that it allows some formula change to come through for authorities above the floor?
Chapter 12 – Transfers and Adjustments Question 4: Do you agree that the three elements of Additional Rule 2 Grant mentioned in Chapter 4 ‘Police’ paragraph 19 should be rolled into Principal Formula Police Grant (Main Grant) and therefore distributed as through the Police Allocation Formula (POL3)?

404
Question 5: Do you agree with that the whole of the Rule 2 grant should be rolled into Principal Formula Police Grant (Main Grant) and therefore distributed as through the Police Allocation Formula (POL4)?
Question 18: Which of the four options for removing concessionary travel from lower-tier authorities do you prefer (CONCF1, CONCF2, CONCF3, CONCF4)?
Question 19: Which of the six options for rolling in concessionary travel to upper-tier authorities do you prefer (CONCF5, CONCF6, CONCF7, CONCF8, CONCF9, CONCF10)?
Question 20: Should concessionary travel have its own sub-block?
Question 21: Do you agree with the methodology for adjusting the base position for unadopted drains?
Chapter 13 – The Incapacity Benefit and Severe Disablement Allowance indicator Question 22: Do you agree that the incapacity benefit and severe disablement allowance indicators should use quarterly data rather than annual data (DATA1)?
Chapter 14 – Replacing the Children’s Income Support Benefit Indicator Question 23: Do you agree that children in out-of-work families receiving Child Tax Credit (CTC) should replace the current children of IS/(IB)JSA claimants (DATA2)?
Chapter 15 – Student Exemptions and the Council Tax Base Question 24: Would you prefer that May data only is used for the student exemptions adjustment in the taxbase projections (DATA3)?
Chapter 16 – Updating data on low achieving ethnic groups
Question 25: Do you agree that the new definition of secondary school pupils in low achieving ethnic groups should be used (DATA4)?

405
Chapter 19
The Consultation Criteria Scope of consultation Topic of consultation Options for a number of the components of the local government
grant distribution system. Scope of consultation This consultation seeks views on the practicality and technical
feasibility of the options described, particularly from local authority practitioners.
Geographical scope All local authorities in England that receive formula grant (Revenue Support Grant, redistributed National Non Domestic Rates and, where appropriate, Police Grant). Police authorities in both England and Wales who receive grant via this system are also covered.
Impact assessment Not applicable. Basic information To Local authorities (including police authorities, fire and rescue
authorities and local precepting authorities). Representative organisations (including, but not limited to, the LGA and London Councils).
Body responsible for the consultation
Department for Communities and Local Government
Duration 10 weeks (28 July to 6 October). This is in line with the arrangements agreed under the Framework for Partnership with the Local Government Association.
Enquiries Andrew Lock Local Government Finance – Formula Grant Distribution Department for Communities and Local Government Zone 5/J2 Eland House Bressenden Place London SW1E 5DU Telephone: 030 3444 2137 Email: [email protected]
How to respond To either of the addresses above. Additional ways to become involved
Not applicable.
After the consultation The Government will take into account the responses to this consultation in its preparation for future local government finance settlements.
Compliance with the code of practice on consultation
This consultation complies with the Code.

406
Background Getting to this stage The Settlement Working Group has considered over the previous
three years how the formula grant system might be changed. The Settlement Working Group consists of representatives from all types of local authority in England along with interested parties from central Government.
Previous engagement Local Government Finance – Formula Grant Distribution consultation paper 2007.
This consultation document and consultation process have been planned to adhere to the Code of Practice on Consultation issued by the Department for Business, Innovation and Skills and is in line with the seven consultation criteria, which are:
1. Formal consultation should take place at a stage when there is scope to influence the policy outcome.
2. Consultations should normally last for at least 12 weeks with consideration given to longer timescales where feasible and sensible.
3. Consultation documents should be clear about the consultation process, what is being proposed, the scope to influence and the expected costs and benefits of the proposals.
4. Consultation exercises should be designed to be accessible to, and clearly targeted at, those people the exercise is intended to reach.
5. Keeping the burden of consultation to a minimum is essential if consultations are to be effective and if consultee’s buy-in to the process is to be obtained.
6. Consultation responses should be analysed carefully and clear feedback should be provided to participants following the consultation.
7. Officials running consultations should seek guidance in how to run an effective consultation exercise and share what they have learned from the experience.
Representative groups are asked to give a summary of the people and organisations they represent and, where relevant, who else they have consulted in reaching their conclusions when they respond. Information provided in response to this consultation, including personal information, may be published or disclosed in accordance with the access to information regimes (these are primarily the Freedom of Information Act 2000 (FOIA), the Data Protection Act 1998 (DPA) and the Environmental

407
Information Regulations 2004). If you want the information that you provide to be treated as confidential, please be aware that, under the FOIA, there is a statutory Code of Practice with which public authorities must comply and which deals, amongst other things, with obligations of confidence. In view of this it would be helpful if you could explain to us why you regard the information you have provided as confidential. If we receive a request for disclosure of the information we will take full account of your explanation, but we cannot give an assurance that confidentiality can be maintained in all circumstances. An automatic confidentiality disclaimer generated by your IT system will not, of itself, be regarded as binding on the department. The Department for Communities and Local Government will process your personal data in accordance with the DPA and in the majority of circumstances this will mean that your personal data will not be disclosed to third parties. Individual responses will not be acknowledged unless specifically requested. Your opinions are valuable to us. Thank you for taking the time to read this document and respond. Are you satisfied that this consultation has followed these criteria? If not or you have any other observations about how we can improve the process please contact: CLG Consultation Co-ordinator Zone 6/H10 Eland House London SW1E 5 DU or by e-mail to: [email protected] Consultation process The Department for Communities and Local Government invites comments on the proposals set out in this document. The consultation will run until 6 October 2010. When responding please state whether you are responding as an individual or representing the views of an organisation. Responses to this consultation must be received by 6 October 2010. You can email your response to: [email protected] Or you can respond in writing to:
408
Andrew Lock Local Government Finance Directorate Department for Communities and Local Government Zone 5/J2 Eland House Bressenden Place London SW1E 5DU


Department for Communities and Local Government © Crown Copyright, July 2010 ISBN: 978 1 4098 2508 1
Top Related