


Languages
Pages
Legal


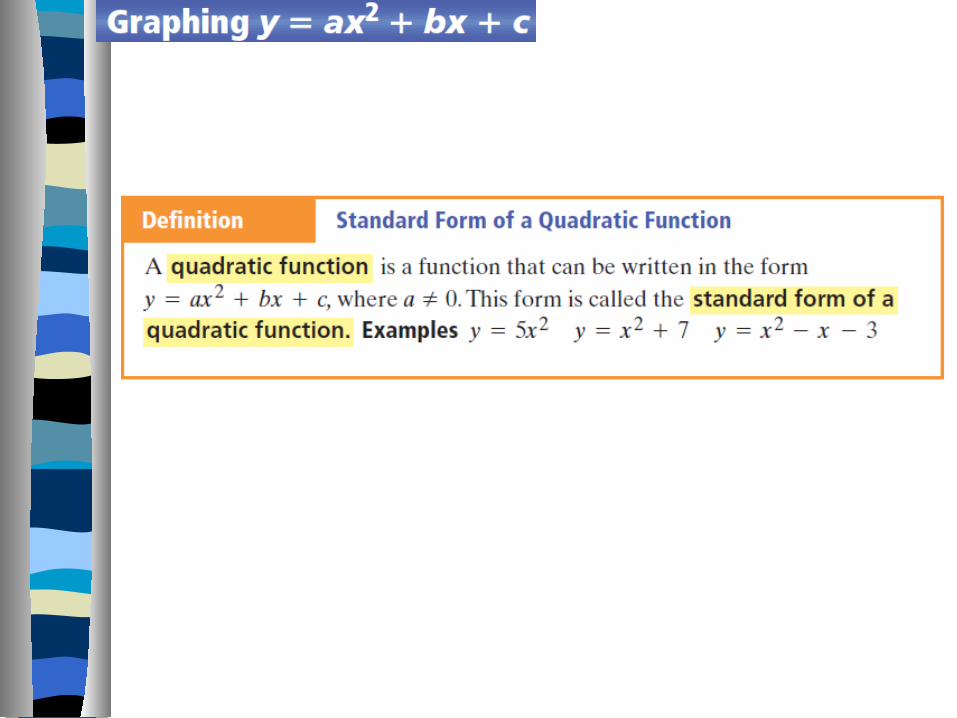
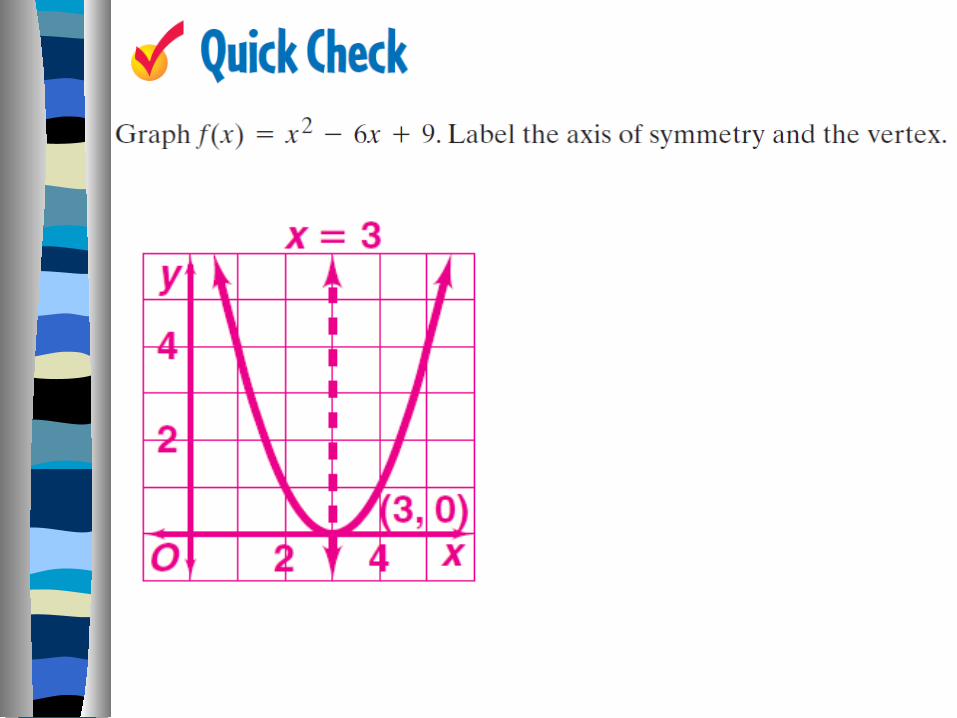
Lesson 9-2Graphing y = ax + bx + c
Objective: To graph equations of the form f(x) = ax + bx + c and interpret these graphs.
2
2

In Lesson 9-1 we investigated graphs of y = ax2 and y = x2
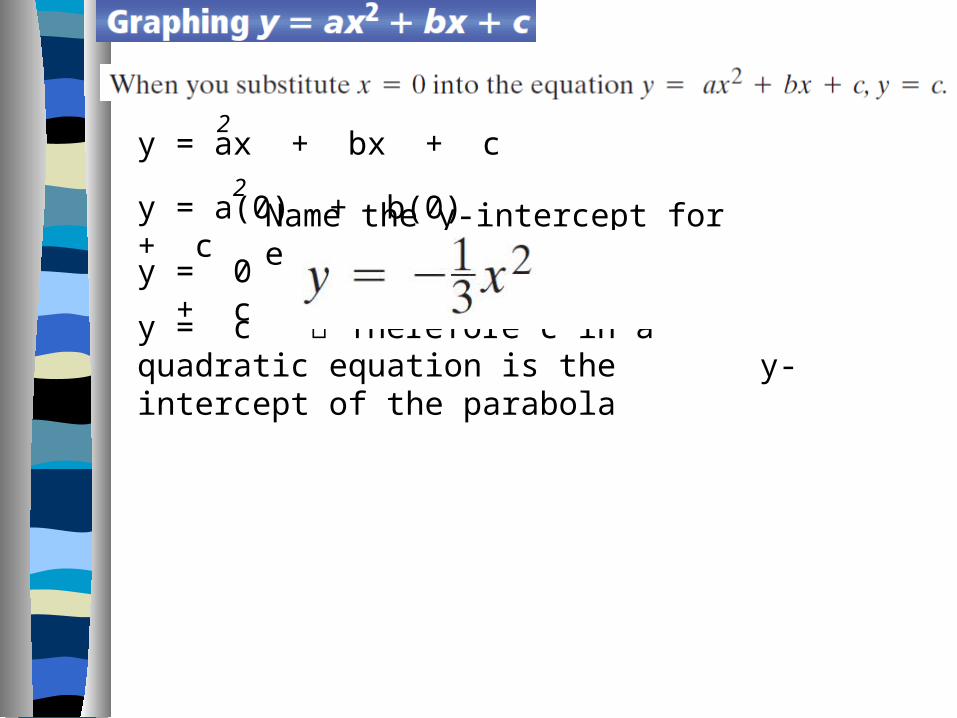
y = a(0) + b(0) + c2
y = ax + bx + c2
y = 0 + 0 + c
y = c Therefore c in a quadratic equation is the y-intercept of the parabola
Name the y-intercept for each function.
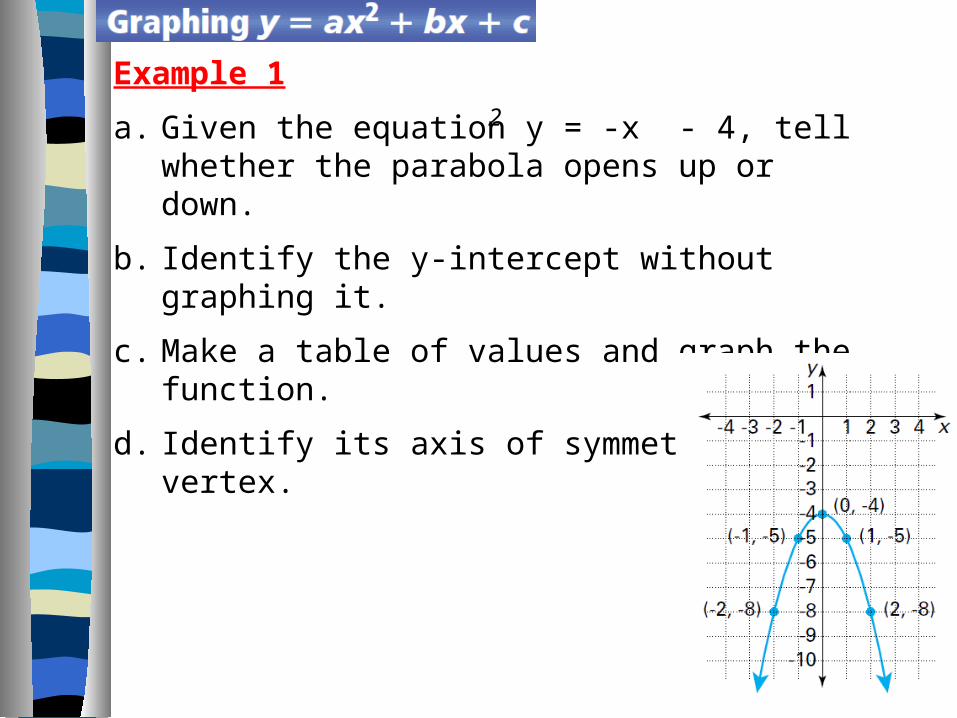
Example 1
a. Given the equation y = -x - 4, tell whether the parabola opens up or down.
b. Identify the y-intercept without graphing it.
c. Make a table of values and graph the function.
d. Identify its axis of symmetry and vertex.
2

Example 2
Consider the equation f(x) = 2x - 8x + 6 and use a table of values to answer the questions. Your table should include negative and positive values.
• Identify the vertex of the parabola by using your table of values if possible?
• What is the equation for the axis of symmetry of the parabola?
• Find the y-intercept without graphing.
• Graph the parabola.
• What are the x-coordinates of the two points where y = 16?
2
Read Lesson 9-3 and fill in study guide. In Lesson 9-2 complete #5-9, 12-13, 15-18.
Homework ~ Friday March 26

Exit Ticket

Top Related