


Languages
Pages
Legal


Lecture 4:
Stratospheric Transport
(i) Quantifying transport rates: Effective diffusivity
(ii) Quantifying transport rates: Age
(iii) Stratospheric trace gases:Global structure and tracer-tracer relationships
FDEPS 2010
Alan Plumb, MIT
Nov 2010

stirring diabatic motion

(i) Quantifying transport rates:
Effective diffusivity

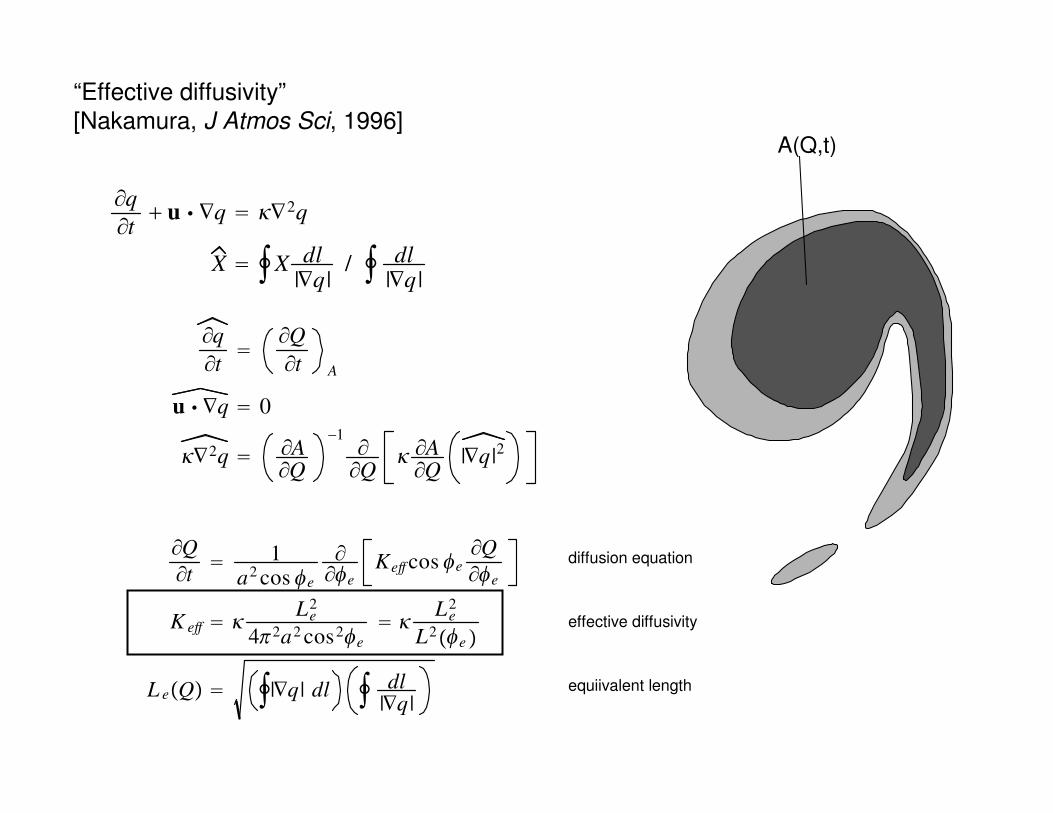
A(Q,t)
“Effective diffusivity”
[Nakamura, J Atmos Sci, 1996]
∂q
∂t+ u ⋅ ∇q = κ∇2q
X = ∮X dl|∇q |
/ ∮ dl|∇q |
∂q
∂t=
∂Q
∂t A
u ⋅ ∇q = 0
κ∇2q = ∂A∂Q
−1∂∂Q
κ ∂A∂Q
|∇q |2
∂Q
∂t= 1
a2 cos φe
∂∂φe
Keff cos φe∂Q
∂φe
K eff = κLe
2
4π2a2 cos2φe
= κLe
2
L2φe
L eQ = ∮|∇q | dl ∮ dl|∇q |
diffusion equation
effective diffusivity
equiivalent length

color: Keff
contours: zonal wind
[Haynes & Shuckburgh, J Atmos Sci,2002]
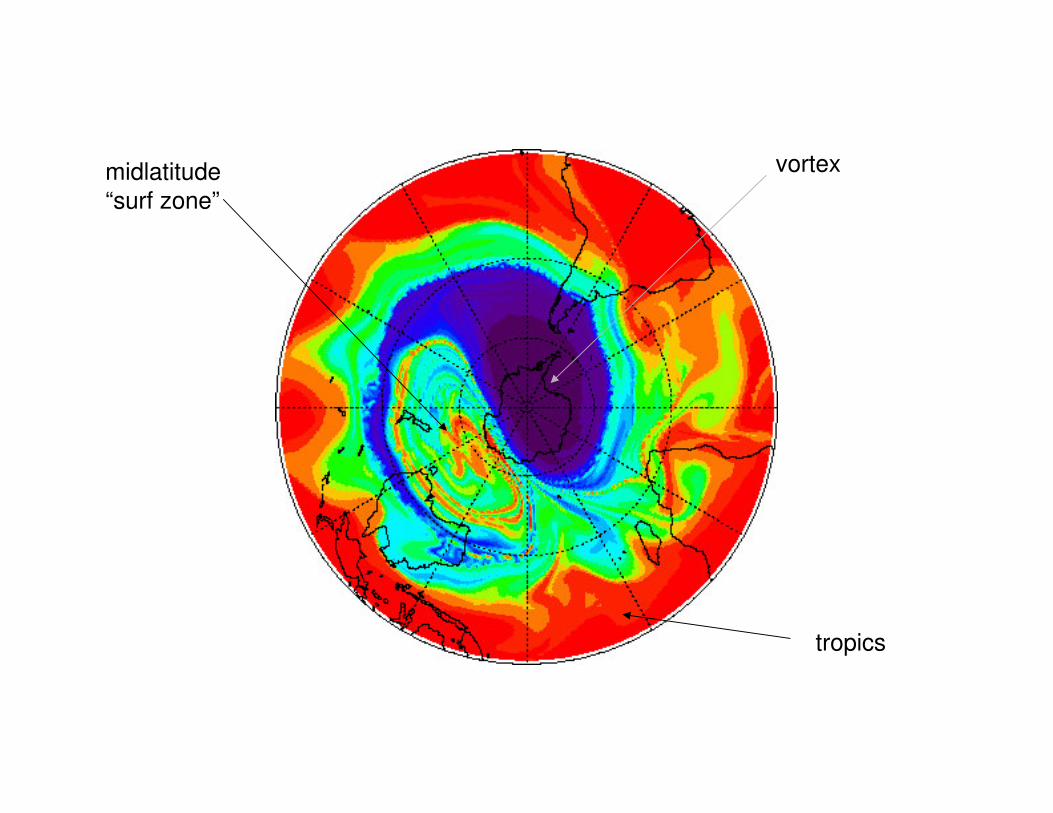
vortexmidlatitude
“surf zone”
tropics


vortex

vortex
midlatitude “surf zone”

vortex
midlatitude “surf zone”tropics

vortex
midlatitude “surf zone”tropics
summer

In “surf zone”,
Keff ∼ 3 × 10⁶m2s−1
mixing time across L = 3000km:
τmix ∼ L2
Keff∼
3 × 1062
3 × 10⁶∼ 3 × 10⁶ s ∼ 35 days
Time scale for residual advection across surf zone (v̄∗ ∼ 0. 1ms−1):
τadv ∼ Lv̄∗
∼ 3 × 10⁷s ∼ 1 year
τmix ≪ τadv
Stirring and mixing is the dominant poleward transport process
Transport rates

tropopause


tropopause
entrainment across edges into surf zone (and some detrainment)

(ii) Quantifying transport rates: Age
a stratospheric clock

tropopause
Γ(λ,γ,z)
Γ=0
conserved tracer:∂q
∂t+ u ⋅ ∇q − κ∇ 2q =
∂q
∂t+ Tq = 0
age: ∂Γ∂t
+ TΓ = 1

linearly growing tracer q0t = Q0 + Λt
→ in equilibrium qϕ,z, t = Qϕ,z + Λt
∂q
∂t+ Tq = Λ + TQ = 0
→ Qϕ,z = −T−1Λ ; Qϕ0,z0 = Q0
→ Q − Q0 = − ΛΓ
→ qϕ,z, t = Q0 + Λt − Γ
= q0t − Γ
SP Equator NP
100 10 1 0.1
hP
a
4
4.5
3
Modeled age (annual mean; yrs)
∂Γ∂t
+ TΓ = 1
steady equilibrium: TΓ = 1 → Γϕ, z = T−11 ; Γ0 = 0
Theoretical (ideal) age:
Age from observed tracers:

Age from observed tracers:
Andrews et al,
J.Geophys Res, 2001
Surface values
balloon measurements
Lines are smoothed surface values
delayed by 4, 4.5, 5 years
linearly growing tracer q0t = Q0 + Λt
→ in equilibrium qϕ,z, t = Qϕ,z + Λt
∂q
∂t+ Tq = Λ + TQ = 0
→ Qϕ,z = −T−1Λ ; Qϕ0,z0 = Q0
→ Q − Q0 = − ΛΓ
→ qϕ,z, t = Q0 + Λt − Γ
= q0t − Γ

CO2 – derived age (yr)
z
[Engel et al, Nature Geoscience,
2008]

Global flux of age
∂Γ∂t
+ TΓ = ∂Γ∂t
+ 1ρ ∇ ⋅ F Γ = 1
in equilibrium 1ρ ∇ ⋅ F Γ = 1
Integrate over volume above surface θ = Θ :
→ ∫∫∫θ>Θ
∇ ⋅ FΓ dV = ∫∫∫θ>Θ0
ρ dV = MΘ
∫∫∫θ>Θ
∇ ⋅ FΓ dV = ∫∫θ=Θ
FΓ ⋅ n dA
→ ∫∫θ=Θ
FΓ ⋅ n dA = MΘ
→ so we know the net flux of age through any surface ifwe know the mass above that surface (which we do if weknow p along the surface)
θ
YOUNG
OLD
Z
WINTER
POLESUMMER
POLE

→ ∫∫θ=Θ
FΓ ⋅ n dA = MΘ
FΓ = ρwdΓ
→ ∫∫θ=Θ
FΓ ⋅ n dA = ∫∫θ=Θ
ρwdΓdA
= ∫∫up
ρwdΓdA + ∫∫down
ρwdΓdA
= −M ⟨Γ⟩down− ⟨Γ⟩up
If diabatic diffusion is negligible (Kzz weak in stratosphere),flux through θ surface is purely advective:
M = ∫∫up
ρwddA = − ∫∫down
ρwddA
⟨Γ⟩down= − 1
M∫∫
down
ρwdΓdA ; ⟨Γ⟩up= 1M
∫∫up
ρwdΓdA
where
overturning mass flux
ΔΓΘ = ⟨Γ⟩down
− ⟨Γ⟩up
=MΘMΘ
YOUNG
OLD
Z
WINTER
POLESUMMER
POLE

[Garcia & Randel, J Atmos Sci, 2008]
Age trends from WACCM
age (
yr)

[Engel et al, Nature Geoscience, 2008]

(iii) Stratospheric trace gases:
Global structure and tracer-tracer relationships

HALOE data
[Russell et al, J Geophys Res, 1993]
CH4
tropospheric source stratospheric sink
HF
stratospheric source tropospheric sink

Similar isopleth shapes,
despite different locations of
sources and sinks
CH4 : HF comparison
(HALOE data)

In situ data
(SOLVE experiment 2000)
Ertel PV, 480K
Compact tracer-tracer relationships

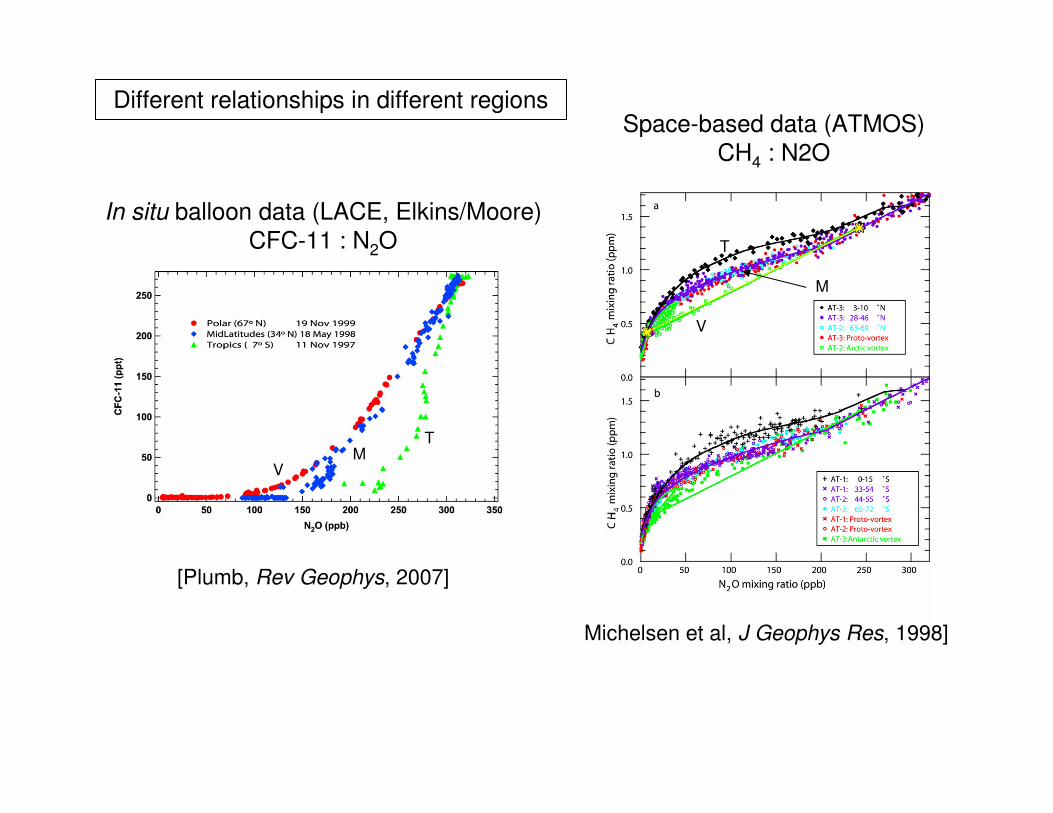
[Plumb, Rev Geophys, 2007]
In situ balloon data (LACE, Elkins/Moore)
CFC-11 : N2O
Different relationships in different regions

In situ balloon data (LACE, Elkins/Moore)
CFC-11 : N2O
[Plumb, Rev Geophys, 2007]
vortex
middle latitudes
tropics
Different relationships in different regions

Space-based data (ATMOS)
CH4 : N2O
Michelsen et al, J Geophys Res, 1998]
Different relationships in different regions

Space-based data (ATMOS)
CH4 : N2O
Michelsen et al, J Geophys Res, 1998]
Different relationships in different regions
vortex
middle latitudes
tropics

[Plumb, Rev Geophys, 2007]
Space-based data (ATMOS)
CH4 : N2O
Michelsen et al, J Geophys Res, 1998]
In situ balloon data (LACE, Elkins/Moore)
CFC-11 : N2O
Different relationships in different regions

0 100 200 3000
50
100
150
200
250S Hem
0 100 200 300N2O (ppb)
0
50
100
150
200
250
CF
C-1
1 (
pp
t)
Tropics
0 100 200 300N2O (ppb)
0
50
100
150
200
250global
P(N2O,CFC-11) 22 Jan 2000
0 100 200 3000
50
100
150
200
250
CF
C-1
1 (
pp
t)
N Hem
from chemical transport model
[Plumb et al., J Geophys Res, 2002]
vortex midlatitudes
tropics

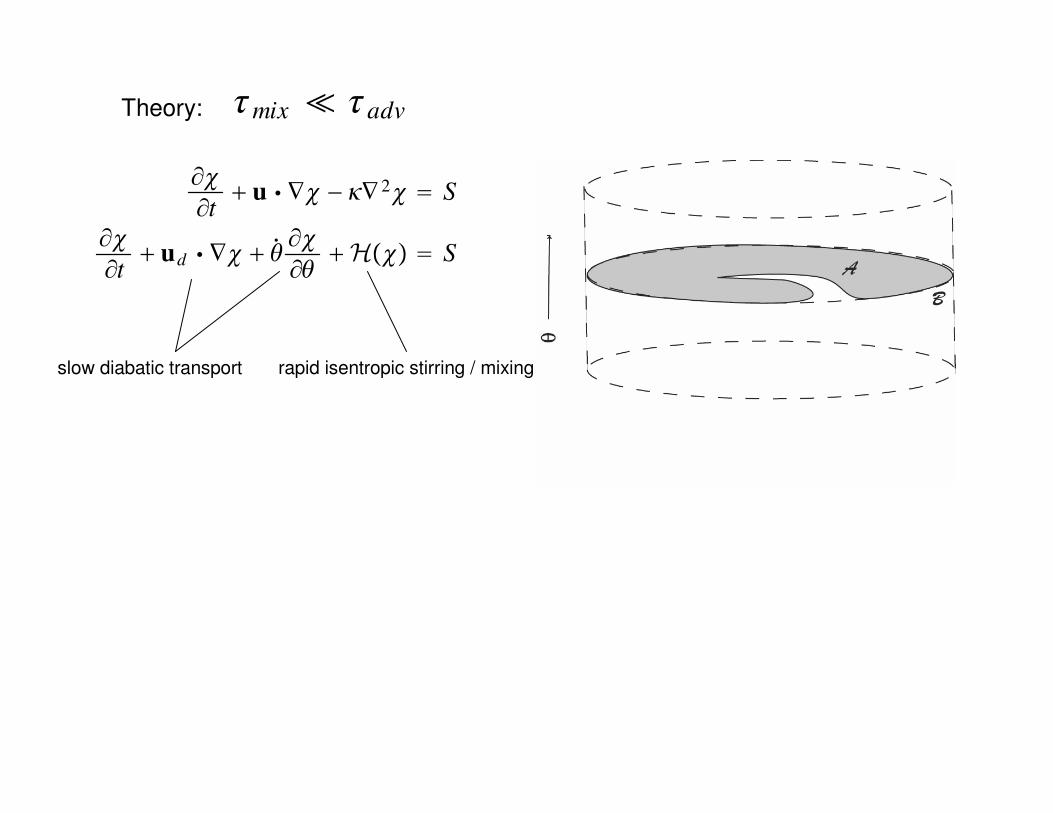
Theory: τmix ≪ τadv
∂χ∂t
+ u ⋅ ∇χ − κ∇ 2χ = S
∂χ∂t
+ ud ⋅ ∇χ + θ̇∂χ∂θ
+Hχ = Stracer mixing ratio sources and sinks
[Plumb, Rev Geophys, 2007]
Theory: τmix ≪ τadv
∂χ∂t
+ u ⋅ ∇χ − κ∇ 2χ = S
∂χ∂t
+ ud ⋅ ∇χ + θ̇∂χ∂θ
+Hχ = S
slow diabatic transport rapid isentropic stirring / mixing

Theory: τmix ≪ τadv
∂χ∂t
+ u ⋅ ∇χ − κ∇ 2χ = S
∂χ∂t
+ ud ⋅ ∇χ + θ̇∂χ∂θ
+Hχ = S
∂σ∂t
+ ∇ ⋅ σud +∂∂θ σθ̇ = 0
σ = −g −1 ∂p
∂θ is density in θ − coordinates

Theory: τmix ≪ τadv
∂χ∂t
+ u ⋅ ∇χ − κ∇ 2χ = S
∂χ∂t
+ ud ⋅ ∇χ + θ̇∂χ∂θ
+Hχ = S
Properties ofH :
● only acts on isentropic gradients: Hfθ, t = 0
● it is linear:Hχ + φ = Hχ +Hφ and Hfθ, tχ = fθ, tHχ● redistribution operator (does not create or destroy tracer)
∫∫σHχ dA = boundary fluxes
● it is uniquely invertible; solution to
Hχ = X
subject to zero net boundary flux, has solution
χ = H−1X
(solvability condition:
X̄ = ∫∫σ dA−1
∫∫σX dA = 0

Theory: τmix ≪ τadv
Tmixing ≪ Tdiabatic,T t ≪ Tchem
∂χ∂t
+ ud ⋅ ∇χ + θ̇∂χ∂θ +Hχ = S
θ̇ = θ̇0 + θ̇1 ,
∂∂t
= ∂∂t
+ ∂∂τ
S = 2S0
χ = χ0 + χ1 + 2χ2 +. . . . . . . . . . . . .

∂χ∂t
+ ud ⋅ ∇χ + θ̇∂χ∂θ +Hχ = S
At leading order ε0,
Hχ 0 = 0
→ χ 0 = χ0θ, t
→ complete isentropic homogenization
χ0n
= χ0nθ, t → Ωχ0
1,χ0
2, t = 0 , triviallyfχ0
1, χ0
2, t = 0

∂χ∂t
+ ud ⋅ ∇χ + θ̇∂χ∂θ +Hχ = S
At order ε1,
Hχ1 = S −∂χ0
∂t− ud ⋅ ∇χ0 − θ̇
∂χ0
∂θ
solvability condition
∂χ0
∂t+ θ̇
∂χ0
∂θ = S̄ + 1τe
χT − χ0 ,
where τe = ∫∫σ dA / ∮σV dl
entrainment velocitytime for entrained air to fill surf zone
mixing ratio of entrained tropical air
advection by average vertical motion

∂χ∂t
+ ud ⋅ ∇χ + θ̇∂χ∂θ +Hχ = S
Hχ1 = S −∂χ0
∂t− ud ⋅ ∇χ0 − θ̇
∂χ0
∂θ
distribution of entrained air
χ1 = H−1S ′ − θ̇′∂χ0
∂θ + τeφσV S̄ − θ̇
∂χ0
∂θ− ∂χ0
∂t
if χ0 steady, and S̄ negligible,
χ1n
= −ζ∂χ 0
n
∂θ, where
ζ = H−1θ̇′ − θ̇τeφσV
ζλ,ϕ, t is the vertical displacement of tracer isoplethsit is purely kinematic: same for all tracers
At order ε1,

χ1n
= −ζ∂χ0
n
∂θ , where
ζ = H−1θ̇′ − θ̇τeφσV
→ all (long-lived) tracrs have the same isopleth shapes→ “equilibrium slopes” [Ehhalt et al. 1983;
Mahlman et al, 1986; Holton 1986]
In tracer-tracer space:
The O departure from the canonical curve fχ01
,χ02
, t = 0 is
Δ = χ11
,χ12
⋅∂χ0
2
∂θ,−
∂χ01
∂θ∂χ0
1
∂θ
2
+∂χ0
1
∂θ
2 −1/2
= − ζ∂χ0
1
∂θ + ζ∂χ0
2
∂θ ⋅∂χ0
2
∂θ , −∂χ0
1
∂θ∂χ 0
1
∂θ
2
+∂χ0
1
∂θ
2 −1/2
= 0
→ the O correction lies along the canonical curve, so
fχ1 ,χ2, t = 0
remains valid at this order: non-trivial compact relationships
χ(1)
χ(2)
χ f
χ1
f (χ
,χ
, t
) =0
(1)
(2)
∆

T
E
χ (1)
χ
e
t
TROPICS EXTRATROPICS
θ
latitude
e t
tracer spacephysical space
Creation of tropical relationships
2 tropospheric source gases, destroyed in tropical stratosphere
tracer 2 has shorter lifetime than tracer 1 � tracer-tracer relation in
tropics is curved as shown (T)
t e
Increasing
altitude
χ
χ(1)
χ(2)
z,θ
TROPICS

T
E
χ (1)
χ
e
t
TROPICS EXTRATROPICS
θ
latitude
e t
tracer spacephysical space
Creation of tropical relationships
2 tropospheric source gases, destroyed in tropical stratosphere
tracer 2 has shorter lifetime than tracer 1 � tracer-tracer relation in
tropics is curved as shown (T)
t e
Increasing
altitude
χ(1)
χ(2)
T
Increasing
altitude

T
E
χ (1)
χ
e
t
TROPICS EXTRATROPICS
θ
latitude
e t
tracer spacephysical space
Creation of midlatitude relationships
t e
χ(1)
χ(2)
T
t
e
midlatitude air at e is
a mixture of tropical air from higher
altitudes
M
tropical air entrained and
mixed into midlatitudes

T
E
χ (1)
χ
e
t
TROPICS EXTRATROPICS
θ
latitude
e t
tracer spacephysical space
Creation of midlatitude relationships
tropical air entrained and
mixed into midlatitudes
midlatitude air at e is
a mixture of tropical air from higher
altitudes
midlatitude curve lies on concave side of tropical curve
t e
χ(1)
χ(2)
T
t
e
M

TE
χ (1)
χ
TROPICS EXTRATROPICS
θ
latitude
tracer spacephysical space
VORTEX
V
Creation of vortex relationshipsmidlatitude air entrained
and mixed into vortex
vortex curve lies on concave side of midlatitude curve
χ(1)
χ(2)
T
M
V
vortex air is a mixture of
midlatitude air from higher altitudes

0 100 200 3000
50
100
150
200
250S Hem
0 100 200 300N2O (ppb)
0
50
100
150
200
250
CF
C-1
1 (
pp
t)
Tropics
0 100 200 300N2O (ppb)
0
50
100
150
200
250global
P(N2O,CFC-11) 22 Jan 2000
0 100 200 3000
50
100
150
200
250
CF
C-1
1 (
pp
t)
N Hem
from chemical transport model
[Plumb et al., J Geophys Res, 2002]
T
M
V
[Plumb, Rev Geophys, 2007]
Space-based data (ATMOS)
CH4 : N2O
Michelsen et al, J Geophys Res, 1998]
In situ balloon data (LACE, Elkins/Moore)
CFC-11 : N2O
Different relationships in different regions
V
TM
M
T
V

HALOE data
[Russell et al, J Geophys Res, 1993]
CH4
tropospheric source stratospheric sink
HF
stratospheric source tropospheric sink

HALOE data
[Russell et al, J Geophys Res, 1993]
CH4
tropospheric source stratospheric sink
HF
stratospheric source tropospheric sink
TR
OP
ICS
MID
LA
TIT
UD
ES
VO
RT
EX
TR
OP
ICS
MID
LA
TIT
UD
ES
VO
RT
EX

References● Andrews et al, 2001: Mean ages of stratospheric air derived from in
situ observations of CO2, CH4, and N2O, J.Geophys Res, 106, 32295-32314
● Engel et al, 2008: Age of stratospheric air unchanged within uncertainties over the past 30 years,
● N. Geosci., 14, 28-31● Garcia and Randel, 2008: Acceleration of the Brewer?Dobson
Circulation due to Increases in Greenhouse Gases, J. Atmos. Sci., 65, 2731-2739.
● Haynes and Shuckburgh, 2002: Effective diffusivity as a diagnostic of atmospherictransport 1. Stratosphere, J. Atmos. Sci., 105, 22777-22794.
● Michelsen et al, 1998: Correlations of stratospheric abundances of NOy, 03, NO, and CH 4 derived from ATMOS measurements, J. Geophys. Res., 03, 28347-28359.

References● Russell et al,1993: THE HALOGEN OCCULTATION EXPERIMENT, J.
Geophys. Res., 98, 10777-10797● Plumb et al., 2002: Global tracer modeling during SOLVE: High-
latitude descent and mixing, J. Geophys. Res., 108, 14 pp.● Plumb, R. A., 2007: Tracer interrelationships in the stratosphere, Rev.
Geophys., 45, 33 pp.● NCEP,
http://www.ncep.noaa.gov/
Top Related