


Languages
Pages
Legal

Lecture 3: Allele Frequencies and Hardy-Weinberg
Equilibrium August 27, 2012
Last Time Review of genetic variation and
Mendelian Genetics
Methods for detecting variation Morphology Allozymes DNA Markers
Anonymous Sequence-tagged
Today Sequence probability calculation
Molecular markers: DNA sequencing
Introduction to statistical distributions
Estimating allele frequencies
Introduction to Hardy-Weinberg Equilibrium
Using Hardy-Weinberg: Estimating allele frequencies for dominant loci
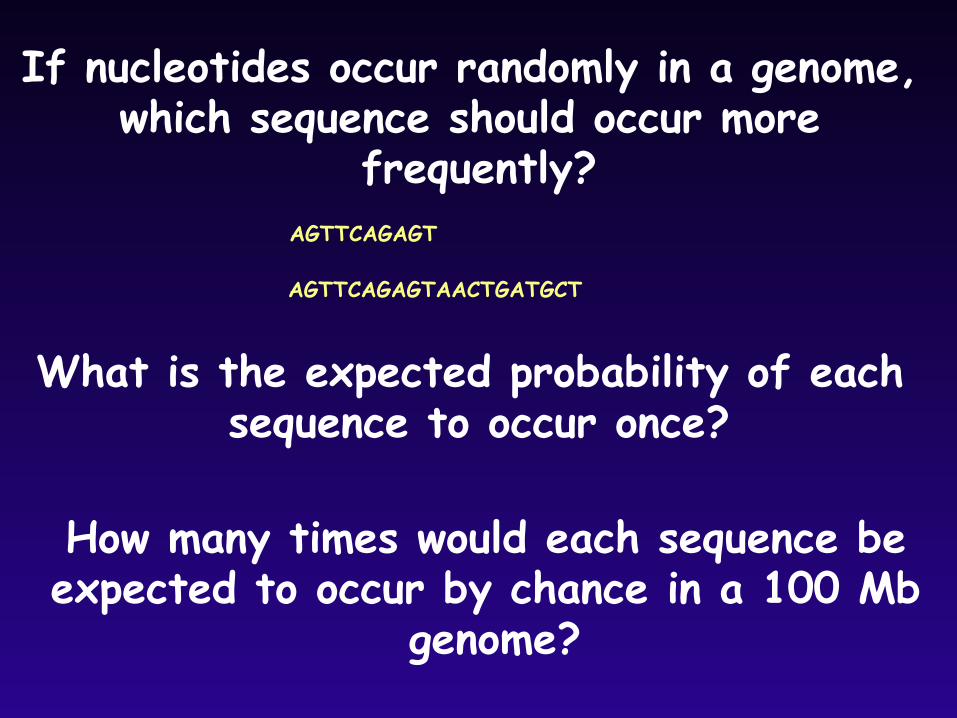
If nucleotides occur randomly in a genome, which sequence should occur more
frequently? AGTTCAGAGT
AGTTCAGAGTAACTGATGCT
What is the expected probability of each sequence to occur once?
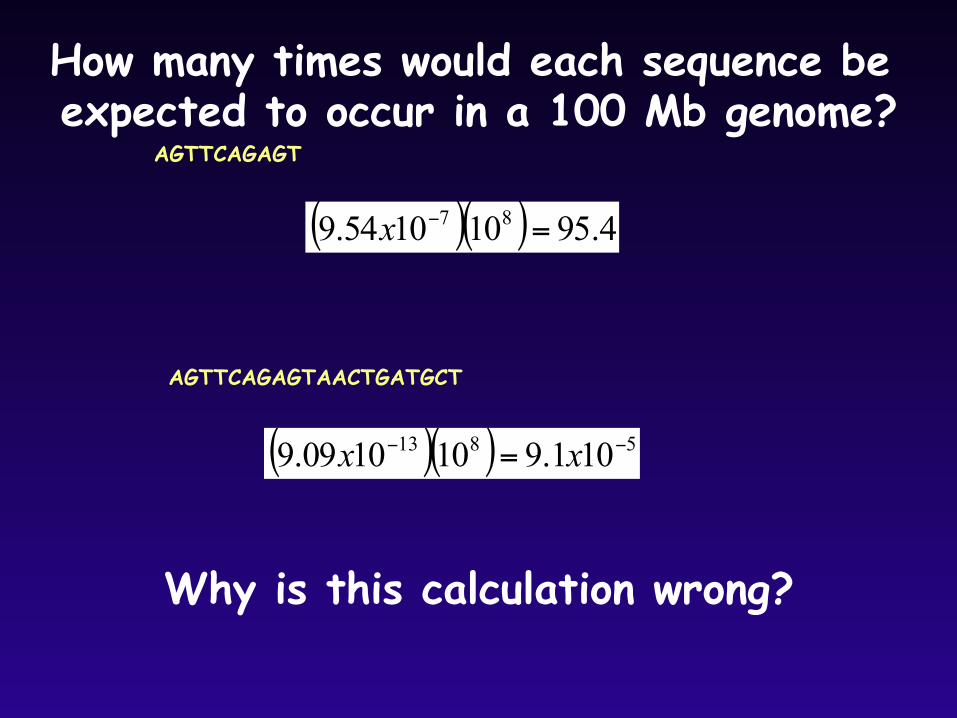
How many times would each sequence be expected to occur by chance in a 100 Mb
genome?
AGTTCAGAGT
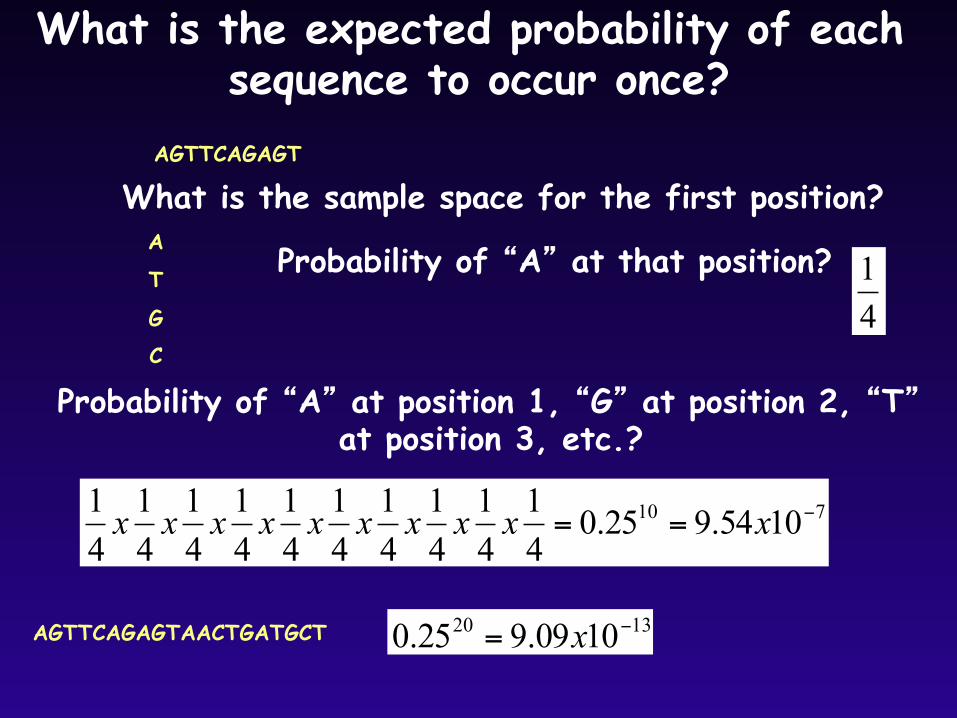
What is the expected probability of each sequence to occur once?
What is the sample space for the first position? A
T
G C
Probability of “A” at that position? 41
Probability of “A” at position 1, “G” at position 2, “T” at position 3, etc.?
710 1054.925.041
41
41
41
41
41
41
41
41
41 −== xxxxxxxxxx
AGTTCAGAGTAACTGATGCT 1320 1009.925.0 −= x
AGTTCAGAGT
How many times would each sequence be expected to occur in a 100 Mb genome?
( )( ) 4.95101054.9 87 =−x
AGTTCAGAGTAACTGATGCT
( )( ) 5813 101.9101009.9 −− = xx
Why is this calculation wrong?
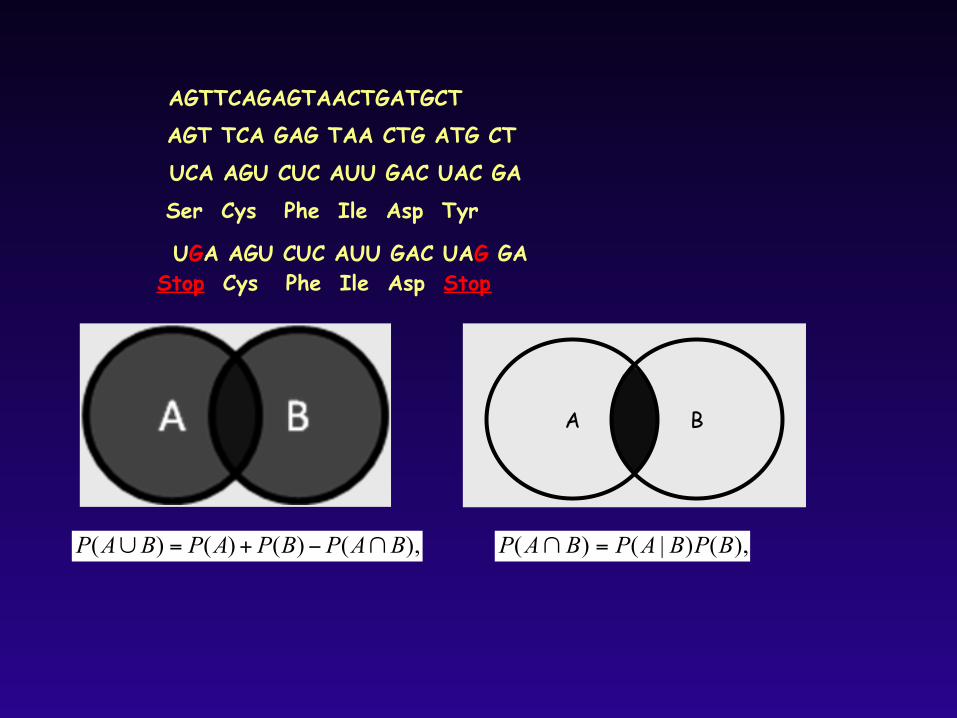
),()|()( BPBAPBAP =∩),()()()( BAPBPAPBAP ∩−+=∪
A B
AGTTCAGAGTAACTGATGCT AGT TCA GAG TAA CTG ATG CT
UCA AGU CUC AUU GAC UAC GA
Ser Cys Phe Ile Asp Tyr
UGA AGU CUC AUU GAC UAG GA Stop Cys Phe Ile Asp Stop
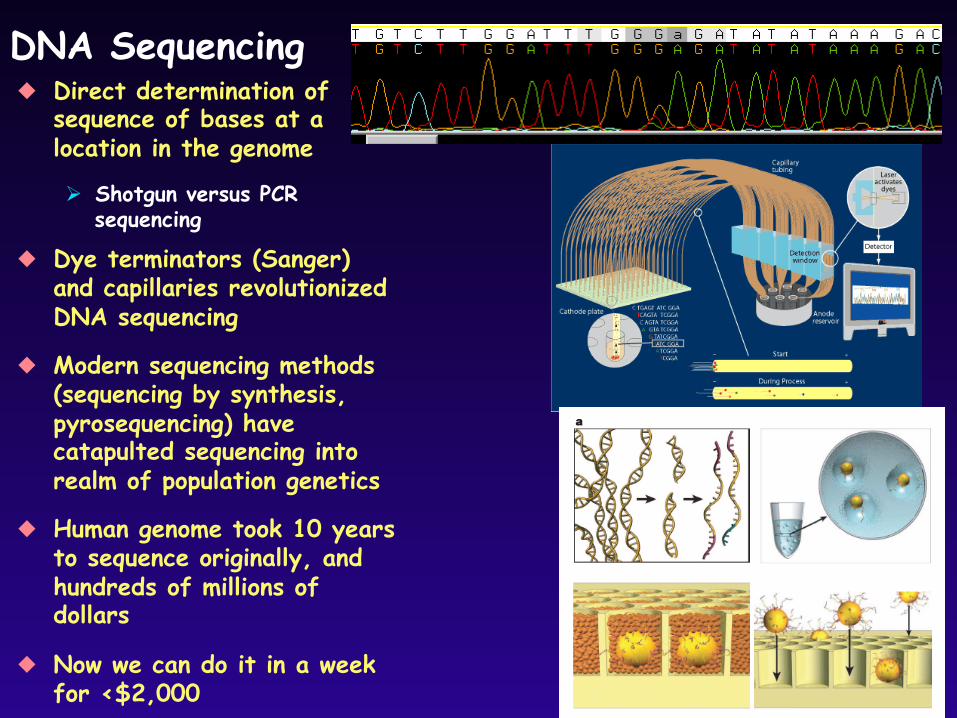
DNA Sequencing Direct determination of
sequence of bases at a location in the genome
Shotgun versus PCR sequencing
Dye terminators (Sanger) and capillaries revolutionized DNA sequencing
Modern sequencing methods (sequencing by synthesis, pyrosequencing) have catapulted sequencing into realm of population genetics
Human genome took 10 years to sequence originally, and hundreds of millions of dollars
Now we can do it in a week for <$2,000
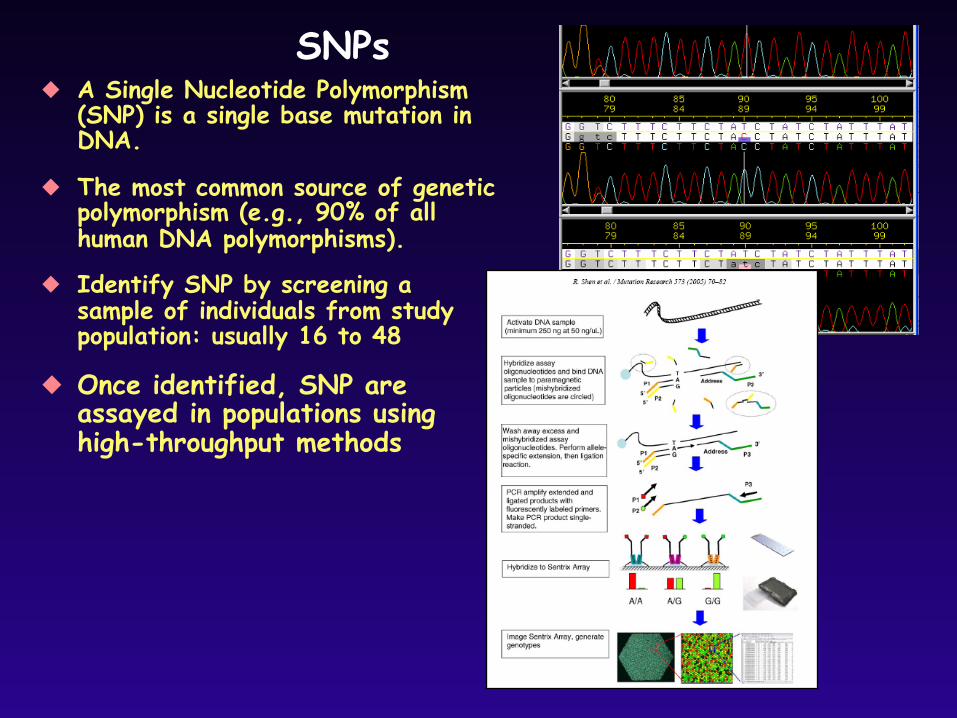
SNPs A Single Nucleotide Polymorphism
(SNP) is a single base mutation in DNA.
The most common source of genetic polymorphism (e.g., 90% of all human DNA polymorphisms).
Identify SNP by screening a sample of individuals from study population: usually 16 to 48
Once identified, SNP are assayed in populations using high-throughput methods
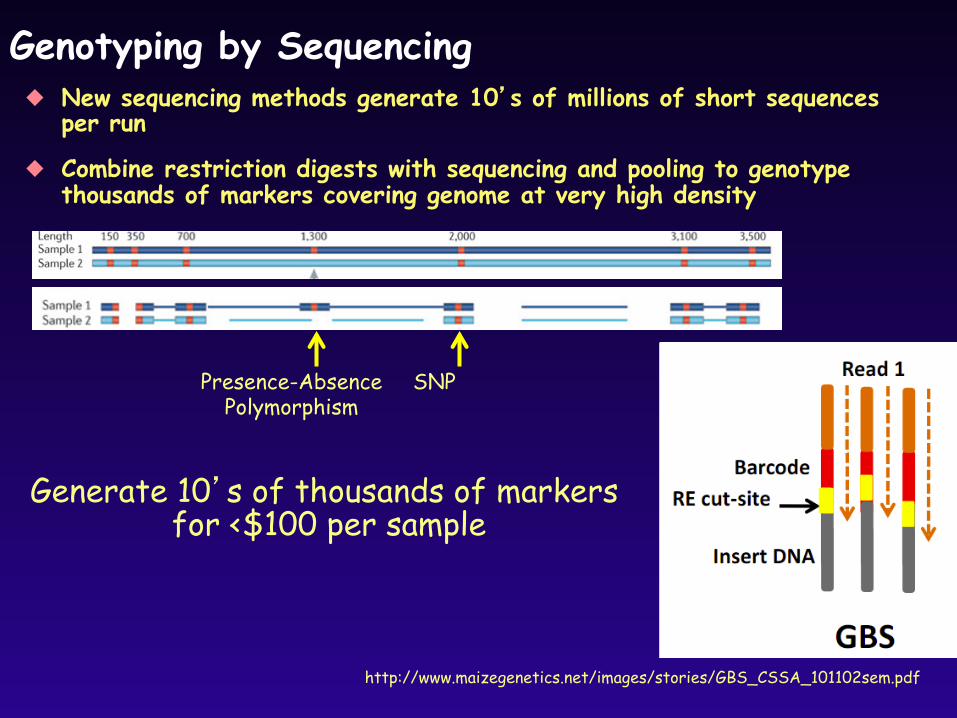
Genotyping by Sequencing New sequencing methods generate 10’s of millions of short sequences
per run
Combine restriction digests with sequencing and pooling to genotype thousands of markers covering genome at very high density
http://www.maizegenetics.net/images/stories/GBS_CSSA_101102sem.pdf
Generate 10’s of thousands of markers for <$100 per sample
Presence-Absence Polymorphism
SNP
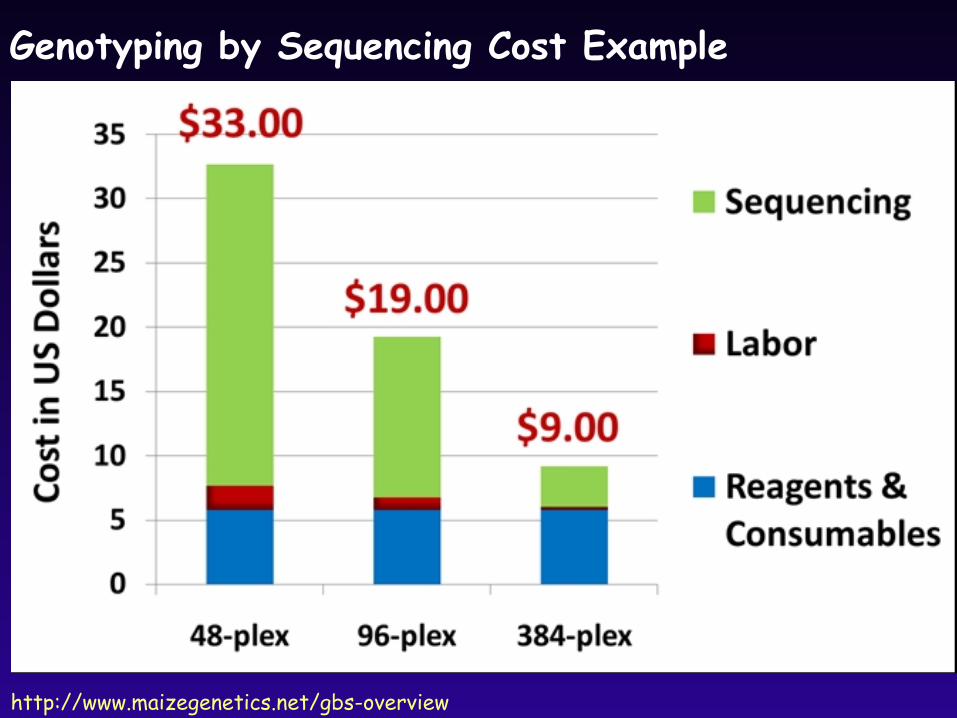
Genotyping by Sequencing Cost Example
http://www.maizegenetics.net/gbs-overview
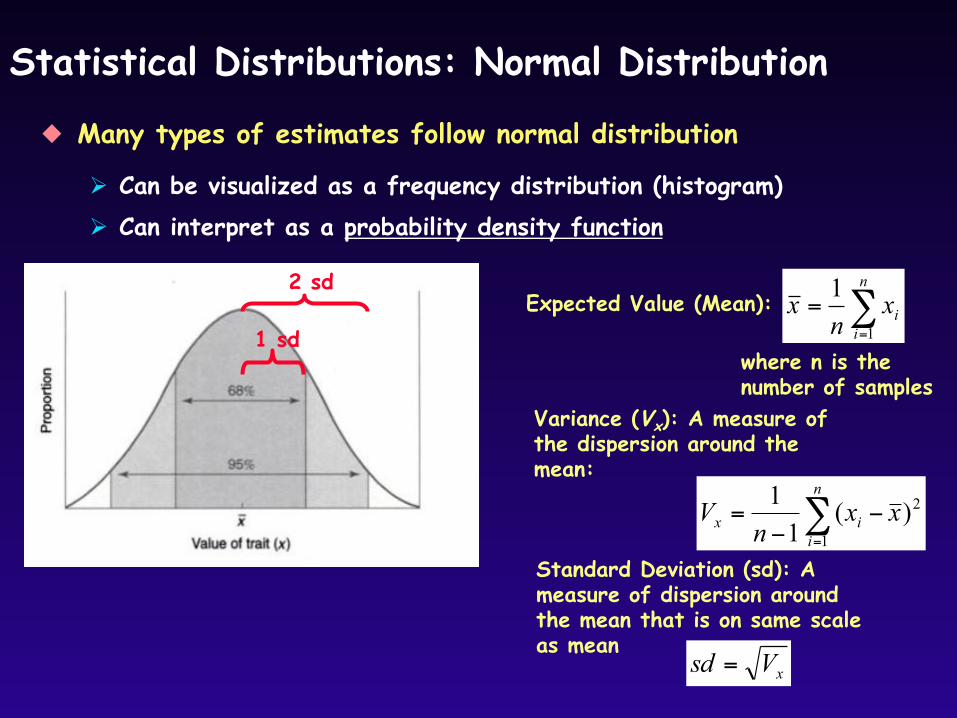
Statistical Distributions: Normal Distribution
Many types of estimates follow normal distribution
Can be visualized as a frequency distribution (histogram) Can interpret as a probability density function
Variance (Vx): A measure of the dispersion around the mean:
∑=
−−
=n
iix xx
nV
1
2)(11
Expected Value (Mean): ∑=
=n
iixn
x1
1
where n is the number of samples
Standard Deviation (sd): A measure of dispersion around the mean that is on same scale as mean
xVsd =
1 sd
2 sd
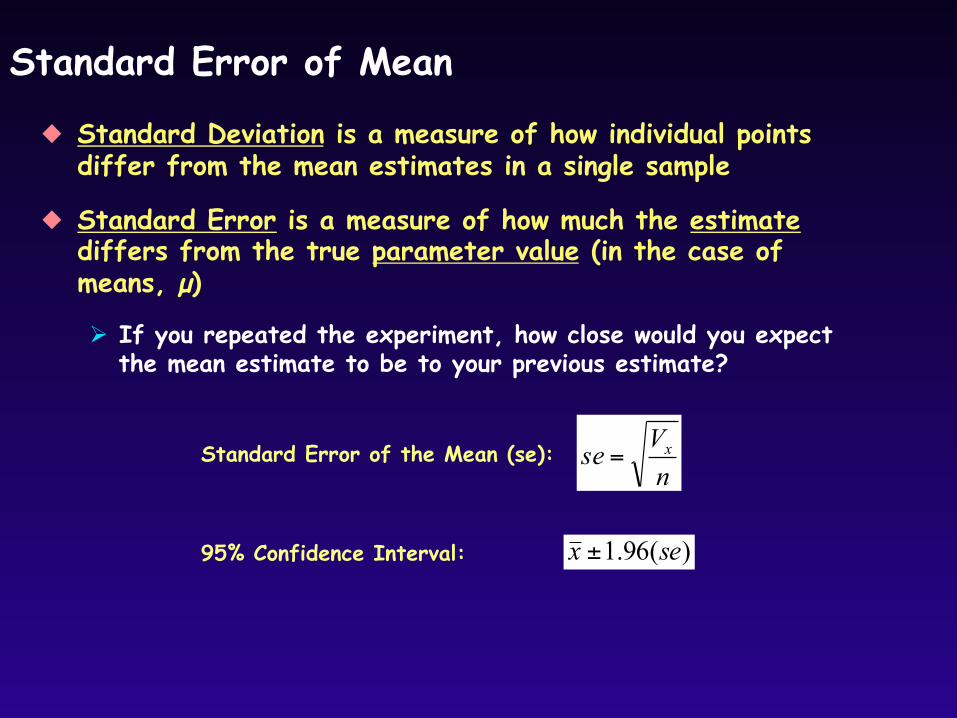
Standard Error of Mean
Standard Deviation is a measure of how individual points differ from the mean estimates in a single sample
Standard Error is a measure of how much the estimate differs from the true parameter value (in the case of means, µ)
If you repeated the experiment, how close would you expect the mean estimate to be to your previous estimate?
Standard Error of the Mean (se): nVse x=
95% Confidence Interval: )(96.1 sex ±
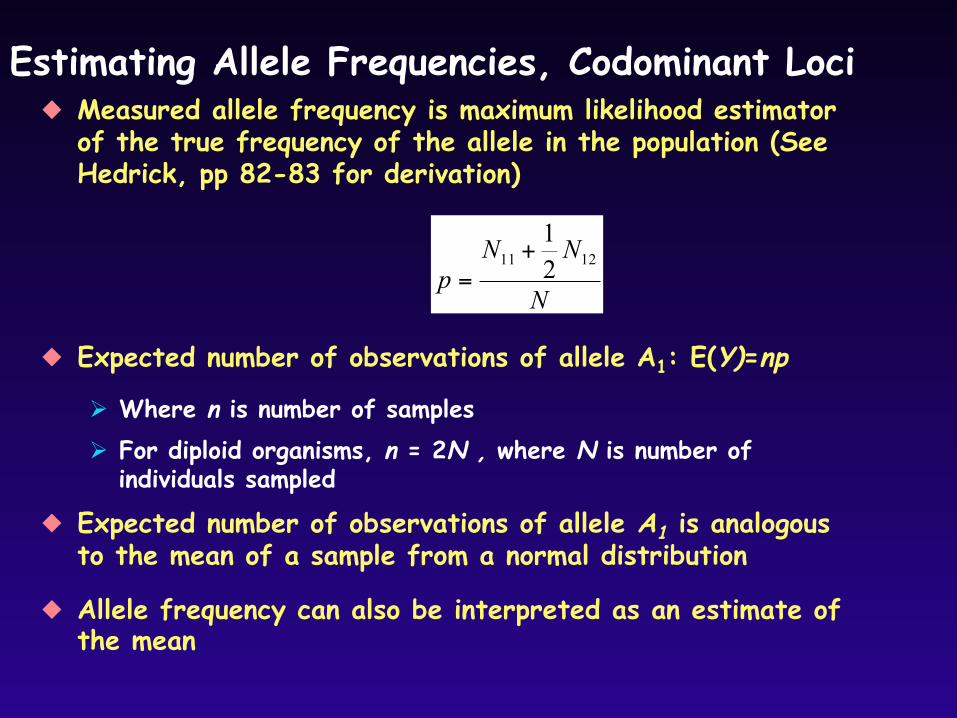
Estimating Allele Frequencies, Codominant Loci Measured allele frequency is maximum likelihood estimator
of the true frequency of the allele in the population (See Hedrick, pp 82-83 for derivation)
N
NNp
1211 21
+=
Expected number of observations of allele A1: E(Y)=np
Where n is number of samples For diploid organisms, n = 2N , where N is number of
individuals sampled
Expected number of observations of allele A1 is analogous to the mean of a sample from a normal distribution
Allele frequency can also be interpreted as an estimate of the mean
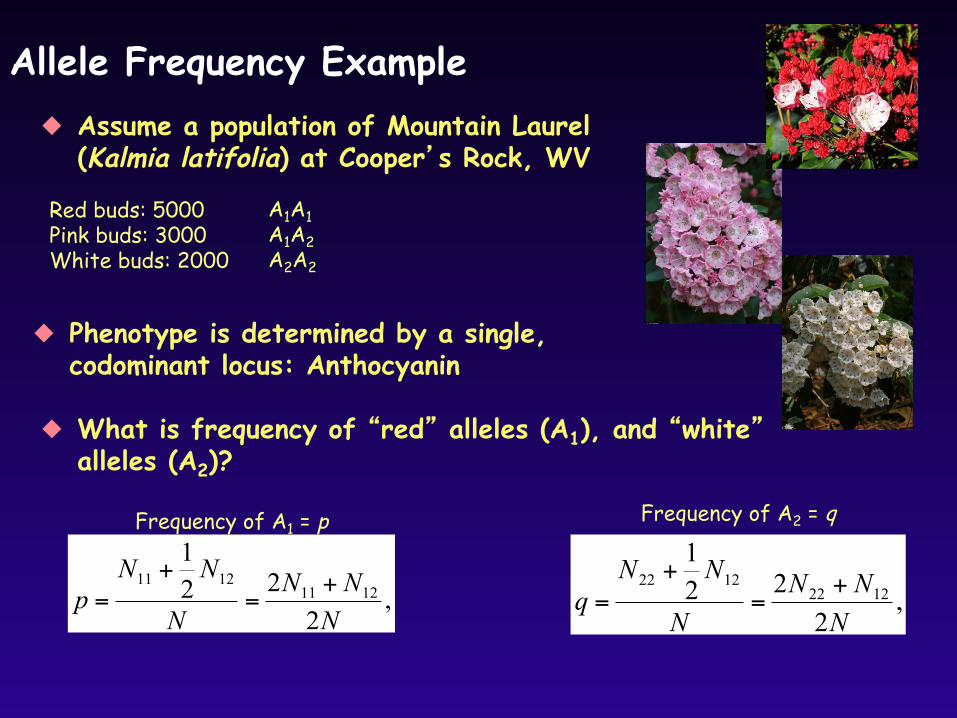
Assume a population of Mountain Laurel (Kalmia latifolia) at Cooper’s Rock, WV
Allele Frequency Example
Red buds: 5000 Pink buds: 3000 White buds: 2000
Phenotype is determined by a single, codominant locus: Anthocyanin
What is frequency of “red” alleles (A1), and “white” alleles (A2)?
A1A1 A1A2 A2A2
,2
221
12111211
NNN
N
NNp +
=+
=
Frequency of A1 = p
,2
221
12221222
NNN
N
NNq +
=+
=
Frequency of A2 = q
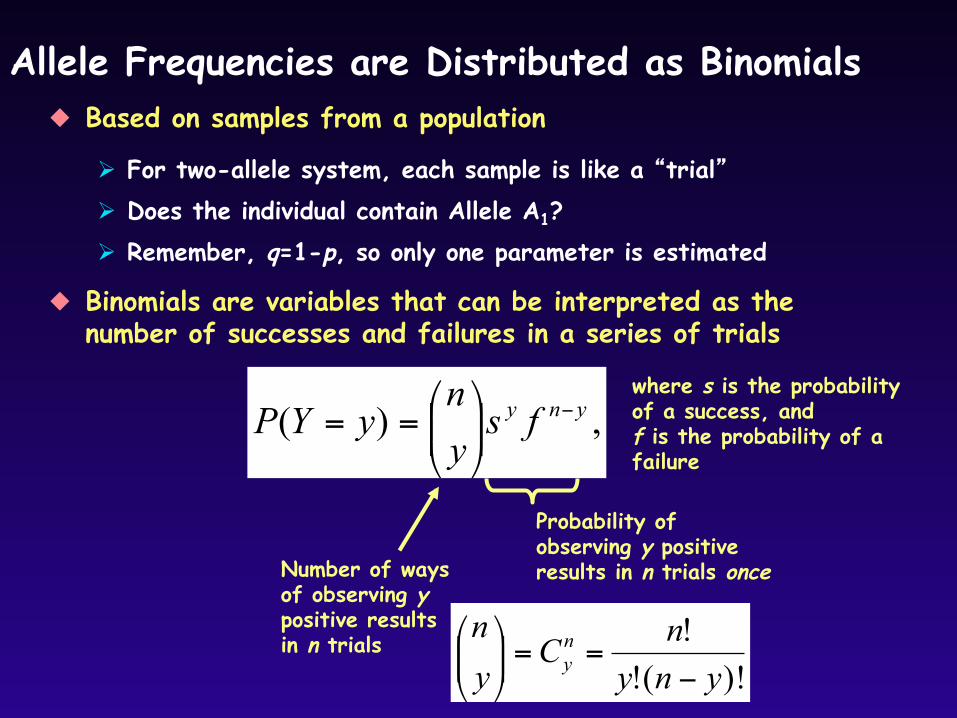
Allele Frequencies are Distributed as Binomials
Binomials are variables that can be interpreted as the number of successes and failures in a series of trials
Based on samples from a population
For two-allele system, each sample is like a “trial” Does the individual contain Allele A1? Remember, q=1-p, so only one parameter is estimated
Number of ways of observing y positive results in n trials
Probability of observing y positive results in n trials once
,)( yny fsyn
yYP −⎟⎟⎠
⎞⎜⎜⎝
⎛==
)!(!!yny
nCyn n
y −==⎟⎟
⎠
⎞⎜⎜⎝
⎛
where s is the probability of a success, and f is the probability of a failure
Given the allele frequencies that you calculated earlier for Cooper’s Rock
Kalmia latifolia, what is the probability of observing two “white” alleles in a
sample of two plants?
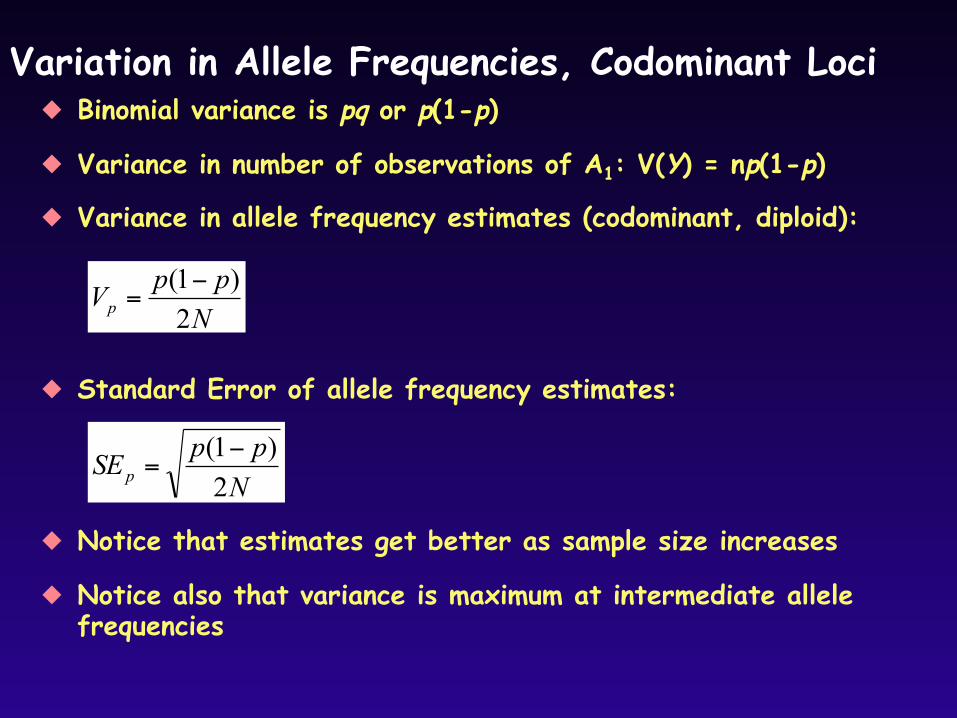
Variation in Allele Frequencies, Codominant Loci Binomial variance is pq or p(1-p)
Variance in number of observations of A1: V(Y) = np(1-p)
Variance in allele frequency estimates (codominant, diploid):
NppVp 2)1( −
=
Standard Error of allele frequency estimates:
NppSEp 2)1( −
=
Notice that estimates get better as sample size increases
Notice also that variance is maximum at intermediate allele frequencies
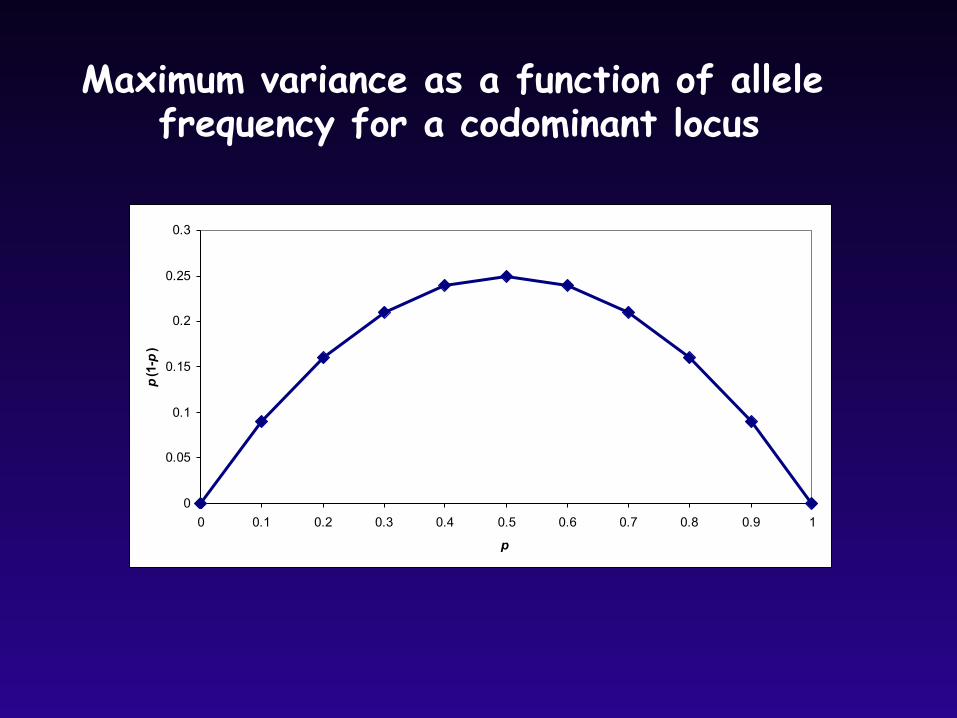
Maximum variance as a function of allele frequency for a codominant locus
0
0.05
0.1
0.15
0.2
0.25
0.3
0 0.1 0.2 0.3 0.4 0.5 0.6 0.7 0.8 0.9 1
p
p(1-p)
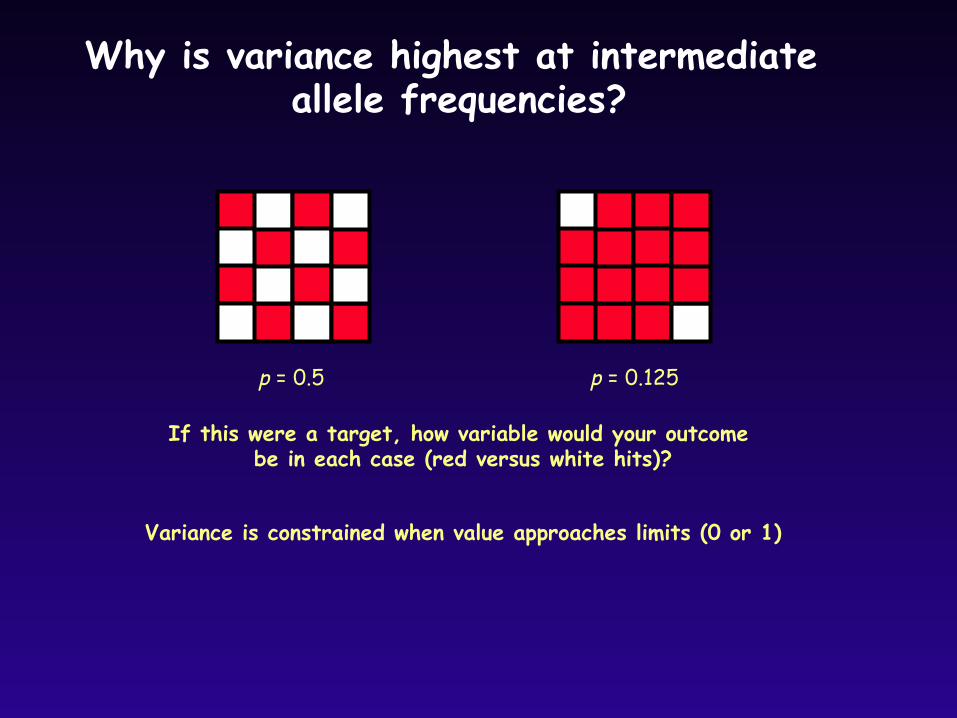
Why is variance highest at intermediate allele frequencies?
p = 0.5
If this were a target, how variable would your outcome be in each case (red versus white hits)?
Variance is constrained when value approaches limits (0 or 1)
p = 0.125
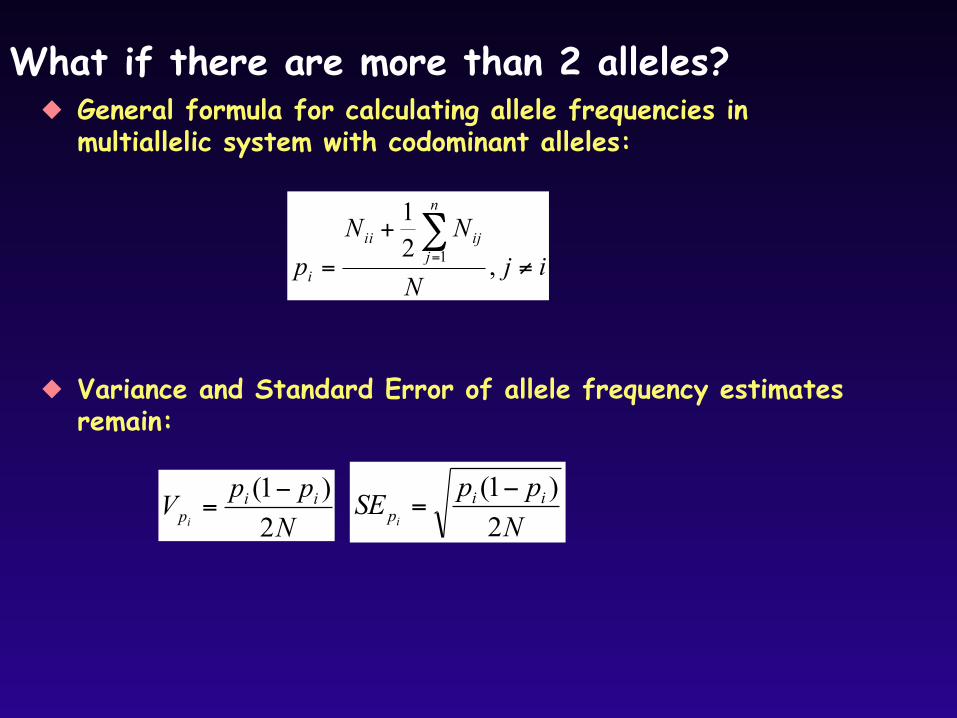
What if there are more than 2 alleles? General formula for calculating allele frequencies in
multiallelic system with codominant alleles:
NppV ii
pi 2)1( −
=
Variance and Standard Error of allele frequency estimates remain:
NppSE ii
pi 2)1( −
=
ijN
NNp
n
jijii
i ≠
+
=∑= ,
21
1
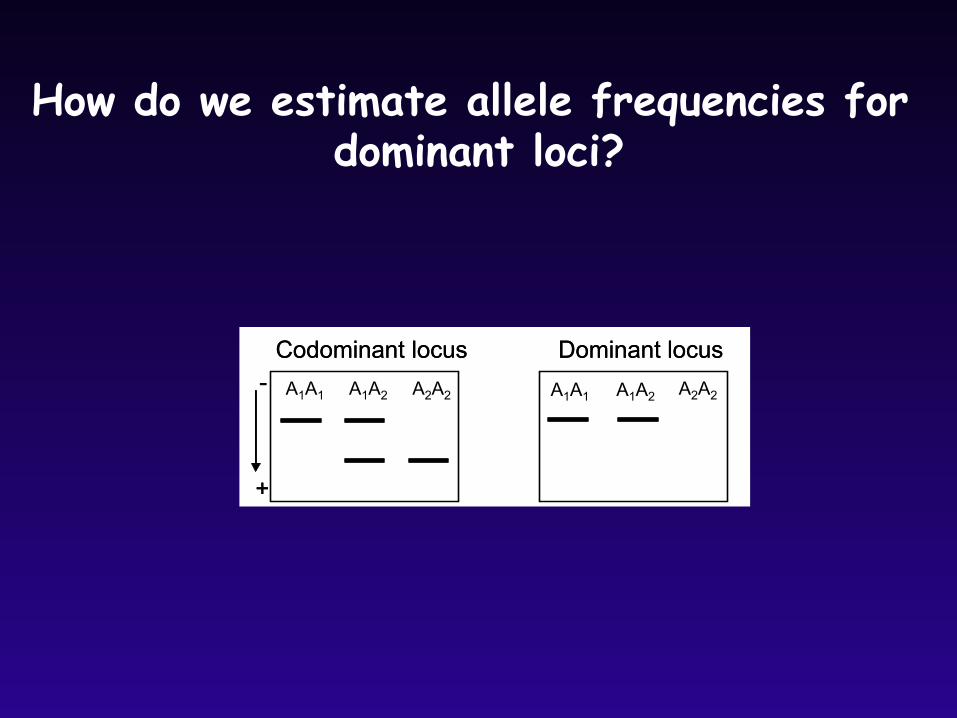
How do we estimate allele frequencies for dominant loci?
A2A2
Codominant locus Dominant locus
A1A1 A1A2 A2A2 -
+
A1A1 A1A2
Codominant locus Dominant locus -
+
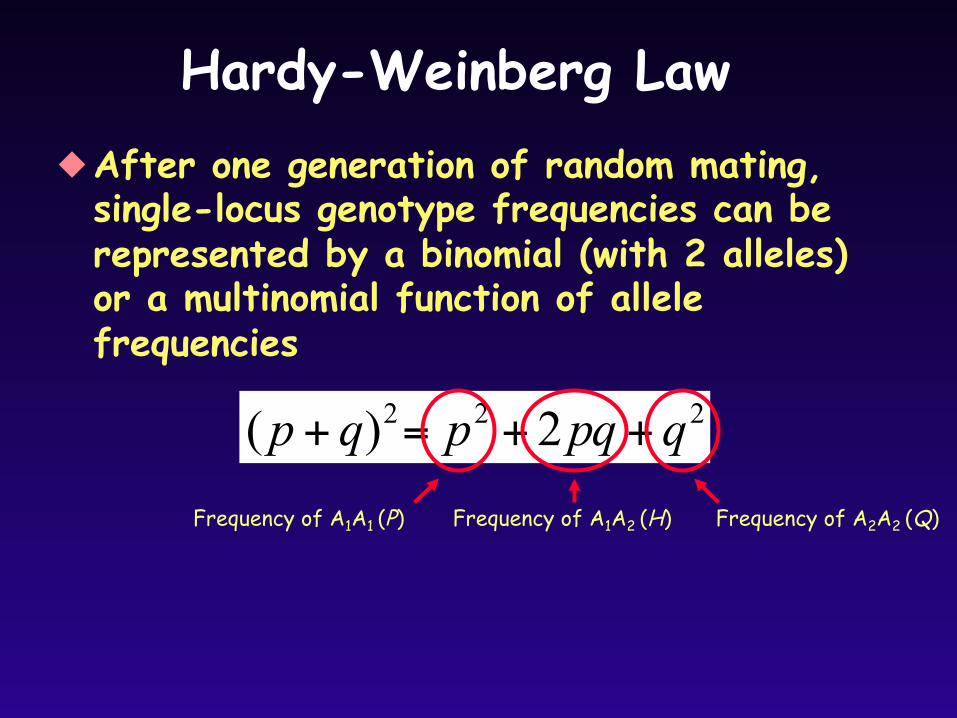
Hardy-Weinberg Law After one generation of random mating,
single-locus genotype frequencies can be represented by a binomial (with 2 alleles) or a multinomial function of allele frequencies
222 2)( qpqpqp ++=+
Frequency of A2A2 (Q) Frequency of A1A1 (P) Frequency of A1A2 (H)
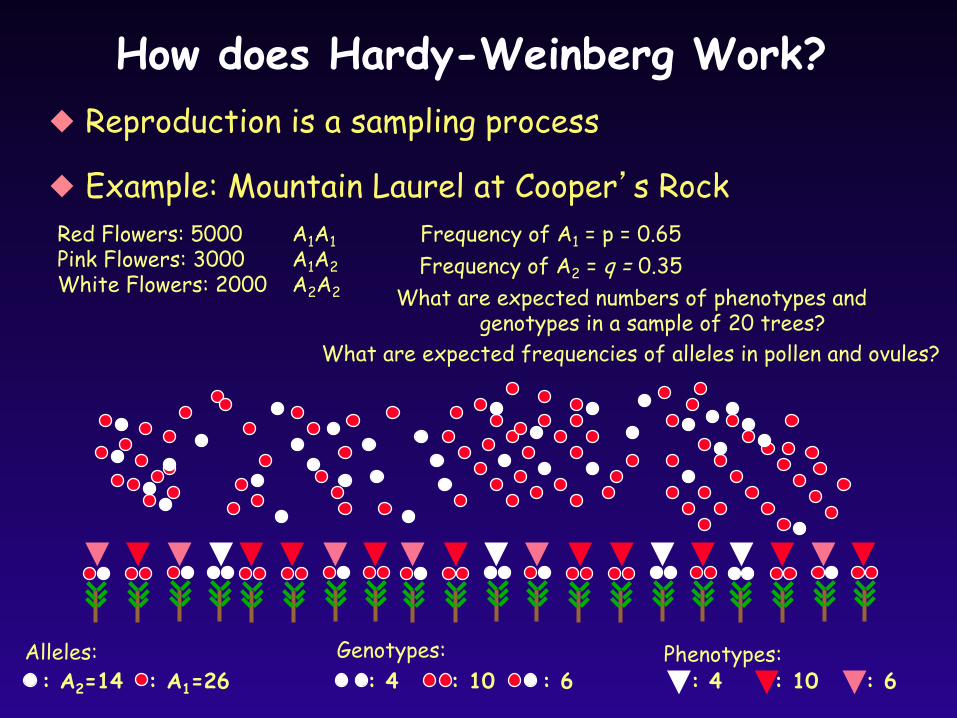
How does Hardy-Weinberg Work? Reproduction is a sampling process
Example: Mountain Laurel at Cooper’s Rock Red Flowers: 5000 Pink Flowers: 3000 White Flowers: 2000
A1A1 A1A2 A2A2
Frequency of A1 = p = 0.65
Frequency of A2 = q = 0.35
: A2=14 : A1=26 Alleles:
: 4 : 10 Genotypes:
: 6 Phenotypes:
: 4 : 10 : 6
What are expected numbers of phenotypes and genotypes in a sample of 20 trees?
What are expected frequencies of alleles in pollen and ovules?
What will be the genotype and phenotype frequencies in the next
generation?
What assumptions must we make?
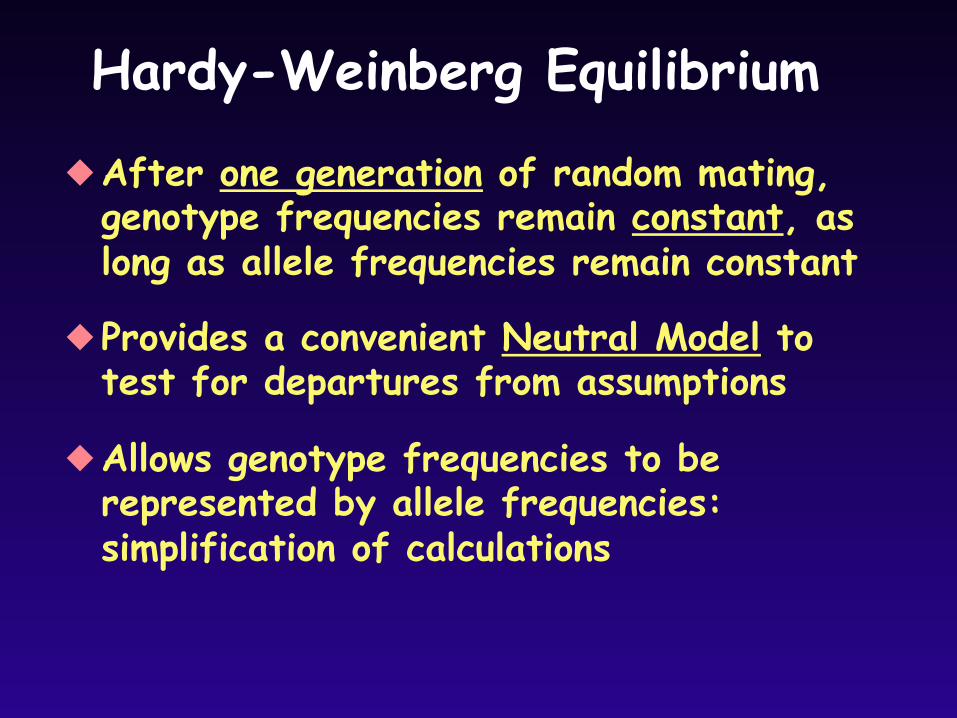
Hardy-Weinberg Equilibrium
After one generation of random mating, genotype frequencies remain constant, as long as allele frequencies remain constant
Provides a convenient Neutral Model to test for departures from assumptions
Allows genotype frequencies to be represented by allele frequencies: simplification of calculations
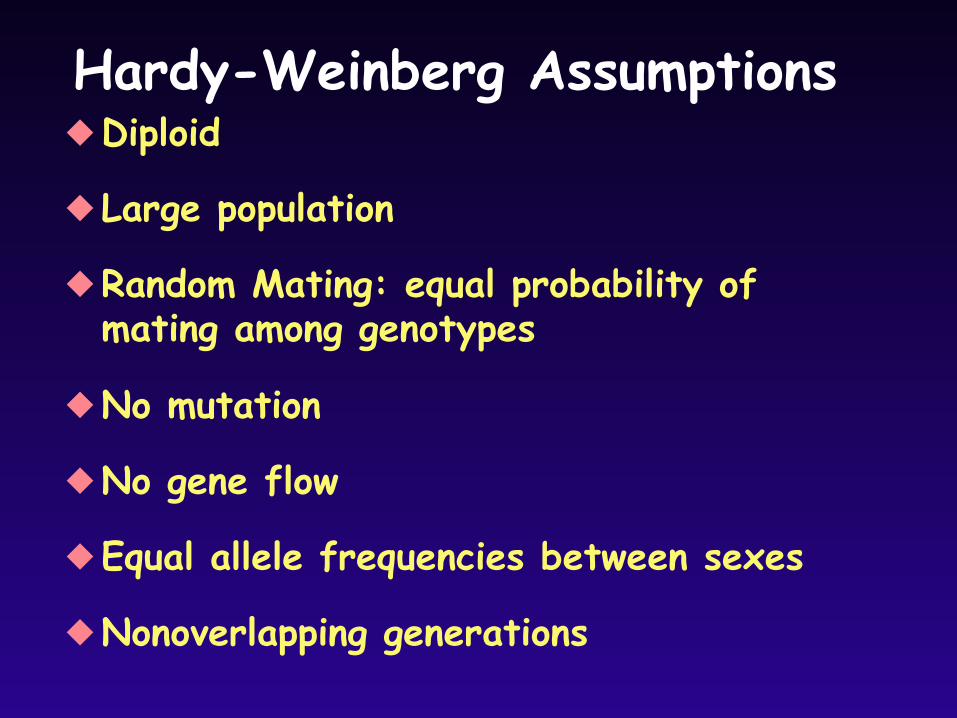
Hardy-Weinberg Assumptions Diploid
Large population
Random Mating: equal probability of mating among genotypes
No mutation
No gene flow
Equal allele frequencies between sexes
Nonoverlapping generations
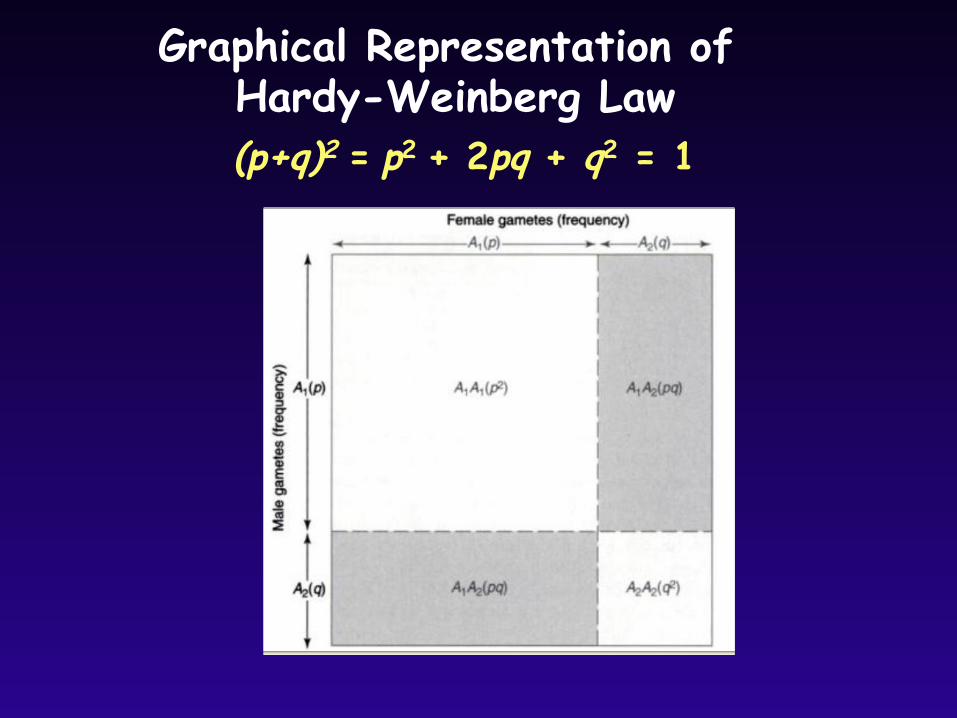
Graphical Representation of Hardy-Weinberg Law (p+q)2 = p2 + 2pq + q2 = 1
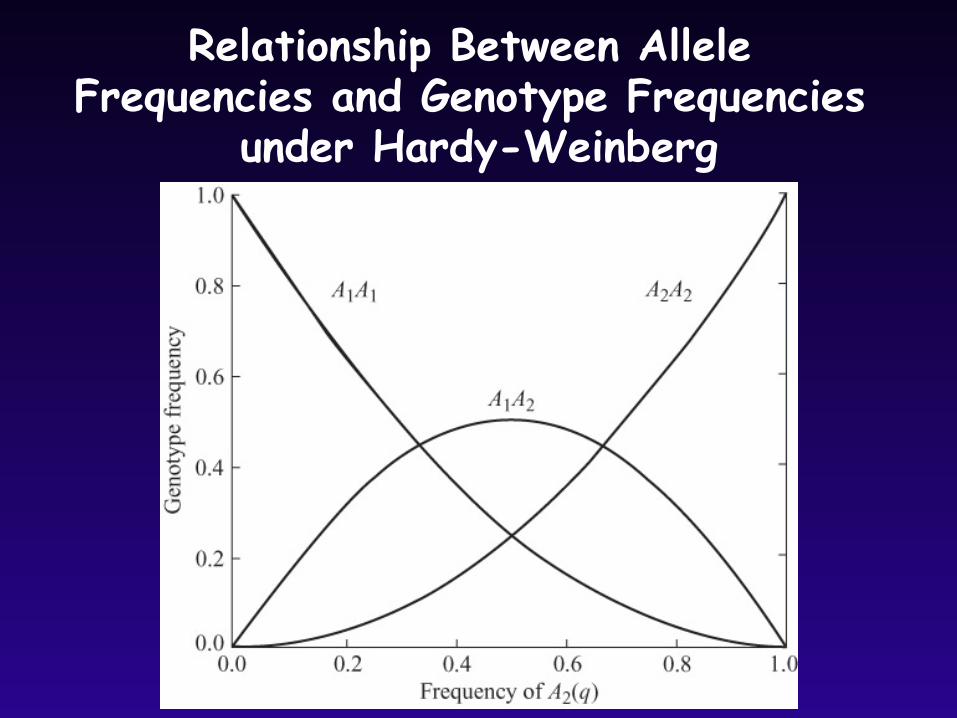
Relationship Between Allele Frequencies and Genotype Frequencies
under Hardy-Weinberg
Top Related