


Languages
Pages
Legal


STA 291SPRING 2010
Lecture 17Dustin Lueker
A way of statistically testing a hypothesis by comparing the data to values predicted by the hypothesis◦ Data that fall far from the predicted values
provide evidence against the hypothesis
Significance Test
2STA 291 Spring 2010 Lecture 17
1. State a hypothesis that you would like to find evidence against
2. Get data and calculate a statistic1. Sample mean2. Sample proportion
3. Hypothesis determines the sampling distribution of our statistic
4. If the sample value is very unreasonable given our initial hypothesis, then we conclude that the hypothesis is wrong
Logical Procedure
3STA 291 Spring 2010 Lecture 17

Assumptions◦ Type of data, population distribution, sample size
Hypotheses◦ Null hypothesis
H0
◦ Alternative hypothesis H1
Test Statistic◦ Compares point estimate to parameter value under the null hypothesis
P-value◦ Uses the sampling distribution to quantify evidence against null hypothesis◦ Small p-value is more contradictory
Conclusion◦ Report p-value◦ Make formal rejection decision (optional)
Useful for those that are not familiar with hypothesis testing
Elements of a Significance Test
4STA 291 Spring 2010 Lecture 17

The z-score has a standard normal distribution
◦ The z-score measures how many estimated standard errors the sample mean falls from the hypothesized population mean
The farther the sample mean falls from the larger the absolute value of the z test statistic, and the stronger the evidence against the null hypothesis
Test Statistic
5
0
STA 291 Spring 2010 Lecture 17
ns
xz 0
The mean age at first marriage for married men in a New England community was 22 years in 1790
For a random sample of 40 married men in that community in 1990, the sample mean age at first marriage was 26 with a standard deviation of 9
State the hypotheses, find the test statistic and p-value for testing whether or not the mean has changed, interpret◦ Make a decision, using a significance level of 5%
Example
6STA 291 Spring 2010 Lecture 17

How unusual is the observed test statistic when the null hypothesis is assumed true?◦ The p-value is the probability, assuming that the
null hypothesis is true, that the test statistic takes values at least as contradictory to the null hypothesis as the value actually observed The smaller the p-value, the more strongly the data
contradicts the null hypothesis
P-value
7STA 291 Spring 2010 Lecture 17

Has the advantage that different test results from different tests can be compared◦ Always a number between 0 and 1, no matter
what type of data is being examined Probability that a standard normal
distribution takes values more extreme than the observed z-score
The smaller the p-value, the stronger the evidence against the null hypothesis and in favor of the alternative hypothesis
P-value
8STA 291 Spring 2010 Lecture 17
In addition to reporting the p-value, sometimes a formal decision is made about rejecting or not rejecting the null hypothesis◦ Most studies require small p-values like p<.05 or
p<.01 as significant evidence against the null hypothesis “The results are significant at the 5% level”
α=.05
Conclusion
9STA 291 Spring 2010 Lecture 17
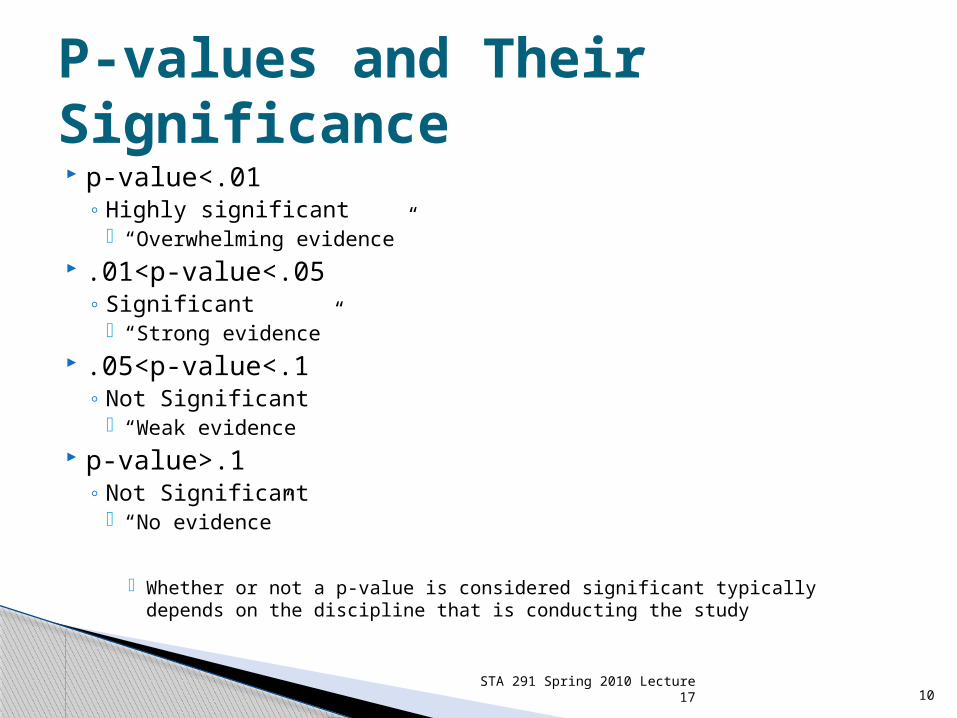
p-value<.01◦ Highly significant
“Overwhelming evidence” .01<p-value<.05
◦ Significant “Strong evidence”
.05<p-value<.1◦ Not Significant
“Weak evidence p-value>.1
◦ Not Significant “No evidence”
Whether or not a p-value is considered significant typically depends on the discipline that is conducting the study
P-values and Their Significance
10STA 291 Spring 2010 Lecture 17
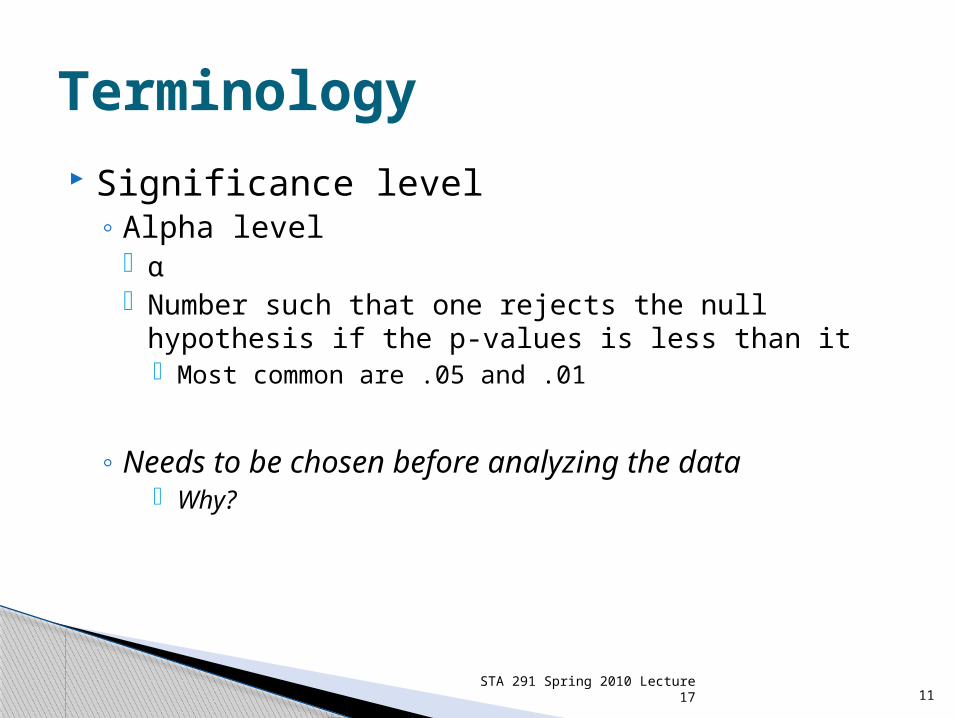
Significance level◦ Alpha level
α Number such that one rejects the null hypothesis if
the p-values is less than it Most common are .05 and .01
◦ Needs to be chosen before analyzing the data Why?
Terminology
11STA 291 Spring 2010 Lecture 17
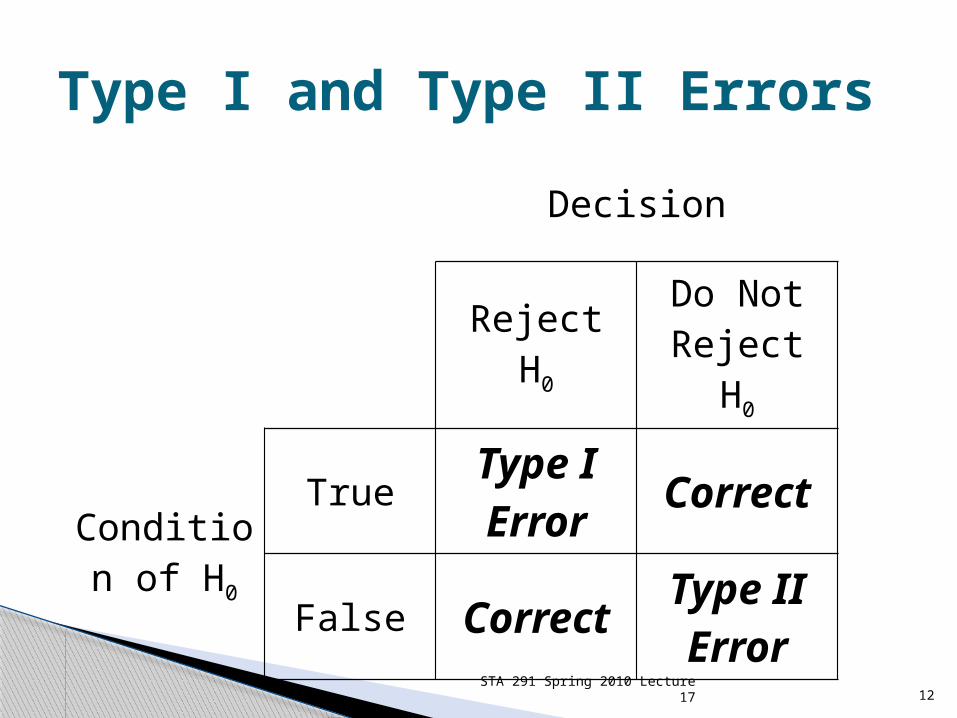
Type I and Type II Errors
12
Decision
Reject H0
Do Not Reject H0
Condition of H0
TrueType I Error
Correct
False CorrectType II Error
STA 291 Spring 2010 Lecture 17

α=probability of Type I error β=probability of Type II error Power=1-β
◦ The smaller the probability of Type I error, the larger the probability of Type II error and the smaller the power If you ask for very strong evidence to reject the null
hypothesis (very small α), it is more likely that you fail to detect a real difference
In reality, α is specified, and the probability of Type II error could be calculated, but the calculations are often difficult
Type I and Type II Errors
13STA 291 Spring 2010 Lecture 17

In a criminal trial someone is assumed innocent until proven guilty◦ What type of error (in terms of hypothesis testing)
would be made if an innocent person is found guilty?◦ What type of error would be made if a guilty person
is found not guilty?◦ What does the Power represent (1-β)?
Also, the reason we only do not reject H0 instead of saying that we accept H0 is because of the way our hypothesis tests are set up Just like in a criminal trial someone is found not guilty
instead of innocent
Example
STA 291 Spring 2010 Lecture 17 14

If the consequences of a Type I error are very serious, then α should be small◦ Criminal trial example
In exploratory research, often a larger probability of Type I error is acceptable
If the sample size increases, both error probabilities decrease
How to choose α?
15STA 291 Spring 2010 Lecture 17

Which area of study would be most likely to use a very small level of significance?◦ Social Sciences◦ Medical◦ Physical Sciences
How to choose α?
STA 291 Spring 2010 Lecture 17 16
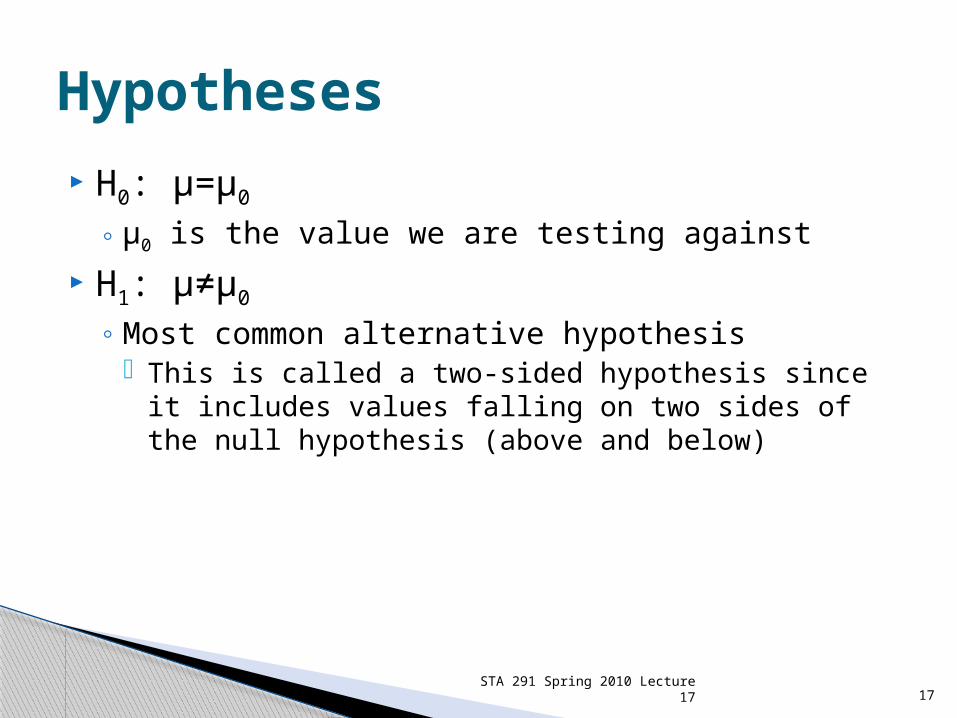
H0: μ=μ0
◦ μ0 is the value we are testing against
H1: μ≠μ0
◦ Most common alternative hypothesis This is called a two-sided hypothesis since it includes
values falling on two sides of the null hypothesis (above and below)
Hypotheses
17STA 291 Spring 2010 Lecture 17
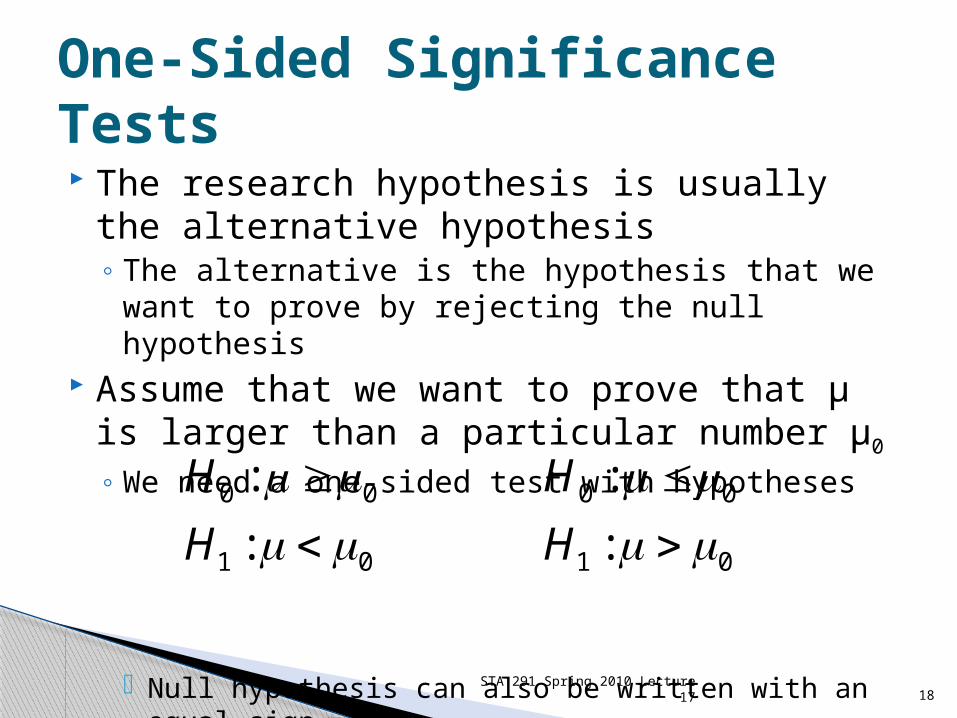
The research hypothesis is usually the alternative hypothesis◦ The alternative is the hypothesis that we want to
prove by rejecting the null hypothesis Assume that we want to prove that μ is
larger than a particular number μ0 ◦ We need a one-sided test with hypotheses
Null hypothesis can also be written with an equal sign
One-Sided Significance Tests
18
01
00
:
:
H
H
01
00
:
:
H
H
STA 291 Spring 2010 Lecture 17
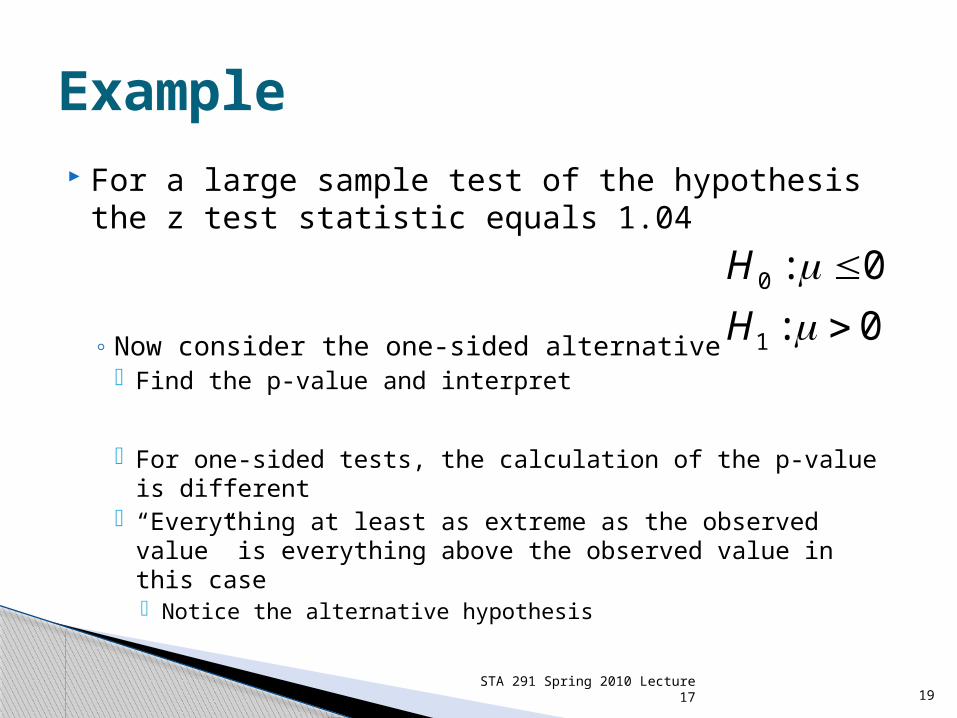
For a large sample test of the hypothesis the z test statistic equals 1.04
◦ Now consider the one-sided alternative Find the p-value and interpret
For one-sided tests, the calculation of the p-value is different
“Everything at least as extreme as the observed value” is everything above the observed value in this case Notice the alternative hypothesis
Example
19STA 291 Spring 2010 Lecture 17
0:
0:
1
0
H
H

Two sided tests are more common in practice
Look for formulations like◦ “test whether the mean has changed”◦ “test whether the mean has increased”◦ “test whether the mean is the same”◦ “test whether the mean has decreased”
One-Sided vs. Two-Sided Test
20STA 291 Spring 2010 Lecture 17
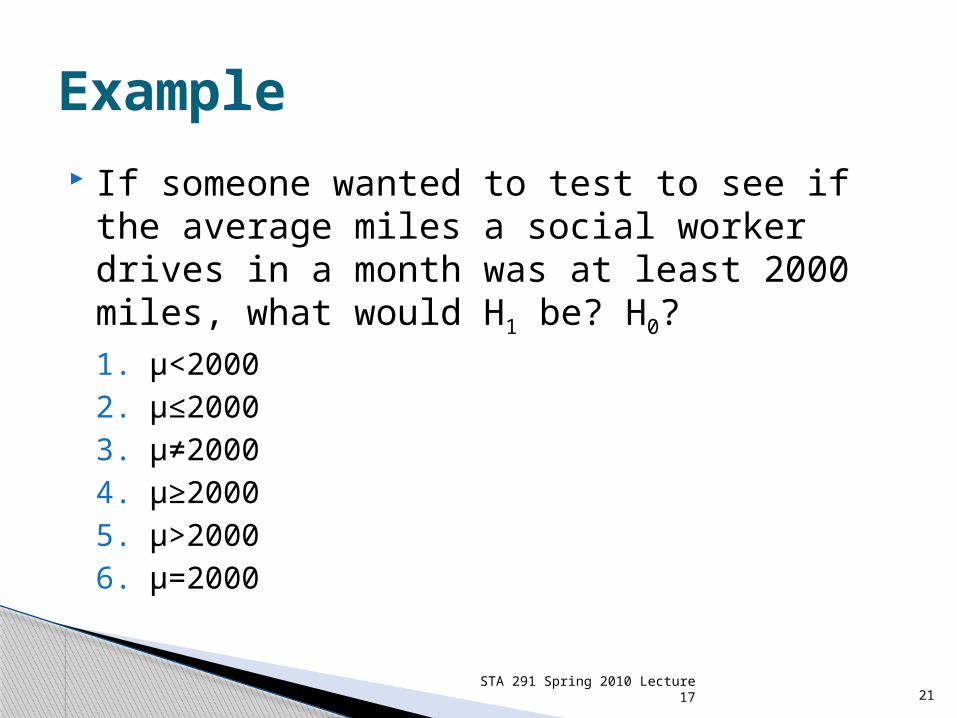
If someone wanted to test to see if the average miles a social worker drives in a month was at least 2000 miles, what would H1 be? H0? 1. μ<20002. μ≤20003. μ≠20004. μ≥20005. μ>20006. μ=2000
Example
STA 291 Spring 2010 Lecture 17 21
Top Related