


Languages
Pages
Legal


Lecture 12Projection and Least Square
Approximation
Shang-Hua Teng

Line Fitting and Predication
• Input: Table of paired data values (x, y)– Some connection between x and y.– Example: height ------ weight– Example: revenue ------ stock price– Example: Yesterday’s temperature at Pittsburgh --------- today’s temperature at Boston
• Output: a and b that best predicates y from x: y = ax + b

Scatter Plot of Data
Revenue
StockPrice

Regression Liney = ax+b
Revenue
StockPrice

Predication with Regression Liney = ax+b
Revenue
StockPrice

When Life is Perfecty = ax+b
Revenue
StockPrice
x1 x7
y7
x2
y1
y3
x3
y2
How do we find a and b

When Life is Perfecty = ax+b
Revenue
StockPrice
x1 x7
y7
x2
y1
y3
x3
y2
7
6
5
4
3
2
1
7
6
5
4
3
2
1
1
1
1
1
1
1
1
y
y
y
y
y
y
y
b
a
x
x
x
x
x
x
x

How to Solve it?
• By Elimination• What will happen?
7
6
5
4
3
2
1
7
6
5
4
3
2
1
1
1
1
1
1
1
1
y
y
y
y
y
y
y
b
a
x
x
x
x
x
x
x
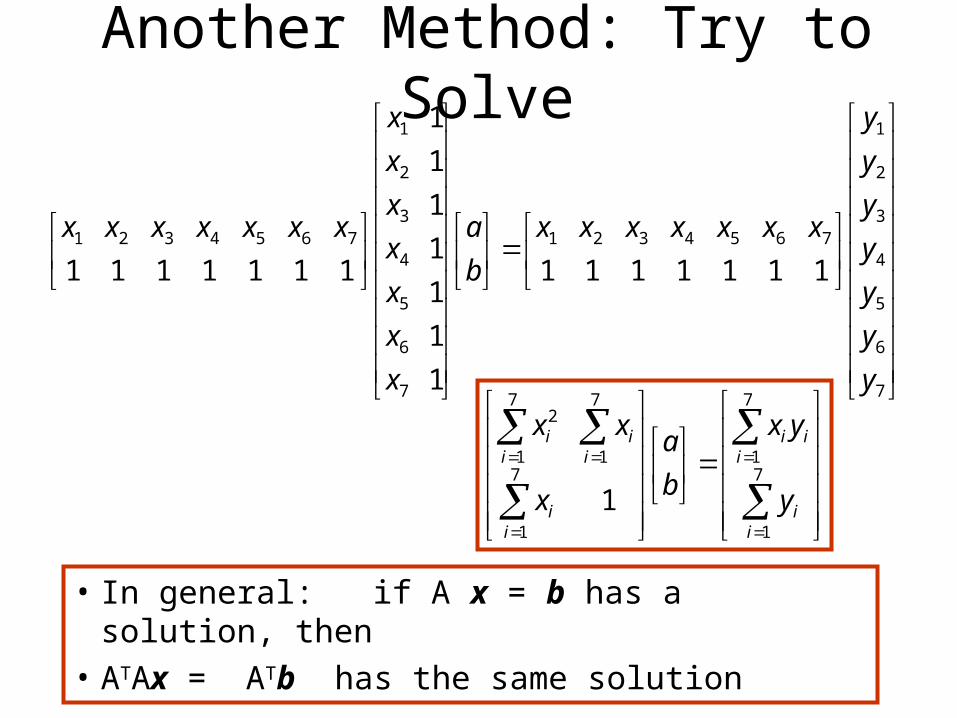
Another Method: Try to Solve
• In general: if A x = b has a solution, then
• ATAx = ATb has the same solution
7
6
5
4
3
2
1
7654321
7
6
5
4
3
2
1
7654321
1111111
1
1
1
1
1
1
1
1111111
y
y
y
y
y
y
y
xxxxxxx
b
a
x
x
x
x
x
x
x
xxxxxxx
7
1
7
17
1
7
1
7
1
2
1i
i
iii
ii
ii
ii
y
yx
b
a
x
xx

When Life is not PerfectNo perfect Regression Line
y = ax+b
Revenue
StockPrice

When Life is not PerfectNo perfect Regression Line
y = ax+b
Revenue
StockPrice
No solution!!!!!!What happen during elimination
7
6
5
4
3
2
1
7
6
5
4
3
2
1
1
1
1
1
1
1
1
y
y
y
y
y
y
y
b
a
x
x
x
x
x
x
x

Linear Algebra Magic
7
6
5
4
3
2
1
7654321
7
6
5
4
3
2
1
7654321
1111111
1
1
1
1
1
1
1
1111111
y
y
y
y
y
y
y
xxxxxxx
b
a
x
x
x
x
x
x
x
xxxxxxx
7
1
7
17
1
7
1
7
1
2
1i
i
iii
ii
ii
ii
y
yx
b
a
x
xx
• In general: if A x = b has no solution, then
• ATAx = ATb gives the best approximation

Least Squares
• No errors in x• Errors in y
• Best Fit• Find the line that
minimize the norm of the y errors
• (sum of the squares)

When Life is not PerfectLeast Square Approximation
Revenue
StockPrice
2
7
6
5
4
3
2
1
7
6
5
4
3
2
1
2
ˆˆ
1
1
1
1
1
1
1
minimize toˆ,ˆ Find
b
a
x
x
x
x
x
x
x
y
y
y
y
y
y
y
e
ba

In General: When Ax = b Does not Have Solution
• Residue error
Axbe • Least Square Approximation:
Find the best
22ˆ
minimizes that ˆ
xAbe
x

One Dimension
n
iii
n
ii
n
iiii
n
iii
nn
nnnnnn
baxaxabax
e
xab
xab
xab
e
xab
xab
x
a
a
b
b
e
b
b
x
a
a
11
2
1
2
1
2
2
112
111111
02

One Dimension
n
iii
n
ii
n
iiii
nn
baxaxabax
e
b
b
x
a
a
11
2
1
2
11
02
n
n
n
n
b
b
aax
a
a
aa 1
1
1
1

In General
0211
,1,
,11,1
,,1
2
1
2
1,
2
1,
1,11
2
1
,1,
,11,1111
,1,
,11,1
mnnmm
n
imii
n
j
n
iiijj
n
iiimm
n
iii
nnmm
n
nmnnmm
n
b
b
x
x
aa
aa
aax
e
xab
xab
xab
e
x
x
aa
aa
b
b
e
b
b
x
x
aa
aa

In General
mmnn
m
nnmm
n
mnn
m
i
mnnmm
n
b
b
aa
aa
x
x
aa
aa
aa
aa
x
e
b
b
x
x
aa
aa
1
,1,
,11,11
,1,
,11,1
,1,
,11,1
2
11
,1,
,11,1
0

Least Square Approximation
• In general: if A x = b has no solution, then
Solving ATAx = ATb produces
the least square approximation
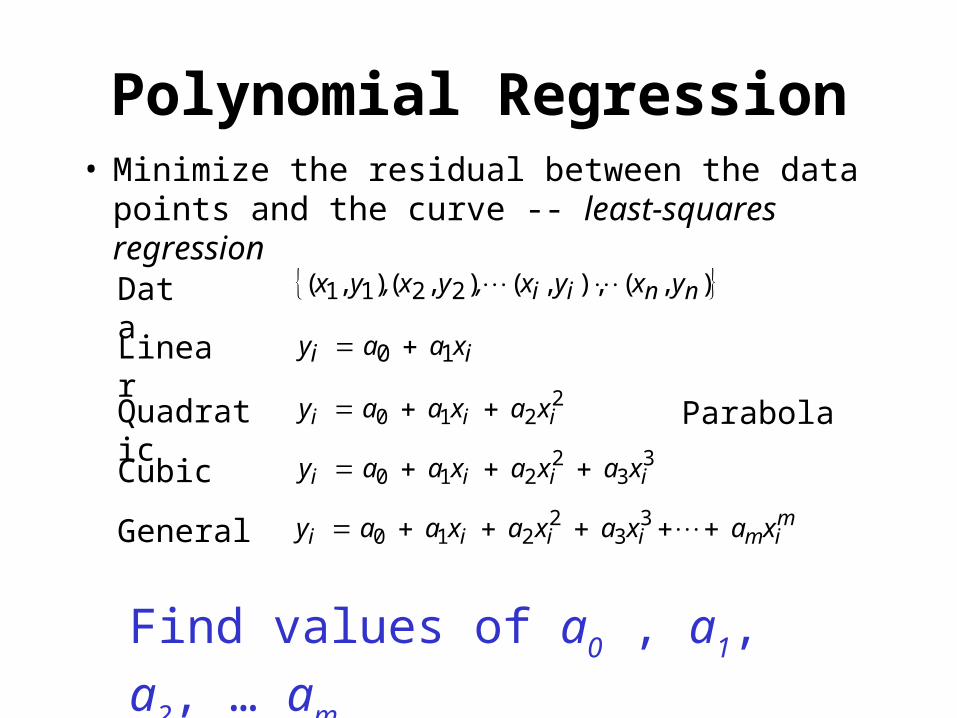
Polynomial Regression• Minimize the residual between the data points and
the curve -- least-squares regression
),(),,(),(),( 2211 nnii yxyx,yx,yx Data
Find values of a0 , a1, a2, … am
ii x a a y 10 Linear
2210 iii x a x a a y Quadratic
33
2210 iiii x a x a x a a y Cubic
General mimiiii x ax a x a x a a y 3
32
210
Parabola

Polynomial Regression
• Residual m
imiiiii x a x a x a x a a = ye 33
2210
n
i=
mm
n
i=i x a x a x ax a a y = e
1
233
2210
1
2
• Sum of squared residuals
• Linear Equations
mimiiii x a x a x a x a a y 3
32
210

Least Square Solution• Normal Equations
n
i=i
mi
n
i=ii
n
i=ii
n
i=i
mn
i=
mi
n
i=
mi
n
i=
mi
n
i=
mi
n
i=
mi
n
i=i
n
i=i
n
i=i
n
i=
mi
n
i=i
n
i=i
n
i=i
n
i=
mi
n
i=i
n
i=i
yx
yx
yx
y
a
a
a
a
xxxx
xxxx
xxxx
xxxn
1
1
2
1
1
2
1
0
1
2
1
2
1
1
1
1
2
1
4
1
3
1
2
1
1
1
3
1
2
1
11
2
1

Examplex 0 1.0 1.5 2.3 2.5 4.0 5.1 6.0 6.5 7.0 8.1 9.0
y 0.2 0.8 2.5 2.5 3.5 4.3 3.0 5.0 3.5 2.4 1.3 2.0
x 9.3 11.0 11.3 12.1 13.1 14.0 15.5 16.0 17.5 17.8 19.0 20.0
y -0.3 -1.3 -3.0 -4.0 -4.9 -4.0 -5.2 -3.0 -3.5 -1.6 -1.4 -0.1
-6
-4
-2
0
2
4
6
0 5 10 15 20 25
x
f(x)

Example
n
i=ii
n
i=ii
n
i=ii
n
i=i
n
i=i
n
i=i
n
i=i
n
i=i
n
i=i
n
i=i
n
i=i
n
i=i
n
i=i
n
i=i
n
i=i
n
i=i
n
i=i
n
i=i
n
i=i
yx
yx
yx
y
a
a
a
a
xxxx
xxxx
xxxx
xxxn
1
3
1
2
1
1
3
2
1
0
1
6
1
5
1
4
1
3
1
5
1
4
1
3
1
2
1
4
1
3
1
2
1
1
3
1
2
1
369943
26037
9316
301
82235181167127801472752835846342
712780147275283584634223060
2752835846342230606229
84634223060622924
3
2
1
0
.
.
.
.
a
a
a
a
....
....
....
...

Example
01210
35320
30512
35930
3
2
1
0
.
.
.
.
a
a
a
a
Regression Equationy = - 0.359 + 2.305x - 0.353x2 + 0.012x3
-6
-4
-2
0
2
4
6
0 5 10 15 20 25
x
f(x)

Projection
• Projection onto an axis
(a,b)
x axis is a vector subspace

Projection onto an Arbitrary Line Passing through 0
(a,b)

Projection on to a Plane

Projection onto a Subspace
• Input: 1. Given a vector subspace V in Rm
2. A vector b in Rm…
• Desirable Output:– A vector in x in V that is closest to b– The projection x of b in V– A vector x in V such that (b-x) is orthogonal
to V

How to Describe a Vector Subspace V in Rm
• If dim(V) = n, then V has n basis vectors– a1, a2, …, an
– They are independent
• V = C(A) where A = [a1, a2, …, an]

Projection onto a Subspace
• Input: 1. Given n independent vectors a1, a2, …, an in Rm
2. A vector b in Rm…
• Desirable Output:– A vector in x in C([a1, a2, …, an]) that is closest to b
– The projection x of b in C([a1, a2, …, an])
– A vector x in V such that (b-x) is orthogonal to C([a1, a2, …, an])

Think about this Picture
C(AT)
N(A)
Rn
Rm
C(A)
N(AT)
xn A xn= 0
xr
b
A xr= b
nr xxx
A x= b
dim r dim r
dim n- r
dim m- r

Projection on to a Lineb
a
cosbabaT
aaa
ba
aa
aba
a
abp
T
T
T
coscos
p

Projection Matrix: on to a Line
b
a
aaa
ba
aa
aba
a
abp
T
T
T
coscos
p
What matrix P has the propertyp = Pb
baa
aa
aa
baap
Pbaaa
bap
T
T
T
T
T
T
Top Related