


Languages
Pages
Legal


Making education everybody’s business
Andreas SchleicherAlmaty, 11 March 2016
Learning environments as a third teacher

The kind of things that are easy to teach are
now easy to automate, digitize or outsource

Robotics

>1m km,
one minor accident,
occasional human intervention

Augmented Reality

The Race between Technology and Education
Inspired by “The race between technology and education” Pr. Goldin & Katz (Harvard)
Industrial revolution
Digital revolution
Social pain
Universal public schooling
Technology
Education
Prosperity
Social pain
Prosperity

Leverage the potential of all learners
Better anticipate the evolution of the demand for 21st century skills and better integrate the world of
work and learning
Find more innovative solutions to what we learn, how we learn, when
we learn and where we learn
Advance from an industrial towards a professional work organisation
…build learning systems that…
Citizens expect that we…8

Education in the past

Education now

Knowledge
Systems
thinking
Design
thinking
Information
literacy
Digital
literacy
Global
literacy
11

Creativity Critical Thinking Problem Solving
Innovation Collaboration Data Gathering
Communication
Some examples of skills12

Can we make the differentiator of yesterday’s elite schools the key for success in every school?
Empathy Resilience Mindfulness
Inclusion Curiosity Ethics
Courage Leadership
13

Metacognition
Self-
awarenessSelf-
regulation
Self-
reflection
Self-
adaptation
Lifelong
Learning
Learning
Strategies
14

United States
Poland
Hong Kong-China
Brazil
New Zealand
Greece
Uruguay
United Kingdom
EstoniaFinland
Albania
Croatia
Latvia
Slovak RepublicLuxembourg
Germany
Lithuania
Austria
Czech Republic
Chinese Taipei
FranceThailand
Japan
Turkey SwedenHungary Australia
Canada
IrelandBulgaria
Jordan
Chile
Macao-China
U.A.E.
BelgiumNetherlands
Spain
Argentina
Indonesia
Denmark
Kazakhstan
Peru
Costa Rica
Switzerland
Montenegro
Tunisia
Iceland
Slovenia
Qatar
Singapore
Portugal
Norway
Colombia
Malaysia
Mexico
Liechtenstein
Korea
Serbia
Russian Fed.
Romania
Viet Nam
Italy
Shanghai-China
R² = 0.36
300
350
400
450
500
550
600
650
-0.60 -0.40 -0.20 0.00 0.20 0.40 0.60 0.80 1.00 1.20
Mea
n m
athe
mat
ics
perf
orm
ance
Mean index of mathematics self-efficacy
OEC
D
aver
age
Countries where students have stronger beliefsin their abilities perform better in mathematics Fig III.4.515

A continuum of support16
Make learning central, encourage
engagement and responsibility
Be acutely sensitive to individual
differences
Provide continual assessment with
formative feedback
Be demanding for every student with a
high level of cognitive activation
Ensure that students feel valued and
included and learning is collaborative16

OECD EMPLOYER BRANDPlaybook
1717
Learning environments

Spending per student and learning outcomes
Slovak Republic
Czech RepublicEstonia
Israel
Poland
Korea
PortugalNew Zealand
CanadaGermany
Spain
France
Italy
Singapore
FinlandJapan
Slovenia IrelandIceland
Netherlands
Sweden
Belgium
UK
AustraliaDenmark
United States
Austria
Norway
Switzerland
Luxembourg
Viet Nam
Jordan
Peru
ThailandMalaysia
Uruguay
Turkey
ColombiaTunisia
MexicoMontenegro
Brazil
BulgariaChile
CroatiaLithuania
Latvia
Hungary
Shanghai-China
300
350
400
450
500
550
600
650
0 20 000 40 000 60 000 80 000 100 000 120 000 140 000 160 000 180 000 200 000
Average spending per student from the age of 6 to 15 (USD, PPPs)
Low spending High spending
PIS
A M
ath P
erfo
rman
ce
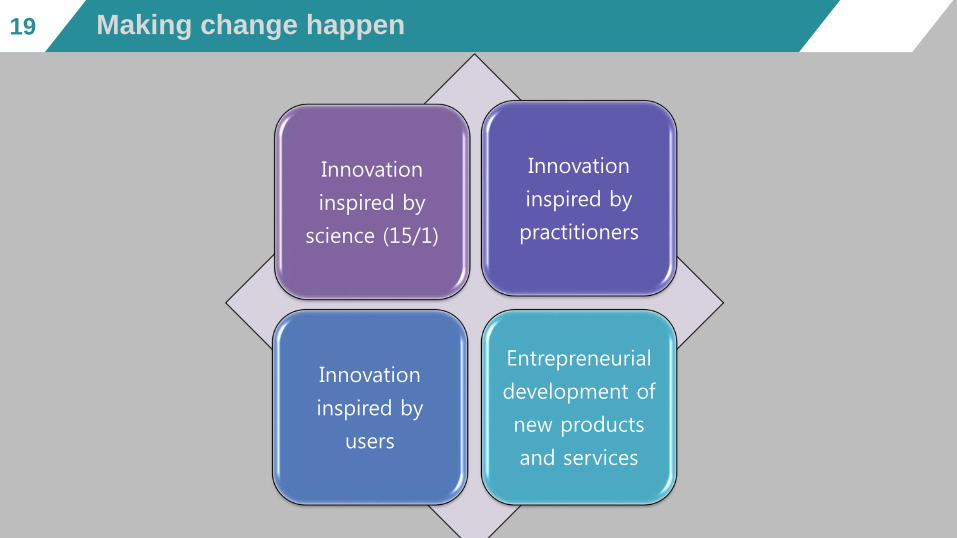
Making change happen
Innovation
inspired by
science (15/1)
Innovation
inspired by
practitioners
Innovation
inspired by
users
Entrepreneurial
development of
new products
and services
19

%
Yes
No
If I am more innovative in my teaching I will be rewarded (country average)
Mean mathematics performance, by school location, after accounting for socio-economic status Fig II.3.32
121
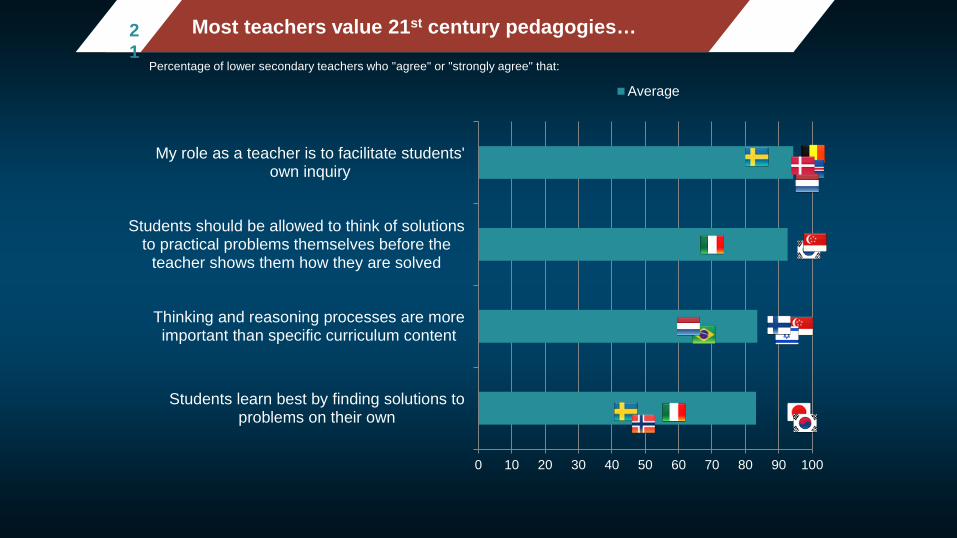
Most teachers value 21st century pedagogies…
Percentage of lower secondary teachers who "agree" or "strongly agree" that:
0 10 20 30 40 50 60 70 80 90 100
Students learn best by finding solutions toproblems on their own
Thinking and reasoning processes are moreimportant than specific curriculum content
Students should be allowed to think of solutionsto practical problems themselves before the
teacher shows them how they are solved
My role as a teacher is to facilitate students'own inquiry
Average

0 20 40 60 80 100
Students work on projects that require atleast one week to complete
Students use ICT for projects or class work
Give different work to the students who havedifficulties learning and/or to those who…
Students work in small groups to come upwith a joint solution to a problem or task
Let students practice similar tasks untilteacher knows that every student has…
Refer to a problem from everyday life or workto demonstrate why new knowledge is useful
Check students' exercise books orhomework
Present a summary of recently learnedcontent
Average
Mean mathematics performance, by school location, after accounting for socio-economic status Fig II.3.32
2…but teaching practices do not always reflect that
Percentage of lower secondary teachers who report using the following teaching practices "frequently" or "in all or nearly all lessons"
22
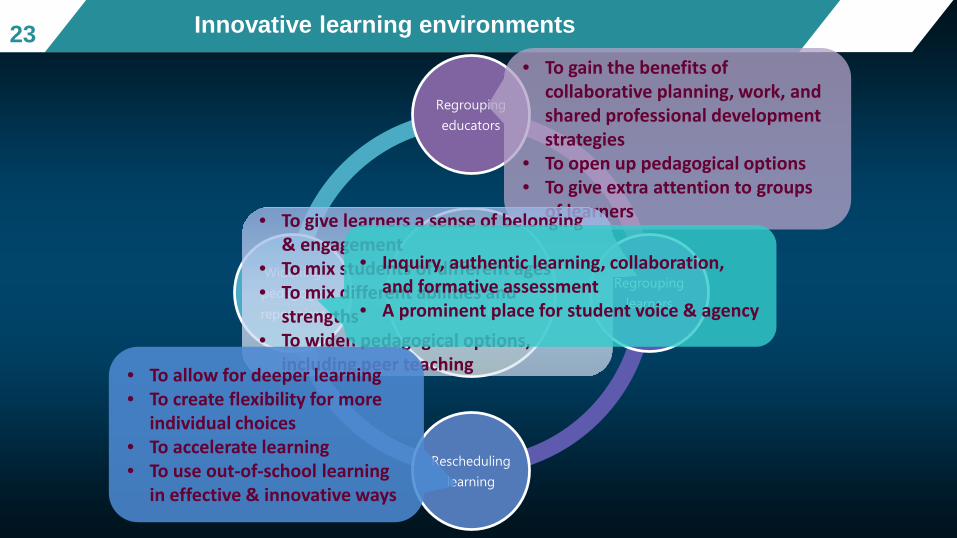
Innovative learning environments
Four
dimensions
Regrouping
educators
Regrouping
learners
Rescheduling
learning
Widening
pedagogic
repertoires
• To gain the benefits of collaborative planning, work, and shared professional development strategies
• To open up pedagogical options • To give extra attention to groups
of learners • To give learners a sense of belonging & engagement
• To mix students of different ages• To mix different abilities and
strengths• To widen pedagogical options,
including peer teaching• To allow for deeper learning• To create flexibility for more
individual choices• To accelerate learning• To use out-of-school learning
in effective & innovative ways
• Inquiry, authentic learning, collaboration, and formative assessment
• A prominent place for student voice & agency
23

External forces
exerting pressure and
influence inward on
an occupation
Internal motivation and
efforts of the members
of the profession itself
Professionalism
Professionalism is the level of autonomy and internal regulation exercised by members of an
occupation in providing services to society
24

Policy levers to teacher professionalism
Knowledge base for teaching (initial education and incentives for professional development)
Autonomy: Teachers’ decision-making power over their work (teaching content, course offerings, discipline practices)
Peer networks: Opportunities for exchange and support needed to maintain high standards of teaching (participation in induction, mentoring, networks, feedback from direct observations)
Teacherprofessionalism

Teacher professionalism
Knowledge base for teaching (initial education and incentives for professional development)
Autonomy: Teachers’ decision-making power over their work (teaching content, course offerings, discipline practices)
Peer networks: Opportunities for exchange and support needed to maintain high standards of teaching (participation in induction, mentoring, networks, feedback from direct observations)

High Peer Networks/Low Autonomy High Autonomy Knowledge Emphasis
Balanced Domains/High Professionalism
Balanced Domains/Low Professionalism
Teacher professionalism

0
1
2
3
4
5
6
7
8
9
10Sp
ain
Japa
n
Fran
ce
Braz
il
Finl
and
Flan
ders
Nor
way
Albe
rta (C
anad
a)
Aust
ralia
Den
mar
k
Isra
el
Kore
a
Uni
ted
Stat
es
Cze
ch R
epub
lic
Shan
ghai
(Chi
na)
Latv
ia
Net
herla
nds
Pola
nd
Engl
and
New
Zea
land
Sing
apor
e
Esto
nia
Networks Autonomy Knowledge
Mean mathematics performance, by school location, after accounting for socio-economic status Fig II.3.32828 TALIS Teacher professionalism index

0
10
20
30
40
50
60
70
80
90
100
Discu
ss ind
ivid
ual
stud
ents
Shar
e re
sour
ces
Team
conf
eren
ces
Colla
bora
te for
com
mon
stan
dar
ds
Team
tea
chin
g
Colla
bora
tive
PD
Join
t ac
tiviti
es
Cla
ssro
om
obse
rvat
ions
Perc
enta
ge
of
teac
her
s
Average
Professional collaboration
Percentage of lower secondary teachers who report doing the following activities at least once per month
Teacher co-operation29
Exchange and co-ordination
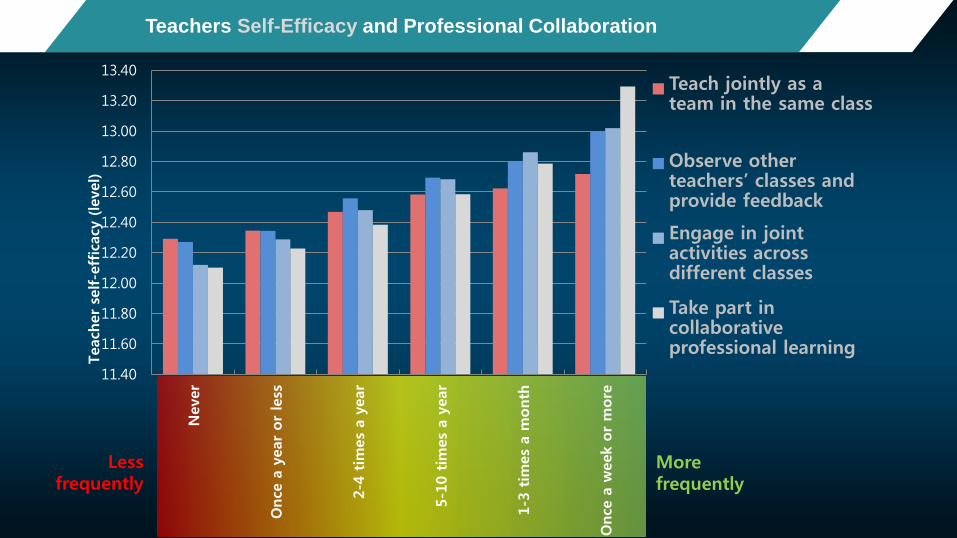
Teachers Self-Efficacy and Professional Collaboration
11.40
11.60
11.80
12.00
12.20
12.40
12.60
12.80
13.00
13.20
13.40
Nev
er
Once
a y
ear
or
less
2-4
tim
es a
yea
r
5-10
tim
es a
yea
r
1-3
tim
es a
month
Once
a w
eek
or
more
Teac
her
sel
f-ef
fica
cy (le
vel)
Teach jointly as a team in the same class
Observe other teachers’ classes and provide feedback
Engage in joint activities across different classes
Take part in collaborative professional learning
Less frequently
Morefrequently

0
10
20
30
40
50
60
70
Low professionalism
High professionalism
Mean mathematics performance, by school location, after accounting for socio-economic status Fig II.3.33131 Teacher professionalism index and teacher outcomes
Perceptions of teachers’ status
Satisfaction with the profession
Satisfaction with the work environment
Teachers’ self-efficacy
Predicted percentile

Making educational reform happen
32

• Clear and consistent priorities (across governments and across time), ambition and urgency, and the capacity to learn rapidly.
Shared vision
• Appropriate targets, real-time data, monitoring, incentives aligned to targets, accountability, and the capacity to intervene where necessary.
Performance
management
• Building professional capabilities, sharing best practice and innovation, flexible management, and frontline ethos aligned with system objectives.
Frontline capacity
• Strong leadership at every level, including teacher leadership, adequate process design and consistency of focus across agencies.
Delivery architecture
Successful reform delivery33

The old bureaucratic system The modern enabling system
Some students learn at high levels All students learn at high levels
Uniformity Embracing diversity
Curriculum-centred Learner-centred
Learning a place Learning an activity
Prescription Informed profession
Delivered wisdom User-generated wisdom
Provision Outcomes
Bureaucratic look-up Devolved – look outwards
Administrative control and accountability Professional forms of work organisation
Conformity Ingenious
Standardise distribution of resources Attract the most talented teachers to the most challenging classrooms
Management Leadership
Public vs private Public with private
Idiosyncratic reforms Alignment of policies, coherence over time, fidelity of implementation

35 Thank you
Find out more about our work at www.oecd.org– All publications– The complete micro-level database
Email: [email protected]: SchleicherEDU
and remember:Without data, you are just another person with an opinion 35
Top Related