


Languages
Pages
Legal

EXHIBIT B—PROJECT OPERATION AND RESOURCE UTILIZATION
Klamath Hydroelectric Project(FERC Project No. 2082)
PacifiCorpPortland, Oregon
Version: February 2004
Copyright © 2004 by PacifiCorpReproduction in whole or in part without the written consent of PacifiCorp is prohibited.


© February 2004 PacifiCorpExhibit B.doc Exhibit B Page iii
CONTENTS
Section Page
B1.0 INTRODUCTION............................................................................................................. 1-1B1.1 EXISTING KLAMATH HYDROELECTRIC PROJECT OVERVIEW............... 1-2B1.2 PROPOSED KLAMATH HYDROELECTRIC PROJECT OVERVIEW............. 1-2B1.3 USBR KLAMATH IRRIGATION PROJECT ....................................................... 1-2
B2.0 FLOW REGULATION THROUGH EXISTING KLAMATHHYDROELECTRIC PROJECT .................................................................................. 2-1B2.1 INTRODUCTION................................................................................................... 2-1B2.2 FLOW REGULATION INTO AND OUT OF THE USBR PROJECT TO
THE KLAMATH HYDROELECTRIC PROJECT............................................. 2-6B2.3 FLOW REGULATION THROUGH THE PROJECT DURING SUMMER
AND/OR BELOW AVERAGE WATER YEAR................................................ 2-7B2.4 FLOW REGULATION THROUGH USBR AND KLAMATH
HYDROELECTRIC PROJECTS IN WINTER AND/ORHIGH WATER YEARS ...................................................................................... 2-7B2.4.1 Project Flood Control ............................................................................... 2-8
B2.5 OTHER OUT-OF-BASIN DIVERSIONS.............................................................. 2-8B2.5.1 Rogue River Basin Irrigation Project ....................................................... 2-8B2.5.2 City of Yreka Municipal Water Supply ................................................... 2-9
B3.0 FLOW REGULATION THROUGH THE PROPOSED KLAMATHHYDROELECTRIC PROJECT .................................................................................. 3-1
B4.0 HYDROLOGY—EXISTING CONDITIONS................................................................ 4-1B4.1 PROJECT AREA HYDROLOGIC DRAINAGE AREA AND
FLOW REGIME.................................................................................................. 4-1B4.2 EXISTING HYDROLOGY AND FLOW AVAILABILITY................................. 4-2
B4.2.1 Hydrologic Data Sources for the Project Area......................................... 4-2B4.2.2 Average Daily Flow Rates ....................................................................... 4-3
B4.3 EXISTING INSTREAM FLOW RELEASES........................................................ 4-6
B5.0 HYDROLOGY—PROPOSED CONDITIONS.............................................................. 5-1
B6.0 LINK RIVER DAM .......................................................................................................... 6-1B6.1 FACILITY OVERVIEW ........................................................................................ 6-1B6.2 OWNERSHIP AND CONTRACTUAL OBLIGATIONS ..................................... 6-1B6.3 EXISTING OPERATIONS..................................................................................... 6-2B6.4 FUTURE OPERATIONS ....................................................................................... 6-4
B7.0 EAST SIDE AND WEST SIDE DEVELOPMENTS..................................................... 7-1B7.1 INTRODUCTION................................................................................................... 7-1B7.2 EAST SIDE DEVELOPMENT OVERVIEW ........................................................ 7-1B7.3 EAST SIDE POWERHOUSE CONTROL............................................................. 7-1
B7.3.1 Annual Plant Factor.................................................................................. 7-2B7.3.2 Period of Critical Stream Flow, Average Annual Energy Production,
and Dependable Capacity ........................................................................ 7-2B7.3.3 Area-Capacity Curve and Rule Curve...................................................... 7-2

PacifiCorpKlamath Hydroelectric ProjectFERC No. 2082
© February 2004 PacifiCorpExhibit B Page iv Exhibit B.doc
B7.3.4 Hydraulic Capacity................................................................................... 7-2B7.3.5 Tailwater Rating Curve ............................................................................ 7-2B7.3.6 Power Plant Capacity Versus Head Curve............................................... 7-2
B7.4 WEST SIDE FACILITY OVERVIEW................................................................... 7-2B7.4.1 West Side Powerhouse Control................................................................ 7-7B7.4.2 Annual Plant Factor.................................................................................. 7-7B7.4.3 Period of Critical Stream Flow, Average Annual Energy Production,
and Dependable Capacity ........................................................................ 7-7B7.4.4 Area-Capacity Curve and Rule Curve...................................................... 7-7B7.4.5 Hydraulic Capacity................................................................................... 7-9B7.4.6 Tailwater Rating Curve ............................................................................ 7-9B7.4.7 Power Plant Capacity Versus Head Curve............................................... 7-9
B7.5 EAST SIDE AND WEST SIDE DECOMMISSIONING....................................... 7-9
B8.0 KENO DEVELOPMENT................................................................................................. 8-1B8.1 INTRODUCTION................................................................................................... 8-1B8.2 DEVELOPMENT OVERVIEW............................................................................. 8-1B8.3 OWNERSHIP AND CONTRACTUAL OBLIGATIONS ..................................... 8-1B8.4 OPERATIONS........................................................................................................ 8-2
B8.4.1 Description of Plant Control .................................................................... 8-5B8.4.2 Keno Drawdown ...................................................................................... 8-5
B9.0 J.C. BOYLE DEVELOPMENT....................................................................................... 9-1B9.1 DEVELOPMENT OVERVIEW............................................................................. 9-1B9.2 OWNERSHIP AND CONTRACTUAL OBLIGATION ....................................... 9-1B9.3 OPERATIONS........................................................................................................ 9-1B9.4 ANNUAL PLANT FACTOR ................................................................................. 9-4B9.5 PERIOD OF CRITICAL STREAM FLOW, AVERAGE ANNUAL ENERGY
PRODUCTION, AND DEPENDABLE CAPACITY......................................... 9-4B9.6 AREA-CAPACITY CURVE AND RULE CURVE .............................................. 9-4B9.7 HYDRAULIC CAPACITY .................................................................................... 9-4B9.8 TAILWATER RATING CUR`VE.......................................................................... 9-9B9.9 POWERPLANT CAPACITY VERSUS HEAD CURVE...................................... 9-9
B10.0 COPCO NO. 1 DEVELOPMENT ............................................................................... 10-1B10.1 DEVELOPMENT OVERVIEW......................................................................... 10-1B10.2 OWNERSHIP AND CONTRACTUAL OBLIGATION ................................... 10-1B10.3 OPERATIONS.................................................................................................... 10-1B10.4 ANNUAL PLANT FACTOR ............................................................................. 10-2B10.5 PERIOD OF CRITICAL STREAM FLOW, AVERAGE ANNUAL
ENERGY PRODUCTION, AND DEPENDABLE CAPACITY...................... 10-2B10.6 AREA-CAPACITY CURVE AND OPERATING CURVE .............................. 10-2B10.7 HYDRAULIC CAPACITY ................................................................................ 10-2B10.8 TAILWATER RATING CURVE....................................................................... 10-2B10.9 POWERPLANT CAPACITY VERSUS HEAD CURVE.................................. 10-2
B11.0 COPCO NO. 2 DEVELOPMENT ............................................................................... 11-1B11.1 DEVELOPMENT OVERVIEW......................................................................... 11-1B11.2 OWNERSHIP AND CONTRACTUAL OBLIGATION ................................... 11-1

PacifiCorpKlamath Hydroelectric Project
FERC No. 2082
© February 2004 PacifiCorpExhibit B.doc Exhibit B Page v
B11.3 OPERATIONS.................................................................................................... 11-1B11.4 ANNUAL PLANT FACTOR ............................................................................. 11-2B11.5 PERIOD OF CRITICAL STREAM FLOW, AVERAGE ANNUAL
ENERGY PRODUCTION, AND DEPENDABLE CAPACITY...................... 11-2B11.6 AREA-CAPACITY CURVE AND RULE CURVE .......................................... 11-2B11.7 HYDRAULIC CAPACITY ................................................................................ 11-2B11.8 TAILWATER RATING CURVE....................................................................... 11-3B11.9 POWERPLANT CAPACITY VERSUS HEAD CURVE.................................. 11-3
B12.0 FALL CREEK DEVELOPMENT............................................................................... 12-1B12.1 DEVELOPMENT OVERVIEW......................................................................... 12-1B12.2 OWNERSHIP AND CONTRACTUAL OBLIGATION ................................... 12-1B12.3 OPERATION ...................................................................................................... 12-1B12.4 SPRING CREEK FACILITY ............................................................................. 12-2B12.5 ANNUAL PLANT FACTOR ............................................................................. 12-2B12.6 PERIOD OF CRITICAL STREAM FLOW, AVERAGE ANNUAL
ENERGY PRODUCTION, AND DEPENDABLE CAPACITY...................... 12-2B12.7 AREA-CAPACITY CURVE AND RULE CURVE .......................................... 12-5B12.8 HYDRAULIC CAPACITY ................................................................................ 12-5B12.9 TAILWATER RATING CURVE....................................................................... 12-5B12.10 POWERPLANT CAPACITY VERSUS HEAD CURVE................................ 12-5
B13.0 IRON GATE DEVELOPMENT.................................................................................. 13-1B13.1 DEVELOPMENT OVERVIEW......................................................................... 13-1B13.2 OWNERSHIP AND CONTRACTUAL OBLIGATION ................................... 13-1B13.3 OPERATIONS.................................................................................................... 13-2B13.4 ANNUAL PLANT FACTOR ............................................................................. 13-4B13.5 PERIOD OF CRITICAL STREAM FLOW, AVERAGE ANNUAL
ENERGY PRODUCTION, AND DEPENDABLE CAPACITY...................... 13-4B13.6 AREA-CAPACITY CURVE AND OPERATING CURVE .............................. 13-4B13.7 HYDRAULIC CAPACITY ................................................................................ 13-8B13.8 TAILWATER RATING CURVE....................................................................... 13-8B13.9 POWERPLANT CAPACITY VERSUS HEAD CURVE.................................. 13-8
B14.0 POWER UTILIZATION.............................................................................................. 14-1
B15.0 PROPOSED PROJECT ............................................................................................... 15-1
B16.0 INFORMATION SOURCES ....................................................................................... 16-1
Appendices
B-1A 1956 Contract with USBR for the Operation of Link River Dam and Subsequent Lettersof Contract Amendment
B-8A Keno Contract with USBR for the Operation of Keno Dam
Tables
B2.1-1 Storage capacities of UKL and PacifiCorp Klamath Hydroelectric Project reservoirs. 2-1B2.1-2 Accretions to Upper Klamath River system downstream of UKL to Iron Gate dam. ..2-2
PacifiCorpKlamath Hydroelectric ProjectFERC No. 2082
© February 2004 PacifiCorpExhibit B Page vi Exhibit B.doc
B2.1-3 Stream gauge sites in general Klamath Hydroelectric Project area.................................2-6B4.1-1 Reservoir storage capacities (acre-feet) as a percent of mean annual runoff
(MAR) for facilities in the Upper Klamath Basin. ..............................................................4-2B4.2-1 USGS flow gauging data for the Klamath River in the Project area................................4-3B4.3-1 Instream flow releases as measured at Iron Gate dam in USBR’s Klamath Project
Operations 2002 Biological Assessment (USBR, 2002). .....................................................4-7B6.3-1 Link River minimum instream flow and ramp rate directives. .......................................6-4B7.3-1 East Side minimum instream flow and ramp rate directives. ..........................................7-1B8.3-1 Flows below Keno dam and frequency/magnitude of flow changes; WY 1995-2001
(through September 30, 2001) (USGS Gauge No.11509500). ............................................8-3B8.3-2 Average 24-hour Klamath Straights Drain change (cfs) for 1995-2001 (through
September 30, 2001).................................................................................................................8-3B8.3-3 Maximum 24-hour Klamath Straights Drain change (cfs) for 1995-2001 (through
September 30, 2001).................................................................................................................8-4B8.3-4 Keno minimum instream flow and ramp rate directives..................................................8-4B9.3-1 J.C. Boyle minimum instream flow and ramp rate directives. .........................................9-2B11.3-1 Copco No. 2 minimum instream flow and ramp rate directives. ..................................11-1B12.3-1 Fall Creek minimum instream flow and ramp rate directives. ......................................12-1B13.3-1 Instream flow releases as measured at Iron Gate dam in the U.S. Bureau of
Reclamation’s Klamath Project Operations 2002 Biological Assessment(USBR, 2002). .........................................................................................................................13-3
B13.3-2 Iron Gate minimum instream flow and ramp rate directives. .......................................13-4
Figures
B1.1-1 Existing PacifiCorp Project facilities. ...................................................................................1-3B1.2-1 Klamath Irrigation Project, Oregon–California. .................................................................1-4B2.1-1 KPOPSIM model. ....................................................................................................................2-3B2.1-2 Total average accretions into/out of Keno reservoir from the USBR Project (for
WY1961–1997). ........................................................................................................................2-4B2.1-3 Total average accretion from tributaries and springs between Keno and Iron Gate
dams (as per KPOPSIM calculation for WY 1961–1997). ..................................................2-5B2.5-1 Yreka filter plant flow (Year 2000). ....................................................................................2-10B4.2-1 Annual hydrographs of average daily flows (cfs) for the period 1967-2001 at four
gauging stations on the Klamath River in the Klamath Hydroelectric Project area. ....4-4B4.2-2 Annual hydrographs of average daily flows in the Klamath River at Keno (USGS
Gauge No. 11509500) for the period 1967-1999, a critical dry year (1991), and a wet year(1998). .......................................................................................................................................4-5
B4.2-3 Estimated monthly median flow values for Fall Creek based on available data fromUSGS Gauge 11512000 for the period of record April 1934 to September 1959.............4-6
B7.3-1 Flow-duration curve of monthly flows at the East Side Development...........................7-4B7.3-2 Tailwater rating curve, East Side Development.................................................................7-5B7.3-3 Turbine generator capability vs. head, East Side Development. .....................................7-6B7.4-1 Flow-duration curve of monthly flows at the West Side Development. ........................7-8B7.4-2 Tailwater rating curve, West Side Development. ............................................................7-10B7.4-3 Turbine generator capability vs. head, West Side Development...................................7-11B9.3-1 J.C. Boyle spring accretion contribution. .............................................................................9-3
PacifiCorpKlamath Hydroelectric Project
FERC No. 2082
© February 2004 PacifiCorpExhibit B.doc Exhibit B Page vii
B9.5-1 Flow-duration curves of monthly flows J.C. Boyle Development...................................9-5B9.5-2 Maximum, mean and minimum historical monthly flows at the J.C. Boyle
Development. ..........................................................................................................................9-6B9.6-1 Area-capacity curve, J.C. Boyle reservoir. ...........................................................................9-7B9.6-2 J.C. Boyle reservoir typical hourly reservoir elevations....................................................9-8B9.8-1 Tailwater rating curve, J.C. Boyle Development..............................................................9-10B9.9-1 Turbine generator capability vs. head, J.C. Boyle Development. ..................................9-11B10.5-1 Flow-duration curves of monthly flows at the Copco No. 1 Development. ................10-3B10.5-2 Maximum, mean, and minimum historical monthly flows at the Copco No. 1
Development. ........................................................................................................................10-4B10.6-1 Area-capacity curve, Copco Lake.......................................................................................10-5B10.6-2 Copco No. 1 typical hourly reservoir elevations..............................................................10-6B10.8-1 Tailwater rating curve, Copco No. 1 Development. ........................................................10-7B10.9-1 Turbine generator capability vs. head, Copco No. 1 Development. .............................10-8B11.5-1 Flow duration curve of monthly flows at the Copco No. 2 Development. ..................11-4B11.5-2 Maximum, mean, and minimum historical monthly flows at the Copco No. 2
Development. ........................................................................................................................11-5B11.8-1 Tailwater rating curve, Copco No. 2 Development. ........................................................11-6B11.9-1 Turbine generator capability vs. head Copco No. 2 Development. ..............................11-7B12.4-1 Fall Creek hydroelectric project general project map......................................................12-3B12.6-1 Flow duration curve of monthly flows at the Fall Creek Development. ......................12-4B13.5-1 Flow duration curve of monthly flows at the Iron Gate Development. .......................13-5B13.6-1 Area-capacity curve, Iron Gate reservoir. .........................................................................13-6B13.6-2 Iron Gate typical hourly reservoir elevations. ..................................................................13-7B13.8-1 Tailwater rating curve, Iron Gate Development. .............................................................13-9B13.9-1 Turbine generator capability vs. head, Iron Gate Development..................................13-10


© February 2004 PacifiCorpExhibit B.doc Exhibit B Page 1-1
B1.0 INTRODUCTION
Exhibit B describes the Klamath Hydroelectric Project facilities and lands, as stipulated in Title18 Section 4.51 (c) of the U.S. Code of Federal Regulations:
Exhibit B is a statement of project operation and resource utilization. If the projectincludes more than one dam with associated facilities, the information must be providedseparately for each such discrete development. The exhibit must contain:
(1) A statement whether operation of the power plant will be manual or automatic, anestimate of the annual plant factor, and a statement of how the project will be operatedduring adverse, mean, and high water years;
(2) An estimate of the dependable capacity and average annual energy production inkilowatt-hours (or a mechanical equivalent), supported by the following data:
(i) The minimum, mean, and maximum recorded flows in cubic feet per second of thestream or other body of water at the power plant intake or point of diversion, with aspecification of any adjustments made for evaporation, leakage, minimum flowreleases (including duration of releases), or other reductions in available flow; a flowduration curve indicating the period of record and the gauging stations used inderiving the curve; and a specification of the period of critical streamflow used todetermine the dependable capacity;
(ii) An area-capacity curve showing the gross storage capacity and usable storagecapacity of the impoundment, with a rule curve showing the proposed operation ofthe impoundment and how the usable storage capacity is to be utilized;
(iii) The estimated hydraulic capacity of the power plant (maximum flow through thepower plant) in cubic feet per second;
(iv) A tailwater rating curve; and
(v) A curve showing power plant capability versus head and specifying maximum,normal, and minimum heads;
(3) A statement, with load curves and tabular data, if necessary, of the manner in whichthe power generated at the project is to be utilized, including the amount of power to beused on-site, if any, the amount of power to be sold, and the identity of any proposedpurchasers; and
(4) A statement of the applicant’s plans, if any, for future development of the project orof any other existing or proposed water power project on the stream or other body ofwater, indicating the approximate location and estimated installed capacity of theproposed developments.
PacifiCorp’s Project and USBR’s Klamath Irrigation Project (“USBR Project”) are two distinctlydifferent projects with two different owners and objectives, yet they are intertwined historically,geographically, physically, and operationally.

PacifiCorpKlamath Hydroelectric ProjectFERC No. 2082
© February 2004 PacifiCorpExhibit B Page 1-2 Exhibit B.doc
B1.1 EXISTING KLAMATH HYDROELECTRIC PROJECT OVERVIEW
As described in Exhibit A2.1, the existing Project consists of six generating developments,between Klamath River mile (RM) 190 and RM 254, and the Keno Development (a re-regulationdam with no generation facilities along the mainstem of the Upper Klamath River), as well asone generating development on Fall Creek, a tributary to the Klamath River at approximatelyRM 196 (Figure B1.1-1).
B1.2 PROPOSED KLAMATH HYDROELECTRIC PROJECT OVERVIEW
As described in Exhibit A.2.2, the proposed Project consists of four generating developments,between Klamath RM 190 and RM 228.0, and one generating development on Fall Creek, atributary to the Klamath River at approximately RM 196 (Figure B1.1-2). The proposed Projectdoes not include the East Side, West Side, and Keno developments.
B1.3 USBR KLAMATH IRRIGATION PROJECT
The USBR Klamath Irrigation Project (USBR Project) provides irrigation water for bothagricultural and national wildlife refuge lands in the Klamath Basin, and also provides floodcontrol for the Klamath River in and downstream of the Project area. This operation is for thebenefit of the USBR and irrigation and flood control concerns. The operation is independent ofdownstream hydroelectric operations. The USBR Project extends into two major watersheds: theKlamath River watershed and the Lost River watershed. The Lost River watershed collectivelycomprises the Clear Lake, Malone, and Gerber watersheds (Figure B1.2-1). The USBR Projectcurrently provides irrigation water for approximately 240,000 acres of agricultural land plus thewildlife refuge lands. Major features of the USBR Project include:
• Clear Lake dam and reservoir located on the Lost River in California
• Gerber dam and reservoir located on Miller Creek, a tributary of the Lost River in Oregon
• Malone diversion dam on the Lost River in Oregon downstream from Clear Lake dam
• Lost River diversion dam on the Lost River in Oregon that diverts water to the KlamathRiver through the Lost River Diversion Channel
• ADY canal that allows water transfer from the Klamath River (Keno reservoir) to the USBRProject
• Klamath Straits Drain that allows water transfer from the USBR Project to the Klamath River(Keno reservoir)
• Link River dam at the outlet from Upper Klamath Lake regulates flow releases from UpperKlamath Lake (UKL) into the Klamath River. Water diverted from UKL provides themajority of irrigation supplies for USBR Project lands through the “A” Canal.
• Anderson Rose dam on the Lost River that diverts water for irrigation of California lands
• Tule Lake tunnel that conveys drainage water from Tule Lake to Lower Klamath Lake

PacifiCorpKlamath Hydroelectric Project
FERC No. 2082
© February 2004 PacifiCorpExhibit B.doc Exhibit B Page 1-3
Figure B1.1-1. Existing PacifiCorp Project facilities.
Upper Klamath Lake
Link River dam (USBR)
Lake Ewauna/Keno reservoir
Keno dam
Link River“A” Canal (USBR facility)
East Side powerhouse (3.2 MW)
West Side powerhouse(0.6 MW)x
Ady Canal (USBR)
Lost River Diversion Channel (USBR)
J.C. Boyle reservoir
J.C. Boyle dam
J.C. Boyle powerhouse(80 MW)x
Copco No.1 dam& powerhouse
(20 MW)x
Copco No. 1 reservoir
Copco No. 2 reservoirCopco No. 2 dam
Iron Gate reservoir
Iron Gate dam& powerhouse(18 MW)
Copco No. 2 powerhouse (27 MW)
Fall Creek powerhouse (2.2 MW)
RM 253.7
RM 233.0
RM 224.7
RM 198.6
RM 198.3
RM 190.1
Spring inflow (250-300 cfs)
RM 220.4
Spencer Creek
Jenny Creek
Shovel Creek
Klamath Straits Drain (USBR)
Spring CreekFall Creek
North Canal (USBR)
RM 253.1
RM 228.0
RM 204.0
RM 196.8
Shasta River RM 176.7

� �
���
����
���
����
���
����
���
���
��
����
� ��
���
��

PacifiCorpKlamath Hydroelectric Project
FERC No. 2082
© February 2004 PacifiCorpExhibit B.doc Exhibit B Page 1-5
The Klamath Hydroelectric Project is located generally downstream from the USBR Project. TheADY canal allows water transfer from Keno reservoir and the Lost River diversion channel. TheKlamath Straits dam allows water transfer into the Keno reservoir.

© February 2004 PacifiCorpExhibit B.doc Exhibit B Page 2-1
B2.0 FLOW REGULATION THROUGH EXISTING KLAMATH HYDROELECTRICPROJECT
B2.1 INTRODUCTION
The Upper Klamath Lake (UKL) inflow-outflow is the major source of water for the KlamathHydroelectric Project. Mean annual net inflow to the lake is 1.2 million acre-feet (AF); annualinflow ranges from 576,000 AF to 2.4 million AF (USBR, 1998). When forecasting runoff fromthe April through September period, USBR uses the following descriptions to categorize inflowsto UKL during this period.
UKL inflow (in AF x 1,000, or TAF) is considered:
• “Above Average” when UKL inflow > 500 TAF• “Below Average” when UKL inflow ≤ 500 TAF and > 312 TAF• “Dry” when UKL inflow ≤ 312 TAF and > 185 TAF• “Critical” when UKL inflow ≤ 185 TAF
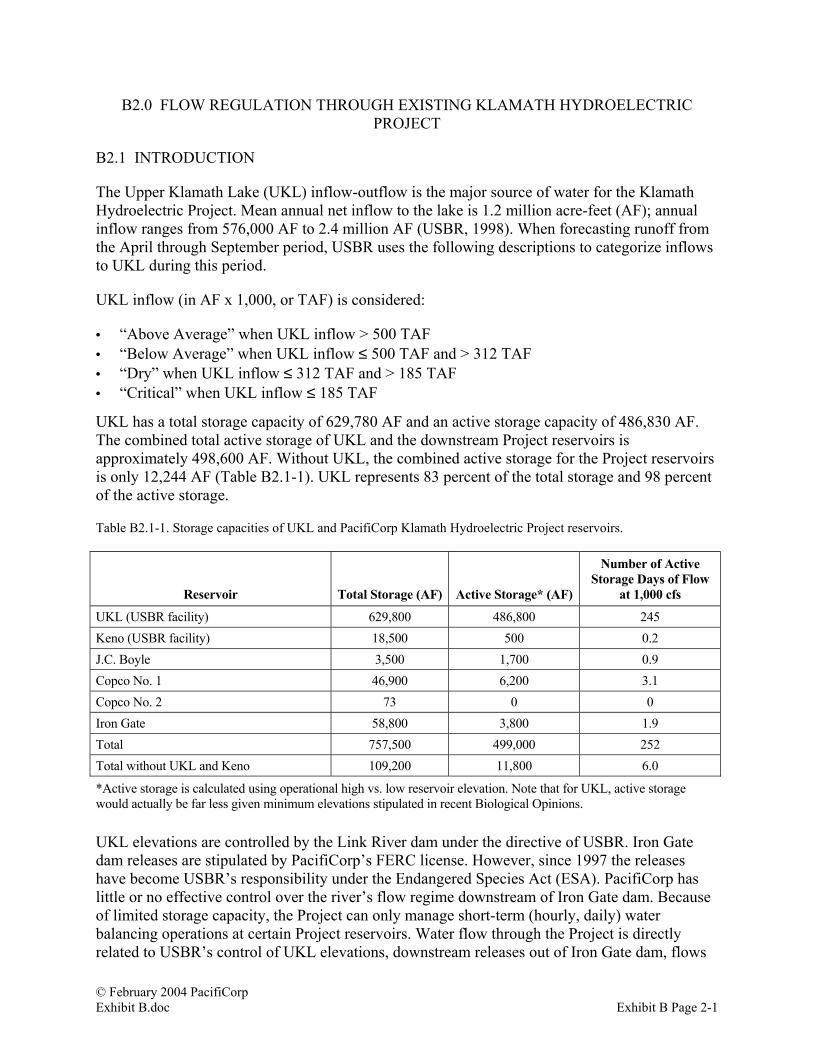
UKL has a total storage capacity of 629,780 AF and an active storage capacity of 486,830 AF.The combined total active storage of UKL and the downstream Project reservoirs isapproximately 498,600 AF. Without UKL, the combined active storage for the Project reservoirsis only 12,244 AF (Table B2.1-1). UKL represents 83 percent of the total storage and 98 percentof the active storage.
Table B2.1-1. Storage capacities of UKL and PacifiCorp Klamath Hydroelectric Project reservoirs.
Reservoir Total Storage (AF) Active Storage* (AF)
Number of ActiveStorage Days of Flow
at 1,000 cfs
UKL (USBR facility) 629,800 486,800 245Keno (USBR facility) 18,500 500 0.2J.C. Boyle 3,500 1,700 0.9Copco No. 1 46,900 6,200 3.1Copco No. 2 73 0 0Iron Gate 58,800 3,800 1.9Total 757,500 499,000 252Total without UKL and Keno 109,200 11,800 6.0
*Active storage is calculated using operational high vs. low reservoir elevation. Note that for UKL, active storagewould actually be far less given minimum elevations stipulated in recent Biological Opinions.
UKL elevations are controlled by the Link River dam under the directive of USBR. Iron Gatedam releases are stipulated by PacifiCorp’s FERC license. However, since 1997 the releaseshave become USBR’s responsibility under the Endangered Species Act (ESA). PacifiCorp haslittle or no effective control over the river’s flow regime downstream of Iron Gate dam. Becauseof limited storage capacity, the Project can only manage short-term (hourly, daily) waterbalancing operations at certain Project reservoirs. Water flow through the Project is directlyrelated to USBR’s control of UKL elevations, downstream releases out of Iron Gate dam, flows

PacifiCorpKlamath Hydroelectric ProjectFERC No. 2082
© February 2004 PacifiCorpExhibit B Page 2-2 Exhibit B.doc
into and out of the USBR Project area, and the relatively small active storage capabilities of theProject reservoirs.
Active storage within the Project (between Link River dam and Iron Gate dam) is small relativeto UKL’s active storage (Table B2.1-1). For this reason, managing flow through the Project tocomply with regulatory requirements necessitates the balancing of total inflows with totaloutflow. Inflow to the Project comes principally from Link River dam and USBR Project netinflows to Keno reservoir. Tributary accretion downstream of UKL to Iron Gate dam is relativelylow, especially during summer months (Table B2.1-2). Accretions from the springs in the J.C.Boyle bypass reach are approximately 220 cfs throughout the year. With the exception of a fewout of basin transfers, outflow from the upper Klamath Basin is entirely via the Iron Gate dam. Inwater years when flows are in excess of the turbine capacity of any given facility, water is passedby the facility as spill. Because the storage-limited reservoirs are typically full during high flows,Project releases become run-of-river. This typically occurs in late winter and spring months inaverage to wet years. During the summer when flows are below the turbine capacity of a facility,PacifiCorp is able to manage the short-term (hourly, daily) timing of flow through its facilities,within the limitations of reservoir storage and regulatory terms and conditions.
Table B2.1-2. Accretions to Upper Klamath River system downstream of UKL to Iron Gate dam.
TributaryMean Annual Accretion
(Thousand Acre Feet –TAF)
From Lost River diversion canal (into Keno reservoir) 119From other USBR diversion canals (into Keno reservoir) 21.4From springs and tributaries between Keno reservoir and Iron Gate dam 337Total 477
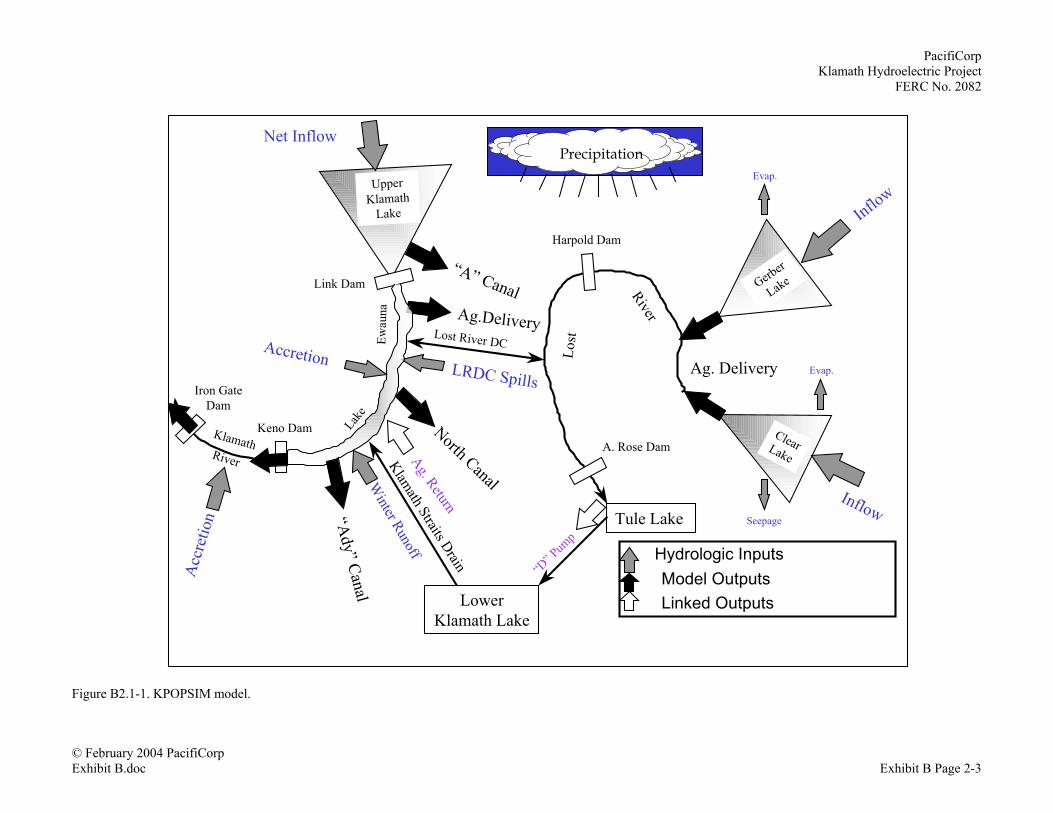
With the exception of Lost River inflow to Keno reservoir, tributary accretions to the Projectarea are not gauged. However, tributary accretions can be estimated using KPOPSIM, ahydrologic model for the Klamath Basin. This model uses a mass-balance equation to measure(1) inflow of all accretions entering the Project between Keno dam and Iron Gate dam, and(2) the inflow from all other USBR canals between Link River dam and Keno dam (i.e.,excluding Lost River diversion canal). Figure B2.1-1 is a schematic depiction of the KPOPSIMmodel. Using data from 1961-1997, mean yearly accretion is summarized in Table B2.1-2,below, and in Figures B2.1-2 and B2.1-3.
PacifiCorpKlamath Hydroelectric Project
FERC No. 2082
© February 2004 PacifiCorpExhibit B.doc Exhibit B Page 2-3
Figure B2.1-1. KPOPSIM model.
UpperKlamath
Lake
Gerber
Lake
ClearLake
Ag.Delivery
LRDC Spills
Lost River DC
Link Dam“A” Canal
Harpold Dam
Inflow
Inflow
Net Inflow
Keno Dam North Canal
“Ady” Canal
AccretionLak
e
Ewau
naIron Gate
Dam
Acc
retio
n
KlamathRiver
Winter Runoff
Ag. Return
Klamath Straits Drain
Lost
River
Hydrologic Inputs Model Outputs Linked Outputs
A. Rose Dam
Tule Lake
LowerKlamath Lake
Ag. Delivery
Evap.
Evap.
Seepage
“D” P
ump
Precipitation

PacifiCorpKlamath Hydroelectric ProjectFERC No. 2082
© February 2004 PacifiCorpExhibit B Page 2-4 Exhibit B.doc
Figure B2.1-2. Total average accretions into/out of Keno reservoir from the USBR Project (for WY1961–1997).
-6-4-202468
10
Oct Nov Dec Jan Feb Mar Apr May Jun Jul Aug Sep
Month
Volu
me
(Tho
usan
d A
F)

PacifiCorpKlamath Hydroelectric Project
FERC No. 2082
© February 2004 PacifiCorpExhibit B.doc Exhibit B Page 2-5
Figure B2.1-3. Total average accretion from tributaries and springs between Keno and Iron Gate dams (as per KPOPSIM calculation for WY 1961–1997).
05
101520253035404550
Oct Nov Dec Jan Feb Mar Apr May Jun Jul Aug Sep
Month
Acc
retio
n (c
fs)

PacifiCorpKlamath Hydroelectric ProjectFERC No. 2082
© February 2004 PacifiCorpExhibit B Page 2-6 Exhibit B.doc
Table B2.1-3 provides a summary of reservoir and river monitoring sites within the KlamathHydroelectric Project area.
Table B2.1-3. Stream gauge sites in general Klamath Hydroelectric Project area.
Site Name Location Type of Monitoring Responsible Party CommentsRocky Point (UKL) Northwest end of UKL Water level w/ staff
gauge, meter, USGSequip, PacifiCorp equip
Cooperative programw/ USBR, PacifiCorp
Real-time, updates,seen at PacifiCorp
Rattlesnake (UKL) East side of UKL Water level w/ staffgauge, meter, USGSequip, PacifiCorp equip
Cooperative programw/ USBR, PacifiCorp
Real-time, updates,seen at PacifiCorp
Pelican (UKL) South east end of UKL Water level w/ staffgauge, meter, USGSequip, PacifiCorp equip
Cooperative programw/ USBR, PacifiCorp
Real-time, updates,seen at PacifiCorp
“833 Gauge” (USGS11507500)
RM 253.4 Water level w/ staffgauge, USGS equip,PacifiCorp equip
USGS Real-time, seen atPacifiCorp
Weed Bridge Keno reservoir at Hwy97 bridgeRM 249.3
Water level w/ staffgauge, meter, USGSequip, PacifiCorp equip
USGS Real-time, seen atPacifiCorp
Keno Reservoir Level At Keno damRM 233.4
Water level w/ staffgauge, PacifiCorp equip
PacifiCorp Real-time, seen atPacifiCorp
Klamath River BelowKeno Dam (USGS11509500)
RM 231.9 Water level w/ staffgauge, USGS equip,PacifiCorp equip
USGS Real-time, seen atPacifiCorp, onUSGS website
J.C. Boyle ReservoirLevel
At J.C. Boyle damRM 224.7
Water level w/ staffgauge, PacifiCorp equip
PacifiCorp Real-time, seen atPacifiCorp
Klamath R. Below J.C.Boyle Powerhouse(USGS 11510700)
0.7 mi downstream ofJ.C. Boyle powerhouseRM 219.7
Water level w/ staffgauge, USGS equip,PacifiCorp equip
USGS Real-time, seen atPacifiCorp, onUSGS website
Copco No. 1 ReservoirLevel
At Copco damRM 198.7
Water level w/ staffgauge, PacifiCorp equip
PacifiCorp Real-time, seen atPacifiCorp
Copco No.2 IntakeLevel
At Copco 2 damRM 198.4
Water level w/ staffgauge, PacifiCorp equip
PacifiCorp Real-time, seen atPacifiCorp
Iron Gate ReservoirLevel
At Iron Gate damRM 190.2
Water level w/ staffgauge, PacifiCorp equip
PacifiCorp Real-time, seen atPacifiCorp
Klamath R. Below IronGate Dam (USGS11516530)
0.6 mi below Iron Gatedam; RM 189.6
Water level, staff gauge,USGS equip, PacifiCorpequip
USGS Real-time, seen atPacifiCorp; onUSGS website
B2.2 FLOW REGULATION INTO AND OUT OF THE USBR PROJECT TO THEKLAMATH HYDROELECTRIC PROJECT
UKL and, to a lesser extent, the Klamath River are the major sources of water for the USBRProject. Up to 1,150 cfs of water may be diverted from UKL through the A-canal (just upstreamof the Link River dam) to the USBR Project during the irrigation season (May - October). Theamount diverted is typically approximately 20 to 30 percent of the annual outflow from the lakeand 50 percent of the summer outflow (FERC, 1990). Agricultural returns from this and other
PacifiCorpKlamath Hydroelectric Project
FERC No. 2082
© February 2004 PacifiCorpExhibit B.doc Exhibit B Page 2-7
diversions have a mean of approximately 400 cfs in the summer and enter the Klamath Riverthrough the ADY canal just upstream of Keno dam. In the fall and winter, spill from USBR’sdams on the Lost River system and irrigation drain water from the Lost River basin and LowerKlamath Lake (a closed system) are added to the total flow of the Klamath River upstream ofKeno dam from the Lost River diversion channel. Such inflow can be as much as 3,000 cfs in thespring; it usually ranges from 200 to 1,500 cfs in the summer. The Klamath Irrigation District,via the USBR calls PacifiCorp’s Hydro Control Center daily with readings of the variousirrigation flows. These flows include pumping from Keno reservoir (a negative value) andinflows into the reservoir from the Lost River diversion channel and Klamath Straits Drain.
B2.3 FLOW REGULATION THROUGH THE PROJECT DURING SUMMER AND/ORBELOW AVERAGE WATER YEAR
Since inflow to the Project must be balanced with outflow (as Project reservoirs have little activestorage), inflow into the Klamath Hydroelectric Project is routinely adjusted to meet specifiedinstream flows below Iron Gate dam. Total summer inflow is typically composed of UKL spillthrough Link River dam spill and the associated fish ladder flows, East Side and West Sidepowerhouse flow, return water from the USBR Project, and summertime tributary accretiondownstream of Keno dam. Based on available and Iron Gate dam required flows, J.C. Boyle,Copco No. 1 and Copco No. 2 may operate as load factoring generation facilities.
B2.4 FLOW REGULATION THROUGH USBR AND KLAMATH HYDROELECTRICPROJECTS IN WINTER AND/OR HIGH WATER YEARS
Collectively, the Project reservoirs and UKL are currently capable of storing approximately49 percent of the mean annual flow as measured at the Iron Gate gauge site. Approximately83 percent of this total storage is provided by UKL. Storage in all PacifiCorp reservoirscombined is only 127,729 AF and only 12,244 of this is in active storage. Therefore, Projectreservoirs store only 8.2 percent of the mean annual flow, and have “active” storage for onlyapproximately 0.8 percent of the mean annual flow.
During the winter and spring in average and above average water years, more water flows intoUKL than can be stored in UKL and Project reservoirs. During these times, operations becomerun-of-river such that all hydroelectric facilities operate at full hydraulic capacity and excesswater is spilled at each of the dams. In below average water years, none of the dams typicallyspill since total inflow to the Klamath system may be less than what can be stored in UKL.Under such conditions, the flow regulation conditions described in Section B2.2 apply.
The potential for high runoff conditions occurs each year from approximately November throughApril. Because the Project reservoirs provide little active storage, UKL provides the onlymeaningful storage in the basin to ameliorate high flow events. Since the inception of the 1992Biological Opinion for suckers, target elevations in UKL have been relatively high in the springmonths to benefit water quality and larval sucker nursery habitat. This condition compromisesUKL’s flood control benefits. High target lake levels during spring runoff essentially eliminatethe ability of UKL to store a high flow event (approximately 10,000 cfs). Typically, Projectreservoirs are drawn down to some extent prior to spring runoff to provide very limited floodcontrol during high flow events. However, this is not done with the Keno reservoir.

PacifiCorpKlamath Hydroelectric ProjectFERC No. 2082
© February 2004 PacifiCorpExhibit B Page 2-8 Exhibit B.doc
B2.4.1 Project Flood Control
During high runoff season, PacifiCorp will frequently draft down Copco and Iron Gatereservoirs by 4 to 7 vertical feet each. The vacant storage created by this draft is then available tomanage all or some portion of the high flows as they accumulate from sub-basin tributariesdownstream of the Link River dam. This vacant storage also allows for better management offlows below Iron Gate.
During high water conditions, plant personnel may open the spillway gates and maintain fullgeneration. Spill occurs at Link River dam when outflow of Upper Klamath Lake is greater thanthe combined East Side and West Side powerhouse capacity of 1,450 cfs. Link River dam has aspillway capacity of 13,000 cfs. Spill at Keno dam is continuous, and the total spill capacity ofthe dam is 35,000 cfs at elevation of 4,082 feet msl. Spill occurs at J.C. Boyle dam whenincoming river flows are greater than 2,850 cfs. The spillway discharge capacity for the J.C.Boyle dam is 29,100 cfs at elevation 3,797.8 feet msl. Downstream at Copco No. 1 and No. 2,spill occurs when flow is greater than 3,200 cfs, the hydraulic capacity of each powerhouse.Spillway discharge capacity at Copco No. 1 dam is 44,800 cfs at 2,611.3 feet msl and 25,000 cfsat Copco No. 2. Flows greater than 1,750 cfs at Iron Gate dam will spill over the spillwaydependent on reservoir elevation. At Iron Gate, the ungated spillway capacity is 74,400 cfs at2,345.4 msl. In the case of very high flows and under emergency circumstances, a low-leveltunnel may be opened to pass an additional 3,800 cfs. Flow through the tunnel is managed via aslide gate, which can only be operated at the facility. The flow capacity of the Fall Creekpowerhouse is 50 cfs, so any additional flow goes over the spillway. During periods of highflow, Project facilities may be checked several times per 24-hour period, or manned continuallyif needed.
B2.5 OTHER OUT-OF-BASIN DIVERSIONS
B2.5.1 Rogue River Basin Irrigation Project
USBR operates the Rogue River Basin Irrigation Project (Rogue River Project). The RogueRiver basin is to the northwest of the Klamath basin on the west slope of the Cascade MountainRange. This project supplies irrigation water for approximately 35,000 acres in the Medford,Rogue River, and Talent Irrigation Districts.
Some water for the Rogue River Project is diverted from the Klamath basin at Four Mile Lake,Hyatt reservoir, and Howard Prairie reservoir. The latter two reservoirs drain to Jenny Creek, atributary to the Iron Gate reservoir. If water (approximately 30,000 acre-feet) from these tworeservoirs were not transferred out of basin, it would flow to Jenny Creek. A significant portionof the inflow to these two reservoirs occurs in the wet winter months. Hence, this is the timeperiod in which water is diverted from Jenny Creek to the Rogue River Project. Inflows to Hyattand Howard Prairie reservoirs from the Klamath basin are little to none July through September.
Approximately thirty-two water rights permits (as per 1994 data) allow for a Klamath Riverbasin point of diversion to a Rogue River basin point of use. Thirteen of these are associated withFour Mile Lake and nineteen are associated with the Hyatt and Howard Prairie reservoirs.

PacifiCorpKlamath Hydroelectric Project
FERC No. 2082
© February 2004 PacifiCorpExhibit B.doc Exhibit B Page 2-9
B2.5.2 City of Yreka Municipal Water Supply
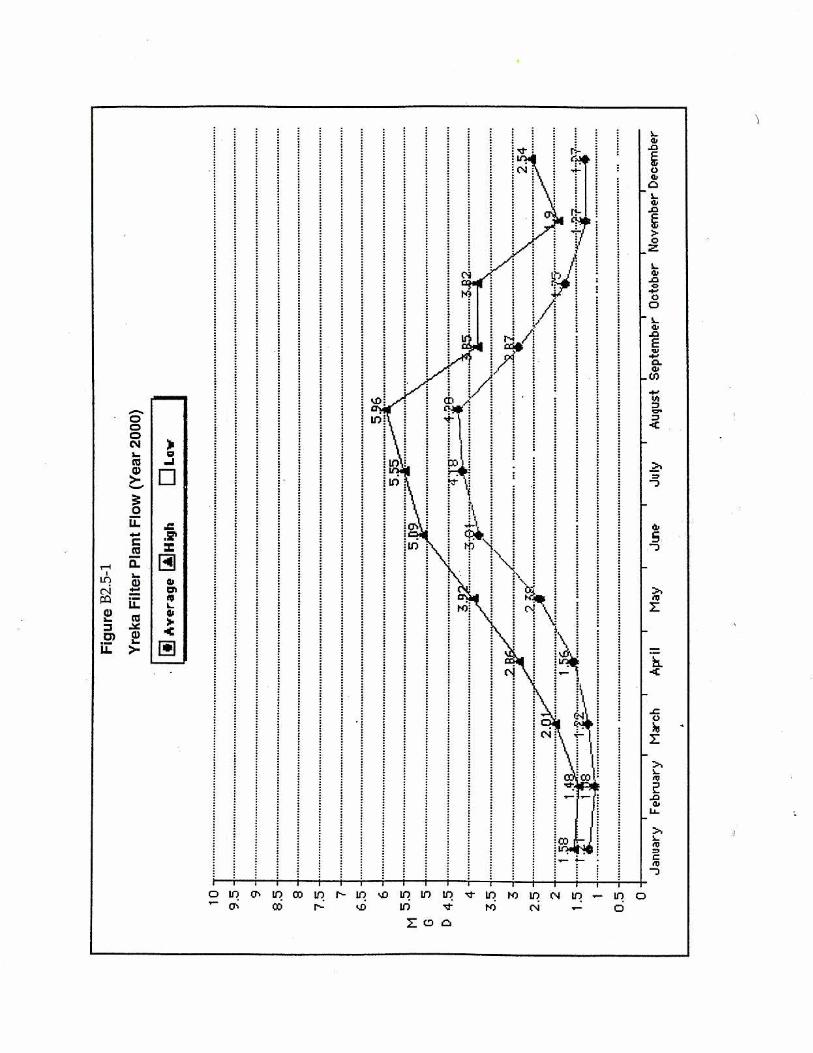
The City of Yreka has a 1966 California water right for 15 cfs to divert water from Fall Creek forits municipal water supply. The city maintains and operates two diversions in Fall Creek: A-dam(the primary diversion structure) and B-dam (the secondary diversion structure). The A-dam islocated upstream from the California Department of Fish and Game (CDFG) Fall Creek hatcheryintake and downstream from the Fall Creek powerhouse. The B-dam is located upstream of thepowerhouse tailrace in the natural channel below a waterfall. Two diversions are necessary sincethe dependability of adequate flow at each diversion is not guaranteed. For instance, if the FallCreek powerhouse trips offline, flow to the A-dam may eventually cease. During that time, theCity of Yreka can switch its point of diversion to the B-dam. Both of the diversions are concretestructures with stop logs spanning the width of the creek. Screened pumps are used at bothlocations. The data in Figure B2.5-1 for calendar year 2000 were provided by the City of Yreka.According to the City, year 2000 was a fairly typical year relative to the amount of waterdiverted to the City. Approximately 820 million gallons per year (2,519 acre-feet per year) ofwater was diverted from Fall Creek with the largest diversions occurring during the late summer.Monthly average diversion rates did not exceed 10 cfs.
© February 2004 PacifiCorpExhibit B.doc Exhibit B Page 3-1
B3.0 FLOW REGULATION THROUGH THE PROPOSED KLAMATH HYDROELECTRICPROJECT
The proposed Project will not include the East Side and West Side developments. It is expectedthat USBR will solely operate Link River dam and will be responsible for releasing water tomeet both the Link River and Iron Gate Development instream flow requirements.
The proposed Project will not include the Keno Development, but the Keno dam will continue tobe operated per current operations under the jurisdiction of the state of Oregon.
Overall, the amount and timing of water available at the J.C. Boyle, Copco No. 1, Copco No. 2,and Iron Gate developments will be similar to existing hydrologic conditions since no newstorage facilities above J.C. Boyle are proposed, nor are any storage facilities being removed.The East Side and West Side developments have no storage capacity.


© February 2004 PacifiCorpExhibit B.doc Exhibit B Page 4-1
B4.0 HYDROLOGY—EXISTING CONDITIONS
B4.1 PROJECT AREA HYDROLOGIC DRAINAGE AREA AND FLOW REGIME
The drainage basin area upstream from Iron Gate dam covers 4,630 square miles throughoutKlamath County, Oregon, and Siskiyou County, California. The drainage basin areas upstreamfrom the J.C. Boyle powerhouse and Keno dam cover approximately 4,080 and 3,920 squaremiles, respectively within Klamath County. However, the operations and diversions for irrigationand wildlife refuge maintenance from UKL largely control Klamath River drainage flows belowLink River dam. Ninety-eight percent of the available 499,074 acre-feet of active storage in thebasin area is contained in UKL.
Gauged runoff and flow patterns on the Klamath River closely reflect climatic conditions andcycles (BHI, 1996; Ayers Associates, 1999). Precipitation in the basin is distinctly seasonal, with60 percent of the total annual precipitation falling from November to March. December andJanuary are the wettest months; the driest months are between June and September. Annualprecipitation patterns historically define distinct dry and wet cycles that are closely related torunoff and the river’s flow regime. The most recent climatic trends include wet periods from1885 to 1915 and 1940 to 1975, and dry periods from 1915 to 1940 and 1975 to 1994. Generaldecreases in runoff and discharge over the last 20 years also coincide with a generally decreasingtrend in precipitation patterns.
The construction of the Copco dams (1918 and 1925) followed by the Link River dam (1921),J.C. Boyle dam (1958), Iron Gate dam (1962), and Keno dam (1967) has had limited effect onstorage capacity and flow in the Klamath River. As summarized in Table B4.1-1, the reservoirsin the upper basin currently are capable of storing approximately 49 percent of the mean annualflow at the Iron Gate gauge site. However, most of this storage is provided by UKL, as the otherreservoirs operated by PacifiCorp have a limited ability to store and therefore affect the river’soverall flow regime. The ability of the reservoirs in the upper basin to alter the river’s flowregime further diminishes moving downstream. For example, the reservoirs are capable ofstoring about 6 percent of the mean annual runoff at the Klamath gauge site near the mouth ofthe Klamath River at Klamath, California (Table B4.1-1).
PacifiCorpKlamath Hydroelectric ProjectFERC No. 2082
© February 2004 PacifiCorpExhibit B Page 4-2 Exhibit B.doc
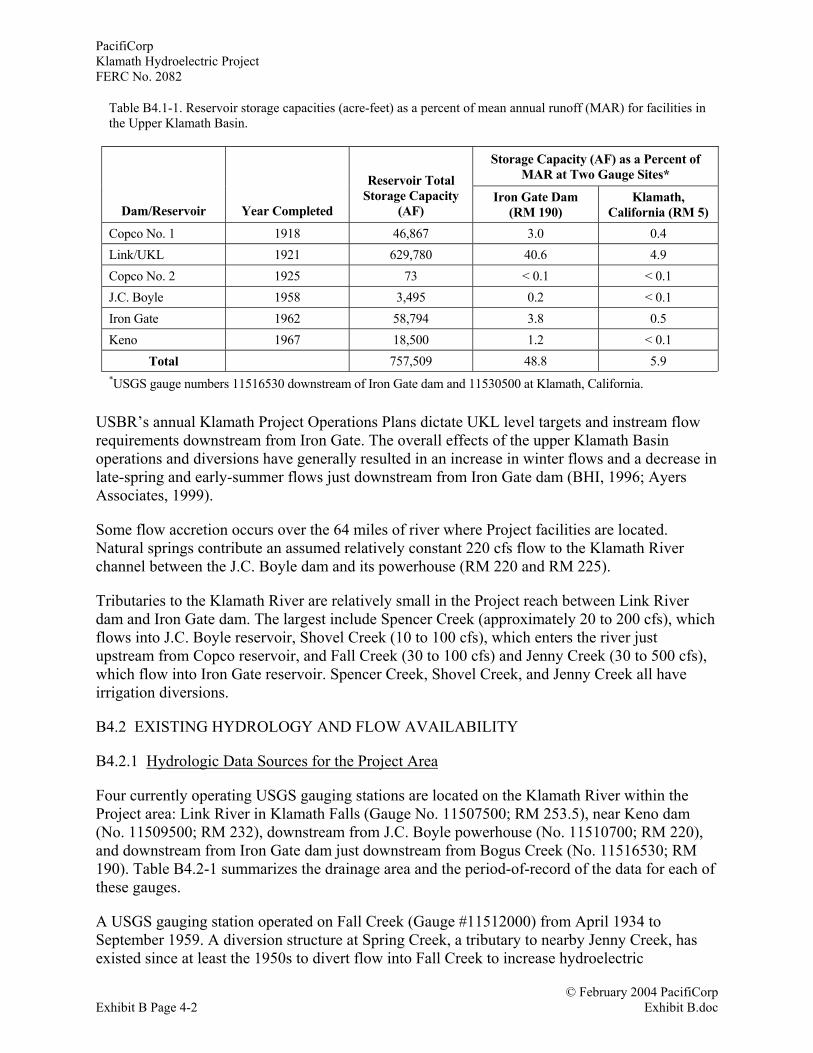
Table B4.1-1. Reservoir storage capacities (acre-feet) as a percent of mean annual runoff (MAR) for facilities inthe Upper Klamath Basin.
Storage Capacity (AF) as a Percent ofMAR at Two Gauge Sites*
Dam/Reservoir Year Completed
Reservoir TotalStorage Capacity
(AF)Iron Gate Dam
(RM 190)Klamath,
California (RM 5)Copco No. 1 1918 46,867 3.0 0.4Link/UKL 1921 629,780 40.6 4.9Copco No. 2 1925 73 < 0.1 < 0.1J.C. Boyle 1958 3,495 0.2 < 0.1Iron Gate 1962 58,794 3.8 0.5Keno 1967 18,500 1.2 < 0.1
Total 757,509 48.8 5.9*USGS gauge numbers 11516530 downstream of Iron Gate dam and 11530500 at Klamath, California.
USBR’s annual Klamath Project Operations Plans dictate UKL level targets and instream flowrequirements downstream from Iron Gate. The overall effects of the upper Klamath Basinoperations and diversions have generally resulted in an increase in winter flows and a decrease inlate-spring and early-summer flows just downstream from Iron Gate dam (BHI, 1996; AyersAssociates, 1999).
Some flow accretion occurs over the 64 miles of river where Project facilities are located.Natural springs contribute an assumed relatively constant 220 cfs flow to the Klamath Riverchannel between the J.C. Boyle dam and its powerhouse (RM 220 and RM 225).
Tributaries to the Klamath River are relatively small in the Project reach between Link Riverdam and Iron Gate dam. The largest include Spencer Creek (approximately 20 to 200 cfs), whichflows into J.C. Boyle reservoir, Shovel Creek (10 to 100 cfs), which enters the river justupstream from Copco reservoir, and Fall Creek (30 to 100 cfs) and Jenny Creek (30 to 500 cfs),which flow into Iron Gate reservoir. Spencer Creek, Shovel Creek, and Jenny Creek all haveirrigation diversions.
B4.2 EXISTING HYDROLOGY AND FLOW AVAILABILITY
B4.2.1 Hydrologic Data Sources for the Project Area
Four currently operating USGS gauging stations are located on the Klamath River within theProject area: Link River in Klamath Falls (Gauge No. 11507500; RM 253.5), near Keno dam(No. 11509500; RM 232), downstream from J.C. Boyle powerhouse (No. 11510700; RM 220),and downstream from Iron Gate dam just downstream from Bogus Creek (No. 11516530; RM190). Table B4.2-1 summarizes the drainage area and the period-of-record of the data for each ofthese gauges.
A USGS gauging station operated on Fall Creek (Gauge #11512000) from April 1934 toSeptember 1959. A diversion structure at Spring Creek, a tributary to nearby Jenny Creek, hasexisted since at least the 1950s to divert flow into Fall Creek to increase hydroelectric

PacifiCorpKlamath Hydroelectric Project
FERC No. 2082
© February 2004 PacifiCorpExhibit B.doc Exhibit B Page 4-3
production. PacifiCorp estimates that the minimum observed flow in spring-fed Spring Creek isapproximately 5 cfs; however, some flows will be required to maintain instream flows below thediversion. The maximum diversion allowed by the water right is 16.5 cfs. In addition, the City ofYreka diverts flow above the USGS gauge. The current and future hydrologic condition of FallCreek was therefore approximated by considering these constraints along with the measuredflows from the 1934-59 USGS gauge period of record.
Table B4.2-1. USGS flow gauging data for the Klamath River in the Project area.*
USGS GaugeDrainage Area(square miles) Gauge Number Period of Record
Link River at Klamath Falls 3,810 11507500 6/01/04-9/30/1310/01/29-present
Klamath River at Keno 3,920 11509500 10/01/29-presentKlamath River Downstreamfrom J.C. BoylePowerhouse
4,080 11510700 1/1/59-9/30/7110/1/74-9/30/7910/1/82-9/30-8710/1/88-present
Klamath River Downstreamof Iron Gate Dam
4,630 11516530 10/01/60-present
*Includes only those gauges that have a period of record extending to present. Two other USGS flow gauge sites onthe Klamath River in the Project area were discontinued in 1931 (at Spencer Bridge) and 1961 (near Copco).
B4.2.2 Average Daily Flow Rates
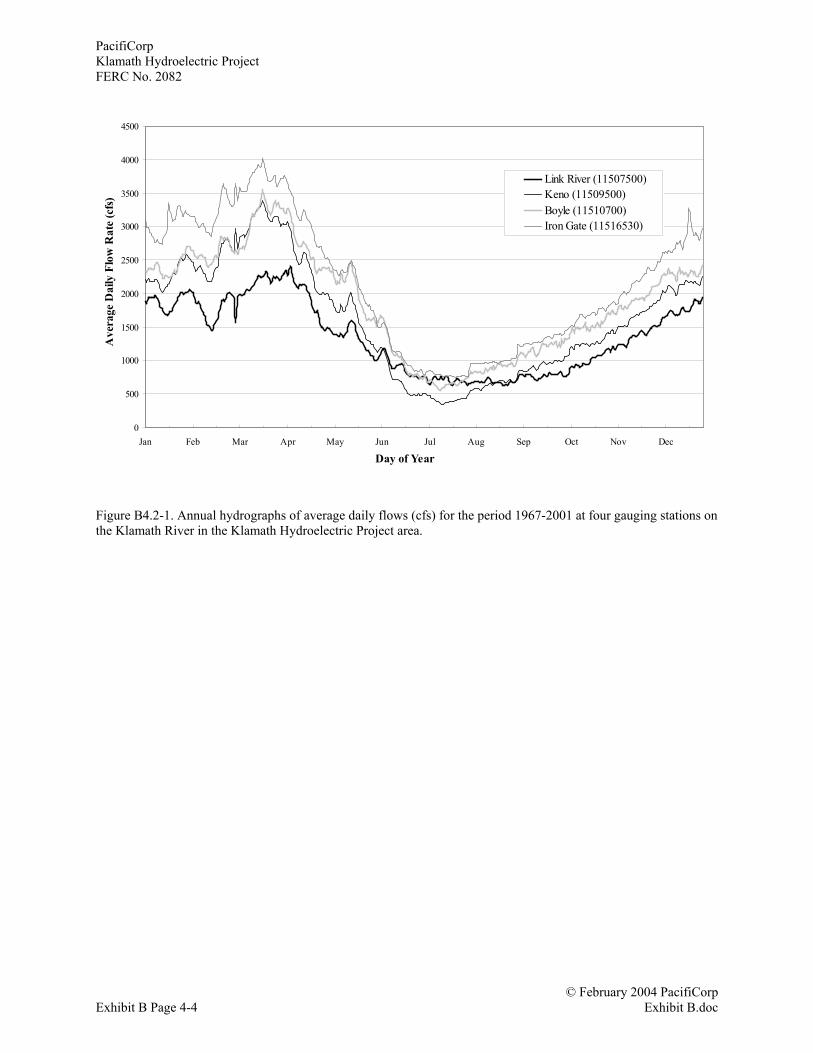
Graphs of average daily flow by month at the four key USGS gauges are provided in the WaterResources Final Technical Report (FTR). Figure B4.2-1 depicts annual hydrographs of averagedaily flow over the period 1967-2001 for the four key USGS gauges. To illustrate flow variationin recent years, Figure B4.2-2 shows the annual hydrograph of average daily flow for the Kenogauge (No. 11509500), together with annual hydrographs for 1991, a critical dry year, and 1998,a wet year.
Figure B4.2-3 shows the 50 percent (median) monthly flow values for Fall Creek for threescenarios. These are: (1) period of record only, representing historic Fall Creek conditionswithout diversion; (2) 5 cfs diverted, representing the minimum expected diversion flow plushistoric conditions; and (3) 16.5 cfs diverted, the sum of historic conditions and the maximumallowed diversion1.
1 It is likely that the diversion range of 5 to 16.5 cfs follows a seasonal pattern, with higher flows in later winter and spring, and lowflows in late summer and autumn. However, no data were available to confirm this. Consequently, the range of diversions and wateryear types were overlain to provide a range of flow values and associated exceedances, regardless of time of year.
PacifiCorpKlamath Hydroelectric ProjectFERC No. 2082
© February 2004 PacifiCorpExhibit B Page 4-4 Exhibit B.doc
0
500
1000
1500
2000
2500
3000
3500
4000
4500
Jan Feb Mar Apr May Jun Jul Aug Sep Oct Nov Dec
Link River (11507500)Keno (11509500)Boyle (11510700)Iron Gate (11516530)
Ave
rage
Dai
ly F
low
Rat
e (c
fs)
Day of Year
Figure B4.2-1. Annual hydrographs of average daily flows (cfs) for the period 1967-2001 at four gauging stations onthe Klamath River in the Klamath Hydroelectric Project area.

PacifiCorpKlamath Hydroelectric Project
FERC No. 2082
© February 2004 PacifiCorpExhibit B.doc Exhibit B Page 4-5
0
1000
2000
3000
4000
5000
6000
7000
Jan Feb Mar Apr May Jun Jul Aug Sep Oct Nov Dec
Water Year 1998 (Wet)
Water Year 1991 (Dry)
Water Years 1967-99
Ave
rage
Dai
ly F
low
Rat
e (c
fs)
Day of Year
Figure B4.2-2. Annual hydrographs of average daily flows in the Klamath River at Keno (USGS GaugeNo. 11509500) for the period 1967-1999, a critical dry year (1991), and a wet year (1998).

PacifiCorpKlamath Hydroelectric ProjectFERC No. 2082
© February 2004 PacifiCorpExhibit B Page 4-6 Exhibit B.doc
0
10
20
30
40
50
60
70
80
Jan Feb Mar Apr May Jun Jul Aug Sep Oct Nov Dec
Month
Flo
w (
cfs)
Maximum Spring Creek Diversion (16.5 cfs)Minimum Observed Spring Creek Flow (5 cfs)No Spring Creek Diversion
Figure B4.2-3. Estimated monthly median flow values for Fall Creek based on available data from USGS Gauge11512000 for the period of record April 1934 to September 1959.Spring Creek flow will be diverted to Fall Creek throughout the year. The minimum flow in Spring Creek isestimated to be 5 cfs and the maximum diversion is estimated to be 16.5 cfs.
B4.3 EXISTING INSTREAM FLOW RELEASES
Minimum flows downstream of Link River dam are generally maintained at 90 cfs upstream ofthe East Side powerhouse and 450 cfs downstream of the West Side powerhouse (whensufficient water from UKL is available).
The minimum flow requirement downstream of Keno dam is 200 cfs, as cooperativelyestablished by Oregon Department of Fish and Wildlife (ODFW) and PacifiCorp. This minimumflow has been incorporated into the current FERC license per Article 58. The dam is typicallyoperated at much higher flows and drops to near 200 cfs only in unusually dry years. PacifiCorphas little control in regulating flows that pass Keno dam, because total flows in this reach aregoverned largely by reservoir elevation needs for irrigation and by USBR directives in meetingits instream flow requirements downstream of Iron Gate dam.
The Project’s current FERC license (Article 34) requires a year-round minimum flow at J.C.Boyle dam of 100 cfs. However, approximately 220 cfs of spring flows enters this 4-mile bypassreach, beginning about ¾ mile downstream from the dam. Therefore, at the downstream end ofthe bypass reach, minimum flows are approximately 320 cfs.
The Copco No. 1 powerhouse discharges directly to the Copco No. 2 reservoir. Copco No. 2powerhouse discharges directly to Iron Gate reservoir. Between Copco No. 2 dam and CopcoNo. 2 powerhouse, the bypass reach is approximately 1.4 miles. There is no required minimumflow for this reach, but PacifiCorp maintains a flow of 5 to 10 cfs.

PacifiCorpKlamath Hydroelectric Project
FERC No. 2082
© February 2004 PacifiCorpExhibit B.doc Exhibit B Page 4-7
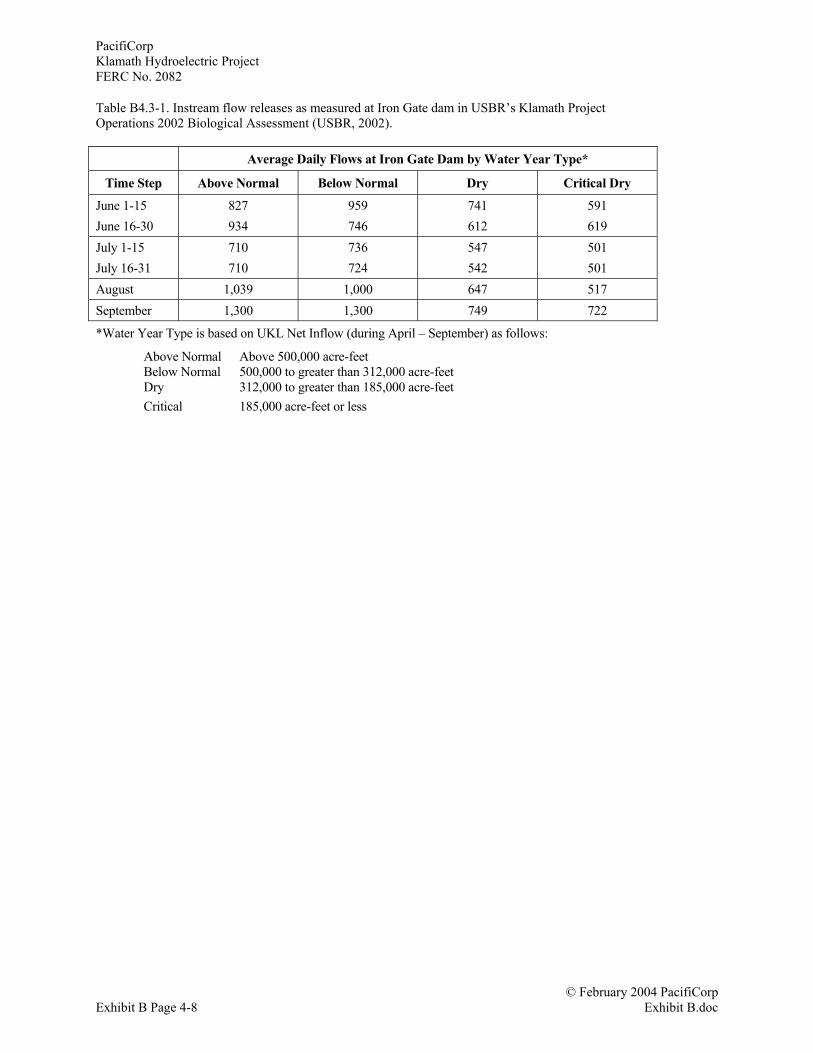
Current FERC-stipulated minimum flow requirements below Iron Gate dam are 1,300 cfs fromSeptember through April, 1,000 cfs in May and August, and 710 cfs in June and July. However,since 1997, PacifiCorp has provided instream flow releases required by USBR’s annual ProjectOperations Plans. USBR’s consultation with U.S. Fish and Wildlife Services (USFWS) andNational Oceanic and Atmospheric Administration (NOAA)-Fisheries on the Plans resulted inBiological Opinions that specifically defined UKL elevations and Klamath River flowsdownstream of Iron Gate dam needed to protect ESA-listed species (USBR, 2002).
To comply with the NOAA Fisheries 2002 Biological Opinion (NOAA, 2002), PacifiCorpcoordinates with USBR to pass through those minimum flows stated in the current biologicalopinion rather than those cited as the FERC minimum. During 2003 through 2005, USBR willmeet or exceed the Iron Gate dam flows listed in Table B3.3-1 by water year types plus anadditional volume to be provided by a water bank (USBR, 2002). Specifically, the minimumvolume of additional water during water years 2003 through 2005 will be 50 TAF, 75 TAF, and100 TAF, respectively. The amount of this additional water is to increase with each successiveyear as USBR continues to develop water resources to support a reliable water bank. Iron GateFish Hatchery return water and Bogus Creek contributions are included in this minimum flow.
To prevent potential fish stranding, USBR will operate the Klamath Irrigation Project to providewater and coordinate with PacifiCorp to achieve the following rates for ramping down of flowsbetween monthly or biweekly timesteps below Iron Gate dam (as listed in Table B4.3-1): (1)decreases in flow of 300 cfs or less per 24-hour period and no more than 125 cfs per 4-hourperiod when Iron Gate dam flows are above 1750 cfs; or (2) decreases in flows of 150 cfs or lessper 24-hour period and no more than 50 cfs per 2-hour period when Iron Gate dam flows are1750 cfs or less (NOAA, 2002).
The current FERC license minimum flow requirements are 0.5 cfs at all times from the FallCreek dam into Fall Creek, and a 15-cfs continuous flow in Fall Creek (or a quantity equal to thenatural stream flow, whichever is less) downstream of the powerhouse.
Table B4.3-1. Instream flow releases as measured at Iron Gate dam in USBR’s Klamath ProjectOperations 2002 Biological Assessment (USBR, 2002).
Average Daily Flows at Iron Gate Dam by Water Year Type*
Time Step Above Normal Below Normal Dry Critical Dry
October 1,345 1,345 879 920November 1,337 1,324 873 912December 1,387 1,621 889 929January 1,300 1,334 888 1,101February 1,300 1,806 747 637March 1-15March 16-30
1,9532,553
2,1901,896
849993
607547
April 1-15April 16-30
1,8632,791
1,7421,347
969922
874773
May 1-15May 16-31
2,2041,466
1,0211,043
761979
633608
PacifiCorpKlamath Hydroelectric ProjectFERC No. 2082
© February 2004 PacifiCorpExhibit B Page 4-8 Exhibit B.doc
Table B4.3-1. Instream flow releases as measured at Iron Gate dam in USBR’s Klamath ProjectOperations 2002 Biological Assessment (USBR, 2002).
Average Daily Flows at Iron Gate Dam by Water Year Type*
Time Step Above Normal Below Normal Dry Critical Dry
June 1-15June 16-30
827934
959746
741612
591619
July 1-15July 16-31
710710
736724
547542
501501
August 1,039 1,000 647 517September 1,300 1,300 749 722
*Water Year Type is based on UKL Net Inflow (during April – September) as follows:
Above Normal Above 500,000 acre-feetBelow Normal 500,000 to greater than 312,000 acre-feetDry 312,000 to greater than 185,000 acre-feetCritical 185,000 acre-feet or less

© February 2004 PacifiCorpExhibit B.doc Exhibit B Page 5-1
B5.0 HYDROLOGY—PROPOSED CONDITIONS
For the proposed Project, water will no longer be provided to the East Side and West Sidedevelopments. USBR will be responsible for maintaining appropriate instream flow and ramprates in Link River below Link River dam. Although no longer a part of the Project, PacifiCorpintends to continue to operate Keno dam per current operations under the jurisdiction of the Stateof Oregon.
As a result, flows into the proposed Project at the J.C. Boyle Development and into the otherProject developments are expected to be similar to existing conditions.


© February 2004 PacifiCorpExhibit B.doc Exhibit B Page 6-1
B6.0 LINK RIVER DAM
B6.1 FACILITY OVERVIEW
Link River dam, located at RM 254 in Klamath Falls, Oregon, is the point of water diversion forthe East Side and West Side powerhouses. Construction of Link River dam was completed in1921. As a federally owned dam, Link River dam is not included in the current FERC license forthe Project. The current license includes the East Side and West Side diversion canals and alldownstream Project facilities. Although the East Side and West Side developments are proposedfor decommissioning, information regarding Link River dam is provided to describe historicoperations.
B6.2 OWNERSHIP AND CONTRACTUAL OBLIGATIONS
PacifiCorp’s operational relationship with USBR dates back to 1917. On February 24, 1917,PacifiCorp’s predecessor, Copco (California and Oregon Power Company), entered into anagreement with USBR to construct Link River dam for the regulation of UKL. Under thisagreement, Copco constructed Link River dam at its own expense and agreed to operate it toserve the USBR Project. In exchange, Copco received significant flexibility to regulate the activewater storage in UKL to maximize water availability for downstream hydroelectric generationoutside the irrigation period. The term of the 1917 agreement was 50 years. To gain additionalactive storage, construction of the dam included notching the natural bedrock reef upstream ofLink River dam in the narrow of the UKL outlet. This notching lowered the hydraulic controlpoint 3 feet so the lake could be drawn down to an elevation of El. 4137 feet mean sea level(msl).
On January 31, 1956, the parties renewed the agreement, on essentially the same terms, foranother 50 years (Appendix B-1A). Under the 1956 Contract, USBR owned Link River dam, butCopco had a broad right to regulate UKL between the elevations of El. 4137 and El. 4143.3 feetmsl. In exchange, Copco agreed to provide electric power at significantly reduced rates for useby USBR Project irrigators pumping USBR Project water.
Under the 1956 Contract, USBR set operational conditions that allowed PacifiCorp sufficientflexibility (in the form of storage water) to efficiently use UKL as a reservoir for hydroelectricbenefits. Since 1992, however, USBR has modified Link River dam operations to benefit theshortnose sucker and the Lost River sucker, two Klamath Basin fish listed in 1988 as endangeredunder the ESA (USFWS, 1992). To protect these fish, the USFWS required that water levels inUKL be managed within specific elevation limits. The impact to PacifiCorp’s Project was lostflexibility in how UKL water storage could be used to optimize and shape power production. The1992 operational directives have also increased the risk of springtime flooding. The overallimpact has been higher UKL elevations during the spring run-off period with resultant increasesin the amount of water spilled to the river that otherwise could have been used to generateelectricity during the winter.
Compliance with more recent biological opinions for USBR’s operations have resulted in furtherloss of seasonal generation due to additional constraints on UKL operational flexibility andhigher summer flows downstream of Iron Gate dam (USFWS, 2001 and NOAA Fisheries, 2001).

PacifiCorpKlamath Hydroelectric ProjectFERC No. 2082
© February 2004 PacifiCorpExhibit B Page 6-2 Exhibit B.doc
Initially, PacifiCorp’s flexibility was limited only by the requirement to satisfy USBR Projectwater requirements. But with the ESA listing of upstream suckers in 1988 and downstream cohosalmon in 1997, PacifiCorp’s ability to operate UKL for hydroelectric purposes was essentiallyeliminated. UKL elevations are driven by ESA requirements, then Tribal Trust, then irrigationneeds, then hydroelectric uses. In the mid-1990s, PacifiCorp considered rescinding the 1956Contract because its original purpose in entering the contract was no longer viable (i.e.,providing storage in UKL for hydropower generation). The situation had left PacifiCorp withsignificant liability exposure due to potential impacts on flood control while no longer affordingPacifiCorp the ability to operate UKL for the benefit of the downstream hydroelectric Project.
In 1997, in order to induce PacifiCorp not to rescind the 1956 Contract, USBR proposed amodification to the 1956 Contract (see Appendix B-1A). Under the 1997 modification, USBRassumed all discretionary responsibility for UKL levels and minimum stream flows at Iron Gatedam. This eliminated PacifiCorp’s exposure to ESA liability for the consequences of operatingLink River dam and water levels of UKL. Since 1997, USBR and PacifiCorp have signed annualletter of agreements to continue under the 1997 Contract modification (see Appendix B-1A).
The 1997 modification was challenged in court by some groups of USBR Project irrigators. Theirrigators believed that PacifiCorp had authority under the 1956 Contract to refuse to implementUSBR’s annual operations plans. In Klamath Water Users Protective Association v. Patterson(January 28, 2000), the U.S. Ninth Circuit Court of Appeals upheld the 1997 modification andmade it clear that the ESA gave USBR, not PacifiCorp, priority control over UKL levels andflows below Iron Gate dam flows.
PacifiCorp currently operates Link River dam and Iron Gate dam to meet agency target UKLlevels and target minimum flows below Iron Gate dam. Lake levels and stream flows aretypically presented in USBR’s annual Klamath Project Operations Plans, following consultationswith USFWS and NOAA Fisheries (formerly NMFS). The plans do not provide any significantoperational flexibility for PacifiCorp. PacifiCorp must use its technical expertise to determinehow best to meet the targets in USBR’s plans, while also protecting against floods. PacifiCorpdoes not have any meaningful ability to alter UKL levels to increase downstream Project powergeneration.
The 1956 Contract will expire by its terms in 2006. At that point, the right to operate and controlLink River dam will revert to USBR as its owner.
B6.3 EXISTING OPERATIONS
As discussed above, Link River dam is operated for UKL elevations and flows downstream ofIron Gate dam at USBR’s direction. With each new operating plan and consequent biologicalopinion, UKL elevations and minimum discharges on the Klamath River below Iron Gate damhave become more specific with more frequent targets to meet throughout the year. For example,the 1997 Operating Plan set four minimum target elevations for UKL and the 2001 OperatingPlan set six target minimum elevations. With the increase in constraint frequency, the operationalflexibility of using UKL as a storage reservoir has been greatly reduced and the capability of thelake to provide flood management has been reduced.
PacifiCorpKlamath Hydroelectric Project
FERC No. 2082
© February 2004 PacifiCorpExhibit B.doc Exhibit B Page 6-3
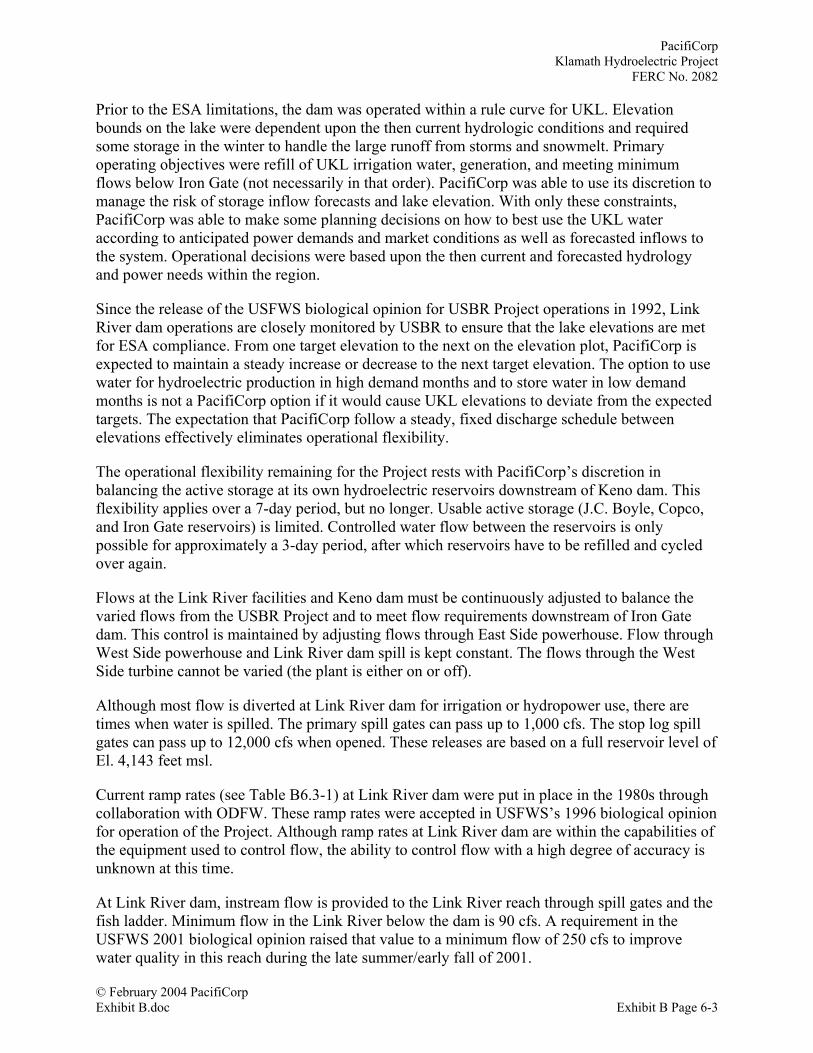
Prior to the ESA limitations, the dam was operated within a rule curve for UKL. Elevationbounds on the lake were dependent upon the then current hydrologic conditions and requiredsome storage in the winter to handle the large runoff from storms and snowmelt. Primaryoperating objectives were refill of UKL irrigation water, generation, and meeting minimumflows below Iron Gate (not necessarily in that order). PacifiCorp was able to use its discretion tomanage the risk of storage inflow forecasts and lake elevation. With only these constraints,PacifiCorp was able to make some planning decisions on how to best use the UKL wateraccording to anticipated power demands and market conditions as well as forecasted inflows tothe system. Operational decisions were based upon the then current and forecasted hydrologyand power needs within the region.
Since the release of the USFWS biological opinion for USBR Project operations in 1992, LinkRiver dam operations are closely monitored by USBR to ensure that the lake elevations are metfor ESA compliance. From one target elevation to the next on the elevation plot, PacifiCorp isexpected to maintain a steady increase or decrease to the next target elevation. The option to usewater for hydroelectric production in high demand months and to store water in low demandmonths is not a PacifiCorp option if it would cause UKL elevations to deviate from the expectedtargets. The expectation that PacifiCorp follow a steady, fixed discharge schedule betweenelevations effectively eliminates operational flexibility.
The operational flexibility remaining for the Project rests with PacifiCorp’s discretion inbalancing the active storage at its own hydroelectric reservoirs downstream of Keno dam. Thisflexibility applies over a 7-day period, but no longer. Usable active storage (J.C. Boyle, Copco,and Iron Gate reservoirs) is limited. Controlled water flow between the reservoirs is onlypossible for approximately a 3-day period, after which reservoirs have to be refilled and cycledover again.
Flows at the Link River facilities and Keno dam must be continuously adjusted to balance thevaried flows from the USBR Project and to meet flow requirements downstream of Iron Gatedam. This control is maintained by adjusting flows through East Side powerhouse. Flow throughWest Side powerhouse and Link River dam spill is kept constant. The flows through the WestSide turbine cannot be varied (the plant is either on or off).
Although most flow is diverted at Link River dam for irrigation or hydropower use, there aretimes when water is spilled. The primary spill gates can pass up to 1,000 cfs. The stop log spillgates can pass up to 12,000 cfs when opened. These releases are based on a full reservoir level ofEl. 4,143 feet msl.
Current ramp rates (see Table B6.3-1) at Link River dam were put in place in the 1980s throughcollaboration with ODFW. These ramp rates were accepted in USFWS’s 1996 biological opinionfor operation of the Project. Although ramp rates at Link River dam are within the capabilities ofthe equipment used to control flow, the ability to control flow with a high degree of accuracy isunknown at this time.
At Link River dam, instream flow is provided to the Link River reach through spill gates and thefish ladder. Minimum flow in the Link River below the dam is 90 cfs. A requirement in theUSFWS 2001 biological opinion raised that value to a minimum flow of 250 cfs to improvewater quality in this reach during the late summer/ early fall of 2001.
PacifiCorpKlamath Hydroelectric ProjectFERC No. 2082
© February 2004 PacifiCorpExhibit B Page 6-4 Exhibit B.doc
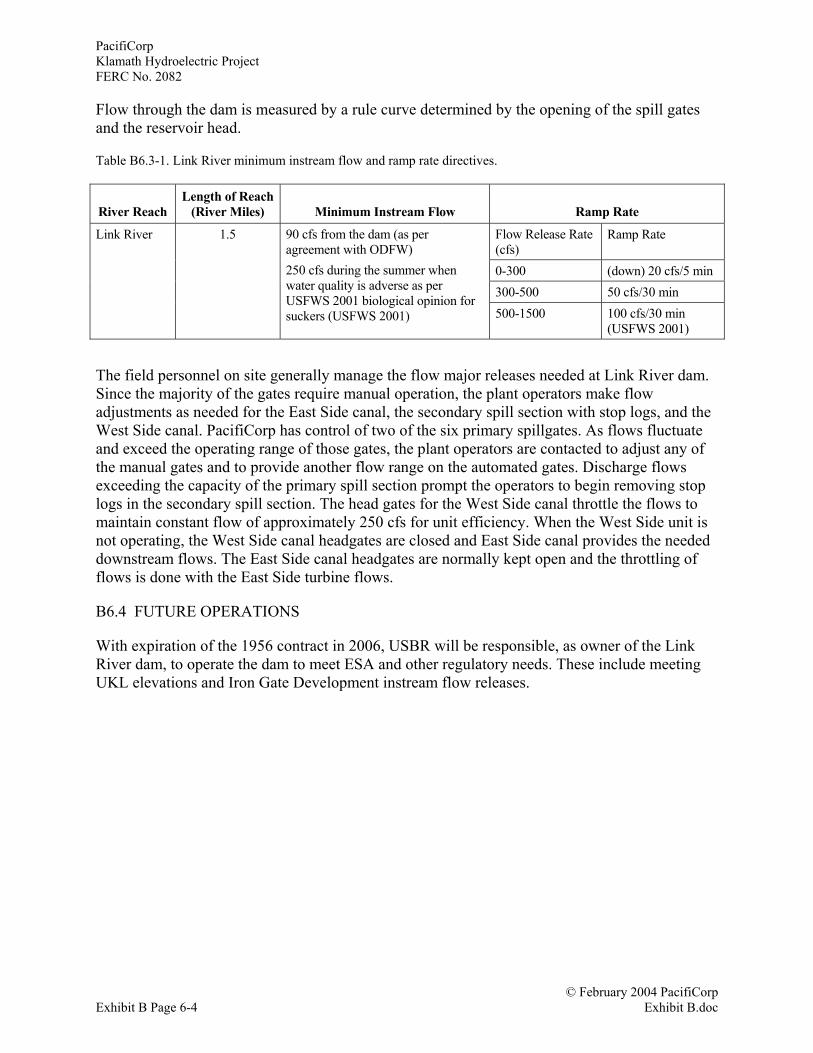
Flow through the dam is measured by a rule curve determined by the opening of the spill gatesand the reservoir head.
Table B6.3-1. Link River minimum instream flow and ramp rate directives.
River ReachLength of Reach
(River Miles) Minimum Instream Flow Ramp Rate
Flow Release Rate(cfs)
Ramp Rate
0-300 (down) 20 cfs/ 5 min300-500 50 cfs/30 min
Link River 1.5 90 cfs from the dam (as peragreement with ODFW)250 cfs during the summer whenwater quality is adverse as perUSFWS 2001 biological opinion forsuckers (USFWS 2001) 500-1500 100 cfs/30 min
(USFWS 2001)
The field personnel on site generally manage the flow major releases needed at Link River dam.Since the majority of the gates require manual operation, the plant operators make flowadjustments as needed for the East Side canal, the secondary spill section with stop logs, and theWest Side canal. PacifiCorp has control of two of the six primary spillgates. As flows fluctuateand exceed the operating range of those gates, the plant operators are contacted to adjust any ofthe manual gates and to provide another flow range on the automated gates. Discharge flowsexceeding the capacity of the primary spill section prompt the operators to begin removing stoplogs in the secondary spill section. The head gates for the West Side canal throttle the flows tomaintain constant flow of approximately 250 cfs for unit efficiency. When the West Side unit isnot operating, the West Side canal headgates are closed and East Side canal provides the neededdownstream flows. The East Side canal headgates are normally kept open and the throttling offlows is done with the East Side turbine flows.
B6.4 FUTURE OPERATIONS
With expiration of the 1956 contract in 2006, USBR will be responsible, as owner of the LinkRiver dam, to operate the dam to meet ESA and other regulatory needs. These include meetingUKL elevations and Iron Gate Development instream flow releases.

© February 2004 PacifiCorpExhibit B.doc Exhibit B Page 7-1
B7.0 EAST SIDE AND WEST SIDE DEVELOPMENTS
B7.1 INTRODUCTION
The East Side and West Side developments are part of the existing Project, but will be removedfrom service and excluded from the proposed Project.
B7.2 EAST SIDE DEVELOPMENT OVERVIEW
PacifiCorp owns and operates the East Side Development including the canal from Link Riverdam to the powerhouse. The development consists of 1,729 feet of wood-stave flowline,1,362 feet of steel flowline, a surge tank, and a powerhouse on the east bank of Link River.Maximum diversion capacity for the East Side powerhouse is 1,200 cfs. The powerhouseconsists of a single 3.2-MW unit. There are no fish screens at the East Side canal intake. A largetrash rack (28 feet by 28 feet) is in place at the entrance to the wood stave flowline.
B7.3 EAST SIDE POWERHOUSE CONTROL
The general operation of the East Side powerhouse is to operate continuously and not varygeneration according to customer demand. The exception is during late July into October whenthe powerhouse operates in a diurnal fashion reducing flows through the facility at night to 200cfs. This operation minimizes entrainment of federally listed fish (Lost River and shortnosesuckers).
The East Side Development typically operates as a run-of-river facility. In above-average wateryears, more water flows into UKL than can be stored. As such, the facility operates at fullhydraulic capacity and excess water is spilled. In below-average water years, spill does notoccur, and all available water is used for generation and the development is operated to meetspecified instream flows below Iron Gate.
Flow downstream of the East Side powerhouse is measured at USGS gauge 11507500 approxi-mately ¼ mile downstream from the plant. This gauge measures spill from Link River dam andpowerhouse flows. Powerhouse flow is determined with a rule curve based on power beingproduced. That is, a particular flow is known to produce a given amount of electricity based onthe efficiency of the turbine unit. There are no ramp rate restrictions for changing flows throughthe East Side powerhouse; however, a minimum instream flow of 450 cfs is in effect below thepowerhouse (Table B7.3-1).
Table B7.3-1. East Side minimum instream flow and ramp rate directives.
River ReachLength of Reach
(River Miles) Minimum Instream Flow Ramp Rate
Downstream of East Sidepowerhouse to Keno reservoir
Not Applicable 450 cfs (as per USFWS 1996 biologicalopinion for PacifiCorp)
None
The canal headgates are normally open, and in the event the powerhouse is not operating theelevation of the forebay mimics that of UKL. Depending on the expected length of an outage,Link River dam spillgate(s) may be opened to meet downstream flow needs.

PacifiCorpKlamath Hydroelectric ProjectFERC No. 2082
© February 2004 PacifiCorpExhibit B Page 7-2 Exhibit B.doc
The East Side powerhouse is operated both manually and automatically. Manual operationincludes manual watering up or de-watering of the water conveyance system before and afterplanned, extended outages. PacifiCorp personnel are present for normal unit startup andshutdown. Project flows and generation are monitored continuously. Unit loading can beremotely adjusted to meet downstream flow requirements until additional manual changes areneeded. Local personnel are able to operate the plant or shut the unit down until problems arecorrected.
B7.3.1 Annual Plant Factor
The average annual energy production for the East Side Development is 15,400 MWh (30-yearlong-term average, May 2003).
With an installed capacity of 3.2 MW, this yields an annual plant factor of 55 percent.
B7.3.2 Period of Critical Stream Flow, Average Annual Energy Production, and DependableCapacity
The period of critical stream flow used to determine the dependable capacity is water year 1981.However, the East Side Development is typically operated based on UKL releases to meet IronGate dam downstream flow requirements. The dependable capacity is approximately the same asthe installed capacity of 3.2 MW. The average annual energy production for the East Sidedevelopment is 15,400 MWh (30-year long-term average, May 2003).
Monthly flow-duration curve for flows at Link River dam are presented in Figure B7.3-1.
B7.3.3 Area-Capacity Curve and Rule Curve
No active storage is available in UKL for use by the East Side Development given USBR'scurrent directive operations. Therefore, no area-capacity curves showing gross storage capacityand usable storage capacity are presented.
B7.3.4 Hydraulic Capacity
The estimated hydraulic capacity of the East Side powerhouse is approximately 975 cfs at a netrated head of 47 feet. The minimum flow necessary for operation is 200 cfs.
B7.3.5 Tailwater Rating Curve
The tailwater rating curve is shown in Figure B7.3-2.
B7.3.6 Power Plant Capacity Versus Head Curve
The power plant capacity versus head curve is shown in Figure B7.3-3.
B7.4 WEST SIDE FACILITY OVERVIEW
The West Side facilities consist of a 5,575-foot-long flume below Link River dam, a spillwayand discharge structure, an intake, 140 feet of steel penstock, and a powerhouse located on theright bank of the Link River. Maximum diversion capacity for the West Side canal is 250 cfs.

PacifiCorpKlamath Hydroelectric Project
FERC No. 2082
© February 2004 PacifiCorpExhibit B.doc Exhibit B Page 7-3
The West Side powerhouse contains a single 0.6-MW unit. There are no fish screens at the WestSide canal intakes; however, there is a 5-foot-wide by 16-foot-high trash rack ahead of eachheadgate. A second trash rack, 12 feet high by 18 feet wide, is located at the penstock entrance.
The West Side powerhouse contains a single 0.6-MW unit. There are no fish screens at the WestSide canal intakes; however, there is a trash rack (5 feet wide by 16 feet high) ahead of eachheadgate. A second trash rack (18 feet wide by 12 feet high) is located at the penstock entrance.
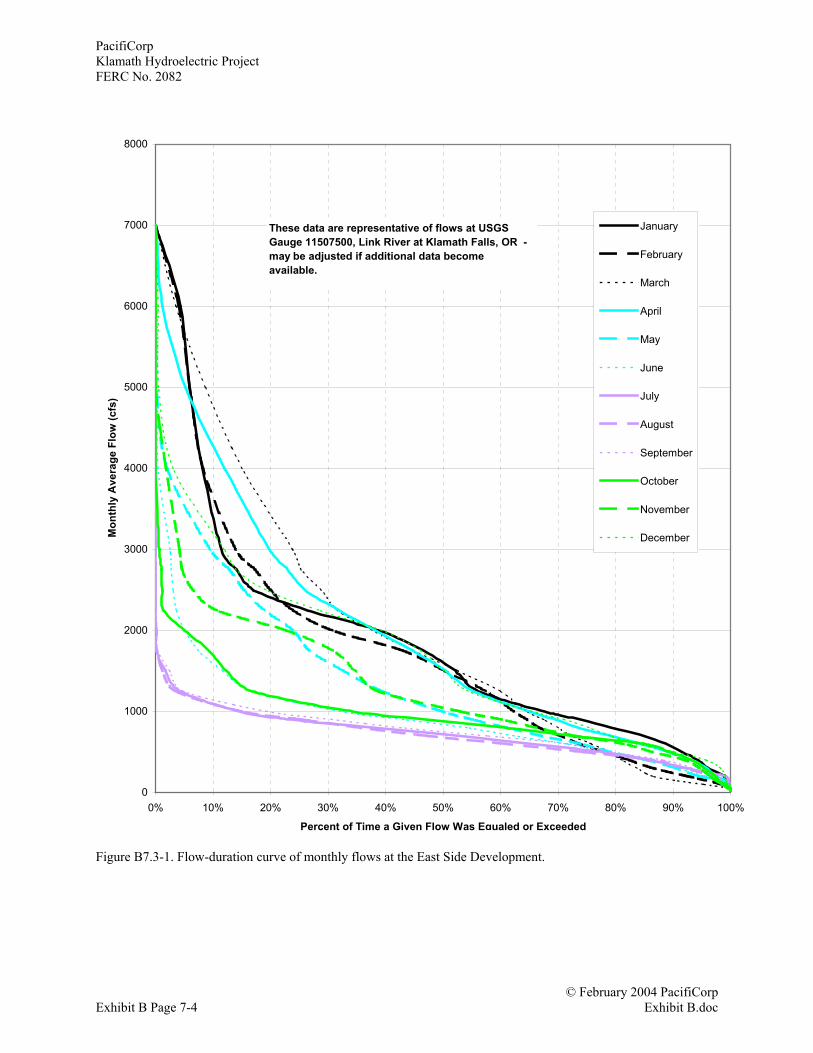
PacifiCorpKlamath Hydroelectric ProjectFERC No. 2082
© February 2004 PacifiCorpExhibit B Page 7-4 Exhibit B.doc
Figure B7.3-1. Flow-duration curve of monthly flows at the East Side Development.
0
1000
2000
3000
4000
5000
6000
7000
8000
0% 10% 20% 30% 40% 50% 60% 70% 80% 90% 100%
Percent of Time a Given Flow Was Equaled or Exceeded
Mon
thly
Ave
rage
Flo
w (c
fs)
January
February
March
April
May
June
July
August
September
October
November
December
These data are representative of flows at USGS Gauge 11507500, Link River at Klamath Falls, OR - may be adjusted if additional data become available.
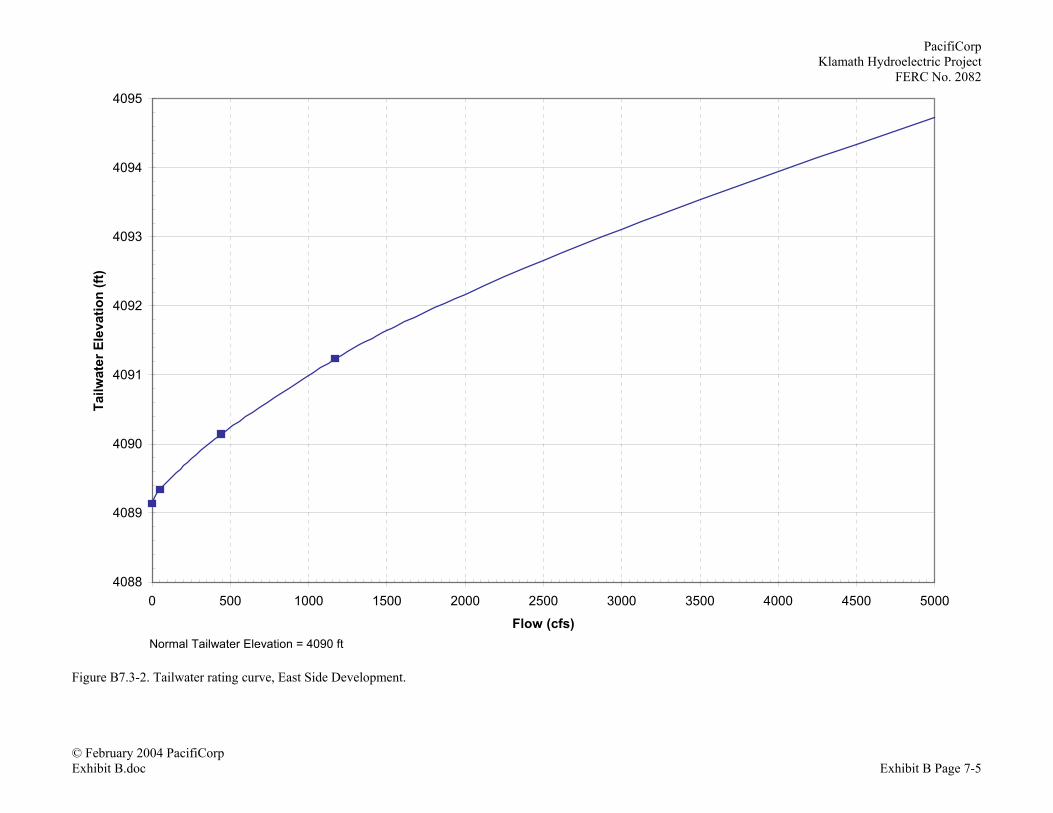
PacifiCorpKlamath Hydroelectric Project
FERC No. 2082
© February 2004 PacifiCorpExhibit B.doc Exhibit B Page 7-5
Figure B7.3-2. Tailwater rating curve, East Side Development.
4088
4089
4090
4091
4092
4093
4094
4095
0 500 1000 1500 2000 2500 3000 3500 4000 4500 5000
Flow (cfs)
Tailw
ater
Ele
vatio
n (ft
)
Normal Tailwater Elevation = 4090 ft

PacifiCorpKlamath Hydroelectric ProjectFERC No. 2082
© February 2004 PacifiCorpExhibit B Page 7-6 Exhibit B.doc
Figure B7.3-3. Turbine generator capability vs. head, East Side Development.
3.00
3.05
3.10
3.15
3.20
3.25
3.30
46.0 46.2 46.4 46.6 46.8 47.0 47.2 47.4 47.6 47.8 48.0
Gross Head (ft)
Net
Tur
bine
-Gen
erat
or C
apab
ility
(MW
)
Gross Head at the Powerhouse = 47 ft
Total Nameplate Generating Capacity = 3.2 MW
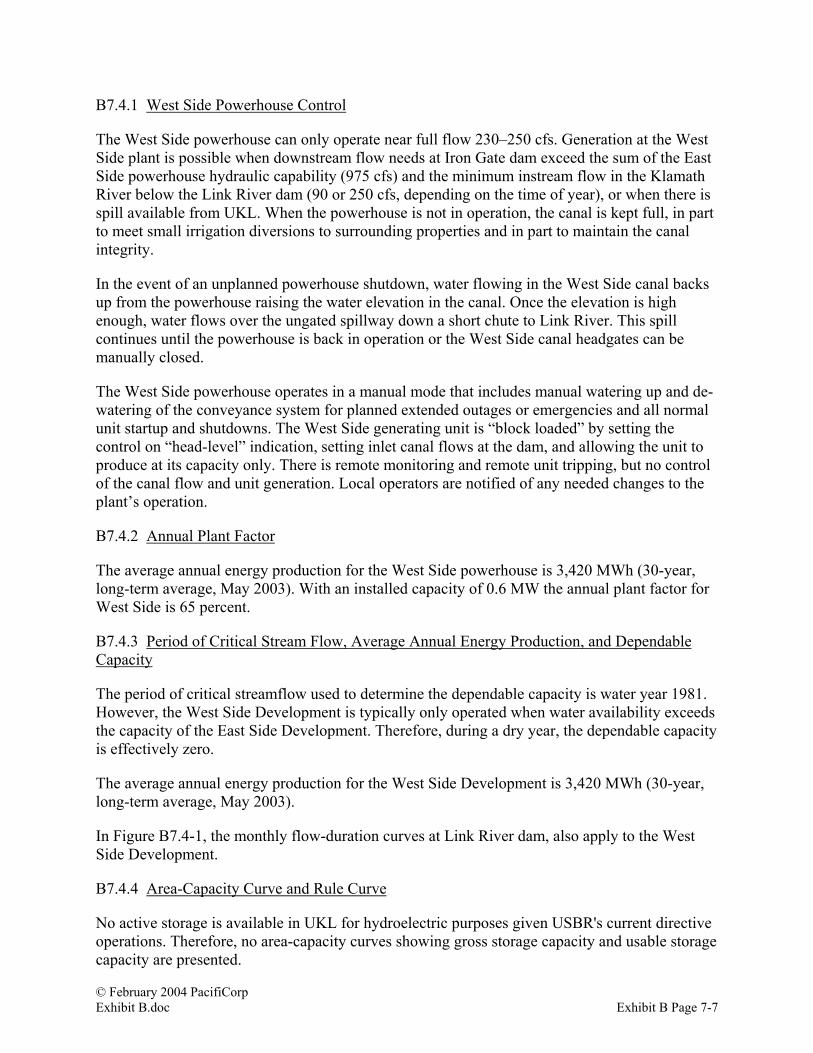
© February 2004 PacifiCorpExhibit B.doc Exhibit B Page 7-7
B7.4.1 West Side Powerhouse Control
The West Side powerhouse can only operate near full flow 230–250 cfs. Generation at the WestSide plant is possible when downstream flow needs at Iron Gate dam exceed the sum of the EastSide powerhouse hydraulic capability (975 cfs) and the minimum instream flow in the KlamathRiver below the Link River dam (90 or 250 cfs, depending on the time of year), or when there isspill available from UKL. When the powerhouse is not in operation, the canal is kept full, in partto meet small irrigation diversions to surrounding properties and in part to maintain the canalintegrity.
In the event of an unplanned powerhouse shutdown, water flowing in the West Side canal backsup from the powerhouse raising the water elevation in the canal. Once the elevation is highenough, water flows over the ungated spillway down a short chute to Link River. This spillcontinues until the powerhouse is back in operation or the West Side canal headgates can bemanually closed.
The West Side powerhouse operates in a manual mode that includes manual watering up and de-watering of the conveyance system for planned extended outages or emergencies and all normalunit startup and shutdowns. The West Side generating unit is “block loaded” by setting thecontrol on “head-level” indication, setting inlet canal flows at the dam, and allowing the unit toproduce at its capacity only. There is remote monitoring and remote unit tripping, but no controlof the canal flow and unit generation. Local operators are notified of any needed changes to theplant’s operation.
B7.4.2 Annual Plant Factor
The average annual energy production for the West Side powerhouse is 3,420 MWh (30-year,long-term average, May 2003). With an installed capacity of 0.6 MW the annual plant factor forWest Side is 65 percent.
B7.4.3 Period of Critical Stream Flow, Average Annual Energy Production, and DependableCapacity
The period of critical streamflow used to determine the dependable capacity is water year 1981.However, the West Side Development is typically only operated when water availability exceedsthe capacity of the East Side Development. Therefore, during a dry year, the dependable capacityis effectively zero.
The average annual energy production for the West Side Development is 3,420 MWh (30-year,long-term average, May 2003).
In Figure B7.4-1, the monthly flow-duration curves at Link River dam, also apply to the WestSide Development.
B7.4.4 Area-Capacity Curve and Rule Curve
No active storage is available in UKL for hydroelectric purposes given USBR's current directiveoperations. Therefore, no area-capacity curves showing gross storage capacity and usable storagecapacity are presented.

PacifiCorpKlamath Hydroelectric ProjectFERC No. 2082
© February 2004 PacifiCorpExhibit B Page 7-8 Exhibit B.doc
Figure B7.4-1. Flow-duration curve of monthly flows at the West Side Development.
0
1000
2000
3000
4000
5000
6000
7000
8000
0% 10% 20% 30% 40% 50% 60% 70% 80% 90% 100%
Percent of Time a Given Flow Was Equaled or Exceeded
Mon
thly
Ave
rage
Flo
w (c
fs)
January
February
March
April
May
June
July
August
September
October
November
December
Period of Record: Water Years 1962 - 2001 (incomplete flow data WY 1966,1967 and 1989)
These data are representative of flows at USGS Gauge 11507500, Link River at Klamath Falls, OR - may be adjusted if additional data become available.

PacifiCorpKlamath Hydroelectric Project
FERC No. 2082
© February 2004 PacifiCorpExhibit B.doc Exhibit B Page 7-9
B7.4.5 Hydraulic Capacity
The estimated hydraulic capacity of the West Side powerhouse is approximately 250 cfs at arated net head of 47 feet.
B7.4.6 Tailwater Rating Curve
The tailwater rating curve is shown in Figure B7.4-2.
B7.4.7 Power Plant Capacity Versus Head Curve
The power plant capacity versus head curve is shown in Figure B7.4-3.
B7.5 EAST SIDE AND WEST SIDE DECOMMISSIONING
As described in Sections A3.6, Proposed Minor Modifications, and C2.5, Proposed Changes, theEast Side and West Side developments are planned to be decommissioned. It is expected thatupon removal of the East Side and West Side developments, the USBR will release flowsthrough the spillgates and fish ladders at Link River dam in a pattern very similar to the existingconditions. The decommissioning will result in the lost of 3.8 MW of capacity and 18,800 MWhsof annual energy.
Decommissioning of the East Side and West Side Developments will have negligible effect onoperation of the downstream developments. The USBR will be responsible for the downstreamreleases at Link River dam in conformance to the requirements of the Klamath Project AnnualOperations Plan. These releases, based on the USBR’s water year type determination asdiscussed in Section B2.1, will be utilized by the downstream developments.
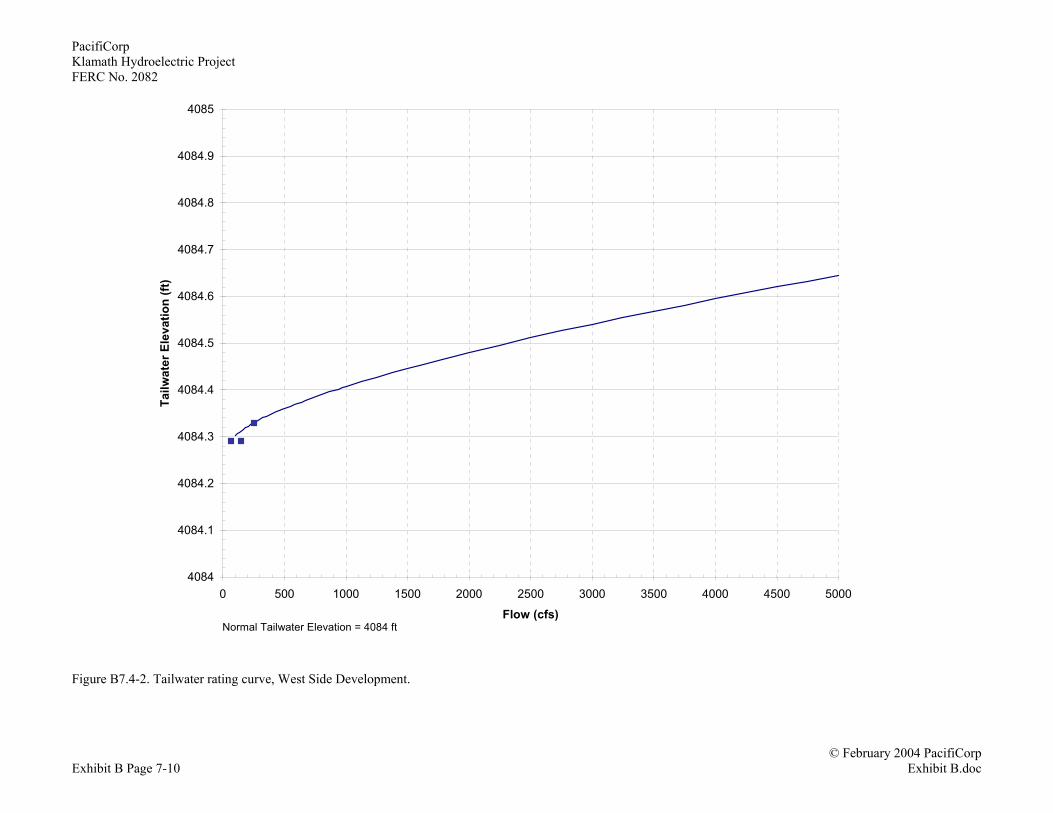
PacifiCorpKlamath Hydroelectric ProjectFERC No. 2082
© February 2004 PacifiCorpExhibit B Page 7-10 Exhibit B.doc
Figure B7.4-2. Tailwater rating curve, West Side Development.
4084
4084.1
4084.2
4084.3
4084.4
4084.5
4084.6
4084.7
4084.8
4084.9
4085
0 500 1000 1500 2000 2500 3000 3500 4000 4500 5000
Flow (cfs)
Tailw
ater
Ele
vatio
n (ft
)
Normal Tailwater Elevation = 4084 ft
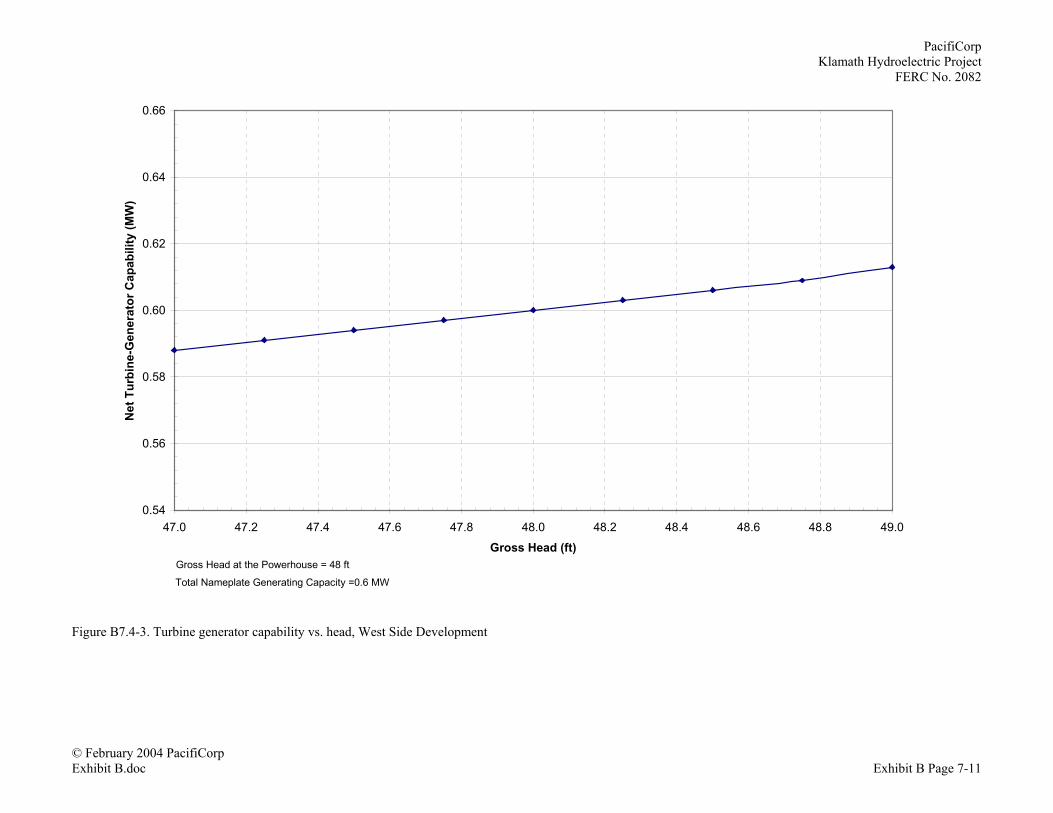
PacifiCorpKlamath Hydroelectric Project
FERC No. 2082
© February 2004 PacifiCorpExhibit B.doc Exhibit B Page 7-11
Figure B7.4-3. Turbine generator capability vs. head, West Side Development
0.54
0.56
0.58
0.60
0.62
0.64
0.66
47.0 47.2 47.4 47.6 47.8 48.0 48.2 48.4 48.6 48.8 49.0
Gross Head (ft)
Net
Tur
bine
-Gen
erat
or C
apab
ility
(MW
)
Gross Head at the Powerhouse = 48 ft
Total Nameplate Generating Capacity =0.6 MW

© February 2004 PacifiCorpExhibit B.doc Exhibit B Page 8-1
B8.0 KENO DEVELOPMENT
B8.1 INTRODUCTION
For the existing Project, PacifiCorp operates Keno dam in accordance to contracts with USBRand local irrigators. The Project does not receive substantial benefit from Keno dam. As such,Keno dam will not be included in the proposed Project. Future operations will be consistent withcurrent operations.
B8.2 DEVELOPMENT OVERVIEW
Keno dam is a re-regulating facility located at approximately RM 233, which is approximately21 miles downstream of Link River dam (Figure B1.1-1). There is no power generatingcapability at this facility. The concrete dam has a height of 25 feet and a spillway sectionconsisting of six 40-foot-wide spill gates. The impoundment upstream of the dam has a surfacearea of 2,475 acres and a total storage capacity of 18,500 acre-feet. There is a weir and orifice-type fish ladder at the Keno dam.
B8.3 OWNERSHIP AND CONTRACTUAL OBLIGATIONS
On January 3, 1968, Pacific Power & Light Company (formerly Copco, now PacifiCorp) andUSBR entered into a contract to operate Keno dam (Appendix B-8A). This contract was inresponse to the FERC license article No. 55 “The licensee shall enter into formal agreement withthe United States Bureau of Reclamation for the purpose of regulating the level of Lake Ewaunaand the Klamath River between Keno dam and Lake Ewauna, and in the event that the Licenseeand the Bureau fail to reach an agreement, the Commission will prescribe the terms of suchregulation after notice and opportunity for hearing” (FPC 1956).
The 1968 contract requires PacifiCorp to maintain Keno reservoir at elevations between 4085.0and 4086.5 feet whenever USBR is diverting water to the USBR Project. From the upper boundsto the lower bounds of these elevations is the equivalent of 18,500 acre-feet. The 1968 contractalso requires PacifiCorp to take certain steps to facilitate the return of used irrigation water intothe river at the Klamath Straits Drain (up to 300 cfs) and the Lost River diversion channel (up to3,000 cfs).
Operation in this manner requires close coordination between USBR and PacifiCorp on anyissues where one party’s operation of its project facilities might impact the other party. Thiscoordination is particularly difficult and important in the spring when run-off can be naturallyhigh and irrigators are pumping a large volume of water from their fields into Keno reservoir inpreparation for the growing season. The 1968 Keno contract expires in 2006 coincidentally withPacifiCorp’s current FERC license. Aside from the contract with USBR and at the request ofirrigators with pumps on Keno reservoir, PacifiCorp maintains Keno reservoir at elevation4085.4 ± 0.1 feet from October 1 to May 15 and 4085.5 ± 0.1 feet from May 16 to September 30so that lake elevations are suited to irrigation pump depths. These elevations also allow forgravity flow from Keno reservoir onto the ODFW Miller Island Wildlife Refuge.

PacifiCorpKlamath Hydroelectric ProjectFERC No. 2082
© February 2004 PacifiCorpExhibit B Page 8-2 Exhibit B.doc
B8.4 OPERATIONS
Keno dam is a re-regulating facility for the varying flows in and out of the Klamath Riverbetween Link River and Keno dam. In as much as possible, Keno dam is operated to maintain asteady reservoir elevation through all river flows and water year types, while continuing toprovide enough water to meet flow requirements at Iron Gate dam. The steady reservoirelevation allows both the USBR and local irrigators to manage irrigation water. In operatingKeno dam, PacifiCorp can more effectively schedule and plan load following operations at theJ.C. Boyle powerhouse. Operating the reservoir in a re-regulating mode can result in riverfluctuations below the dam, especially during high flow conditions.
Flows from the USBR Project enter PacifiCorp’s Project in Keno reservoir via the KlamathStraits Drain and Lost River diversion channel. These return flows can be highly variable andcan be somewhat problematic for stable reservoir elevations. Flows from the USBR Project canvary approximately 775 cfs, each 200 cfs has the ability to affect the reservoir elevationapproximately 0.2 feet in a 24-hour period. Hence, control of flows from the East SideDevelopment and flow through Keno dam are crucial to maintain a constant elevation in Kenoreservoir. In order to achieve a reservoir fluctuation within ± 0.1 feet, PacifiCorp and USBRcoordinate and/or communicate their operations on a daily basis during periods of high flowfluctuation.
Given the need to maintain a fixed Keno reservoir water surface elevation, inflows must bematched by the outflows. It follows that flows through Keno dam largely mimic those into Kenoreservoir, namely releases from UKL plus the net USBR canal flows into Keno reservoir. Thespill gates at Link River dam are operated to assure tight control on minimum flow but not allgates can be remotely controlled to respond to flow changes. Similarly, the West Sidepowerhouse is manually placed on- or off-line and thus cannot easily respond to change. Finally,the hydraulic capacity at the East Side powerhouse limits river flow adjustments to 1,200 cfsuntil gate positions at the dam can be reconfigured by field personnel. For example, if flowreleases exceed the East Side turbine flow capacity, operators manually open the spillgates toprovide a range of operating levels that allow further adjustment to the plant’s power generation.Along with operations at the Link River facilities, spill gate adjustments at Keno dam can beused to help maintain a constant elevation in Keno reservoir. A result of such operations is thatthe river below Keno may fluctuate to keep Keno reservoir elevation constant. (See the nextparagraph and Table B8.3-1 for a further description of the magnitude and frequency of thesechanges.) Minimum flow below Keno dam is 200 cfs, although flows rarely, if ever, get this lowexcept in drought years (e.g., flows approached 150 cfs in 1992, a drought year). If flow isexpected to be less than 250 cfs, PacifiCorp must contact ODFW.
There is no required FERC ramp rate below Keno dam. However, consistent with flowmanagement at J.C. Boyle, PacifiCorp manages flow changes to no more than a 500 cfs per hourramp rate or 9 inches per hour when not in high flow situations. Table B8.3-1 is a summary ofhourly flows at Keno dam and the frequency of hourly changes for various change amounts.Average flow ranges from 700 cfs in July up to 3,600 cfs in March. Large hourly flow changesmostly occur in January through May. The effects of these hourly changes on river stage aresummarized in the second column.

PacifiCorpKlamath Hydroelectric Project
FERC No. 2082
© February 2004 PacifiCorpExhibit B.doc Exhibit B Page 8-3
Table B8.3-1. Flows below Keno dam and frequency/magnitude of flow changes; WY 1995-2001 (throughSeptember 30, 2001) (USGS Gauge No.11509500).
Month
AverageHourlyStage
Change (ft)
AverageHourlyFlow(cfs)
AverageHourlyChange
(cfs)
Avg. # ofHourly
Changesper Month(100-150
cfs)
Avg. # ofHourly
Changesper Month(151-250
cfs)
Avg. # ofHourly
Changesper Month(251-350
cfs)
Avg. # ofHourly
Changesper Month(351-500
cfs)
Avg. # of >500 cfsHourly
Changesper Month
January 0.016 2,935 27 17 15 7 6 6February 0.013 3,586 29 17 16 5 7 5March 0.045 3,606 24 12 12 5 7 5April 0.017 2,791 22 8 10 6 5 6May 0.014 2,570 17 9 11 7 5 2June 0.007 1,370 8 3 5 2 1 0July 0.022 705 5 7 3 4 1 1August 0.008 788 5 5 6 2 1 0September 0.011 984 6 7 4 1 1 0October 0.013 1,076 6 3 3 2 2 1November 0.024 1,165 5 4 4 1 2 1December 0.008 1,533 9 8 7 4 1 1TotalAverage
0.02 1,976 14 93 94 45 38 28
The elevation of Keno reservoir is tightly constrained between 4085.4 ± 0.1 feet October 1through May 15 and 4085.4 ± 0.1 feet from May 16 through September 30. Diversions from theUSBR Project can vary by greater than 1,000 cfs over a 24-hour period. Spill changes at LinkRiver dam and/or generation adjustments at the East Side powerhouse must balance thesechanges. Tables B8.3-2 and B8.3-3 summarize the absolute value of average and maximum dailychanges at the USBR diversions by month.
Table B8.3-2. Average 24-hour Klamath Straights Drain change (cfs) for 1995-2001 (through September 30, 2001).
Month 1995 1996 1997 1998 1999 2000 2001*
January 173 75 263 176 93 128 50February 112 314 189 87 156 84 42March 290 99 38 165 256 81 56April 70 53 47 207 149 82 34May 59 72 74 204 61 88 12June 73 58 67 193 113 74 0July 62 56 58 87 105 78 0August 44 63 105 75 92 67 23September 38 65 62 63 58 132 14October 62 57 46 49 64 49 NA

PacifiCorpKlamath Hydroelectric ProjectFERC No. 2082
© February 2004 PacifiCorpExhibit B Page 8-4 Exhibit B.doc
Table B8.3-2. Average 24-hour Klamath Straights Drain change (cfs) for 1995-2001 (through September 30, 2001).
Month 1995 1996 1997 1998 1999 2000 2001*
November 37 55 78 87 40 44 NADecember 93 81 56 109 50 52 NA
*2001 was a drought year and irrigation supplies via the A-Canal were terminated through the summer.NA = Not available at the time this table was prepared.
Table B8.3-3. Maximum 24-hour Klamath Straights Drain change (cfs) for 1995-2001 (through September 30, 2001).
Month 1995 1996 1997 1998 1999 2000 2001*
January 1,106 463 1,079 1,049 349 799 137February 681 1,273 1,051 407 483 330 123March 1,756 495 114 619 924 512 158April 298 176 149 851 660 277 121May 261 288 254 765 253 263 29June 224 158 193 1,132 557 169 0July 231 216 261 265 568 281 0August 127 178 280 264 228 169 104September 91 192 188 281 165 688 67October 296 335 129 153 178 376 NANovember 165 184 353 374 100 141 NADecember 492 458 226 447 225 222 NA
*2001 was a drought year and irrigation supplies via the A-Canal were terminated through the summer.NA = Not available at the time this table was prepared.
Without Keno dam, the flows in this reach of the Klamath River would fluctuate in directproportion to the current USBR diversions in and out of the reservoir.
Flows are released at Keno dam via three routes: the fish ladder, a 36-inch-diameter sluiceconduit, and the six spill gates. With the exception of critically dry periods, flow is typicallyreleased from all three points. During times when the release flow approaches 200 cfs, the spillgates are closed and flow releases are via the sluice conduit (130 cfs capacity) and the fish ladder(70 cfs capacity). A USGS gauge (No. 11509500) approximately one mile downstream of theKeno dam monitors river flows every few minutes. Table B8.3-4 identifies flow and ramp rateguidelines for releases at Keno.
Table B8.3-4. Keno minimum instream flow and ramp rate directives.
River ReachLength of Reach
(River Miles) Minimum Instream Flow Ramp Rate
Below Keno dam 5 200 cfs (as per agreementwith ODFW, notify whenflow will be less than 250cfs)
500 cfs or 9 inches per hour during summer(self, imposed, nonregulatory ramp rate)

PacifiCorpKlamath Hydroelectric Project
FERC No. 2082
© February 2004 PacifiCorpExhibit B.doc Exhibit B Page 8-5
B8.4.1 Description of Plant Control
Keno dam is automated to provide flow regulation facility. It maintains a relatively constantreservoir level (within a 0.5-foot range). The gate opening, gate closing, control and monitoringcan be provided remotely without local personnel present or involved. This is provided 24 hoursper day, seven days a week. Local crews provide checks of the facilities and manually adjust gateposition to coincide with telemetry values on an as-needed basis. During high runoff periodswhen spill releases exceed the capacity of the controlled gates, the field crew adjusts the locallycontrolled gates and provides a new operating range for the auto-remote controlled gates.
B8.4.2 Keno Drawdown
At the request of USBR and irrigators with pumps located around Keno reservoir, PacifiCorpvoluntarily draws down the reservoir approximately 2 feet every 1 or 2 years in the early spring(April or May) for 2 to 3 days. This is done to let irrigators clean out their water intakes andmaintain the pumps before the irrigation season begins. The drawdown affects Project operationsfor approximately a week.


© February 2004 PacifiCorpExhibit B.doc Exhibit B Page 9-1
B9.0 J.C. BOYLE DEVELOPMENT
B9.1 DEVELOPMENT OVERVIEW
The J.C. Boyle Development consists of a reservoir, dam, power canal, and powerhouse on theKlamath River between approximately RM 228 and 220 (Figure B1.1-1). The dam is an earth-filled dam 68 feet tall impounding a narrow reservoir of 420 surface acres (J.C. Boyle reservoir).The impoundment formed upstream of the dam contains approximately 3,495 acre-feet of totalstorage capacity and 1,724 acre-feet of active storage capacity.
The dam has a spillway with three spill gates and can divert up to 14,850 cfs at El. 3,792 feetmsl. The rated hydraulic capacity of the powerhouse is 2,850 cfs. The intake from the dam to thepower canal is screened. A fish ladder at the dam provides for upstream fish passage.
Water diverted at the dam enters a 617-foot-long steel flowline that empties into a canal. Flowinto the canal can be controlled by an automated headgate. The canal extends just over 2 milesalong the river canyon. At the downstream end of the canal is a small forebay where twoautomated spillgates direct overflows to a short spillway and into the bypass reach. Waterflowing to the powerhouse goes through a trash rack before entering a tunnel. The water thenflows into two steel penstocks, each serving a separate 40-MW unit. The powerhouse is locatedapproximately 4.3 RM downstream of the dam.
B9.2 OWNERSHIP AND CONTRACTUAL OBLIGATION
PacifiCorp owns and operates the J.C. Boyle Development and has no direct contractualobligations with USBR regarding its operation. The J.C. Boyle facility, however, is operated in amanner to assure conformity with NOAA Fisheries 2002 BO flows downstream of Iron Gatedam.
B9.3 OPERATIONS
The J.C. Boyle powerhouse is typically operated as a power peaking facility, especially whenriver flows are less than maximum turbine hydraulic capacity 3,000 cfs. Due to turbineefficiencies, the preferred flow is 2,500 cfs and is typically the maximum used at the plant.Power generation (and hence flow through the powerhouse) is shaped to coincide with peakcustomer electricity demand. During the summer months, peak demand typically occurs onweekdays in the afternoons and early evenings. In general, on a daily basis, water storage occursin the J.C. Boyle reservoir at night when generation is not occurring. Given the required up-ramprate for the J.C. Boyle powerhouse (9 inches per hour), generation must begin well in advance ofpeak electric load requirements so that the units are at full generation capacity for the peakdemand period. The reservoir usually begins to fill sometime after dark, is full by early morning,and begins to be drawn down again during the daylight hours. Specific periods of releases mayvary widely depending on the anticipated time of peak demand, downstream flow requirements,and climatic conditions.
The J.C. Boyle bypass reach (i.e., the reach immediately downstream of the dam and upstream ofthe powerhouse) has a current FERC minimum flow requirement of 100 cfs (Table B9.3-1). Thisflow is comprised of approximately (a) 80 cfs from the fish ladder, (b) 20 cfs from the juvenilebypass system, and (c) any seepage from the dam. Flow through the fish ladder is regulated by a
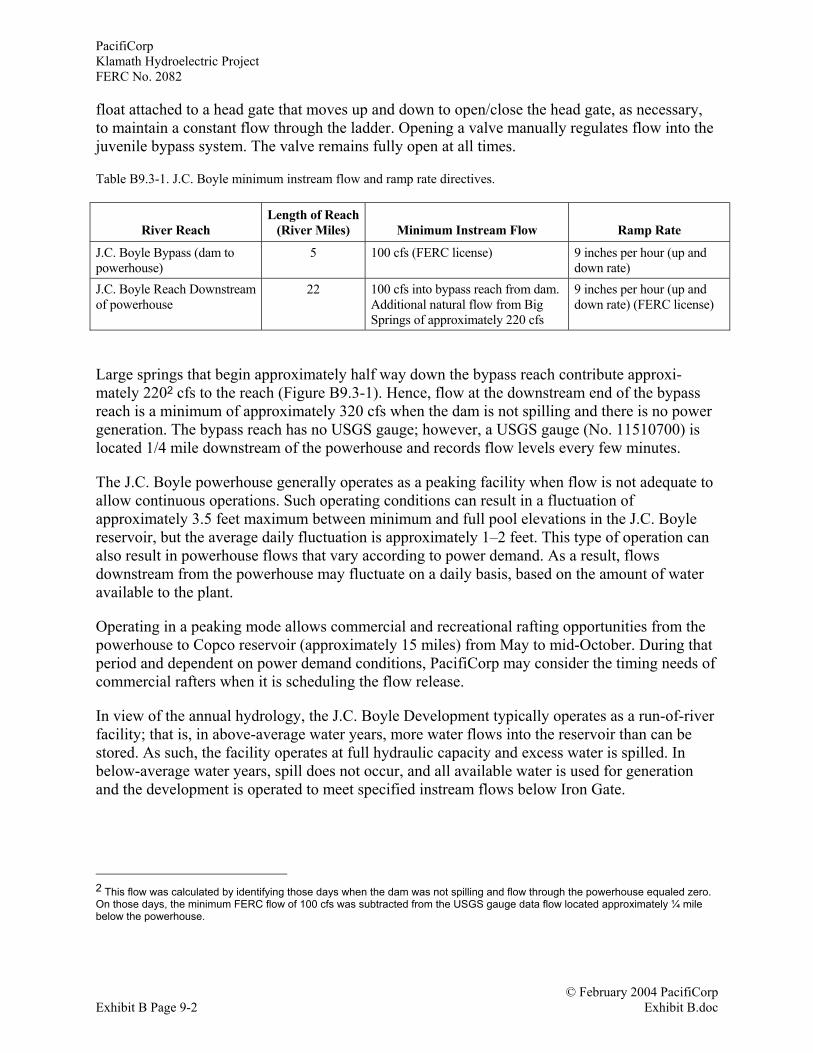
PacifiCorpKlamath Hydroelectric ProjectFERC No. 2082
© February 2004 PacifiCorpExhibit B Page 9-2 Exhibit B.doc
float attached to a head gate that moves up and down to open/close the head gate, as necessary,to maintain a constant flow through the ladder. Opening a valve manually regulates flow into thejuvenile bypass system. The valve remains fully open at all times.
Table B9.3-1. J.C. Boyle minimum instream flow and ramp rate directives.
River ReachLength of Reach
(River Miles) Minimum Instream Flow Ramp Rate
J.C. Boyle Bypass (dam topowerhouse)
5 100 cfs (FERC license) 9 inches per hour (up anddown rate)
J.C. Boyle Reach Downstreamof powerhouse
22 100 cfs into bypass reach from dam.Additional natural flow from BigSprings of approximately 220 cfs
9 inches per hour (up anddown rate) (FERC license)
Large springs that begin approximately half way down the bypass reach contribute approxi-mately 2202 cfs to the reach (Figure B9.3-1). Hence, flow at the downstream end of the bypassreach is a minimum of approximately 320 cfs when the dam is not spilling and there is no powergeneration. The bypass reach has no USGS gauge; however, a USGS gauge (No. 11510700) islocated 1/4 mile downstream of the powerhouse and records flow levels every few minutes.
The J.C. Boyle powerhouse generally operates as a peaking facility when flow is not adequate toallow continuous operations. Such operating conditions can result in a fluctuation ofapproximately 3.5 feet maximum between minimum and full pool elevations in the J.C. Boylereservoir, but the average daily fluctuation is approximately 1–2 feet. This type of operation canalso result in powerhouse flows that vary according to power demand. As a result, flowsdownstream from the powerhouse may fluctuate on a daily basis, based on the amount of wateravailable to the plant.
Operating in a peaking mode allows commercial and recreational rafting opportunities from thepowerhouse to Copco reservoir (approximately 15 miles) from May to mid-October. During thatperiod and dependent on power demand conditions, PacifiCorp may consider the timing needs ofcommercial rafters when it is scheduling the flow release.
In view of the annual hydrology, the J.C. Boyle Development typically operates as a run-of-riverfacility; that is, in above-average water years, more water flows into the reservoir than can bestored. As such, the facility operates at full hydraulic capacity and excess water is spilled. Inbelow-average water years, spill does not occur, and all available water is used for generationand the development is operated to meet specified instream flows below Iron Gate.
2 This flow was calculated by identifying those days when the dam was not spilling and flow through the powerhouse equaled zero.On those days, the minimum FERC flow of 100 cfs was subtracted from the USGS gauge data flow located approximately ¼ milebelow the powerhouse.

PacifiCorpKlamath Hydroelectric Project
FERC No. 2082
© February 2004 PacifiCorpExhibit B.doc Exhibit B Page 9-3
Figure B9.3-1. J.C. Boyle spring accretion contribution.
150
170
190
210
230
250
270
290
11-Jun-91
28-Dec-91
15-Jul-92
31-Jan-93
19-Aug-93
07-Mar-94
23-Sep-94
11-Apr-95
28-Oct-95
15-May-96
01-Dec-96
19-Jun-97
05-Jan-98
24-Jul-98
09-Feb-99
28-Aug-99
15-Mar-00
Date
Flow
Con
trib
utio
n (c
fs)
n=165min=202max=269
mean=220
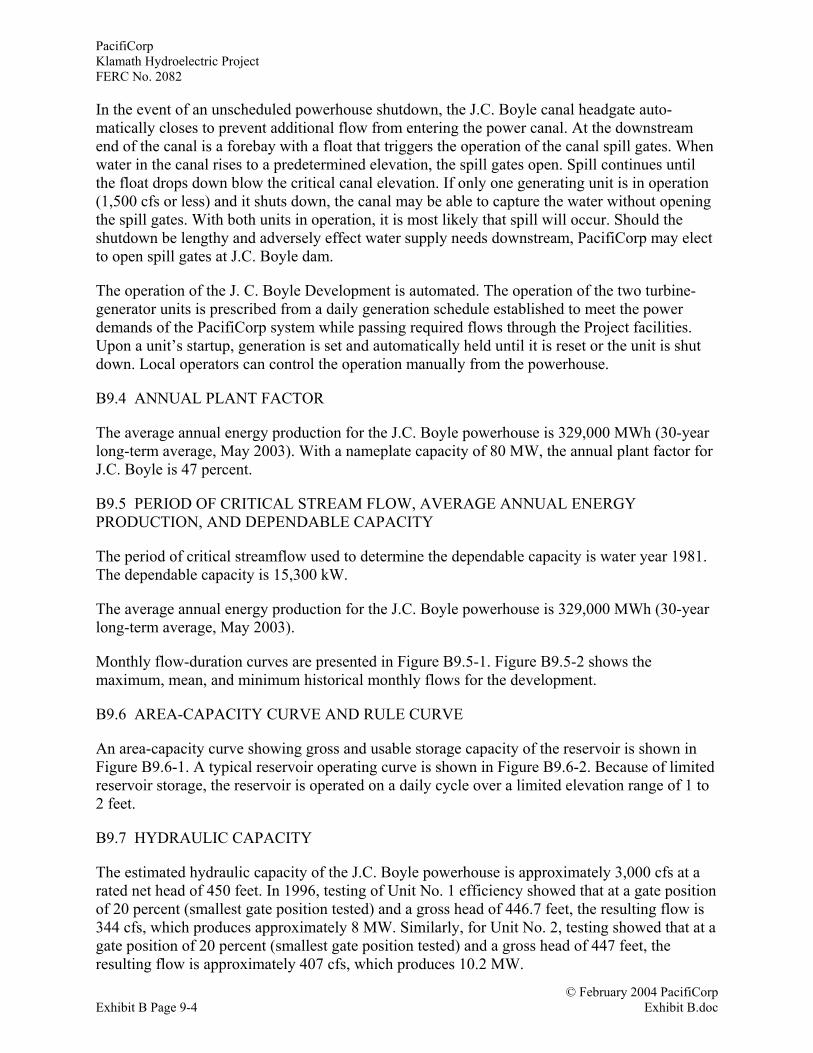
PacifiCorpKlamath Hydroelectric ProjectFERC No. 2082
© February 2004 PacifiCorpExhibit B Page 9-4 Exhibit B.doc
In the event of an unscheduled powerhouse shutdown, the J.C. Boyle canal headgate auto-matically closes to prevent additional flow from entering the power canal. At the downstreamend of the canal is a forebay with a float that triggers the operation of the canal spill gates. Whenwater in the canal rises to a predetermined elevation, the spill gates open. Spill continues untilthe float drops down blow the critical canal elevation. If only one generating unit is in operation(1,500 cfs or less) and it shuts down, the canal may be able to capture the water without openingthe spill gates. With both units in operation, it is most likely that spill will occur. Should theshutdown be lengthy and adversely effect water supply needs downstream, PacifiCorp may electto open spill gates at J.C. Boyle dam.
The operation of the J. C. Boyle Development is automated. The operation of the two turbine-generator units is prescribed from a daily generation schedule established to meet the powerdemands of the PacifiCorp system while passing required flows through the Project facilities.Upon a unit’s startup, generation is set and automatically held until it is reset or the unit is shutdown. Local operators can control the operation manually from the powerhouse.
B9.4 ANNUAL PLANT FACTOR
The average annual energy production for the J.C. Boyle powerhouse is 329,000 MWh (30-yearlong-term average, May 2003). With a nameplate capacity of 80 MW, the annual plant factor forJ.C. Boyle is 47 percent.
B9.5 PERIOD OF CRITICAL STREAM FLOW, AVERAGE ANNUAL ENERGYPRODUCTION, AND DEPENDABLE CAPACITY
The period of critical streamflow used to determine the dependable capacity is water year 1981.The dependable capacity is 15,300 kW.
The average annual energy production for the J.C. Boyle powerhouse is 329,000 MWh (30-yearlong-term average, May 2003).
Monthly flow-duration curves are presented in Figure B9.5-1. Figure B9.5-2 shows themaximum, mean, and minimum historical monthly flows for the development.
B9.6 AREA-CAPACITY CURVE AND RULE CURVE
An area-capacity curve showing gross and usable storage capacity of the reservoir is shown inFigure B9.6-1. A typical reservoir operating curve is shown in Figure B9.6-2. Because of limitedreservoir storage, the reservoir is operated on a daily cycle over a limited elevation range of 1 to2 feet.
B9.7 HYDRAULIC CAPACITY
The estimated hydraulic capacity of the J.C. Boyle powerhouse is approximately 3,000 cfs at arated net head of 450 feet. In 1996, testing of Unit No. 1 efficiency showed that at a gate positionof 20 percent (smallest gate position tested) and a gross head of 446.7 feet, the resulting flow is344 cfs, which produces approximately 8 MW. Similarly, for Unit No. 2, testing showed that at agate position of 20 percent (smallest gate position tested) and a gross head of 447 feet, theresulting flow is approximately 407 cfs, which produces 10.2 MW.
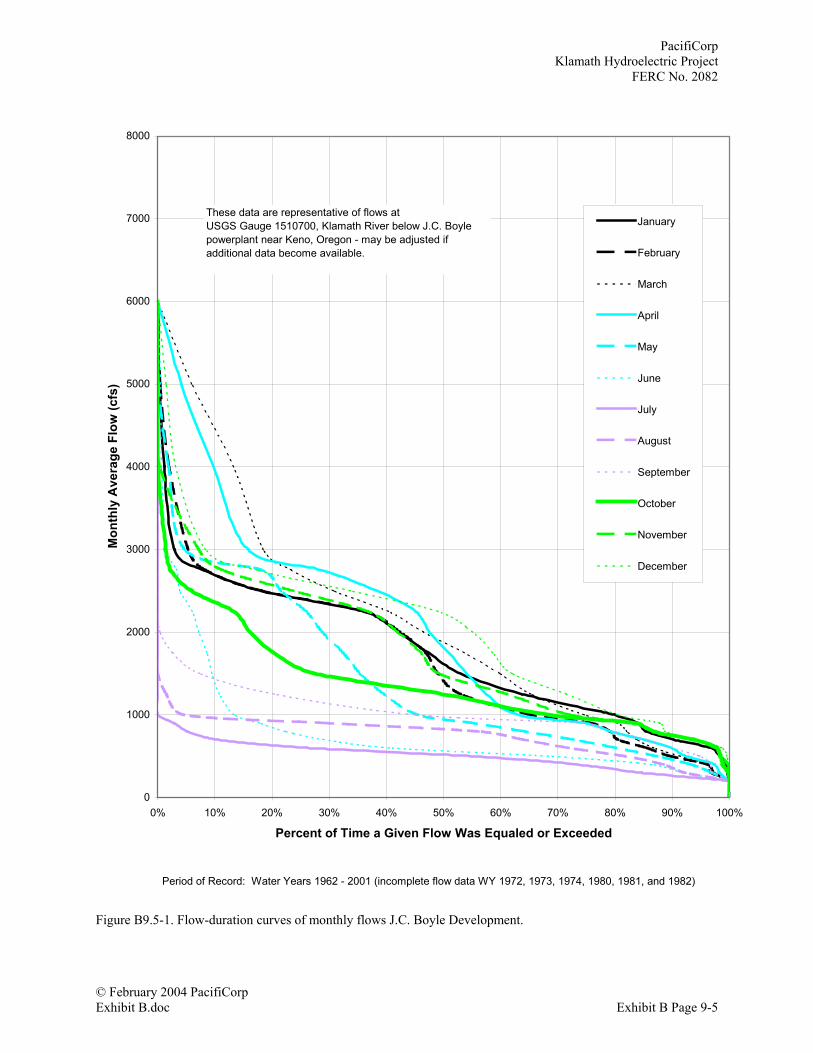
PacifiCorpKlamath Hydroelectric Project
FERC No. 2082
© February 2004 PacifiCorpExhibit B.doc Exhibit B Page 9-5
Figure B9.5-1. Flow-duration curves of monthly flows J.C. Boyle Development.
0
1000
2000
3000
4000
5000
6000
7000
8000
0% 10% 20% 30% 40% 50% 60% 70% 80% 90% 100%
Percent of Time a Given Flow Was Equaled or Exceeded
Mon
thly
Ave
rage
Flo
w (c
fs)
January
February
March
April
May
June
July
August
September
October
November
December
These data are representative of flows atUSGS Gauge 1510700, Klamath River below J.C. Boyle powerplant near Keno, Oregon - may be adjusted if additional data become available.
Period of Record: Water Years 1962 - 2001 (incomplete flow data WY 1972, 1973, 1974, 1980, 1981, and 1982)
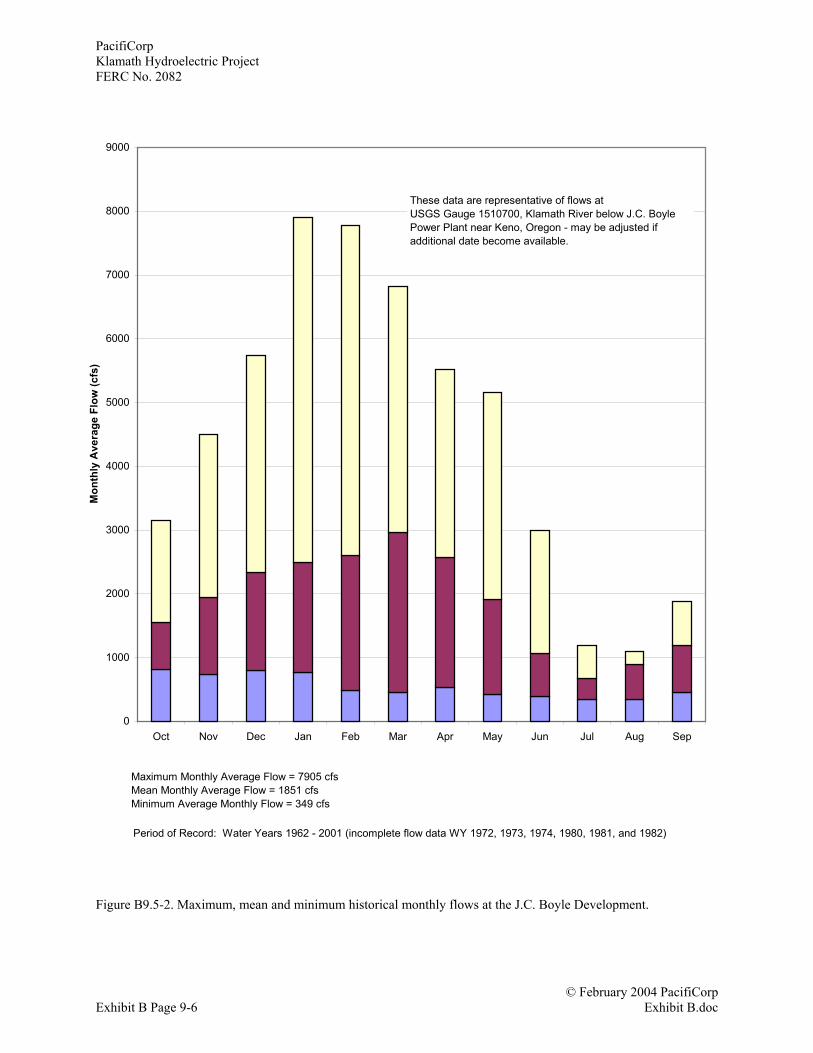
PacifiCorpKlamath Hydroelectric ProjectFERC No. 2082
© February 2004 PacifiCorpExhibit B Page 9-6 Exhibit B.doc
Figure B9.5-2. Maximum, mean and minimum historical monthly flows at the J.C. Boyle Development.
0
1000
2000
3000
4000
5000
6000
7000
8000
9000
Oct Nov Dec Jan Feb Mar Apr May Jun Jul Aug Sep
Mon
thly
Ave
rage
Flo
w (c
fs)
These data are representative of flows atUSGS Gauge 1510700, Klamath River below J.C. Boyle Power Plant near Keno, Oregon - may be adjusted if additional date become available.
Maximum Monthly Average Flow = 7905 cfsMean Monthly Average Flow = 1851 cfsMinimum Average Monthly Flow = 349 cfs
Period of Record: Water Years 1962 - 2001 (incomplete flow data WY 1972, 1973, 1974, 1980, 1981, and 1982)
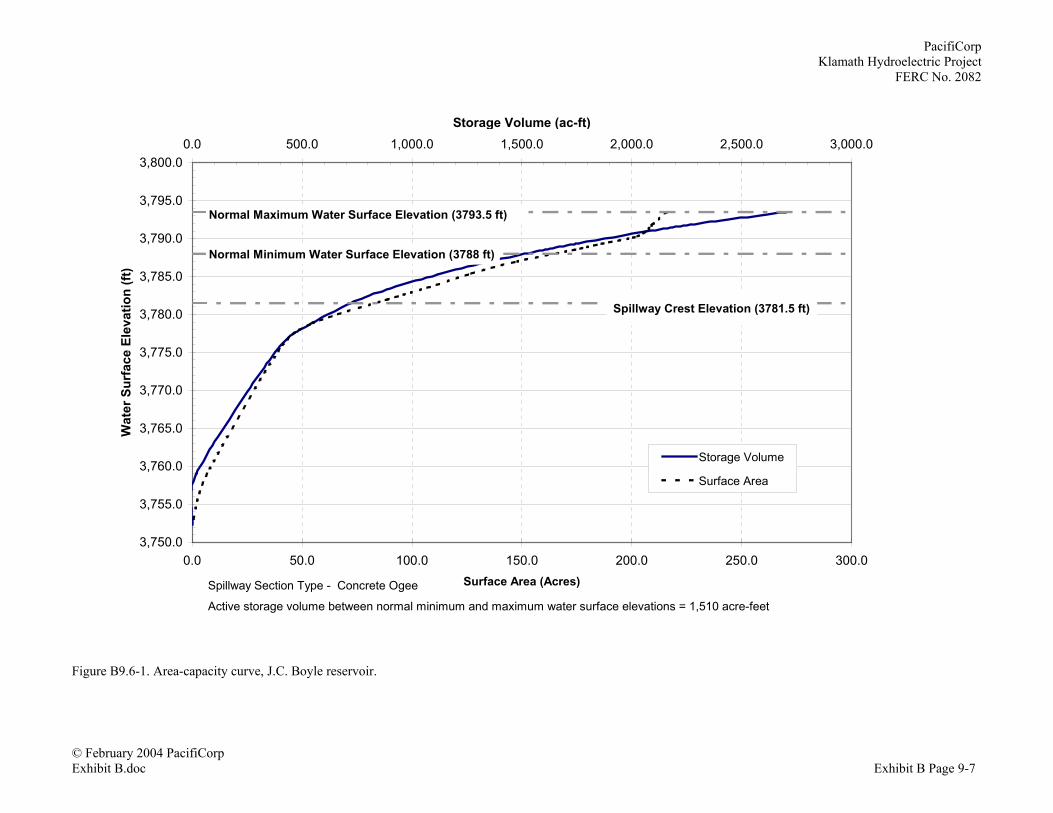
PacifiCorpKlamath Hydroelectric Project
FERC No. 2082
© February 2004 PacifiCorpExhibit B.doc Exhibit B Page 9-7
Figure B9.6-1. Area-capacity curve, J.C. Boyle reservoir.
3,750.0
3,755.0
3,760.0
3,765.0
3,770.0
3,775.0
3,780.0
3,785.0
3,790.0
3,795.0
3,800.00.0 500.0 1,000.0 1,500.0 2,000.0 2,500.0 3,000.0
Storage Volume (ac-ft) W
ater
Sur
face
Ele
vatio
n (ft
)
0.0 50.0 100.0 150.0 200.0 250.0 300.0Surface Area (Acres)
Storage Volume
Surface Area
Spillway Section Type - Concrete Ogee
Active storage volume between normal minimum and maximum water surface elevations = 1,510 acre-feet
Normal Minimum Water Surface Elevation (3788 ft)
Normal Maximum Water Surface Elevation (3793.5 ft)
Spillway Crest Elevation (3781.5 ft)

PacifiCorpKlamath Hydroelectric ProjectFERC No. 2082
© February 2004 PacifiCorpExhibit B Page 9-8 Exhibit B.doc
Figure B9.6-2. J.C. Boyle reservoir typical hourly reservoir elevations.
3,789.0
3,789.5
3,790.0
3,790.5
3,791.0
3,791.5
3,792.0
3,792.5
3,793.0
06-Aug 09-Aug 12-Aug 15-Aug 18-Aug 21-Aug 24-Aug 27-Aug 30-AugTypical Summertime Weekly Operation
Elev
atio
n (ft
, msl
)
Note: Summertime headwater variability will be greater than in the winter, particularly when spilling.
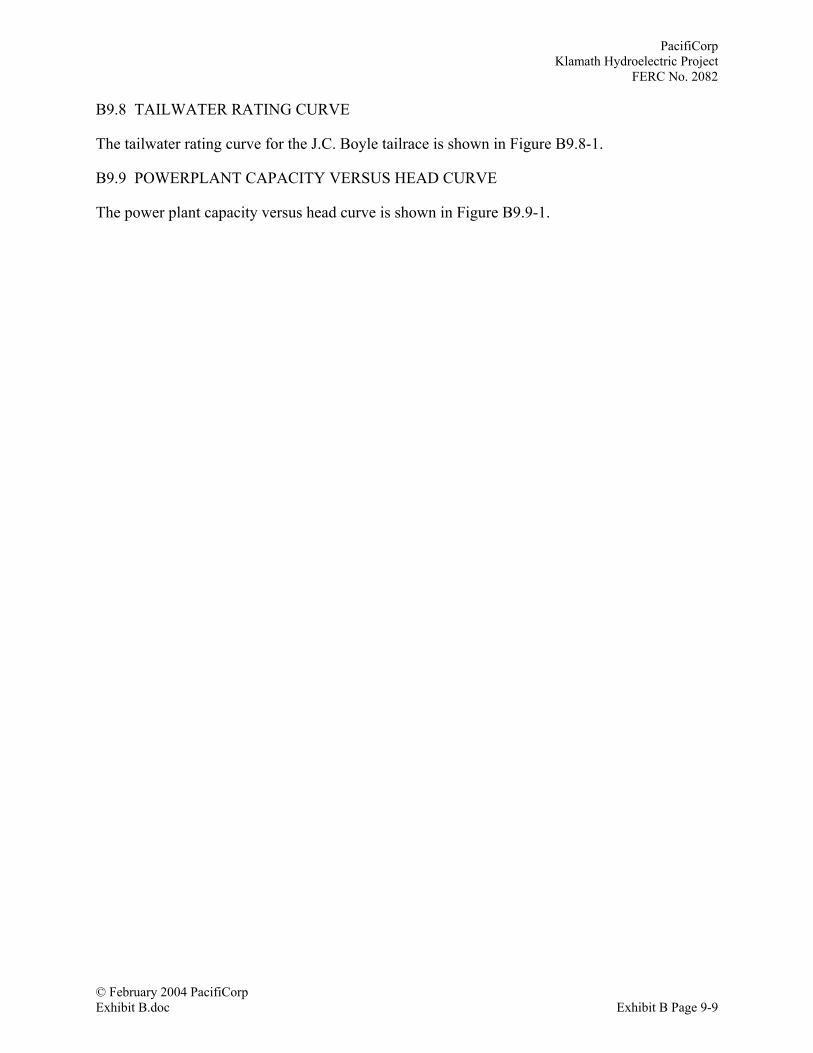
PacifiCorpKlamath Hydroelectric Project
FERC No. 2082
© February 2004 PacifiCorpExhibit B.doc Exhibit B Page 9-9
B9.8 TAILWATER RATING CURVE
The tailwater rating curve for the J.C. Boyle tailrace is shown in Figure B9.8-1.
B9.9 POWERPLANT CAPACITY VERSUS HEAD CURVE
The power plant capacity versus head curve is shown in Figure B9.9-1.
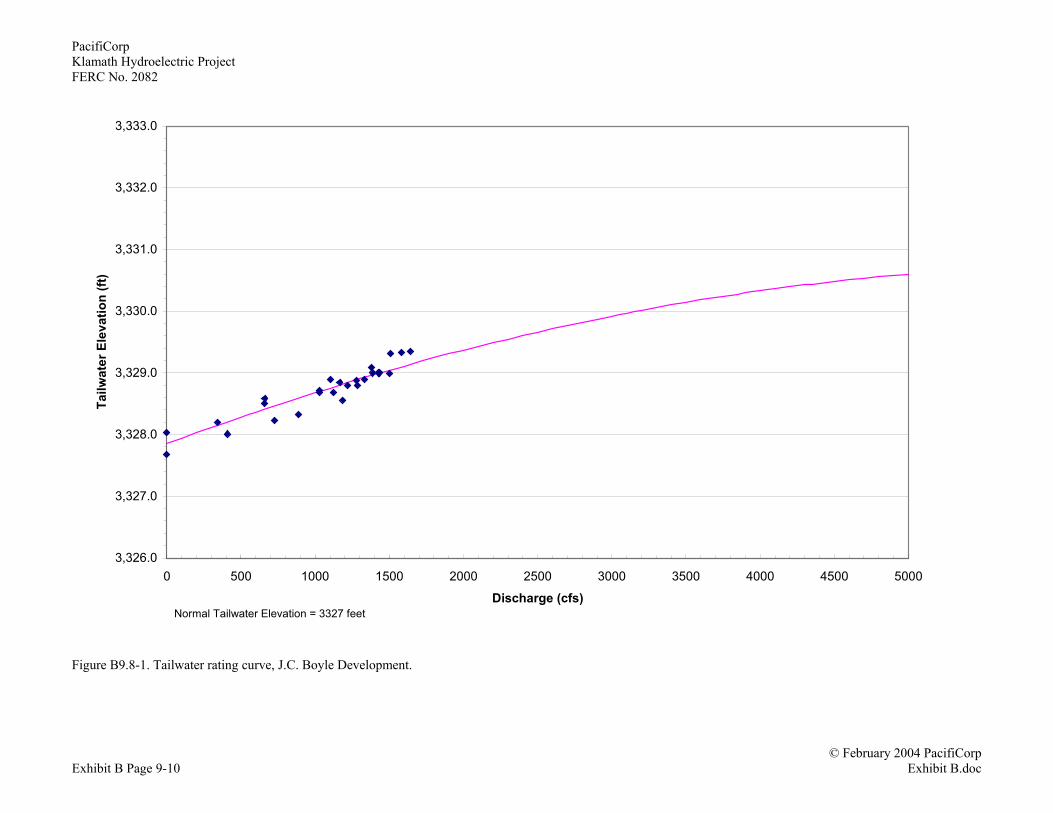
PacifiCorpKlamath Hydroelectric ProjectFERC No. 2082
© February 2004 PacifiCorpExhibit B Page 9-10 Exhibit B.doc
Figure B9.8-1. Tailwater rating curve, J.C. Boyle Development.
3,326.0
3,327.0
3,328.0
3,329.0
3,330.0
3,331.0
3,332.0
3,333.0
0 500 1000 1500 2000 2500 3000 3500 4000 4500 5000
Discharge (cfs)
Tailw
ater
Ele
vatio
n (ft
)
Normal Tailwater Elevation = 3327 feet
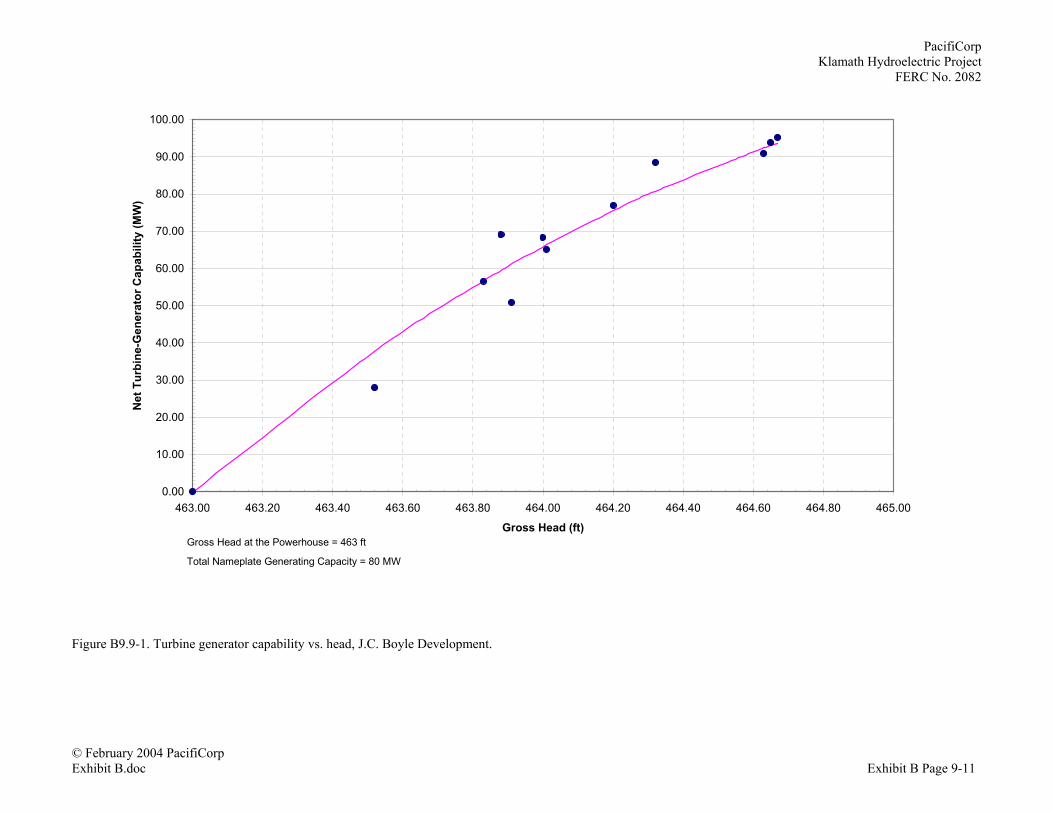
PacifiCorpKlamath Hydroelectric Project
FERC No. 2082
© February 2004 PacifiCorpExhibit B.doc Exhibit B Page 9-11
Figure B9.9-1. Turbine generator capability vs. head, J.C. Boyle Development.
0.00
10.00
20.00
30.00
40.00
50.00
60.00
70.00
80.00
90.00
100.00
463.00 463.20 463.40 463.60 463.80 464.00 464.20 464.40 464.60 464.80 465.00
Gross Head (ft)
Net
Tur
bine
-Gen
erat
or C
apab
ility
(MW
)
Gross Head at the Powerhouse = 463 ft
Total Nameplate Generating Capacity = 80 MW


© February 2004 PacifiCorpExhibit B.doc Exhibit B Page 10-1
B10.0 COPCO NO. 1 DEVELOPMENT
B10.1 DEVELOPMENT OVERVIEW
The Copco No. 1 Development consists of a reservoir, dam, and powerhouse located on theKlamath River between approximately RM 204 and RM 199 just south of the Oregon-Californiaborder (Figures B1.1-1). Copco No. 1 dam is a concrete arch dam 126 feet high, with 13 radialgates. The impoundment formed upstream of the dam is approximately 1,000 acres in extent withapproximately 46,900 acre-feet of total storage capacity and 6,235 acre-feet of active storagecapacity. The Copco No. 1 powerhouse is located immediately below the Copco No. 1 dam.Water diverted for power use flows through several trash racks into three short penstocks thatsupply the two turbines, each 10 MW in size. Combined hydraulic capacity of the turbines is3,200 cfs. Copco No. 1 powerhouse flow is directed to the Copco No. 2 powerhouse intakethrough the small, 1/4-mile-long Copco No. 2 reservoir.
B10.2 OWNERSHIP AND CONTRACTUAL OBLIGATION
PacifiCorp owns and operates the Copco No. 1 development and has no direct contractualobligations with the USBR regarding its operation. The Copco No. 1 facility, however, isoperated in a manner to assure conformity with NOAA Fisheries 2002 BO flows downstream ofIron Gate dam.
B10.3 OPERATIONS
Copco dam is operated for power generation, some very minor flood control and control of theCopco reservoir water surface elevation. The Copco No. 1 powerhouse is usually operated togenerate during the day when energy demands are highest, and to store water during the non-peak times (weeknights and weekends power). When river flows are near or in excess of turbinehydraulic capacity, the powerhouse generates continuously and excess water is spilled throughthe spill gates. Copco reservoir can fluctuate 5.0 feet between normal minimum and full poolelevations, but the average daily fluctuation is approximately 0.5 feet.
Copco No. 1 and No. 2 operate together. Since flows through the system must be closelycoordinated due to lack of significant storage and mandatory downstream flow requirements,flow through the Copco plants typically mimics flow (with a time lag) through J.C. Boyle on adaily average basis. Copco No. 2 has virtually no storage reservoir so is essentially “a slave” toCopco No. 1. That is, Copco No. 2 generation and hydraulic discharge follow Copco No. 1generation and hydraulic discharge.
Copco No. 1 Development has no bypass reach. The powerhouse is located immediately belowthe dam. The Copco No. 1 powerhouse tailwater is the small Copco No. 2 reservoir. There are nominimum instream flow or ramp rate requirements for the Copco No. 1 Development.
The spill gates at Copco No. 1 dam may be opened if an unscheduled turbine shutdown results ina lengthy outage that adversely affects downstream water flow requirements.
The Copco No. 1 Development has been automated for remote control of unit start, stop, andloading. Copco No. 1 generation is scheduled to meet the power demands of the system whilepassing required flows. The development operation is monitored and controlled twenty-four

PacifiCorpKlamath Hydroelectric ProjectFERC No. 2082
© February 2004 PacifiCorpExhibit B Page 10-2 Exhibit B.doc
hours a day, seven days per week. Upon unit startup, generation loads are set and the unit willautomatically reach and hold that requirement until reset or the unit shuts down. Projectoperators can control the operation manually from the powerhouse.
B10.4 ANNUAL PLANT FACTOR
The average annual energy production for the Copco No. 1 powerhouse is 106,000 MWh (30-year, long-term average, May 2003). With a nameplate capacity of 20 MW, the annual plantfactor for Copco No. 1 is 60 percent.
B10.5 PERIOD OF CRITICAL STREAM FLOW, AVERAGE ANNUAL ENERGYPRODUCTION, AND DEPENDABLE CAPACITY
The period of critical streamflow used to determine the dependable capacity is water year 1981.The dependable capacity is 6,000 kW.
The average annual energy production for the Copco No. 1 powerhouse is 106,000 MWh.
Monthly flow-duration curves are presented in Figure B10.5-1. Figure B10.5-2 shows themaximum, mean, and minimum historical monthly flows for Copco No. 1.
B10.6 AREA-CAPACITY CURVE AND OPERATING CURVE
An area-capacity curve showing gross and usable storage capacity of the reservoir is shown inFigure B10.6-1. A typical reservoir operating curve is shown in Figure B10.6-2. Because oflimited reservoir storage, the reservoir is operated on a daily basis over a limited range ofapproximately 1 foot.
B10.7 HYDRAULIC CAPACITY
The estimated hydraulic capacity of the Copco No. 1 powerhouse is approximately 3,200 cfs at arated net head of 118 feet. In 1997, testing of Unit No. 1 efficiency showed that at a gate positionof approximately 18 percent (smallest gate position tested) and a gross head of approximately118 feet, the resulting flow is approximately 258 cfs, which produces 0.33 MW. Similarly,testing of Unit No. 2 efficiency showed that at a gate position of 15 percent (smallest gateposition tested) and a net head of approximately 117 feet, the resulting flow is 305 cfs, whichproduces approximately 1.5 MW.
B10.8 TAILWATER RATING CURVE
The tailwater rating curve is shown in Figure B10.8-1.
B10.9 POWERPLANT CAPACITY VERSUS HEAD CURVE
The power plant capacity versus head curve is shown in Figure B10.9-1.

PacifiCorpKlamath Hydroelectric Project
FERC No. 2082
© February 2004 PacifiCorpExhibit B.doc Exhibit B Page 10-3
Figure B10.5-1. Flow-duration curves of monthly flows at the Copco No. 1 Development.
0
1000
2000
3000
4000
5000
6000
7000
8000
0% 10% 20% 30% 40% 50% 60% 70% 80% 90% 100%
Percent of Time a Given Flow Was Equaled or Exceeded
Mon
thly
Ave
rage
Flo
w (c
fs)
January
February
March
April
May
June
July
August
September
October
November
December
These data are representative of flows atUSGS Gauge 1510700, Klamath River below J.C. Boyle powerplant near Keno, Oregon - may be adjusted if additional data become available.
Period of Record: Water Years 1962 - 2001 (incomplete flow data WY 1972, 1973, 1974, 1980, 1981, and 1982)

PacifiCorpKlamath Hydroelectric ProjectFERC No. 2082
© February 2004 PacifiCorpExhibit B Page 10-4 Exhibit B.doc
Figure B10.5-2. Maximum, mean, and minimum historical monthly flows at the Copco No. 1 Development.
0
1000
2000
3000
4000
5000
6000
7000
8000
9000
Oct Nov Dec Jan Feb Mar Apr May Jun Jul Aug Sep
Mon
thly
Ave
rage
Flo
w (c
fs)
These data are representative of flows atUSGS Gauge 1510700, Klamath River below J.C. Boyle Power Plant near Keno, Oregon - may be adjusted if additional data become available.
Maximum Monthly Average Flow = 7905 cfsMean Monthly Average Flow = 1851 cfsMinimum Average Monthly Flow = 349 cfs
Period of Record: Water Years 1962 - 2001 (incomplete flow data WY 1972, 1973, 1974, 1980, 1981, and 1982)
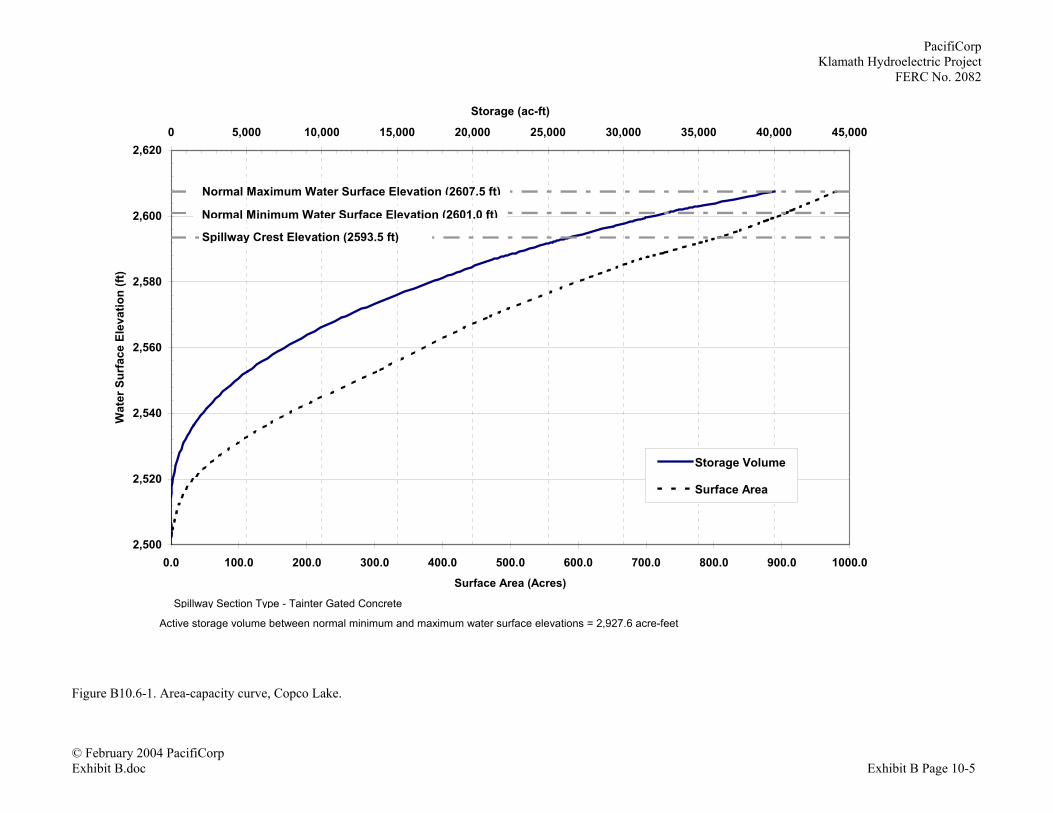
PacifiCorpKlamath Hydroelectric Project
FERC No. 2082
© February 2004 PacifiCorpExhibit B.doc Exhibit B Page 10-5
Figure B10.6-1. Area-capacity curve, Copco Lake.
2,500
2,520
2,540
2,560
2,580
2,600
2,6200 5,000 10,000 15,000 20,000 25,000 30,000 35,000 40,000 45,000
Storage (ac-ft)W
ater
Sur
face
Ele
vatio
n (ft
)
0.0 100.0 200.0 300.0 400.0 500.0 600.0 700.0 800.0 900.0 1000.0
Surface Area (Acres)
Storage Volume
Surface Area
Normal Minimum Water Surface Elevation (2601.0 ft)
Normal Maximum Water Surface Elevation (2607.5 ft)
Spillway Crest Elevation (2593.5 ft)
Active storage volume between normal minimum and maximum water surface elevations = 2,927.6 acre-feet
Spillway Section Type - Tainter Gated Concrete
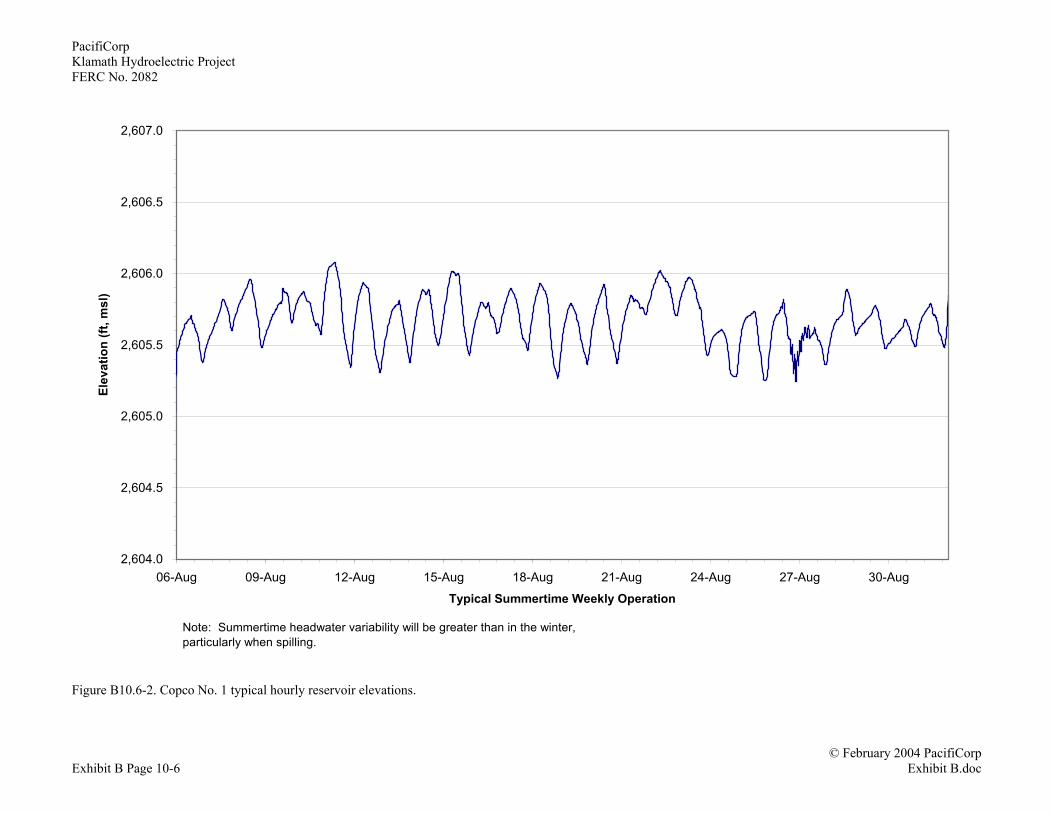
PacifiCorpKlamath Hydroelectric ProjectFERC No. 2082
© February 2004 PacifiCorpExhibit B Page 10-6 Exhibit B.doc
Figure B10.6-2. Copco No. 1 typical hourly reservoir elevations.
2,604.0
2,604.5
2,605.0
2,605.5
2,606.0
2,606.5
2,607.0
06-Aug 09-Aug 12-Aug 15-Aug 18-Aug 21-Aug 24-Aug 27-Aug 30-Aug
Typical Summertime Weekly Operation
Elev
atio
n (ft
, msl
)
Note: Summertime headwater variability will be greater than in the winter, particularly when spilling.

PacifiCorpKlamath Hydroelectric Project
FERC No. 2082
© February 2004 PacifiCorpExhibit B.doc Exhibit B Page 10-7
Figure B10.8-1. Tailwater rating curve, Copco No. 1 Development.
2480.0
2481.0
2482.0
2483.0
2484.0
2485.0
2486.0
2487.0
2488.0
2489.0
2490.0
0 500 1000 1500 2000 2500 3000 3500 4000 4500 5000
Discharge (cfs)
Tailw
ater
Ele
vatio
n (ft
)
Normal Tailwater Elevation = 2483.6

PacifiCorpKlamath Hydroelectric ProjectFERC No. 2082
© February 2004 PacifiCorpExhibit B Page 10-8 Exhibit B.doc
Figure B10.9-1. Turbine generator capability vs. head, Copco No. 1 Development.
18.00
18.50
19.00
19.50
20.00
20.50
21.00
21.50
22.00
119.0 120.0 121.0 122.0 123.0 124.0 125.0 126.0 127.0
Gross Head (ft)
Net
Tur
bine
-Gen
erat
or C
apab
ility
(MW
)
Gross Head at the Powerhouse = 123 ft
Total Nameplate Generating Capacity =20 MW

© February 2004 PacifiCorpExhibit B.doc Exhibit B Page 11-1
B11.0 COPCO NO. 2 DEVELOPMENT
B11.1 DEVELOPMENT OVERVIEW
The Copco No. 2 Development consists of a diversion dam, a small impoundment, andpowerhouse located just downstream of Copco No. 1 dam between approximately RM 198.3 andRM 196.8 (Figure B1.1-1). The reservoir created by the 38-foot-high dam has minimal storagecapacity (73 acre-feet). Copco No. 2 is entirely dependent upon Copco No. 1 releases for waterand as a result functions as a “slave” to the Copco No. 1.
Copco No. 2 dam has five spill gates and a manual gate valve that can control a small amount ofwater into the bypass reach. The flowline to the powerhouse consists of portions of wood-stavepipe, rock tunnel, and steel penstock. At the entrance to the flowline is a 36.5-foot by 48-foottrash rack. There are two 13.5 MW units with a combined hydraulic capacity of 3,200 cfs in thepowerhouse.
B11.2 OWNERSHIP AND CONTRACTUAL OBLIGATION
PacifiCorp owns and operates the Copco No. 2 development and has no direct contractualobligations with USBR regarding its operation. The Copco No. 2 facility, however, is operated ina manner to assure conformity with NOAA Fisheries 2002 BO flows downstream of Iron Gatedam.
B11.3 OPERATIONS
Copco No. 2 reservoir has virtually no active storage, and relies on Copco No. 1 releases foroperating flows. Copco No. 2 generation and hydraulic discharge follow Copco No. 1 generationand hydraulic discharge. With this type of operation, water surface elevations of the Copco No. 2reservoir rarely fluctuate more than several inches.
There are no ramp rate requirements for the 1.5 mile long bypass reach between Copco No. 2dam and Copco No. 2 powerhouse, but PacifiCorp currently releases a minimum flow of 5 to10 cfs as standard operation practice (Table B11.3-1). No natural springs are known to contributeflow to this reach.
Table B11.3-1. Copco No. 2 minimum instream flow and ramp rate directives.
River ReachLength of Reach
(River Miles) Minimum Instream Flow Ramp Rate
Copco No. 2 Bypass (dam topowerhouse)
1.5 10 cfs (nonregulatory release;PacifiCorp standard practice)
None.
Klamath River (Copco No. 2tailrace to Iron Gate reservoir)
0 None None
In the event of an unscheduled shutdown at the Copco No. 2 powerhouse, the Copco No. 1powerhouse is consequently shutdown. If flow in the Copco No. 2 waterway is at full capacity attime of shutdown, some water may be spilled into the lower Copco No. 2 bypass reach via anoverflow waterway at the surge tank. If flows are near the capacity of a single unit (approxi-
PacifiCorpKlamath Hydroelectric ProjectFERC No. 2082
© February 2004 PacifiCorpExhibit B Page 11-2 Exhibit B.doc
mately 1,600 cfs), a surge chamber in the tunnel can accommodate the excess water. If theoutage at Copco No. 2 powerhouse will be lengthy, Copco No. 1 powerhouse may be operatedand water spilled at Copco No. 2 dam.
Since the Copco No. 2 Development is located immediately downstream of Copco No. 1powerhouse, the Copco No. 2 generation is scheduled simultaneously with the generation atCopco No. 1. The Copco No. 2 units are automated. The daily generation schedule is establishedto meet the power demands of the system while passing required flows through the variousProject facilities. The operation is monitored and controlled 24 hours a day, 7 days per week.Upon unit startup, generation loads are set and the unit will automatically reach and hold thatrequirement until reset or the unit shuts down. The local operators to control the operationmanually from the powerhouse.
B11.4 ANNUAL PLANT FACTOR
The average annual energy production for the Copco No. 2 powerhouse is 135,000 MWh (30-year, long-term average, May 2003). With a nameplate capacity of 27 MW, the annual plantfactor for Copco No. 2 is 57 percent.
B11.5 PERIOD OF CRITICAL STREAM FLOW, AVERAGE ANNUAL ENERGYPRODUCTION, AND DEPENDABLE CAPACITY
The period of critical streamflow used to determine the dependable capacity is water year 1981.The dependable capacity is 7,700 kW.
The average annual energy production for the Copco No. 2 powerhouse is 135,000 MWh.
Monthly flow-duration curves are presented in Figure B11.5-1. Figure B11.5-2 shows themaximum, mean, and minimum historical monthly flows for Copco No. 2.
B11.6 AREA-CAPACITY CURVE AND RULE CURVE
In view of the annual hydrology of inflow, the Copco No. 2 Development is considered arun-of-river plant. As such, there is no usable storage and the forebay is kept at a constant watersurface elevation. Because there is minimal storage, area-capacity and rule curves are notapplicable.
B11.7 HYDRAULIC CAPACITY
The estimated hydraulic capacity of the Copco No. 2 powerhouse is approximately 3,200 cfs at arated net head of 148 feet. In 2000, testing of Unit No. 1 efficiency showed that at a gate positionof approximately 15 percent (smallest gate position tested) and a gross head of approximately154 feet, the resulting flow is approximately 241 cfs, which produces approximately 1 MW.Similarly, testing of Unit No. 2 efficiency showed that at a gate position of approximately 20percent (smallest gate position tested) and a net head of 150 feet, the resulting flow is 467 cfs,which produces approximately 3.8 MW.

PacifiCorpKlamath Hydroelectric Project
FERC No. 2082
© February 2004 PacifiCorpExhibit B.doc Exhibit B Page 11-3
B11.8 TAILWATER RATING CURVE
The tailwater rating curve is shown in Figure B11.8-1.
B11.9 POWERPLANT CAPACITY VERSUS HEAD CURVE
The power plant capacity versus head curve is shown in Figure B11.9-1.

PacifiCorpKlamath Hydroelectric ProjectFERC No. 2082
© February 2004 PacifiCorpExhibit B Page 11-4 Exhibit B.doc
Figure B11.5-1. Flow duration curve of monthly flows at the Copco No. 2 Development.
0
1000
2000
3000
4000
5000
6000
7000
8000
0% 10% 20% 30% 40% 50% 60% 70% 80% 90% 100%
Percent of Time a Given Flow Was Equaled or Exceeded
Mon
thly
Ave
rage
Flo
w (c
fs)
January
February
March
April
May
June
July
August
September
October
November
December
These data are representative of flows atUSGS Gauge 1510700, Klamath River below J.C. Boyle powerplant near Keno, Oregon - may be adjusted if additional data become available.
Period of Record: Water Years 1962 - 2001 (incomplete flow data WY 1972, 1973, 1974, 1980, 1981, and

PacifiCorpKlamath Hydroelectric Project
FERC No. 2082
© February 2004 PacifiCorpExhibit B.doc Exhibit B Page 11-5
Figure B11.5-2. Maximum, mean, and minimum historical monthly flows at the Copco No. 2 Development.
0
1000
2000
3000
4000
5000
6000
7000
8000
9000
Oct Nov Dec Jan Feb Mar Apr May Jun Jul Aug Sep
Mon
thly
Ave
rage
Flo
w (c
fs)
These data are representative of flows atUSGS Gauge 1510700, Klamath River below J.C. Boyle Power Plant near Keno, Oregon - may be adjusted if additional data become available.
Maximum Monthly Average Flow = 7905 cfsMean Monthly Average Flow = 1851 cfsMinimum Average Monthly Flow = 349 cfs
Period of Record: Water Years 1962 - 2001 (incomplete flow data WY 1972, 1973, 1974, 1980, 1981, and 1982)

PacifiCorpKlamath Hydroelectric ProjectFERC No. 2082
© February 2004 PacifiCorpExhibit B Page 11-6 Exhibit B.doc
Figure B11.8-1. Tailwater rating curve, Copco No. 2 Development.
2325
2326
2327
2328
2329
2330
2331
2332
2333
0 500 1000 1500 2000 2500 3000 3500 4000 4500 5000
Flow (cfs)
Tailw
ater
Ele
vatio
n (ft
)
Normal Tailwater Elevation = 2328 ft

PacifiCorpKlamath Hydroelectric Project
FERC No. 2082
© February 2004 PacifiCorpExhibit B.doc Exhibit B Page 11-7
Figure B11.9-1. Turbine generator capability vs. head Copco No. 2 Development.
24.00
24.50
25.00
25.50
26.00
26.50
27.00
27.50
28.00
28.50
29.00
148.0 149.0 150.0 151.0 152.0 153.0 154.0 155.0 156.0
Gross Head (ft)
Net
Tur
bine
-Gen
erat
or C
apab
ility
(MW
)
Gross Head at the Powerhouse = 152 ft
Total Nameplate Generating Capacity = 27 MW


© February 2004 PacifiCorpExhibit B.doc Exhibit B Page 12-1
B12.0 FALL CREEK DEVELOPMENT
B12.1 DEVELOPMENT OVERVIEW
The Fall Creek Development is a run-of-river facility located on Fall Creek, which is a tributaryof the Iron Gate reservoir. The Fall Creek Development consists of two small diversion dams, anearthen ditch, a penstock, and a powerhouse. The upper-most diversion is located on SpringCreek. When in use, it diverts up to 16.5 cfs of water to Fall Creek. The diversion dam on FallCreek then diverts up to 50 cfs into the power canal and penstock that supplies the powerhouse.
The diversion dam on Fall Creek is an earth- and rock-filled berm. The spillway structure isconstructed of timber flashboards and concrete. The length of the power canal from the dam tothe penstock intake is approximately 4,560 feet. At the entrance to the penstock is a trash rack.The penstock drops over the hillside, providing a 730-foot head to the three Pelton turbines in thepowerhouse. Generation capacity is 0.5 MW for Unit No. 1, 0.45 MW for Unit No. 2, and1.25 MW for Unit No. 3. The total hydraulic capacity of the turbines is 50 cfs.
B12.2 OWNERSHIP AND CONTRACTUAL OBLIGATION
The Fall Creek hydroelectric facilities are owned and operated by PacifiCorp.
B12.3 OPERATION
The water supply for the Fall Creek powerhouse is predominantly spring fed and is fairlyconsistent. Because of this, the facility was designed without a storage reservoir and is operatedas a run-of-the-river facility under all river flows and water year types. Generation is dependenton flow.
To provide the minimum instream flow, a notch in the lower stop logs at the Fall Creek diversiondam ensures that 0.5 cfs is continually released into the bypass reach. Continuous operation atthe powerhouse (including turbine bypass) or flow through the bypass channel duringmaintenance ensures that the 15 cfs minimum instream flow downstream of the powerhouse ismet (Table B12.3-1). A gauge (USGS No. 11512000) was previously operated downstream ofthe powerhouse, and has recently been reactivated (spring 2003). It is unknown how long thisgauge will be in operation. Flow released at the powerhouse can be estimated through a flow-generation relationship.
Table B12.3-1. Fall Creek minimum instream flow and ramp rate directives.
River ReachLength of Reach
(River Miles) Minimum Instream Flow Ramp Rate
Fall Creek Bypass 1.2 0.5 cfs into bypass plus a 15 cfs continuous flowdownstream of the powerhouse tailrace (FPC 1956)
None.
The Fall Creek development is operated manually, due primarily to its run of river operation,smaller generation potential, and the consistency of the stream flow at the diversion point. Thefacility is operated at a constant discharge equal to the diversion dam inflow minus the 0.5 cfsinstream release. The flashboards at the diversion dam are maintained at a constant elevation,and during periods of higher flow, the water in excess of the diversion capacity (50 cfs) passes

PacifiCorpKlamath Hydroelectric ProjectFERC No. 2082
© February 2004 PacifiCorpExhibit B Page 12-2 Exhibit B.doc
over the diversion dam. The three units are manually operated as flows become available ordiminish seasonally. After normal business hours, the units are monitored. The Fall Creekgeneration is monitored 24 hours per day, 7 days per week from a continuous total generationreadout and through limited critical alarming. Should a critical alarm occur, the local operator iscontacted to respond on site. Since the units are impulse runners, normal unit shutdowns willdeflect flows from the runners and not change flow releases until the operator elects to do so.
B12.4 SPRING CREEK FACILITY
Spring Creek is a tributary to Jenny Creek that in turn flows into the Iron Gate reservoir. SpringCreek water can be diverted out of the Jenny Creek basin into the Fall Creek basin for use at theFall Creek powerhouse (Figure B12.4-1).
The Spring Creek dam is a small earthen embankment approximately 6.3 feet high, spanning theentire stream width (approximately 66 feet). The water from Spring Creek may be divertedthrough an earthen canal approximately 6,850 feet long that empties into the Fall Creek drainage.The Spring Creek facilities are not currently part of the current FERC License No. 2082.
For at least a decade, PacifiCorp has been denied the opportunity to use Spring Creek water forhydroelectric production due a water rights dispute with an adjacent landowner. PacifiCorp andthe landowner filed their respective claims with the Oregon Water Resources Department, and apre-adjudication ruling was made in favor of PacifiCorp. PacifiCorp’s water rights claim is for adiversion of 16.5 cfs from Spring Creek into Fall Creek for hydroelectric production at the FallCreek Development.
B12.5 ANNUAL PLANT FACTOR
The average annual energy production for the Fall Creek powerhouse is 12,000 MWh. With anameplate capacity of 2.2 MW, the annual plant factor for Fall Creek is 62 percent.
B12.6 PERIOD OF CRITICAL STREAM FLOW, AVERAGE ANNUAL ENERGYPRODUCTION, AND DEPENDABLE CAPACITY
The period of critical streamflow used to determine the dependable capacity is water year 1981.The dependable capacity is approximately 1.6 MW.
The average annual energy production is for the Fall Creek powerhouse is 12,000 MWh, withoutthe Spring Creek flows. With the Spring Creek flows, the estimated average annual energyproduction is 16,000 MWh.
Monthly flow-duration curves are presented in Figure B12.6-1.


PacifiCorpKlamath Hydroelectric ProjectFERC No. 2082
© February 2004 PacifiCorpExhibit B Page 12-4 Exhibit B.doc
Figure B12.6-1. Flow duration curve of monthly flows at the Fall Creek Development.
0.00
20.00
40.00
60.00
80.00
100.00
120.00
140.00
0% 10% 20% 30% 40% 50% 60% 70% 80% 90% 100%
Percent of Time a Given Flow Was Equaled or Exceeded
Ave
rage
Mon
thly
Flo
w (c
fs)
January
February
March
April
May
June
July
August
September
October
November
December
Period of Record: Water Years 1933 - 1959 (incomplete flow data WY October 1932 - March 1933)
These data are representative of flows at USGS Gauge 111512000 Fall Creek above Copco, CA - may be adjusted if additional data become available.
Spring Creek Diversion Flow Estimated

PacifiCorpKlamath Hydroelectric Project
FERC No. 2082
© February 2004 PacifiCorpExhibit B.doc Exhibit B Page 12-5
B12.7 AREA-CAPACITY CURVE AND RULE CURVE
The Fall Creek Development is a run-of-river plant. As such, there is no usable storage, and theforebay is kept at a constant level. There is no area-capacity curve or rule curve.
B12.8 HYDRAULIC CAPACITY
The estimated hydraulic capacity of the Fall Creek powerhouse is approximately 50 cfs at a ratednet head of 720 feet.
B12.9 TAILWATER RATING CURVE
The Fall Creek powerhouse utilizes Pelton-type impulse turbines, which discharge to an openchannel at atmospheric pressure. As a result, the turbine capacity is generally unaffected by thetailwater elevation.
B12.10 POWERPLANT CAPACITY VERSUS HEAD CURVE
The run-of-river Fall Creek Development operates at a fairly constant head. As such, generatingcapacity is only influenced by variations in flow rate.

© February 2004 PacifiCorpExhibit B.doc Exhibit B Page 13-1
B13.0 IRON GATE DEVELOPMENT
B13.1 DEVELOPMENT OVERVIEW
The Iron Gate Development consists of a reservoir, dam, and powerhouse located on theKlamath River between approximately RM 196.8 and RM 190, which is approximately 20 milesnortheast of Yreka, California. It is the most downstream hydroelectric facility of the Project(Figure B1.1-1). The rock fill Iron Gate dam is 173 feet high. The impoundment formedupstream of the dam is approximately 944 surface acres and contains approximately 58,794 acre-feet of total storage capacity and 3,790 acre-feet of active storage capacity. An ungated spillway730 feet long leads to a large spill canal, allowing transport of high flows past the structure. Thepowerhouse is located at the base of the dam. Trash is prevented from entering the penstock by a17.5-foot by 45-foot trash rack.
In 2003, modifications were made to Iron Gate dam to raise the dam crest elevation from El.2343 feet msl to El. 2348 feet msl. The modifications included construction of a concrete wallextension along the dam crest, anchored into the existing dam structure. Additional riprapmaterials were placed on the upstream face of the dam to protect those areas inundated by thehigher reservoir elevations. This work included shotcrete protection at the top of the spillway andspillway chute.
The Iron Gate powerhouse consists of a single 18 MW unit with a hydraulic capacity of1,735 cfs. In the event of a turbine shutdown, a synchronized bypass valve located immediatelyupstream of the turbine diverts water around the turbine to maintain flows downstream of thedam.
The original construction diversion tunnel is still in place. Operation of the gate controlling theflow through the tunnel is limited to emergency use during high flow events. If needed for suchpurposes, the tunnel can pass up to approximately 5,000 cfs.
B13.2 OWNERSHIP AND CONTRACTUAL OBLIGATION
PacifiCorp owns and operates the Iron Gate Development. Although it is not covered by the1956 Contract with USBR, most of the discussion relating to Link River dam and UKLnonetheless applies to Iron Gate dam as well because average daily flows below Iron Gate damare a direct function of flows released at Link River dam.
In 1992, USBR operational control required only specific UKL elevations, but now USBR alsorequires specific flow releases at Iron Gate dam. In 1997, National Marine Fisheries Service(NOAA Fisheries) listed coastal coho salmon below Iron Gate dam as federally threatened underthe ESA. In compliance with ESA, for the period 1997-2003, USBR defined its own Projectoperations through annual operation plans. Each annual plan defined how UKL and flowsdownstream of Iron Gate dam could be regulated for that year, based on hydrological andenvironmental (e.g., water quality, fishery) conditions. USBR’s consultation with USFWS andNOAA Fisheries on the plans resulted in Biological Opinions that specifically defined UKLelevations and Klamath River flows downstream of Iron Gate dam needed to protect listedspecies. PacifiCorp has continued to assist USBR in achieving its UKL elevation and the riverflow in compliance with the ESA. This commitment is expressed via annual agreements that
PacifiCorpKlamath Hydroelectric ProjectFERC No. 2082
© February 2004 PacifiCorpExhibit B Page 13-2 Exhibit B.doc
PacifiCorp has signed with USBR stating its cooperation to operate the Hydroelectric Project inaccordance with USBR’s annual Operating Plans (see Appendix B-1A).
Since coho salmon are listed under the ESA downstream of Iron Gate dam and flows below IronGate are closely correlated to releases at Link River and Keno Dams, the 1997 modification ofthe 1956 Contract covers Iron Gate dam as well. Specifically, the modification states that USBRwill assume all discretionary responsibility for setting minimum river flows below Iron Gatedam. USBR does this through consultation with NOAA Fisheries. PacifiCorp implements theminimum flows pursuant to the 1997 modification and annual agreements with USBR. Insummary, under the 1997 modification and because there is minimal in-Project storage, USBR,not PacifiCorp, controls the amount of water released at Iron Gate dam to meet instream flowconditions of NOAA Fisheries Biological Opinions (most recently the 2002 BO).
B13.3 OPERATIONS
The Iron Gate powerhouse is located at the base of the dam and has no bypass reach. The facilityoperates as a regulating dam to dampen the effects of fluctuating river levels from the CopcoNos. 1 and 2 peaking operations. Releases through the turbine can be as much as 1,735 cfs.When flows are higher, or higher flows are needed to meet regulatory conditions downstream,additional water is passed over the ungated spillway. The amount of spill is controlled to theextent possible through Copco Nos. 1 and 2 operations. If a consistent spill is needed at IronGate dam, Copco Nos. 1 and 2 cannot operate in a peaking operation, but must provide aconstant flow to maintain Iron Gate reservoir elevations. Due to the 800-foot length of thespillway, and the variable inflows from reservoir tributaries (Fall Creek, Jenny Creek, and CampCreek), operating to meet less than a 500 cfs spill amount over the ungated spillway at Iron Gatedam is very difficult.
The current FERC license stipulated minimum flow requirements below Iron Gate dam are 1,300cfs from September through April, 1,000 cfs in May and August, and 710 cfs in June and July.However, and as mentioned above, since 1997 PacifiCorp has operated to provide instream flowreleases dictated by USBR’s annual Project Operations Plans.
PacifiCorp coordinates with USBR to pass those minimum flows stated in the current biologicalopinion rather than those cited as the FERC minimum. During 2003 through 2005, USBR willmeet or exceed the Iron Gate dam flows listed in Table B10.3-1 by water year types plus anadditional volume to be provided by a water bank (NOAA Fisheries, 2002). Specifically, theminimum volume of additional water during water years 2003 through 2005 will be 50 totalacre-feet (TAF), 75 TAF, and 100 TAF, respectively. The amount of this additional water is toincrease with each successive year as USBR continues to develop water resources to support areliable water bank. By March 31 of each year, NOAA Fisheries and USBR will determine howthis additional ware will be distributed for release. Iron Gate Hatchery return water and BogusCreek contributions are included in this minimum flow.

PacifiCorpKlamath Hydroelectric Project
FERC No. 2082
© February 2004 PacifiCorpExhibit B.doc Exhibit B Page 13-3
Table B13.3-1. Instream flow releases as measured at Iron Gate dam in the U.S. Bureau ofReclamation’s Klamath Project Operations 2002 Biological Assessment (USBR, 2002).
Flows at Iron Gate Dam (Average Daily Flow) by Water Year Type*Time Step Above Average Below Average Dry Critical Dry
October 1,345 1,345 879 920November 1,337 1,324 873 912December 1,387 1,621 889 929January 1,300 1,334 888 1,101February 1,300 1,806 747 637March 1-15March 16-30
1,9532,553
2,1901,896
849993
607547
April 1-15April 16-30
1,8632,791
1,7421,347
969922
874773
May 1-15May 16-31
2,2041,466
1,0211,043
761979
633608
June 1-15June 16-30
827934
959746
741612
591619
July 1-15July 16-31
710710
736724
547542
501501
August 1,039 1,000 647 517September 1,300 1,300 749 722*Water Year Type is based on Upper Klamath Lake Net Inflow (during April – September) as follows:
Above Normal Above 500,000 acre-feetBelow Normal 500,000 to greater than 312,000 acre-feetDry 312,000 to greater than 185,000 acre-feetCritical 185,000 acre feet or less
In addition, in order to prevent potential coho salmon stranding, USBR will operate the KlamathIrrigation Project to provide water and coordinate with PacifiCorp to achieve the following ratesfor ramping down of flows between monthly or biweekly timesteps below Iron Gate dam aslisted in Table B13.3-1.
The 2001 biological opinion issued by NOAA Fisheries for USBR contained limits onPacifiCorp’s ramp rates at Iron Gate. The 2001 and the subsequent 2002 biological opinionsspecified a ramp rate of 50 cfs per 2-hour period at the Iron Gate powerhouse at those timeswhen flows are within the hydraulic capacity of the plant (Table B13.3-2). The biologicalopinions also set a limit for flow reduction to 150 cfs per day (NOAA Fisheries, 2001). Thislimit is five times more restrictive than the current FERC license ramp rate of 250 cfs per hour.PacifiCorp has found that the equipment in the powerhouse can achieve this lower ramp rate.However, coordination between USBR and PacifiCorp is necessary to make sure enough water isavailable for release over the long ramp-down periods. This operational change relies on semi-automated control subject to occasional inaccuracies. PacifiCorp has committed to implementthose ramp rates to the extent possible based on the physical limitations of the hydroelectricProject facilities. These limitations include the absence of spill gates at Iron Gate dam.
Flow below Iron Gate dam is measured every 15 minutes at a USGS gauging station(No. 11516530) located approximately 0.6 mile downstream. The gauge is also downstream of
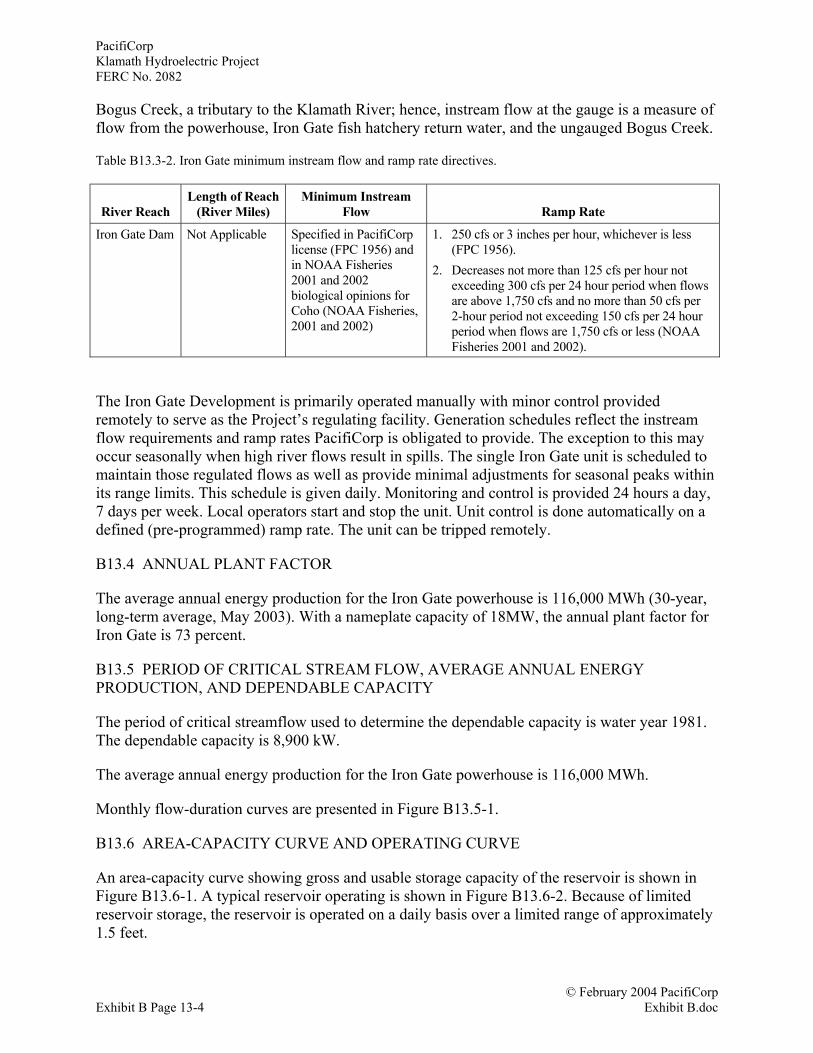
PacifiCorpKlamath Hydroelectric ProjectFERC No. 2082
© February 2004 PacifiCorpExhibit B Page 13-4 Exhibit B.doc
Bogus Creek, a tributary to the Klamath River; hence, instream flow at the gauge is a measure offlow from the powerhouse, Iron Gate fish hatchery return water, and the ungauged Bogus Creek.
Table B13.3-2. Iron Gate minimum instream flow and ramp rate directives.
River ReachLength of Reach
(River Miles)Minimum Instream
Flow Ramp Rate
Iron Gate Dam Not Applicable Specified in PacifiCorplicense (FPC 1956) andin NOAA Fisheries2001 and 2002biological opinions forCoho (NOAA Fisheries,2001 and 2002)
1. 250 cfs or 3 inches per hour, whichever is less(FPC 1956).
2. Decreases not more than 125 cfs per hour notexceeding 300 cfs per 24 hour period when flowsare above 1,750 cfs and no more than 50 cfs per2-hour period not exceeding 150 cfs per 24 hourperiod when flows are 1,750 cfs or less (NOAAFisheries 2001 and 2002).
The Iron Gate Development is primarily operated manually with minor control providedremotely to serve as the Project’s regulating facility. Generation schedules reflect the instreamflow requirements and ramp rates PacifiCorp is obligated to provide. The exception to this mayoccur seasonally when high river flows result in spills. The single Iron Gate unit is scheduled tomaintain those regulated flows as well as provide minimal adjustments for seasonal peaks withinits range limits. This schedule is given daily. Monitoring and control is provided 24 hours a day,7 days per week. Local operators start and stop the unit. Unit control is done automatically on adefined (pre-programmed) ramp rate. The unit can be tripped remotely.
B13.4 ANNUAL PLANT FACTOR
The average annual energy production for the Iron Gate powerhouse is 116,000 MWh (30-year,long-term average, May 2003). With a nameplate capacity of 18MW, the annual plant factor forIron Gate is 73 percent.
B13.5 PERIOD OF CRITICAL STREAM FLOW, AVERAGE ANNUAL ENERGYPRODUCTION, AND DEPENDABLE CAPACITY
The period of critical streamflow used to determine the dependable capacity is water year 1981.The dependable capacity is 8,900 kW.
The average annual energy production for the Iron Gate powerhouse is 116,000 MWh.
Monthly flow-duration curves are presented in Figure B13.5-1.
B13.6 AREA-CAPACITY CURVE AND OPERATING CURVE
An area-capacity curve showing gross and usable storage capacity of the reservoir is shown inFigure B13.6-1. A typical reservoir operating is shown in Figure B13.6-2. Because of limitedreservoir storage, the reservoir is operated on a daily basis over a limited range of approximately1.5 feet.

PacifiCorpKlamath Hydroelectric Project
FERC No. 2082
© February 2004 PacifiCorpExhibit B.doc Exhibit B Page 13-5
Figure B13.5-1. Flow duration curve of monthly flows at the Iron Gate Development.
0
1000
2000
3000
4000
5000
6000
7000
8000
0% 10% 20% 30% 40% 50% 60% 70% 80% 90% 100%
Percent of Time a Given Flow Was Equaled or Exceeded
Mon
thly
Ave
rage
Flo
w (c
fs)
January
February
March
April
May
June
July
August
September
October
November
December
These data are representative of flows at USGS Gauge 1151653-, Klamath River below Iron Gate Dam, CA - may be adjusted if additional data become available.
Period of Record: Water Years 1962 - 2001
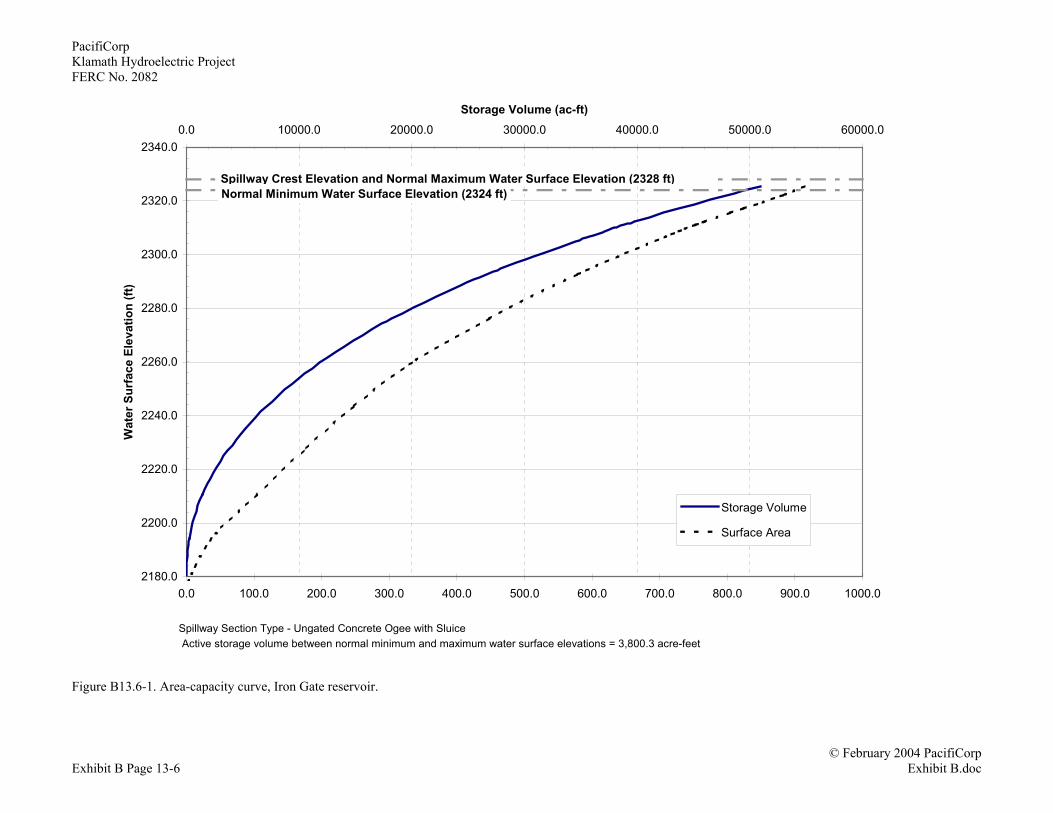
PacifiCorpKlamath Hydroelectric ProjectFERC No. 2082
© February 2004 PacifiCorpExhibit B Page 13-6 Exhibit B.doc
Figure B13.6-1. Area-capacity curve, Iron Gate reservoir.
2180.0
2200.0
2220.0
2240.0
2260.0
2280.0
2300.0
2320.0
2340.00.0 10000.0 20000.0 30000.0 40000.0 50000.0 60000.0
Storage Volume (ac-ft)W
ater
Sur
face
Ele
vatio
n (ft
)
0.0 100.0 200.0 300.0 400.0 500.0 600.0 700.0 800.0 900.0 1000.0
Storage Volume
Surface Area
Normal Minimum Water Surface Elevation (2324 ft)Spillway Crest Elevation and Normal Maximum Water Surface Elevation (2328 ft)
Active storage volume between normal minimum and maximum water surface elevations = 3,800.3 acre-feetSpillway Section Type - Ungated Concrete Ogee with Sluice

PacifiCorpKlamath Hydroelectric Project
FERC No. 2082
© February 2004 PacifiCorpExhibit B.doc Exhibit B Page 13-7
Figure B13.6-2. Iron Gate typical hourly reservoir elevations.
2,325.0
2,325.5
2,326.0
2,326.5
2,327.0
2,327.5
2,328.0
06-Aug 09-Aug 12-Aug 15-Aug 18-Aug 21-Aug 24-Aug 27-Aug 30-AugTypical Summertime Weekly Operation
Elev
atio
n (ft
., m
sl)
Note: Summertime headwater variability will be greater than in the winter, particularly when spilling.

PacifiCorpKlamath Hydroelectric ProjectFERC No. 2082
© February 2004 PacifiCorpExhibit B Page 13-8 Exhibit B.doc
B13.7 HYDRAULIC CAPACITY
The estimated hydraulic capacity of the Iron Gate powerhouse is approximately 1,735 cfs at arated net head of 153 feet.
B13.8 TAILWATER RATING CURVE
The tailwater rating curve is shown in Figure B13.8-1.
B13.9 POWERPLANT CAPACITY VERSUS HEAD CURVE
The power plant capacity versus head curve is shown in Figure B13.9-1.

PacifiCorpKlamath Hydroelectric Project
FERC No. 2082
© February 2004 PacifiCorpExhibit B.doc Exhibit B Page 13-9
Figure B13.8-1. Tailwater rating curve, Iron Gate Development.
2165
2167
2169
2171
2173
2175
2177
2179
2181
2183
2185
0 2000 4000 6000 8000 10000 12000 14000 16000 18000 20000
Discharge (cfs)
Tailw
ater
Ele
vatio
n (ft
)
Normal Tailwater Elevation = 2170 ft

PacifiCorpKlamath Hydroelectric ProjectFERC No. 2082
© February 2004 PacifiCorpExhibit B Page 13-10 Exhibit B.doc
Figure B13.9-1. Turbine generator capability vs. head, Iron Gate Development.
16.00
16.50
17.00
17.50
18.00
18.50
19.00
19.50
20.00
154.0 155.0 156.0 157.0 158.0 159.0 160.0 161.0 162.0
Gross Head (ft)
Net
Tur
bine
-Gen
erat
or C
apab
ility
(MW
)
Gross Head at the Powerhouse = 158 ft
Total Nameplate Generating Capacity =18 MW

© February 2004 PacifiCorpExhibit B.doc Exhibit B Page 14-1
B14.0 POWER UTILIZATION
Power generated at the Project is and will be used to meet the applicant’s system loads. Theapplicant is an operating public utility, subject to regulation by the Public Utilities Commissionerof Oregon, the Washington Public Service Commission, the Idaho Public Utilities Commission,Utah Public Service Commission, the Public Service Commission of Wyoming, and the PublicUtilities Commission, State of California, engaged primarily in the business of generating,purchasing, transmitting, distributing, and selling electric power and energy to domestic,commercial, and industrial customers in its service areas in the States of Oregon, Washington,Idaho, Utah, Wyoming, and California.
The applicant’s transmission facilities are interconnected with those of other utilities constitutingthe Northwest Power Pool. The Project is connected to this transmission grid and is operated incoordination with the Northwest Power Pool under the provisions of the Pacific NorthwestCoordination Agreement.


© February 2004 PacifiCorpExhibit B.doc Exhibit B Page 15-1
B15.0 PROPOSED PROJECT
The proposed Project will include the removal of three developments (East Side, West Side, andKeno) from the existing Project and the inclusion of new instream flow requirements at twodevelopments (J.C. Boyle and Fall Creek). PacifiCorp does not plan to make any substantialProject generation capacity additions in the foreseeable future. As described in Exhibit A,PacifiCorp will monitor the condition of powerhouse runners and generators and make repairs ina timely manner to extend the life of the equipment or replace as needed. These generationenhancements will result in slight improvements in capacity and energy at the Projectdevelopments.
As previously stated, the decommissioning of the East Side and West Side developments willresult in the loss of 3.8 MW of capacity and 18,800 MWh of annual energy.
The proposed additional 100 cfs of instream flow released at the J. C. Boyle powerhouse willresult in an estimated annual energy reduction at that development of 1,500 MWh. The increaseof the instream flow at the Fall Creek Development from 0.5 cfs to 5.0 cfs will reduce the annualenergy production by 1,300 MWh.

© February 2004 PacifiCorpExhibit B.doc Exhibit B Page 16-1
B16.0 INFORMATION SOURCES
Ayers Associates. 1999. Geomorphic and Sediment Evaluation of the Klamath River, California,Below Iron Gate Dam. Fort Collins, Colorado.
Balance Hydrologics, Inc. (BHI). 1996. Initial Assessment of Pre- and Post-Klamath ProjectHydrology on the Klamath River and Impacts on Instream Flows and Fishery Habitat.Report prepared by BHI for the Yurok Tribe. Berkeley, California.
Federal Energy Regulatory Commission (FERC). 1990. Final Environmental Impact Statement:Salt Caves Hydroelectric Project (FERC 10199-0000). Federal Energy RegulatoryCommission, Office of Hydropower Relicensing, Washington, D.C.
Federal Power Commission. 1956. The California-Oregon Power Company Project No. 2082.License (Major). Issued March 1, 1956, by Federal Power Commission, Washington D.C.
National Oceanic and Atmospheric Administration Fisheries (NOAA Fisheries). 2001.Biological Opinion – Ongoing Klamath Project Operation.
National Oceanic and Atmospheric Administration Fisheries (NOAA Fisheries). 2002.Biological Opinion – Ongoing Klamath Project Operation.
PacifiCorp. 2000. Klamath Hydroelectric Project FERC No. 2082 First Stage ConsultationDocument. Portland, Oregon.
U. S. Bureau of Reclamation (USBR). 1998. Klamath Project 1998 Operations PlanEnvironmental Assessment. Klamath Falls, Oregon.
U. S. Bureau of Reclamation (USBR). 2002. Final Biological Assessment. The Effects ofProposed Actions Related to Klamath Project Operation (April 1, 2002–March 31, 2012)on Federally-Listed Threatened and Endangered Species. Partially incorporating January22, 2001, Biological Assessment submitted to the U.S. Fish and Wildlife Service.Prepared by the U.S. Department of Interior Bureau of Reclamation, Mid-Pacific Region,Klamath Basin Area Office. February 25, 2002.
U.S. Fish and Wildlife Service (USFWS). 1992. Biological Opinion on Effects of Long-termOperation of the Klamath Project. Klamath Falls, OR.
U.S. Fish and Wildlife Service (USFWS). 1996. Formal Consultation on PacifiCorp and TheNew Earth Corporation Operations, as Permitted by the Bureau of Reclamation, for theLost River and Shortnose Sucker. Klamath Falls, Oregon.
U.S. Fish and Wildlife Service (USFWS). 2001. Biological / conference opinion regarding theeffects of operation of the Bureau of Reclamation’s Klamath Project on endangered LostRiver (Deltistes luxatus), endangered shortnose sucker (Chasmistes brevirostris), threatenbald eagle (Haliaeetus leucocephalus) and proposed critical habitat for the Lost River /shortnose suckers. California/Nevada Operations Office, Sacramento, California.


Exhibit B.doc
APPENDIX B-1A
1956 Contract with USBR for the Operation of Link River Dam andAssociated Letters of Contract Amendments

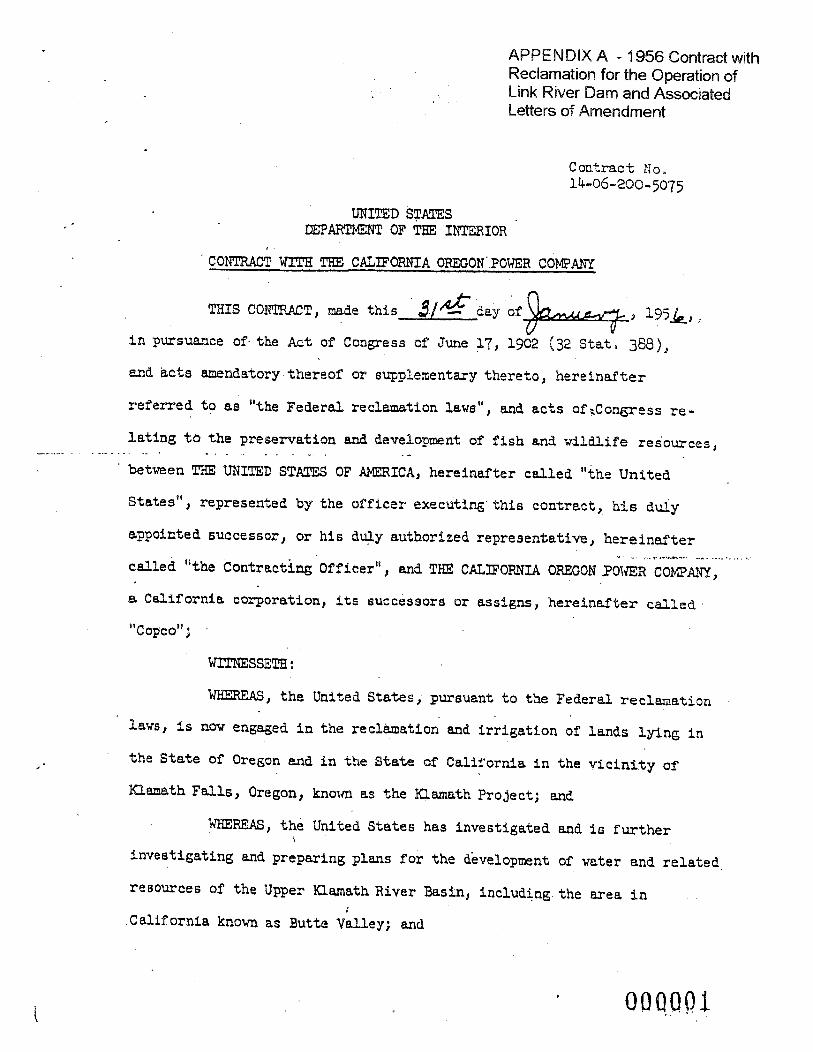


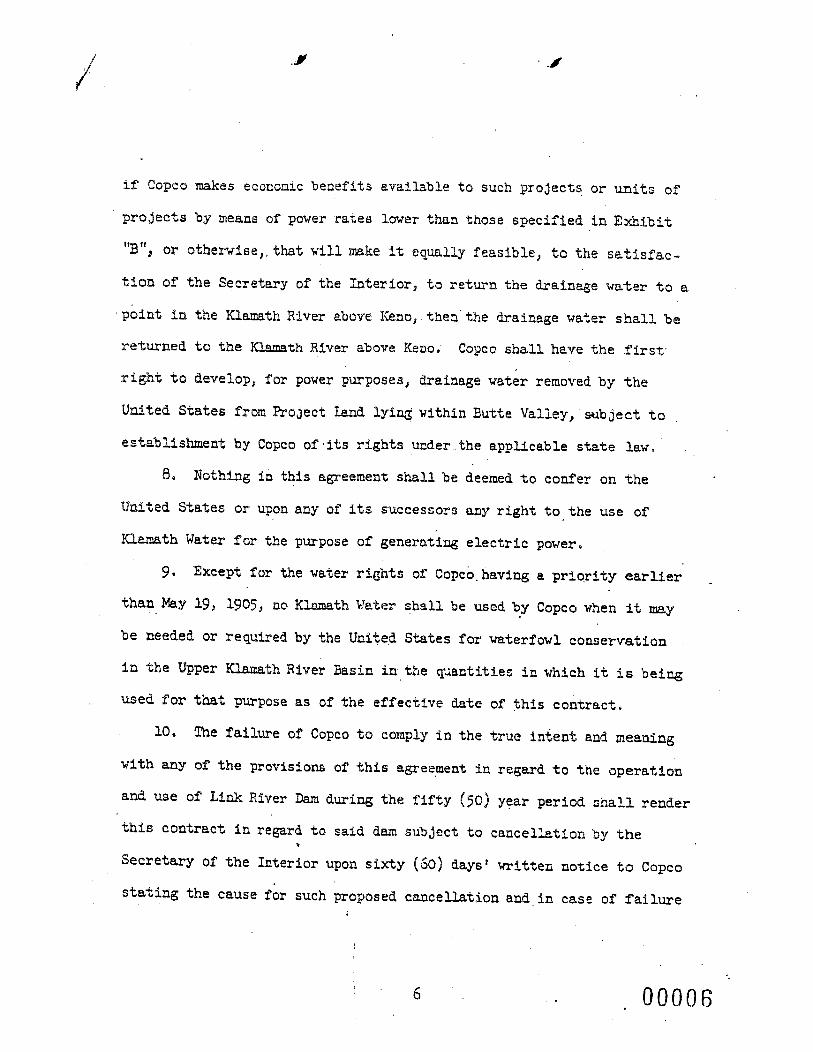
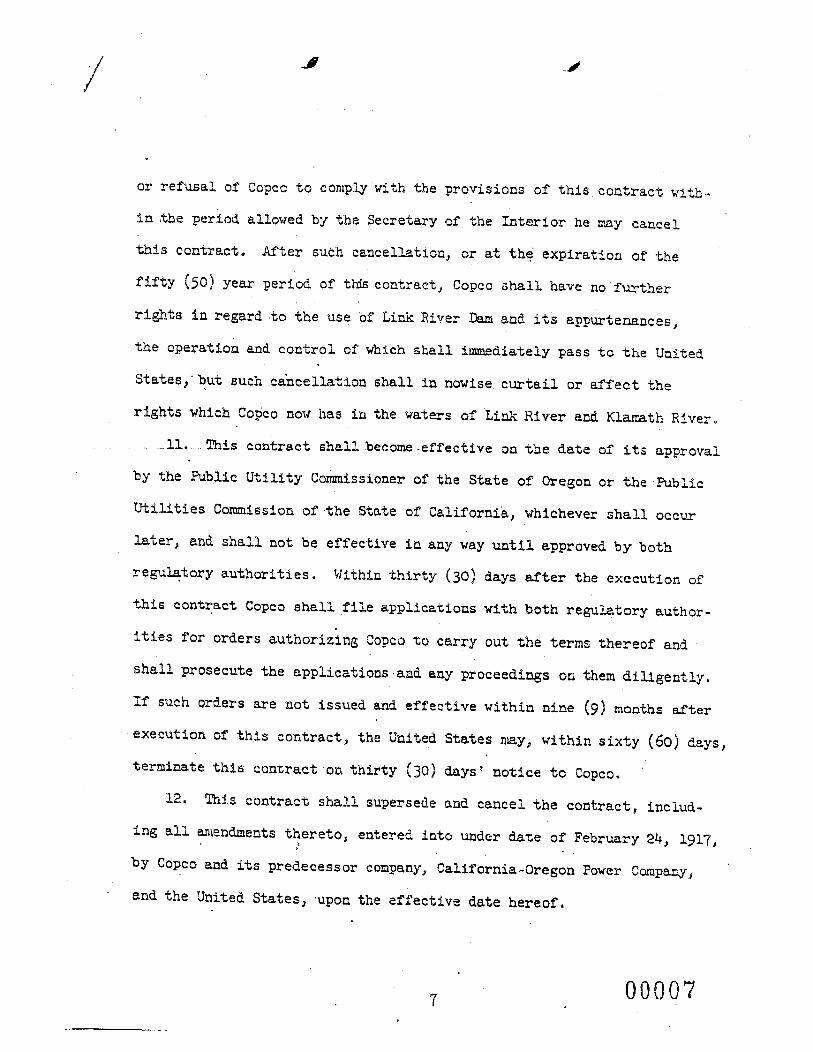


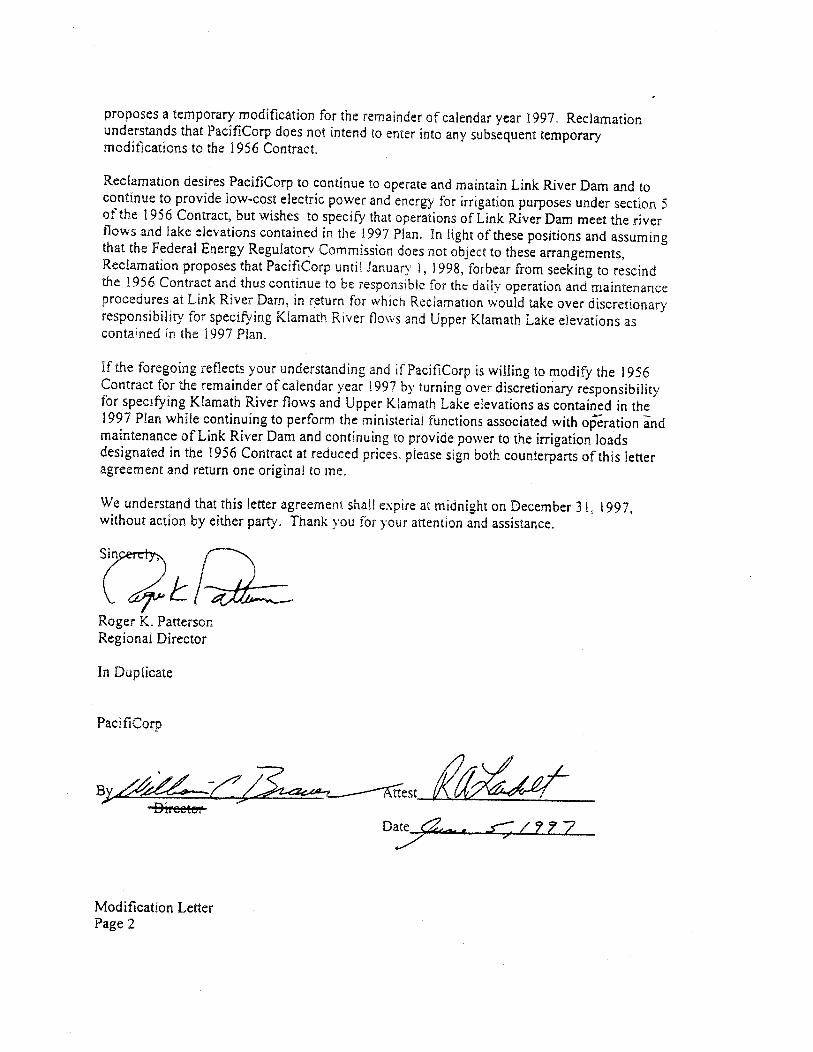


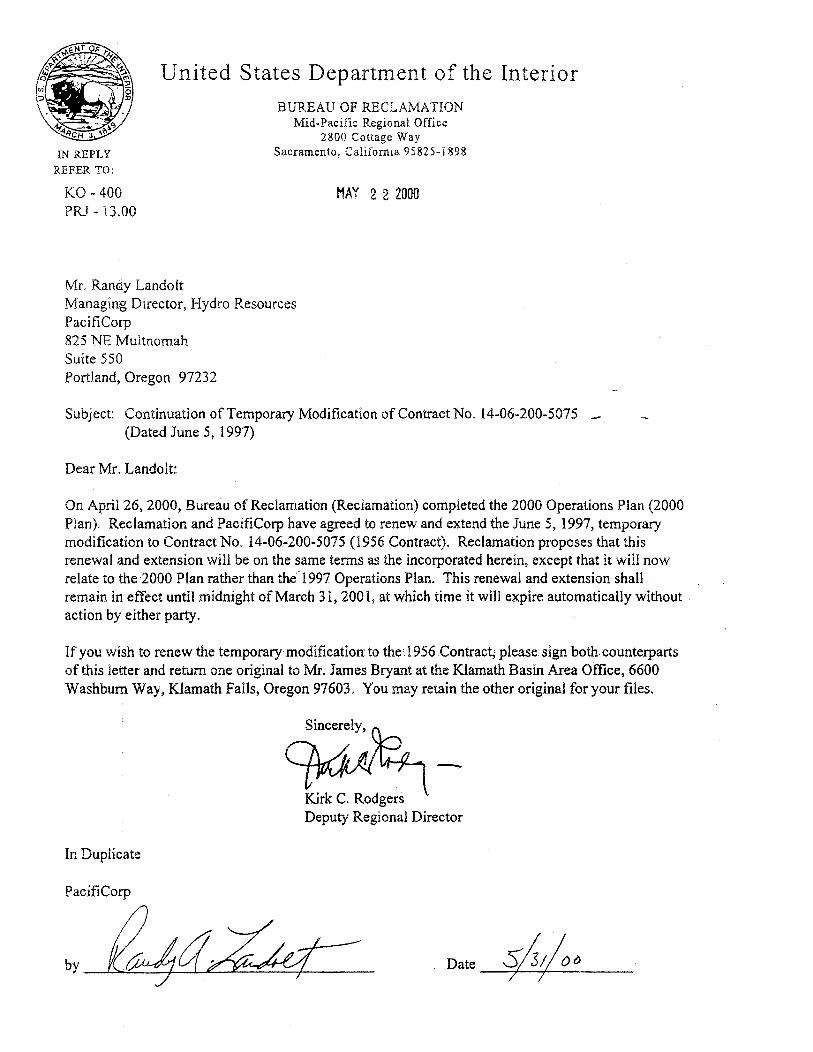


Exhibit B.doc
APPENDIX B-8A
Keno Contract with USBR for the Operation of Keno Dam

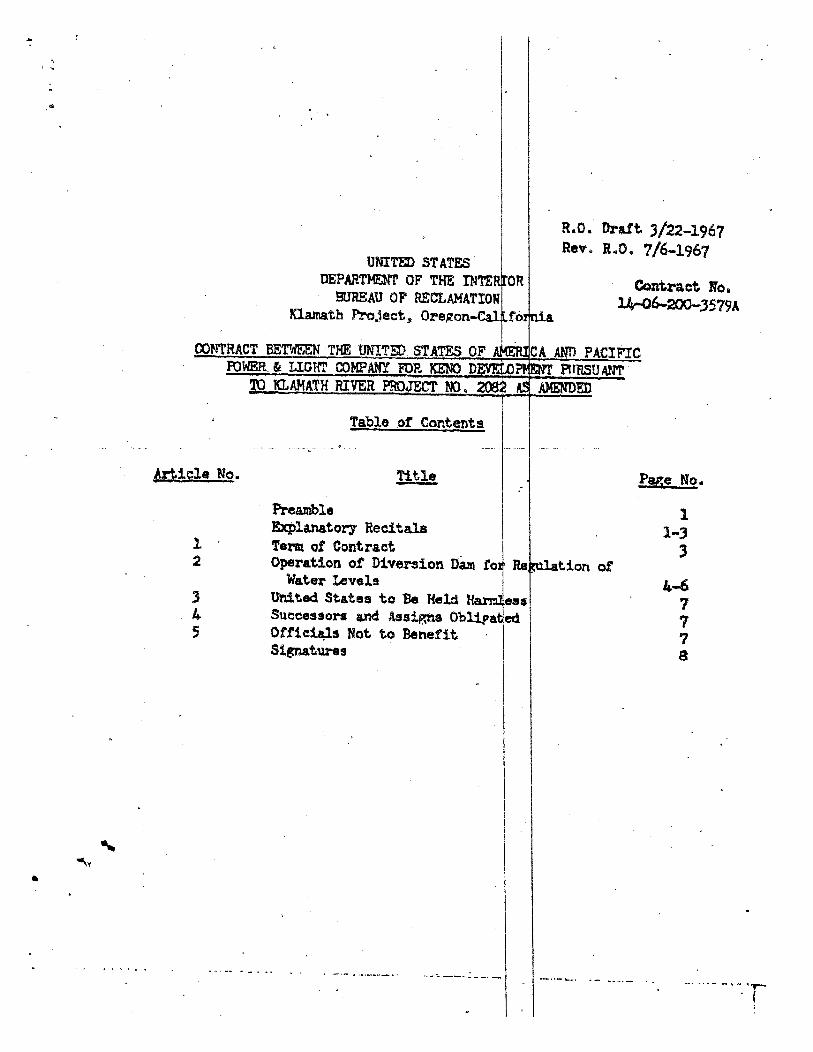


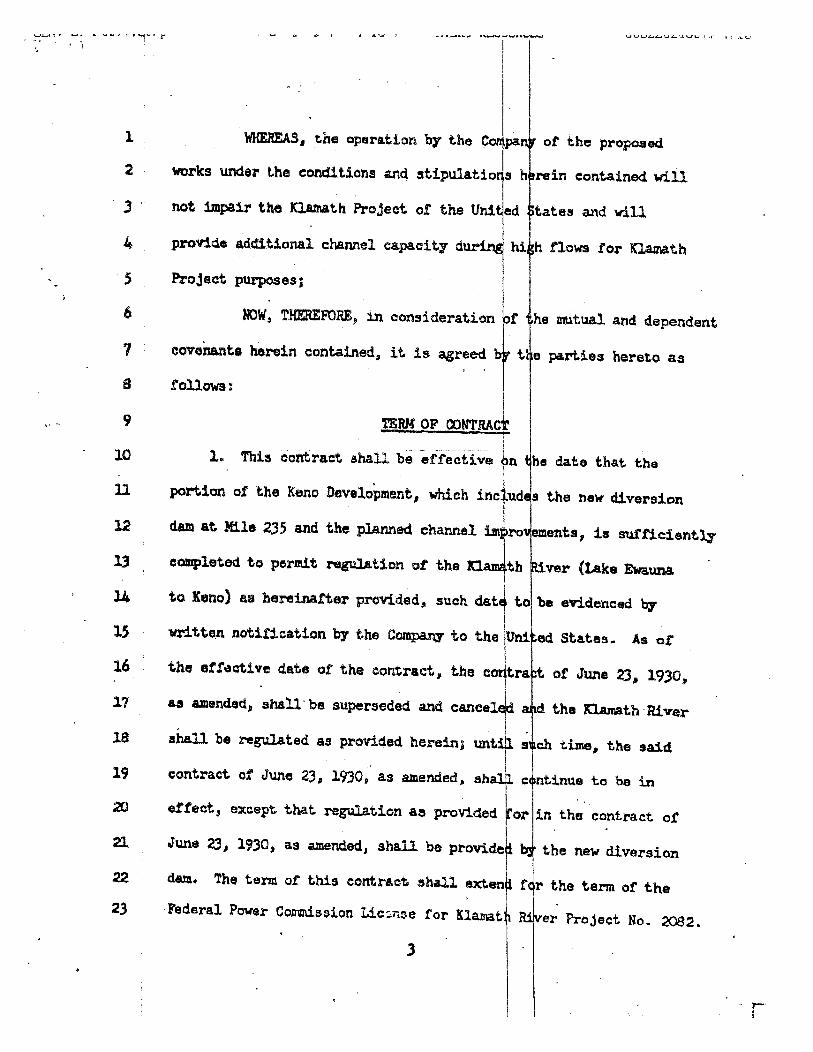


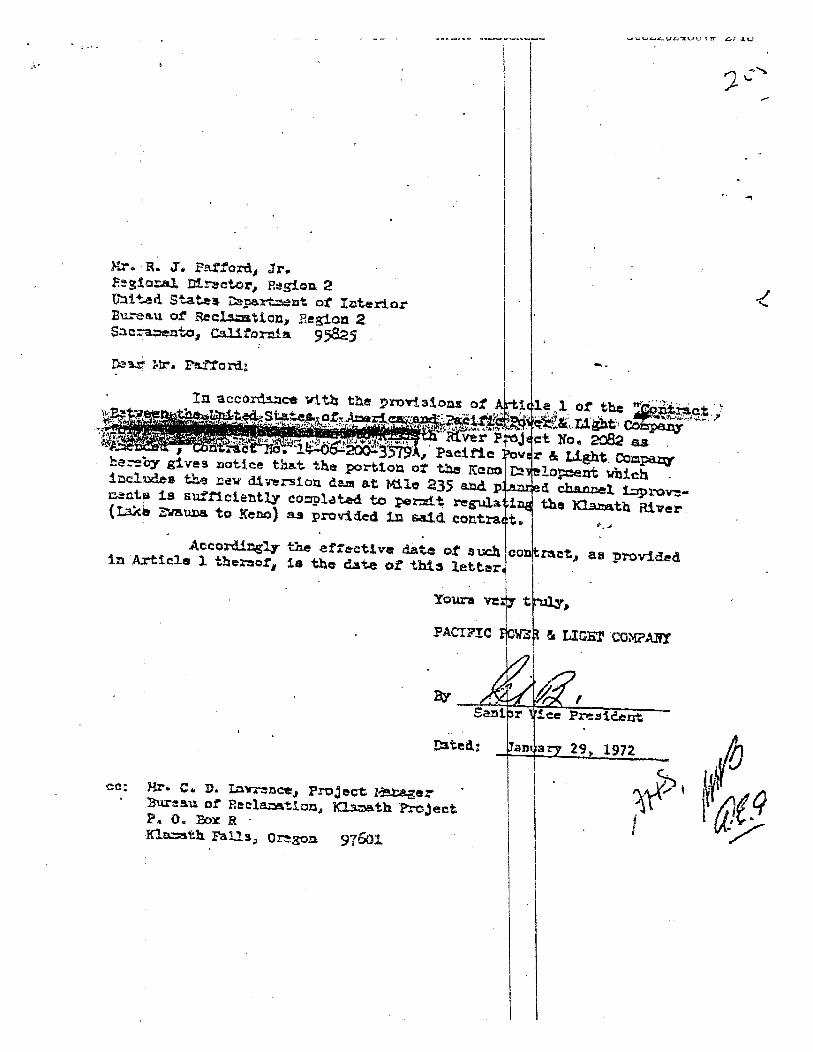
Top Related