


Languages
Pages
Legal


Jasper City Schools:
A Look at the Numbers
Dr. Martha LaCroixJasper City Schools
Administrative Retreat – 7.7.14

The Numbers
Assessments
Vision 2015
AdvancED Assist Surveys

Stakeholder Surveys – AdvancED ASSIST Portal

School Number of Respondents
Walker High School 62
Maddox Middle School 42
Memorial Park Elementary 33
T.R. Simmons Elementary 32
West Jasper Elementary 22
North Highland 3
ASSIST Staff Survey Respondents
“In progress” – No composite score yet
School Number of Respondents
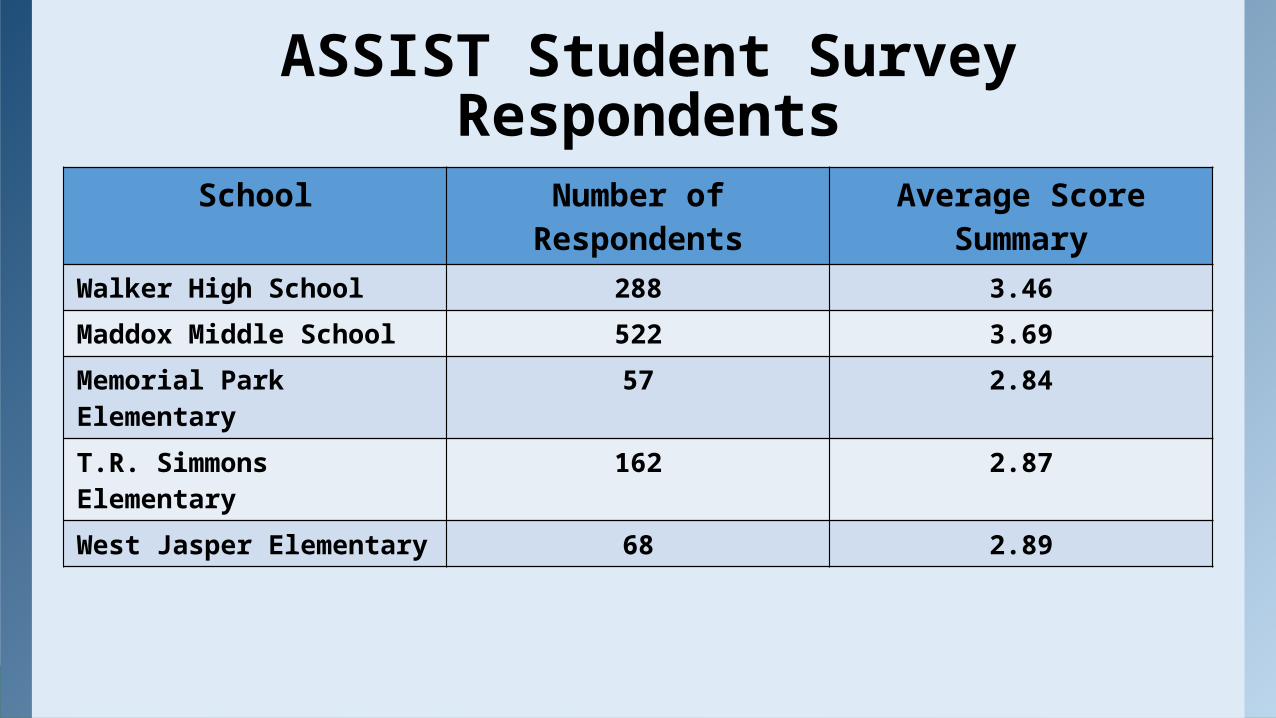
Average Score Summary
Walker High School 288 3.46
Maddox Middle School 522 3.69
Memorial Park Elementary
57 2.84
T.R. Simmons Elementary
162 2.87
West Jasper Elementary
68 2.89
ASSIST Student Survey Respondents

School Number of Respondents
Walker High School 127
Maddox Middle School 264
Memorial Park Elementary 110
T.R. Simmons Elementary 136
West Jasper Elementary 54
North Highland 4
ASSIST Parent Survey Respondents
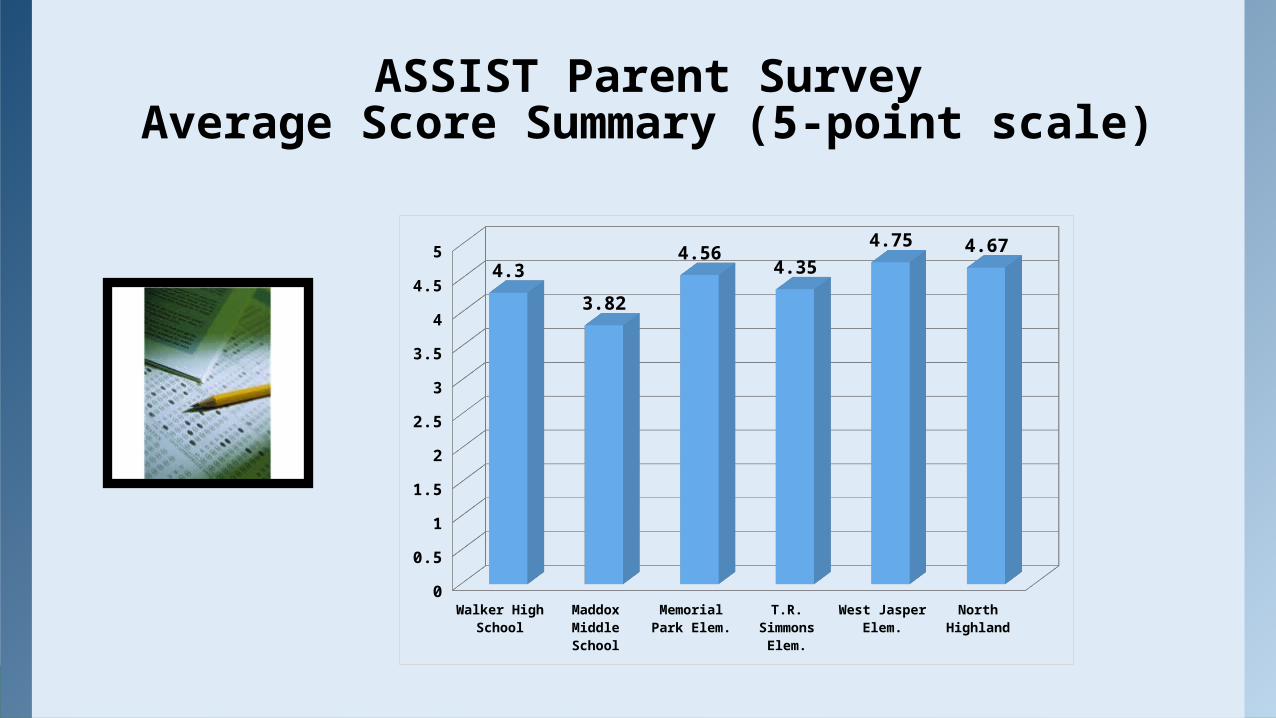
ASSIST Parent SurveyAverage Score Summary (5-point scale)
Walke
r High
Scho
ol
Mad
dox Middle
Scho
ol
Mem
orial P
ark
Elem
.
T.R. S
imm
ons Elem
.
Wes
t Jas
per E
lem
.
North
Highlan
d0
0.5
1
1.5
2
2.5
3
3.5
4
4.5
54.3
3.82
4.564.35
4.75 4.67
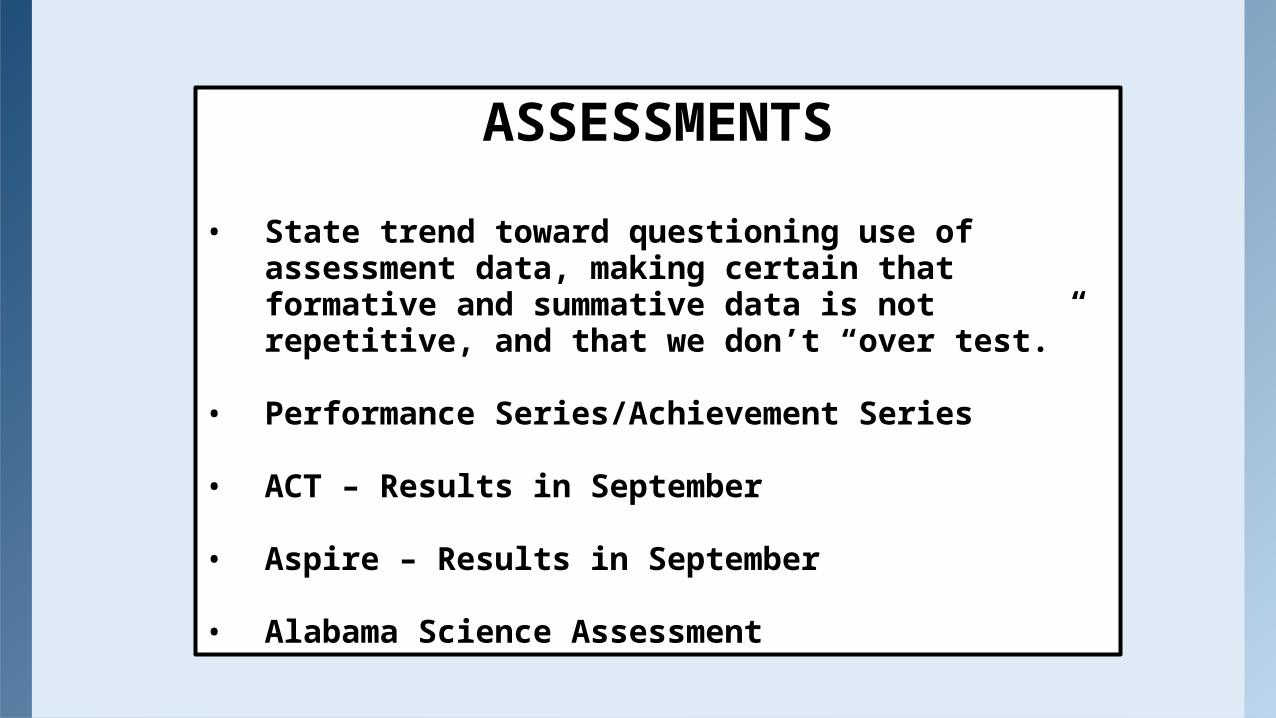
ASSESSMENTS
• State trend toward questioning use of assessment data, making certain that formative and summative data is not repetitive, and that we don’t “over test.”
• Performance Series/Achievement Series
• ACT – Results in September
• Aspire – Results in September
• Alabama Science Assessment
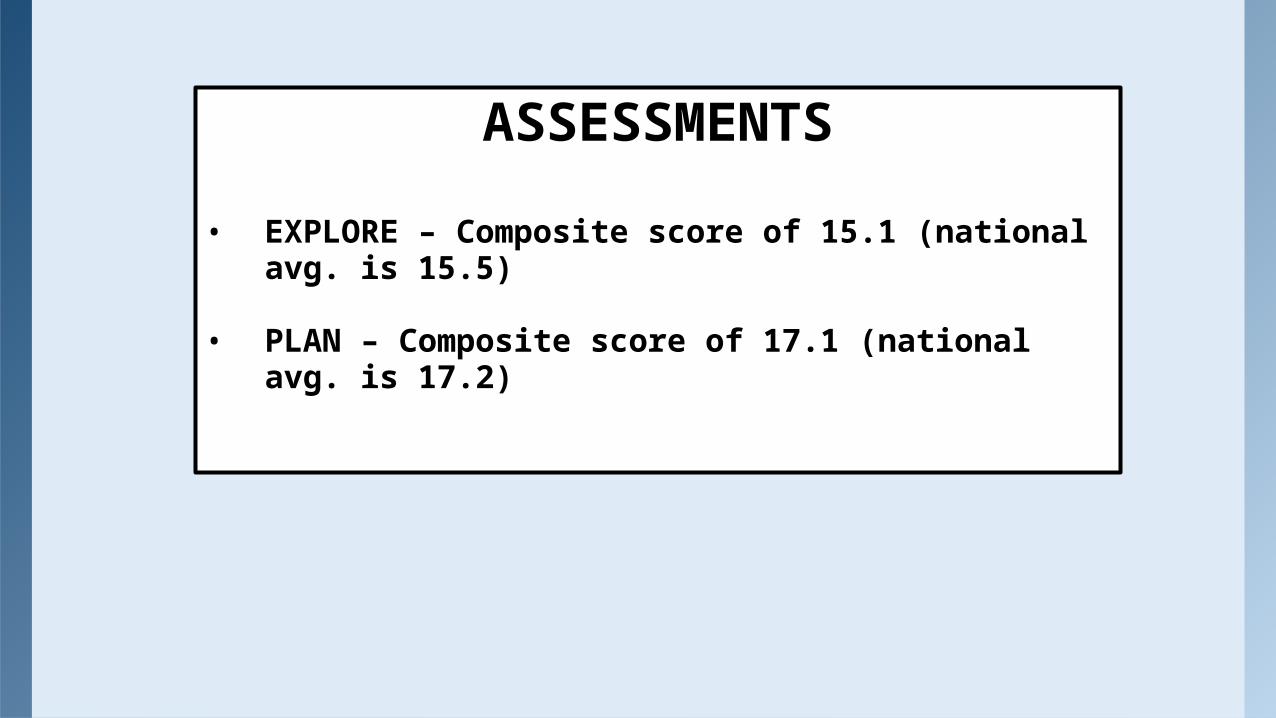
ASSESSMENTS
• EXPLORE – Composite score of 15.1 (national avg. is 15.5)
• PLAN – Composite score of 17.1 (national avg. is 17.2)
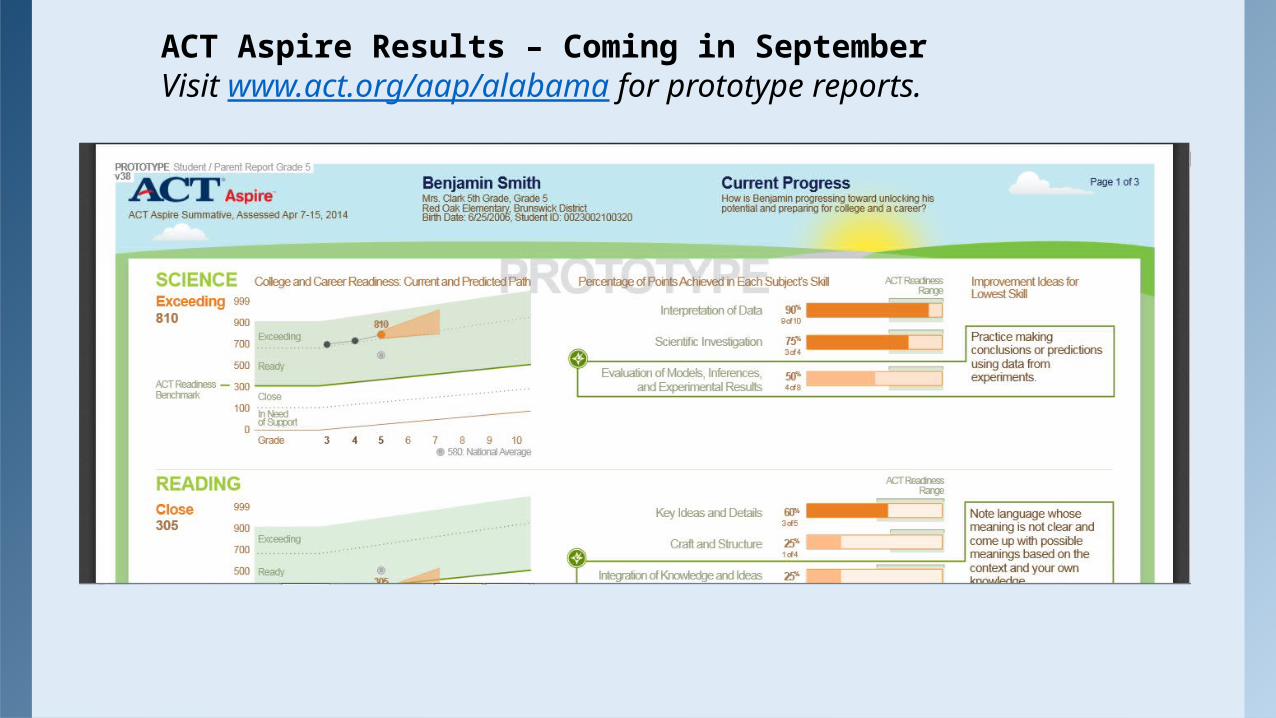
ACT Aspire Results – Coming in SeptemberVisit www.act.org/aap/alabama for prototype reports.
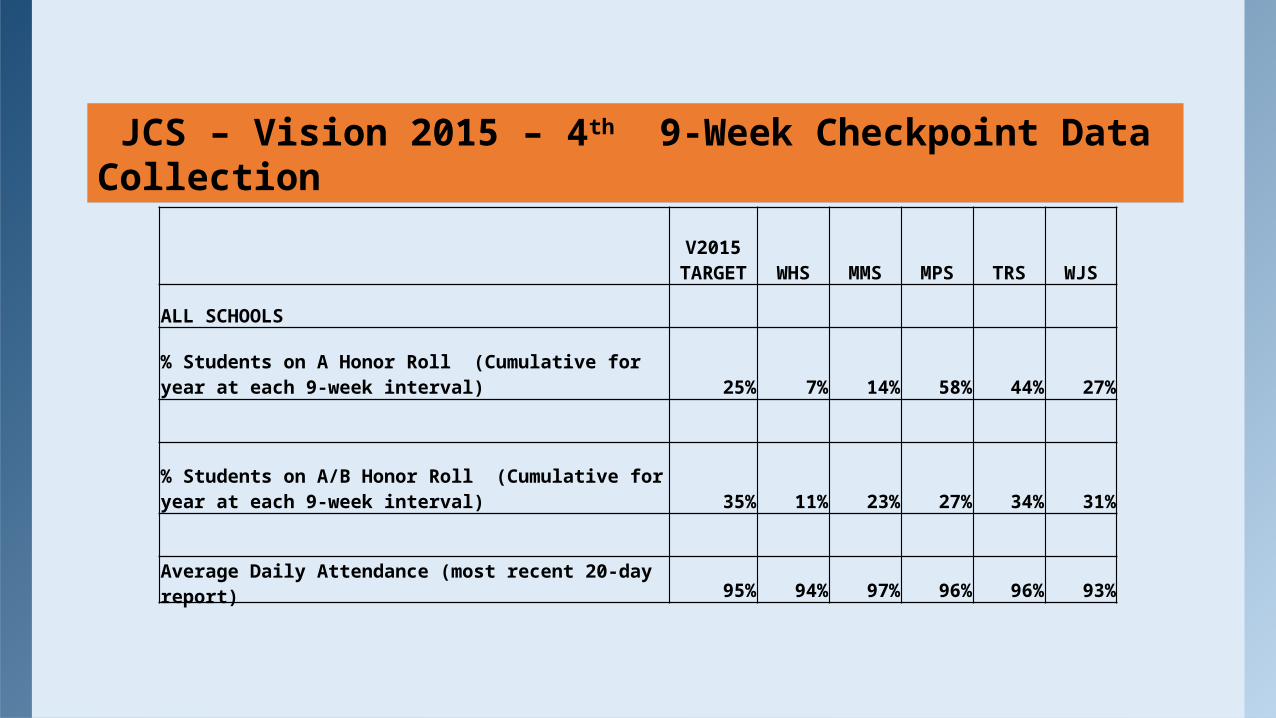
JCS – Vision 2015 – 4th 9-Week Checkpoint Data Collection
V2015
TARGET WHS MMS MPS TRS WJS
ALL SCHOOLS
% Students on A Honor Roll (Cumulative for year at each 9-week interval) 25% 7% 14% 58% 44% 27%
% Students on A/B Honor Roll (Cumulative for year at each 9-week interval) 35% 11% 23% 27% 34% 31%
Average Daily Attendance (most recent 20-day report) 95% 94% 97% 96% 96% 93%
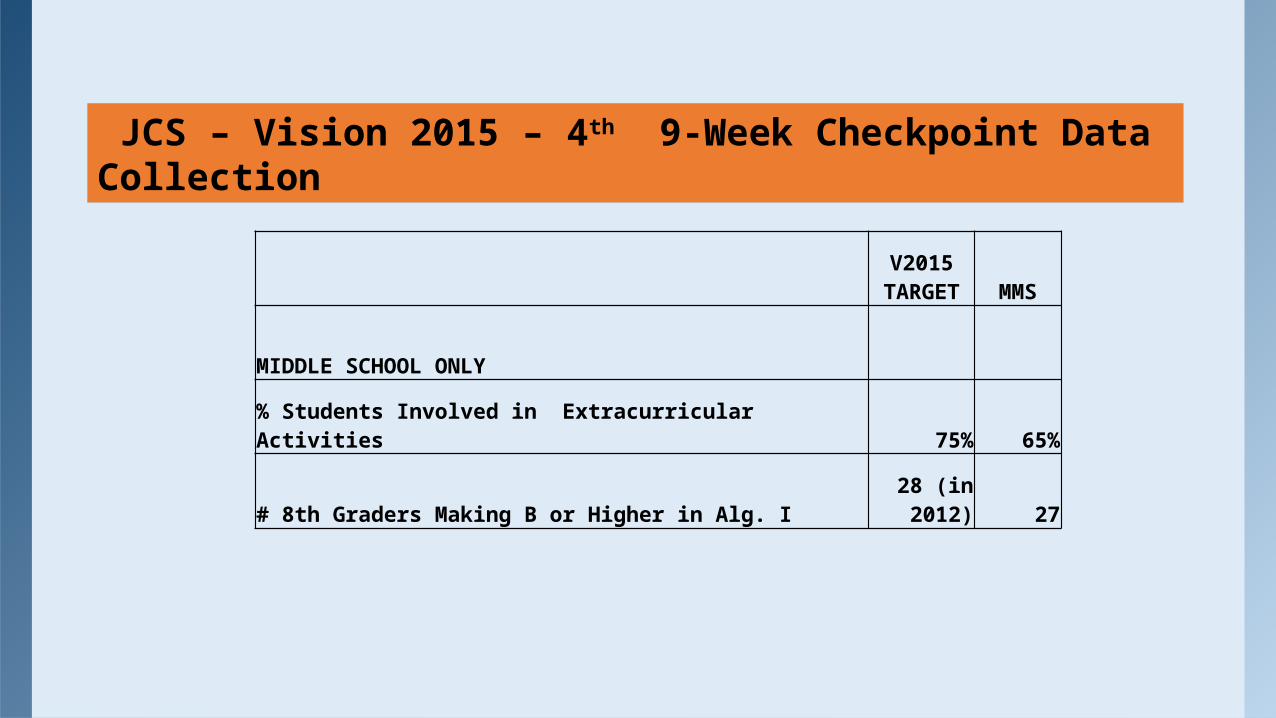
JCS – Vision 2015 – 4th 9-Week Checkpoint Data Collection
V2015
TARGET MMS
MIDDLE SCHOOL ONLY
% Students Involved in Extracurricular Activities 75% 65%
# 8th Graders Making B or Higher in Alg. I 28 (in 2012) 27
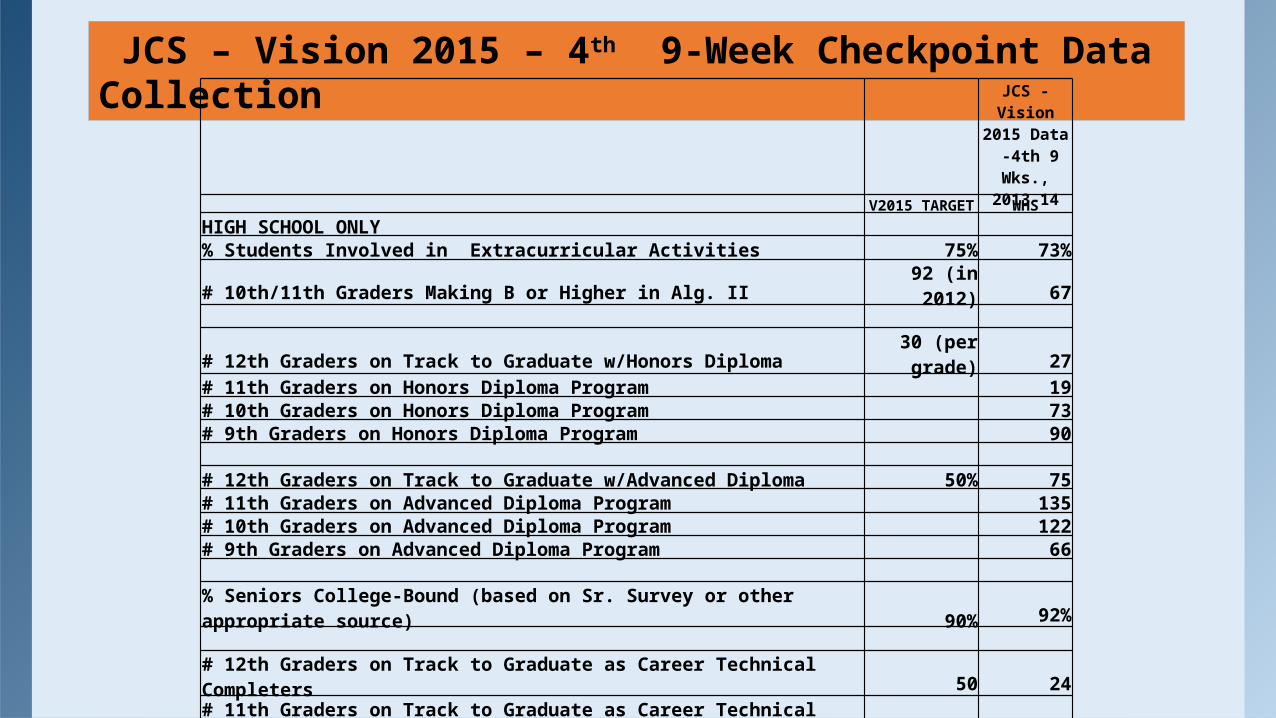
JCS – Vision 2015 – 4th 9-Week Checkpoint Data Collection
JCS - Vision 2015
Data -4th 9 Wks., 2013-14
V2015
TARGET WHS
HIGH SCHOOL ONLY % Students Involved in Extracurricular Activities 75% 73%
# 10th/11th Graders Making B or Higher in Alg. II92 (in 2012) 67
# 12th Graders on Track to Graduate w/Honors Diploma30 (per grade) 27
# 11th Graders on Honors Diploma Program 19# 10th Graders on Honors Diploma Program 73# 9th Graders on Honors Diploma Program 90 # 12th Graders on Track to Graduate w/Advanced Diploma 50% 75# 11th Graders on Advanced Diploma Program 135# 10th Graders on Advanced Diploma Program 122# 9th Graders on Advanced Diploma Program 66 % Seniors College-Bound (based on Sr. Survey or other appropriate source) 90% 92% # 12th Graders on Track to Graduate as Career Technical Completers 50 24# 11th Graders on Track to Graduate as Career Technical Completers 106# 10th Graders on Track to Graduate as Career Technical Completers 128# 9th Graders on Track to Graduate as Career Technical Completers 260
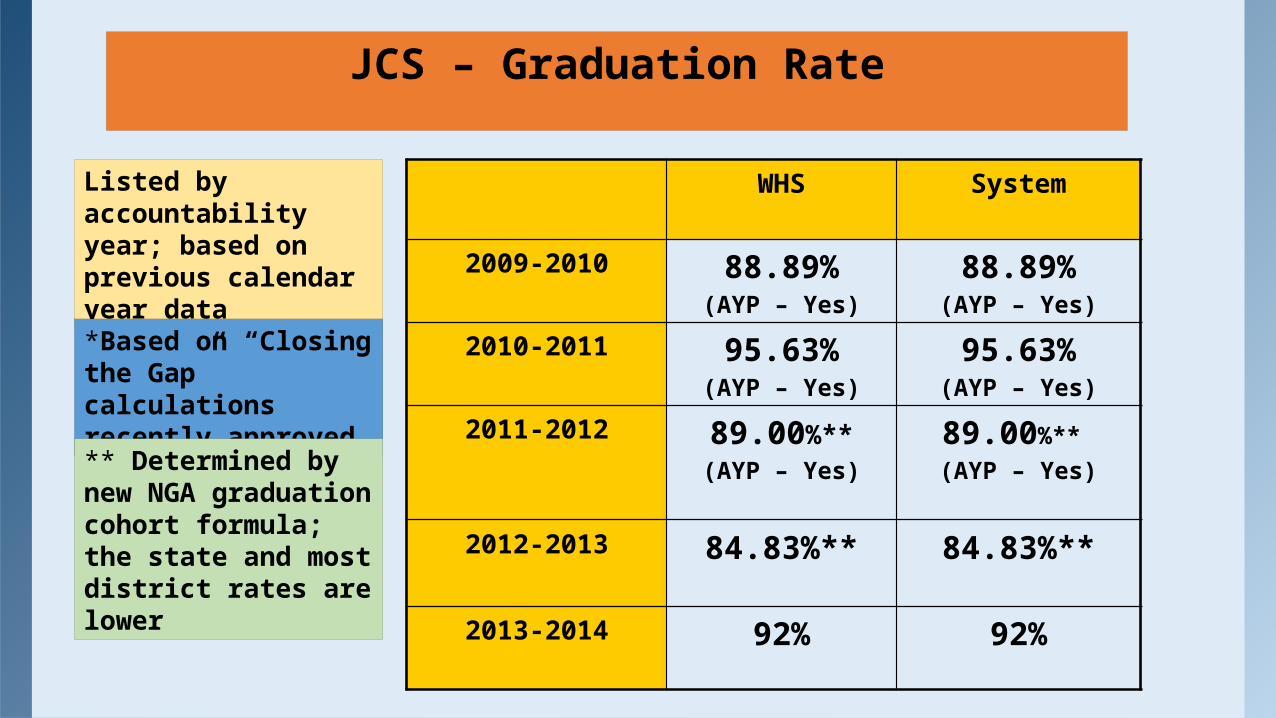
JCS – Graduation Rate
WHS System
2009-2010 88.89%(AYP – Yes)
88.89%(AYP – Yes)
2010-2011 95.63%(AYP – Yes)
95.63%(AYP – Yes)
2011-2012 89.00%**(AYP – Yes)
89.00%** (AYP – Yes)
2012-2013 84.83%** 84.83%**
2013-2014 92% 92%
Listed by accountability year; based on previous calendar year data*Based on “Closing the Gap” calculations recently approved** Determined by new NGA graduation cohort formula; the state and most district rates are lower

Thanks so much!
Top Related