


Languages
Pages
Legal


Dick Weil
Chief Executive Officer
Roger Thompson
Chief Financial Officer
Janus Henderson Group
3Q18 results presentation
Thursday 1 November 2018
For
per
sona
l use
onl
y

Roger Thompson
Chief Financial Officer
3Q18 results presentation
Business and financial update
For
per
sona
l use
onl
y

2
3Q18 highlights
• Solid investment performance
• AUM of US$378.1bn with positive
markets partially offset by net outflows
• Adjusted diluted EPS of US$0.69
• On track to achieve targeted cost
synergies of US$125 million by end of
2018 – significantly ahead of schedule
• Declared US$0.36 per share dividend
and completed US$50 million of share
buybacks
3Q18 2Q18
3 year investment
outperformance¹ 60% 64%
Net flows (US$4.3bn) (US$2.7bn)
Total AUM US$378.1bn US$370.1bn
US GAAP diluted EPS US$0.55 US$0.70
Adjusted diluted EPS² US$0.69 US$0.74
Dividend per share US$0.36 US$0.36
1 Represents percentage of AUM outperforming the relevant benchmark. Full performance disclosures detailed in the appendix on slide 22. 2 See adjusted financial measures reconciliation on slide 31 for additional information.
Key metrics – 3Q18 vs 2Q18
For
per
sona
l use
onl
y

3
Capability 1 year 3 years 5 years
Equities
Fixed Income
Quantitative
Equities
Multi-Asset
Alternatives
Total
Investment performance
Investment performance reflects ongoing weakness at Intech
75 77
87
76
66
79 79
68
84
69 64
82
63 60
81
1 year 3 years 5 years
30 Sep 2017 31 Dec 2017 31 Mar 2018
30 Jun 2018 30 Sep 2018
% of AUM outperforming benchmark
(30 Sep 2017 to 30 Sep 2018) % of AUM outperforming benchmark
(as at 30 Sep 2018)
Note: Represents percentage of AUM outperforming the relevant benchmark. Full performance disclosures detailed in the appendix on slide 22.
100%
81%
56% 61%
89%
60%
89%
99%
63%
90%
73%
94% 92% 79%
8% 21% 83%
75%
For
per
sona
l use
onl
y

4
15.6 20.9 19.4 20.2 18.3 20.0 19.7 17.1
17.7
(18.8) (23.0)
(26.4)
(21.2) (17.6)
(22.9) (22.4) (19.8) (22.0)
(3.2) (2.1) (7.0)
(1.0)
0.7
(2.9) (2.7) (2.7) (4.3)
3Q16 4Q16 1Q17 2Q17 3Q17 4Q17 1Q18 2Q18 3Q18
Total flows
Total flows
3Q16 to 3Q18 (US$bn)
20% 26% 24% 24%
(24%) (28%) (33%) (26%)
Redemptions Sales Net sales / (redemptions) Annualised gross sales¹
Annualised gross redemptions¹
Net outflows continue
22%
(25%)
21%
(20%)
21%
(24%)
18%
(21%)
19%
(24%)
Note: Data for periods prior to and including 2Q17 presents pro forma flows of JHG as if the merger had occurred at the beginning of the period shown. 1 Annualised gross sales and redemption rates calculated as a percentage of beginning period AUM.
For
per
sona
l use
onl
y

5
3Q18 flows by capability
6.8 6.0
1.3 2.2
1.4
(9.9)
(7.6)
(1.3) (1.3) (1.9) (3.1)
(1.6)
(0.0) 0.9
(0.5)
Equities Fixed Income Quantitative Equities Multi-Asset Alternatives
31% 10% 27% 31% 14%
(39%) (11%) (15%) (43%) (21%)
3Q18 flows by capability
(US$bn)
Annualised gross sales¹
Annualised gross redemptions¹
1 Annualised gross sales and redemption rates calculated as a percentage of beginning period AUM.
Redemptions Sales Net sales / (redemptions)
Outflows in Equity and Fixed Income partially offset by strong Multi-Asset inflows
For
per
sona
l use
onl
y

6
Statement of income
Note: See adjusted financial measures reconciliation on slide 30 for additional information.
US GAAP and adjusted
US GAAP Adjustments Adjusted
Revenue
Management fees 498.7
Performance fees (6.0)
Shareowner servicing fees 33.1
Other revenue 55.4
Total revenue 581.2 (112.3) 468.9
Operating expenses
Employee compensation and benefits 159.5
Long-term incentive plans 61.1
Distribution expenses 112.3
Investment administration 12.2
Marketing 7.1
General, administrative and occupancy 59.9
Depreciation and amortisation 20.8
Total operating expenses 432.9 (144.5) 288.4
Operating income 148.3 32.2 180.5
US$m3 months ended 30 Sep 2018
For
per
sona
l use
onl
y

7
US$, except margin data 3Q18 2Q18 Change
3Q18 vs 2Q18
3Q17 Change
3Q18 vs 3Q17
Average AUM 376.8bn 369.1bn 2% 352.7bn 7%
Total revenue 581.2m 592.4m (2%) 566.9m 3%
Operating income 148.3m 175.3m (15%) 138.2m 7%
Operating margin 25.5% 29.6% (4.1ppt) 24.4% 1.1ppt
US GAAP diluted EPS 0.55 0.70 (21%) 0.49 12%
Adjusted revenue 468.9m 477.7m (2%) 454.6m 3%
Adjusted operating income 180.5m 191.4m (6%) 168.4m 7%
Adjusted operating margin 38.5% 40.1% (1.6ppt) 37.0% 1.5ppt
Adjusted diluted EPS 0.69 0.74 (7%) 0.56 23%
Financial highlights
Summary of results
Note: 3Q17 numbers updated to reflect the adoption of the new revenue recognition standard, with a reconciliation shown on slide 33. See adjusted financial measures
reconciliation on slides 30 and 31 for additional information.
US GAAP and adjusted
For
per
sona
l use
onl
y

8
3Q18 adjusted revenue drivers
• Slight increase in management fees driven by
higher average AUM
• Performance fees declined from 2Q18 driven by
seasonality and a decline in mutual fund
performance fees
Revenue
3Q18 adjusted revenue decreased, driven by lower performance fees
Adjusted revenue – 2Q18 vs 3Q18
(US$m)
Note: See adjusted financial measures reconciliation on slide 30 for additional
information. 1 Net margin based on management fees net of distribution expenses.
US$m, except margin data 3Q18 2Q18 Change
Total adjusted revenue 468.9 477.7 (2%)
Management fees 498.7 493.5 1%
Performance fees (6.0) 13.5 nm
Shareowner servicing fees 33.1 31.8 4%
Other revenue 55.4 53.6 3%
Distribution expenses (112.3) (114.7) 2%
Average net¹ mgmt fee margin 44.1bps 44.7bps (0.6bps)498.7 493.5
(6.0)
13.5 33.1 31.8 55.4 53.6
(112.3)(114.7)
468.9 477.7
3Q182Q18
Management fees Performance fees
Shareowner servicing fees Other revenue
Distribution expenses
For
per
sona
l use
onl
y

9
288.4
(3.4) (2.6) (0.4)
286.3
6.4
1.2 0.9
2Q18 Compensationand benefits
LT incentiveplans
Investmentadministration
Marketing General, admin.and occupancy
Depreciation andamortisation
3Q18
Adjusted operating expenses – 2Q18 vs 3Q18
(US$m)
Operating expenses
Note: See adjusted financial measures reconciliation on slide 30 for additional information.
US$m 3Q18
US GAAP
Adjustments 3Q18
adjusted
2Q18
adjusted
Change
3Q18 adjusted
vs 2Q18 adjusted
Employee compensation and benefits 159.5 (8.1) 151.4 145.0 4%
Long-term incentive plans 61.1 (10.0) 51.1 54.5 (6%)
Total compensation expenses 220.6 (18.1) 202.5 199.5 2%
Distribution expenses 112.3 (112.3) – – nm
Investment administration 12.2 – 12.2 11.0 11%
Marketing 7.1 – 7.1 9.7 (27%)
General, administrative and occupancy 59.9 (1.3) 58.6 57.7 2%
Depreciation and amortisation 20.8 (12.8) 8.0 8.4 (5%)
Non-staff operating expenses 212.3 (126.4) 85.9 86.8 (1%)
Total operating expenses 432.9 (144.5) 288.4 286.3 1%
For
per
sona
l use
onl
y
10
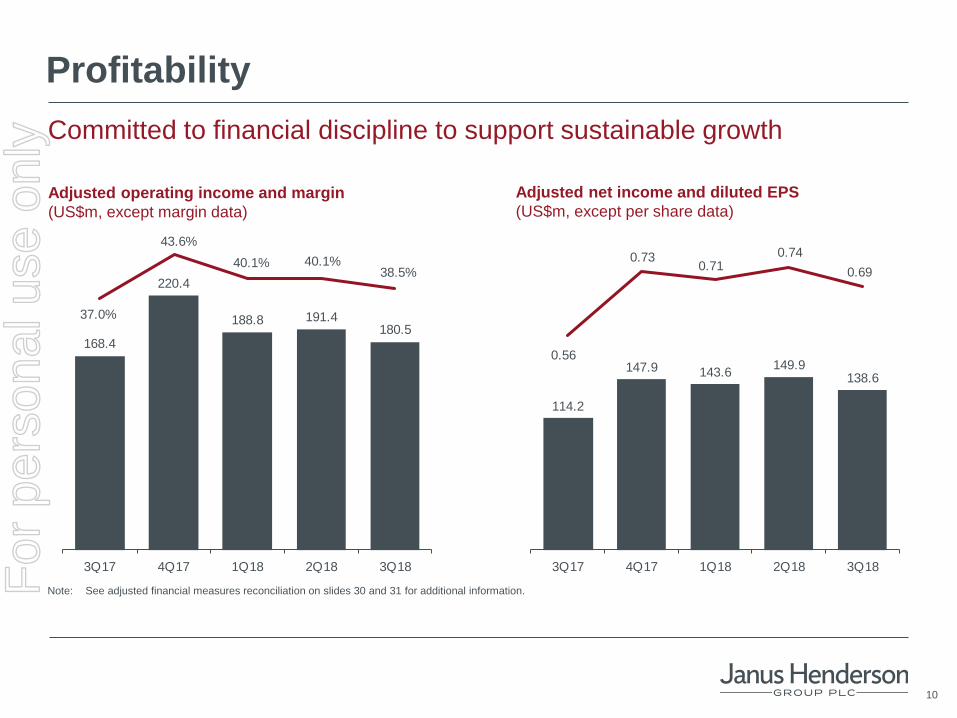
Profitability
Committed to financial discipline to support sustainable growth
Adjusted operating income and margin
(US$m, except margin data)
Adjusted net income and diluted EPS
(US$m, except per share data)
Note: See adjusted financial measures reconciliation on slides 30 and 31 for additional information.
168.4
220.4
188.8 191.4180.5
37.0%
43.6%
40.1% 40.1% 38.5%
3Q17 4Q17 1Q18 2Q18 3Q18
114.2
147.9 143.6149.9
138.6
0.56
0.73 0.71
0.74
0.69
3Q17 4Q17 1Q18 2Q18 3Q18For
per
sona
l use
onl
y

11
Returning capital to shareholders
Delivering on the capital return plan we previously articulated
The results: What we previously told you:
• “As we close the merger there will be a
period of elevated demand for cash in the
near-term to cover deal and integration
costs”
• “The 2018 Convertible Notes were available
for holders to convert early and we settled
all conversions in cash”
• “Bonus payments in 1Q 2018 result in a
seasonal drawdown on our cash balance,
after which the firm will generate positive
cash flow”
• “Once we begin generating excess cash,
we will evaluate, and balance, the ongoing
investments the business requires with
external opportunities we see, including
returning excess capital to shareholders”
US$m 2017 YTD 2018
Deal and integration
costs 172 32
2018 Convertible
Notes repayment 93 95
Dividends1 256 277
Share buyback – 50
TOTAL 521 454
With deal and integration costs winding
down and the repayment of the convertible
note complete, there are fewer demands on
cash going forward
1 Reflects an estimated US$71m of dividends (shares receiving dividends to be determined on record date) declared by the Board on 31 October 2018 that will be paid on 30
November 2018 to shareholders of record at the close of business on 12 November 2018.
For
per
sona
l use
onl
y

Q&A
For
per
sona
l use
onl
y

Appendix
For
per
sona
l use
onl
y

14
53%
20%
14%
9% 4%
Equities
Fixed Income
Quantitative Equities
Multi-Asset
Alternatives
Assets under management as at 30 Sep 2018
17%
44%
39%
Self-directed
Intermediary
Institutional
53%
31%
16%
North America
EMEA & LatAm
Asia Pacific
By client type By capability By client location
US$199.2bn
US$74.5bn
US$52.9bn
US$34.6bn
US$16.9bn
US$66.1bn
US$166.4bn
US$145.6bn
US$202.5bn
US$115.8bn
US$59.8bn
AUM: US$378.1bn
For
per
sona
l use
onl
y

15
Investment management capabilities
Diversified product range
Equities
US$199.2bn
AUM
30 Sep 2018
US$378.1bn
Fixed Income
US$74.5bn
Multi-Asset
US$34.6bn
Self-directed
Intermediary
Institutional
Institutional
Institutional
Quantitative Equities
US$52.9bn
Equities • Diverse business encompassing a wide range of
geographic and investment styles
Fixed Income • Coverage across the asset class, with an
increasingly global offering
Quantitative Equities • Intech applies advanced mathematical and
systematic portfolio rebalancing intended to
harness the volatility of stock price movements
Multi-Asset • Retail and Institutional offering through a
diversity of strategies
Alternatives • Expertise in liquid alternatives alongside
traditional hedge funds
Alternatives
US$16.9bn
For
per
sona
l use
onl
y

16
AUM by investment capability as at 30 Sep 2018
0%
100%
Equities Fixed Income Quantitative Equities Multi-Asset Alternatives
US$16.9bn US$34.6bn US$199.2bn US$52.9bn US$74.5bn
Specialist
Global Equities
US Equities
European Equities
Asia Pacific Equities
Relative risk
Absolute risk
Regio
nal
Enhanced index
US
Fixed Income
Australian
Fixed Income
Corporate credit
Global bonds
Regio
nal
Long/short equity
Property
Absolute return
Strategic Fixed Inc.
Unconstrained Structured debt
Commodities/Agri.
Balanced
Other¹
1 Other primarily includes Absolute Return Bond and Multi-Strategy.
Investment management capabilities
Balanced range of offerings
Multi-Asset
Asset Allocation
For
per
sona
l use
onl
y
17
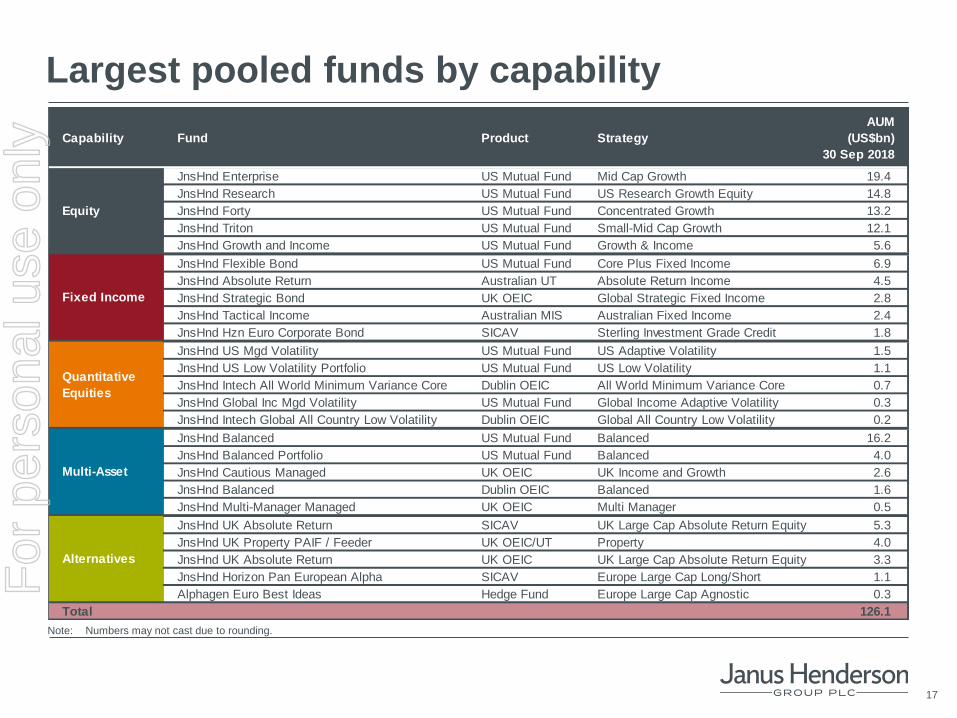
Largest pooled funds by capability
Capability Fund Product Strategy
AUM
(US$bn)
30 Sep 2018
JnsHnd Enterprise US Mutual Fund Mid Cap Growth 19.4
JnsHnd Research US Mutual Fund US Research Growth Equity 14.8
JnsHnd Forty US Mutual Fund Concentrated Growth 13.2
JnsHnd Triton US Mutual Fund Small-Mid Cap Growth 12.1
JnsHnd Growth and Income US Mutual Fund Growth & Income 5.6
JnsHnd Flexible Bond US Mutual Fund Core Plus Fixed Income 6.9
JnsHnd Absolute Return Australian UT Absolute Return Income 4.5
JnsHnd Strategic Bond UK OEIC Global Strategic Fixed Income 2.8
JnsHnd Tactical Income Australian MIS Australian Fixed Income 2.4
JnsHnd Hzn Euro Corporate Bond SICAV Sterling Investment Grade Credit 1.8
JnsHnd US Mgd Volatility US Mutual Fund US Adaptive Volatility 1.5
JnsHnd US Low Volatility Portfolio US Mutual Fund US Low Volatility 1.1
JnsHnd Intech All World Minimum Variance Core Dublin OEIC All World Minimum Variance Core 0.7
JnsHnd Global Inc Mgd Volatility US Mutual Fund Global Income Adaptive Volatility 0.3
JnsHnd Intech Global All Country Low Volatility Dublin OEIC Global All Country Low Volatility 0.2
JnsHnd Balanced US Mutual Fund Balanced 16.2
JnsHnd Balanced Portfolio US Mutual Fund Balanced 4.0
JnsHnd Cautious Managed UK OEIC UK Income and Growth 2.6
JnsHnd Balanced Dublin OEIC Balanced 1.6
JnsHnd Multi-Manager Managed UK OEIC Multi Manager 0.5
JnsHnd UK Absolute Return SICAV UK Large Cap Absolute Return Equity 5.3
JnsHnd UK Property PAIF / Feeder UK OEIC/UT Property 4.0
JnsHnd UK Absolute Return UK OEIC UK Large Cap Absolute Return Equity 3.3
JnsHnd Horizon Pan European Alpha SICAV Europe Large Cap Long/Short 1.1
Alphagen Euro Best Ideas Hedge Fund Europe Large Cap Agnostic 0.3
Total 126.1
Equity
Fixed Income
Multi-Asset
Alternatives
Quantitative
Equities
Note: Numbers may not cast due to rounding.
For
per
sona
l use
onl
y

18
Flows: Equities and Fixed Income
9.6 10.8 9.9 8.5
6.8
(9.0)
(11.5) (11.7)
(9.6) (9.9)
0.6
(0.7) (1.8) (1.1) (3.1)
3Q17 4Q17 1Q18 2Q18 3Q18
5.3 5.2 5.3 5.0 6.0
(4.9) (5.0) (5.6) (5.6) (7.6)
0.4 0.2
(0.3) (0.6) (1.6)
3Q17 4Q17 1Q18 2Q18 3Q18
Equities (US$bn) Fixed Income (US$bn)
22%
(21%)
27%
(25%)
Redemptions Sales Net sales / (redemptions)
1 Annualised gross sales and redemption rates calculated as a percentage of beginning period AUM.
Annualised gross sales¹
Annualised gross redemptions¹
24%
(25%)
26%
(25%)
21%
(25%)
26%
(28%)
18% 25%
(20%) (28%)
14%
(21%)
31%
(39%)
For
per
sona
l use
onl
y

19
0.9 1.1 1.3 1.8
2.2
(1.2) (1.3) (1.2) (1.3) (1.3)
(0.3) (0.2)
0.1 0.5
0.9
3Q17 4Q17 1Q18 2Q18 3Q18
0.7 0.7
1.7
0.4 1.3
(1.2)
(2.3)
(1.4) (1.2) (1.3)
(0.5)
(1.6)
0.3
(0.8) (0.0)
3Q17 4Q17 1Q18 2Q18 3Q18
1.8 2.2 1.5 1.4 1.4
(1.3)
(2.8) (2.5) (2.1) (1.9)
0.5
(0.6) (1.0) (0.7) (0.5)
3Q17 4Q17 1Q18 2Q18 3Q18
Flows: Quantitative Equities, Multi-Asset and Alternatives
Quantitative Equities (US$bn) Multi-Asset (US$bn) Alternatives (US$bn)
6%
(29%) (16%) (10%)
Annualised gross sales¹
Annualised gross redemptions¹
Redemptions Sales Net sales / (redemptions)
6%
(19%) (17%)
13% 14% 38%
(56%)
45% 13%
(11%) (15%)
16%
(51%)
31% 30% 22% 3%
(44%) (16%) (10%)
10%
(11%)
27%
(15%)
31%
(43%)
1 Annualised gross sales and redemption rates calculated as a percentage of beginning period AUM. For
per
sona
l use
onl
y
20
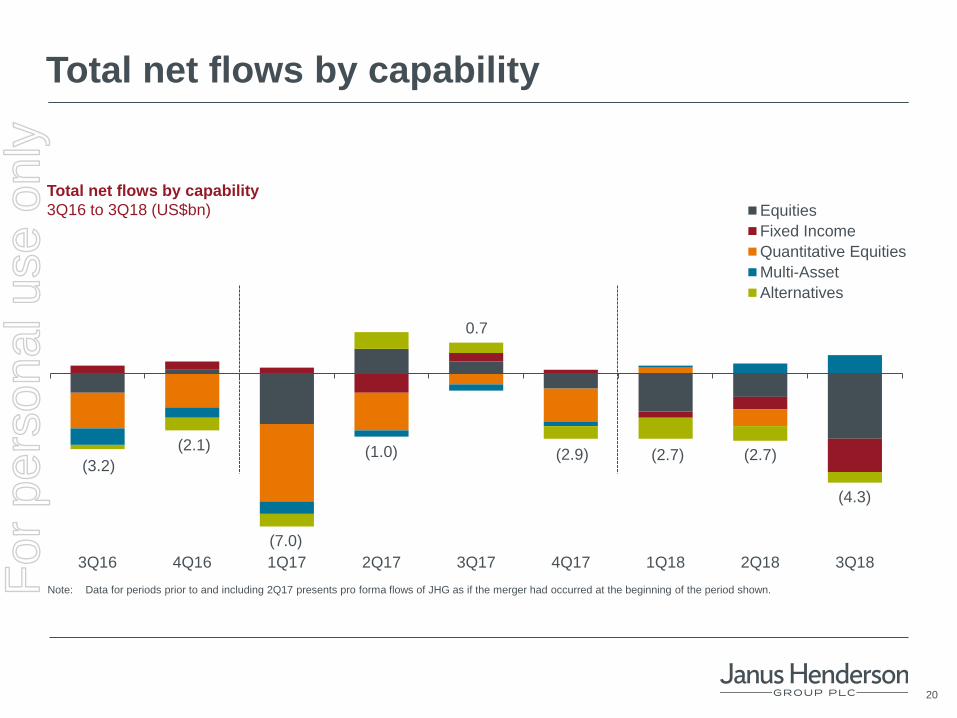
Total net flows by capability
3Q16 4Q16 1Q17 2Q17 3Q17 4Q17 1Q18 2Q18 3Q18
Equities
Fixed Income
Quantitative Equities
Multi-Asset
Alternatives
(3.2)
(2.1)
(7.0)
(1.0)
Total net flows by capability
3Q16 to 3Q18 (US$bn)
Note: Data for periods prior to and including 2Q17 presents pro forma flows of JHG as if the merger had occurred at the beginning of the period shown.
0.7
(2.9) (2.7) (2.7)
(4.3)
For
per
sona
l use
onl
y
21
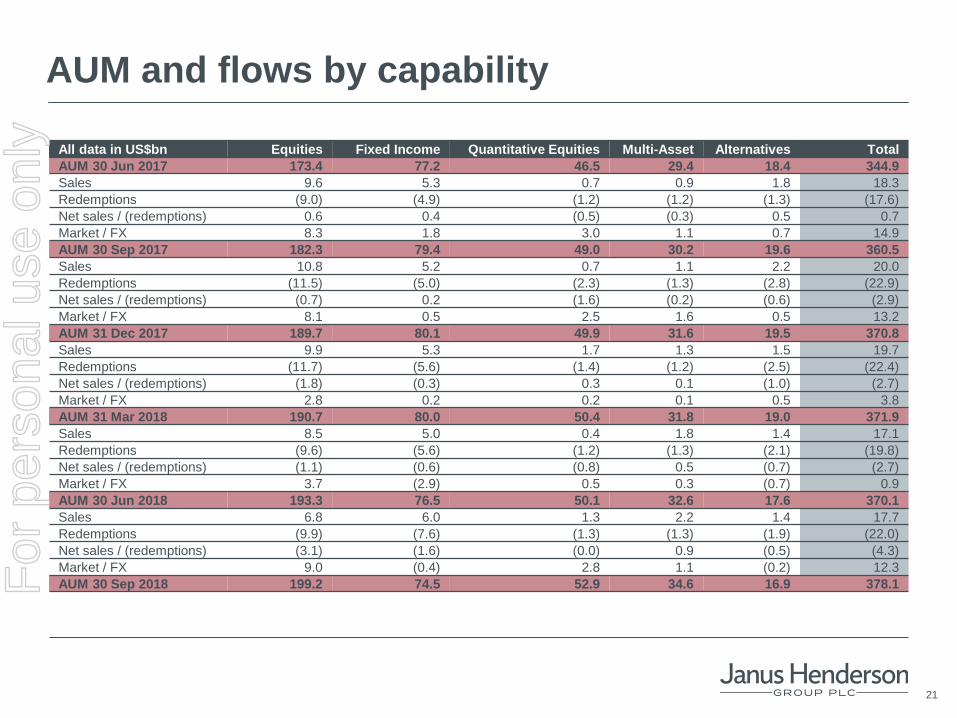
AUM and flows by capability
All data in US$bn Equities Fixed Income Quantitative Equities Multi-Asset Alternatives Total
AUM 30 Jun 2017 173.4 77.2 46.5 29.4 18.4 344.9
Sales 9.6 5.3 0.7 0.9 1.8 18.3
Redemptions (9.0) (4.9) (1.2) (1.2) (1.3) (17.6)
Net sales / (redemptions) 0.6 0.4 (0.5) (0.3) 0.5 0.7
Market / FX 8.3 1.8 3.0 1.1 0.7 14.9
AUM 30 Sep 2017 182.3 79.4 49.0 30.2 19.6 360.5
Sales 10.8 5.2 0.7 1.1 2.2 20.0
Redemptions (11.5) (5.0) (2.3) (1.3) (2.8) (22.9)
Net sales / (redemptions) (0.7) 0.2 (1.6) (0.2) (0.6) (2.9)
Market / FX 8.1 0.5 2.5 1.6 0.5 13.2
AUM 31 Dec 2017 189.7 80.1 49.9 31.6 19.5 370.8
Sales 9.9 5.3 1.7 1.3 1.5 19.7
Redemptions (11.7) (5.6) (1.4) (1.2) (2.5) (22.4)
Net sales / (redemptions) (1.8) (0.3) 0.3 0.1 (1.0) (2.7)
Market / FX 2.8 0.2 0.2 0.1 0.5 3.8
AUM 31 Mar 2018 190.7 80.0 50.4 31.8 19.0 371.9
Sales 8.5 5.0 0.4 1.8 1.4 17.1
Redemptions (9.6) (5.6) (1.2) (1.3) (2.1) (19.8)
Net sales / (redemptions) (1.1) (0.6) (0.8) 0.5 (0.7) (2.7)
Market / FX 3.7 (2.9) 0.5 0.3 (0.7) 0.9
AUM 30 Jun 2018 193.3 76.5 50.1 32.6 17.6 370.1
Sales 6.8 6.0 1.3 2.2 1.4 17.7
Redemptions (9.9) (7.6) (1.3) (1.3) (1.9) (22.0)
Net sales / (redemptions) (3.1) (1.6) (0.0) 0.9 (0.5) (4.3)
Market / FX 9.0 (0.4) 2.8 1.1 (0.2) 12.3
AUM 30 Sep 2018 199.2 74.5 52.9 34.6 16.9 378.1 For
per
sona
l use
onl
y

22
Investment performance
% of AUM outperforming benchmark
Note: Outperformance is measured based on composite performance gross of fees vs primary benchmark, except where a strategy has no benchmark index or corresponding
composite in which case the most relevant metric is used: (1) composite gross of fees vs zero for absolute return strategies, (2) fund net of fees vs primary index or (3) fund
net of fees vs Morningstar peer group average or median. Non-discretionary and separately managed account assets are included with a corresponding composite where
applicable.
Cash management vehicles, ETFs, Managed CDOs, Private Equity funds and custom non-discretionary accounts with no corresponding composite are excluded from the analysis.
Excluded assets represent 3% of AUM as at 30 Sep 2017 and 31 Dec 2017 and 4% of AUM as at 31 Mar 2018, 30 Jun 2018, 30 Sep 2018. Capabilities defined by Janus
Henderson.
1yr 3yr 5yr 1yr 3yr 5yr 1yr 3yr 5yr 1yr 3yr 5yr 1yr 3yr 5yr
Equities 61% 73% 82% 64% 60% 67% 68% 59% 76% 63% 58% 73% 61% 56% 75%
Fixed Income 92% 91% 97% 93% 95% 98% 96% 96% 97% 87% 93% 98% 79% 92% 94%
Quantitative Equities 85% 61% 87% 90% 27% 87% 91% 46% 88% 47% 25% 87% 21% 8% 83%
Multi-Asset 95% 87% 90% 86% 87% 89% 83% 87% 90% 90% 88% 90% 89% 89% 90%
Alternatives 91% 100% 100% 93% 76% 100% 95% 76% 100% 99% 73% 100% 99% 73% 100%
Total 75% 77% 87% 76% 66% 79% 79% 68% 84% 69% 64% 82% 63% 60% 81%
Capability3Q17 4Q17 1Q18 2Q18 3Q18
For
per
sona
l use
onl
y

23
Mutual fund investment performance
% of mutual fund AUM in top 2 Morningstar quartiles
Note: Includes Janus Investment Fund, Janus Aspen Series and Clayton Street Trust (US Trusts), Janus Henderson Capital Funds (Dublin based), Dublin and UK OEIC and
Investment Trusts, Luxembourg SICAVs and Australian Managed Investment Schemes. The top two Morningstar quartiles represent funds in the top half of their category
based on total return. On an asset-weighted basis, 82%, 73%, 67%, 74% and 84% of total mutual fund AUM were in the top 2 Morningstar quartiles for the 10-year periods
ended 30 Sep 2017, 31 Dec 2017, 31 Mar 2018, 30 Jun 2018 and 30 Sep 2018 respectively. For the 1-, 3-, 5- and 10-year periods ending 30 Sep 2018, 55%, 50%, 60%
and 64% of the 214, 202, 181 and 145 total mutual funds, respectively, were in the top 2 Morningstar quartiles.
Analysis based on “primary” share class (Class I Shares, Institutional Shares or share class with longest history for US Trusts; Class A Shares or share class with longest history for
Dublin based; primary share class as defined by Morningstar for other funds). Performance may vary by share class.
ETFs and funds not ranked by Morningstar are excluded from the analysis. Capabilities defined by Janus Henderson. © 2018 Morningstar, Inc. All Rights Reserved.
1yr 3yr 5yr 1yr 3yr 5yr 1yr 3yr 5yr 1yr 3yr 5yr 1yr 3yr 5yr
Equities 56% 71% 88% 63% 59% 87% 64% 62% 82% 56% 61% 75% 72% 65% 86%
Fixed Income 81% 49% 98% 43% 36% 87% 48% 32% 62% 42% 38% 42% 63% 36% 66%
Quantitative Equities 7% 97% 48% 24% 64% 50% 57% 55% 51% 58% 54% 53% 59% 5% 55%
Multi-Asset 83% 81% 83% 82% 83% 84% 84% 82% 83% 92% 83% 83% 86% 88% 88%
Alternatives 38% 25% 32% 59% 25% 32% 53% 53% 53% 92% 25% 25% 54% 26% 53%
Total 61% 66% 85% 61% 56% 82% 63% 59% 76% 60% 57% 68% 71% 60% 81%
3Q18Capability
3Q17 4Q17 1Q18 2Q18
For
per
sona
l use
onl
y

24
Mutual fund investment performance (cont’d)
Group
30 30 36
23 21
42 41 40 40 35
49 44 47 51 50
31 31 27
37 50
24 15 19 17 26
36 38 29 17
31 61 61 63 60
71 66
56 59 57
60
85 82
76
68
81
3Q
17
4Q
17
1Q
18
2Q
18
3Q
18
3Q
17
4Q
17
1Q
18
2Q
18
3Q
18
3Q
17
4Q
17
1Q
18
2Q
18
3Q
18
% of mutual fund AUM in top 2 Morningstar quartiles
Equities
25 31 35
14 11
45 43 42 43 34
52 47
53 57 55
31
32 29
42
61
26
16 20 18 31
36 40 29 18
31
56
63 64
56
72 71
59 62 61
65
88 87 82
75
86
3Q
17
4Q
17
1Q
18
2Q
18
3Q
18
3Q
17
4Q
17
1Q
18
2Q
18
3Q
18
3Q
17
4Q
17
1Q
18
2Q
18
3Q
18
1 year 3 year 5 year 1 year 3 year 5 year
Note: Full performance disclosures detailed on slide 23.
2nd quartile
1st quartile
For
per
sona
l use
onl
y

25
3
57
38 42
9
38
3 5 4 4
24
20 17
88
64 55
16
2
43 50 47 53 55
7
24
57 58 59
97
64
55 54
5
48 50 51 53 55
3Q
17
4Q
17
1Q
18
2Q
18
3Q
18
3Q
17
4Q
17
1Q
18
2Q
18
3Q
18
3Q
17
4Q
17
1Q
18
2Q
18
3Q
18
Mutual fund investment performance (cont’d)
Fixed Income
20 11 8 10 11
16 21
14 9
19 26
15 13 13 14
61
32 40 32
52 33
15 18 29
17
72
72
49
29
52
81
43 48
42
63
49
36 32
38 36
98
87
62
42
66
3Q
17
4Q
17
1Q
18
2Q
18
3Q
18
3Q
17
4Q
17
1Q
18
2Q
18
3Q
18
3Q
17
4Q
17
1Q
18
2Q
18
3Q
18
% of mutual fund AUM in top 2 Morningstar quartiles
Quantitative Equities
1 year 3 year 5 year 1 year 3 year 5 year
2nd quartile
1st quartile
Note: Full performance disclosures detailed on slide 23. For
per
sona
l use
onl
y

26
Mutual fund investment performance (cont’d)
Multi-Asset
76 76 78
90 81 76 76 77 80 82 77 78 79 79 82
7 6 6
2
5 5 7 5 3 6
6 6 4 4 6
83 82 84
92
86 81 83 82 83
88 83 84 83 83
88
3Q
17
4Q
17
1Q
18
2Q
18
3Q
18
3Q
17
4Q
17
1Q
18
2Q
18
3Q
18
3Q
17
4Q
17
1Q
18
2Q
18
3Q
18
% of mutual fund AUM in top 2 Morningstar quartiles
Alternatives
29 28 28 29 23 23 24 23 23 24 25 24 24
9 59
25
64
25
2 2
29
2
26
9 8
28
1
29
38
59 53
92
54
25 25
53
25 26
32 32
53
25
53
3Q
17
4Q
17
1Q
18
2Q
18
3Q
18
3Q
17
4Q
17
1Q
18
2Q
18
3Q
18
3Q
17
4Q
17
1Q
18
2Q
18
3Q
18
1 year 3 year 5 year 1 year 3 year 5 year
2nd quartile
1st quartile
Note: Full performance disclosures detailed on slide 23. For
per
sona
l use
onl
y

27
1 Includes seed investments of US$519.8m (including investment securities of consolidated variable interest entities of US$351.0m), investments related to deferred compensation
plans of US$138.5m and other investments of US$6.1m as at 30 June 2018; includes seed investments of US$481.3m (including investment securities of consolidated variable
interest entities of US$303.9m), investments related to deferred compensation plans of US$128.9m and other investments of US$4.0m as at 30 September 2018.
2 Includes cash and cash equivalents of consolidated variable interest entities of US$34.0m and US$41.3m as at 30 June 2018 and 30 September 2018 respectively.
Balance sheet
• At 30 September 2018, cash and investment
securities totalled US$1,410m compared to
outstanding debt of US$320m
• Cash and cash equivalents increased 13%, with
cash flow generation partially offset by dividend
payments and stock repurchases
• Board declared a dividend of US$0.36 per share
to be paid on 30 November to shareholders on
record at the close of business on 12 November
• Repurchased approximately 1.8m shares,
completing 50% of the Board-authorised US$100m
buyback programme
Strong liquidity position
Investment securities¹
Cash and cash equivalents²
2018 maturity
2025 maturity
30 Sep 2018 30 Jun 2018
704 796
664 614
1,368 1,410
321 320
9
330 320
Cash andinvestments
Debt Cash andinvestments
Debt
Balance sheet profile – carrying value
(30 Jun 2018 vs 30 Sep 2018)
(US$m)
For
per
sona
l use
onl
y

28
US GAAP: statement of income
Note: 3Q17 numbers updated to reflect the adoption of the new revenue recognition standard, with a reconciliation shown on slide 33.
30 Sep 2018 30 Jun 2018 30 Sep 2017
Revenue
Management fees 498.7 493.5 481.8
Performance fees (6.0) 13.5 (2.1)
Shareowner servicing fees 33.1 31.8 30.2
Other revenue 55.4 53.6 57.0
Total revenue 581.2 592.4 566.9
Operating expenses
Employee compensation and benefits 159.5 151.0 176.7
Long-term incentive plans 61.1 55.2 50.9
Distribution expenses 112.3 114.7 112.3
Investment administration 12.2 11.7 11.7
Marketing 7.1 9.5 8.1
General, administrative and occupancy 59.9 59.2 54.2
Depreciation and amortisation 20.8 15.8 14.8
Total operating expenses 432.9 417.1 428.7
Operating income 148.3 175.3 138.2
Interest expense (4.0) (3.9) (4.7)
Investment gains (losses), net (8.3) (16.6) 6.1
Other non-operating income, net 2.3 13.9 8.7
Income before taxes 138.3 168.7 148.3
Income tax provision (33.2) (38.2) (46.1)
Net income 105.1 130.5 102.2
Net loss (income) attributable to non-controlling interests 6.1 10.1 (2.7)
Net income attributable to JHG 111.2 140.6 99.5
Less: allocation of earnings to participating stock-based awards (3.0) (3.8) (2.8)
Net income attributable to JHG common shareholders 108.2 136.8 96.7
Diluted weighted-average shares outstanding (m) 195.9 196.6 198.2
Diluted EPS (in US$) 0.55 0.70 0.49
US$m, except per share data or as noted 3 months ended
For
per
sona
l use
onl
y

29
Adjusted: statement of income
Note: 3Q17 numbers updated to reflect the adoption of the new revenue recognition standard, with a reconciliation shown on slide 33. See adjusted financial measures reconciliation
on slides 30 and 31 for additional information.
30 Sep 2018 30 Jun 2018 30 Sep 2017
Revenue
Management fees 498.7 493.5 481.8
Performance fees (6.0) 13.5 (2.1)
Shareowner servicing fees 33.1 31.8 30.2
Other revenue 55.4 53.6 57.0
Distribution expenses (112.3) (114.7) (112.3)
Total adjusted revenue 468.9 477.7 454.6
Operating expenses
Employee compensation and benefits 151.4 145.0 161.4
Long-term incentive plans 51.1 54.5 48.1
Investment administration 12.2 11.0 11.7
Marketing 7.1 9.7 7.4
General, administrative and occupancy 58.6 57.7 49.8
Depreciation and amortisation 8.0 8.4 7.8
Total adjusted operating expenses 288.4 286.3 286.2
Adjusted operating income 180.5 191.4 168.4
Interest expense (3.2) (3.2) (3.4)
Investment gains (losses), net (8.3) (16.6) 6.1
Other non-operating income (expenses), net 4.8 9.9 (4.0)
Adjusted income before taxes 173.8 181.5 167.1
Income tax provision (41.3) (41.7) (50.2)
Adjusted net income 132.5 139.8 116.9
Net loss (income) attributable to non-controlling interests 6.1 10.1 (2.7)
Adjusted net income attributable to JHG 138.6 149.9 114.2
Less: allocation of earnings to participating stock-based awards (3.7) (4.1) (3.2)
Adjusted net income attributable to JHG common shareholders 134.9 145.8 111.0
Diluted weighted-average shares outstanding (m) 195.9 196.6 198.2
Adjusted diluted EPS (in US$) 0.69 0.74 0.56
US$m, except per share data or as noted 3 months ended
For
per
sona
l use
onl
y

30
Alternative performance measures
Reconciliation of adjusted financial measures
Note: 3Q17 numbers updated to reflect the adoption of the new revenue recognition standard, with a reconciliation shown on slide 33. Reconciliation to be used in conjunction with
slide 31. Footnotes included on slide 32.
30 Sep 2018 30 Jun 2018 30 Sep 2017
Revenue 581.2 592.4 566.9
Distribution expenses¹ (112.3) (114.7) (112.3)
Adjusted revenue 468.9 477.7 454.6
Operating income 148.3 175.3 138.2
Employee compensation and benefits² 8.1 6.0 15.3
Long-term incentive plans² 10.0 0.7 2.8
Investment administration² – 0.7 –
Marketing² – (0.2) 0.7
General, administrative and occupancy² 1.3 1.5 4.4
Depreciation and amortisation³ 12.8 7.4 7.0
Adjusted operating income 180.5 191.4 168.4
Operating margin 25.5% 29.6% 24.4%
Adjusted operating margin 38.5% 40.1% 37.0%
3 months ended
Reconciliation of revenue to adjusted revenue
Reconciliation of operating income to adjusted operating income
US$m, except margin data
For
per
sona
l use
onl
y

31
Alternative performance measures (cont’d)
Reconciliation of adjusted financial measures
Note: 3Q17 numbers updated to reflect the adoption of the new revenue recognition standard, with a reconciliation shown on slide 33. Reconciliation to be used in conjunction with
slide 30. Footnotes included on slide 32.
30 Sep 2018 30 Jun 2018 30 Sep 2017
Net income attributable to JHG 111.2 140.6 99.5
Employee compensation and benefits² 8.1 6.0 15.3
Long-term incentive plans² 10.0 0.7 2.8
Investment administration² – 0.7 –
Marketing² – (0.2) 0.7
General, administrative and occupancy² 1.3 1.5 4.4
Depreciation and amortisation³ 12.8 7.4 7.0
Interest expense4 0.8 0.7 1.3
Other non-operating income (expense)4 2.5 (4.0) (12.7)
Income tax provision5 (8.1) (3.5) (4.1)
Adjusted net income attributable to JHG 138.6 149.9 114.2
Diluted earnings per share (in US$) 0.55 0.70 0.49
Adjusted diluted earnings per share (in US$) 0.69 0.74 0.56
3 months ended
Reconciliation of net income to adjusted net income, attributable to JHG
US$m, except per share data
For
per
sona
l use
onl
y

32
Alternative performance measures (cont’d)
Footnotes to reconciliation of adjusted financial measures
1 Distribution expenses are paid to financial intermediaries for the distribution of JHG’s investment products. JHG management believes that the deduction of third-party
distribution, service and advisory expenses from revenue in the computation of net revenue reflects the nature of these expenses, as these costs are passed through to external
parties that perform functions on behalf of, and distribute, the Group’s managed AUM.
2 Adjustments primarily represent deal and integration costs in relation to the Merger. The costs primarily represent severance costs, legal costs and consulting fees. JHG
management believes these costs do not represent the ongoing operations of the Group.
3 Investment management contracts have been identified as a separately identifiable intangible asset arising on the acquisition of subsidiaries and businesses. Such contracts are
recognised at the net present value of the expected future cash flows arising from the contracts at the date of acquisition. For segregated mandate contracts, the intangible asset
is amortised on a straight-line basis over the expected life of the contracts. JHG management believes these non-cash and acquisition-related costs do not represent the ongoing
operations of the Group.
4 Adjustments primarily represent fair value movements on options issued to Dai-ichi and deferred consideration costs associated with acquisitions. JHG management believes
these costs do not represent the ongoing operations of the Group. The options issued to Dai-ichi expired on 3 October 2018.
5 The tax impact of the adjustments is calculated based on the US or foreign statutory tax rate as they relate to each adjustment. Certain adjustments are either not taxable or not
tax-deductible.
For
per
sona
l use
onl
y
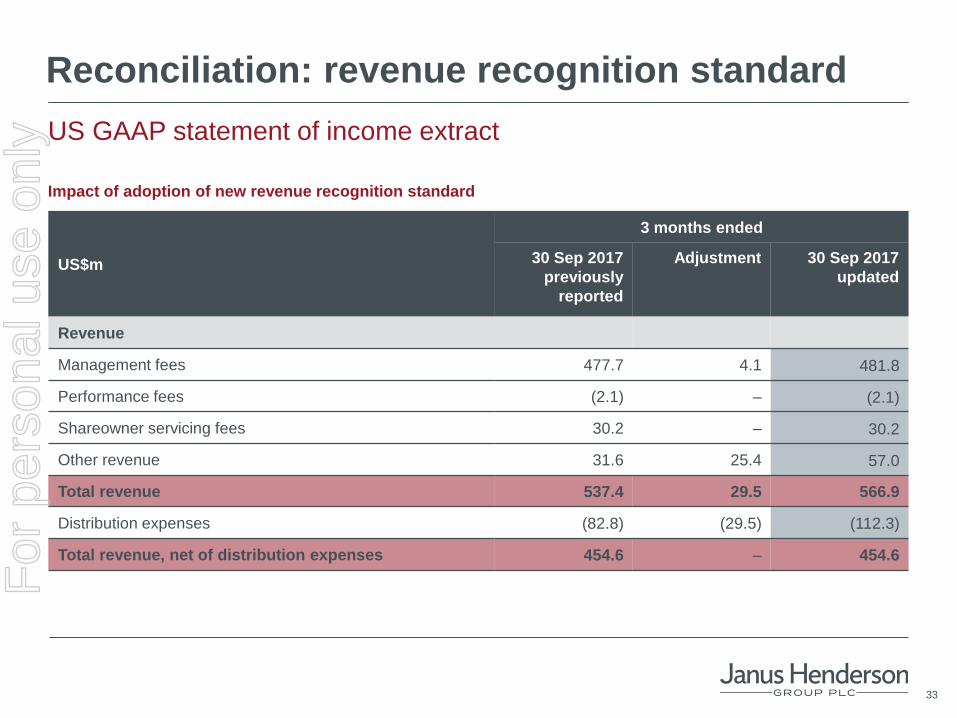
33
US$m
3 months ended
30 Sep 2017
previously
reported
Adjustment 30 Sep 2017
updated
Revenue
Management fees 477.7 4.1 481.8
Performance fees (2.1) – (2.1)
Shareowner servicing fees 30.2 – 30.2
Other revenue 31.6 25.4 57.0
Total revenue 537.4 29.5 566.9
Distribution expenses (82.8) (29.5) (112.3)
Total revenue, net of distribution expenses 454.6 – 454.6
Reconciliation: revenue recognition standard
Impact of adoption of new revenue recognition standard
US GAAP statement of income extract
For
per
sona
l use
onl
y

34
3Q18
(US$m)
2Q18
(US$m)
3Q17
(US$m)
AUM
generating
3Q18 pfees
(US$bn)
# of funds
generating
3Q18
pfees
Frequency
Timing
SICAVs 0.0 4.2 1.8
5.2 2 23 annually;
2 quarterly
23 at June;
2 on quarters
Offshore Absolute Return 1.2 1.5 1.2 0.1 1 Quarterly / Annually Various
Segregated Mandates1 3.2 4.4 2.3 4.4 5 Quarterly / Annually Various
UK OEICs & Unit Trusts 0.0 4.4 – 3.4 3 Quarterly Various
Investment Trusts 0.2 6.7 0.7 0.0 0 Annually Various
US Mutual Funds2 (10.6) (7.7) (8.1) 45.8 17 Monthly Monthly
Total (6.0) 13.5 (2.1) 58.9 28
Performance fees
Note: Performance fees include prior quarter accrual true-ups.
1 Segregated Mandates includes Private Accounts (legacy Janus product categorisation), Managed CDOs and Private Equity. 2 AUM data presents US Mutual Fund AUM subject to performance fees as at 30 Sep 2018. Janus Investment Funds and Janus Aspen Series Portfolios are counted as
distinct and separate funds.
For
per
sona
l use
onl
y

35
US mutual funds with performance fees
Mutual funds with performance fees¹ AUM
30 Sep 2018
US$m
Benchmark Base
fee
Performance
fee2
Performance
cap/(floor)
vs benchmark
3Q18 P&L
impact
US$’000
Research Fund³ 14,821 Russell 1000® Growth Index 0.64% ± 15 bps ± 5.00% (3,840)
Forty Fund³ and Portfolio 14,087 Russell 1000® Growth Index 0.64% ± 15 bps ± 8.50% (2,252)
Mid Cap Value Fund and Portfolio 3,841 Russell Midcap® Value Index 0.64% ± 15 bps ± 4.00% (843)
Global Research Fund and Portfolio 3,692 MSCI World IndexSM 0.60% ± 15 bps ± 6.00% (637)
Small Cap Value Fund 3,048 Russell 2000® Value Index 0.72% ± 15 bps ± 5.50% (849)
Contrarian Fund 2,720 S&P 500® Index 0.64% ± 15 bps ± 7.00% (1,056)
Overseas Fund and Portfolio 2,288 MSCI All Country World ex-U.S. IndexSM 0.64% ± 15 bps ± 7.00% (817)
Research Portfolio⁴ 558 Russell 1000® Growth Index 0.64% ± 15 bps ± 5.00% (195)
Global Real Estate Fund 279 FTSE EPRA / NAREIT Global Index 0.75% ± 15 bps ± 4.00% 37
Global Value Fund 217 MSCI World IndexSM 0.64% ± 15 bps ± 7.00% (89)
Large Cap Value Fund 113 Russell 1000® Value Index 0.64% ± 15 bps ± 3.50% (55)
Select Value Fund 62 Russell 3000® Value Index 0.70% ± 15 bps ± 5.00% 15
Asia Equity Fund 26 MSCI All Country Asia ex-Japan IndexSM 0.92% ± 15 bps ± 7.00% 5
Total 45,753 (10,576)
Note: AUM data shown on a managed view. Numbers may not cast due to rounding. 1 The funds listed have a performance-based investment advisory fee that adjusts up or down based on performance relative to a benchmark over 36-month rolling
periods. Please see the funds’ Statements of Additional Information for more details and benchmark information. 2 Adjustment of ± 15 bps assumes constant assets and could be higher or lower depending on asset fluctuations. 3 The Janus Fund merged into the Research Fund and the Twenty Fund merged into the Forty Fund effective 1 May 2017. For two years, the investment advisory fee will
be waived to the lesser of the investment advisory fee rate payable by the surviving fund, or the investment advisory fee rate that the merged fund would have paid if the
merger did not occur. 4 Until 1 May 2020, the portion of performance for periods prior to 1 May 2017 will be compared to the Portfolio's former benchmark, the Core Growth Index (50% S&P
500® Index / 50% Russell 1000® Growth Index). Prior to 1 May 2017, the performance fee hurdle was ± 4.5% vs the Core Growth Index.
For
per
sona
l use
onl
y

36
Long-term incentive compensation
Estimated future long-term incentive compensation amortisation
US$m
Amount
remaining
to expense
2018 2019 2020 2021
2015 annual grant 6 6 – – –
2016 annual grant 28 21 7 – –
2017 annual grant 62 38 18 6 –
2018 annual grant 160 77 53 24 6
Other¹ 116 47 29 22 18
Total long-term incentive compensation 372 189 107 52 24
Note: 2015, 2016, 2017 and 2018 annual grants generally vest over three and four years. Assumes no forfeitures in future periods. Assumes no change in future values related to
market or currency, which would impact expense related to cash based awards (MFSAs and DEP funds) and social security expense upon vesting. 1 Includes retention and recruiting awards; other subsidiary grants and social security expense. Social security expense is estimated based on amount of existing awards
expected to vest in that year.
For
per
sona
l use
onl
y

37
Contacts
Investor enquiries
John Groneman
Global Head of Investor Relations
+44 (0) 20 7818 2106
Jim Kurtz
US Investor Relations Manager
+1 (303) 336 4529
Melanie Horton
Non-US Investor Relations Manager
+44 (0) 20 7818 2905
Investor Relations
+44 (0) 20 7818 5310
Media enquiries
North America:
Erin Passan
+1 (303) 394 7681
EMEA:
Natasha Moore
+44 (0) 20 7818 3521
United Kingdom: FTI Consulting
Tom Blackwell
+44 (0) 20 3727 1051
Asia Pacific: Honner
Michael Mullane
+61 28248 3740
For
per
sona
l use
onl
y

38
Janus Henderson Investors
201 Bishopsgate, London EC2M 3AE
Tel: 020 7818 1818 Fax: 020 7818 1819
Past performance is no guarantee of future results. Investing involves risk, including the possible loss of principal and fluctuation of value.
Forward looking information
This presentation includes statements concerning potential future events involving Janus Henderson Group plc that could differ materially from the events that
actually occur. The differences could be caused by a number of factors including those factors identified in Janus Henderson Group’s Annual Report on Form
10-K for the fiscal year ended 31 December 2017, on file with the Securities and Exchange Commission (Commission file no. 001-3810), including those that
appear under headings such as “Risk Factors” and “Management’s Discussion and Analysis of Financial Condition and Results of Operations.” Many of these
factors are beyond the control of the company and its management. Any forward-looking statements contained in this presentation are as of the date on which
such statements were made. The company assumes no duty to update them, even if experience, unexpected events, or future changes make it clear that any
projected results expressed or implied therein will not be realised.
Annualised, pro forma, projected and estimated numbers are used for illustrative purposes only, are not forecasts and may not reflect actual results.
No public offer
The information, statements and opinions contained in this presentation do not constitute a public offer under any applicable legislation or an offer to sell or
solicitation of any offer to buy any securities or financial instruments or any advice or recommendation with respect to such securities or other financial
instruments.
Not all products or services are available in all jurisdictions.
Mutual funds in the US distributed by Janus Henderson Distributors.
Please consider the charges, risks, expenses and investment objectives carefully before investing. For a US fund prospectus or, if available, a
summary prospectus containing this and other information, please contact your investment professional or call 800.668.0434. Read it carefully before
you invest or send money.
Janus Henderson, Janus, Henderson, Intech, Alphagen and Knowledge. Shared are trademarks of Janus Henderson Group plc or one of its subsidiary entities.
© Janus Henderson Group plc. For
per
sona
l use
onl
y
Top Related