


Languages
Pages
Legal

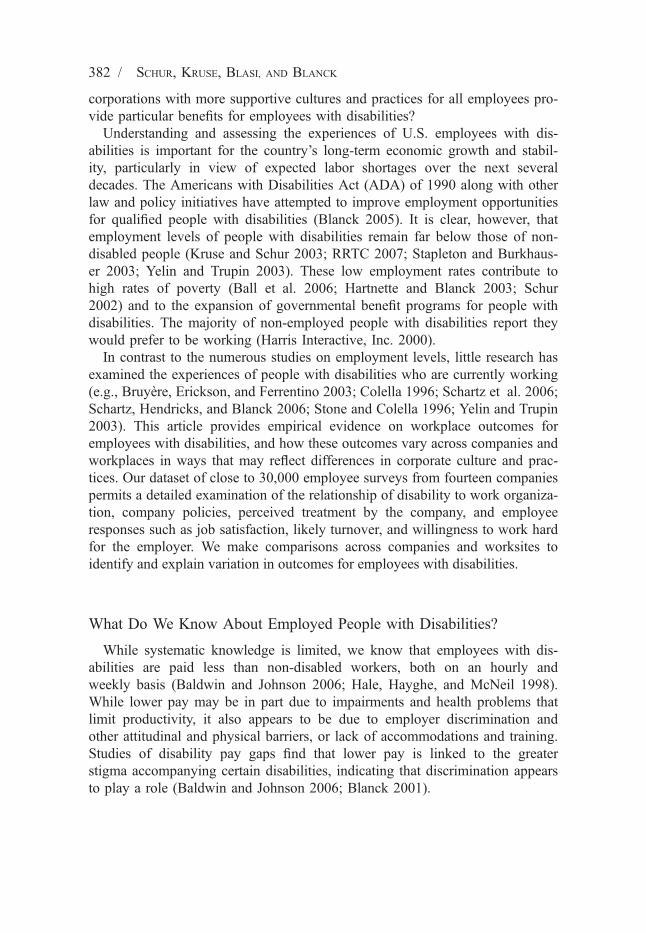
Is Disability Disabling in All Workplaces?Workplace Disparities and Corporate Culture
LISA SCHUR, DOUGLAS KRUSE, JOSEPH BLASI, and PETERBLANCK*
*sity,UnivRutg900dkrusIndusthe RCorinMichentryProjethe opart fDisab(RRTH133BasedNo.H133for PPolicicy o
IND
Pub
Using nearly 30,000 employee surveys from fourteen companies, we find disabil-
ity is linked to lower average pay, job security, training, and participation in deci-
sions, and to more negative attitudes toward the job and company. Disability gaps
in attitudes vary substantially, however, across companies and worksites, with no
attitude gaps in worksites rated highly by all employees for fairness and respon-
siveness. The results indicate that corporate cultures that are responsive to the
needs of all employees are especially beneficial for employees with disabilities.
Introduction
DO EMPLOYEES WITH DISABILITIES FACE DISPARITIES in important workplace out-comes such as pay, training, job security, promotions, and participation in deci-sions? Do they believe their companies treat them fairly and with respect? Do
The authors’ affiliations are, respectively, School of Management and Labor Relations, Rutgers Univer-50 Labor Center Way, New Brunswick, NJ, USA; School of Management and Labor Relations, Rutgersersity, 94 Rockafeller Road, Piscataway, NJ, USA; School of Management and Labor Relations,ers University, 94 Rockafeller Road, Piscataway, NJ, USA; Burton Blatt Institute, Syracuse University,Crouse Avenue, Crouse-Hinds Hall, Suite 300, Syracuse, NY, USA. E-mails: [email protected],[email protected], [email protected], [email protected]. This paper was presented at the Society fortrial and Organizational Psychology annual conference, Dallas, Texas, May 2006, and in a seminar atutgers University Department of Labor Studies and Employment Relations. Adrienne Colella, Ed Yelin,ne Kirchner, Stan Gully, and seminar participants provided useful comments and advice. Refen Koh,elle Pinheiro, Rhokeun Park, and Patricia Berhau provided excellent assistance in survey scanning,, and verification. The data analyzed were collected as part of the NBER Shared Capitalism Researchct. We are grateful to the Russell Sage and Rockefeller Foundations which funded the project, and tother project director, Richard Freeman, for letting the data be used for this paper. This research was inunded by grants to the fourth author from (1) the U.S. Department of Education, National Institute onility and Rehabilitation Research (NIDRR), for the ‘‘Rehabilitation Research and Training CenterC) on Workforce Investment and Employment Policy for Persons with Disabilities,’’ Grant No.B980042-99, ‘‘IT Works,’’ Grant No. H133A011803, ‘‘Technology for Independence: A Community-Resource Center,’’ Grant No. H133A021801, ‘‘Demand Side Employment Placement Models,’’ GrantH133A060033, ‘‘Southeast Disability & Business Technical Assistance Center,’’ Grant No.A060094, and The Rehabilitation Services Administration (RSA) for ‘‘RRTC on Employment Policyeople with Disabilities,’’ and (2) the U.S. Department of Labor, Office of Disability and Employmenty, Contract #J-9-M-2-0022. The opinions expressed herein do not necessarily reflect the position or pol-f any U.S. Department or any other entity.
381
USTRIAL RELATIONS, Vol. 48, No. 3 (July 2009). � 2009 Regents of the University of Californialished by Wiley Periodicals, Inc., 350 Main Street, Malden, MA 02148, USA, and 9600 Garsington
Road, Oxford, OX4 2DQ, UK.
382 / SCHUR, KRUSE, BLASI, AND BLANCK
corporations with more supportive cultures and practices for all employees pro-vide particular benefits for employees with disabilities?Understanding and assessing the experiences of U.S. employees with dis-
abilities is important for the country’s long-term economic growth and stabil-ity, particularly in view of expected labor shortages over the next severaldecades. The Americans with Disabilities Act (ADA) of 1990 along with otherlaw and policy initiatives have attempted to improve employment opportunitiesfor qualified people with disabilities (Blanck 2005). It is clear, however, thatemployment levels of people with disabilities remain far below those of non-disabled people (Kruse and Schur 2003; RRTC 2007; Stapleton and Burkhaus-er 2003; Yelin and Trupin 2003). These low employment rates contribute tohigh rates of poverty (Ball et al. 2006; Hartnette and Blanck 2003; Schur2002) and to the expansion of governmental benefit programs for people withdisabilities. The majority of non-employed people with disabilities report theywould prefer to be working (Harris Interactive, Inc. 2000).In contrast to the numerous studies on employment levels, little research has
examined the experiences of people with disabilities who are currently working(e.g., Bruyere, Erickson, and Ferrentino 2003; Colella 1996; Schartz et al. 2006;Schartz, Hendricks, and Blanck 2006; Stone and Colella 1996; Yelin and Trupin2003). This article provides empirical evidence on workplace outcomes foremployees with disabilities, and how these outcomes vary across companies andworkplaces in ways that may reflect differences in corporate culture and prac-tices. Our dataset of close to 30,000 employee surveys from fourteen companiespermits a detailed examination of the relationship of disability to work organiza-tion, company policies, perceived treatment by the company, and employeeresponses such as job satisfaction, likely turnover, and willingness to work hardfor the employer. We make comparisons across companies and worksites toidentify and explain variation in outcomes for employees with disabilities.
What Do We Know About Employed People with Disabilities?
While systematic knowledge is limited, we know that employees with dis-abilities are paid less than non-disabled workers, both on an hourly andweekly basis (Baldwin and Johnson 2006; Hale, Hayghe, and McNeil 1998).While lower pay may be in part due to impairments and health problems thatlimit productivity, it also appears to be due to employer discrimination andother attitudinal and physical barriers, or lack of accommodations and training.Studies of disability pay gaps find that lower pay is linked to the greaterstigma accompanying certain disabilities, indicating that discrimination appearsto play a role (Baldwin and Johnson 2006; Blanck 2001).
Disability and Corporate Culture / 383
Employees with disabilities are less likely than non-disabled employees toreceive benefits such as employer provided health insurance and pension plans(Kruse 1998; Schur 2002). They are more likely to be in production and ser-vice jobs and less likely to be in professional, technical, or managerial jobs(Hale, Hayghe, and McNeil 1998: 8). They are also more likely to be in part-time, temporary, and other non-standard jobs that often provide low pay andfew if any benefits (Di Natale 2001; Schur 2002; Yelin and Trupin 2003).Overall, almost half (44 percent) of workers with disabilities are in some typeof non-standard work arrangement, compared with one-quarter (22 percent) ofworkers without disabilities (Schur 2003). They are not, however, more likelyto work in jobs with flexible schedules (Presser and Altman 2002; Yelin andTrupin 2003).Apart from information on employment and pay levels, there is relatively little
information on other employment outcomes. There is some evidence that work-ers with disabilities have lower job security and higher rates of job loss (Baldwinand Schumacher 2002; Yelin and Trupin 2003), and generally lower levels ofjob satisfaction (McAfee and McNaughton 1997a,b; Uppal 2005). Analysis of aCalifornia survey shows that they do not appear to differ from non-disabledworkers in psychological and cognitive job demands (e.g., job autonomy, inter-action with co-workers), although they are less likely to be in jobs classified as‘‘economically and psychologically rewarding’’ (Yelin and Trupin 2003: 28).There are no systematic studies of disparities in important job attributes,
such as opportunities for training, promotion, and participation in decisions, orregarding attitudes of employees with disabilities toward their companies.Moreover, the existing evidence on disability gaps in pay and other outcomesis based on broad samples that predominantly compare workers across firms,and not on intensive comparisons within firms that hold constant a number offirm-specific characteristics affecting outcomes for all workers. Based on theexisting literature showing lower levels of pay, benefits, and job security forpeople with disabilities, and the role that stigma and discrimination appear toplay in these gaps (Baldwin and Johnson 2006), our first hypothesis is
Hypothesis 1: Employees with disabilities have lower levels of pay, benefits, job
security, and opportunities for promotions, skill building, and decision making
than do non-disabled employees.
We further hypothesize that these disparities will affect employee views ofthe company:
Hypothesis 2: Employees with disabilities have more negative views of how
employees are treated by the company than do non-disabled employees.
384 / SCHUR, KRUSE, BLASI, AND BLANCK
Hypothesis 3: The negative effect of disability on views of company treatment is
partially mediated by access to pay, benefits, job security, and opportunities for pro-
motions, skill building, and decision making.
Disparities between employees with and without disabilities can have impor-tant consequences: the growing literature on high-performance work systemsindicates that workplace policies affect corporate performance throughemployee skills, attitudes, and behaviors (Becker and Huselid 2006; Combset al. 2006; Macky and Boxall 2007). Outcomes such as turnover and organi-zational citizenship behaviors are related to how employees feel they are trea-ted by the company (Griffeth, Hom, and Gaertner 2000; Meyer et al. 2002).Based on this literature, our next two hypotheses are
Hypothesis 4: Employees with disabilities have higher turnover intentions and
lower job satisfaction, company loyalty, and willingness to work hard for the
company than do non-disabled employees.
Hypothesis 5: The negative effects of disability on turnover intentions, job satis-
faction, company loyalty, and willingness to work hard are partially mediated by
access to pay, benefits, job security, and opportunities for promotions, skill build-
ing, and decision-making input.
Recent scholarship suggests that the workplace experiences of employees withdisabilities may be shaped by corporate cultures—i.e., the values, attitudes, andnorms embedded in a company (Blanck 2005; Colella 1996; Schur, Kruse, andBlanck 2005; Sandler and Blanck 2004; Spataro 2005; Stone and Colella 1996).Many corporate cultures appear to be based on the assumption that employeesare able-bodied, which poses significant obstacles to hiring and retention of peo-ple with disabilities (Ball et al. 2005, 2006). One important aspect of corporateculture is the ‘‘justice climate,’’ reflecting collective beliefs about distributive,procedural, and interpersonal justice in the organization (Liao 2007; Rupp,Bashshur, and Liao 2007). All three beliefs may be particularly important forpeople with disabilities: distributive justice concerns outcomes such as pay andthe provision of workplace accommodations, procedural justice concerns policiesand procedures such as how requests for accommodations are handled, and inter-personal justice concerns the extent to which organizational members are treatedwith respect, dignity, and sensitivity. Research has shown that all three types arehighly related and contribute to an overall sense of fairness and justice at work.The justice climate is shaped by organizational structures, and has been linked tojob attitudes, performance, and citizenship behaviors (Liao and Rupp 2005;Rupp, Bashshur, and Liao 2007).
Disability and Corporate Culture / 385
There is no direct evidence on how workers with disabilities experience thejustice climate or other aspects of corporate culture, but results from the fewextant studies and related psychological evidence suggest that supervisor andco-worker attitudes have a profound impact on the employment experiences ofpeople with disabilities (Boyle 1997; Colella 1996, 2001; Colella, DeNisi, andVarma 1998; Harlan and Robert 1998; Marti and Blanck 2000). These attitudescan reflect negative or positive stereotypes about the personalities and abilitiesof employees with disabilities, as well as discomfort if the disability involvesstigmatized conditions such as mental or cognitive impairments (Blanck 2005;Colella 1996). Exposure to people with disabilities may help overcome thesenegative stereotypes (Makas 1988).The importance of corporate culture is demonstrated by O’Reilly, Chatman,
and Caldwell (1991), who find the fit between individuals and organizationalvalues is a strong predictor of organizational commitment, job satisfaction, andturnover. Of even more direct relevance for this study, McKay et al. (2007),McKay, Avery, and Morris (2008) find that racial differences in employeeretention and sales performance are related to workplace environment. Theyfind the largest racial disparities in retention and sales performance in storeswith the most negative diversity climates, and the smallest gaps in stores withpro-diversity climates, indicating that workplace environments may be particu-larly important for members of disadvantaged groups.Based on this literature our next hypothesis is
Hypothesis 6: Perceived justice climate moderates the relationship between
disability and employee responses to the job and company (turnover intention,
job satisfaction, company loyalty, and willingness to work hard), with especially
negative responses by employees with disabilities when the workplace climate is
perceived as less just by workers in general.
Stone and Colella (1996) theorize that employees with disabilities fare par-ticularly badly in bureaucratic organizations that emphasize competitiveachievement and are based on a rigid equity value system. Such organizationsoften weigh the fairness of treatment for all employees against the personalizedconsideration of employees with disabilities (see case examples in Blanck2005). In such companies, workplace accommodations are likely to be viewedas unfair—an unjustified and expensive ‘‘perk’’—especially when seen asmaking the accommodated person’s work easier, making the co-worker’s jobharder or less desirable, and causing coworkers to lose competitive rewards.This often is the case even though the practical benefits of workplace accom-modations are generally clear, generalizable, and their costs minor and benefitshigh (Schartz, Hendricks, and Blanck 2006; Schartz et al. 2006).
386 / SCHUR, KRUSE, BLASI, AND BLANCK
In contrast, people with disabilities are likely to fare better in flexible orga-nizations that value diversity, cooperation, and the personalized considerationof employee needs (Stone and Colella 1996). Company cultures based on a‘‘customized needs’’ model, as opposed to a strict ‘‘equity’’ model, are morelikely to approve and support accommodations generally, especially in support-ive work environments that stress individual autonomy and let employees helpdecide how best to perform their own work (Blanck 1994, 1996; Colella2001). This leads to our final hypothesis:
Hypothesis 7: Perceived company responsiveness to employees moderates the
relationship between disability and employee responses to the job and company
(turnover intention, job satisfaction, company loyalty, and willingness to work
hard), with especially negative responses by employees with disabilities when the
workplace climate is perceived by workers in general as less responsive to
employee concerns.
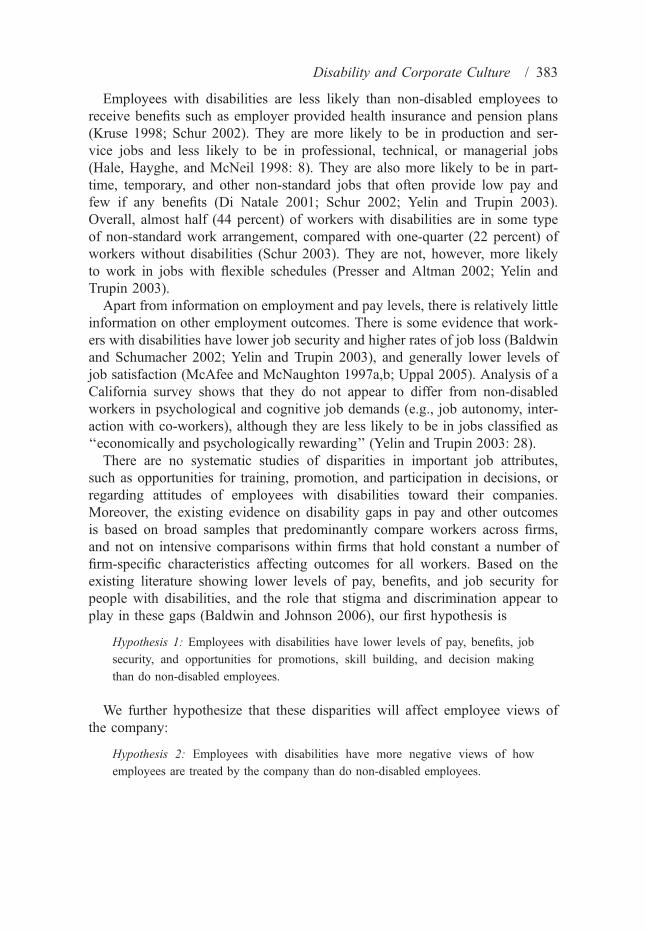
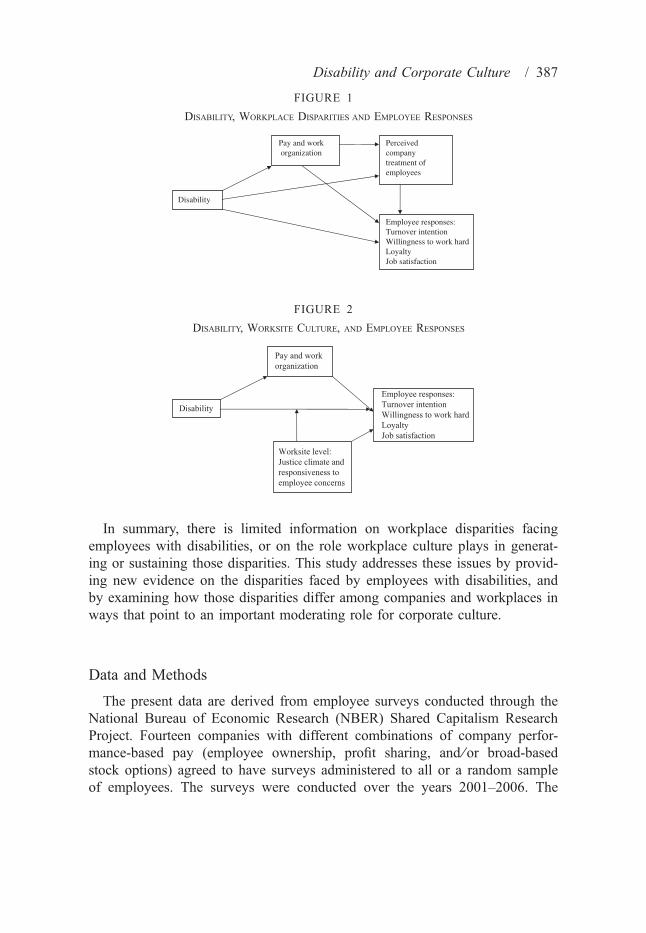
The importance of attitudes toward employees with disabilities is supportedby employers’ own views. One-fifth (20 percent) of employers report thegreatest barrier to people with disabilities finding employment is discrimina-tion, prejudice, or employer reluctance to hire them (Dixon, Kruse, and VanHorn 2003). A similar percentage (22 percent) of employers report attitudesand stereotypes are a barrier to employment of people with disabilities in theirown firms (Bruyere 2000). In addition, one-third (32 percent) of employerssay it is difficult or very difficult to change supervisor and co-worker attitudes.It is likely that these figures understate the problem due to ‘‘social desirabil-ity’’ bias in responding to surveys, and to the frequent discrepancy foundbetween the attitudes employers express towards people with disabilities onsurveys and their actual hiring practices (Wilgosh and Skaret 1987). Together,the survey evidence combined with the evidence from laboratory studies indi-cate negative attitudes toward people with disabilities may be an importantbarrier to their job and career experiences.The hypotheses described above are depicted in two figures below. Figure 1
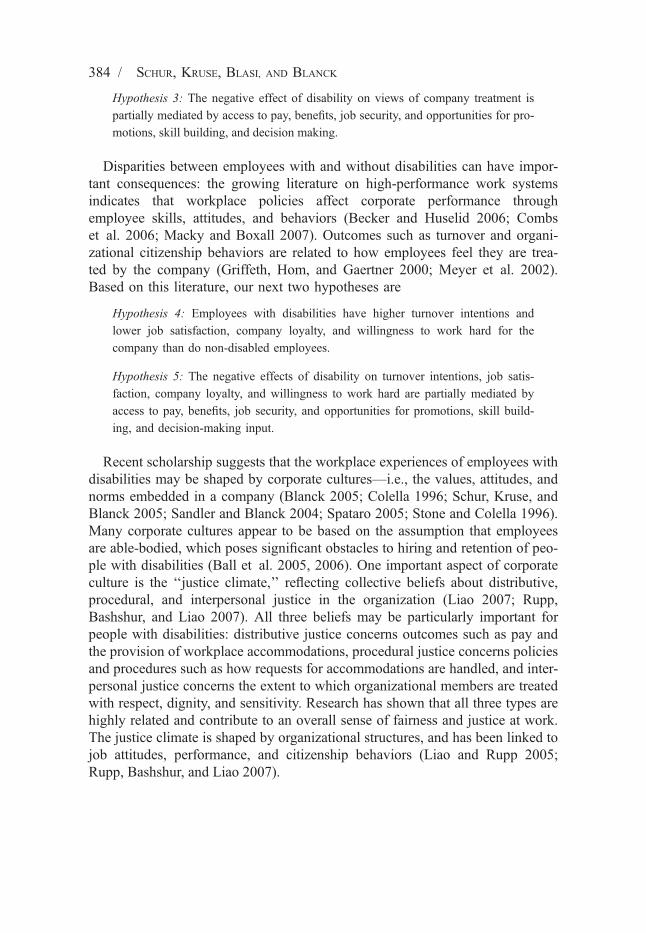
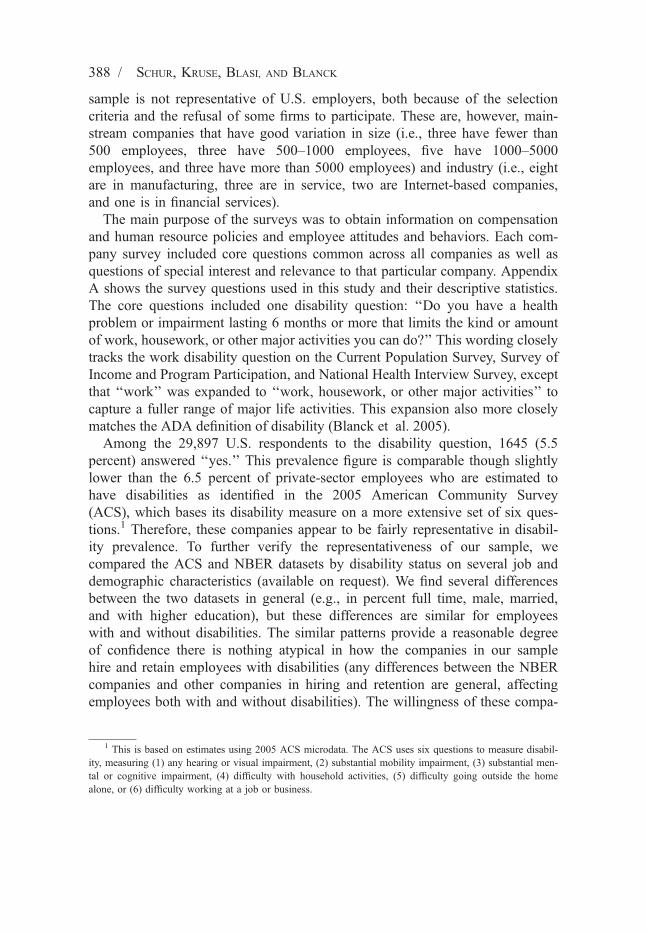
illustrates the effect of disability on pay and work organization (Hypothesis 1)and perceived company treatment of employees (Hypothesis 2), the mediatingrole of pay and work organization in affecting perceived company treatment ofemployees (Hypothesis 3), the effect of disability on employee responses(Hypothesis 4), and the mediating role of pay and work organization in affectingemployee responses (Hypothesis 5). Figure 2 depicts the effect of disability onpay and work organization, and on employee responses, with the latter relation-ship moderated by worksite-level measures of the justice climate (Hypothesis 6)and perceived responsiveness to employee concerns (Hypothesis 7).
Disability
Pay and workorganization
Perceivedcompanytreatment ofemployees
Employee responses:Turnover intentionWillingness to work hardLoyaltyJob satisfaction
FIGURE 1
DISABILITY, WORKPLACE DISPARITIES AND EMPLOYEE RESPONSES
Disability
Pay and workorganization
Worksite level:Justice climate andresponsiveness toemployee concerns
Employee responses:Turnover intentionWillingness to work hardLoyaltyJob satisfaction
FIGURE 2
DISABILITY, WORKSITE CULTURE, AND EMPLOYEE RESPONSES
Disability and Corporate Culture / 387
In summary, there is limited information on workplace disparities facingemployees with disabilities, or on the role workplace culture plays in generat-ing or sustaining those disparities. This study addresses these issues by provid-ing new evidence on the disparities faced by employees with disabilities, andby examining how those disparities differ among companies and workplaces inways that point to an important moderating role for corporate culture.
Data and Methods
The present data are derived from employee surveys conducted through theNational Bureau of Economic Research (NBER) Shared Capitalism ResearchProject. Fourteen companies with different combinations of company perfor-mance-based pay (employee ownership, profit sharing, and ⁄or broad-basedstock options) agreed to have surveys administered to all or a random sampleof employees. The surveys were conducted over the years 2001–2006. The
388 / SCHUR, KRUSE, BLASI, AND BLANCK
sample is not representative of U.S. employers, both because of the selectioncriteria and the refusal of some firms to participate. These are, however, main-stream companies that have good variation in size (i.e., three have fewer than500 employees, three have 500–1000 employees, five have 1000–5000employees, and three have more than 5000 employees) and industry (i.e., eightare in manufacturing, three are in service, two are Internet-based companies,and one is in financial services).The main purpose of the surveys was to obtain information on compensation
and human resource policies and employee attitudes and behaviors. Each com-pany survey included core questions common across all companies as well asquestions of special interest and relevance to that particular company. AppendixA shows the survey questions used in this study and their descriptive statistics.The core questions included one disability question: ‘‘Do you have a healthproblem or impairment lasting 6 months or more that limits the kind or amountof work, housework, or other major activities you can do?’’ This wording closelytracks the work disability question on the Current Population Survey, Survey ofIncome and Program Participation, and National Health Interview Survey, exceptthat ‘‘work’’ was expanded to ‘‘work, housework, or other major activities’’ tocapture a fuller range of major life activities. This expansion also more closelymatches the ADA definition of disability (Blanck et al. 2005).Among the 29,897 U.S. respondents to the disability question, 1645 (5.5
percent) answered ‘‘yes.’’ This prevalence figure is comparable though slightlylower than the 6.5 percent of private-sector employees who are estimated tohave disabilities as identified in the 2005 American Community Survey(ACS), which bases its disability measure on a more extensive set of six ques-tions.1 Therefore, these companies appear to be fairly representative in disabil-ity prevalence. To further verify the representativeness of our sample, wecompared the ACS and NBER datasets by disability status on several job anddemographic characteristics (available on request). We find several differencesbetween the two datasets in general (e.g., in percent full time, male, married,and with higher education), but these differences are similar for employeeswith and without disabilities. The similar patterns provide a reasonable degreeof confidence there is nothing atypical in how the companies in our samplehire and retain employees with disabilities (any differences between the NBERcompanies and other companies in hiring and retention are general, affectingemployees both with and without disabilities). The willingness of these compa-
1 This is based on estimates using 2005 ACS microdata. The ACS uses six questions to measure disabil-ity, measuring (1) any hearing or visual impairment, (2) substantial mobility impairment, (3) substantial men-tal or cognitive impairment, (4) difficulty with household activities, (5) difficulty going outside the homealone, or (6) difficulty working at a job or business.
Disability and Corporate Culture / 389
nies to allow outside researchers to conduct employee surveys may signal thatthey put more effort than other companies into treating employees well, andare less worried that disparities among employee groups will be found. There-fore, to the extent these companies may be unrepresentative, the disparities wefind are likely to be understated relative to the population of all firms.The variables analyzed are classified into three groups: (1) pay and work
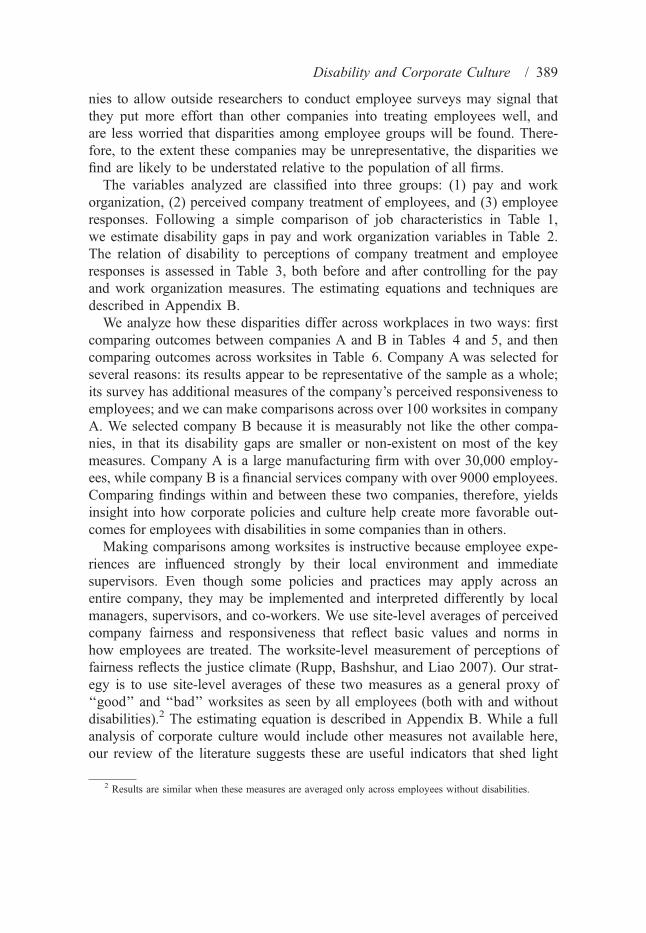
organization, (2) perceived company treatment of employees, and (3) employeeresponses. Following a simple comparison of job characteristics in Table 1,we estimate disability gaps in pay and work organization variables in Table 2.The relation of disability to perceptions of company treatment and employeeresponses is assessed in Table 3, both before and after controlling for the payand work organization measures. The estimating equations and techniques aredescribed in Appendix B.We analyze how these disparities differ across workplaces in two ways: first
comparing outcomes between companies A and B in Tables 4 and 5, and thencomparing outcomes across worksites in Table 6. Company A was selected forseveral reasons: its results appear to be representative of the sample as a whole;its survey has additional measures of the company’s perceived responsiveness toemployees; and we can make comparisons across over 100 worksites in companyA. We selected company B because it is measurably not like the other compa-nies, in that its disability gaps are smaller or non-existent on most of the keymeasures. Company A is a large manufacturing firm with over 30,000 employ-ees, while company B is a financial services company with over 9000 employees.Comparing findings within and between these two companies, therefore, yieldsinsight into how corporate policies and culture help create more favorable out-comes for employees with disabilities in some companies than in others.Making comparisons among worksites is instructive because employee expe-
riences are influenced strongly by their local environment and immediatesupervisors. Even though some policies and practices may apply across anentire company, they may be implemented and interpreted differently by localmanagers, supervisors, and co-workers. We use site-level averages of perceivedcompany fairness and responsiveness that reflect basic values and norms inhow employees are treated. The worksite-level measurement of perceptions offairness reflects the justice climate (Rupp, Bashshur, and Liao 2007). Our strat-egy is to use site-level averages of these two measures as a general proxy of‘‘good’’ and ‘‘bad’’ worksites as seen by all employees (both with and withoutdisabilities).2 The estimating equation is described in Appendix B. While a fullanalysis of corporate culture would include other measures not available here,our review of the literature suggests these are useful indicators that shed light
2 Results are similar when these measures are averaged only across employees without disabilities.
TABLE 1
DISABILITY AND BASIC JOB CHARACTERISTICS
Full sample Company A Company B
Nodisability Disability
Nodisability Disability
Nodisability Disability
Occupation
Production 42.2%** 63.1% 57.3%** 77.0% 14.1%* 23.2%
Administrative support 5.8% 6.5% 4.6% 3.5% 21.3%** 36.6%
Professional ⁄ technical 32.4%** 20.2% 21.2%** 11.5% 37.9% 28.0%
Sales ⁄ customer support 7.0%** 4.0% 6.3%** 3.1% 9.4% 8.5%
Management
Low 11.7%** 7.1% 4.4% 3.4% 8.2% 2.4%
Middle 7.5%** 5.0% 5.7%** 3.8% 6.4% 1.2%
Upper 2.0% 1.4% 1.8% 1.2% 2.8% 0.0%
Supervisor 26.0%** 18.4% 24.4%** 16.5% 26.3%** 8.5%
Paid on hourly basis 49.8%** 72.9% 62.7%** 82.4% 40.1%** 71.6%
Tenure
Avg. years (SD) 9.8** (9.0) 12.2 (9.8) 12.1** (9.7) 14.1 (10.1) 6.3 (5.7) 6.1 (5.3)
0–2 years 21.0%** 13.5% 16.3%** 10.5% 25.1% 23.5%
2–5 years 17.9%* 15.6% 12.6%* 10.1% 32.9% 38.3%
>5 years 61.1%** 70.9% 71.1%** 79.4% 42.0% 38.3%
Work hours per week
Avg. hours (SD) 45.6** (9.4) 43.0 (9.8) 44.1** (8.3) 42.3 (9.3) 43.5** (7.3) 40.7 (6.2)
<35 h 2.7%** 4.4% 2.8%** 4.5% 3.5% 4.9%
36–50 h 65.0%** 76.0% 73.2%** 79.6% 76.0%** 87.8%
>51 h 32.4%** 19.6% 24.0%** 15.9% 20.5%** 7.3%
Union coverage 4.7%** 10.4% 5.6%** 11.7% 0.0% 0.0%
Sample size 28,252 1645 16,620 1093 1045 82
NOTE: Significant difference by disability status at *p < 0.05; **p < 0.01.
390 / SCHUR, KRUSE, BLASI, AND BLANCK
on the potential role of corporate culture in the experiences of employees withdisabilities and suggest avenues for future research. If workplaces that are per-ceived as more just and responsive to employees in general are particularlygood for those with disabilities, the disability gaps should be smaller or non-existent in more just and responsive workplaces.The data have some limitations with regard to studying disability. In particu-
lar, as only one question is used to identify employees with disabilities, it isnot possible to make comparisons by type of impairment or by severity ofactivity limitations. In addition, because the surveys were conducted foranother purpose, no specific questions were asked about disability issues, suchas whether the respondent had received workplace accommodations. Whilewe recognize these limitations, this dataset nonetheless provides new and valu-able information. This is the first large-scale dataset that permits a detailedexamination of what happens at work for employees with disabilities, allowingcomparisons within and across companies and worksites.
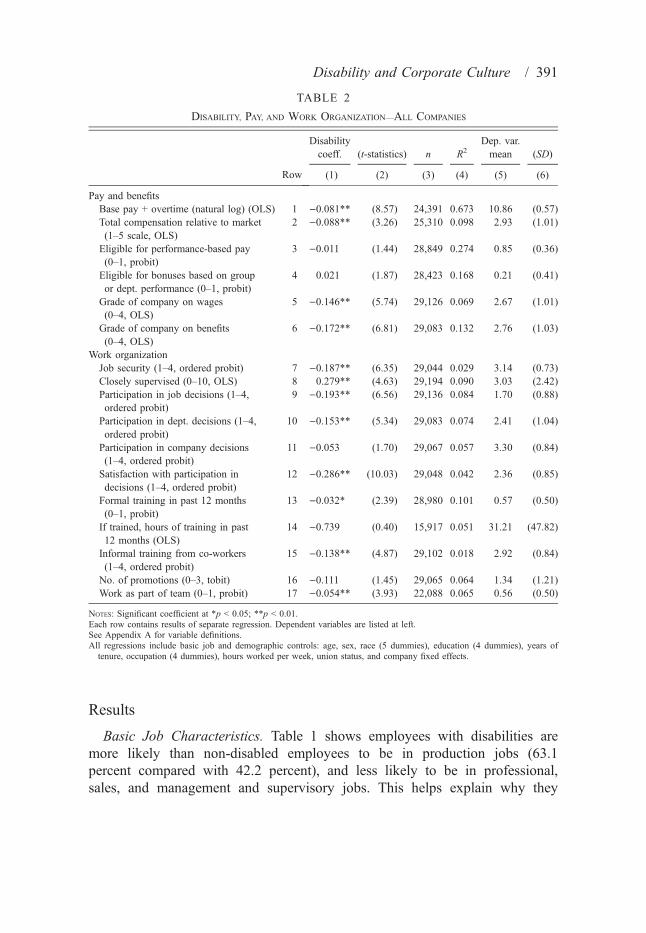
TABLE 2
DISABILITY, PAY, AND WORK ORGANIZATION—ALL COMPANIES
Row
Disabilitycoeff. (t-statistics) n R2
Dep. var.mean (SD)
(1) (2) (3) (4) (5) (6)
Pay and benefitsBase pay + overtime (natural log) (OLS) 1 )0.081** (8.57) 24,391 0.673 10.86 (0.57)Total compensation relative to market(1–5 scale, OLS)
2 )0.088** (3.26) 25,310 0.098 2.93 (1.01)
Eligible for performance-based pay(0–1, probit)
3 )0.011 (1.44) 28,849 0.274 0.85 (0.36)
Eligible for bonuses based on groupor dept. performance (0–1, probit)
4 0.021 (1.87) 28,423 0.168 0.21 (0.41)
Grade of company on wages(0–4, OLS)
5 )0.146** (5.74) 29,126 0.069 2.67 (1.01)
Grade of company on benefits(0–4, OLS)
6 )0.172** (6.81) 29,083 0.132 2.76 (1.03)
Work organizationJob security (1–4, ordered probit) 7 )0.187** (6.35) 29,044 0.029 3.14 (0.73)Closely supervised (0–10, OLS) 8 0.279** (4.63) 29,194 0.090 3.03 (2.42)Participation in job decisions (1–4,ordered probit)
9 )0.193** (6.56) 29,136 0.084 1.70 (0.88)
Participation in dept. decisions (1–4,ordered probit)
10 )0.153** (5.34) 29,083 0.074 2.41 (1.04)
Participation in company decisions(1–4, ordered probit)
11 )0.053 (1.70) 29,067 0.057 3.30 (0.84)
Satisfaction with participation indecisions (1–4, ordered probit)
12 )0.286** (10.03) 29,048 0.042 2.36 (0.85)
Formal training in past 12 months(0–1, probit)
13 )0.032* (2.39) 28,980 0.101 0.57 (0.50)
If trained, hours of training in past12 months (OLS)
14 )0.739 (0.40) 15,917 0.051 31.21 (47.82)
Informal training from co-workers(1–4, ordered probit)
15 )0.138** (4.87) 29,102 0.018 2.92 (0.84)
No. of promotions (0–3, tobit) 16 )0.111 (1.45) 29,065 0.064 1.34 (1.21)Work as part of team (0–1, probit) 17 )0.054** (3.93) 22,088 0.065 0.56 (0.50)
NOTES: Significant coefficient at *p < 0.05; **p < 0.01.Each row contains results of separate regression. Dependent variables are listed at left.See Appendix A for variable definitions.All regressions include basic job and demographic controls: age, sex, race (5 dummies), education (4 dummies), years oftenure, occupation (4 dummies), hours worked per week, union status, and company fixed effects.
Disability and Corporate Culture / 391
Results
Basic Job Characteristics. Table 1 shows employees with disabilities aremore likely than non-disabled employees to be in production jobs (63.1percent compared with 42.2 percent), and less likely to be in professional,sales, and management and supervisory jobs. This helps explain why they
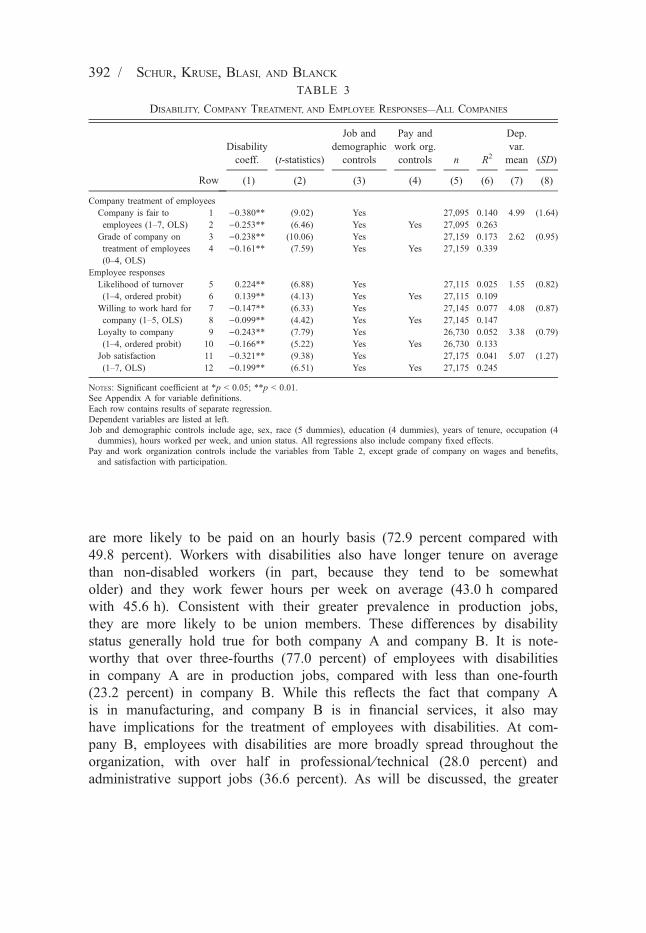
TABLE 3
DISABILITY, COMPANY TREATMENT, AND EMPLOYEE RESPONSES—ALL COMPANIES
Row
Disabilitycoeff. (t-statistics)
Job anddemographiccontrols
Pay andwork org.controls n R2
Dep.var.mean (SD)
(1) (2) (3) (4) (5) (6) (7) (8)
Company treatment of employeesCompany is fair to
employees (1–7, OLS)
1 )0.380** (9.02) Yes 27,095 0.140 4.99 (1.64)
2 )0.253** (6.46) Yes Yes 27,095 0.263Grade of company ontreatment of employees(0–4, OLS)
3 )0.238** (10.06) Yes 27,159 0.173 2.62 (0.95)4 )0.161** (7.59) Yes Yes 27,159 0.339
Employee responsesLikelihood of turnover(1–4, ordered probit)
5 0.224** (6.88) Yes 27,115 0.025 1.55 (0.82)6 0.139** (4.13) Yes Yes 27,115 0.109
Willing to work hard forcompany (1–5, OLS)
7 )0.147** (6.33) Yes 27,145 0.077 4.08 (0.87)8 )0.099** (4.42) Yes Yes 27,145 0.147
Loyalty to company(1–4, ordered probit)
9 )0.243** (7.79) Yes 26,730 0.052 3.38 (0.79)10 )0.166** (5.22) Yes Yes 26,730 0.133
Job satisfaction(1–7, OLS)
11 )0.321** (9.38) Yes 27,175 0.041 5.07 (1.27)12 )0.199** (6.51) Yes Yes 27,175 0.245
NOTES: Significant coefficient at *p < 0.05; **p < 0.01.See Appendix A for variable definitions.Each row contains results of separate regression.Dependent variables are listed at left.Job and demographic controls include age, sex, race (5 dummies), education (4 dummies), years of tenure, occupation (4dummies), hours worked per week, and union status. All regressions also include company fixed effects.
Pay and work organization controls include the variables from Table 2, except grade of company on wages and benefits,and satisfaction with participation.
392 / SCHUR, KRUSE, BLASI, AND BLANCK
are more likely to be paid on an hourly basis (72.9 percent compared with49.8 percent). Workers with disabilities also have longer tenure on averagethan non-disabled workers (in part, because they tend to be somewhatolder) and they work fewer hours per week on average (43.0 h comparedwith 45.6 h). Consistent with their greater prevalence in production jobs,they are more likely to be union members. These differences by disabilitystatus generally hold true for both company A and company B. It is note-worthy that over three-fourths (77.0 percent) of employees with disabilitiesin company A are in production jobs, compared with less than one-fourth(23.2 percent) in company B. While this reflects the fact that company Ais in manufacturing, and company B is in financial services, it also mayhave implications for the treatment of employees with disabilities. At com-pany B, employees with disabilities are more broadly spread throughout theorganization, with over half in professional ⁄ technical (28.0 percent) andadministrative support jobs (36.6 percent). As will be discussed, the greater
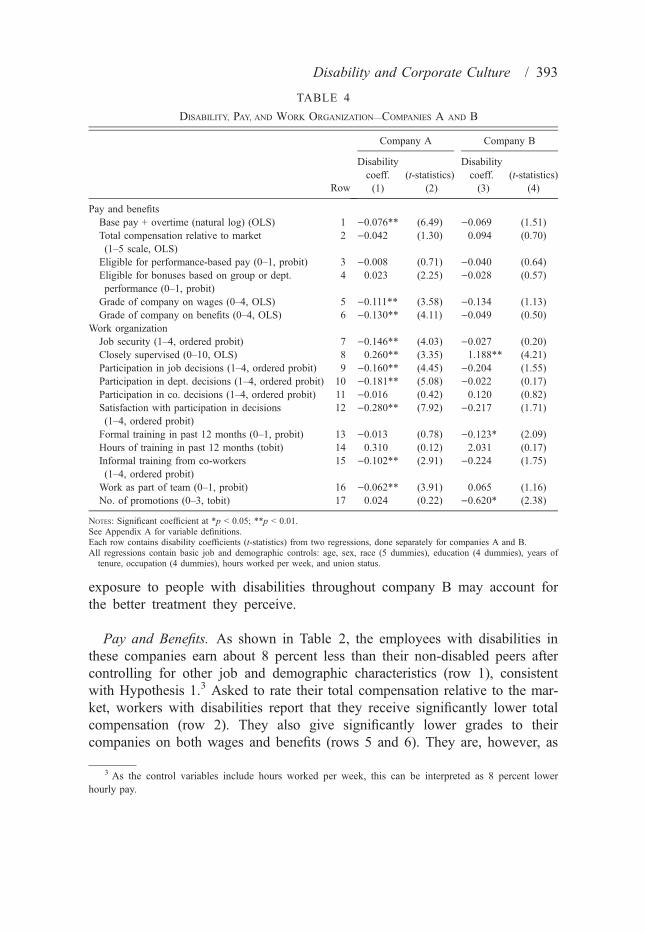
TABLE 4
DISABILITY, PAY, AND WORK ORGANIZATION—COMPANIES A AND B
Row
Company A Company B
Disabilitycoeff.(1)
(t-statistics)(2)
Disabilitycoeff.(3)
(t-statistics)(4)
Pay and benefitsBase pay + overtime (natural log) (OLS) 1 )0.076** (6.49) )0.069 (1.51)Total compensation relative to market(1–5 scale, OLS)
2 )0.042 (1.30) 0.094 (0.70)
Eligible for performance-based pay (0–1, probit) 3 )0.008 (0.71) )0.040 (0.64)Eligible for bonuses based on group or dept.performance (0–1, probit)
4 0.023 (2.25) )0.028 (0.57)
Grade of company on wages (0–4, OLS) 5 )0.111** (3.58) )0.134 (1.13)Grade of company on benefits (0–4, OLS) 6 )0.130** (4.11) )0.049 (0.50)
Work organizationJob security (1–4, ordered probit) 7 )0.146** (4.03) )0.027 (0.20)Closely supervised (0–10, OLS) 8 0.260** (3.35) 1.188** (4.21)Participation in job decisions (1–4, ordered probit) 9 )0.160** (4.45) )0.204 (1.55)Participation in dept. decisions (1–4, ordered probit) 10 )0.181** (5.08) )0.022 (0.17)Participation in co. decisions (1–4, ordered probit) 11 )0.016 (0.42) 0.120 (0.82)Satisfaction with participation in decisions(1–4, ordered probit)
12 )0.280** (7.92) )0.217 (1.71)
Formal training in past 12 months (0–1, probit) 13 )0.013 (0.78) )0.123* (2.09)Hours of training in past 12 months (tobit) 14 0.310 (0.12) 2.031 (0.17)Informal training from co-workers(1–4, ordered probit)
15 )0.102** (2.91) )0.224 (1.75)
Work as part of team (0–1, probit) 16 )0.062** (3.91) 0.065 (1.16)No. of promotions (0–3, tobit) 17 0.024 (0.22) )0.620* (2.38)
NOTES: Significant coefficient at *p < 0.05; **p < 0.01.See Appendix A for variable definitions.Each row contains disability coefficients (t-statistics) from two regressions, done separately for companies A and B.All regressions contain basic job and demographic controls: age, sex, race (5 dummies), education (4 dummies), years oftenure, occupation (4 dummies), hours worked per week, and union status.
Disability and Corporate Culture / 393
exposure to people with disabilities throughout company B may account forthe better treatment they perceive.
Pay and Benefits. As shown in Table 2, the employees with disabilities inthese companies earn about 8 percent less than their non-disabled peers aftercontrolling for other job and demographic characteristics (row 1), consistentwith Hypothesis 1.3 Asked to rate their total compensation relative to the mar-ket, workers with disabilities report that they receive significantly lower totalcompensation (row 2). They also give significantly lower grades to theircompanies on both wages and benefits (rows 5 and 6). They are, however, as
3 As the control variables include hours worked per week, this can be interpreted as 8 percent lowerhourly pay.
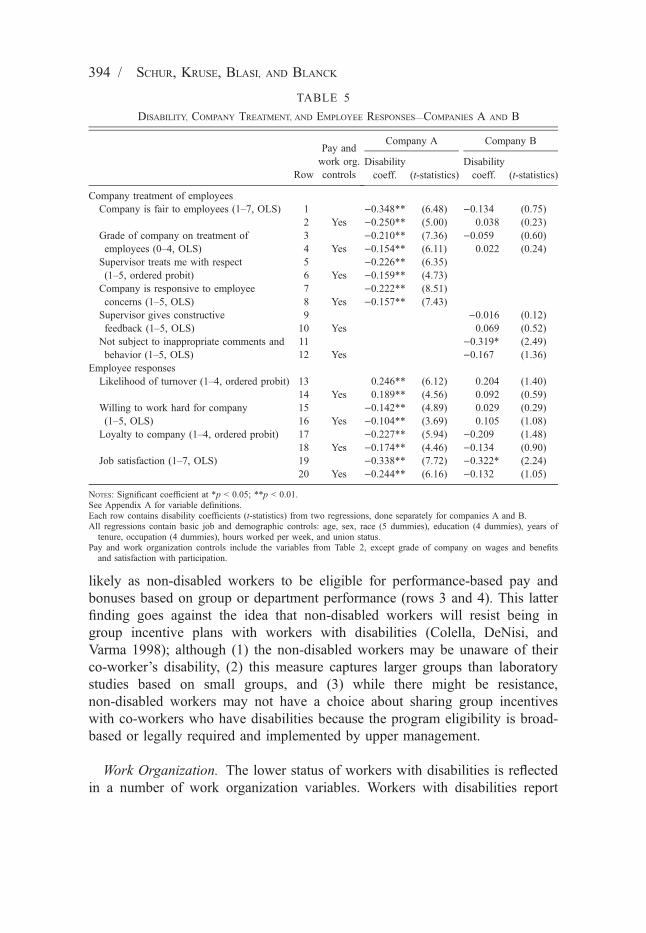
TABLE 5
DISABILITY, COMPANY TREATMENT, AND EMPLOYEE RESPONSES—COMPANIES A AND B
Row
Pay andwork org.controls
Company A Company B
Disabilitycoeff. (t-statistics)
Disabilitycoeff. (t-statistics)
Company treatment of employeesCompany is fair to employees (1–7, OLS) 1
Yes)0.348** (6.48) )0.134 (0.75)
2 )0.250** (5.00) 0.038 (0.23)Grade of company on treatment ofemployees (0–4, OLS)
3Yes
)0.210** (7.36) )0.059 (0.60)4 )0.154** (6.11) 0.022 (0.24)
Supervisor treats me with respect(1–5, ordered probit)
5Yes
)0.226** (6.35)6 )0.159** (4.73)
Company is responsive to employeeconcerns (1–5, OLS)
7Yes
)0.222** (8.51)8 )0.157** (7.43)
Supervisor gives constructivefeedback (1–5, OLS)
9Yes
)0.016 (0.12)10 0.069 (0.52)
Not subject to inappropriate comments andbehavior (1–5, OLS)
11Yes
)0.319* (2.49)12 )0.167 (1.36)
Employee responsesLikelihood of turnover (1–4, ordered probit) 13
Yes0.246** (6.12) 0.204 (1.40)
14 0.189** (4.56) 0.092 (0.59)Willing to work hard for company(1–5, OLS)
15Yes
)0.142** (4.89) 0.029 (0.29)16 )0.104** (3.69) 0.105 (1.08)
Loyalty to company (1–4, ordered probit) 17Yes
)0.227** (5.94) )0.209 (1.48)18 )0.174** (4.46) )0.134 (0.90)
Job satisfaction (1–7, OLS) 19Yes
)0.338** (7.72) )0.322* (2.24)20 )0.244** (6.16) )0.132 (1.05)
NOTES: Significant coefficient at *p < 0.05; **p < 0.01.See Appendix A for variable definitions.Each row contains disability coefficients (t-statistics) from two regressions, done separately for companies A and B.All regressions contain basic job and demographic controls: age, sex, race (5 dummies), education (4 dummies), years oftenure, occupation (4 dummies), hours worked per week, and union status.
Pay and work organization controls include the variables from Table 2, except grade of company on wages and benefitsand satisfaction with participation.
394 / SCHUR, KRUSE, BLASI, AND BLANCK
likely as non-disabled workers to be eligible for performance-based pay andbonuses based on group or department performance (rows 3 and 4). This latterfinding goes against the idea that non-disabled workers will resist being ingroup incentive plans with workers with disabilities (Colella, DeNisi, andVarma 1998); although (1) the non-disabled workers may be unaware of theirco-worker’s disability, (2) this measure captures larger groups than laboratorystudies based on small groups, and (3) while there might be resistance,non-disabled workers may not have a choice about sharing group incentiveswith co-workers who have disabilities because the program eligibility is broad-based or legally required and implemented by upper management.
Work Organization. The lower status of workers with disabilities is reflectedin a number of work organization variables. Workers with disabilities report
TABLE
6
DISABILITYEFFECTSANDSITE-LEVELFA
IRNESSANDRESPONSIV
ENESS
Row
Independ
entvariables
Dependent
variables
Likelihoo
dof
turnov
er(ordered
prob
it)
Willing
toworkhard
forcompany
(OLS)
Loyalty
tocompany
(ordered
prob
it)
Job
satisfaction
(OLS)
(1)
(2)
(3)
(4)
Allcompa
nies D
isabilityinteractionwith:
1Highsite-level
fairness
0.086(0.50)
0.069(0.81)
0.07
1(0.52)
0.055(0.39)
2Medium
site-level
fairness
0.150(2.27)*
)0.089(2.13)**
)0.13
1(2.13)*
)0.258(4.45)**
3Low
site-level
fairness
0.287(6.34)**
)0.170(4.04)**
)0.27
4(6.15)**
)0.401(6.44)**
4Highsite-level
fairness
)0.516(10.15
)**
0.270(6.62)**
0.58
1(12.00
)**
0.474(10.82
)**
5Medium
site-level
fairness
)0.363(8.58)**
0.142(5.68)**
0.33
3(11.01)**
0.319(10.16
)**
Low
site-level
fairness
(omitted)
Jobanddemog
raphic
variables
Yes
Yes
Yes
Yes
(Pseud
o)R2
0.042
0.073
0.05
70.055
No.
ofsites
175
175
175
175
n18
,709
18,710
18,423
18,741
Com
pany
ADisabilityinteractionwith:
6Highsite-level
respon
siveness
)0.016(0.07)
0.034(0.33)
0.04
3(0.34)
)0.042(0.25)
7Medium
site-level
responsiveness
0.231(3.38)**
)0.061(1.28)
)0.19
0(2.70)**
)0.231(3.06)*
8Low
site-level
responsiveness
0.191(3.78)**
)0.127(2.73)**
)0.14
1(2.64)**
)0.281(4.14)**
9Highsite-level
responsiveness
)0.402(6.20)**
0.155(4.08)**
0.40
4(7.88)**
0.321(7.73)**
Disability and Corporate Culture / 395
TABLE
6(con
t.)
Row
Independentvariables
Dependent
variables
Likelihoo
dof
turnov
er(ordered
probit)
Willing
toworkhard
forcompany
(OLS)
Loy
alty
tocompany
(ordered
probit)
Job
satisfaction
(OLS)
(1)
(2)
(3)
(4)
10Medium
site-level
respon
siveness
)0.222(4.34)**
0.133(4.71)**
0.238(6.28)**
0.213(5.29)**
Low
site-level
responsiveness
(omitted)
11Sup
ervisortreatswithrespect
)0.252(21.38
)**
0.157(21.11)**
0.304(29.32
)**
0.407(26.75
)**
Jobanddemographic
variables
Yes
Yes
Yes
Yes
(Pseudo)
R2
0.066
0.112
0.086
0.150
No.
ofsites
131
131
131
131
n13
,605
13,601
13,344
13,626
NOTES:Significant
coefficientat
*p<0.05;**p<0.01.
Standarderrors
areadjusted
forwithin-site
correlated
errors.
See
AppendixA
forvariable
definitions.
Jobanddemographic
controls
includeage,
sex,
race
(5dummies),education(4
dummies),yearsof
tenure,occupation
(4dummies),hoursworkedperweek,
andunionstatus.The
regressionsfor‘‘allcompanies’’also
includecompany
fixedeffects.
396 / SCHUR, KRUSE, BLASI, AND BLANCK
Disability and Corporate Culture / 397
having less job security, being more closely supervised, and having lowerlevels of participation in job and department decisions along with lowersatisfaction with participation in decisions (Table 2, rows 7–12). They are alsoless likely than their non-disabled peers to have received formal, company-sponsored training in the last 12 months (row 13), but among those who didreceive training, there was no significant gap in hours of training by disabilitystatus (row 14).Further disadvantage is indicated by lower levels of informal training from
co-workers (row 15). This is important because much learning on the job isthrough informal training and mentoring by peers. This relative lack of informaltraining supports Colella’s observation that co-workers often do not fully acceptemployees with disabilities and fail to integrate them completely into the work-place. The lower levels of training should be expected to lead to expect fewerpromotions, which is consistent with the negative relationship between disabil-ity and promotions (row 16), although the disability gap in promotions is notstatistically significant. One partial explanation for the lower degree of informaltraining may be that workers with disabilities are less likely to work as part ofa team (row 17). These findings provide general support for Hypothesis 1.
Company Treatment of Employees. How do workers with disabilities feelthey are treated by their employers? In Table 3, we analyze how much employ-ees agree with the statement ‘‘overall, this company is fair to its employees,’’and the average grade they give their company on five dimensions (see Appen-dix A). Employees with disabilities give significantly lower average scores onthese measures (rows 1 and 3, column 1), consistent with Hypothesis 2. Con-trolling further for the pay, benefits, and work organization variables fromTable 2, the disability gaps are reduced by about one-third, which is consistentwith Hypothesis 3, but the gaps remain statistically significant (rows 2 and 4).In other words, the unfair treatment perceived by workers with disabilities isonly partially captured by disparities in pay and work organization variables,indicating they also perceive unfair treatment in other areas (which is exploredwith special questions on the company A and B surveys).
Employee Outcomes. How do employees with disabilities respond to thedisparities they face? Table 3 shows, compared with the non-disabled workers,they report a greater average likelihood of turnover, less loyalty and willing-ness to work hard for the company, and lower average levels of job satisfac-tion (rows 5–12, column 1). This may be explained by equity theory, whichpredicts employees become alienated and decrease their work effort when theybelieve they have been unfairly treated (Blanck et al. 2003). Controlling forthe pay and work organization variables, the disability gaps are again reduced
398 / SCHUR, KRUSE, BLASI, AND BLANCK
by about one-third but remain significant (rows 6, 8, 10 and 12). These resultssupport Hypotheses 4 and 5.
Comparison of Disability Disparities Across Companies. Do these dispari-ties or disability gaps exist in all companies and worksites, or just some? In thissection, we compare company A and company B, two large companies withdifferent outcomes. The disability gaps in pay and work organization at eachcompany are presented in Table 4. The results for company A are similar toresults for the overall sample presented in Table 3 (not surprisingly becausecompany A constituted over half of the sample.) In company B, however, thereare significant disability gaps for only three measures—supervision, formal train-ing, and number of promotions. The smaller sample size restricts the power ofthe tests, so it is important to examine effect sizes. The magnitudes and directionof the coefficients suggest employees with disabilities fare relatively better incompany B on four measures—total compensation relative to market, grade ofthe company on benefits, job security, and participation in department decisions.While comparisons on pay and work organization present a mixed picture,
the results are clearer when we examine company treatment of employees inTable 5. In company A, people with disabilities report significantly lowerscores on perceived company fairness and grading of company treatment ofemployees, with coefficients that decline but still are significant after control-ling for pay and work organization variables (Table 5, rows 1–4). Company Aalso shows two disability gaps on measures not available for other companies.Employees with disabilities are significantly less likely than non-disabledemployees to report their supervisors treat them with respect (rows 5 and 6).Colella views lack of respect as an important barrier to the integration ofemployees with disabilities in the workplace. Also, employees with disabilitiesare less likely to report the company is responsive to employee concerns, bothbefore and after controlling for pay and work organization variables (rows 7and 8). As in the overall sample, employees with disabilities at company Areport a higher likelihood of turnover and lower scores on willingness to workhard, company loyalty, and job satisfaction measures (rows 13–20).Company B provides a different picture. There are no significant differ-
ences between employees with and without disabilities on perceived companyfairness or on the grades they give the company on treatment of employees,before and after controlling for pay and work organization variables (rows1–4). In contrast to company A where employees with disabilities reportedworse relations with their supervisors, employees with disabilities in companyB were as likely as non-disabled employees to report that their supervisorsgive constructive feedback (rows 9 and 10). The climate is not, however, idealfor workers with disabilities at company B. In another measure available only
Disability and Corporate Culture / 399
for this company, employees with disabilities were significantly less likely toreport they are not subject to inappropriate comments and behavior (row 11).This may help explain why employees with disabilities report significantlylower levels of job satisfaction (row 19). The gaps in inappropriate treatmentand in job satisfaction at company B become smaller, however, and lose statis-tical significance when controlling for pay and work organization variables(rows 12 and 20). In contrast, at company A the disability gap in job satis-faction is larger and remains significant after controlling for pay and workorganization variables. Finally, unlike the employees with disabilities atcompany A, those at company B are not significantly different from theirnon-disabled co-workers in their reported likelihood of turnover, willingnessto work hard for the company, and loyalty to the company.These findings suggest that while some important disability gaps exist at com-
pany B, the company appears to treat workers more equally and the climate ismore hospitable to employees with disabilities than at company A. Some of thedifferences between the companies may be explained by disparities in pay andwork organization—in particular, employees with disabilities at company Aappear to face greater gaps in total compensation, benefits, job security, and par-ticipation in department decisions. However, perceptions of better treatmentappear to operate apart from disparities in pay and work organization, as indi-cated by the persistence of disability gaps in perceived company treatment aftercontrolling for pay and work organization variables at company A, and the lackof such disability gaps either before or after controlling for several disparities inpay and work organization at company B. More supportive and respectful treat-ment on a daily basis—by the company, supervisors, and co-workers—appearsto be a key factor in employees’ job satisfaction and views of the company. Thebetter treatment may stem in part from the broader distribution of employeeswith disabilities throughout company B—they are not concentrated in produc-tion jobs, and many are in professional and technical jobs. As noted, greater con-tact with people with disabilities, particularly in more skilled and higher-statuspositions, helps non-disabled workers overcome negative stereotypes about thecapacities of people with disabilities (Makas 1988). The differences betweencompanies A and B suggest the workplace environment plays an importantmoderating role in the relationship between disability and employee responses,which is consistent with Hypotheses 6 and 7. More formal tests of thesehypotheses are presented next.
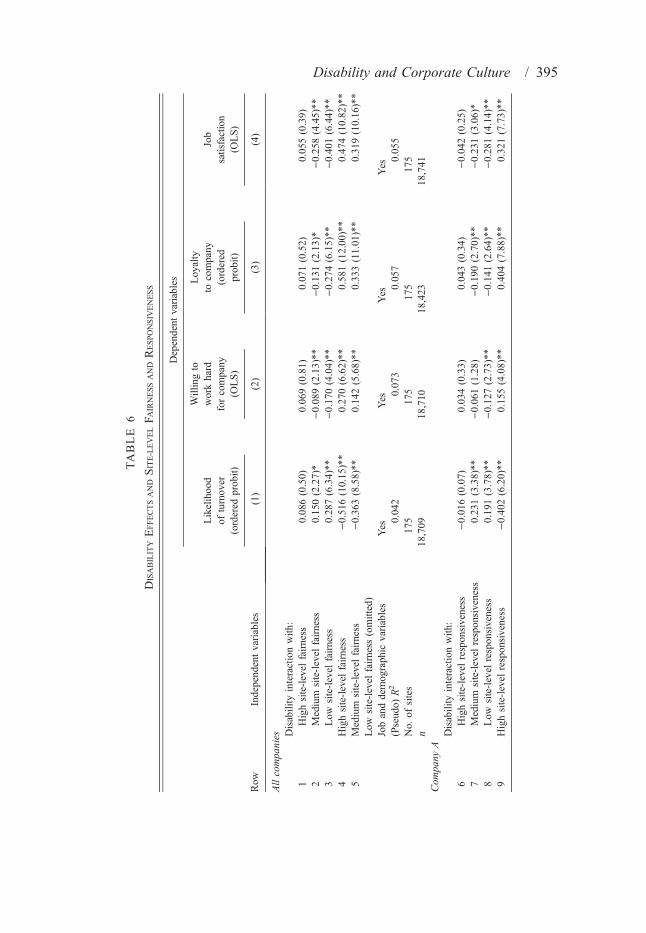
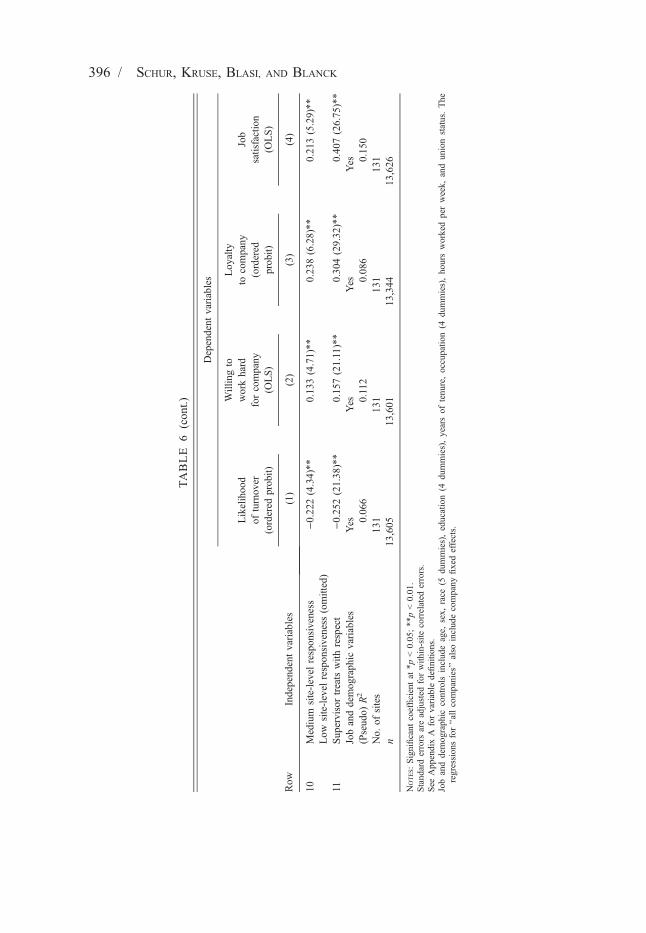
Comparison of Disability Disparities Across Worksites. An alternative way toexamine the importance of workplace climate and culture is to make compari-sons across worksites. There are 175 separate worksites in the entire samplewith at least one employee with a disability, of which 131 belong to company
400 / SCHUR, KRUSE, BLASI, AND BLANCK
A. As noted, comparisons across worksites are useful because employee expe-riences are influenced strongly by their local environment. Company policiesand practices are implemented and interpreted in different ways by local man-agers, supervisors, and co-workers.To obtain site-level measures of company climate, the scores on the com-
pany fairness and responsiveness variables were averaged within each work-site, and the average worksite score was interacted with an employee’sdisability status. While we expect a positive moderating role of company fair-ness and responsiveness (Hypotheses 6 and 7), there is no firm theoreticalbasis for specifying the exact form of this relationship (e.g., whether the rela-tionship is linear, and what types of non-linearities may exist). The relationshipwas tested first by using a disability interaction term alone and with its square,and then by categorical variables to capture non-continuous changes betweendifferent categories. Here, we present results comparing three categories,because they provide a meaningful picture of differences among worksiteswith better and worse perceptions of company treatment.4 Specifically, for eachmeasure we establish three groups based on whether the site-level companytreatment score was above the 90th percentile, between the 50th and 90th per-centiles, or below the 50th percentile. Estimates with other groupings producesimilar results, but this classification is presented because a focus on the top10 percent allows a straightforward examination of how employees with dis-abilities do in the ‘‘best’’ workplaces.Worksites viewed as more fair and responsive by employees in general appear
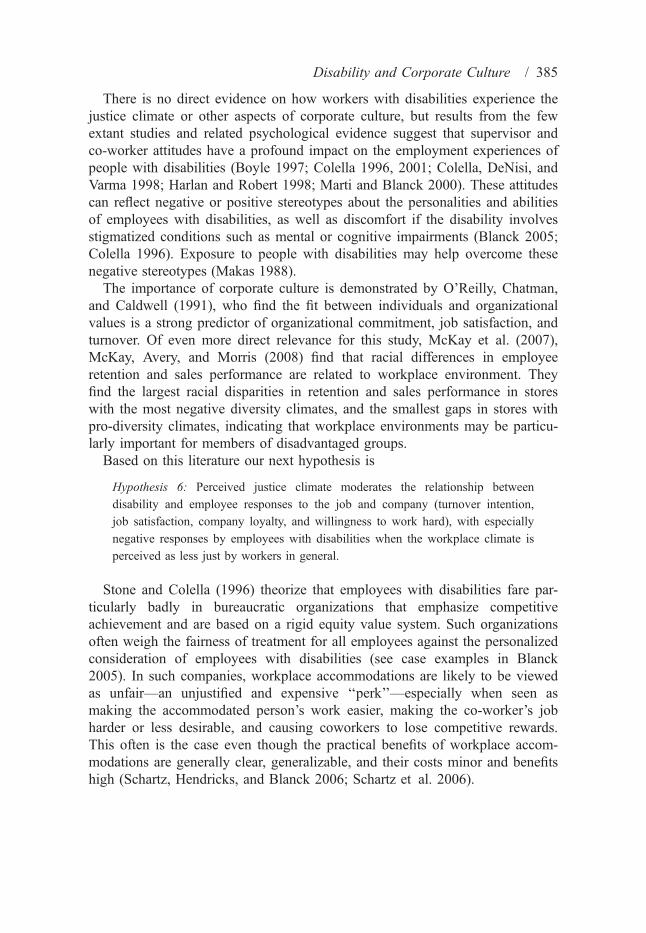
to be particularly beneficial for employees with disabilities. The results inTable 6 show that among the top 10 percent of worksites in perceived fairness,there are no significant differences between employees with and without disabili-ties in measures of likelihood of turnover, willingness to work hard, loyalty, andjob satisfaction (row 1). In contrast, the biggest gaps between workers with andwithout disabilities occur in the worksites with the lowest overall levels ofperceived fairness (row 3). The findings are maintained when controlling for payand work organization variables (not shown). The results in the top half ofTable 6 are consistent with Hypothesis 6, and with the results of McKay et al.(2007), McKay, Avery, and Morris (2008) on the especially strong impact ofdiversity climate on outcomes for African-American employees.Figure 3 illustrates the results for the job satisfaction measure. Individual
job satisfaction increases as the site level fairness score goes up, but it
4 The results using linear and squared terms showed several significant results indicating a positive inter-action between disability status and worksite company treatment scores, but there was no consistent patternacross the four dependent variables. The categories provide a more straightforward way to present and assessthe interactions.
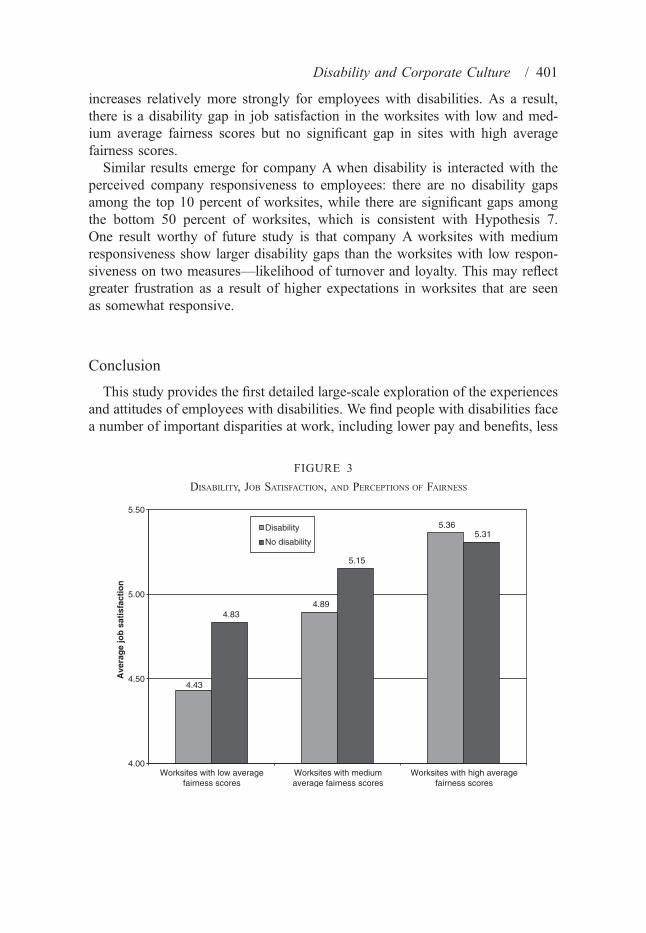
Disability and Corporate Culture / 401
increases relatively more strongly for employees with disabilities. As a result,there is a disability gap in job satisfaction in the worksites with low and med-ium average fairness scores but no significant gap in sites with high averagefairness scores.Similar results emerge for company A when disability is interacted with the
perceived company responsiveness to employees: there are no disability gapsamong the top 10 percent of worksites, while there are significant gaps amongthe bottom 50 percent of worksites, which is consistent with Hypothesis 7.One result worthy of future study is that company A worksites with mediumresponsiveness show larger disability gaps than the worksites with low respon-siveness on two measures—likelihood of turnover and loyalty. This may reflectgreater frustration as a result of higher expectations in worksites that are seenas somewhat responsive.
Conclusion
This study provides the first detailed large-scale exploration of the experiencesand attitudes of employees with disabilities. We find people with disabilities facea number of important disparities at work, including lower pay and benefits, less
4.43
4.89
5.36
4.83
5.15
5.31
4.00
4.50
5.00
5.50
Worksites with low averagefairness scores
Worksites with mediumaverage fairness scores
Worksites with high averagefairness scores
Ave
rag
e jo
b s
atis
fact
ion
Disability
No disability
FIGURE 3
DISABILITY, JOB SATISFACTION, AND PERCEPTIONS OF FAIRNESS
402 / SCHUR, KRUSE, BLASI, AND BLANCK
job security, higher levels of supervision, lower participation in job and depart-ment decisions, and lower levels of company-sponsored formal training andinformal training from co-workers. These gaps contribute to, but do not fullyexplain, the more negative evaluations of company treatment by workers withdisabilities, and their higher likelihood of turnover and their lower levels of com-pany loyalty and job satisfaction. The estimated disparities are consistent withthe hypotheses, except for the lack of a statistically significant disability gap inpromotion opportunities (though the result was in the predicted direction).The disability gaps vary greatly across companies and worksites in ways
that suggest the importance of corporate culture. Our comparison of twofirms—one with and one without significant disability gaps in perceived com-pany treatment of employees—show differences in perceived company treat-ment were only partly explained by differences in pay and work organizationvariables, indicating other factors, such as being treated with respect, play animportant role.Our comparisons across worksites show that in sites where employees in
general report high levels of company fairness and responsiveness, there are nosignificant differences between employees with and without disabilities on mea-sures of job satisfaction, company loyalty, willingness to work hard, and turnoverintention. In contrast, in worksites where employees in general perceive lowerlevels of company fairness and responsiveness, employees with disabilities haveespecially low levels of job satisfaction, loyalty, and willingness to work hard,and express greater turnover intentions, which supports our hypotheses. Thispattern is consistent with Stone and Colella’s (1996) theory that workers withdisabilities fare better in companies viewed as fair and responsive to the needs ofall employees, in part because workplace accommodations are less likely to beviewed as special treatment, while employees with disabilities are likely to fareworse in unresponsive and more rigid organizations.These findings strongly suggest company climate and culture have a large
influence on employees with disabilities. As noted, there is a need for futureinvestigation in this area given the limitations of this first study. The sample,though large, may not be representative of other U.S. businesses. The originalsurveys were not designed specifically to study disability issues, and the disabil-ity identifier provides no information on type or severity of disability. There maybe interactions between disability and demographic characteristics—e.g., raceand gender—that provide a more complex and nuanced picture. In futureresearch, it will be valuable to know whether a disability’s onset occurred beforeor after the employee joined the company, because employers may treat currentemployees who acquire a disability differently from job applicants with disabili-ties, for instance in the provision of workplace accommodations (Gunderson andHyatt 1996; Schartz, Hendricks, and Blanck 2006).
Disability and Corporate Culture / 403
Finally, the measures of perceived company treatment of employees onlyscratch the surface of corporate culture, which is a complex phenomenon thathas many theoretical and practical dimensions. Corporate culture is best stud-ied with a variety of methods, including qualitative interviews that explore theoften unconscious or subtle values and assumptions in organizations. As notedby Rousseau, qualitative and quantitative methods are best used togetherbecause ‘‘different levels of culture are amenable to different research meth-ods’’ (Rousseau 1990: 166). In this study, we provide initial quantitative evi-dence that justice climate and other cultural variables make a clear differencefor employees with disabilities. Still, in future and ongoing studies we hope toidentify the mechanisms through which such culture is transmitted and may bechanged over time.This study thus is a first step in exploring the relationship between corporate
culture and the experiences of employees with disabilities. A valuable nextstep is detailed company case studies of disability, corporate culture, and bestpractices that combine quantitative and qualitative data, making comparisonsbetween and within industries (Blanck et al. 2007). This will shed light ona neglected and important area, and help companies develop and assess sys-tematic policies, training, promotion, and hiring programs that benefit peoplewith disabilities and the companies themselves. In particular, this research maylead to greater understanding of why certain companies, consistent with theADA’s core requirements, are more likely to provide workplace accommo-dations to their qualified employees with disabilities (Blanck et al. 2007). Weare only beginning to understand the factors that predict the provision ofaccommodations (Schartz, Hendricks, and Blanck 2006), but we do know theyare crucial to the employment of many workers with disabilities. Ultimately,enhanced understanding of corporate culture and the experiences of employeeswith disabilities may help to improve employment rates, working conditions,and the full acceptance of people with disabilities in the workplace.
REFERENCES
Baldwin, Marjorie L., and William Johnson. 2006. ‘‘A Critical Review of Studies of Discrimination againstWorkers with Disabilities.’’ In Handbook on the Economics of Discrimination, edited by William M.Rodgers III, pp. 119–60. Northampton, MA: Edgar Elgar Publishing.
———, and Edward J. Schumacher. 2002. ‘‘A Note on Job Mobility Among Workers with Disabilities.’’Industrial Relations 41(3):430–41.
Ball, Phoebe, Gregory Monaco, James Schmeling, Helen Schartz, and Peter Blanck. 2005. ‘‘Disability asDiversity in Fortune 100 Companies.’’ Behavioral Sciences and the Law 23(1):97–121.
———, Michael B. Morris, Johnette Hartnette, and Peter Blanck. 2006. ‘‘Breaking the Cycle of Poverty:Asset Accumulation by People with Disabilities.’’ Disability Studies Quarterly, 26(1): Available at:http://www.dsq-sds-archives.org/_articles_html/2006/winter/ball.asp
Becker, Brian, and Mark Huselid. 2006. ‘‘Strategic Human Resource Management: Where Do We Go FromHere?’’ Journal of Management 32:898–925.
404 / SCHUR, KRUSE, BLASI, AND BLANCK
Blanck, Peter. 1994. ‘‘Communicating the Americans with Disabilities Act: Transcending Compliance—Acase report on Sears Roebuck & Co.’’ The Annenberg Washington Program, White Paper,Washington, DC. Available at: http://www.annenberg.northwestern.edu/pubs/sears/.
———. 1996. ‘‘Communicating the Americans with Disabilities Act: Transcending Compliance—1996 Fol-low-up report on Sears, Roebuck & Co.’’ The Annenberg Washington Program Reports, Washington,DC. Available at: http://bbi.syr.edu/publications/blanck_docs/1995-1999/annen_follow_up_96_sears.pdf
———. 2001. ‘‘Civil War Pensions and Disability.’’ Ohio State Law Journal 62:109–249.———. 2005. ‘‘Americans with Disabilities and their Civil Rights: Past, Present, Future.’’ University of
Pittsburgh Law Review 66:687–719.———, Lisa Schur, Douglas Kruse, Susan Schwochau, and Chen Song. 2003. ‘‘Calibrating the Impact of
the ADA’s Employment Provisions.’’ Stanford Law and Policy Review 14:267–90.———, Eve Hill, Charles D. Siegal, and Michael Waterstone. 2005. Disability Civil Rights Law and Policy.
St Paul, MN: Thomson ⁄West.———, Meera Adya, William Myhill, Deepti Samant, and Pei-Chun Chen. 2007. ‘‘Employment of Persons
with Disabilities: Twenty-Five Years Back and Forward.’’ Minnesota Law and Inequality: A Journalof Theory and Practice 25:323–53.
Boyle, Mike A. 1997. ‘‘Social Barriers to Successful Reentry into Mainstream Organizational Culture:Perceptions of People with Disabilities.’’ Human Resource Development Quarterly 8:259–68.
Bruyere, Susanne. 2000. Disability Employment Policies and Practices in Private and Federal SectorOrganizations. Ithaca, NY: Cornell University, Program on Employment and Disability.
———, William A. Erickson, and Joshua T. Ferrentino. 2003. ‘‘Identity and Disability in the Workplace.’’William and Mary Law Review 44(3):1173–96.
Colella, Adrienne. 1996. ‘‘Organizational Socialization of Newcomers with Disabilities: A Framework forFuture Research.’’ Research in Personnel and Human Resources Management 14:351–417.
———. 2001. ‘‘Coworker Distributive Fairness Judgments of the Workplace Accommodation of Employeeswith Disabilities.’’ Academy of Management Review 26:100–16.
———, Angelo DeNisi, and Arup Varma. 1998. ‘‘The Impact of Ratee’s Disability on Performance Judg-ments and Choice as Partner: The Role of Disability-Job Fit Stereotypes and Interdependence ofRewards.’’ Journal of Applied Psychology 83:102–11.
Combs, James, Yongmei Liu, Angela Hall, and David Ketchen. 2006. ‘‘How Much Do High-PerformanceWork Practices Matter? A Meta-analysis of Their Effects on Organizational Performance.’’ PersonnelPsychology 59(3):501–28.
Di Natale, Marisa. 2001. ‘‘Characteristics of and Preference for Alternative Work Arrangements, 1999.’’Monthly Labor Review 124(3):28–49.
Dixon, Karen, Douglas Kruse, and Carl Van Horn 2003. Restricted Access: A Survey of Employers aboutPeople with Disabilities and Lowering Barriers to Work. New Brunswick, NJ: John J. HeldrichCenter for Workforce Development, Rutgers University.
Griffeth, Rodger W., Peter W. Hom, and Stefan Gaertner. 2000. ‘‘A Meta-analysis of Antecedents and Corre-lates of Employee Turnover: Update, Moderator Tests, and Research Implications for the Next Millen-nium.’’ Journal of Management 26(3):463–88.
Gunderson, Morley, and Douglas Hyatt. 1996. ‘‘Do Injured Workers Pay for Reasonable Accommodation?’’Industrial and Labor Relations Review 50:92–103.
Hale, Thomas, Howard Hayghe, and John McNeil 1998. ‘‘Persons with Disabilities: Labor Market Activity,1994.’’ Monthly Labor Review, 121(9):1–12.
Harlan, Sharon L., and Pamela W. Robert. 1998. ‘‘The Social Construction of Disability in Organizations:Why Employers Resist Reasonable Accommodations.’’ Work and Occupations 25:397–435.
Harris Interactive, Inc. 2000. 2000 N.O.D. ⁄Harris Survey of Americans with Disabilities. New York: LouisHarris and Associates.
Hartnette, Johnette, and Peter Blanck. 2003. Temporary Assistance to Needy Families (TANF) and Disability.Unpublished manuscript, University of Iowa, Law, Health Policy and Disability Center.
Klein, Katherine J., and Steve W.J. Kozlowski. 2000. Multilevel Theory, Research, and Methods in Organi-zations: Foundations, Extensions, and New Directions. San Francisco, CA: Jossey-Bass.
Disability and Corporate Culture / 405
Kruse, Douglas. 1998. ‘‘Persons with Disabilities: Demographic, Income, and Health Care Characteristics.’’Monthly Labor Review 121(9):13–22.
———, and Lisa Schur. 2003. ‘‘Employment of People with Disabilities Following the ADA.’’ IndustrialRelations 42:31–66.
Liao, Hui. 2007. ‘‘Do It Right This Time: The Role of Employee Service Recovery Performance inCustomer Perceived Justice and Customer Loyalty After Service Failures.’’ Journal of AppliedPsychology 92:475–89.
———, and Deborah Rupp. 2005. ‘‘The Impact of Justice Climate and Justice Orientation on Work Out-comes: A Cross-level Multifoci Framework.’’ Journal of Applied Psychology 90(2):242–56.
Macky, Keith, and Peter Boxall. 2007. ‘‘The Relationship Between ‘High-Performance Work Practices’ andEmployee Attitudes: An Investigation of Additive and Interaction Effects.’’ International Journal ofHuman Resource Management 18(4):537–67.
Makas, Elaine. 1988. ‘‘Positive Attitudes Toward Disabled People: Disabled and Nondisabled Persons’Perspectives.’’ Journal of Social Issues 44:49–61.
Marti, Mollie W., and Peter Blanck. 2000. ‘‘Attitudes, Behavior, and the ADA.’’ In Employment, Disability,and the Americans with Disabilities Act: Issues in Law, Public Policy, and Research, edited by PeterD. Blanck, pp. 356–84. Evanston, IL: Northwestern University Press.
McAfee, James K., and David McNaughton. 1997a. ‘‘Transitional Outcomes: Job Satisfaction of Workerswith Disabilities—Part One: General Job Satisfaction.’’ Journal of Vocational Rehabilitation 8:135–42.
———, and ———. 1997b. ‘‘Transitional Outcomes: Job Satisfaction of Workers with Disabilities—PartTwo: Satisfaction with Promotions, Pay, Co-workers, Supervision, and Work Conditions.’’ Journal ofVocational Rehabilitation 8:243–51.
McKay, Patrick, Derek Avery, and Mark A. Morris. 2008. ‘‘Mean Racial–Ethnic Differences in EmployeeSales Performance: The Moderating Role of Diversity Climate.’’ Personnel Psychology 61:349–74.
———, ———, Scott Tonadandel, Mark A. Morris, Morela Hernandez, and Michelle R. Hebl. 2007.‘‘Racial Differences in Employee Retention: Are Diversity Climate Perceptions the Key?’’ PersonnelPsychology 60:35–62.
Meyer, John P., David J. Stanley, Lynne Herscovitch, and Laryssa Topolnytsky. 2002. ‘‘Affective, Continu-ance, and Normative Commitment to the Organization: A Meta-analysis of Antecedents, Correlates,and Consequences.’’ Journal of Vocational Behavior 61:20–52.
O’Reilly, Charles A., Jennifer Chatman, and David Caldwell. 1991. ‘‘People and Organizational Culture: AProfile Comparison Approach to Assessing Person–Organization Fit.’’ Academy of Management Jour-nal, 34(3):487–516.
Presser, H., and Barbara Altman. 2002. ‘‘Work Shifts and Disability: A National View.’’ Monthly LaborReview September:11–24.
RRTC. 2007. 2006 Disability Status Reports: United States. Ithaca, NY: Rehabilitation Research and Train-ing Center on Disability Demographics and Statistics, Cornell University.
Rupp, Deborah, Michael Bashshur, and Hui Liao 2007. ‘‘Justice Climate Past, Present, and Future: Modelsof Structure and Emergence.’’ In Research in Multi-Level Issues, Vol. 6, edited by Fred Dansereau,and Francis Yammarino, pp. 357–96. Oxford: Elsevier.
Sandler, Len, and Peter Blanck. 2004. ‘‘Accessibility as a Corporate Article of Faith at Microsoft: CaseStudy of Corporate Culture and Human Resource Dimensions.’’ Behavioral Sciences and the Law23:39–64.
Schartz, Helen, D.J. Hendricks, and Peter Blanck. 2006. ‘‘Workplace Accommodations: Evidence-BasedOutcomes.’’ Work 27:345–54.
———, Kevin M. Schartz, D.J. Hendricks, and Peter Blanck. 2006. ‘‘Workplace Accommodations: Empiri-cal Study of Current Employees.’’ Mississippi Law Journal 75:917–43.
Schur, Lisa. 2002. ‘‘Dead-End Jobs or a Path to Economic Well-Being? The Consequences of Non-StandardWork among People with Disabilities.’’ Behavioral Sciences and the Law 20:601–20.
———. 2003. ‘‘Barriers or Opportunities? The Causes of Contingent and Part-time Work Among Peoplewith Disabilities.’’ Industrial Relations 42:589–622.

406 / SCHUR, KRUSE, BLASI, AND BLANCK
———, Douglas Kruse, and Peter Blanck. 2005. ‘‘Corporate Culture and the Employment of Persons withDisabilities.’’ Behavioral Sciences and the Law 23:3–20.
Spataro, Sandra E. 2005. ‘‘Diversity in Context: How Organizational Culture Shapes Reactions to Workerswith Disabilities and Others who are Demographically Different.’’ Behavioral Sciences and the Law23:21–38.
Stapleton, David C., and Richard Burkhauser (eds). 2003. The Decline in the Employment of People withDisabilities: A Policy Puzzle. Kalamazoo, MI: W.E. Upjohn Institute for Employment Research.
Stone, Dianna, and Adrienne Colella. 1996. ‘‘A Model of Factors Affecting the Treatment of Disabled Indi-viduals in Organizations.’’ Academy of Management Review 21:352–401.
Uppal, Sharanjit. 2005. ‘‘Disability, Workplace Characteristics, and Job Satisfaction.’’ International Journalof Management 26(4):336–49.
Wilgosh, Lorraine R., and D. Skaret. 1987. ‘‘Employer Attitudes Toward Hiring Individuals with Disabili-ties: A Review of the Recent Literature.’’ Canadian Journal of Rehabilitation 1:89–98.
Yelin, Ed, and Laura Trupin. 2003. ‘‘Disability and the Characteristics of Employment.’’ Monthly LaborReview May:20–31.
Appendix A: Variable Definitions and Descriptive Statistics
Pay and Work Organization
Base Pay Plus Overtime. Yearly base pay + overtime (natural log),mean = 10.86, SD = 0.57, n = 24,687.Total Compensation Relative to Market. ‘‘Do you believe your total com-
pensation is higher or lower than those of employees with similar experienceand job descriptions in other companies in your region?’’ (1–5 scale,1 = lower, 5 = higher), mean = 2.93, SD = 1.01, n = 25,722.Eligible for Performance-Based Pay. ‘‘In your job, are you eligible for any
type of performance-based pay, such as individual or group bonuses, or anytype of profit-sharing?’’ (0 = no, 1 = yes), mean = 0.850, SD = 0.357,n = 29,798.Eligible for Bonuses Based on Group or Department Performance. ‘‘In your
job, are you eligible for any type of performance-based pay, such as individualor group bonuses, or any type of profit-sharing? What does the size of theseperformance-based payments depend on? Workgroup or department perfor-mance’’ (0 = no, 1 = yes), mean = 0.213, SD = 0.410, n = 29,803.Grade of Company on Wages. ‘‘If you were to rate how well this company
takes care of workers on a scale similar to school grades, what grade wouldyou give in these areas? Paying good wages’’ (0–4 scale, 0 = F, 4 = A),mean = 2.67, SD = 1.01, n = 29,660.Grade of Company on Benefits. ‘‘If you were to rate how well this company
takes care of workers on a scale similar to school grades, what grade wouldyou give in these areas? Giving fair benefits to workers’’ (0–4 scale, 0 = F,4 = A), mean = 2.76, SD = 1.03, n = 29,623.
Disability and Corporate Culture / 407
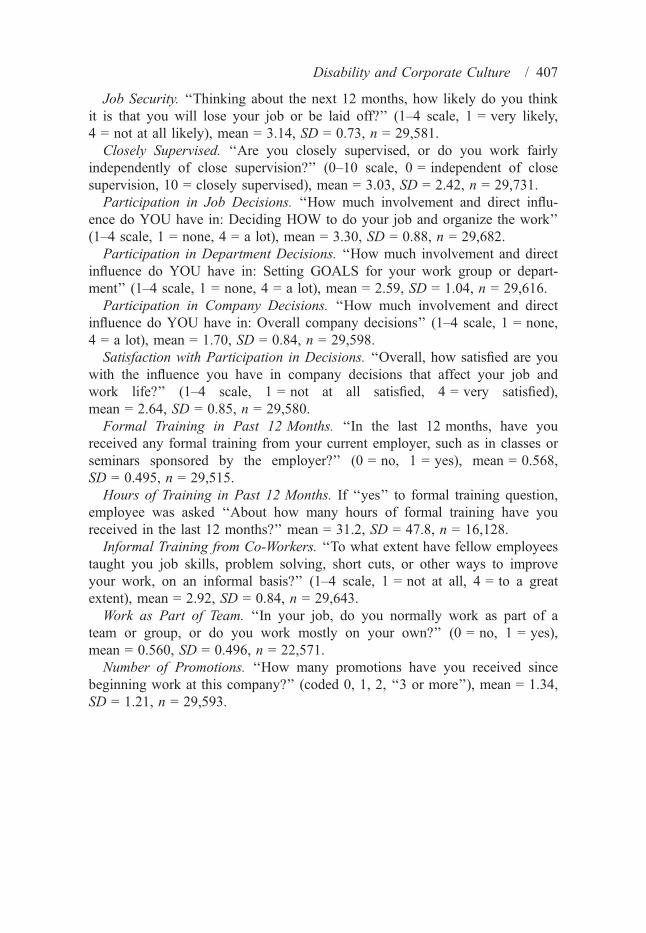
Job Security. ‘‘Thinking about the next 12 months, how likely do you thinkit is that you will lose your job or be laid off?’’ (1–4 scale, 1 = very likely,4 = not at all likely), mean = 3.14, SD = 0.73, n = 29,581.Closely Supervised. ‘‘Are you closely supervised, or do you work fairly
independently of close supervision?’’ (0–10 scale, 0 = independent of closesupervision, 10 = closely supervised), mean = 3.03, SD = 2.42, n = 29,731.Participation in Job Decisions. ‘‘How much involvement and direct influ-
ence do YOU have in: Deciding HOW to do your job and organize the work’’(1–4 scale, 1 = none, 4 = a lot), mean = 3.30, SD = 0.88, n = 29,682.Participation in Department Decisions. ‘‘How much involvement and direct
influence do YOU have in: Setting GOALS for your work group or depart-ment’’ (1–4 scale, 1 = none, 4 = a lot), mean = 2.59, SD = 1.04, n = 29,616.Participation in Company Decisions. ‘‘How much involvement and direct
influence do YOU have in: Overall company decisions’’ (1–4 scale, 1 = none,4 = a lot), mean = 1.70, SD = 0.84, n = 29,598.Satisfaction with Participation in Decisions. ‘‘Overall, how satisfied are you
with the influence you have in company decisions that affect your job andwork life?’’ (1–4 scale, 1 = not at all satisfied, 4 = very satisfied),mean = 2.64, SD = 0.85, n = 29,580.Formal Training in Past 12 Months. ‘‘In the last 12 months, have you
received any formal training from your current employer, such as in classes orseminars sponsored by the employer?’’ (0 = no, 1 = yes), mean = 0.568,SD = 0.495, n = 29,515.Hours of Training in Past 12 Months. If ‘‘yes’’ to formal training question,
employee was asked ‘‘About how many hours of formal training have youreceived in the last 12 months?’’ mean = 31.2, SD = 47.8, n = 16,128.Informal Training from Co-Workers. ‘‘To what extent have fellow employees
taught you job skills, problem solving, short cuts, or other ways to improveyour work, on an informal basis?’’ (1–4 scale, 1 = not at all, 4 = to a greatextent), mean = 2.92, SD = 0.84, n = 29,643.Work as Part of Team. ‘‘In your job, do you normally work as part of a
team or group, or do you work mostly on your own?’’ (0 = no, 1 = yes),mean = 0.560, SD = 0.496, n = 22,571.Number of Promotions. ‘‘How many promotions have you received since
beginning work at this company?’’ (coded 0, 1, 2, ‘‘3 or more’’), mean = 1.34,SD = 1.21, n = 29,593.
408 / SCHUR, KRUSE, BLASI, AND BLANCK
Company Treatment of Employees
Company fair to Employees. ‘‘Overall, this company is fair to its employ-ees’’ (1–7 scale, 1 = strongly disagree, 7 = strongly agree), mean = 4.94,SD = 1.65, n = 27,130.Grade of Company on Treatment of Employees. This measure is built on an
average of the following five items, which has an alpha of 0.930. ‘‘If you wereto rate how well this company takes care of workers on a scale similar toschool grades, what grade would you give in these areas? (a) Sharing informa-tion with employees, b) Creating a sense of common purpose in the company,c) Trustworthiness in keeping its promises, d) Accurate information aboutcompany performance, e) Overall relations with employees’’ (0–4 scale, 0 = F,4 = A), mean = 2.58, SD = 0.94, n = 27,194.Supervisor Treats me with Respect (company A only). ‘‘Please indicate the
degree to which you agree with these statements about your facility: My super-visor treats me with respect’’ (1–5 scale, 1 = strongly disagree, 5 = stronglyagree), mean = 3.88, SD = 1.07, n = 15,878.Company is Responsive to Employee Concerns (company A only). This mea-
sure is built on an average of the following 17 items, which has an alpha of0.942. ‘‘Please indicate the degree to which you agree with these statementsabout your facility:
I feel my ideas and opinions count on the job.I get the information I need to do my job.My advice on how to deal with problems or work related issues isasked for regularly.
We are kept informed of important issues in the organization.My suggestions and complaints are taken seriously.I am kept informed about changes affecting my work.When changes affecting my area or work are being considered, myideas are asked for.
Problem solving is pushed to the lowest appropriate level here.Decision-making is pushed to the lowest appropriate level here.Overall, this organization is a good place to work.Decisions that are made and actions taken on a daily basis areconsistent with the division’s stated goals and direction.
Management follows through on promises and commitments to me.Management makes a real effort to understand my concerns.Management follows through on promises and commitments to us.I trust staff level management in this division.I trust upper management in this division.Employees here have confidence in leadership.’’
Disability and Corporate Culture / 409
(1–5 scale, 1 = strongly disagree, 5 = strongly agree), mean = 3.14,SD = 0.82, n = 15,971
Not Subject to Inappropriate Comments and Behavior (company B only).‘‘How much do you agree or disagree with the following statements? At work,I feel that I am treated with respect and not subject to inappropriate commentsor behavior.’’ (1–5 scale, 1 = strongly disagree, 5 = strongly agree),mean = 4.06, SD = 1.08, n = 1074.Supervisor Gives Constructive Feedback (company B only). ‘‘How much do
you agree or disagree with the following statements? In the last 6 months, mysupervisor has given me constructive feedback so that I can do a better job.’’(1–5 scale, 1 = strongly disagree, 5 = strongly agree), mean = 3.69,SD = 1.16, n = 1077.
Employee Responses
Likelihood of Turnover. ‘‘How likely is it that you will decide to look hardfor a job with another organization within the next 12 months? (1–4 scale,1 = not at all likely, 4 = already looking), mean = 1.54, SD = 0.82,n = 27,149.Willing to Work Hard for Company. ‘‘To what extent do you agree or dis-
agree with this statement? ‘I am willing to work harder than I have to in orderto help the company I work for succeed?’’’ (1–5 scale, 1 = strongly disagree,5 = strongly agree), mean = 4.05, SD = 0.88, n = 27,180.Loyalty. How much loyalty would you say you feel toward the company
you work for as a whole? (1–4 scale, no loyalty at all ⁄only a little ⁄ some ⁄alot), mean = 3.35, SD = 0.80, n = 26,763.Job Satisfaction. ‘‘How satisfied are you in your job?’’ (1–7 scale, 1 = com-
pletely dissatisfied, 7 = completely satisfied), mean = 5.07, SD = 1.27,n = 27,210.
Appendix B: Regression Specifications
The estimating equations for regressions in Tables 2 and 3 are:
Y1 ¼ aþ b1 � disabþ b2 � X1 þ b3 � Dj þ e ð1Þ
Y2;Y3 ¼ aþ b1 � disabþ b2 � X1 þ b3 � Y1 þ b4 � Dj þ e ð2Þ
410 / SCHUR, KRUSE, BLASI, AND BLANCK
where Y1 is the pay and work organization measures; Y2 is the measures ofperceived company treatment; Y3 is the measures of employee outcomes; disabis the employee reports disability; X1 is the vector of basic job and demo-graphic variables; Dj is the vector of firm dummy variables; e is the error term;a, b1, b2, b3, b4, and b5 are coefficients.The use of company fixed effects adjusts for any company differences in
how workers are treated in general. Standard regressions may also be taintedby selection bias, as both observable and unobservable characteristics may leadpeople to select, or be selected into, employment. This dataset does not haveinformation on non-employed people. Therefore, we constructed a Heckmanselection term based on estimates from employed and non-employed people inthe 2005 American Community Survey. The selection term was tested in allregressions but its inclusion never made a noteworthy difference in the coeffi-cients of interest (available on request), so results without the selection termare reported here.The type of regression model employed depends upon the measure: OLS
regressions are used to predict standard continuous variables, probits are usedto predict binary variables, ordered probits are used to predict variables wherethere is a natural ordering but the distances between values may not be equiva-lent, and tobits are used for continuous variables with censoring at either end.Table 6 contains results of multi-level models that use site-level averages of
perceived company fairness and responsiveness to predict individual-leveloutcomes. We examine whether site-level averages of these two Y2 variablesinteract with disability in predicting the Y3 variables, based on the thirdestimating equation:
Y3 ¼ aþ b1 � disabþ b2�Y2 � disabþ b3�Y2þb4 � X1 þ b5 � Dj þ e ð3Þwhere Y2 is the site-level mean of fairness or responsiveness measure; othervariables as defined above.Examination of ANOVA and intraclass correlation results show the use of mul-
tilevel modeling is justified (Klein and Kozlowski 2000). The ANOVA scores forthe fairness and responsiveness measures are (respectively) 11.74 and 10.30(significant at the 0.0001 level), the intraclass correlations are 0.092 and 0.082,and the estimated reliabilities of the worksite mean are 0.915 and 0.903. Theregressions adjust for correlated errors within worksites so the standard errorswill not be understated.
Top Related