


Languages
Pages
Legal


Call Toll Free 1800-425-8282
Initial Public Offer - Note
Issue Highlights:
Issuer: Security and Intelligence Services (SIS) Ltd
Issue Type: 100% Book Built Issue IPO
Issue Open: Monday, July 31, 2017
Issue Close: Wednesday, Aug 02, 2017
Issue Size (Rs)^: Fresh issue of shares aggregating to Rs.
362.25 crores and Offer for Sale of 51,20,619 equity shares.
Face Value: Rs.10 per Equity Share
Price Band: Rs. 805 – Rs. 815 per Equity Share
Minimum Order Quantity Retail: 18 Shares and in
multiples thereof
Maximum Bid amount for Retail: Rs. 2 Lakhs
Listing: NSE & BSE
Issue Size and Investor Category Allocation
Total Issue Size: 95,65,404 Equity Shares^
QIB: 75% of the issue size (71,74,054 Equity Shares^)
NIB: 15% of the issue size (14,34,810 Equity Shares^)
Retail: 10% of the issue size (9,56,540 Equity Shares^)
^ Upper Price Band
Book Running Lead Managers:
Axis Capital, ICICI Securities, IIFL Holdings, Kotak Mahindra
Capital, SBI Capital Markets, Yes Securities, IDBI Capital
Registrar:
Link Intime India Pvt Ltd
Key Business Strategies:
Grow businesses across customer segments
Use and upgrade technology to improve productivity and
customer satisfaction
Leverage existing branch infrastructure to achieve
operational synergies
Inorganic growth through strategic acquisitions
Key Strengths:
Diverse portfolio of private security and facility
management services
Leader in providing security services in India and
Australia
Second largest cash logistics service provider in India
Leading position in facility management services in India
Widespread and integrated branch network in India
Diverse customer base
Established systems and processes leading to a scalable
business model
Experienced management and operational team
Objects of the Issue:
1. To achieve the benefits of listing the Equity Shares on the
Stock Exchanges and for the Offer for Sale of 51,20,619
Equity Shares.
2. General Corporate Purpose.
Public issue of 95,65,404 equity shares of Rs. 10/- each
(“equity shares”) of Security and Intelligence Services Ltd
(Company or Issuer).
About the Issuer:
It is a leading provider of private security and facility
management services in India. Portfolio of services includes
private security services, comprising of security services,
cash logistics services, electronic security services and
home alarm monitoring and response services along with
facility services.
It has developed portfolio of services in order to cater to the
needs of diverse consumer segments, including, business
entities, Government organizations and households, and to
leverage the growth and potential of such customer
segments in India.
It has deep geographical reach for manpower sourcing and
training and currently operates 17 training academies
across India and four training academies across Australia.
It has employed 133,551 personnel in India and rendered
security and facility management services at 10,224
customer premises across India.
Total revenue grew at a CAGR of 12.36% to Rs. 38,516.82
million for Fiscal Year 2016 from Rs. 24,161.11 million for
Fiscal Year 2012.
Revenue from Operations (Rs. Millions)
Net Profit After Tax (Rs. Millions)
5665.23
8069.03
10340.57
12736.78
02000400060008000
100001200014000
FY 13 FY 14 FY 15 FY 16
298.93332.15
246.38
339.08
0
100
200
300
400
FY 13 FY 14 FY 15 FY 16
Security and Intelligence Services Ltd
Security and Intelligence Services Ltd
Call Toll Free 1800-425-8282
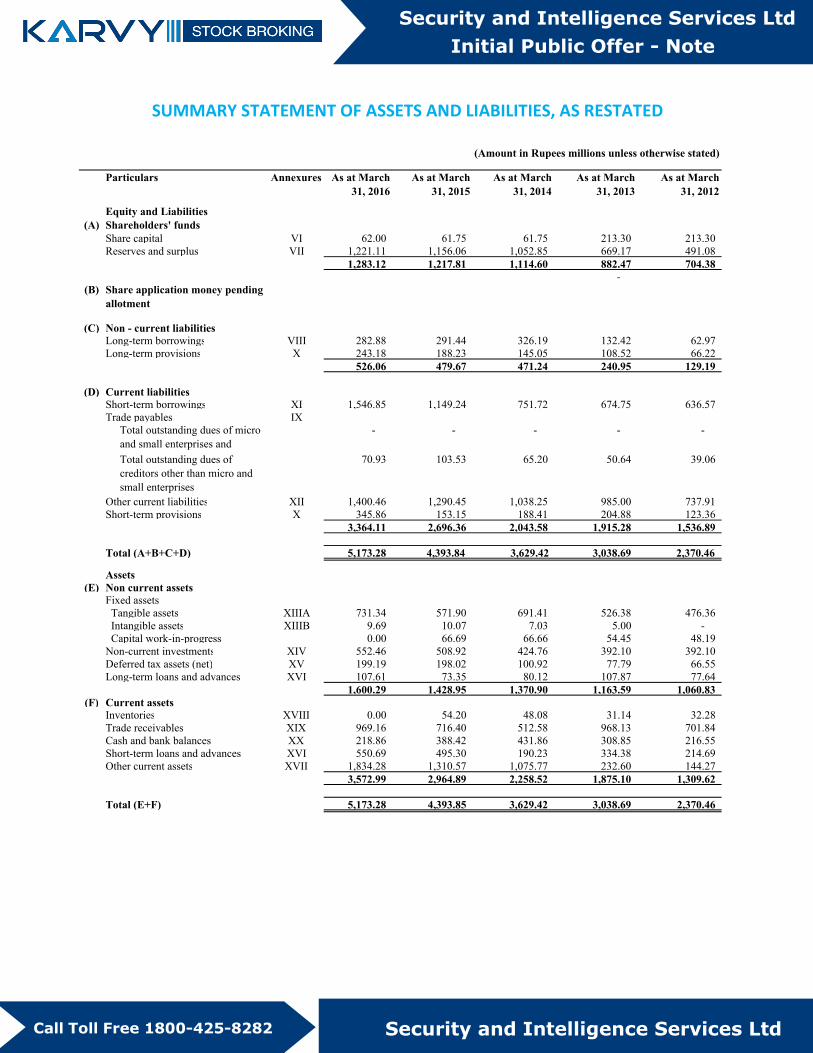
SUMMARY STATEMENT OF ASSETS AND LIABILITIES, AS RESTATED
Initial Public Offer - Note
Security and Intelligence Services Ltd
Security and Intelligence Services Ltd
(Amount in Rupees millions unless otherwise stated)
Particulars Annexures As at March 31, 2016
As at March 31, 2015
As at March 31, 2014
As at March 31, 2013
As at March 31, 2012
Equity and Liabilities(A) Shareholders' funds
Share capital VI 62.00 61.75 61.75 213.30 213.30 Reserves and surplus VII 1,221.11 1,156.06 1,052.85 669.17 491.08
1,283.12 1,217.81 1,114.60 882.47 704.38 -
(B) Share application money pending allotment
(C) Non - current liabilities Long-term borrowings VIII 282.88 291.44 326.19 132.42 62.97 Long-term provisions X 243.18 188.23 145.05 108.52 66.22
526.06 479.67 471.24 240.95 129.19
(D) Current liabilities Short-term borrowings XI 1,546.85 1,149.24 751.72 674.75 636.57 Trade payables IX
Total outstanding dues of micro and small enterprises and
- - - - -
Total outstanding dues of creditors other than micro and small enterprises
70.93 103.53 65.20 50.64 39.06
Other current liabilities XII 1,400.46 1,290.45 1,038.25 985.00 737.91 Short-term provisions X 345.86 153.15 188.41 204.88 123.36
3,364.11 2,696.36 2,043.58 1,915.28 1,536.89
Total (A+B+C+D) 5,173.28 4,393.84 3,629.42 3,038.69 2,370.46
Assets(E) Non current assets
Fixed assets Tangible assets XIIIA 731.34 571.90 691.41 526.38 476.36 Intangible assets XIIIB 9.69 10.07 7.03 5.00 - Capital work-in-progress 0.00 66.69 66.66 54.45 48.19 Non-current investments XIV 552.46 508.92 424.76 392.10 392.10 Deferred tax assets (net) XV 199.19 198.02 100.92 77.79 66.55 Long-term loans and advances XVI 107.61 73.35 80.12 107.87 77.64
1,600.29 1,428.95 1,370.90 1,163.59 1,060.83 (F) Current assets
Inventories XVIII 0.00) 54.20 48.08 31.14 32.28 Trade receivables XIX 969.16 716.40 512.58 968.13 701.84 Cash and bank balances XX 218.86 388.42 431.86 308.85 216.55 Short-term loans and advances XVI 550.69 495.30 190.23 334.38 214.69 Other current assets XVII 1,834.28 1,310.57 1,075.77 232.60 144.27
3,572.99 2,964.89 2,258.52 1,875.10 1,309.62
Total (E+F) 5,173.28 4,393.85 3,629.42 3,038.69 2,370.46

Call Toll Free 1800-425-8282
Source
for
Note:
DRHP
IMPORTANT: Please read the Red Herring Prospectus of this issue carefully before investing in the same.
:: Research Desk :: :: Research Desk ::
E-mail:
Direct Ph: 040 3321 7132
Disclaimer
The information and views presented in this report are prepared by Karvy Stock Broking Limited. The information
contained herein is based on our analysis and upon sources that we consider reliable. We, however, do not vouch for the
accuracy or the completeness thereof. This material is for personal information and we are not responsible for any loss
incurred based upon it. The investments discussed or recommended in this report may not be suitable for all investors.
Investors must make their own investment decisions based on their specific investment objectives and financial position
and using such independent advice, as they believe necessary. While acting upon any information or analysis mentioned
in this report, investors may please note that neither Karvy nor Karvy Stock Broking nor any person connected with any
associate companies of Karvy accepts any liability arising from the use of this information and views mentioned in this
document.
PF/IPON/24072017/31
SUMMARY STATEMENT OF PROFITS AND LOSSES, AS RESTATED
Initial Public Offer - Note
Security and Intelligence Services Ltd
Security and Intelligence Services Ltd
(Amount in Rupees millions unless otherwise stated)
Particulars Annexures For the year ended
March 31, 2016 For the year
ended March 31, 2015
For the year ended
March 31, 2014 For the year
ended March 31, 2013
For the year ended
March 31, 2012 RevenueRevenue from operations XXI 12,736.78 10,340.57 8,069.03 5,665.23 4,639.51 Revenue from operations 12,736.78 10,340.57 8,069.03 5,665.23 4,639.51 Other income XXII 136.44 222.30 175.91 161.50 9.33 Total revenue (A) 12,873.22 10,562.87 8,244.94 5,826.73 4,648.84 ExpensesEmployee benefits expense XXIII 11,344.05 9,148.47 6,954.57 4,712.25 3,627.72 Depreciation and amortisation expense XIIIA&B 210.31 245.70 110.80 90.49 116.08 Finance costs XXIV 206.61 251.43 128.50 146.99 140.39 Other expenses XXV 621.63 613.15 581.47 473.82 597.17 Total expenses (B) 12,382.59 10,258.75 7,775.34 5,423.54 4,481.36 Profit/(loss) before taxation (A-B) (C ) 490.64 304.12 469.60 403.18 167.48 Tax expense/(income)Current tax 152.72 147.25 160.58 115.49 89.01 Deferred tax charge/(credit) (1.17) (89.52) (23.13) (11.24) (32.07) Total tax expense (D) 151.56 57.74 137.45 104.25 56.95 Net profit/(loss) after taxation (C-D) (E ) 339.08 246.38 332.15 298.93 110.53 Net profit/(loss) for the period from discontinuing operationsProfit for the period from discontinuingoperations
- - - - 27.89 Tax expense of discontinuing operations - - - - 22.56 Profit/(loss) from discontinuing operations after tax
- - - - 5.33
Profit/(loss) for the year from continuing operations
339.08 246.38 332.15 298.93 105.20
Top Related