


Languages
Pages
Legal


IPAA Oil & Gas Investment SymposiumLondon
July 7, 2005
2
Forward-looking Statements
This presentation contains projections and other forward-looking
statements within the meaning of Section 27A of the U.S. Securities
Act of 1933 and Section 21E of the U.S. Securities Exchange Act of
1934. These projections and statements reflect the Company’s
current views with respect to future events and financial performance.
No assurances can be given, however, that these events will occur or
that these projections will be achieved, and actual results could differ
materially from those projected as a result of certain factors. A
discussion of these factors is included in the Company’s periodic
reports filed with the U.S. Securities and Exchange Commission.

3
Magnum Hunter Acquisition
• Merger closed June 7th
• Transaction summary– Issued 39.5 million shares (doubles market cap) – Total shares outstanding 81.3 million– Assumed $590 million of debt
• Doubles production
• Triples proved reserves
• Expands drilling program
• Adds Permian Basin and Gulf of Mexico operations
4
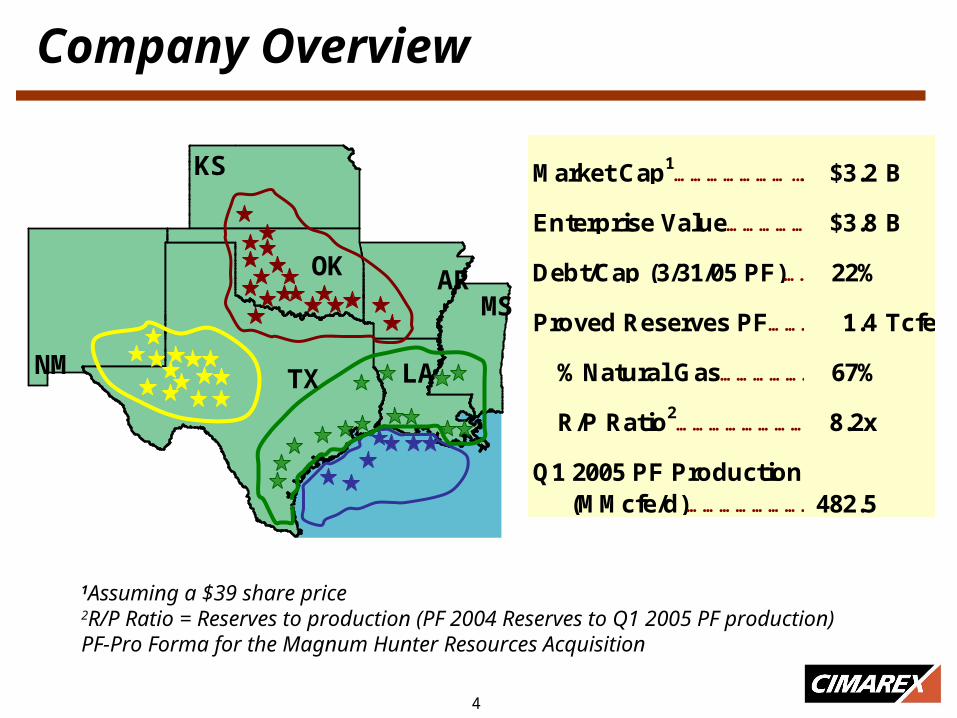
Company Overview
NM
KS
TX LA
MSAROK
Market Cap1…………………...…. $3.2 B
Enterprise Value…………………..$3.8 B
Debt/Cap (3/31/05 PF)…………………………..22%
Proved Reserves PF…………..1.4 Tcfe
% Natural Gas……………………..67%
R/P Ratio2…………………………….8.2x
Q1 2005 PF Production(MMcfe/d)………………………482.5
1Assuming a $39 share price2R/P Ratio = Reserves to production (PF 2004 Reserves to Q1 2005 PF production) PF-Pro Forma for the Magnum Hunter Resources Acquisition
5
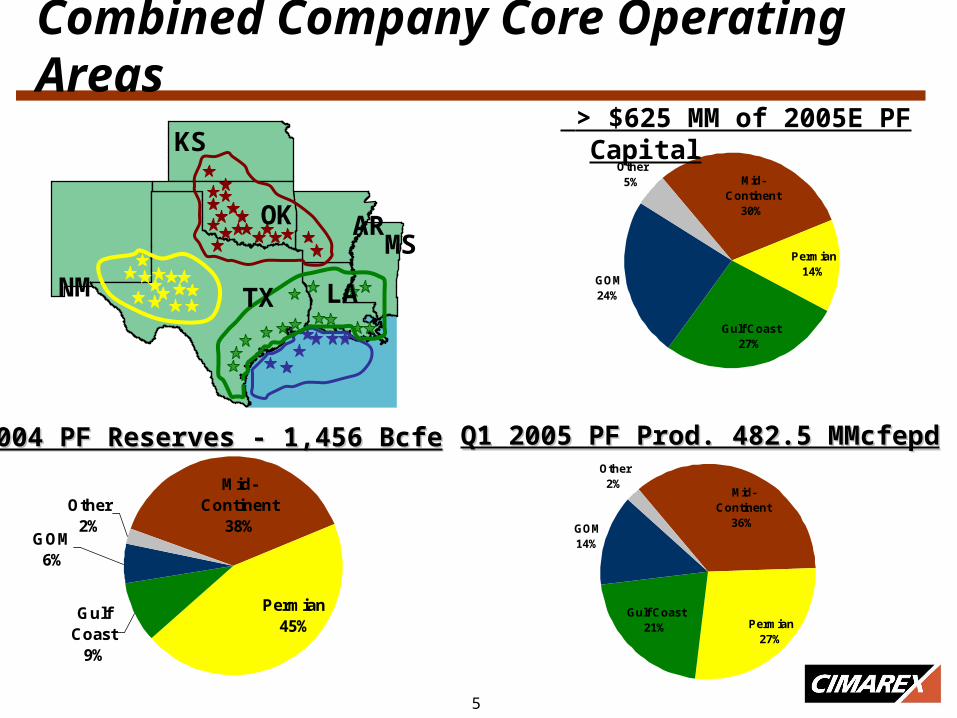
Combined Company Core Operating Areas
Gulf Coast
9%
GOM6%
Other2%
Permian45%
Mid-Continent
38%
GOM24%
Other5%
Permian14%
Gulf Coast27%
Mid-Continent
30%
NM
KS
TX LA
MSAROK
> $625 MM of 2005E PF Capital
2004 PF Reserves - 1,456 Bcfe2004 PF Reserves - 1,456 Bcfe Q1 2005 PF Prod. 482.5 MMcfepdQ1 2005 PF Prod. 482.5 MMcfepd
GOM14%
Other2%
Permian27%
Gulf Coast21%
Mid-Continent
36%

6
History/Track Record
• Started in 1992 as Key Production Company, Inc.• Merger with Helmerich & Payne E & P in 2002, changed name to Cimarex Energy Co.• Acquired Magnum Hunter in June 2005
Q1 93-'051993 2004 2005 PF CAGR
Proved reserves (Bcfe) 30 449 1,451 38%Reserves per share (Mcfe/share) 3 11 18 16%
Production (MMcfe/d) 14 217 483 34%Production per share (cfepd/share) 1.4 5.2 5.9 13%
Market Cap ($ in billions) $0.03 $1.6 $3.2 48%Stock Price $3.00 $37.90 $39.00 24%
E&D Capital ($ millions) $1.9 $296 $625 62%

7
Consistent Growth in Reserves and Production
0
100
200
300
400
500
600
1993 1994 1995 1996 1997 1998 1999 2000 2001 2002 2003 2004 Q1 2005PF
Production (MMcfe/d)
0
200
400
600
800
1000
1200
1400
1600
1993 1994 1995 1996 1997 1998 1999 2000 2001 2002 2003 2004 2004 PF
Proved Reserves (Bcfe)

8
Cimarex Strategy• Growth through the drill-bit
• Rate of Return Driven– Reinvest cash flow in highest risked rate of return projects– Portfolio approach…blended risk and basin diversity– Lower risk: Permian and Mid-Continent regions– Higher risk/reward: Gulf Coast and Gulf of Mexico
• Utilize decentralized exploration teams who are experts in their regions– Generate (vs. buy) our drilling inventory– Each team performs thorough review of predicted results to actual
• Maintain a strong financial position– Drill through the cycles
9
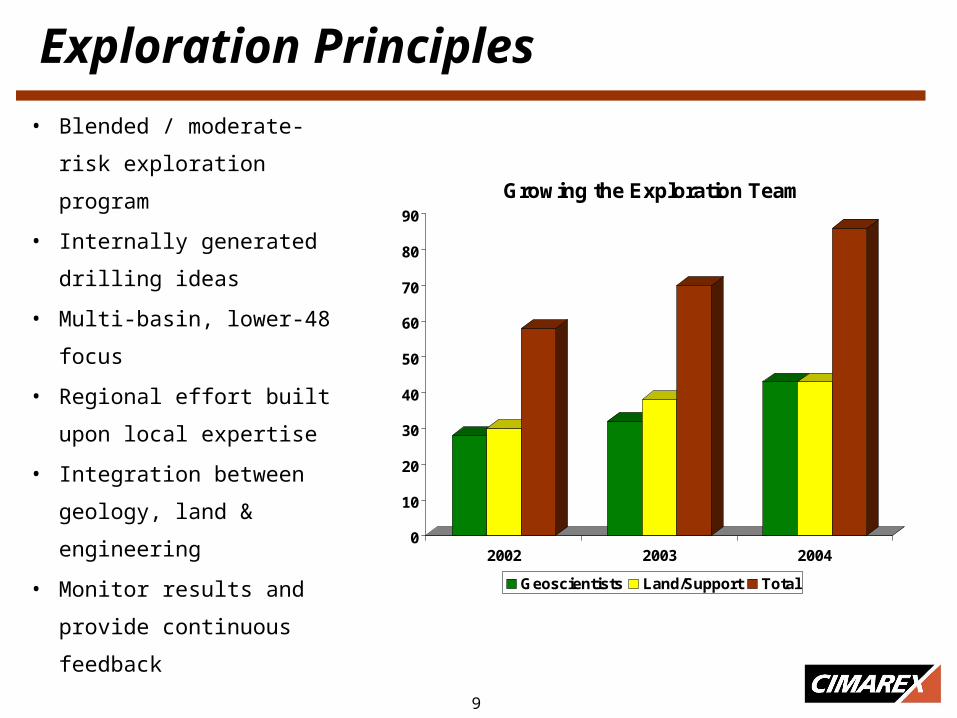
Exploration Principles
• Blended / moderate-risk
exploration program
• Internally generated drilling
ideas
• Multi-basin, lower-48 focus
• Regional effort built upon
local expertise
• Integration between
geology, land &
engineering
• Monitor results and provide
continuous feedback
0
10
20
30
40
50
60
70
80
90
2002 2003 2004
Growing the Exploration Team
Geoscientists Land/Support Total
Operations Overview

11
Mid-Continent Basins
YE 2004 PF Reserves (Bcfe) 555
Q1 2005 PF production (MMcfe/d) 172
2005 Capital ($ MM) $185
Anadarko Basin
Mountain Front
Panhandles/Shelf
Hugoton
TTM Pro Forma Production
100
110
120
130
140
150
160
170
180
190
May-04Jul-0
4
Sep-04
Nov-04
Jan-05
Mar-05
Mm
cfe
per
day
Mid-Continent
Arkoma

12
Panhandle Area – Roberts & Hemphill Counties
Hemphill/Roberts Counties Granite Wash – Lower Morrow
– Depth: 11,000-13,000’
– CWC $2.0MM
– Expected Reserves: 1.0-3.0 BCF
2005 moving to 4 Rig Program
• Through 5-05 11 wells drilled; 45 wells planned for 2005
• MHR acquisition added 60 sections to Cimarex’s acreage position

13
Anadarko Basin Projects
Western Oklahoma Des Moines/Red Fork – Depth 12,000-14,000’; CWC $1.7-2.2 MM
Clinton Lake Atoka – E. Carpenter/Canute Area– Depth 15,000-16,000’; CWC $2.8-3.6 MM
Shallow Clinton Lake – Red Moon Area– Depth 13,000-13,500’; CWC $2.2-2.4 MM
Middle Atoka – Washita River Area– Depth 13,800-14,200’; CWC $2.4-2.6 MM
Expected Reserves 1-3 BCF per well; ROR’s 19-40%
2005 CapEx: $102 MM, 150 gross wells
14
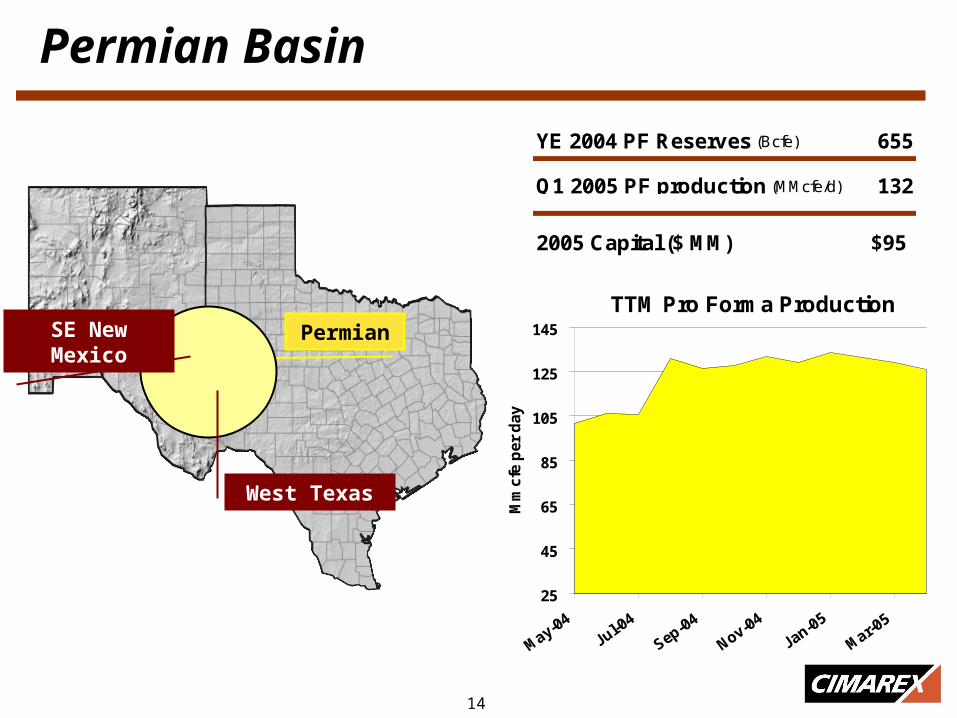
Permian Basin
Permian
YE 2004 PF Reserves (Bcfe) 655
Q1 2005 PF production (MMcfe/d) 132
2005 Capital ($ MM) $95
TTM Pro Forma Production
25
45
65
85
105
125
145
May-04Jul-0
4
Sep-04
Nov-04
Jan-05
Mar-05
Mm
cfe
per
day
Permian
SE New Mexico
West Texas
15
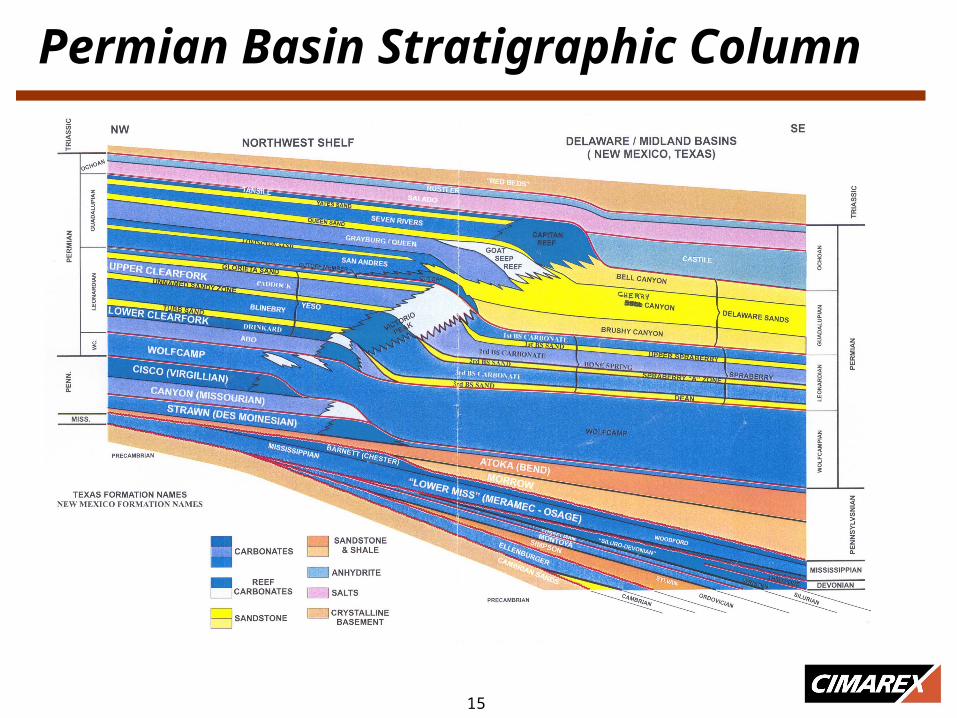
Permian Basin Stratigraphic Column
16
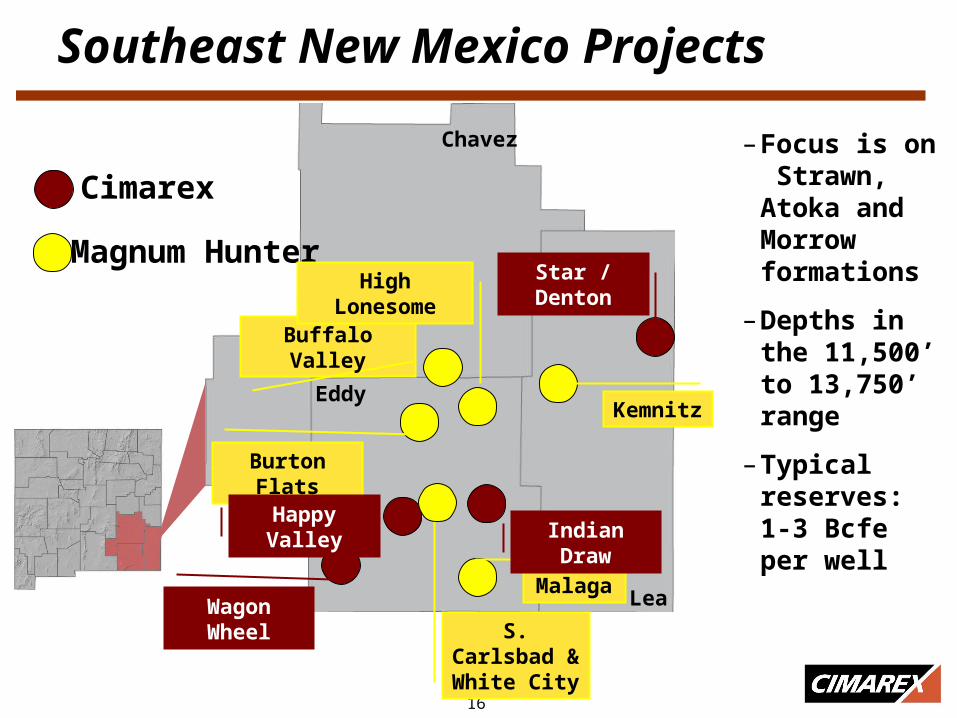
Southeast New Mexico Projects
Cimarex
Magnum Hunter
Chavez
Lea
Eddy
Buffalo Valley
Burton Flats
Wagon Wheel
Star / Denton
S. Carlsbad & White City
High Lonesome
Malaga
Happy ValleyIndian Draw
– Focus is on Strawn, Atoka and Morrow formations
– Depths in the 11,500’ to 13,750’ range
– Typical reserves: 1-3 Bcfe per well
Kemnitz
17
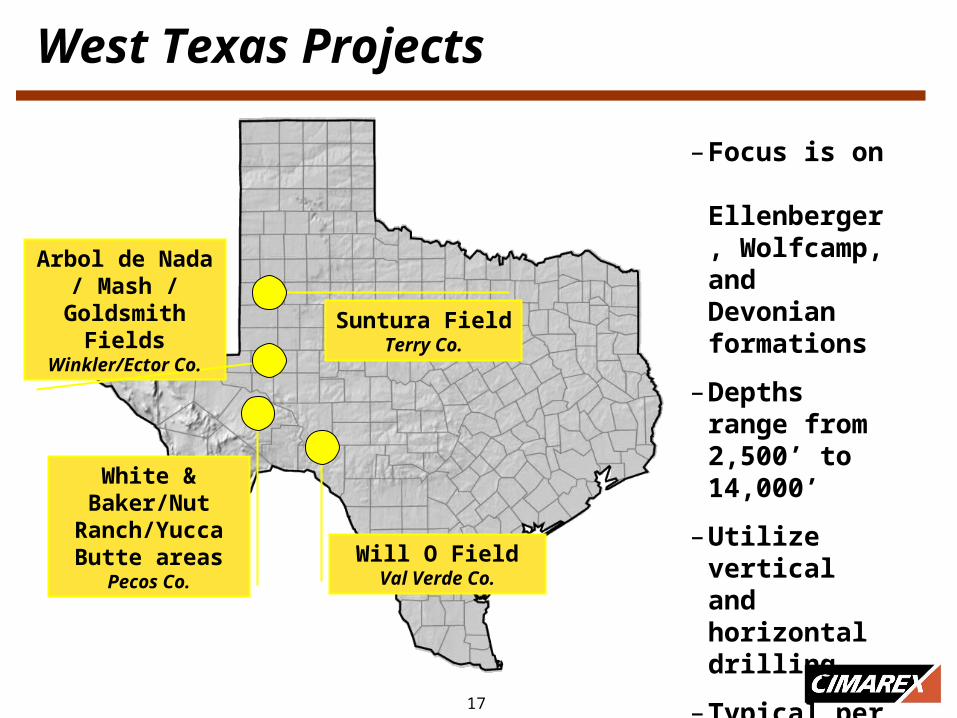
West Texas Projects
Suntura FieldTerry Co.
Will O FieldVal Verde Co.
White & Baker/Nut Ranch/Yucca Butte
areasPecos Co.
Arbol de Nada / Mash / Goldsmith
FieldsWinkler/Ector Co.
– Focus is on Ellenberger, Wolfcamp, and Devonian formations
– Depths range from 2,500’ to 14,000’
– Utilize vertical and horizontal drilling
– Typical per well reserve: 0.2-5 Bcf or 50-500 MBO
18
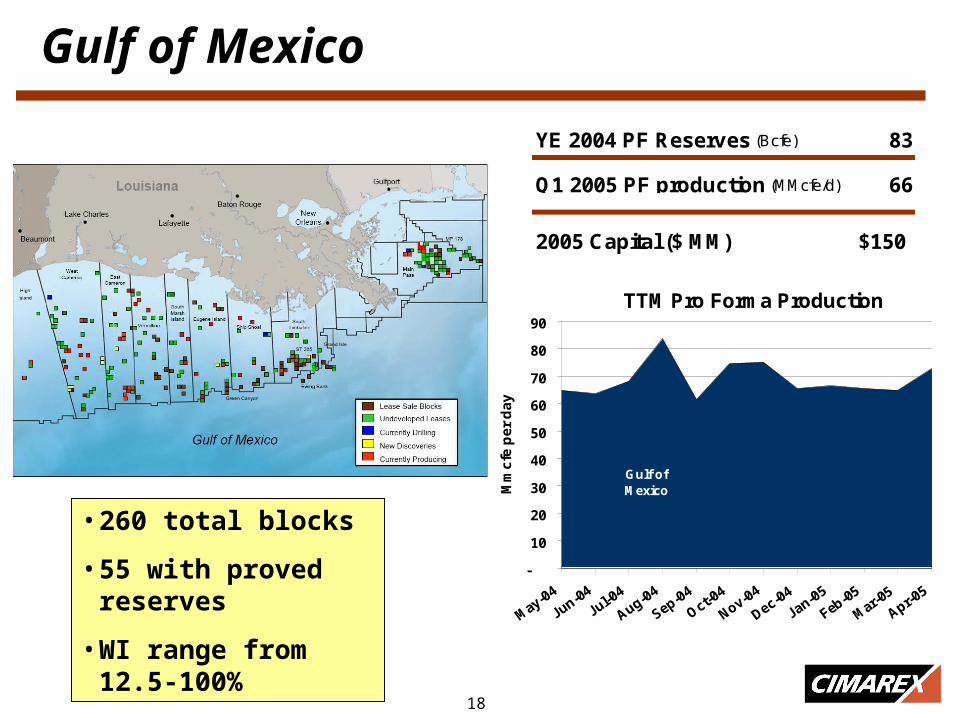
Gulf of Mexico
YE 2004 PF Reserves (Bcfe) 83
Q1 2005 PF production (MMcfe/d) 66
2005 Capital ($ MM) $150
TTM Pro Forma Production
Gulf of Mexico
-
10
20
30
40
50
60
70
80
90
May-04
Jun-04
Jul-04
Aug-04
Sep-04
Oct-04
Nov-04
Dec-04
Jan-05
Feb-05
Mar-05
Apr-05
Mm
cfe
pe
r d
ay
ShallowWater Gulf of
Mexico
• 260 total blocks
• 55 with proved reserves
• WI range from 12.5-100%

19
Gulf Coast Projects
YE 2004 PF Reserves (Bcfe) 129
Q1 2005 PF production (MMcfe/d) 102
2005 Capital ($ MM) $165
TTM Pro Forma Production
Gulf Coast
25
35
45
55
65
75
85
95
105
115
May-04
Jun-04
Jul-04
Aug-04
Sep-04
Oct-04
Nov-04
Dec-04
Jan-05
Feb-05
Mar-05
Apr-05
Mm
cfe
pe
r d
ay
Mississippi Salt Dome Trend
W. Gueydan Field
Hackberry Trend
Camerina/Miogyp Planulina
Miocene Trends
Yegua/Cook Mtn.
South TexasVicksburg/Frio

20
Yegua/Cook Mountain – Liberty County
• 670 sq mi of 3D seismic data
• Reprocessed 3D into one dataset, leading to expanded 2005 inventory
• 2004:
– 14 gross wells / 6.4 net
– 10 of 14 successful
– $25MM of capital
• Aggressive 2005 program
– 19 wells; $36MM
– Mix of exploration and development
Harris
Liberty
Hardin
Jefferson
Chambers
Harris
RaywoodTrinity
Gas Well/Discovery
New Location
Dry Hole

21
Mississippi Multi-Dome 3-D Reprocessing
• Covington and Jones counties
• A “new look” with curved-ray pre-stack time migration
• Recent wells on Centerville and Dont Domes; Hosston interval
• Ellzy 2 producing 300 Bopd
• Speed 2 tested 350 Bopd
• Eight more wells planned for 2005
• Two wells currently drilling
Dont Dome
Centerville Dome
Kola Dome
Eminence Dome
Moselle Dome

22
Investment Considerations
• Well-balanced, diversified operations– Mid-Continent, Permian, Gulf Coast and Gulf of Mexico
• Attractive asset base of proved reserves– 81% proved developed (pro forma)– 67% natural gas – 70% operated
• Track record of consistent profitable growth– Proven technical expertise– 10-year production CAGR of 38%– Financially conservative
• Magnum Hunter acquisition…better not just bigger– New low-moderate risk core area in the Permian Basin– Measured entrée into the Gulf of Mexico– Expanded drilling inventory

23
Contact Information
Paul Korus
Vice President and CFO
Mark Burford
Director of Capital Markets
Cimarex Energy Co.
1700 Lincoln Street, Suite 1800
Denver, CO 80203Phone (303) 295-3995
Fax (303) 285-9299
www.cimarex.com

IPAA Oil & Gas Investment SymposiumLondon
July 7, 2005
Top Related