


Languages
Pages
Legal


Introduction to 2D LC-MS/MS
(Yuanming Luo)Institute of Microbiology
Chinese Academy of Sciences
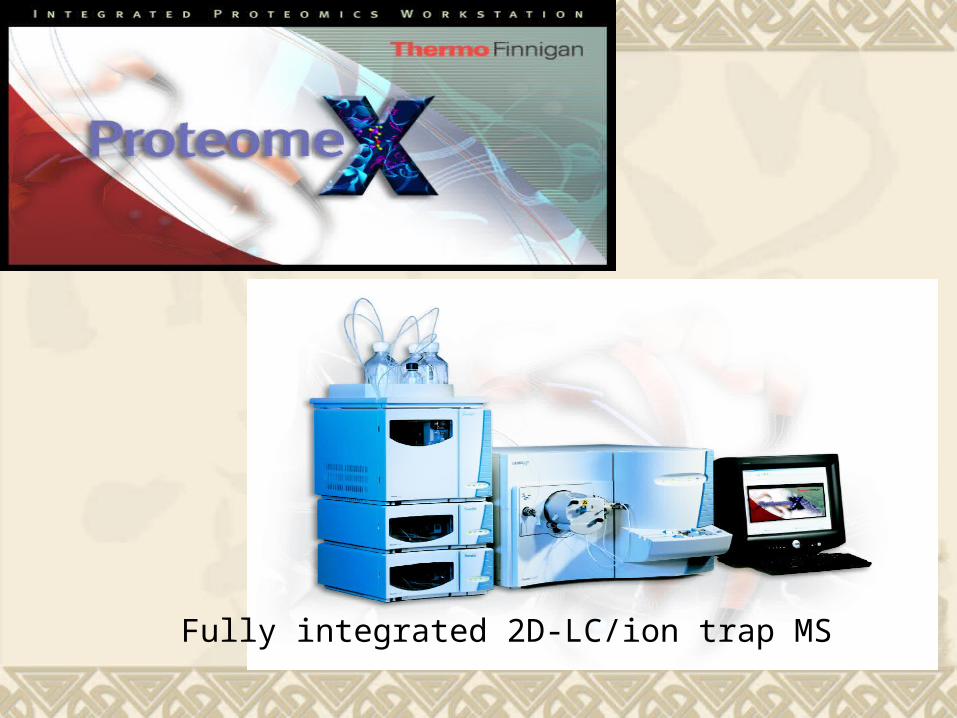
Fully integrated 2D-LC/ion trap MS
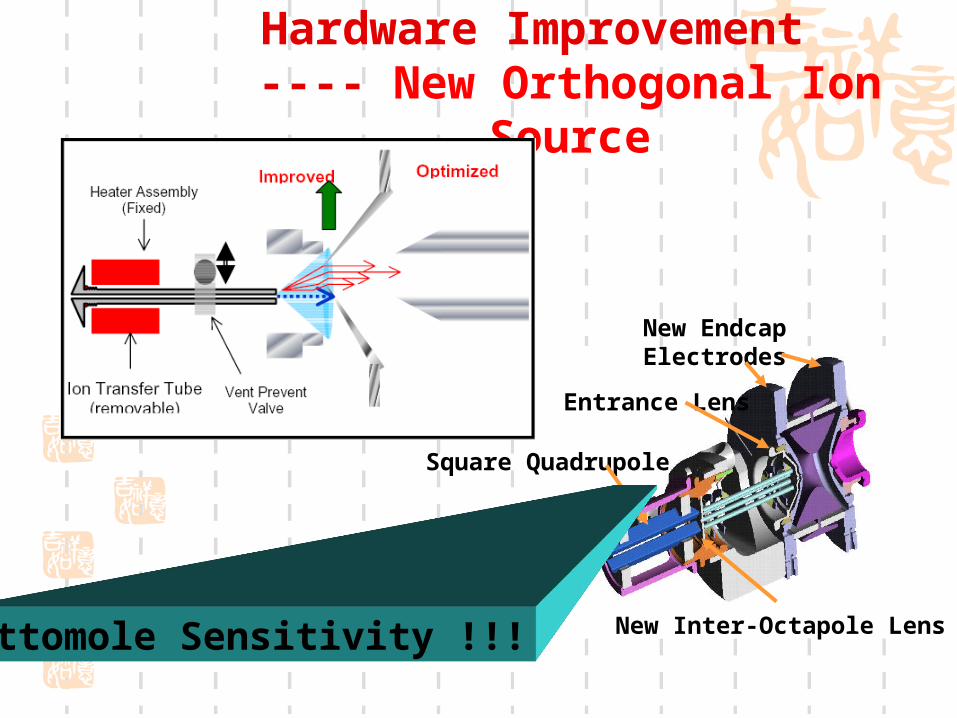
Hardware Improvement ---- New Orthogonal Ion
Source
Square Quadrupole
New Inter-Octapole Lens
New Endcap Electrodes
Entrance Lens
Attomole Sensitivity !!!

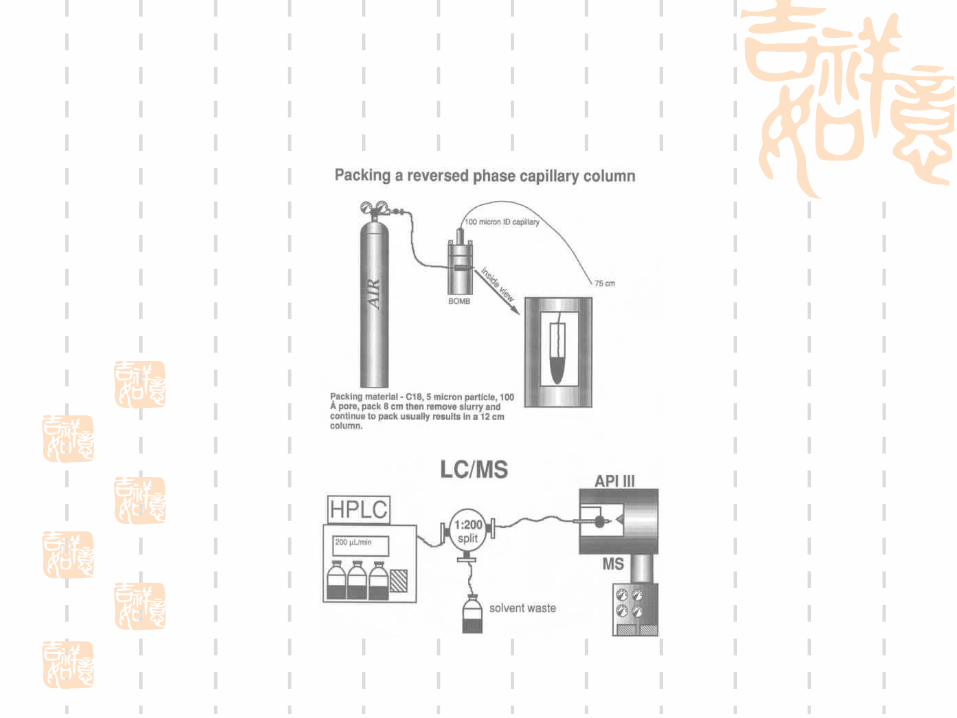
1D-strong cation exchange column (Biobasic SCX)

Pressure cell

Xcalibur-control the instrument

Bioworks 3.1-database search software package containing SEQUEST

Application of 2D LC-MS/MS Molecular weight determination
2D gel spots (especially the spots that can’t be identified
by PMF analysis)
Protein complex (after primary factionation)
Proteome separation and identification
Multi-dimensional liquid chromatography MS-based
differential proteomics
Quantitative proteomics (including ICAT or stable isotope
labeling-based differential proteome analysis)
Analysis of posttranslational modification (data
dependent)

Molecular weight determination of myoglobin by BIOMASS
Calculation
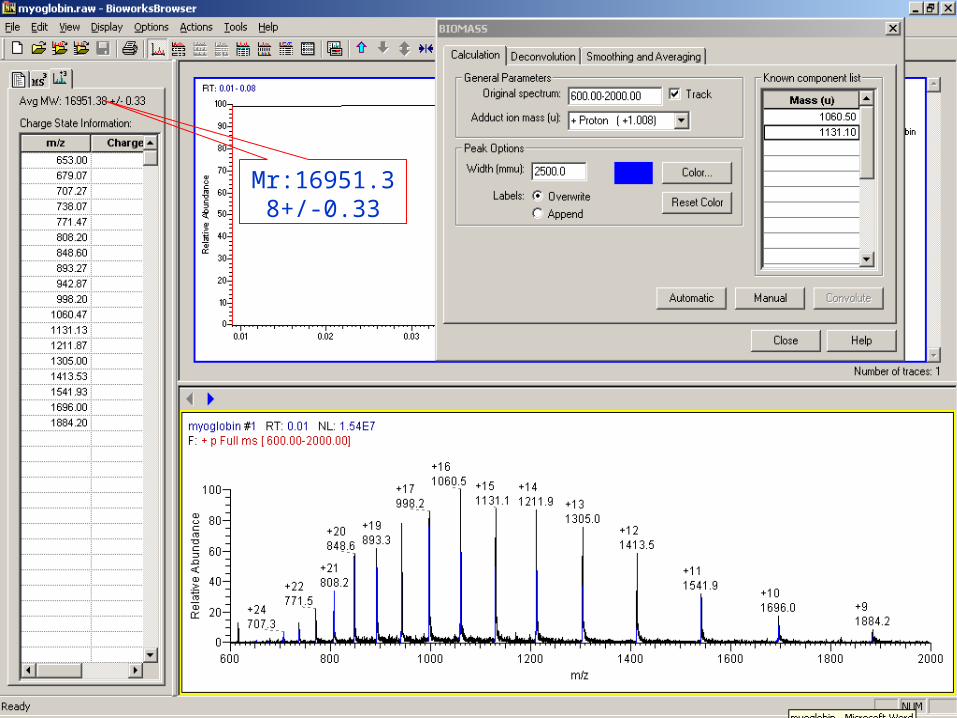
Mr:16951.38+/-0.33

High throughput gel
spot analysis

Tandem RP ColumnsTandem RP Columns

Automated Protein Identification of 2-D gel Automated Protein Identification of 2-D gel spotsspots
??
Sensitivity and Throughput !!!Sensitivity and Throughput !!!
SEQUESTCross-Correlation
Comparison
Protein identified
Digest


High throughput gel spot analysis
1. Protein mixture is separated by 2D gel electrophoresis
2. Excise target gel spot
3. Perform in-gel digestion with trypsin.
4. Extract peptides from gel spot.
5. Run peptide mixture with ProteomeX in 1D High Throughput mode.
6. Data search by TurboSEQUEST software

Analysis of 2D Gel Spots Using ProteomeX ProteomeX High Throughput Method
RT: 0.00 - 102.10
0 2 4 6 8 10 12 14 16 18 20
Time (min)
0
50
100
0
50
100
0
50
100
0
50
100
Rel
ativ
e A
bu
nda
nce 0
50
100
0
50
100
0
50
10069.67
74.3851.4222.49 75.4066.1142.2728.29 82.7513.98 97.5610.92
61.66
51.90 65.73 70.4921.95 45.20 82.5928.6419.53 41.2213.77 83.90 100.31
22.68
51.85 79.6772.3570.5823.16 35.66 40.14 82.2922.0517.203.68 95.10
61.76
21.8351.89 65.77 70.2936.77 43.0734.16 80.86 82.4420.55 100.618.820.48
63.9323.06
29.58 39.32 51.7279.8765.8835.12 42.52 59.2017.44 82.2715.18 97.304.34
61.60
21.90 51.85 70.3748.8119.62 37.34 72.64 81.2627.7712.701.26 98.7485.70
22.74 51.8379.8663.79 70.37
54.5648.0029.56 81.1944.4721.2811.13 84.87 92.898.54
NL: 2.39E7
Base Peak F: + c Full ms [ 300.00-2000.00] MS
GelSpot_tPA1_C1
NL: 9.02E6
Base Peak F: + c Full ms [ 300.00-2000.00] MS
gelspot_tpa2_c2
NL: 1.16E7
Base Peak F: + c Full ms [ 300.00-2000.00] MS
gelspot_tpa3_c1
NL: 1.41E7
Base Peak F: + c Full ms [ 300.00-2000.00] MS
gelspot_tpa4_c2
NL: 2.11E7
Base Peak F: + c Full ms [ 300.00-2000.00] MS
gelspot_tpa5_c1
NL: 1.15E7
Base Peak F: + c Full ms [ 300.00-2000.00] MS
gelspot_tpa6_c2
NL: 8.00E6
Base Peak F: + c Full ms [ 300.00-2000.00] MS
gelspot_tpa7_c1
Spot 1
2
3
4
5
6
7
Found t-PA
Found t-PA
Found t-PA

Global Protein Identification

Global Protein Identification
Protein mixture Protein digests
SCX column fractionationReverse column
separation
Auto MS/MS detection
Tandem MS spectraBioWorks data base search
Results

Plumbing Diagrams for Proteome X.
1D-SCX column
2D-RP1 column
2D-RP2 column

Global Protein Identification1. Extract proteins from cell lysates
2. Reduce proteins to peptide
fragments by tryptic digestion.
3. Analyze peptide mixture by 2D LC-
MS/MS with ProteomeX.
4. Peptide and proteins identified by
TurboSEQUEST software.

Protease Digestion of Proteins

1D LC-MS/MS of proteins from A431 cell lysates
RT:0.00 - 600.00
0 50 100 150 200 250 300 350 400 450 500 550 600Time (min)
0
50
100
0
50
100
0
50
100
Rel
ativ
e A
bund
ance 0
50
100
0
50
100
33.95431.84
35.121163.80
26.66652.24
42.921138.32
76.43667.61
68.711160.5350.66
486.92 117.86563.10 138.63
703.32
148.78371.00
14.27344.05 84.72
1154.55200.37563.16
17.79388.10
118.32431.94 258.97
776.40140.051839.77 228.84
619.48 269.22444.83
520.911912.57
432.24675.178.40
439.73 362.07675.25
341.64675.16
382.40675.26
524.051511.36
465.75488.12294.93
576.29171.601154.56
123.05926.00
268.841285.77
226.50794.78
12.29390.90
113.04897.74
575.63444.75
NL:2.28E9Base Peak MS A431_30minG_1029
NL:2.65E9Base Peak MS a431_60ming_1029
NL:1.28E9Base Peak MS a431_120ming_1029
NL:1.49E9Base Peak MS a431_240ming_1029
NL:4.60E8Base Peak MS a431_1213_8hrg
30 min gradient
60 min
120 min
240 min
480 min

2D LC-MS/MS of proteins from A431 cell lysates

Analysis of proteins from A431 cell lysates
56240min
105480min
44120min
2260min
1630min
# of Proteins Identified
Gradient
1D
49120 hr.
33710 hr.
1445 hr.
# of Proteins Identified
Total Run Time
2D
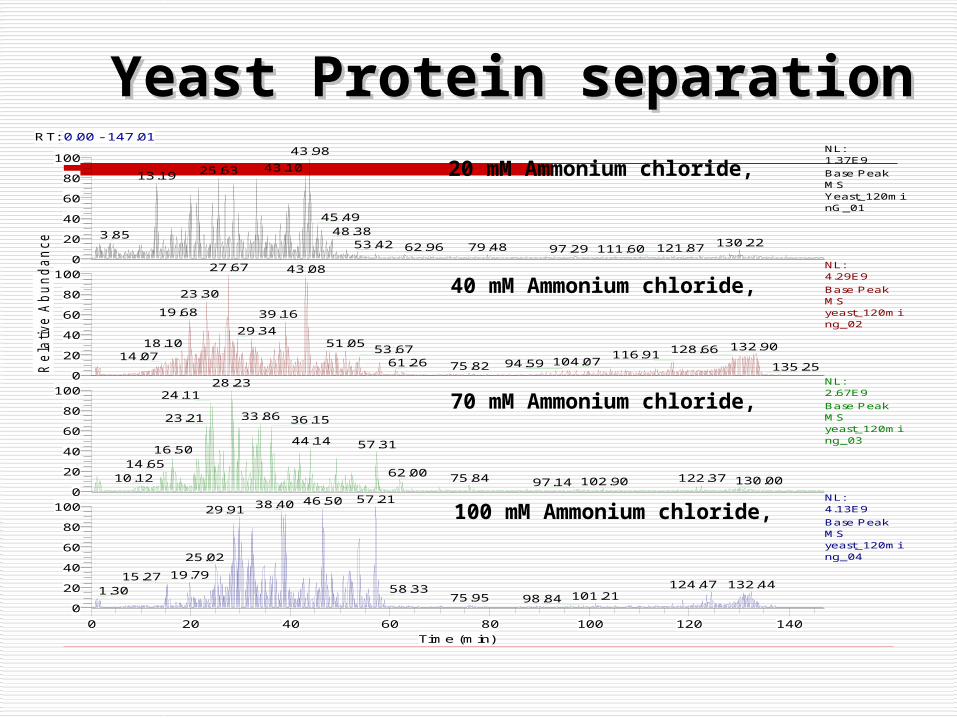
Yeast Protein separationYeast Protein separationRT: 0.00 - 147.01
0 20 40 60 80 100 120 140
Time (min)
0
20
40
60
80
100
0
20
40
60
80
100
0
20
40
60
80
100
Re
lative
Ab
un
da
nce
0
20
40
60
80
10043.98
43.1025.6313.19
45.4948.383.85
130.2253.42 79.4862.96 121.87111.6097.29
27.67 43.08
23.30
19.68 39.16
29.3418.10 51.05 132.9053.67 128.66116.9114.07 104.0761.26 94.5975.82 135.25
28.2324.11
33.8623.21 36.15
44.14 57.3116.5014.65
62.00 122.3775.8410.12 130.00102.9097.14
57.2146.5038.4029.91
25.02
19.7915.27132.44124.4758.331.30 101.2175.95 98.84
NL:1.37E9
Base Peak MS Yeast_120minG_01
NL:4.29E9
Base Peak MS yeast_120ming_02
NL:2.67E9
Base Peak MS yeast_120ming_03
NL:4.13E9
Base Peak MS yeast_120ming_04
20 mM Ammonium chloride,
40 mM Ammonium chloride,
70 mM Ammonium chloride,
100 mM Ammonium chloride,

Yeast Protein SeparationYeast Protein SeparationRT: 0.00 - 147.01
0 20 40 60 80 100 120 140
Time (min)
0
20
40
60
80
100
0
20
40
60
80
100
Re
lative
Ab
un
da
nce
0
20
40
60
80
10052.6632.77
18.84 46.16 57.14
44.10
12.57
1.57 75.8658.03 87.56 129.57121.87 137.2296.28
41.06
26.8522.22
13.3432.88
50.9312.54 128.3954.17 132.4157.88 75.96 87.63 124.3989.932.55
18.5217.01
42.0727.731.34
1.89 30.91 75.8650.18 57.70
76.9914.82 87.6770.04 134.87129.1497.96 113.09
NL:4.05E9
Base Peak MS yeast_120ming_05
NL:3.24E9
Base Peak MS yeast_120ming_06
NL:1.02E9
Base Peak MS yeast_120ming_07
140 mM Ammonium chloride,
180 mM Ammonium chloride,
220 mM Ammonium chloride,

Yeast proteinsYeast proteinsReference Score Hits Entriesgi|129922|sp|P14828|PGK_KLULA PHOSPHOGLYCERATE KINASEgi|66895|pir||KIVKGL 65809.5 18 4 4 3 0 91 95 96 101 255 260 686 689 824 873 888 902 913 925 926 948 960 1050 : 864 994 1630 1765 : 1333 1507 1682 1749 : 886 910 1760 : gi|6319594|ref|NP_009676.1| translational elongation factor EF-1 alpha; Te 56564.0 12 1 1 0 0 76 215 239 336 1020 1024 1159 1163 1338 1362 1518 1526 : 113 : 538 : : gi|119145|sp|P16017|EF1A_CANAL ELONGATION FACTOR 1-ALPHA (EF-1-ALPHA)gi|1 46500.4 0 11 1 1 0 : 76 215 239 1020 1024 1159 1163 1338 1362 1518 1526 : 113 : 1706 : gi|1172457|sp|P41757|PGK_CANMA PHOSPHOGLYCERATE KINASEgi|83923|pir||JT095 46303.5 12 1 0 0 0 255 260 824 860 873 888 913 925 926 948 960 1050 : 994 : : : gi|6324637|ref|NP_014706.1| Ribosomal protein L3 (rp1) (YL1); Rpl3p [Sacch 42592.4 10 0 1 1 0 133 138 143 383 387 468 471 482 484 1531 : : 386 : 1305 : gi|6321968|ref|NP_012044.1| enolase; Eno2p [Saccharomyces cerevisiae]gi|1 41268.3 10 2 1 0 0 38 56 58 69 77 262 269 270 302 313 : 180 1413 : 163 : : gi|6319279|ref|NP_009362.1| Pyruvate kinase; Cdc19p [Saccharomyces cerevis 38052.7 23 3 0 0 0 29 38 59 70 73 92 132 136 166 288 291 421 474 483 900 1121 1198 1246 1613 1619 1632 1638 1714 : 163 480 526 : : : gi|6321968|ref|NP_012044.1| enolase; Eno2p [Saccharomyces cerevisiae]gi|1 36687.9 13 2 1 0 1 8 11 39 42 129 377 396 486 488 590 802 1751 1814 : 1014 1621 : 234 : : 458 gi|6321968|ref|NP_012044.1| enolase; Eno2p [Saccharomyces cerevisiae]gi|1 34389.6 13 2 1 0 1 19 50 329 349 441 442 445 820 1028 1037 1434 1522 1548 : 346 2014 : 160 : : 1674 gi|6323004|ref|NP_013076.1| member of 70 kDa heat shock protein family; Ss 34030.4 13 7 0 0 0 49 113 116 212 215 336 567 608 804 1082 1275 1317 1320 : 121 125 615 647 797 1253 1272 : : : gi|10383781|ref|NP_009938.2| 3-phosphoglycerate kinase; Pgk1p [Saccharomyc 26362.2 7 4 1 0 0 185 187 307 313 404 1743 1785 : 109 373 1746 1804 : 1811 : : gi|6322790|ref|NP_012863.1| aldolase; Fba1p [Saccharomyces cerevisiae]gi| 26245.4 2 0 0 0 0 266 269 : : : : gi|6319279|ref|NP_009362.1| Pyruvate kinase; Cdc19p [Saccharomyces cerevis 25546.9 9 0 0 0 0 61 131 218 276 309 310 1005 1399 1404 : : : : gi|6323004|ref|NP_013076.1| member of 70 kDa heat shock protein family; Ss 23954.0 7 1 0 0 1 97 143 204 294 356 365 492 : 297 : : : 264 gi|6325112|ref|NP_015180.1| sequence similar to Hes1p; Kes1p [Saccharomyce 23937.7 3 0 2 2 0 611 736 1234 : : 76 1362 : 215 1547 : gi|10383781|ref|NP_009938.2| 3-phosphoglycerate kinase; Pgk1p [Saccharomyc 23524.5 3 2 1 0 1 171 173 298 : 175 1060 : 1226 : : 378 gi|6321609|ref|NP_011686.1| phosphatidylserine decarboxylase located in va 23254.1 2 0 1 3 4 475 1103 : : 404 : 397 451 1007 : 139 185 400 1607 gi|6322526|ref|NP_012600.1| phosphatidylinositol kinase homolog; Tor1p [Sa 21082.5 0 3 2 1 2 : 7 80 770 : 1518 1690 : 1024 : 75 1020 gi|14318479|ref|NP_116614.1| Actin; Act1p [Saccharomyces cerevisiae]gi|11 21011.4 2 0 0 0 0 372 384 : : : : gi|12230852|sp|O74343|YH2X_SCHPO HYPOTHETICAL 76.4 KDA PROTEIN C1A4.09 IN 20063.6 0 1 1 1 1 : 1603 : 847 : 1607 : 1590 gi|119336|sp|P00924|ENO1_YEAST ENOLASE 1 (2-PHOSPHOGLYCERATE DEHYDRATASE) 19580.1 4 0 0 0 0 177 260 302 313 : : : : gi|6324313|ref|NP_014383.1| Pbi2p [Saccharomyces cerevisiae]gi|124818|sp| 19318.9 5 0 0 0 0 62 70 73 1878 1882 : : : : gi|6323004|ref|NP_013076.1| member of 70 kDa heat shock protein family; Ss 19151.9 7 0 0 0 1 208 211 213 215 1467 1609 1610 : : : : 1288 gi|6325331|ref|NP_015399.1| Transketolase 1; Tkl1p [Saccharomyces cerevisi 18932.7 5 1 0 0 0 217 218 223 224 1328 : 420 : : : gi|6321631|ref|NP_011708.1| Glyceraldehyde-3-phosphate dehydrogenase 3; Td 18650.3 3 0 0 0 0 1590 1603 1607 : : : : gi|6321977|ref|NP_012053.1| 6-phosphogluconate dehydrogenase; probable GND 18647.0 4 0 0 1 0 647 1529 1530 1534 : : : 695 : gi|7492246|pir||T40586 nucleolar protein involved in pre-rRNA processing - 18417.0 6 8 12 10 8 1075 1243 1276 1414 1508 1540 : 1009 1076 1247 1482 1585 1587 1715 1739 : 277 880 895 967 1148 1180 1213 1216 1296 1386 1625 1773 : 137 587 962 1149 1287 1312 1451 1538 1556 1763 : 140 911 1042 1355 1356 1450 1681 1713 gi|7491534|pir||T40003 hypothetical protein SPBC25H2.08c - fission yeast 18270.9 0 1 2 0 0 : 143 : 133 138 : : gi|6325016|ref|NP_015084.1| 82 kDa heat shock protein; homolog of mammalia 18036.9 6 2 0 0 0 5 31 132 800 1229 1235 : 37 1237 : : :

Yeast proteinsYeast proteinsgi|6323376|ref|NP_013448.1| Ribosomal protein L26A (L33A) (YL33); Rpl26ap 4748.4 2 1 1 0 0 1624 1627 : 1625 : 652 : : gi|6321007|ref|NP_011086.1| Transcriptional regulator which functions in m 4747.8 0 0 0 1 0 : : : 33 : gi|6323292|ref|NP_013364.1| Ylr262c-ap [Saccharomyces cerevisiae]gi|21318 4746.0 0 1 0 0 1 : 876 : : : 732 gi|6322314|ref|NP_012388.1| Yjl147cp [Saccharomyces cerevisiae]gi|1353019 4744.7 0 0 0 1 0 : : : 460 : gi|6324034|ref|NP_014104.1| Ynl295wp [Saccharomyces cerevisiae]gi|1353106 4744.4 0 1 0 0 0 : 396 : : : gi|6324151|ref|NP_014221.1| Ribosomal protein S3 (rp13) (YS3); Rps3p [Sacc 4743.3 2 0 0 0 0 279 332 : : : : gi|6323691|ref|NP_013762.1| 4741.6 0 0 3 0 3 : : 1877 1949 2145 : : 981 1314 1853 gi|6322806|ref|NP_012879.1| p58 polypeptide of DNA primase; Pri2p [Sacchar 4738.8 0 0 1 0 1 : : 971 : : 558 gi|1171671|sp|Q09711|NCS1_SCHPO HYPOTHETICAL CALCIUM-BINDING PROTEIN C18B1 4737.8 0 0 0 1 0 : : : 397 : gi|7496455|pir||T19442 hypothetical protein C25A1.7a - Caenorhabditis eleg 4737.0 0 0 1 2 1 : : 1597 : 185 1645 : 1521 gi|83218|pir||S19440 hypothetical protein YCR029c - yeast (Saccharomyces c 4736.0 0 0 1 0 0 : : 50 : : gi|6323487|ref|NP_013559.1| Ylr454wp [Saccharomyces cerevisiae]gi|1363732 4735.9 1 1 2 2 0 724 : 6 : 638 1305 : 359 1200 : gi|6319642|ref|NP_009724.1| 4735.1 0 0 0 0 1 : : : : 224 gi|6319850|ref|NP_009931.1| non-mitochondrial citrate synthase; Cit2p [Sac 4729.1 1 1 0 0 1 646 : 1020 : : : 1619 gi|6324552|ref|NP_014621.1| 3'-5' exoribonuclease complex subunit; Dis3p [ 4728.2 0 0 1 1 0 : : 1637 : 329 : gi|7490292|pir||T38695 conserved hypothetical protein SPAC3C7.09 - fission 4726.5 0 0 1 1 0 : : 766 : 1441 : gi|6320126|ref|NP_010206.1| 4724.8 0 0 0 2 3 : : : 342 712 : 598 637 1671 gi|1077218|pir||S49776 hypothetical protein YDR179w-a - yeast (Saccharomyc 4723.5 0 0 1 0 0 : : 50 : : gi|1352297|sp|P48996|DP27_CAEEL CHROMOSOME CONDENSATION PROTEIN DPY-27gi| 4723.3 1 0 0 1 2 1196 : : : 482 : 122 896 gi|6323875|ref|NP_013946.1| involved in silencing; Esc1p [Saccharomyces ce 4722.7 1 0 1 0 1 1103 : : 1722 : : 792 gi|1175464|sp|Q09796|YAA2_SCHPO HYPOTHETICAL 111.5 KD PROTEIN C22G7.02 IN 4719.0 1 0 1 0 1 1954 : : 294 : : 214 gi|6323762|ref|NP_013833.1| Ymr115wp [Saccharomyces cerevisiae]gi|2497155 4717.5 0 0 0 1 0 : : : 243 : gi|6322171|ref|NP_012246.1| Ribosomal protein L2B (L5B) (rp8) (YL6); Rpl2b 4715.9 1 1 0 0 0 42 : 25 : : : gi|2495228|sp|Q12578|HIS7_CANGA IMIDAZOLEGLYCEROL-PHOSPHATE DEHYDRATASE (I 4715.9 0 1 0 0 0 : 610 : : : gi|15213983|sp|O94489|EF3_SCHPO ELONGATION FACTOR 3 (EF-3)gi|7492556|pir| 4715.5 1 0 1 0 0 24 : : 326 : : gi|6321594|ref|NP_011671.1| Cystathionine beta-synthase; Cys4p [Saccharomy 4712.9 2 0 0 0 0 284 652 : : : : gi|6323722|ref|NP_013793.1| (putative) involved in sister chromosome cohes 4712.4 1 0 0 0 1 561 : : : : 198 gi|113719|sp|P12807|AMO_PICAN PEROXISOMAL COPPER AMINE OXIDASE (METHYLAMIN 4712.2 4 6 4 3 5 1168 1335 1362 1468 : 1169 1228 1471 1496 1499 1613 : 1217 1394 1436 1745 : 1249 1530 1550 : 1151 1324 1337 1462 1742 gi|6320232|ref|NP_010312.1| 4707.7 0 0 0 0 1 : : : : 202 gi|6322088|ref|NP_012163.1| 4707.5 0 0 0 2 0 : : : 116 1740 :
Protein # 1708

2D LC-MS/MS of Yeast proteins2D LC-MS/MS of Yeast proteins
• Time: 15 hours
• Gradient: 5 – 65% Acetonitrile in 2 hrs in each step
• Proteins searched by Bioworks 3.1
• Proteins identified: 1708
• Throughput: 113.8 proteins/hr

Viewing Results

Synclein alpha
TIC


Filters for SEQUEST Results
Xcorr : +1>1.5, +2>2.0, +3>2.5 ∆CN: >0.1 When three or fewer peptides for an
individual protein passed the criteria (1) the spectrum quality (S/N, match rate) (2) some continuity must be present among
the b or y fragments (3) if proline is predicted to be present, then
the corresponding y fragment should give an intense peak.
(4) unidentified intense peaks should be verified as being either doubly charged.

Filters for SEQUEST Results

On-Line Phosphopeptide Enrichment (IMAC capture)

Flow Path of an Automated 2D (IMAC + RP)-MS/MS System for the Analysis of Phosphopeptides
SCX
Col
umn
11
6
2
3
5
4
Pump 1
injector
1
6
2
3
5
4
Sample loop
Sample valve
To Waste
IMA
C
RP
11
6
2
3
5
4
Pump 1
injector
1
6
2
3
5
4
Pump 1
injector
1
6
2
3
5
4
InjectorSample loop
LCQ Deca XP Plus- mass spectrometer
RP
2
10 –port valve in mass spectrometer
Analytical Pump
Sample Pump
1D-IMAC Column

Procedure Used for Automated 2D LC(IMAC+RP)- MS/MS Analysis of Phosphopeptides
Step 1: Load IMAC column
Step 2: Load peptides on IMAC column. Flow-through peptides captured by RP2 column.
Step 3: Wash IMAC column. The bound peptides are then eluted by phosphate buffer on to RP1, while the flow-through peptides trapped on RP2 are being analyzed by LC/MS.
Step 4: The bound phosphopeptides on RP1 are analyzed by LC/MS/MS.

Capture of FQ*SEEQQQTEDELQDK Phosphopeptide of -Casein Digest in the 2D LC(IMAC+RP)-MS/MS System
Non-phosphorylated peptidesflow through IMAC column and captured by and eluted from RP2
Phosphorylated peptide (m/z=1031.7, FQ*SEEQQQTEDELQDK) captured by IMAC column, bound to RP1, and eluted.
NL: 1.34E9
NL: 1.80E8
position for m/z=1031.7 on C2 column
RP2 column
RP1 column

Neutral Loss Scanning Confirmed the Major Ion at m/z=1031.6 as a P-peptide
Neutral lossfragment (-49)
M+2H+-49MS/MS of 1031.6
Phosphorylated peptide (m/z=1031.7,
FQ*SEEQQQTEDELQDK)

Bioworks 3.1 Search Identified the P-peptide with m/z=1031.6 as FQ*SEEQQQTEDELQDK
1+ 2+(M+2H)-49 (M+2H)-49

Proteins - Differential
Expression
(EGF treated and untreated
cells)
----Alternative method for differential analysis of protein expression compared to 2DE
strategy

Protein differential expression
1. Divide A431 cell sample in two: a) Half stimulated by EGFb) Half control
2. Lyse cells3. Extract proteins from lysates4. Digest with trypsin5. Run 2D LC-MS/MS of digests with
ProteomeX6. Proteins identified by TurboSEQUEST
software7. Compare “stimulated” vs. “control”

Automated 2D LC-MS/MS Analysis of Human A431 Cell Proteins
RT: 0.00 - 87.01
0 10 20 30 40 50 60 70 80
Time (min)
0
50
100
0
50
100
0
50
100
Rela
tive
Abun
danc
e
0
50
100
36.47974.2
11.84652.2
20.801154.5
8.17513.5 27.76
866.214.06981.2
34.75814.4
6.03652.9
45.66955.3
37.28974.1 74.00
1010.451.00614.2
53.93804.3
59.861179.0
66.46971.0
77.031024.2
20.34896.2
34.70970.7
37.53974.231.70
925.6 38.011335.0
26.50784.4
50.68496.2
13.92581.510.95
566.942.02322.0
52.10522.3
1.21712.6
54.90716.3
65.23369.3
73.06494.5
85.51371.0
78.78371.0
23.831154.7
50.28991.6
22.25820.7
37.57974.6
31.161113.3
51.75522.2
20.32896.1
46.23955.2
1.36712.6
13.92464.4
74.101010.4
85.00370.9
54.11760.2
68.691418.3
18.07652.3
23.73839.4
28.851079.1
52.371043.736.47
814.414.08655.0
1.06712.6
45.61955.3
12.34729.2
56.98315.9
72.50390.9
84.35370.9
81.03370.9
62.62563.3
NL:4.02E9
Base Peak MS A431_040402_01
NL:7.25E8
Base Peak MS a431_040402_02
NL:6.96E8
Base Peak MS a431_040402_03
NL:1.26E9
Base Peak MS a431_040402_04
RT: 0.00 - 87.01
0 10 20 30 40 50 60 70 80
Time (min)
0
50
100
0
50
100
0
50
100
Relat
ive A
bund
ance
0
50
100
35.16947.6
50.21991.830.76
832.018.73893.3 19.50
654.614.64653.5 51.82
522.227.91653.8
8.92578.0 35.81
1286.341.74322.0
53.03522.6
72.10390.8
83.25370.9
80.53370.9
59.38842.3
64.81371.0
23.93797.2
31.93866.3
26.10878.616.37
600.150.62496.2
12.80495.8
1.22712.5
38.721103.9
42.18322.0
73.18508.6
56.97315.9
85.04370.9
69.94508.7
65.29369.3
78.99370.9
33.02932.8
27.32889.5
51.72522.3
24.01697.0 50.30
496.211.49417.31.35
712.5 36.50900.1
38.62894.5
9.30630.8 52.55
522.472.16390.9
59.49842.4
83.45370.9
80.72371.0
69.191269.7
22.56682.7
30.16822.8
17.43480.8
15.47478.7
23.90668.8
50.63496.3
52.17522.232.76
932.60.82
712.4 38.09894.7
42.17321.9
73.04508.7
72.03508.5
56.86315.9
86.81370.9
80.31370.9
NL:9.00E8
Base Peak MS a431_040402_05
NL:1.10E9
Base Peak MS a431_040402_06
NL:3.95E8
Base Peak MS a431_040402_07
NL:1.04E9
Base Peak MS a431_040402_08
120 mM
10 mM
20 mM
40 mM
60 mMNH4Cl 0 mM
80 mM
160 mM

Automated 2D-LC-LC/MS-MS Analysis of
Human A431 Cell Proteins (continued)
200mM
300mM
500mM
900mM
RT: 0.00 - 87.02
0 10 20 30 40 50 60 70 80
Time (min)
0
50
100
0
50
100
0
50
100
Re
lativ
e A
bu
nd
an
ce0
50
100
15.05506.3 51.86
522.4
50.26496.3
1.20712.5
41.68322.1
13.02503.1
31.88569.4
15.60473.0
9.31452.8
29.42677.9
59.03886.5
82.29370.8
72.08391.0
62.99347.9
1.14712.6
52.16522.250.64
496.2
32.45569.6
42.15321.912.85
603.41.91
712.549.37496.5
19.02857.9
32.95932.5
85.51370.9
79.64370.9
30.87832.1
63.71347.9
77.53370.9
53.47508.3
50.36991.7
1.09712.4
51.731043.5
32.17569.7
2.00712.5
41.92321.99.27
446.415.78824.2
81.51370.9
25.96769.1
78.98370.9
63.24348.0
72.13390.9
59.23886.4
1.04712.5
50.64496.31.69
712.432.37569.6
52.17522.3
42.27321.95.69
712.5 19.62712.5
70.87508.7
37.95331.9
63.72348.0
46.88399.1
83.46370.9
72.54390.9
29.70347.9
54.66371.1
NL:4.11E8
Base Peak MS A431_040402_09
NL:2.46E8
Base Peak MS a431_040402_10
NL:2.95E8
Base Peak MS a431_040402_11
NL:2.70E8
Base Peak MS a431_040402_12
Total Proteins Identified= 709, using Bioworks 3.1 with TurboSequest
(Xcorr = 1.5, 2.0, and 3 for charge states +1, +2, and +3, respectively)

Proteins Differentially Expressed in Control and EGF-Stimulated A431 Cells

Proteins Differentially Expressed in Control and EGF-Stimulated A431 Cells (continued)
*Only those proteins with two or more peptides identified were compared

Proteins Identified in Both Control and EGF-Treated A431 Cells

Proteins Common to Control and EGF-treated A431 Cells (continued)

Proteins Common to Control and EGF-treated A431 Cells (continued)

Differential Protein
quantitation
-quantitative proteomics

Stable isotope labeling (SIL) for quanlitative proteomics
Metabolic labeling (13C, 15N)
Post-biosynthetic labeling (ICAT reagent)
Post-digest isotope Labeling of tryptic
peptides(18O)

Metabolic labeling with [13C6]Arg in the elucidation of EGF signaling
Cells were grown in medium containing either normal or [13C6] arginine.
8 h of serum starvation, the labeled cells were stimulated with 150ng/ml EGF for 10 min, whereas the unlabeled cells were left untreated.
Cells were lysed and combined in a 1:1 ratio followed by incubating at 4°C with Grb2 fusion protein bound to GSH-sepharose beads for 4h.
Wash with lysis buffer, boiled in sample buffer, and resolved on a 4-12% gel.
Bands of interest were excised and subjected to in gel digestion.
Mass spectrometric analysis

Strategy to study activated EGFR complex
SH2 domain of Gb2 binds tyrosine-phosphorylated proteins including EGFR, Shc etc.,

Quantification of protein ratios from peptide doublets. Top panels show mass spectra of peptides of different identified proteins, bottom panels show mass spectra of peptides from EGF-stimulated cells upon detection of autophosphorylation

Metabolic labeling
Advantages: (1) all sample-to-sample
variability induced by subsequent
biochemical experiments can be
eliminated. (2) metabolism-related
dynamic labeling involved in a specific
physiological process.

Drawbacks: (1)only works in cell culture systems that tolerate isotope-substituted media (which is actually often not the case), which may not be compatible with a particular biological investigation. (2)Total isotope substitution is required for reliable for MS-based quantification, which renders the approach rather expensive. (3)Difficulty in establishing an enrichment method

Differential Quantitation with isotope-coded Differential Quantitation with isotope-coded affinity tags (ICAT)affinity tags (ICAT)
1. Divide the previous sample (hGH in plasma) into two identical pools.
2. Reduce and alkylate (D0 ICAT for one plasma pool and D8 ICAT for the other), separately. Mix the two pools and digest the whole mixture with trypsin.
3. Sample clean-upa) ion exchange to remove excess ICAT reagentb) avidin affinity to capture the ICAT-labeled peptides
4. Collect the ICAT-peptide fractions and run LC-MS/MS.
5. Data analysis by Bioworks 3.1a) TurboSEQUEST for protein identificationb) XPRESS for relative quantitation
ProteomeX (2D)
Collect the flow through Frxn ProteomeX(2D)
ProteomeX (1D)

The structure of ICAT reagent

Data Dependent Mass Tag Setting for ICAT
1+2+3+

TurboSEQUEST Search ParametersTurboSEQUEST Search Parameters
Turbosequest parameters are set as usual except the amino acid modification and differential mass need to be set as in above

Bioworks 3.1 (SEQUEST and XPRESS) Bioworks 3.1 (SEQUEST and XPRESS) Search ResultsSearch Results200mM NH4Cl

Differential Quantitation by Bioworks (XPRESS) Differential Quantitation by Bioworks (XPRESS) SoftwareSoftware
NYGLLYCFR(T16 peptide of human growth hormone)
*
After finishing the TurboSEQUEST search, click the XPRESS function to locate the correct cysteine-containing peptide sequence (identified from its MS/MS spectrum) with the ratio of D0 and D8 ion intensities (integrated from its parent ion spectrum) as shown in above.
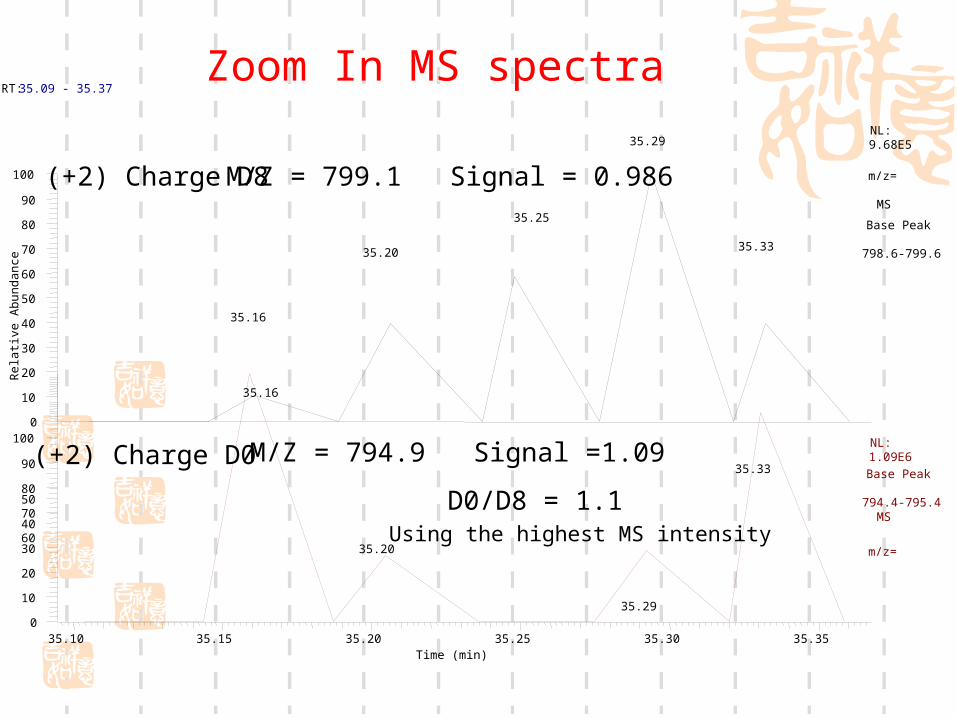
RT: 35.09 - 35.37
35.10 35.15 35.20 35.25 35.30 35.35Time (min)
0
10
20
30
40
50
60
70
80
90
1000
10
20
30
40
50
60
70
80
90
100
Rel
ativ
e A
bu
nda
nce
35.29
35.25
35.20 35.33
35.16
35.16
35.33
35.29
35.20
NL:9.68E5
Base Peak
m/z=
798.6-799.6
MS
NL:1.09E6
Base Peak
m/z=
794.4-795.4 MS
M/Z = 799.1 Signal = 0.986
M/Z = 794.9 Signal =1.09
D0/D8 = 1.1
Zoom In MS spectra
(+2) Charge D8
(+2) Charge D0
Using the highest MS intensity

Advantage: (1)Largely reduce the complexity of peptide mixture; (2)Easy to enrich.
Drawbacks: (1) 14% protein sequences do not contain cysteine-containing tryptic peptides (800-2500Da),19% contains just a single such peptide (alternatively, cleavable ICAT reagents). (2) requirement of protein over 100 g.

Post-digestion isotope labeling (18O)
Artifacts (i.e. side reactions) inherent
to chemical labeling can be avoided.
All peptides can be used for
identification and quantification
Available for gel-separated proteins

Samples of interest are first digested with trypsin.
Aliquots are subsequently incubated with either
16O water or18O water in the presence of trypsin.
Labeling efficiencies of individual peptides of the
H218O-treated sample are determined by MALDI-
TOFMS of a small portion of the sample. Mixtures
of 16O- and 18O-labeled samples are then applied
on the MALDI plate, and relative abundances are
derived from relative isotopomer abundances.

General scheme of post-digest 18O labeling procedure

Time course of trypsin-catalyzed post-digest labeling of 1 pmol BSA tryptic digest. The exchange rate of C-terminal oxygen atoms is dependent on the peptide sequence. Fast exchanging peptides show complete labeling after <10 min (a). However, for some peptides close to quantitative labeling could only be achieved after incubation for 2 h (c).

Practical considerations for stable isotope labeling in quantitative proteomics
Predictable mass difference
between labeled and unlabeled
samples
Easy to enrich

An example of Data dependent MS/MS mode-reject high abundant proteins(GDH-2)

Glutamate dehydrogenase 2
1193.29
1759.92

Data dependent setup for rejecting high abundant GDH-2 Just ion of
interest

Post-Translational Modifications
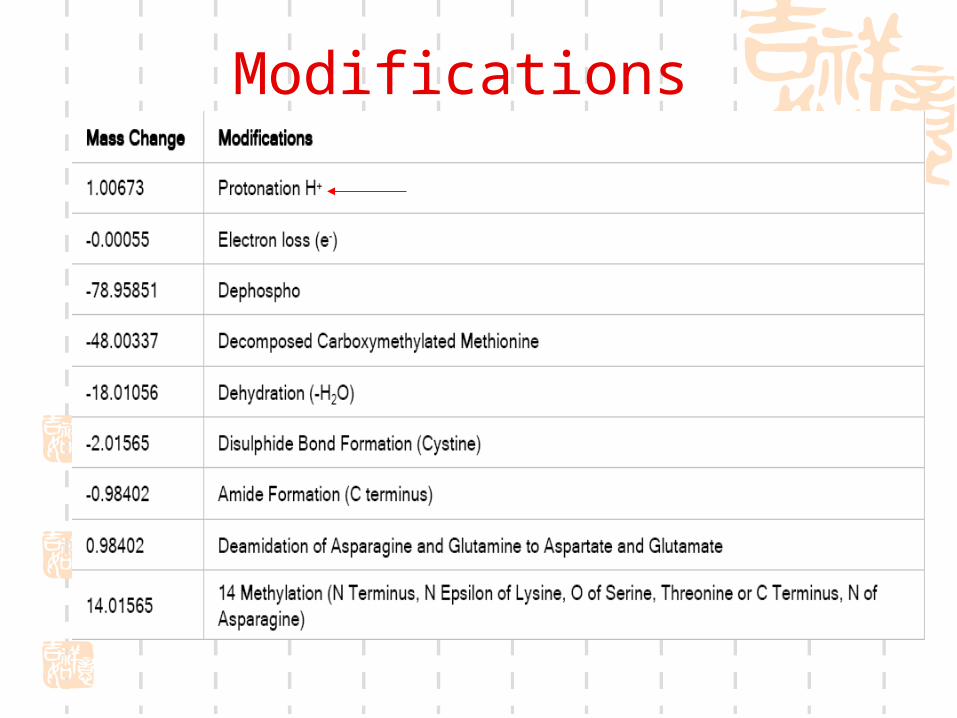
Modifications

Modifications (continued)

Modifications (continued)

Phosphorylation

Protein identification: Phosphorylation

Data Dependent (with Dynamic Exclusion)
MS/MS spectrum of m/z 980-982
% R
elat
ive
Ab
un
dan
ce
400 600 800 1000 1200 1400 1600 18000
10
20
30
40
50
60
70
80
90
100
931.8
1311.5
922.71099.5
764.6551.1452.5 1591.51410.6 1689.71083.1366.4 665.3 1786.8
Y’’12
+1
(MH2 - H3PO4)2+
Y’’10
+1
Arg-Leu-Ser-Leu-Val-Pro-Asp-Ser-Glu-Gln-Gly-Glu-Ala-Ile-Leu-Pro-Arg
Y”12
+1 Y”10
+1
Serine Not Phosphorylated
SerinePhosphorylated

Glycosylations
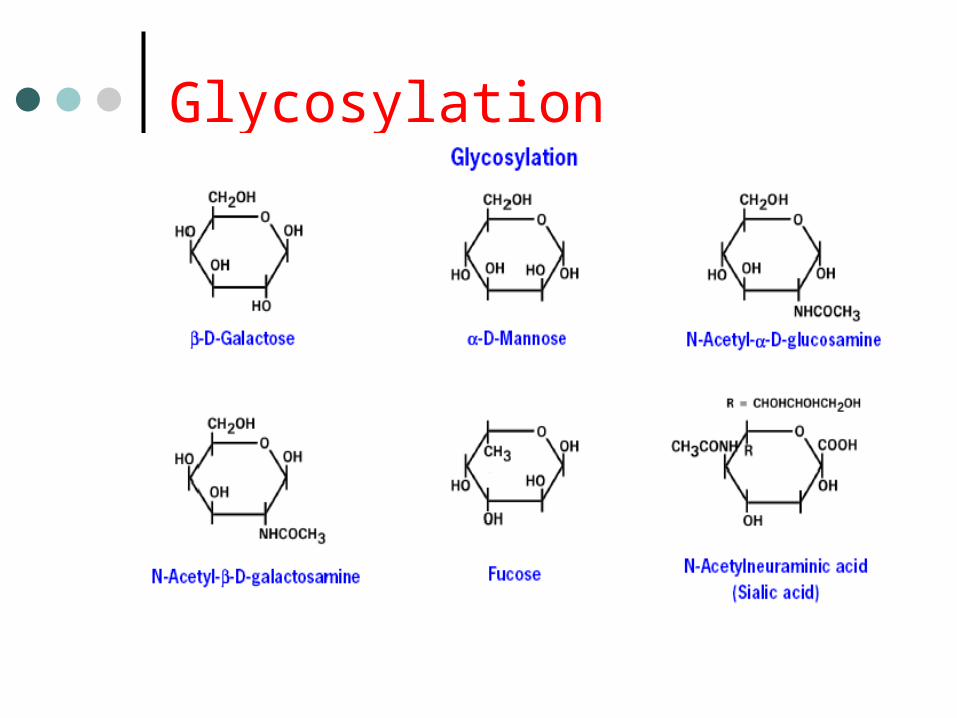
Glycosylation

Glycosylation

Glycosylation

Identifying Glycosylation – MS full scan
RT: 0.00 - 140.00
0 10 20 30 40 50 60 70 80 90 100 110 120 130Time (min)
0
10
20
30
40
50
60
70
80
90
100
Re
lativ
e A
bun
danc
e
46.78
31.0834.55
29.80 44.6626.555.32
56.23
6.06 97.6149.19 96.92
121.72113.398.59 57.42 98.2595.9321.91 110.9821.55 88.2461.02 117.3564.9113.23 86.7570.50 75.92122.46 138.88
NL:2.79E10TIC MS
#583 RT: 15.57 AV: 1 NL: 7.23E8T: + c Full ms [ 200.00-2000.00]
200 400 600 800 1000 1200 1400 1600 1800 2000m/z
0
5
10
15
20
Rel
ativ
e A
bund
ance
527.5
217.0 575.8
1064.0234.1445.0 634.8286.8 1095.7762.3 1060.7807.9 1267.6 1595.2 1780.21514.8 1987.9
Glycopeptide region MS from
glycopeptide ionMS scan
+3
+2
Asn
FuN
(select to do MS/MS)
Glycopeptide region
12
34
Other region perform only MS and MS/MS

Identifying Glycosylation – MS/MS
584 RT: 15.59 :T: + c Full ms2 [email protected] [ 280.00-2000.00]
400 600 800 1000 1200 1400 1600 1800 2000m/z
0
5
10
15
20
25
30
35
40
45
50
55
60
65
70
75
80
85
90
95
100
Rel
ativ
e A
bund
ance
1267.6
1185.81413.1
1449.6
1369.4
1450.3
366.0657.0 1003.5
1478.91085.1739.5453.8 966.8 1845.7 1933.3923.0
AsnFu
AsnFu
AsnFu
AsnN Fu
N
AsnFu
AsnFu
(select to do MS to 3)
+2
+2
+2+2
+2+1+1
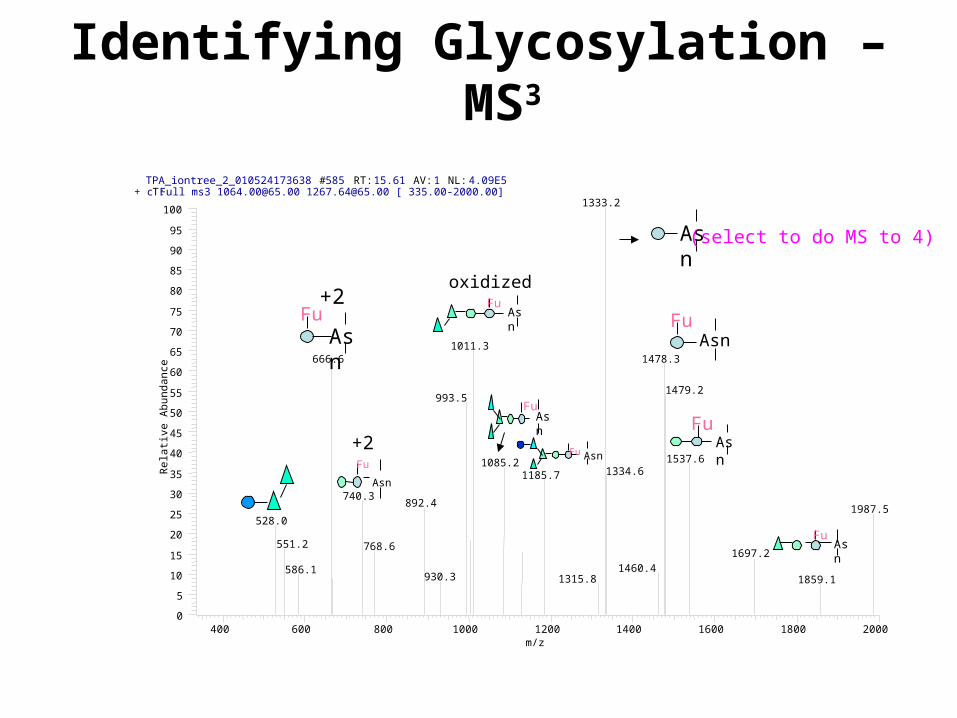
Identifying Glycosylation – MS3
TPA_iontree_2_010524173638 #585 RT: 15.61 AV: 1 NL: 4.09E5T: + c Full ms3 [email protected] [email protected] [ 335.00-2000.00]
400 600 800 1000 1200 1400 1600 1800 2000m/z
0
5
10
15
20
25
30
35
40
45
50
55
60
65
70
75
80
85
90
95
100
Rel
ativ
e A
bund
ance
1333.2
1011.31478.3666.6
1479.2993.5
1537.61085.21334.61185.7
740.3892.4
1987.5528.0
551.2 768.61697.2
1460.4586.1930.3 1315.8 1859.1
Asn
AsnFu
Asn
Fu+2
AsnFu
Asn
Fu
+2 Asn
AsnFu
oxidized
Asn
Fu
(select to do MS to 4)
Fu
AsnFu

Identifying Glycosylation – MS4
SCH2COOH
TPA_iontree_2_010524173638 #586 RT: 15.63 AV: 1 NL: 8.63E4T: + c Full ms4 [email protected] [email protected] [email protected] [ 355.00-2000.00]
400 600 800 1000 1200 1400 1600 1800 2000m/z
0
5
10
15
20
25
30
35
40
45
50
55
60
65
70
75
80
85
90
95
100
Rel
ativ
e A
bund
ance
728.4 1213.4
1130.7
506.2
833.01053.4
636.2 823.4 1240.5618.3 798.0
492.2
C-T-S-Q-H-L-L-N-R
C-T-S-Q-H-L-L-N-R
Dehydro-alanine form
Peptide onlyC-T-S-Q-H-L-L-N-R
B6B6
Y7
Y7-H2O
y2
Y2 / Y6(+2)
B5
B5
Dehydro-alanine formFurther CNH2 loss on N-terminal
B7-H2O
B7(select to do MS to 5)
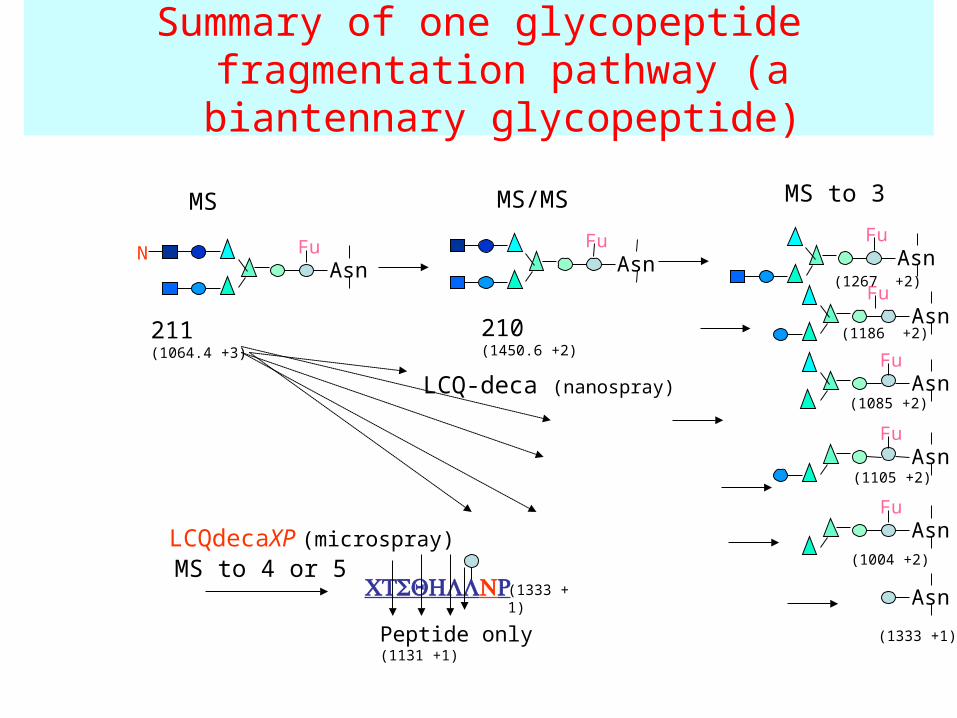
Summary of one glycopeptide fragmentation pathway (a biantennary
glycopeptide)
AsnFu
MS MS/MS
AsnFuN
MS to 3
Asn
AsnFu
AsnFu
AsnFu
AsnFu
211(1064.4 +3)
210(1450.6 +2)
MS to 4 or 5
Peptide only (1131 +1)
LCQ-deca (nanospray)
LCQdecaXP (microspray)
(1333 +1)
(1186 +2)
(1085 +2)
(1105 +2)
(1004 +2)
(1333 +1)
AsnFu
(1267 +2)

De Novo Peptide Sequencing

Why De Novo Peptide Sequencing ?
Determination and/or confirmation of peptide sequences derived from proteins that are:
not in the databases (including DNA sequence)
with amino acid modifications

De novo sequencing software (PARSER II)
Ref: Zhang ZQ, McElvain JS. De Novo peptide sequencing by two-dimensional fragment correlation mass spectrometry. Anal Chem, 2000, 72 (11): 2337-2350

MS, MS2 and MS3 spectra collected with peak parking
16 18 20 22 24Time (min)
0
20
40
60
80
100
Base Peak
400 600 800 1000 1200m/z
496.1
990.6
Full Scan MS
200 400 600 800 1000m/z
0
20
40
60
80
100
730.4
389.2261.1
233.1 616.4
732.4502.4
Full Scan MS2
***
*
*
100 200 300 400m/z
120.2
86.1121.2
400 800 1200m/z
713.4
714.5389.2502.3
Full Scan [email protected]
Full Scan [email protected]
100 200 300 400 500m/z
0
233.1
234.1200 400 600
m/z
261.2226.1
243.0
129.1
372.2
354.1
200 400 600 800 1000m/z
581.2
599.3
Full Scan [email protected]
Full Scan [email protected]
Full Scan [email protected]

Determination of Peptide Sequence by MS3 De Novo Sequencing Software --- Biowork 3.1
Peptide = FINNIGANK

Sequencing Tryptic Peptide (m/z 585.1) by MS3 De Novo Sequencing Software
Peptide = TGPNLHGLFGR

Thank You!
Top Related