


Languages
Pages
Legal


Better insight + Better process = Better results
Interim Report & Accounts
31 July 2010
JPMorgan Fund ICVC
Click to enter

Contents
1
> JPM Asia Fund
> JPM Balanced Total Return Fund
> JPM Cautious Total Return Fund
> JPM Emerging Markets Fund
> JPM Emerging Markets Infrastructure Fund
> JPM Europe Dynamic (ex-UK) Fund
> JPM Europe Fund
> JPM Global Consumer Trends Fund
> JPM Global Equity Income Fund
> JPM Global (ex-UK) Bond Fund
> JPM Global Financials Fund
> JPM Global Fund
> JPM Global High Yield Bond Fund
> JPM Global Property Securities Fund
> JPM Institutional Asia Fund
> JPM Institutional Continental Europe Fund
> JPM Institutional Japan Fund
> JPM Japan Fund
> JPM Multi-Asset Income Fund
> JPM Multi-Manager Growth Fund
> JPM Natural Resources Fund
> JPM New Europe Fund
> JPM Premier Equity Growth Fund
> JPM Premier Equity Income Fund
> JPM Sterling Corporate Bond Fund
> JPM Strategic Bond Fund
> JPM UK Active 350 Fund
> JPM UK Dynamic Fund
> JPM UK Equity & Bond Income Fund
> JPM UK Focus Fund
> JPM UK Managed Equity Fund
> JPM UK Strategic Equity Income Fund
> JPM UK Strategic Growth Fund
> JPM US Equity Income Fund
> JPM US Fund
> JPM US Select Fund
> Authorised Corporate Director’s (ACD) Report
> Interim Report for the six months to 31 July 2010Find out how the markets have performed over the six months to 31 July 2010
> Aggregated Company financial statements

This material should not be relied on as including sufficient information to support an investment decision.
The opinions and views expressed in this document are those held by J.P. Morgan Asset Management as at 31 July 2010, which are subject tochange and are not to be taken as or construed as investment advice.
For up-to-date performance information please contact J.P. Morgan Asset Management using the numbers shown on the back of this document.
You should remember that past performance is not a guide to the future. The price of investments and the income from them may fall as wellas rise and investors may not get back the full amount invested. The level of tax benefits and liabilities will depend on individual circumstancesand may change in the future.
The investment objective of a fund may allow some flexibility in terms of portfolio composition.
Funds that invest predominantly in a single market, asset class or sector may be subject to greater volatility than those funds with a morediversified portfolio.
The information in this booklet is based on our understanding of law, regulation and HM Revenue and Customs practice as at 31 July 2010.
2

Authorised Corporate Director’s (ACD) ReportWe are pleased to present the Interim Report &Accounts for JPMorgan Fund ICVC for the periodended 31 July 2010.
Authorised StatusJPMorgan Fund ICVC is an Open-EndedInvestment Company (OEIC) with variable capitalauthorised, under Regulation 12 of the OEICRegulations, by the Financial Services Authorityon 6 October 1997.
The Company was launched as a UCITS Schemeon 16 November 2001 and acts as an umbrellacompany comprising of various sub-funds. Itsregistration number is IC00005 and its registeredaddress is Finsbury Dials, 20 Finsbury Street,London EC2Y 9AQ.
Structure & LiabilitiesThe assets of each Fund are treated as separatefrom those of every other Fund and are investedin accordance with the investment objective andinvestment policies applicable to that Fund. Details of the investment objective, the policiesfor achieving these objectives, the performancerecord and a review of the investment activitiesfor each of the Funds can be found in this report.
Each Fund has a specific portfolio of securitiesto which its assets and liabilities are attributable.So far as shareholders are concerned each Fundis managed as a separate entity. However, ifthe assets of any Fund were insufficient to meetthe liabilities attributable to it, the shortfall mayhave to be met out of the assets attributable tothe other Funds in the OEIC. In the event of thishappening, the ACD would advise shareholdersimmediately. Each Fund has different classes ofshares which are applicable to different typesof investor.
Shareholders are not liable for the debts of the OEIC.
A shareholder is not liable to make any furtherpayment to the company after the purchase oftheir shares has been paid for.
Changes to Funds, Prospectusand Instrument of IncorporationDuring the period under review, the followingchanges were made as follows:
Liquidation of JPM Institutional Japan FundThe ACD informed shareholders of JPMInstitutional Japan Fund in March 2010 of the
intention to close the Fund. Approval for this wasreceived from the Financial Services Authorityand all trading and dealings in the Fund weresuspended as of 12:00 on 21 April 2010. An initialdistribution of the pro-rata termination proceedswas paid to shareholders on 23 April 2010.
Shareholders were informed in May 2010 of thefollowing matters which came into effect from2 August 2010:
Collateral Management CostsCollateral Management Costs are incurred bysome Funds when dealing in sophisticatedinvestments and the ACD decided to include suchcosts as part of the Funds’ ‘fixed expenses’. Thischange was made to provide greater certaintyof costs to shareholders.
JPM Premier Equity Income FundThe investment objective and policy was changedto “To provide income and prospects of capitalgrowth by investing primarily in equity and equity-linked securities of UK companies. Otherinstruments as permitted in the stated investmentand borrowing powers of the Company including,but not limited to, fixed interest securities, cashand cash equivalents may be held on an ancillarybasis, as appropriate.”
JPM Emerging Markets FundThe investment objective and policy was changedto “To provide long term capital growth byinvesting primarily in equity and equity-linkedsecurities of emerging markets companies. Otherinstruments as permitted in the stated investmentand borrowing powers of the Company including,but not limited to, fixed interest securities, cashand cash equivalents may be held on an ancillarybasis, as appropriate.”
JPM Global Property Securities FundThe investment objective and policy was changedto “To provide long-term capital growth byinvesting primarily in Real Estate InvestmentTrusts (REITS) and in equity and equity-linkedsecurities of other real estate companies that,at the time of investment, are significant owners,developers or financiers of real estate or thatprovide real estate related services. Otherinstruments as permitted in the statedinvestment and borrowing powers of theCompany including, but not limited to, fixedinterest securities, cash and cash equivalentsmay be held on an ancillary basis, as appropriate.The Fund will aim to hedge non-sterlingexposures back to sterling.”
The following additional changes to the Prospectuscame into effect from 1 September 2010:
• The Swing Pricing threshold was reduced tothe lower of £750,000 and 1% of net asset value.
• Shareholders can no longer request that theACD sells any underlying securities allocatedto them as a result of redemptions in specieunless the ACD specifically agrees to act onsuch instructions and is properly authorised bythe shareholder to do so.
• The ACD has flexibility to adjust the end of anaccounting period by +/- 7 days.
Management and Administration DepositaryThe Royal Bank of Scotland plcThe Broadstone, 50 South Gyle CrescentEdinburgh, EH12 9UZ(Authorised and regulated by the Financial Services Authority)
Independent AuditorsPricewaterhouseCoopers LLPPO Box 90, Erskine House68–73 Queen StreetEdinburgh, EH2 4NH
RegistrarJPMorgan Asset Management Marketing Limited125 London Wall, London, EC2Y 5AJ(Authorised and regulated by the Financial Services Authority)
Investment AdviserJPMorgan Asset Management (UK) Limited125 London Wall, London, EC2Y 5AJ(Authorised and regulated by the Financial Services Authority)
By order of the Authorised Corporate Director,
Ms T McDowall DirectorFor an on behalf of JPMorgan Funds Limited6 September 2010
Mr R ThompsonDirectorFor an on behalf of JPMorgan Funds Limited6 September 2010
3
Return to Index�
Interim Report for the six monthsto 31 July 2010Market reviewGlobal equity markets experienced a volatilesix months as concerns over the sovereign debtcrisis in Europe contributed to fears of a fading recovery. The MSCI World Index did,however, return 4.4% and the JPMorgan GlobalGovernment Bond Index produced a 5.6%return in Sterling terms.
The period began on a positive note as first-quarter earnings were surprisingly strong,suggesting that the recovery was becomingentrenched. The US and Asia produced gooddomestic economic data, as both regionsexperienced strong industrial activity. In theUK, an upward revision of fourth-quarter GDPgrowth to 0.4% helped to ease fears of adouble-dip recession.
In April however, financial markets wobbled asworries that Greece may be unable to serviceits debt spread to other highly indebtedeurozone countries. Rating agencies Standardand Poor’s and Moody’s severely downgradedGreece and followed with downgrades forPortugal, Spain, Ireland and Italy.
As a result of these sovereign debt concerns,peripheral eurozone bond yields widenedsharply and investors fled to quality, benefitinggold and those government bond markets thatare perceived as being the safest haven, notablyGerman Bunds and US Treasuries. Financialstocks were particularly badly hit by concernover the balance sheet exposure of many banksto peripheral European bonds. These concernseased following the European Union and IMF’sannouncement of a EUR 750 billion rescuepackage in May, with additional support pledgedby the European Central Bank.
However, as austerity measures required totackle huge budget deficits were introduced inmany countries concern set in again as investorsfeared the new age of austerity may berestrictive to global growth. Growth concernswere also focused on China over the period asgovernment measures to stop the domesticproperty market from overheating led to theunderperformance of Chinese stocks for thehalf year. Concerns mounted in May as industrialdata pointed to a slowdown in Chinese domesticgrowth, which provoked fears of a stalling globalrecovery.
Concerns over the pace of economic growthwere also prominent in the US, as the recoveryfailed to open up new jobs and private payrollsrose by less than expected, eroding thespending power of US households. In the UK,the new coalition government announcedswingeing cuts to public spending as part ofthe June austerity budget, adding to concernthat severe cuts to spending may compromisethe recovery.
The end of the period saw a boost to sentimentfollowing the release of surprisingly strongsecond-quarter corporate earnings data in theUS, Europe and Asia. The European Union’srelease of positive bank stress test results,showing the majority of European banks areadequately capitalised, further eased concernsover the sovereign debt crisis.
Market outlookAlthough sentiment improved in July, concernsover the pace of the recovery are likely toremain at the forefront of investors’ minds forsome time. Despite evidence of a slowdown inChina, the country’s growth outlook remainsattractive. The Chinese authorities are choosingto steer a pragmatic course and should avoidthe perils of aggressive tightening of monetarypolicy. The US and European economies,however, are likely to experience a drag togrowth from the reversal of fiscal stimulus,especially after tightening measures are put inplace. In Europe, including the UK, this effectcould be more marked in the short-term asausterity measures are already being carriedout. The key question is whether there will bea recovery in private sector demand to offseta retrenchment in the public sector. A successfulrebalancing of activity would be supportive forequities and other risk assets.
Equity valuations are attractive in manymarkets, but investors will be looking forevidence that earnings momentum remainsstrong. Government bonds, meanwhile, appearfully valued at current levels but could benefitif volatility persists.
JPMorgan Asset Management (UK) Limited11 August 2010
4
Return to Index�

ContinuationReturn to Index�
�
JPM Asia Fund
5
Investment objective and policyTo provide long-term capital growth from investment primarily in the securitiesof companies quoted or trading in Asia (excluding Japan).
Risk profileThis equity based Fund is designed to give broad market exposure (whichmay include emerging markets and smaller companies) to stock marketsacross the Asia ex-Japan region.
Equity investment is subject to specific risks relating to the performance ofthe individual companies held and the market’s perception of theirperformance. Equities are also subject to systematic risks such as generaleconomic conditions, inflation, interest rates, foreign exchange rates andindustry sector risks. In general terms, equities tend to be more volatile than bonds.
The Fund may be invested in emerging markets, which may be subject toadditional political and economic risks, low liquidity, poor transparencyand greater financial risks.
The underlying assets of the Fund are denominated in currencies other thanSterling and are not hedged back to Sterling. Investors will therefore beexposed to the currency risk of fluctuations between Sterling and the currencydenomination of the underlying assets.
Fund review• Over the six month review period, the Fund produced a positive return
but underperformed its benchmark. Asset allocation (overweight HK/Chinaand Thailand; underweight Singapore, Philippines and Malaysia) wasneutral and underperformance was mainly due to negative stock selectionin Korea and Taiwan.
• Asian markets were volatile at the start of the year on concerns over Greekfiscal stress, Chinese policy tightening and fears over US bank regulation.Markets staged an unconvincing rally from mid-February. The Fundbenefited from its overweight position in Thailand.
• The latter part of the period proved more difficult for the Fund, againsta backdrop of heightened concerns over European sovereign debt, Chinesepolicy tightening and global growth. The Fund’s overweight in China andunderweight in ASEAN markets were detrimental for returns, as was ourdecision to eschew classic defensive stocks such as utilities and telecoms.
Fund outlook• We are cautiously optimistic about the outlook for Asia. We remain
concerned about the external environment, as earnings forecasts for theUS in 2011 look high and we expect external demand for Asian exportsnext year to be anaemic.
• That said, the Asian consumption story, particularly in China, continuesto offer high growth and the Fund is well exposed to this sector. Overall,Asian equities are reasonably priced and balance sheets look strong.
You should remember that past performance is not a guide to the future. The price of investments and the income from them may fall as well as rise andinvestors may not get back the full amount invested. For specific risks, please read the Simplified Prospectus.All performance returns are calculated using the quoted price of the accumulation shares. Performance returns are in Sterling.FX Adjusted returns have been calculated by JPMAM. Blended benchmarks have been calculated by JPMAM.Source: J.P. Morgan.A On 01/03/09 the Fund’s benchmark was changed from MSCI AC Far East ex Japan Net to the MSCI AC Asia ex Japan (Total Return Net) Index.Benchmark Source: MSCI. Neither MSCI nor any other party involved in or related to compiling, computing or creating the MSCI data makes any express of implied warranties or representations with respect to such data(or the results to be obtained by the use thereof), and all such parties hereby expressly disclaim all warranties of originality, accuracy, completeness, merchantability or fitness for a particular purpose with respect toany of such data. Without limiting any of the foregoing, in no event shall MSCI, any of its affiliates or any third party involved in or related to compiling computing or creating the data have any liability for any direct,indirect, special, punitive, consequential or any other damages (including lost profits) even if notified of the possibility of such damages. No further distribution or dissemination of the MSCI data is permitted withoutMSCI’s express written consent.
• If China can engineer a soft economic landing in the second half of 2010,then we think further upside exists. The slowdown in sequential growthin China should soon bring an end to policy tightening, boosting regionalmarkets.
• Valuations appear reasonable and for the second half of 2010 the Fundremains overweight in Hong Kong/China and Thailand and underweightin Singapore, Malaysia and Taiwan.
Rolling 12 month performance as at 31 July2010/2009 2009/2008 2008/2007 2007/2006 2006/2005
JPM Asia A-Class Acc 17.0% 13.6% -13.7% 51.4% 8.1%
JPM AsiaB-Class Acc 17.7% – – – –
Benchmark IndexA 21.0% 12.8% -10.5% 41.6% 9.5%
Six month performance31/01/10–31/07/10
JPM Asia A-Class Acc 8.6%
Benchmark IndexA 10.9%
Fund statisticsFund size £111.0m
Benchmark IndexA MSCI AC Asia ex Japan (Total Return Net)
Fund chargesA-Class Initial 4.25%, Annual 1.50%B-Class Initial Nil, Annual 1.00%
Top ten holdings %Samsung Electronics 4.7China Construction Bank ‘H’ 4.3KB Financial Group 3.2China Life Insurance ‘H’ 2.9Industrial & Commercial Bank of China ‘H’ 2.5Hon Hai Precision Industry 2.3HDFC Bank 2.2Tencent 2.2CNOOC 1.9Wharf 1.9
6
ContinuationReturn to Index�
�
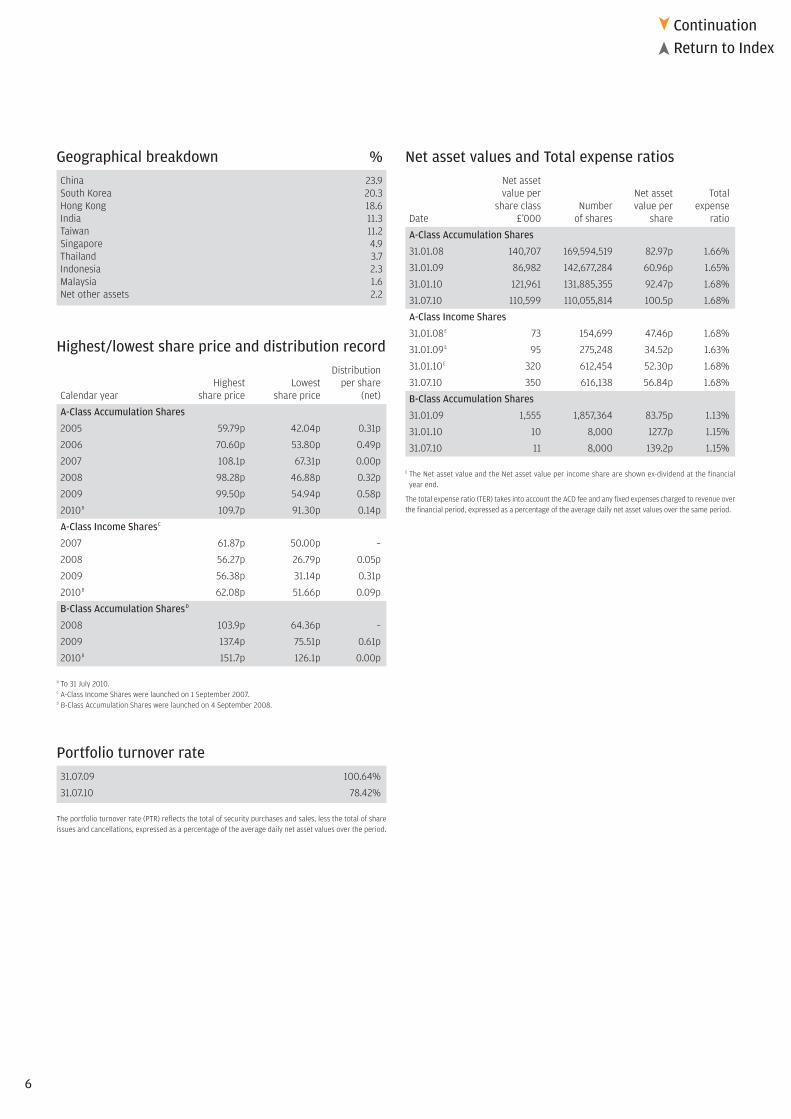
Geographical breakdown %China 23.9South Korea 20.3Hong Kong 18.6India 11.3Taiwan 11.2Singapore 4.9Thailand 3.7Indonesia 2.3Malaysia 1.6Net other assets 2.2
Highest/lowest share price and distribution recordDistribution
Highest Lowest per shareCalendar year share price share price (net)
A-Class Accumulation Shares
2005 59.79p 42.04p 0.31p
2006 70.60p 53.80p 0.49p
2007 108.1p 67.31p 0.00p
2008 98.28p 46.88p 0.32p
2009 99.50p 54.94p 0.58p
2010B 109.7p 91.30p 0.14p
A-Class Income SharesC
2007 61.87p 50.00p –
2008 56.27p 26.79p 0.05p
2009 56.38p 31.14p 0.31p
2010B 62.08p 51.66p 0.09p
B-Class Accumulation SharesD
2008 103.9p 64.36p –
2009 137.4p 75.51p 0.61p
2010B 151.7p 126.1p 0.00p
B To 31 July 2010.C A-Class Income Shares were launched on 1 September 2007.D B-Class Accumulation Shares were launched on 4 September 2008.
Portfolio turnover rate31.07.09 100.64%
31.07.10 78.42%
The portfolio turnover rate (PTR) reflects the total of security purchases and sales, less the total of shareissues and cancellations, expressed as a percentage of the average daily net asset values over the period.
Net asset values and Total expense ratiosNet assetvalue per Net asset Total
share class Number value per expenseDate £’000 of shares share ratio
A-Class Accumulation Shares
31.01.08 140,707 169,594,519 82.97p 1.66%
31.01.09 86,982 142,677,284 60.96p 1.65%
31.01.10 121,961 131,885,355 92.47p 1.68%
31.07.10 110,599 110,055,814 100.5p 1.68%
A-Class Income Shares
31.01.08E 73 154,699 47.46p 1.68%
31.01.09E 95 275,248 34.52p 1.63%
31.01.10E 320 612,454 52.30p 1.68%
31.07.10 350 616,138 56.84p 1.68%
B-Class Accumulation Shares
31.01.09 1,555 1,857,364 83.75p 1.13%
31.01.10 10 8,000 127.7p 1.15%
31.07.10 11 8,000 139.2p 1.15%
E The Net asset value and the Net asset value per income share are shown ex-dividend at the financial year end.
The total expense ratio (TER) takes into account the ACD fee and any fixed expenses charged to revenue overthe financial period, expressed as a percentage of the average daily net asset values over the same period.

7
ContinuationReturn to Index�
�
Market value Total netInvestment Holding £’000 assets %
Portfolio statementAs at 31 July 2010
China – 23.9% (17.3%)Agricultural Bank of China 3,008,000 870 0.8 Aluminium Corp of China 1,284,000 729 0.7 Angang Steel 192,000 186 0.2 China Construction Bank ‘H’ 8,750,000 4,759 4.3 China Life Insurance ‘H’ 1,146,000 3,263 2.9 China National Building Material ‘H’ 1,318,000 1,597 1.4 China Petroleum & Chemical ‘H’ 3,394,000 1,751 1.6 China Shenhua Energy ‘H’ 849,000 2,098 1.9 China Vanke ‘B’ 1,297,298 1,086 1.0 CNOOC 1,986,000 2,141 1.9 Industrial & Commercial Bank of China ‘H’ 5,750,000 2,819 2.5 Jiangxi Copper ‘H’ 513,000 729 0.7 Tencent 196,000 2,424 2.2 Yanzhou Coal Mining 1,444,000 1,984 1.8
South Korea – 20.3% (19.1%)Daelim Industrial 34,400 1,244 1.1 GS Engineering & Construction 24,700 1,066 1.0 Hana Financial Group 51,497 981 0.9 Hyosung 24,000 1,063 1.0 Hyundai Heavy Industries 13,000 1,887 1.7 KB Financial Group 125,800 3,503 3.2 Korea Electric Power 67,000 1,203 1.1 LG Electronics 20,000 1,081 1.0 Lotte Shopping 7,700 1,484 1.3 POSCO 5,000 1,330 1.2 Samsung Electronics 11,898 5,210 4.7 Samsung Engineering 23,200 1,549 1.4 Shinsegae 2,400 734 0.7
Hong Kong – 18.6% (21.1%)BOC Hong Kong 769,000 1,262 1.1 Cheung Kong 224,000 1,735 1.6 China Resources Land 1,000,000 1,362 1.2 China Yurun Food Group 900,000 1,878 1.7 Glorious Property 6,295,000 1,317 1.2 GOME Electrical Appliances 4,723,000 1,050 0.9 Hang Lung Properties 663,000 1,765 1.6 Hidili Industries International Development 555,000 322 0.3 Hutchison Whampoa 207,000 874 0.8 Jardine Matheson 42,800 1,085 1.0 Kerry Properties 443,000 1,428 1.3 Li Ning 862,500 1,832 1.6 Lifestyle International 648,500 858 0.8 Orient Overseas International 250,000 1,253 1.1 Pacific Basin Shipping 1,201,000 582 0.5 Wharf 602,000 2,112 1.9
India – 11.3% (11.3%)Ambuja Cements 393,000 640 0.6 Bharat Heavy Electricals 33,000 1,112 1.0 HDFC Bank 85,000 2,499 2.2 Hindalco Industries 403,000 893 0.8 Infosys Technologies 50,000 1,927 1.7 Infrastructure Development Finance 350,000 900 0.8 Maruti Suzuki India 50,400 837 0.8 Reliance Industries 104,000 1,452 1.3 Rural Electrification 90,551 393 0.3 Tata Motors 100,000 1,170 1.1 Tata Power 44,000 804 0.7
Market value Total netInvestment Holding £’000 assets %
Taiwan – 11.2% (16.0%)Acer 840,423 1,445 1.3 Advanced Semiconductor Engineering 3,121,529 1,572 1.4 Compal Electronics 2,091,000 1,758 1.6 Formosa Plastic 766,980 1,028 0.9 Fubon Financial 756,000 596 0.5 Hon Hai Precision Industry 970,575 2,513 2.3 Innolux Display 1,671,000 1,160 1.0 MediaTek 95,684 832 0.7 Taishin Financial Holdings 1,779,623 509 0.5 Taiwan Fertilizer 657,000 1,168 1.0
Singapore – 4.9% (4.5%)CapitaLand 804,500 1,498 1.3 DBS Group 262,000 1,779 1.6 Keppel 232,000 1,019 0.9 Neptune Orient Lines 1,222,000 1,181 1.1
Thailand – 3.7% (3.8%)Bank of Ayudhya (Alien Market) 2,450,000 1,004 0.9 Banpu (Alien Market) 53,000 658 0.6 Krung Thai Bank (Alien Market) 3,452,000 879 0.8 PTT Chemical Public Company (Alien Market) 372,000 747 0.7 Siam Cement Non-Voting Depository Receipt 149,400 799 0.7
Indonesia – 2.3% (4.3%)Bank Danamon 1,654,000 635 0.6 Indo Tambangraya Megah 165,000 444 0.4 Telekomunikasi Indonesia ‘B’ 891,000 537 0.5 United Tractors 615,166 887 0.8
Malaysia – 1.6% (1.3%)Parkson Retail Group 1,626,000 1,782 1.6
Investment assets 108,543 97.8
Net other assets 2,417 2.2
Net assets 110,960 100.0
Unless otherwise stated the above securities are admitted to official stock exchange listings or trade on aregulated market.
The comparative percentage figures in brackets are at 31 January 2010.

8
ContinuationReturn to Index�
�
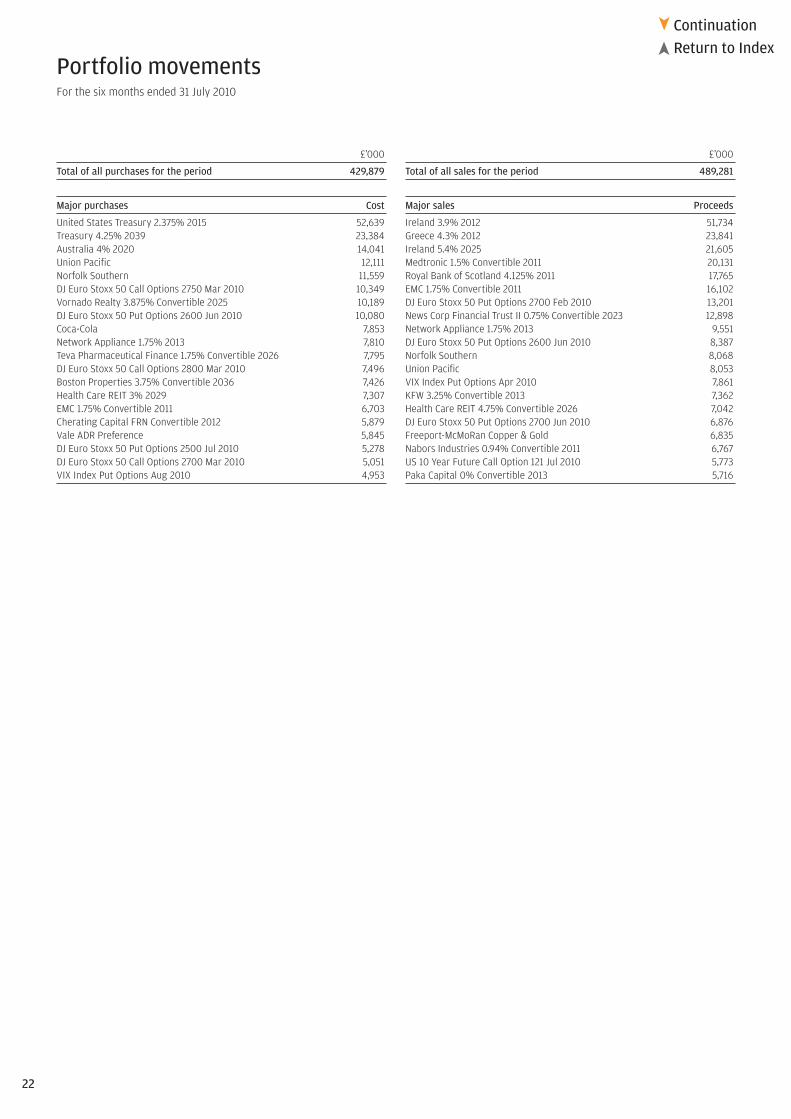
£’000
Total of all purchases for the period 53,339
Major purchases Cost
LG Electronics 2,847Yanzhou Coal Mining 2,501Glorious Property 2,093Hyundai Heavy Industries 1,915Krung Thai Bank 1,844BOC Hong Kong 1,542Neptune Orient Lines 1,488POSCO 1,346KB Financial Group 1,317China Life Insurance ‘H’ 1,108Tata Motors 1,060GOME Electrical Appliances 1,058Shin Kong Financial 1,026Siam Cement Non-Voting Depository Receipt 1,020ICICI Bank 962China Construction Bank ‘H’ 909Hyosung 908Samsung Electronics 898Hindalco Industries 879Acer 854
£’000
Total of all sales for the period 75,024
Major sales Proceeds
Samsung Electronics 3,631Shinhan Financial Group 2,492Industrial & Commercial Bank of China ‘H’ 2,244Kangwon Land 2,180China Mobile 2,037China Overseas Land & Investments 2,031Siam Cement Non-Voting Depository Receipt 1,954Jardine Matheson 1,727China Construction Bank ‘H’ 1,691China Steel 1,677Hindalco Industries 1,668Richtek 1,589LG Electronics 1,483United Microelectronics 1,359Siam Commercial Bank (Alien Market) 1,349Reliance Industries 1,338China Life Insurance ‘H’ 1,306Hong Kong Exchanges & Clearing 1,288PTT Chemical Public Company 1,254Bank Danamon 1,207
Portfolio movements For the six months ended 31 July 2010

9
Return to Index�
Financial statements
Statement of total return(Unaudited)
For the six months ended 31 July2010 2009
£’000 £’000 £’000 £’000
Income
Net capital gains 9,553 33,415
Revenue 1,659 1,168
Expenses (1,059) (799)
Net revenue before taxation 600 369
Taxation (144) (43)
Net revenue after taxation 456 326
Total return before distributions 10,009 33,741
Finance costs: Distributions (38) 31
Change in net assets attributable to shareholders from investment activities 9,971 33,772
Statement of change in net assets attributable to shareholders(Unaudited)
For the six months ended 31 July2010 2009
£’000 £’000 £’000 £’000
Opening net assets attributable to shareholders 122,291 88,632
Amounts receivable onissue of shares 4,145 8,545
Amounts payable on cancellation of shares (25,447) (8,542)
(21,302) 3
Change in net assets attributable to shareholders from investment activities (see above) 9,971 33,772
Closing net assets attributable to shareholders 110,960 122,407
As the comparatives in the above table are for the previous interim period, the Net assets at the end ofthat period will not agree to the Net assets at the start of the current period.
Balance sheet(Unaudited)
As at31 July 2010 31 January 2010
£’000 £’000 £’000 £’000
ASSETS
Investment assets 108,543 120,654
Debtors 588 4,677
Cash and bank balances 2,947 2,489
Total other assets 3,535 7,166
Total assets 112,078 127,820
LIABILITIES
Creditors (1,118) (5,528)
Distribution payable on income shares – (1)
Total liabilities (1,118) (5,529)
Net assets attributable to shareholders 110,960 122,291

10
ContinuationReturn to Index�
�
JPM Balanced Total Return Fund
Investment objective and policyTo achieve over a longer-term horizon higher returns than those availablefrom money market instruments denominated in Sterling by investingprimarily in equity securities, fixed income securities, convertible bonds andshort-term securities of issuers located in any country. The Fund may investin such securities issued by issuers in emerging countries worldwide.Additionally, subject to market conditions the Fund may invest up to 90%in cash and cash equivalents. Asset and country allocations may vary overtime to reflect market conditions and opportunities. The Fund may investup to 90% in government and public securities (see section 3.10(e) of thefull Prospectus). The Fund may use derivatives for investment purposes orEfficient Portfolio Management including hedging where appropriate.
Risk profileThis multi-asset Fund invests in equities (which may include investment inemerging markets and smaller companies), bonds, convertible bonds, cashand cash equivalents, typically maintaining a bias towards equities.
Equity investment is subject to specific risks relating to the performance ofthe individual companies held and the market’s perception of theirperformance. Equities are also subject to systematic risks such as generaleconomic conditions, inflation, interest rates, foreign exchange rates andindustry sector risks. In general terms, equities tend to be more volatile than bonds.
Bond prices can fluctuate significantly depending not only on the globaleconomic and interest rate conditions but also on the general credit marketenvironment and the creditworthiness of the issuer.
The investment policy of the Fund permits the use of derivatives and/orforward transactions for investment purposes, potentially increasing thevolatility and therefore risk of the Fund.
Total return funds seek to provide a positive return but this is not guaranteedand they should not be used as a substitute for traditional liquidity funds orcash accounts. As the priority of these funds is to provide positive returns,they will not perform in line with stock markets.
This Fund charges the fees of the ACD against capital, which will increasethe amount of income available for distribution to Shareholders, but mayconstrain capital growth. It may also have tax implications for certain investors.
Fund review• The six-month period to the end of July 2010 was a volatile time for markets.
In this environment, the Fund produced a positive return and outperformedits cash benchmark.
• We saw disappointing performance over the six month period in our GlobalDynamic stock picking module in comparison to the MSCI World Index,with positive excess returns coming only in March and April. The Fund’sequity sensitivity (delta) averaged around 55% but ranged from a high of75% to a low of 41%.
• Currency positions were negative over the period, with our short JapaneseYen versus Norwegian Krone trade suffering in May as the Yen strengthened.Fixed income positions were broadly positive, as several trades, includingan inflation-protected Australian bond position and particularly our longin German five- and ten-year government bonds added value, the latterdue to the flight to quality in May, which saw both German and US bondsrally. We also maintained a small allocation to convertibles over the period.
You should remember that past performance is not a guide to the future. The price of investments and the income from them may fall as well as rise andinvestors may not get back the full amount invested. For specific risks, please read the Simplified Prospectus.All performance returns are calculated using the quoted price of the accumulation shares. Performance returns are in Sterling.FX Adjusted returns have been calculated by JPMAM. Blended benchmarks have been calculated by JPMAM.Source: J.P. Morgan.
Fund outlook• Our outlook remains stable. We do not expect a global double-dip recession,
but continue to anticipate a slow and gradual recovery with both fixedincome and equity markets trading in broad ranges, possibly for manyyears to come. Over the rest of the year, we expect to continue favouringthe Asian and, to a lesser degree, European equity markets, where wefeel there is an attractive valuation discount.
Rolling 12 month performance as at 31 July2010/2009 2009/2008 2008/2007
JPM Balanced Total ReturnA-Class Acc 5.8% -3.8% -3.1%
JPM Balanced Total ReturnI-Class Acc 6.6% -3.1% -2.4%
Benchmark Index 0.5% 2.6% 6.0%
Six month performance31/01/10–31/07/10
JPM Balanced Total Return A-Class Acc 2.4%
Benchmark Index 0.3%
Fund statisticsFund size £11.9m
Benchmark Index 1 Month LIBOR GBP (Gross)
Fund chargesA-Class Initial 4.25%, Annual 1.50%I-Class Initial Nil, Annual 0.75%
Top ten holdings %Treasury 4.5% 2013 9.1Australia 4% 2020 3.9Canada 5% 2037 3.2Treasury 5% 2012 2.7Treasury 8% 2013 2.0KFW 3.25% Convertible 2013 1.5Nestle 0.7Chevron 0.6Cisco Systems 0.6Wells Fargo 0.6

ContinuationReturn to Index�
�
Sector breakdown %Equities 58.0Fixed interest securities 20.9Convertible bonds 2.2Forward currency contracts 1.5Options 0.5Futures 0.2Net other assets 16.7
In line with current accounting practice the sector breakdown includes the unrealised profit and loss onderivate holdings and consequently the economic market exposure of the Fund cannot be fully determinedfrom the above disclosure.
Highest/lowest share price and distribution recordDistribution
Highest Lowest per shareCalendar year share price share price (net)
A-Class Accumulation Shares
2006 52.63p 49.61p –
2007 55.17p 51.95p 0.64p
2008 54.89p 44.65p 0.95p
2009 53.46p 43.72p 1.02p
2010A 56.08p 51.12p 0.65p
A-Class Income Shares
2006 52.63p 49.61p –
2007 54.68p 51.56p 0.63p
2008 54.23p 43.32p 0.93p
2009 50.96p 42.24p 0.99p
2010A 53.14p 48.21p 0.59p
I-Class Accumulation Shares
2006 105.6p 99.26p –
2007 111.4p 104.4p 2.37p
2008 111.1p 90.89p 2.70p
2009 109.5p 89.20p 2.41p
2010A 115.4p 105.4p 1.53p
I-Class Income Shares
2006 105.6p 99.26p –
2007 109.6p 103.2p 2.34p
2008 108.6p 86.65p 2.62p
2009 102.4p 84.53p 2.27p
2010A 107.0p 97.24p 1.41p
A To 31 July 2010.
Portfolio turnover rate31.07.09 34.59%
31.07.10 15.67%
The portfolio turnover rate (PTR) reflects the total of security purchases and sales, less the total of shareissues and cancellations, expressed as a percentage of the average daily net asset values over the period.
Net asset values and Total expense ratiosNet assetvalue per Net asset Total
share class Number value per expenseDate £’000 of shares share ratio
A-Class Accumulation Shares
31.01.08 4,505 8,526,650 52.83p 1.72%
31.01.09 5,606 11,866,420 47.24p 1.67%
31.01.10 8,053 15,543,846 51.81p 1.68%
31.07.10 8,731 16,457,633 53.05p 1.68%
A-Class Income Shares
31.01.08 2,238 4,303,604 52.01p 1.74%
31.01.09 2,883 6,318,157 45.63p 1.67%
31.01.10 2,083 4,244,130 49.10p 1.68%
31.07.10 2,212 4,441,323 49.81p 1.68%
I-Class Accumulation Shares
31.01.08 897 839,337 106.9p 0.75%
31.01.09 809 840,337 96.29p 0.75%
31.01.10 496 465,872 106.4p 0.75%
31.07.10 510 465,872 109.5p 0.75%
I-Class Income Shares
31.01.08 863 830,000 104.0p 0.75%
31.01.09 758 831,000 91.24p 0.75%
31.01.10 440 445,722 98.68p 0.75%
31.07.10 449 446,722 100.5p 0.75%
The Net asset value and the Net asset value per income share are shown ex-dividend.
The total expense ratio (TER) takes into account the ACD fee and any fixed expenses charged to revenue overthe financial period, expressed as a percentage of the average daily net asset values over the same period.
11

Market value Total netInvestment Holding £’000 assets %
Portfolio statementAs at 31 July 2010
Equities – 58.0% (59.0%)United States of America – 27.9%Abbott Laboratories 947 30 0.2 ACE 602 20 0.2 Actuant ‘A’ 1,131 15 0.1 Adobe Systems 740 14 0.1 AerCap Holdings 1,580 13 0.1 AFLAC 833 27 0.2 Altria Group 2,346 33 0.2 American Electric Power 510 12 0.1 American Express 1,075 31 0.2 Ameriprise Financial 675 19 0.2 AmerisourceBergen 879 16 0.1 Anadarko Petroleum 1,133 36 0.3 Analog Devices 1,326 25 0.2 Apple 417 69 0.6 Ashland 529 18 0.2 AT&T 2,949 49 0.4 Atlas Air Worldwide Holdings 540 20 0.2 Autoliv 503 19 0.2 Axis Capital 690 14 0.1 Bank of America 6,618 60 0.5 Baxter International 861 24 0.2 BE Aerospace 1,109 21 0.2 Cameron International 453 11 0.1 Capital One Financial 784 21 0.2 Casey’s General Stores 420 10 0.1 CBS ‘B’ 1,493 14 0.1 Cephalon 427 16 0.1 Chevron 1,581 77 0.6 Cimarex Energy 527 23 0.2 Cisco Systems 4,959 74 0.6 Citigroup 23,103 61 0.5 Cognizant Technology Solutions 625 22 0.2 Comcast ‘A’ 2,030 25 0.2 Concho Resources 350 14 0.1 ConocoPhillips 550 19 0.2 Cooper 765 19 0.2 Cooper Industries 232 7 0.1 Cooper Tire & Rubber 897 12 0.1 Corning 1,518 18 0.2 CSX 915 31 0.2 Cummins 426 22 0.2 Danaher 842 21 0.2 Deere & Co 370 15 0.1 Dell 2,298 19 0.2 Devon Energy 409 16 0.1 Dow Chemical 1,183 21 0.2 Dr Pepper Snapple Group 900 21 0.2 DTE Energy 544 17 0.1 Eaton 338 17 0.1 El Paso 2,985 24 0.2 EMC 2,360 30 0.2 Emerson Electric 721 23 0.2 Endo Pharmaceutical 930 14 0.1 F5 Network 341 19 0.2 Finisar 1,340 15 0.1 Ford Motor Company 2,502 21 0.2 Forest Laboratories 750 13 0.1 Fossil 460 12 0.1 GameStop ‘A’ 1,196 15 0.1 Gannett 2,239 19 0.2 General Electric 6,005 62 0.5 Genworth Financial 2,440 25 0.2 Goldman Sachs Group 264 26 0.2 Goodrich 449 21 0.2 Google ‘A’ 120 37 0.3 Guess 1,077 25 0.2 Halliburton 752 15 0.1 Hartford Financial Services Group 1,023 15 0.1 Hess 573 20 0.2 Hewlett Packard 1,193 35 0.3 IBM 674 55 0.5 Intel 3,038 41 0.3 Interpublic Group 3,261 19 0.2 Jones Lang LaSalle 533 26 0.2 Kansas City Southern 500 12 0.1 Lam Research 510 14 0.1 Las Vegas Sands 1,234 21 0.2 Lennar 1,751 17 0.1 Lexmark International ‘A’ 584 14 0.1
Market value Total netInvestment Holding £’000 assets %
Lifepoint Hospitals 410 8 0.1 Limited Brands 957 16 0.1 Macy’s 2,111 25 0.2 Marathon Oil 878 19 0.2 Marvell Tech Group 1,576 15 0.1 McKesson 409 17 0.1 Mead Johnson Nutrition ‘A’ 565 19 0.2 Merck 2,912 65 0.5 Microsoft 2,096 35 0.3 Morgan Stanley 1,040 18 0.2 Motorola 2,950 14 0.1 Mylan Laboratories 2,031 23 0.2 Network Appliance 924 25 0.2 Newell Rubbermaid 1,785 18 0.2 Newfield Exploration 386 13 0.1 Newmont Mining 974 35 0.3 News Corp ‘B’ 2,363 22 0.2 Norfolk Southern 839 30 0.2 Northrop Grumman 480 18 0.2 Occidental Petroleum 502 25 0.2 ONEOK 750 22 0.2 Pfizer 5,963 58 0.5 Philip Morris International 891 29 0.2 Phillips Van Heusen 604 20 0.2 Pier 1 Imports 3,557 16 0.1 Pioneer Natural Resources 411 15 0.1 PNC Financial Services Group 653 25 0.2 Principal Financial Group 1,263 21 0.2 Progress Energy 676 18 0.2 Prudential Financial 968 35 0.3 QEP Resources 720 15 0.1 Qualcomm 1,034 26 0.2 Questar 970 10 0.1 Red Hat 845 17 0.1 Reynolds American 629 23 0.2 Rowan 1,004 16 0.1 Royal Caribbean Cruises 1,097 20 0.2 Sandisk 455 13 0.1 Smucker (J.M.) 480 19 0.2 Sothebys ‘A’ 1,183 21 0.2 Starbucks 825 13 0.1 Starwood Hotels ‘B’ 772 24 0.2 State Street 550 14 0.1 The Travelers Companies 521 17 0.1 TIBCO Software 2,320 20 0.2 Tiffany & Co 990 26 0.2 Time Warner 1,017 20 0.2 Time Warner Cable 402 14 0.1 Treehouse Foods 380 12 0.1 Tyson Foods ‘A’ 1,527 17 0.1 United Parcel Service ‘B’ 470 19 0.2 United Technologies 623 28 0.2 UNUM Group 970 14 0.1 US Bancorp 1,685 26 0.2 Veeco Fei Inccom 541 15 0.1 VF 438 22 0.2 Viacom ‘B’ 777 16 0.1 Walt Disney 1,052 23 0.2 Watson Pharmaceuticals 579 15 0.1 Wellpoint 471 15 0.1 Wells Fargo 4,084 73 0.6 Whirlpool 303 16 0.1 Whiting Petroleum 400 22 0.2 Williams-Sonoma 1,099 19 0.2 Xerox 4,189 26 0.2 Zimmer 510 17 0.1 United Kingdom – 7.6%Aggreko 892 14 0.1 Anglo American 1,022 26 0.2 AstraZeneca 714 23 0.2 Autonomy 926 15 0.1 Aviva 5,260 19 0.2 Barclays 11,645 39 0.3 BG Group 2,520 26 0.2 BP 10,341 42 0.3 British American Tobacco 1,153 26 0.2 Britvic 3,539 17 0.1 BT Group 12,205 17 0.1 Burberry Group 2,687 23 0.2 Cairn Energy 4,413 21 0.2 Centrica 6,370 20 0.2
1212
ContinuationReturn to Index�
�

13
ContinuationReturn to Index�
�
Portfolio statement – continuedAs at 31 July 2010
Market value Total netInvestment Holding £’000 assets %
Cookson Group 4,626 20 0.2 Enquest 11,332 13 0.1 Eurasian Natural Resources 2,308 21 0.2 GKN 13,287 18 0.2 GlaxoSmithKline 2,111 24 0.2 IMI 1,930 14 0.1 Inchcape 6,268 19 0.2 Informa 4,522 18 0.2 ING Groep 5,602 35 0.3 Intercontinental Hotels Group 1,586 18 0.2 Lloyds Banking Group 38,742 27 0.2 Man Group 8,418 19 0.2 Petrofac 1,287 16 0.1 Petropavlovsk 1,520 15 0.1 Prudential 3,128 18 0.2 Rio Tinto 1,323 44 0.3 Royal Bank of Scotland Group 37,609 19 0.2 Standard Chartered 3,352 63 0.5 Travis Perkins 1,744 15 0.1 Vodafone Group 47,867 72 0.6 Weir Group 1,236 14 0.1 WPP 3,088 21 0.2 Xstrata 3,503 36 0.3 Japan – 4.0%Aisin Seiki 1,000 18 0.2 Asahi Glass 4,000 26 0.2 East Japan Railway 600 25 0.2 Honda Motor 1,800 36 0.3 Isuzu Motors 9,000 17 0.1 Itochu 3,900 20 0.2 JX Holdings 3,700 13 0.1 Komatsu 1,600 22 0.2 Kubota 5,000 25 0.2 Marubeni 8,000 27 0.2 Mitsubishi 2,100 29 0.2 Mitsui & Co 1,700 14 0.1 Nidec 400 24 0.2 Nintendo 100 18 0.2 Nippon Telegraph & Telephone 1,000 27 0.2 Nissan Motor 4,200 21 0.2 Nitto Denko 600 13 0.1 Orix 400 20 0.2 Sumitomo Electric 3,200 24 0.2 Suzuken 800 18 0.2 Yahoo 76 19 0.2 Yamada Denki 380 16 0.1 France – 2.9%Alstom 550 18 0.2 AXA 3,077 36 0.3 BNP Paribas 874 38 0.3 Pernod-Ricard 432 22 0.2 PPR 351 30 0.2 Rhodia 1,779 24 0.2 Sanofi-Aventis 1,230 46 0.4 Schneider Electric 304 22 0.2 Societe Generale 987 37 0.3 Technip 467 20 0.2 TOTAL S.A. 1,603 52 0.4 Switzerland – 2.8%Compagnie Financiere Richemont ‘A’ 902 23 0.2 Credit Suisse 1,468 44 0.4 Holcim 505 22 0.2 Nestle 2,469 79 0.7 Novartis 1,918 60 0.5 Roche (Genusscheine) 298 25 0.2 Swatch Group 71 14 0.1 UBS 1,670 18 0.2 Zurich Financial Services 241 36 0.3 Germany – 2.1%BASF 673 25 0.2 Bayer 517 19 0.2 BMW 532 18 0.2 Deutsche Bank 582 26 0.2 Deutsche Telekom 2,195 19 0.2 E.ON 1,020 19 0.2 Lanxess 579 18 0.2 Linde 244 18 0.2 Siemens 415 26 0.2 Symrise 1,020 16 0.1 Volkswagen Non-Voting Preference 332 22 0.2
Market value Total netInvestment Holding £’000 assets %
Canada – 1.7%BCE 832 16 0.1 Lundin Mining 8,396 21 0.2 Niko Resources 270 18 0.2 Pacific Rubiales Energy 1,056 16 0.1 Quadra FNX Mining 1,670 13 0.1 Research In Motion 492 18 0.2 Talisman Energy 2,401 26 0.2 Teck Resources ‘B’ 867 19 0.2 Telus Corp 570 15 0.1 Telus Non-Voting 150 4 – Toronto-Dominion Bank 390 18 0.2 Western Canadian Coal 4,064 11 0.1 Netherlands – 1.2%Ahold 2,170 18 0.2 CSM 957 18 0.2 KPN 2,089 19 0.2 Philips Electronics 836 16 0.1 Royal Dutch Shell ‘A’ 3,405 60 0.5 Australia – 0.9%BHP Billiton 2,492 58 0.5 Challenger Financial Services Group 2,029 4 – Flight Centre 1,522 16 0.1 MacQuarie Group 983 21 0.2 Seek 3,578 15 0.1 China – 0.9%China Construction Bank ‘H’ 41,000 22 0.2 China Merchants Bank ‘H’ 19,357 33 0.2 CNOOC 22,000 24 0.2 Guangzhou R&F Properties ‘H’ 14,000 14 0.1 Yanzhou Coal Mining ‘H’ 14,000 19 0.2 Hong Kong – 0.8%Cathay Pacific Airways 14,000 20 0.2 Hang Lung Properties 12,000 32 0.2 Orient Overseas International 3,500 18 0.2 Wharf 5,000 18 0.2 Spain – 0.6%Banco Santander 3,371 28 0.2 Industria de Diseno Textil 554 24 0.2 Telefonica 1,959 28 0.2 Italy – 0.5%Intesa Sanpaolo 10,089 22 0.2 Telecom Italia 26,276 17 0.1 Unicredito Italiano 13,636 24 0.2 Mexico – 0.5%America Movil ADR 643 21 0.2 Banco Compartamos 3,356 12 0.1 NII Holdings 800 19 0.2 India – 0.4%ICICI Bank ADR 938 23 0.2 Yes Bank 5,133 21 0.2 South Korea – 0.4%Hyundai Motor 241 19 0.2 Samsung Electronics 56 24 0.2 Sweden – 0.4%Atlas Copco ‘A’ 2,320 24 0.2 Volvo ‘B’ 2,219 18 0.2 Denmark – 0.4%Carlsberg ‘B’ 397 23 0.2 D/S Norden 736 19 0.2 Belgium – 0.3%Bekaert 93 12 0.1 Delhaize Group 318 15 0.1 KBC Groep 517 15 0.1 Norway – 0.3%Acergy 1,668 17 0.1 Telenor 2,004 19 0.2 Taiwan – 0.3%Hon Hai Precision Industry GDR 2,650 15 0.1 Taiwan Semiconductor Manufacturing ADS 2,996 20 0.2 Brazil – 0.2%Petrobras ADS 1,082 25 0.2 Ireland – 0.2%Bank of Ireland 32,191 22 0.2 Singapore – 0.2%Singapore Airlines 3,000 22 0.2

14
ContinuationReturn to Index�
�
Market value Total netInvestment Holding £’000 assets %
Portfolio statement – continuedAs at 31 July 2010
Finland – 0.2%Metso 810 20 0.2 Indonesia – 0.2%Bank Rakyat Indonesia 26,000 18 0.2 Israel – 0.1%Teva Pharmaceutical Industries ADR 532 16 0.1
Fixed interest securities – 20.9% (18.8%)Sterling – 13.8%Treasury 5% 2012 £300,000 320 2.7 Treasury 4.5% 2013 £1,000,000 1,084 9.1 Treasury 8% 2013 £200,000 241 2.0 Australian Dollar – 3.9%Australia 4% 2020 AUD 500,000 465 3.9 Canadian Dollar – 3.2%Canada 5% 2037 CAD 500,000 376 3.2
Convertible bonds – 2.2% (2.8%)Euro – 1.9%KFW 3.25% Convertible 2013 u200,000 175 1.5 Rhodia 0.5% Convertible 2014 u121,200 46 0.4 Swiss Franc – 0.3%Pargesa 1.75% Convertible 2014 CHF 70,000 41 0.3
Forward currency contracts – 1.5% (0.6%)Australian DollarForward foreign currency position
16/09/10 £636,873 637 5.4 Forward foreign currency position
16/09/10 AUD (1,107,865) (637) (5.4)Canadian DollarForward foreign currency position
16/09/10 £244,266 244 2.0 Forward foreign currency position
16/09/10 CAD (371,431) (231) (2.0)Forward foreign currency position
16/09/10 £399,935 400 3.4 Forward foreign currency position
16/09/10 CAD (643,754) (401) (3.4)Danish KronaForward foreign currency position
16/09/10 £15,103 15 0.1 Forward foreign currency position
16/09/10 DKK (135,273) (15) (0.1)EuroForward foreign currency position
16/09/10 £83,611 84 0.7 Forward foreign currency position
16/09/10 u(100,000) (83) (0.7)Forward foreign currency position
16/09/10 £1,345,133 1,345 11.3 Forward foreign currency position
16/09/10 u(1,618,909) (1,352) (11.4)Hong Kong DollarForward foreign currency position
16/09/10 £285,965 286 2.4 Forward foreign currency position
16/09/10 HKD (3,277,684) (271) (2.3)Forward foreign currency position
16/09/10 HKD 1,571,357 130 1.1 Forward foreign currency position
16/09/10 £(133,119) (133) (1.1)Japanese YenForward foreign currency position
16/09/10 ¥11,835,808 88 0.7 Forward foreign currency position
16/09/10 $(136,000) (87) (0.7)Forward foreign currency position
16/09/10 £617,415 617 5.2 Forward foreign currency position
16/09/10 ¥(83,216,540) (618) (5.2)Forward foreign currency position
16/09/10 ¥6,246,102 46 0.4 Forward foreign currency position
16/09/10 £(46,869) (47) (0.4)
Market value Total netInvestment Holding £’000 assets %
Norwegian KroneForward foreign currency position
16/09/10 NOK 5,174,938 541 4.5 Forward foreign currency position
16/09/10 $(820,000) (527) (4.4)Forward foreign currency position
16/09/10 NOK 5,667,125 593 5.0 Forward foreign currency position
16/09/10 ¥(78,787,205) (585) (4.9)Singapore DollarForward foreign currency position
16/09/10 £75,904 76 0.6 Forward foreign currency position
16/09/10 SGD (156,460) (74) (0.6)Swedish KronaForward foreign currency position
16/09/10 £37,553 38 0.3 Forward foreign currency position
16/09/10 SEK (434,805) (38) (0.3)Swiss FrancForward foreign currency position
16/09/10 £405,702 406 3.4 Forward foreign currency position
16/09/10 CHF (682,900) (422) (3.5)US DollarForward foreign currency position
16/09/10 £4,223,095 4,223 35.5 Forward foreign currency position
16/09/10 $(6,250,613) (4,014) (33.7)Forward foreign currency position
16/09/10 $900,568 578 4.9 Forward foreign currency position
16/09/10 £(595,501) (596) (5.0)Forward foreign currency position
16/09/10 $914,825 587 4.9 Forward foreign currency position
16/09/10 u(735,000) (614) (5.2)
Options – 0.5% (0.0%)DJ Euro Stoxx 50 Put Options 2000 Sep 2010 58 2 – DJ Euro Stoxx 50 Put Options 2050 Dec 2010 (120) (33) (0.3)DJ Euro Stoxx 50 Put Options 2350 Dec 2010 120 70 0.6 Hang Seng Call Options 23000 Dec 2010 20 27 0.2
Futures – 0.2% (0.3%)AEX Index Futures Aug 2010 2 – – Australia 3 Year Bond Futures Sep 2010 (26) (1) – Australia 10 Year Bond Futures Sep 2010 (8) (7) (0.1)CAC40 10 Euro Futures Aug 2010 6 1 – Canada 10 Year Bond Futures Sep 2010 (11) (3) – DAX Index Futures Sep 2010 1 5 – DJ Euro Stoxx 50 Index Futures Sep 2010 (34) (8) (0.1)Euro BOBL Futures Sep 2010 16 – – Euro Bund Futures Sep 2010 31 14 0.1 FTSE 100 Index Futures Sep 2010 10 8 0.1 FTSE/MIB Index Futures Sep 2010 2 16 0.1 Hang Seng Index Futures Aug 2010 6 3 – H-Shares Index Futures Aug 2010 3 (1) – Long Gilt Futures Sep 2010 (3) (6) – MSCI Sing Index ETS Futures Aug 2010 (3) (1) – S&P 500 E-Mini Futures Sep 2010 (20) (5) – S&P/TSX 60 Index Futures Sep 2010 (3) – – SPI 200 Futures Sep 2010 (2) 3 – Swiss Market Index Futures Sep 2010 (4) 7 0.1 Topix Index Futures Sep 2010 3 (3) – US 2 Year Note Futures Sep 2010 (22) (14) (0.1)US 10 Year Note Futures Sep 2010 9 16 0.1
Investment assets 9,915 83.3
Net other assets 1,987 16.7
Net assets 11,902 100.0
Unless otherwise stated the above securities are admitted to official stock exchange listings or trade on aregulated market.
The comparative percentage figures in brackets are at 31 January 2010.

15
ContinuationReturn to Index�
�
Portfolio statement – continuedAs at 31 July 2010
Market value Portfolio credit ratings £’000
AAA 2,661BBB 41B+ 46
Total bonds 2,748
Equities 6,888Forward currency contracts 189Options 66Futures 24
Investment assets 9,915

16
ContinuationReturn to Index�
�
£’000
Total of all purchases for the period 3,938
Major purchases Cost
Canada 5% 2037 379DJ Euro Stoxx 50 Put Options 2350 Dec 2010 143Citigroup 67Royal Dutch Shell ‘A’ 61General Electric 48DJ Euro Stoxx 50 Put Options 2700 Jun 2010 34Goldman Sachs Group 34Altria Group 31Macy’s 31S&P 500 Call Options 1160 Apr 2010 30Forest Laboratories 29DJ Euro Stoxx 50 Put Options 2850 May 2010 28Lloyds Banking Group 28DJ Euro Stoxx 50 Put Options 2000 Sep 2010 28Philip Morris International 28Petrofac 27Xerox 27Hang Seng Call Options 23000 Dec 2010 27Sothebys ‘A’ 26Nikon 26
£’000
Total of all sales for the period 3,468
Major sales Proceeds
Procter & Gamble 75DJ Euro Stoxx 50 Put Options 2700 Jun 2010 71HSBC 65S&P 500 Call Options 1160 Apr 2010 55DJ Euro Stoxx 50 Put Options 2850 May 2010 44Michelin 0% Convertible 2017 43Wal-Mart Stores 38Royal Dutch Shell ‘B’ 35Bank of America 32ArcelorMittal 30Zimmer 30Mitsui & Co 30State Street 29Microsoft 29Anheuser-Busch InBev 28Royal Bank of Canada 27Estee Lauder ‘A’ 27Transocean 27Mitsubishi Electric 27Nomura Holdings 26
Portfolio movements For the six months ended 31 July 2010

17
Return to Index�
Financial statements
Statement of total return(Unaudited)
For the six months ended 31 July2010 2009
£’000 £’000 £’000 £’000
Income
Net capital gains 156 522
Revenue 147 156
Expenses (97) (73)
Net revenue before taxation 50 83
Taxation (9) (11)
Net revenue after taxation 41 72
Total return before distributions 197 594
Finance costs: Distributions (115) (125)
Change in net assets attributable to shareholders from investment activities 82 469
Statement of change in net assets attributable to shareholders(Unaudited)
For the six months ended 31 July2010 2009
£’000 £’000 £’000 £’000
Opening net assets attributable to shareholders 11,072 10,056
Amounts receivable on issue of shares 2,974 1,166
Amounts payable on cancellation of shares (2,317) (1,555)
657 (389)
Change in net assets attributable to shareholders from investment activities (see above) 82 469
Retained distributions on accumulation shares 91 87
Stamp duty reserve tax – (1)
Closing net assets attributable to shareholders 11,902 10,222
As the comparatives in the above table are for the previous interim period, the Net assets at the end ofthat period will not agree to the Net assets at the start of the current period.
Balance sheet(Unaudited)
As at31 July 2010 31 January 2010
£’000 £’000 £’000 £’000
ASSETS
Investment assets 10,071 9,156
Debtors 130 138
Cash and bank balances 2,035 2,038
Total other assets 2,165 2,176
Total assets 12,236 11,332
LIABILITIES
Investment liabilities (156) (132)
Creditors (165) (122)
Distribution payable on income shares (13) (6)
Total other liabilities (178) (128)
Total liabilities (334) (260)
Net assets attributable to shareholders 11,902 11,072

18
ContinuationReturn to Index�
�
JPM Cautious Total Return Fund
Investment objective and policyTo achieve over a medium-term horizon higher returns than those availablefrom money market instruments denominated in Sterling by investingprimarily in fixed income securities, convertible bonds, equity securities andshort-term securities of issuers located in any country. The Fund may investin such securities issued by issuers in emerging countries worldwide.Additionally, the Fund may invest up to 100% in cash and cash equivalents.Asset and country allocations may vary over time to reflect market conditionsand opportunities. The Fund may invest up to 100% in government andpublic securities (see section 3.10(e) of the full Prospectus). The Fund mayuse derivatives for investment purposes or Efficient Portfolio Management,including hedging, where appropriate.
Risk profileThis multi-asset Fund invests in bonds, convertible bonds, equities (whichmay include investment in emerging markets and smaller companies),cash and cash equivalents with a bias towards bonds.
Bond prices can fluctuate significantly depending not only on the globaleconomic and interest rate conditions but also on the general credit marketenvironment and the creditworthiness of the issuer.
Equity investment is subject to specific risks relating to the performance ofthe individual companies held and the market’s perception of theirperformance. Equities are also subject to systematic risks such as generaleconomic conditions, inflation, interest rates, foreign exchange rates andindustry sector risks. In general terms, equities tend to be more volatile than bonds.
The investment policy of the Fund permits the use of derivatives and/orforward transactions for investment purposes, potentially increasing thevolatility and therefore risk of the Fund.
Total return funds seek to provide a positive return but this is not guaranteedand they should not be used as a substitute for traditional liquidity funds orcash accounts. As the priority of these funds is to provide positive returns,they will not perform in line with stock markets.
Fund review• The six-month period to the end of July 2010 was a volatile time for markets.
In this environment, the Fund produced a positive return and outperformedits cash benchmark.
• May was a difficult month for the Fund, as we held too much directionalrisk and markets fell heavily, with previously profitable positions such asdividend futures coming under extreme selling pressure. March and Julywere good months for the Fund, as risk assets in general posted stronggains following periods of nervousness in markets.
• Over the review period, the Fund’s equity sensitivity (delta) averagedaround 11% but varied considerably from a high of 31% to a low of closeto 0%. We maintained an allocation of around 30% to convertibles overthe period. Fixed income positions worked well to diversify the portfolioin the correction period in February, with strong contributions from someof our more micro spread positions.
• We closed out all of our currency positions in the May de-risking. However,now that the market appears more orderly, we have re-entered into ourfavoured trades, although in smaller sizes.
You should remember that past performance is not a guide to the future. The price of investments and the income from them may fall as well as rise andinvestors may not get back the full amount invested. For specific risks, please read the Simplified Prospectus.All performance returns are calculated using the quoted price of the accumulation or income shares. Performance returns are in Sterling.FX Adjusted returns have been calculated by JPMAM. Blended benchmarks have been calculated by JPMAM.Source: J.P. Morgan.
Fund outlook• Our outlook remains stable. We do not expect a global double-dip recession,
but continue to anticipate a slow and gradual recovery with both fixedincome and equity markets trading in broad ranges, possibly for manyyears to come. We believe this is an environment in which relative valueand tactical risk exposure will likely produce more attractive risk-adjustedreturns than a buy-and-hold strategy.
Rolling 12 month performance as at 31 July2010/2009 2009/2008 2008/2007 2007/2006 2006/2005
JPM Cautious Total ReturnA-Class Acc 4.1% 0.5% 2.8% 5.1% 5.9%
JPM Cautious Total ReturnC-Class Inc 4.9% 1.2% – – –
JPM Cautious Total ReturnI-Class Acc 4.7% 1.1% 3.5% 5.7% 6.6%
Benchmark Index 0.5% 2.6% 6.0% 5.5% 4.7%
Six month performance31/01/10–31/07/10
JPM Cautious Total Return A-Class Acc 0.8%
Benchmark Index 0.3%
Fund statisticsFund size £759.3m
Benchmark Index 1 Month LIBOR GBP (Gross)
Fund chargesA-Class Initial 4.25%, Annual 1.25%C-Class Initial Nil, Annual 0.65%I-Class Initial Nil, Annual 0.65%
Top ten holdings %United States Treasury 2.375% 2015 7.0European Investment Bank 4.25% 2019 4.6Australia 3% 2025 4.0KFW 3.25% Convertible 2013 4.0Treasury 4.25% 2039 3.0Lloyds Banking Group 4% 2011 2.4Transocean 1.625% Convertible 2037 2.2Amgen 0.125% 2011 2.0Australia 4% 2020 1.9Boston Properties 2.875% Convertible 2037 1.5

19
ContinuationReturn to Index�
�
Sector breakdown %Fixed interest securities 31.4Convertible bonds 25.1Equities 17.6Options 2.0Forward currency contracts 1.2Swaps (0.1)Futures (0.3)Net other assets 23.1
In line with current accounting practice the sector breakdown includes the unrealised profit or loss onderivative holdings and consequently the economic market exposure of the Fund cannot be fully determinedfrom the above disclosure.
Highest/lowest share price and distribution recordHighest Lowest Distribution
Calendar year share price share price per share
A-Class Accumulation Shares
2005 52.74p 49.88p 0.34p
2006 54.77p 52.55p 1.10p
2007 58.73p 54.62p 1.40p
2008 59.58p 52.88p 1.45p
2009 60.07p 54.70p 0.81p
2010A 61.83p 58.68p 0.50p
A-Class Income Shares
2005 52.39p 49.88p 0.34p
2006 53.28p 51.70p 1.08p
2007 55.71p 52.84p 1.33p
2008 55.91p 49.21p 1.37p
2009 54.75p 50.34p 0.74p
2010A 56.21p 53.17p 0.46p
C-Class Income SharesB
2008 102.8p 90.73p 2.09p
2009 100.9p 92.76p 1.87p
2010A 103.7p 98.01p 1.25p
I-Class Accumulation Shares
2005 52.92p 49.89p 0.46p
2006 55.29p 52.85p 1.42p
2007 59.62p 55.15p 2.11p
2008 60.63p 53.94p 1.84p
2009 61.74p 55.94p 1.18p
2010A 63.68p 60.48p 0.82p
I-Class Gross Accumulation SharesC
2007 108.3p 99.90p 2.85p
2008 110.4p 98.57p 4.19p
2009 113.5p 102.5p 2.77p
2010A 117.2p 111.4p 1.83p
I-Class Income Shares
2005 52.43p 49.89p 0.46p
2006 53.32p 51.74p 1.39p
2007 55.77p 53.39p 1.66p
2008 55.96p 49.26p 1.72p
2009 54.80p 50.37p 1.06p
2010A 56.29p 53.20p 0.72p
A To 31 July 2010.B C-Class Income Shares were launched on 26 February 2008.C I-Class Gross Accumulation Shares were launched on 1 February 2007.
Portfolio turnover rate31.07.09 166.80%
31.07.10 73.23%
The portfolio turnover rate (PTR) reflects the total of security purchases and sales, less the total of shareissues and cancellations, expressed as a percentage of the average daily net asset values over the period.
Net asset values and Total expense ratiosNet assetvalue per Net asset Total
share class Number value per expenseDate £’000 of shares share ratio
A-Class Accumulation Shares
31.01.08 245,630 422,553,848 58.13p 1.40%
31.01.09 514,351 921,532,833 55.81p 1.42%
31.01.10 632,628 1,063,250,961 59.50p 1.42%
31.07.10 652,985 1,087,582,573 60.04p 1.43%
A-Class Income Shares
31.01.08 29,975 54,668,065 54.83p 1.41%
31.01.09 54,701 106,497,214 51.36p 1.39%
31.01.10 59,455 109,909,238 54.09p 1.43%
31.07.10 60,220 110,960,703 54.27p 1.43%
C-Class Income Shares
31.01.09 3,360 3,553,780 94.54p 0.77%
31.01.10 1,931 1,938,109 99.62p 0.77%
31.07.10 2,137 2,137,445 99.95p 0.77%
I-Class Accumulation Shares
31.01.08 3,383 5,729,451 59.04p 0.65%
31.01.09 8,301 14,551,847 57.04p 0.65%
31.01.10 13,781 22,522,053 61.19p 0.65%
31.07.10 12,792 20,650,872 61.94p 0.65%
I-Class Gross Accumulation Shares
31.01.08 18,727 17,443,833 107.4p 0.65%
31.01.09 23,486 22,483,966 104.5p 0.65%
31.01.10 22,797 20,253,443 112.6p 0.65%
31.07.10 24,454 21,416,254 114.2p 0.65%
I-Class Income Shares
31.01.08 3,875 7,068,045 54.83p 0.65%
31.01.09 4,748 9,244,378 51.36p 0.65%
31.01.10 5,831 10,780,377 54.09p 0.65%
31.07.10 6,678 12,306,598 54.26p 0.65%
The Net asset value and the Net asset value per income share are shown ex-dividend.
The total expense ratio (TER) takes into account the ACD fee and any fixed expenses charged to revenue overthe financial period, expressed as a percentage of the average daily net asset values over the same period.

20
ContinuationReturn to Index�
�
Market value Total netInvestment Holding £’000 assets %
Portfolio statementAs at 31 July 2010
Fixed interest securities – 31.4% (35.3%)US Dollar – 11.3%Amgen 0.125% 2011 $23,390,000 14,904 2.0Health Care REIT 3% 2029 $10,693,000 7,097 0.9Rayonier TRS Holdings 3.75% 2012 $5,380,000 3,713 0.5United States Treasury 2.375% 2015 $80,000,000 53,269 7.0Verizon Wireless Capital 5.5% 2014 $9,000,000 6,531 0.9Sterling – 8.0%Anglian Water Services Financing ‘A’
5.25% FRN 2015 £300,000 323 –Aviva 5.9021% 2020 £100,000 78 –Barclays Bank 10% 2021 £226,000 289 –Deutsche Telekom International Finance
7.125% 2012 £300,000 328 –Granite Master Issuer B3 FRN 2054 £350,000 259 –HSBC Finance FRN 2011 £300,000 300 –Lloyds Banking Group 4% 2011 £17,500,000 18,103 2.4Nationwide Building Society 3.75% 2011 £10,000,000 10,318 1.4Roche 5.5% 2015 £5,710,000 6,330 0.8Telereal Securitisation B6 FRN 2033 £1,300,000 670 0.1Treasury 4.25% 2039 £23,000,000 22,834 3.0Unilever 4% 2014 £1,120,000 1,188 0.2Windermere VIII A3 FRN 2015 £889,653 676 0.1Euro – 6.2%EDF 5.125% 2015 u2,100,000 1,948 0.3European Investment Bank 4.25% 2019 u38,000,000 34,886 4.6Magyar Nemzeti Vagyonkezelo 4.4% 2014 u4,300,000 3,484 0.5Rabobank Nederland 4.375% 2016 u3,498,000 3,141 0.4Sanofi-Aventis 3.5% 2013 u660,000 574 0.1Telefonica Emisiones 5.431% 2014 u2,100,000 1,890 0.3Australian Dollar – 5.9%Australia 4% 2020 AUD 15,200,000 14,123 1.9Australia 3% 2025 AUD 49,807,000 30,331 4.0
Convertible bonds – 25.1% (29.5%)US Dollar – 17.9%Boston Properties 3.625% Convertible 2014 $2,476,000 1,629 0.2Boston Properties 3.75% Convertible 2036 $11,240,000 7,766 1.0Boston Properties 2.875% Convertible 2037 $17,347,000 11,067 1.5Carnival Corp 2% Convertible 2021 $12,550,000 8,601 1.1Cherating Capital FRN Convertible 2012 $6,000,000 4,401 0.6Citigroup 7.5% Convertible Preference 2012 $30,654 2,395 0.3First Quantum Minerals 6% Convertible 2014 $2,300,000 2,010 0.3Gilead Sciences 0.625% Convertible 2013 $8,850,000 6,115 0.8Health Care REIT 4.75% Convertible 2013 $1,170,000 815 0.1Liberty Media FRN Convertible 2023 $10,713,000 7,548 1.0Life Technologies 1.5% Convertible 2024 $5,000,000 3,451 0.5Life Technologies 3.25% Convertible 2025 $7,310,000 4,963 0.7Medtronic 1.5% Convertible 2011 $5,770,000 3,695 0.5Nasdaq OMX 2.50% Convertible 2013 $6,120,000 3,796 0.5Prologis 3.25% Convertible 2015 $6,181,000 3,834 0.5Shire 2.75% Convertible 2014 $11,400,000 7,273 1.0Swiss Re FRN Convertible 2021 $9,140,000 5,563 0.7Symantec 1% Convertible 2013 $6,562,000 4,260 0.6Technology Data 2.75% Convertible 2026 $5,506,000 3,597 0.5Teva Pharmaceutical Finance 1.75%
Convertible 2026 $9,230,000 6,548 0.9Transocean 1.5% Convertible 2037 $7,200,000 4,270 0.6Transocean 1.625% Convertible 2037 $26,200,000 16,589 2.2Vornado Realty 3.875% Convertible 2025 $8,645,000 6,237 0.8Wells Fargo ‘A’ 7.5% Convertible Perpetual $12,408 7,767 1.0Euro – 6.0%AXA 2.5% Convertible 2014 u1,710,800 3,099 0.4KFW 3.25% Convertible 2013 u34,400,000 30,097 4.0KFW 1.5% Convertible 2014 u1,600,000 1,580 0.2Portugal Telecom International Finance
4.125% Convertible 2014 u7,000,000 5,873 0.8Rhodia 0.5% Convertible 2014 u12,256,800 4,696 0.6Swiss Franc – 0.7%Pargesa 1.7% Convertible 2013 CHF 8,535,000 5,114 0.7Singapore Dollar – 0.5%Capitaland 2.875% Convertible 2016 SGD 7,750,000 3,794 0.5
Market value Total netInvestment Holding £’000 assets %
Equities – 17.6% (17.8%)United States of America – 8.8%Abbott Laboratories 145,917 4,586 0.6Apple 22,127 3,667 0.5Celgene 70,996 2,446 0.3Coca-Cola 223,573 7,893 1.0Freeport-McMoRan Copper & Gold 89,334 4,056 0.5Hewlett Packard 234,547 6,982 0.9IBM 43,387 3,564 0.5McDonald’s 75,921 3,382 0.4Microsoft 236,905 3,959 0.5Newmont Mining 194,903 6,972 0.9Norfolk Southern 201,862 7,248 1.0The Mosaic Company 56,613 1,729 0.2Union Pacific 155,906 7,440 1.0Walt Disney 161,102 3,486 0.5United Kingdom – 2.8%3i Infrastructure 3,717,663 4,160 0.5BG Group 258,005 2,617 0.3British American Tobacco 188,548 4,175 0.5Reckitt Benckiser Group 118,331 3,705 0.5Unilever 208,142 3,790 0.5Vodafone Group 2,763,242 4,138 0.5China – 1.1%China Life Insurance ‘H’ 1,854,000 5,279 0.7China Shenhua Energy ‘H’ 1,180,000 2,916 0.4France – 0.8%Sanofi-Aventis 92,048 3,407 0.4TOTAL S.A. 96,600 3,144 0.4Brazil – 0.8%Vale ADR Preference 372,846 5,771 0.8Luxembourg – 0.7%ArcelorMittal 272,223 5,306 0.7Taiwan – 0.7%Hon Hai Precision Industry 1,157,000 2,995 0.4MediaTek 257,197 2,235 0.3Japan – 0.6%Daikin Industries 63,000 1,497 0.2Nidec 48,100 2,896 0.4Hong Kong – 0.5%Esprit 122,884 3,909 0.5Switzerland – 0.5%Nestle 987,400 3,942 0.5Singapore – 0.3%Wilmar International 832,000 2,455 0.3
Options – 2.0% (0.0%)DJ Euro Stoxx 50 Call Options 2850 Aug 2010 7,000 982 0.1DJ Euro Stoxx 50 Put Options 2350 Aug 2010 (2,216) (68) –DJ Euro Stoxx 50 Put Options 2650 Aug 2010 2,500 670 0.1Hang Seng Call Options 21400 Sep 2010 629 1,105 0.1Hang Seng Call Options 23000 Dec 2010 1,732 2,326 0.3Imm Euro¢ Put Options Sep 2010 (2,289) (28) –US 10 Year Future Call Options 125 Aug 2010 16,532 3,317 0.4US 10 Year Future Call Options 127 Aug 2010 (1,121) (62) –VIX Index Put Options Aug 2010 (20,200) (778) (0.1)VIX Index Put Options Aug 2010 51,760 5,815 0.8VIX Index Put Options Sep 2010 21,874 1,966 0.3
Forward currency contracts – 1.2% ((0.3)%)Australian DollarForward foreign currency position
23/08/10 £46,923,254 46,923 6.2Forward foreign currency position
23/08/10 AUD (82,912,123) (47,788) (6.3)Canadian DollarForward foreign currency position
23/08/10 £1,912,269 1,912 0.3Forward foreign currency position
23/08/10 CAD (3,070,968) (1,911) (0.3)

21
ContinuationReturn to Index�
�
Portfolio statement – continuedAs at 31 July 2010
Market value Total netInvestment Holding £’000 assets %
EuroForward foreign currency position
23/08/10 £156,712,009 156,712 20.6Forward foreign currency position
23/08/10 u(184,752,877) (154,235) (20.3)Forward foreign currency position
23/08/10 u9,000,000 7,513 1.0Forward foreign currency position
23/08/10 £(7,649,100) (7,649) (1.0)Japanese YenForward foreign currency position
23/08/10 £43,491,432 43,491 5.7Forward foreign currency position
23/08/10 ¥(5,836,293,534) (43,345) (5.7)Norwegian KroneForward foreign currency position
23/08/10 NOK 375,349,862 39,322 5.2Forward foreign currency position
23/08/10 £(39,033,490) (39,033) (5.1)Forward foreign currency position
23/08/10 NOK 344,730,722 36,115 4.8Forward foreign currency position
23/08/10 $(54,691,382) (35,115) (4.6)Singapore DollarForward foreign currency position
23/08/10 £6,346,252 6,346 0.8Forward foreign currency position
23/08/10 SGD (13,349,849) (6,294) (0.8)Swiss FrancForward foreign currency position
23/08/10 £8,371,546 8,372 1.1Forward foreign currency position
23/08/10 CHF (13,448,721) (8,310) (1.1)US DollarForward foreign currency position
23/08/10 £294,048,973 294,049 38.7Forward foreign currency position
23/08/10 $(449,150,263) (288,380) (38.0)Forward foreign currency position
23/08/10 $19,459,718 12,494 1.7Forward foreign currency position
23/08/10 £(12,553,044) (12,553) (1.7)
Swaps – (0.1)% (0.1%)Credit Default Swaps iTraxx Receive
20 Jun 2015 u80,000,000 60 –Goldman Sachs Interest Rate Swaps
Pay 3.02% 16 Jun 2015 CAD (62,400,000) (1,099) (0.1)Goldman Sachs Interest Rate Swaps
Receive 0.038% 16 Jun 2020 CAD 34,400,000 837 0.1Merrill Lynch Interest Rate Swaps
Pay 0.02705% 8 Jul 2015 CAD (62,400,000) (468) (0.1)Merrill Lynch Interest Rate Swaps
Receive 0.035325% 8 Jul 2020 CAD 34,400,000 332 –
Futures – (0.3)% (1.0%)Australia 3 Year Bond Futures Sep 2010 (1,229) (47) –Australia 10 Year Bond Futures Sep 2010 (603) (498) (0.1)DAX Index Futures Sep 2010 233 (142) –DJ Euro Stoxx 50 Futures Dec 2011 3,797 (1,293) (0.2)Euro BOBL Futures Sep 2010 356 10 –Euro Bund Futures Sep 2010 (1,870) 1,344 0.2Long Gilt Futures Sep 2010 614 313 –S&P 500 E-Mini Futures Sep 2010 (4,054) 332 –SGX S&P CNX Futures Aug 2010 (5,007) 497 0.1US 2 Year Note Futures Sep 2010 (1,678) (1,103) (0.2)US 10 Year Note Futures Sep 2010 (627) (1,091) (0.1)
Investment assets 583,642 76.9
Net other assets 175,624 23.1
Net assets 759,266 100.0
Unless otherwise stated the above securities are admitted to official stock exchange listings or trade on aregulated market.
The comparative percentage figures in brackets are at 31 January 2010.
Market value Portfolio credit ratings £’000
AAA 216,476AA+ 3,141AA- 300A+ 7,405A 12,861A- 28,967BBB+ 25,436BBB 63,647BBB- 24,276BB+ 18,637BB 3,834BB- 7,548B+ 4,696B 2,010C 6,796
Total bonds 426,030
Equities 135,747Options 15,245Forward currency contracts 8,636Swaps (338)Futures (1,678)
Investment assets 583,642
22
ContinuationReturn to Index�
�
£’000
Total of all purchases for the period 429,879
Major purchases Cost
United States Treasury 2.375% 2015 52,639Treasury 4.25% 2039 23,384Australia 4% 2020 14,041Union Pacific 12,111Norfolk Southern 11,559DJ Euro Stoxx 50 Call Options 2750 Mar 2010 10,349Vornado Realty 3.875% Convertible 2025 10,189DJ Euro Stoxx 50 Put Options 2600 Jun 2010 10,080Coca-Cola 7,853Network Appliance 1.75% 2013 7,810Teva Pharmaceutical Finance 1.75% Convertible 2026 7,795DJ Euro Stoxx 50 Call Options 2800 Mar 2010 7,496Boston Properties 3.75% Convertible 2036 7,426Health Care REIT 3% 2029 7,307EMC 1.75% Convertible 2011 6,703Cherating Capital FRN Convertible 2012 5,879Vale ADR Preference 5,845DJ Euro Stoxx 50 Put Options 2500 Jul 2010 5,278DJ Euro Stoxx 50 Call Options 2700 Mar 2010 5,051VIX Index Put Options Aug 2010 4,953
£’000
Total of all sales for the period 489,281
Major sales Proceeds
Ireland 3.9% 2012 51,734Greece 4.3% 2012 23,841Ireland 5.4% 2025 21,605Medtronic 1.5% Convertible 2011 20,131Royal Bank of Scotland 4.125% 2011 17,765EMC 1.75% Convertible 2011 16,102DJ Euro Stoxx 50 Put Options 2700 Feb 2010 13,201News Corp Financial Trust II 0.75% Convertible 2023 12,898Network Appliance 1.75% 2013 9,551DJ Euro Stoxx 50 Put Options 2600 Jun 2010 8,387Norfolk Southern 8,068Union Pacific 8,053VIX Index Put Options Apr 2010 7,861KFW 3.25% Convertible 2013 7,362Health Care REIT 4.75% Convertible 2026 7,042DJ Euro Stoxx 50 Put Options 2700 Jun 2010 6,876Freeport-McMoRan Copper & Gold 6,835Nabors Industries 0.94% Convertible 2011 6,767US 10 Year Future Call Option 121 Jul 2010 5,773Paka Capital 0% Convertible 2013 5,716
Portfolio movements For the six months ended 31 July 2010

23
Return to Index�
Financial statements
Statement of total return(Unaudited)
For the six months ended 31 July2010 2009
£’000 £’000 £’000 £’000
Income
Net capital gains 1,778 17,443
Revenue 11,103 10,496
Expenses (5,250) (4,490)
Net revenue before taxation 5,853 6,006
Taxation (160) (93)
Net revenue after taxation 5,693 5,913
Total return before distributions 7,471 23,356
Finance costs: Distributions (5,690) (5,826)
Change in net assets attributable to shareholders from investment activities 1,781 17,530
Statement of change in net assets attributable to shareholders(Unaudited)
For the six months ended 31 July2010 2009
£’000 £’000 £’000 £’000
Opening net assets attributable to shareholders 736,423 608,947
Amounts receivable on issue of shares 73,276 104,464
Amounts payable on cancellation of shares (56,386) (28,428)
16,890 76,036
Change in net assets attributable to shareholders from investment activities (see above) 1,781 17,530
Retained distributions on accumulation shares 4,221 4,240
Stamp duty reserve tax (49) (9)
Closing net assets attributable to shareholders 759,266 706,744
As the comparatives in the above table are for the previous interim period, the Net assets at the end ofthat period will not agree to the Net assets at the start of the current period.
Balance sheet(Unaudited)
As at31 July 2010 31 January 2010
£’000 £’000 £’000 £’000
ASSETS
Investment assets 591,379 629,878
Debtors 10,938 9,295
Cash and bank balances 170,613 118,077
Total other assets 181,551 127,372
Total assets 772,930 757,250
LIABILITIES
Investment liabilities (7,737) (15,653)
Creditors (5,746) (4,989)
Distribution payable on income shares (181) (185)
Total other liabilities (5,927) (5,174)
Total liabilities (13,664) (20,827)
Net assets attributable to shareholders 759,266 736,423

24
ContinuationReturn to Index�
�
JPM Emerging Markets Fund
Investment objective and policyTo provide long term capital growth by investing primarily in equity andequity-linked securities of emerging markets companies. Other instrumentsas permitted in the stated investment and borrowing powers of the Companyincluding, but not limited to, fixed interest securities, cash and cash equivalentsmay be held on an ancillary basis, as appropriate.
Risk profileThis equity based Fund is designed for investors looking for exposure toemerging markets which may include smaller company investments.
Equity investment is subject to specific risks relating to the performance ofthe individual companies held and the market’s perception of their performance.Equities are also subject to systematic risks such as general economic conditions,inflation, interest rates, foreign exchange rates and industry sector risks. Ingeneral terms, equities tend to be more volatile than bonds.
The Fund invests in emerging markets, which may be subject to additionalpolitical and economic risks, low liquidity, poor transparency and greaterfinancial risks.
The underlying assets of the Fund are denominated in currencies other thanSterling and are not hedged back to Sterling. Investors will therefore beexposed to the currency risk of fluctuations between Sterling and the currencydenomination of the underlying assets.
Fund review• Emerging markets have produced modest returns so far this year in
comparison to their strong growth in 2009. The period saw significantvolatility as investors had already discounted much of the short-termrecovery in earnings and then had to contend with rising inflation andinterest rates, concerns over the Chinese economy overheating, and fearsof credit default in the periphery of Europe.
• There was a significant discrepancy in performance by region as Asia hitdouble figures while eastern Europe fell into negative territory. Brazilunderperformed Latin America as fears over Chinese and global growthaffected markets. In EMEA, Poland and Hungary were particularly badlyhit as nervousness over the European debt crisis spread to the region.
• The Fund outperformed its benchmark during the period. Stock selectionin China, Indonesia and Russia was positive for performance. Underweightpositions in Taiwan and Russia and an overweight in Mexico also contributedto returns while stock selection in Brazil and Taiwan detracted. Investmentsin Argentina and an underweight in Thailand also had a negative impacton performance.
Fund outlook• We continue to believe in a half-speed developed market recovery giving
way to a half-speed expansion. While not expecting a relapse in the globalcycle, we note that emerging markets retain far greater policy flexibilitythan developed markets. This is most evident in fiscal terms but alsoapplies to monetary policy as many emerging market central banks havestarted to raise rates, albeit not aggressively, and so may cut again ifneeded.
You should remember that past performance is not a guide to the future. The price of investments and the income from them may fall as well as rise andinvestors may not get back the full amount invested. For specific risks, please read the Simplified Prospectus.All performance returns are calculated using the quoted price of the accumulation shares. Performance returns are in Sterling.FX Adjusted returns have been calculated by JPMAM. Blended benchmarks have been calculated by JPMAM.Source: J.P. Morgan.Benchmark Source: MSCI. Neither MSCI nor any other party involved in or related to compiling, computing or creating the MSCI data makes any express of implied warranties or representations with respect to such data(or the results to be obtained by the use thereof), and all such parties hereby expressly disclaim all warranties of originality, accuracy, completeness, merchantability or fitness for a particular purpose with respect toany of such data. Without limiting any of the foregoing, in no event shall MSCI, any of its affiliates or any third party involved in or related to compiling computing or creating the data have any liability for any direct,indirect, special, punitive, consequential or any other damages (including lost profits) even if notified of the possibility of such damages. No further distribution or dissemination of the MSCI data is permitted withoutMSCI’s express written consent.
• With the strong boost to industrial production from inventory restockingnow waning, we are more confident in being underweight cyclical stocks.Any moderation in global growth will naturally feed through to earningsexpectations in both emerging markets and developed markets.
Rolling 12 month performance as at 31 July2010/2009 2009/2008 2008/2007 2007/2006 2006/2005
JPM Emerging MarketsA-Class Acc 27.0% 0.1% -0.4% 35.9% 23.0%
JPM Emerging Markets B-Class Acc 27.7% – – – –
JPM Emerging MarketsI-Class Acc 27.8% 0.8% 0.2% 36.7% 23.8%
Benchmark Index 27.0% -0.6% -1.9% 38.3% 21.1%
Six month performance31/01/10–31/07/10
JPM Emerging Markets A-Class Acc 11.8%
Benchmark Index 10.2%
Fund statisticsFund size £818.1m
Benchmark Index MSCI Emerging Markets (Total Return Net)
Fund chargesA-Class Initial 4.25%, Annual 1.50%B-Class Initial Nil, Annual 1.00%I-Class Initial Nil, Annual 1.00%
Top ten holdings %Petrobras ADR Preference 4.1Housing Development Finance 4.0Vale ADR Preference 4.0China Merchants Bank ‘H’ 3.1Turkiye Garanti Bankasi 3.0Samsung Electronics 3.0Taiwan Semiconductor Manufacturing 2.8Infosys Technologies 2.7Banco Itau Non-Cum Preference 2.5Sberbank of Russia 2.4

25
ContinuationReturn to Index�
�
Geographical breakdown %Brazil 16.2China 12.7India 12.1South Korea 9.9Hong Kong 8.2South Africa 7.4Mexico 5.9Taiwan 5.6Russia 4.1Indonesia 3.2Turkey 3.0Chile 1.5Egypt 1.4Argentina 1.3Sweden 1.1Hungary 1.0Malaysia 0.6Net other assets 4.8
Highest/lowest share price and distribution recordDistribution
Highest Lowest per shareCalendar year share price share price (net)
A-Class Accumulation Shares
2005 82.98p 51.63p 0.37p
2006 98.32p 73.14p 0.42p
2007 133.7p 94.19p 0.26p
2008 134.4p 67.49p 0.35p
2009 136.3p 76.63p 0.78p
2010A 154.5p 127.1p 0.37p
A-Class Income SharesB
2007 59.71p 49.14p –
2008 59.96p 30.12p 0.04p
2009 60.17p 33.85p 0.35p
2010A 67.94p 56.09p 0.19p
B-Class Accumulation SharesC
2008 114.9p 100.0p –
2009 179.4p 100.4p 0.21p
2010A 203.5p 167.3p 1.25p
I-Class Accumulation Shares
2005 301.6p 186.5p 2.43p
2006 359.5p 266.6p 3.04p
2007 491.8p 344.4p 3.00p
2008 495.2p 249.4p 3.56p
2009 507.7p 283.6p 5.15p
2010A 576.3p 473.6p 4.17p
A To 31 July 2010.B A-Class Income Shares were launched on 1 September 2007.C B-Class Accumulation Shares were launched on 3 December 2008.
Portfolio turnover rate31.07.09 (1.68%)
31.07.10 10.08%
The portfolio turnover rate (PTR) reflects the total of security purchases and sales, less the total of shareissues and cancellations, expressed as a percentage of the average daily net asset values over the period.
Net asset values and Total expense ratiosNet assetvalue per Net asset Total
share class Number value per expenseDate £’000 of shares share ratio
A-Class Accumulation Shares
31.01.08 265,125 226,732,062 116.9p 1.70%
31.01.09 236,115 280,194,314 84.27p 1.67%
31.01.10 435,085 340,501,356 127.8p 1.67%
31.07.10 522,436 365,538,418 142.9p 1.68%
A-Class Income Shares
31.01.08D 284 545,135 52.18p 1.68%
31.01.09D 514 1,380,730 37.24p 1.67%
31.01.10D 4,938 8,785,925 56.20p 1.66%
31.07.10 6,712 10,677,192 62.86p 1.68%
B-Class Accumulation Shares
31.01.09 625 566,900 110.3p 1.15%
31.01.10 1,929 1,146,736 168.2p 1.15%
31.07.10 2,433 1,289,995 188.6p 1.15%
I-Class Accumulation Shares
31.01.08 147,120 34,191,103 430.3p 1.00%
31.01.09 119,908 38,438,851 311.9p 1.00%
31.01.10 241,402 50,701,924 476.1p 1.00%
31.07.10 286,554 53,625,622 534.4p 1.00%
D The Net asset value and the Net asset value per income share are shown ex-dividend at the financial year end.
The total expense ratio (TER) takes into account the ACD fee and any fixed expenses charged to revenue overthe financial period, expressed as a percentage of the average daily net asset values over the same period.

26
ContinuationReturn to Index�
�
Portfolio statementAs at 31 July 2010
Market value Total netInvestment Holding £’000 assets %
Brazil – 16.2% (19.4%)All America Latina Logistica 1,314,427 7,724 0.9Banco Itau Non-Cum Preference 1,416,302 20,316 2.5Cielo 1,679,034 9,444 1.1Companhia de Bebidas das Americas
ADR Preference 198,019 13,881 1.7Itau Unibanco Multiplo ADR Preference 60,200 862 0.1OGX Petroleo e Gas Participacoes 2,180,300 14,683 1.8Petrobras ADR Preference 1,673,046 33,769 4.1Vale ADR Preference 2,093,256 32,400 4.0
China – 12.7% (8.9%)Anhui Conch Cement ‘H’ 4,734,000 10,624 1.3China Construction Bank ‘H’ 14,646,000 7,966 1.0China Merchants Bank ‘H’ 14,875,150 25,452 3.1China National Building Material ‘H’ 4,664,000 5,652 0.7CNOOC 14,461,000 15,587 1.9New Oriental Education & Technology ADR 162,958 9,995 1.2Ping An Insurance ‘H’A 2,850,500 15,162 1.8Tsingtao Brewery ‘H’ 3,166,000 9,657 1.2Wumart Stores 2,725,000 3,825 0.5
India – 12.1% (11.6%)ACC 564,466 6,484 0.8Ambuja Cements 1,492,459 2,430 0.3Bharti Airtel 3,043,126 12,907 1.6Housing Development Finance 791,720 32,618 4.0Infosys Technologies 293,269 11,305 1.4Infosys Technologies ADR 273,687 10,599 1.3Jindal Steel & Power 786,100 6,764 0.8Reliance Capital 684,047 7,410 0.9United Spirits 439,500 8,415 1.0
South Korea – 9.9% (10.6%)Hyundai Mobis 119,070 13,164 1.6Hyundai Motor 159,509 12,806 1.6KT&G 257,769 8,278 1.0POSCO 36,117 9,607 1.2Samsung Electronics 56,711 24,834 3.0Shinsegae 39,513 12,091 1.5
Hong Kong – 8.2% (8.4%)China Mobile 2,411,000 15,684 1.9China Resources Enterprise 3,898,000 9,457 1.2Esprit 2,205,975 8,807 1.1Hang Lung Properties 3,408,000 9,071 1.1Li & Fung 5,626,000 16,556 2.0Tencent 609,600 7,538 0.9
South Africa – 7.4% (9.3%)African Bank Investments 3,109,041 9,030 1.1FirstRand 2,598,406 4,542 0.6Impala Platinum 872,310 14,956 1.8Massmart 1,043,156 11,741 1.4MTN Group 1,537,612 15,377 1.9RMB 1,538,644 4,569 0.6
Mexico – 5.9% (6.8%)America Movil ADR 318,357 10,280 1.3Cemex ADR 521,983 3,106 0.4Grupo Financiero Banorte ‘O’ 4,265,872 10,640 1.3NII Holdings 388,716 9,406 1.1Wal-Mart de Mexico ‘V’ 9,790,020 14,901 1.8
Market value Total netInvestment Holding £’000 assets %
Taiwan – 5.6% (5.8%)Acer 4,137,133 7,115 0.9Hon Hai Precision Industry 5,928,224 15,347 1.9Taiwan Semiconductor Manufacturing 3,979,480 4,967 0.6Taiwan Semiconductor Manufacturing ADS 2,769,854 18,102 2.2
Russia – 4.1% (5.6%)Magnit 40,500 2,549 0.3Magnit GDR 824,900 11,116 1.4Sberbank of Russia 10,857,995 19,419 2.4
Indonesia – 3.2% (1.6%)Astra International 3,341,500 12,116 1.5Bank Rakyat Indonesia 12,832,347 8,975 1.1Unilever Indonesia 4,118,100 5,007 0.6
Turkey – 3.0% (3.1%)Turkiye Garanti Bankasi 7,473,960 24,905 3.0
Chile – 1.5% (1.1%)Banco Santander Chile ADR 222,483 11,919 1.5
Egypt – 1.4% (1.8%)Orascom Constructions Industry 259,167 6,918 0.8Orascom Telecom 5,942,308 3,454 0.4Orascom Telecom GDR 577,497 1,713 0.2
Argentina – 1.3% (1.0%)Tenaris ADR 411,355 10,614 1.3
Sweden – 1.1% (0.0%)Oriflame Cosmetics SDR 233,997 8,906 1.1
Hungary – 1.0% (0.0%)OTP Bank 542,400 8,274 1.0
Malaysia – 0.6% (0.6%)British American Tobacco Malaysia 566,000 5,054 0.6
Investment assets 778,842 95.2
Net other assets 39,293 4.8
Net assets 818,135 100.0
Unless otherwise stated the above securities are admitted to official stock exchange listings or trade on aregulated market.
The comparative percentage figures in brackets are at 31 January 2010.A Unquoted security

27
ContinuationReturn to Index�
�
£’000
Total of all purchases for the period 109,105
Major purchases Cost
CNOOC 16,515OTP Bank 10,157Acer 8,205Oriflame Cosmetics SDR 8,199China Construction Bank ‘H’ 8,059Hang Lung Properties 7,805Astra International 6,108Tenaris ADR 4,449Housing Development Finance 4,441Teva Pharmaceutical Industries ADR 3,345Tsingtao Brewery ‘H’ 2,069Turkiye Garanti Bankasi 1,768Magnit GDR 1,712Ping An Insurance ‘H’ 1,685China Merchants Bank ‘H’ 1,481OGX Petroleo e Gas Participacoes 1,387Impala Platinum 1,382Petrobras ADR Preference 1,291Massmart 1,251Banco Santander Chile ADR 1,244
£’000
Total of all sales for the period 72,499
Major sales Proceeds
Sasol 16,252BM&F Bovespa Sa Bolsa de Valores 7,777Teva Pharmaceutical Industries ADR 7,771Grupo Financiero Banorte ‘O’ 7,724Sberbank 6,996Vale ADR Preference 6,155Vimpel-Communications ADR 4,413GOME Electrical Appliances 4,382Anadolou Efes 3,946Yue Yuen Industrial 3,682DP World 3,401
Portfolio movements For the six months ended 31 July 2010

28
Return to Index�
Financial statements
Statement of total return(Unaudited)
For the six months ended 31 July2010 2009
£’000 £’000 £’000 £’000
Income
Net capital gains 79,949 123,259
Revenue 8,493 6,146
Expenses (5,634) (3,104)
Net revenue before taxation 2,859 3,042
Taxation (572) (334)
Net revenue after taxation 2,287 2,708
Total return before distributions 82,236 125,967
Finance costs: Distributions 57 24
Change in net assets attributable to shareholders from investment activities 82,293 125,991
Statement of change in net assets attributable to shareholders(Unaudited)
For the six months ended 31 July2010 2009
£’000 £’000 £’000 £’000
Opening net assets attributable to shareholders 683,354 357,162
Amounts receivable on issue of shares 80,957 61,692
Amounts payable on cancellation of shares (28,469) (21,713)
52,488 39,979
Change in net assets attributable to shareholders from investment activities (see above) 82,293 125,991
Closing net assets attributable to shareholders 818,135 523,132
As the comparatives in the above table are for the previous interim period, the Net assets at the end ofthat period will not agree to the Net assets at the start of the current period.
Balance sheet(Unaudited)
As at31 July 2010 31 January 2010
£’000 £’000 £’000 £’000
ASSETS
Investment assets 778,842 662,978
Debtors 3,174 13,161
Cash and bank balances 37,173 36,300
Total other assets 40,347 49,461
Total assets 819,189 712,439
LIABILITIES
Creditors (1,054) (29,056)
Bank overdraft – (12)
Distribution payable on income shares – (17)
Total liabilities (1,054) (29,085)
Net assets attributable to shareholders 818,135 683,354

29
JPM Emerging Markets Infrastructure Fund
Investment objective and policyTo achieve long-term capital growth by investing primarily in emergingmarkets companies related to infrastructure opportunities. Investments mayinclude, but are not limited to, companies found in the capital goods,transportation, telecommunication services, utilities, energy, materials andreal estate sectors. Issuers of these securities may be located in any countryand the Fund may invest significantly in emerging markets and smallercompanies (see sections 11.5 and 11.10 of the full Prospectus – Risk Warnings).Derivatives may be used for the purpose of efficient portfolio management,including hedging, where appropriate (see section 11.14 of the full Prospectusfor Risk Warnings on derivatives). Subject to at least 60 days notice toshareholders, the Fund may use derivatives for investment purposes. TheFund may hold non-equity investments from time to time, as appropriate.
Risk profileThis equity based Fund is designed for investors looking for enhanced long-term capital growth, but who are comfortable with the additional economic,currency and political risks associated with emerging market and smallercompany investments. The Fund may take significant positions at the stockselection, sector and country allocation levels via a relatively concentratedportfolio, with the result that the Fund’s volatility may be high.
Equity investment is subject to specific risks relating to the performance ofthe individual companies held and the market’s perception of theirperformance. Equities are also subject to systematic risks such as generaleconomic conditions, inflation, interest rates, foreign exchange rates andindustry sector risks. In general terms, equities tend to be more volatile than bonds.
The Fund invests in emerging markets, which may be subject to additionalpolitical and economic risks, low liquidity, poor transparency and greaterfinancial risks.
Smaller companies’ securities may be less liquid than the securities of largercompanies as a result of inadequate trading volume or restrictions on trading.Smaller companies may possess greater potential for growth, but can alsoinvolve greater risks, such as limited product lines and markets, and financialor managerial resources. Trading in such securities may be subject to moreabrupt price movements and greater fluctuations in available liquidity thantrading in the securities of larger companies.
The underlying assets of the Fund are denominated in currencies other thanSterling and are not hedged back to Sterling. Investors will therefore beexposed to the currency risk of fluctuations between Sterling and the currencydenomination of the underlying assets.
Fund review• Emerging markets have produced modest returns so far this year in
comparison to their strong growth in 2009. The period saw significantvolatility as investors had already discounted much of the short-termrecovery in earnings and then had to contend with rising inflation andinterest rates, concerns over the Chinese economy overheating, and fearsof credit default in the periphery of Europe.
You should remember that past performance is not a guide to the future. The price of investments and the income from them may fall as well as rise andinvestors may not get back the full amount invested. For specific risks, please read the Simplified Prospectus.All performance returns are calculated using the quoted price of the accumulation shares. Performance returns are in Sterling.FX Adjusted returns have been calculated by JPMAM. Blended benchmarks have been calculated by JPMAM.Source: J.P. Morgan.Performance fee is 10% when the Fund return exceeds the benchmark return. Please refer to the Fund’s Prospectus for conditions on the application of the performance fees.A Benchmark for this Fund is customised by Morgan Stanley Capital International (MSCI), limited to seven sectors: Energy, Materials (excluding Fertilizers & Agricultural Chemicals, Metal & Glass Containers, Paper Packaging,
and Gold), Capital Goods (excluding Trading Companies & Distributors), Transportation, Real Estate (excluding Residential REITs and Retail REITs), Telecommunication Services and Utilities.Benchmark Source: MSCI. Neither MSCI nor any other party involved in or related to compiling, computing or creating the MSCI data makes any express of implied warranties or representations with respect to such data(or the results to be obtained by the use thereof), and all such parties hereby expressly disclaim all warranties of originality, accuracy, completeness, merchantability or fitness for a particular purpose with respect toany of such data. Without limiting any of the foregoing, in no event shall MSCI, any of its affiliates or any third party involved in or related to compiling computing or creating the data have any liability for any direct,indirect, special, punitive, consequential or any other damages (including lost profits) even if notified of the possibility of such damages. No further distribution or dissemination of the MSCI data is permitted withoutMSCI’s express written consent.
• There was a significant discrepancy in performance by region as Asia hitdouble figures while eastern Europe touched negative territory. Brazilunderperformed the wider Latin America region as fears over Chineseand global growth affected markets. In EMEA, Poland and Hungary wereparticularly badly hit as nervousness over the European debt crisis spread.
• The Fund outperformed its benchmark over the period. Stock selection inIndia was one of the greatest contributors to returns and the Fund alsobenefited from investment ideas in Brazil, Turkey and Korea. Stock selectionin China and Mexico detracted as did an underweight in South Africa.
Fund outlook• We continue to believe in a half-speed developed market recovery giving
way to a half-speed expansion. While not expecting a relapse in the globalcycle, we note that emerging markets retain far greater policy flexibilitythan developed markets. This is most evident in fiscal terms but also inmonetary policy given that most emerging market central banks havestarted to raise rates, albeit not aggressively, and so may cut again ifneeded. Any moderation in global growth will naturally feed through toearnings expectations in both emerging markets and developed markets.However, with valuations looking attractive again markets will be able toabsorb some moderation in consensus EPS growth.
Rolling 12 month performance as at 31 July2010/2009
JPM Emerging Markets InfrastructureA-Class Acc 25.3%
Benchmark IndexA 22.4%
Six month performance31/01/10–31/07/10
JPM Emerging Markets Infrastructure A-Class Acc 7.7%
Benchmark IndexA 7.3%
Fund statisticsFund size £12.7m
Benchmark IndexA MSCI Customised Emerging MarketsInfrastructure Index (Total Return Net)
Fund charges Initial 4.25%, Annual 1.75%
ContinuationReturn to Index�
�

30
ContinuationReturn to Index�
�
Top ten holdings %Vale ADR 3.2 Pacific Rubiales Energy 3.2 China Gas Holdings 2.7 OGX Petroleo e Gas Participacoes 2.7 Lanco Infratech 2.0 Companhia De Concessoes Rodoviarias 1.9 Wellstream 1.8 All America Latina Logistica 1.8 PetroChina ‘H’ 1.8China Resources Power 1.7
Geographical breakdown %Brazil 22.6India 13.1China 11.8Hong Kong 10.7Turkey 5.8South Korea 5.2Canada 4.7Russia 4.1Mexico 3.4United Kingdom 3.1Argentina 3.0Indonesia 2.9South Africa 2.1Turkmenistan 1.7Taiwan 1.5Egypt 1.2Panama 1.2United Arab Emirates 0.9Net other assets 1.0
Highest/lowest share price and distribution recordDistribution
Highest Lowest per shareCalendar year share price share price (net)
A-Class Accumulation SharesB
2008 53.42p 31.26p –
2009 68.50p 35.43p 0.00p
2010C 76.34p 64.41p 0.58p
A-Class Income SharesB
2008 53.42p 31.26p –
2009 68.53p 35.43p 0.00p
2010C 75.61p 63.95p 0.58p
B A-Class Accumulation and A-Class Income Shares were launched on 16 September 2008.C To 31 July 2010.
Portfolio turnover rate31.07.09 52.07%
31.07.10 63.45%
The portfolio turnover rate (PTR) reflects the total of security purchases and sales, less the total of shareissues and cancellations, expressed as a percentage of the average daily net asset values over the period.
Net asset values and Total expense ratiosNet assetvalue per Net asset Total
share class Number value per expenseDate £’000 of shares share ratio
A-Class Accumulation Shares
31.01.09 1,290 3,264,404 39.51p 1.93%
31.01.10 8,379 12,938,640 64.76p 1.93%
31.07.10 10,870 15,593,581 69.70p 1.93%
A-Class Income Shares
31.01.09D 1,210 3,064,308 39.50p 1.93%
31.01.10D 1,440 2,244,547 64.17p 1.93%
31.07.10 1,812 2,624,086 69.07p 1.93%
D The Net asset value and the Net asset value per income share are shown ex-dividend at the financial year end.
The total expense ratio (TER) takes into account the ACD fee and any fixed expenses charged to revenue overthe financial period, expressed as a percentage of the average daily net asset values over the same period.

31
ContinuationReturn to Index�
�
Portfolio statementAs at 31 July 2010
Market value Total netInvestment Holding £’000 assets %
Brazil – 22.6% (18.9%)AES Tiete 20,747 138 1.1 All America Latina Logistica 38,910 229 1.8 BR Malls Participacoes 15,130 142 1.1 Cia Energetica Minas Gerais Preference 4,965 48 0.4 Cia Transmissao de Energia Electrica Paulista 177 3 – Cia Transmissao de Energia Electrica Paulista
Preference 3,161 55 0.4 Companhia De Concessoes Rodoviarias 16,040 234 1.9 Companhia De Saneamento Minasgerais 17,572 160 1.3 Gerdau ADR 18,475 174 1.4 Mills Estruturas e Servicos 37,710 202 1.6 OGX Petroleo e Gas Participacoes 50,500 340 2.7 Petroleo Brasileiro ADS 7,290 167 1.3 Randon Sa Implementos E Participaco
Non Cum Preference 43,900 183 1.4 Ultrapar Participacoes ADR 5,220 169 1.3 Vale ADR 22,851 404 3.2 WEG 33,199 216 1.7
India – 13.1% (7.9%)ACC 17,240 198 1.6 Ambuja Cements 129,690 211 1.7 Bharti Airtel 29,940 127 1.0 Crompton Greaves 51,660 196 1.6 Gujarat NRE Coke 218,030 185 1.5 India Cements 42,270 63 0.5 Jindal Steel & Power 24,220 208 1.6 Lanco Infratech 272,160 251 2.0 Mundra Port & Special Economic Zone 19,670 197 1.6
China – 11.8% (12.0%)Anhui Conch Cement ‘H’ 64,000 144 1.1 Anhui Expressway ‘H’ 470,000 189 1.5 China National Building Material ‘H’ 112,000 136 1.1 China Railway Group ‘H’ 351,000 168 1.3 Dongfang Electric ‘H’ 83,400 184 1.5 Harbin Power Equipment ‘H’ 230,000 129 1.0 PetroChina ‘H’ 314,000 228 1.8 Shanghai Electric Group ‘H’ 522,000 158 1.2 Zhejiang Expressway ‘H’ 274,000 166 1.3
Hong Kong – 10.7% (10.4%)Beijing Enterprise 24,500 104 0.8 China Gas Holdings 1,068,000 347 2.7 China Resources Power 158,000 221 1.7 Guangdong Investment 652,000 208 1.6 Towngas China 724,000 183 1.4 Xinao Gas 112,000 170 1.3 Yingde Gases Group 242,000 151 1.2
Turkey – 5.8% (7.0%)KOC 63,156 158 1.2 TAV Havalimanlari 76,756 205 1.6 Turk Hava Yollari 102,603 188 1.5 Turkiye Petrol Rafinerileri 12,912 185 1.5
South Korea – 5.2% (3.1%)Hyundai Heavy Industries 900 131 1.0 Hyundai Steel 1,560 86 0.7 LG 1,794 79 0.6 LG Chemical 630 112 0.9 POSCO 370 98 0.8 Samsung Engineering 2,250 150 1.2
Market value Total netInvestment Holding £’000 assets %
Canada – 4.7% (0.9%)First Quantum Minerals 4,480 188 1.5 Pacific Rubiales Energy 26,187 400 3.2
Russia – 4.1% (7.9%)AO Tatneft ADS 8,050 161 1.3 Magnitogorsk Iron & Steel Works GDR 32,150 217 1.7 Rosneft GDR 32,700 140 1.1
Mexico – 3.4% (2.6%)Cemex ADR 26,078 155 1.2 Grupo Aeroportuario del Sureste ADS ‘B’ 3,594 118 0.9 NII Holdings 6,930 168 1.3
United Kingdom – 3.1% (2.4%)EurAsia Drilling Company GDR 13,050 165 1.3 Wellstream 46,141 231 1.8
Argentina – 3.0% (2.9%)Telecom Argentina ADR 17,890 210 1.7 Tenaris ADR 6,583 170 1.3
Indonesia – 2.9% (3.4%)Delta Dunia Makmur 2,481,500 176 1.4 Perusahaan Gas Negara 650,500 188 1.5
South Africa – 2.1% (5.4%)AECI 20,500 123 1.0 Raubex Group 73,740 143 1.1
Turkmenistan – 1.7% (0.0%)Dragon Oil 50,665 216 1.7
Taiwan – 1.5% (2.7%)Asia Cement 132,000 84 0.7 CTCI 142,000 97 0.8
Egypt – 1.2% (3.2%)Orascom Constructions Industry GDR 5,812 157 1.2
Panama – 1.2% (0.0%)Copa ‘A’ 4,660 151 1.2
United Arab Emirates – 0.9% (2.7%)DP WorldB 375,190 117 0.9
Investment assets 12,553 99.0
Net other assets 129 1.0
Net assets 12,682 100.0
Unless otherwise stated the above securities are admitted to official stock exchange listings or trade on aregulated market.
The comparative percentage figures in brackets are at 31 January 2010. B Quoted on Alternative Investment Market

32
ContinuationReturn to Index�
�
£’000
Total of all purchases for the period 9,284
Major purchases Cost
OGX Petroleo e Gas Participacoes 399Ambuja Cements 313Samsung Engineering 307Pacific Rubiales Energy 296Vale ADR 290Delta Dunia Makmur Tbk Pt Idr50 244ACC 243Dragon Oil 241China Resources Power 239Companhia De Concessoes Rodoviarias 238Jindal Steel & Power 233Petroleo Brasileiro ADS 212Hyundai Steel 210Mills Estruturas e Servicos 207Gujarat NRE Coke 205Crompton Greaves 202Mundra Port & Special Economic Zone 200Siam Cement (Alien Market) 200Lanco Infratech 200Yingde Gases Group 191
£’000
Total of all sales for the period 6,636
Major sales Proceeds
Reliance Inds GDR 413Siam Cement (Alien Market) 350MMC Norilsk Nickel ADR 294OGX Petroleo e Gas Participacoes 278ACC ELN 06/07/10 (UBS) 227Korean Air Lines 221Ambuja Cements ELN 13/11/12 (UBS) 218LLX Logistica 209Beijing Capital International Airport ‘H’ 197PLUS Expressways 187Vodacom Group 186Astra International 178ArcelorMittal 171Murray & Roberts Holdings 153Telecom Egypt 143Fibria Cellulose ADR 142Bumi Resources 133Tam ADR Preference 133Doosan Infracore 132Ambuja Cements 123
Portfolio movements For the six months ended 31 July 2010

33
Return to Index�
Financial statements
Statement of total return(Unaudited)
For the six months ended 31 July2010 2009
£’000 £’000 £’000 £’000
Income
Net capital gains 472 1,018
Revenue 188 98
Expenses (124) (31)
Net revenue before taxation 64 67
Taxation (11) (9)
Net revenue after taxation 53 58
Total return before distributions 525 1,076
Finance costs: Distributions (8) 6
Change in net assets attributable to shareholders from investment activities 517 1,082
Statement of change in net assets attributable to shareholders(Unaudited)
For the six months ended 31 July2010 2009
£’000 £’000 £’000 £’000
Opening net assets attributable to shareholders 9,819 2,500
Amounts receivable on issue of shares 5,172 651
Amounts payable on cancellation of shares (2,826) (52)
2,346 599
Change in net assets attributable to shareholders from investment activities (see above) 517 1,082
Closing net assets attributable to shareholders 12,682 4,181
As the comparatives in the above table are for the previous interim period, the Net assets at the end ofthat period will not agree to the Net assets at the start of the current period.
Balance sheet(Unaudited)
As at31 July 2010 31 January 2010
£’000 £’000 £’000 £’000
ASSETS
Investment assets 12,553 9,433
Debtors 151 4,551
Cash and bank balances 116 461
Total other assets 267 5,012
Total assets 12,820 14,445
LIABILITIES
Creditors (138) (4,613)
Distribution payable on income shares – (13)
Total liabilities (138) (4,626)
Net assets attributable to shareholders 12,682 9,819

34
ContinuationReturn to Index�
�
JPM Europe Dynamic (ex-UK) Fund
Investment objective and policyTo maximise long-term capital growth by investing primarily in continentalEuropean equities.
Risk profileThis equity based Fund is designed to give broad market exposure primarilyto European stock markets (which may include investments in emergingEuropean markets and smaller companies).
Equity investment is subject to specific risks relating to the performance ofthe individual companies held and the market’s perception of theirperformance. Equities are also subject to systematic risks such as generaleconomic conditions, inflation, interest rates, foreign exchange rates andindustry sector risks. In general terms, equities tend to be more volatile than bonds.
This Fund is aggressively managed, which may result in higher volatility ofthe Fund’s performance and bigger differences between the performanceof the Fund and its benchmark when compared to core funds.
For investors in Share Classes which are not hedged to Sterling, as theunderlying assets of the Fund are denominated in currencies other thanSterling, they will therefore be exposed to the currency risk of fluctuationsbetween Sterling and the currency denominations of the underlying assets.
Investors in the A GBP Hedged Share Class should be aware that any currencyhedging process may not give a precise hedge. Where currency hedging isundertaken, whilst it may protect an investor in Hedged Shares against adecrease in the value of the currency being hedged, it may also prevent theinvestor from participating in an increase in the value of that currency.
Fund review• European stock markets experienced a volatile six months as worries over
government debt levels in some eurozone countries sparked concernsover the outlook for regional economic growth.
• Against this backdrop, the Fund produced a negative return and laggedits benchmark. Positive contributors to relative returns included stockselection in the industrial metals & mining, chemicals and beveragessectors. Stock selection in the oil & gas producers and travel & leisuresectors detracted, as did stock selection and an underweight position inthe banks sector.
• At the stock level, the Fund benefited from an overweight position inBekaert, the maker of steel wire and coatings, which reported stronger-than-expected first-half profit and raised its three-year profitability forecaston the growth of its operations in Asia. An overweight position in Lanxesswas also beneficial after the chemical producer reported a first-quarterprofit versus a loss in the same period a year earlier, citing a strongrecovery in demand.
• Stock-level detractors included an overweight position in Tipp24, theonline lottery operator, which reported first-quarter results that fell shortof expectations due to higher expenses and the negative impact of above-average winnings on revenue. An overweight position in Questerre Energywas also detrimental as the oil producer reported disappointing first-quarter earnings on lower-than-expected production.
You should remember that past performance is not a guide to the future. The price of investments and the income from them may fall as well as rise andinvestors may not get back the full amount invested. For specific risks, please read the Simplified Prospectus.All performance returns are calculated using the quoted price of the accumulation shares. Performance returns are in Sterling.FX Adjusted returns have been calculated by JPMAM. Blended benchmarks have been calculated by JPMAM.Source: J.P. Morgan.A On 01/10/09 the name of the benchmark changed from the FTSE World Europe ex UK (Total Return Net) to the FTSE All World Developed Europe ex UK (Total Return Net).Source: FTSE International Limited (“FTSE”) © FTSE [2010]. “FTSE®” is a trade mark of London Stock Exchange Plc and The Financial Times Limited and is used by FTSE International Limited under licence. All rights inthe FTSE indices and/or FTSE ratings vest in FTSE and/or its licensors. Neither FTSE nor its licensors accept any liability for any errors or omissions in the FTSE indices and/or FTSE ratings or underlying data. No furtherdistribution of FTSE Data is permitted without FTSE’s express written consent.
• However, the Fund benefited in relative terms from an overweight positionin Royal Unibrew, the Swedish brewer, which received broker upgradesafter reporting stronger-than-expected fourth-quarter results and raisingits 2010 guidance.
Fund outlook• Investors remain concerned over the impact of the sovereign debt crisis
on the regional economic recovery, particularly given that austeritymeasures from several European governments are likely to weigh ongrowth. However, equity valuations have become more attractive followingstrong second-quarter corporate earnings reports and should providesupport if the economic outlook stabilises.
Rolling 12 month performance as at 31 July2010/2009 2009/2008 2008/2007 2007/2006 2006/2005
JPM Europe Dynamic (ex-UK)A-Class Acc 14.0% -17.9% -10.6% 30.4% 29.0%
JPM Europe Dynamic (ex-UK)B-Class Acc 14.9% -17.7% – – –
Benchmark IndexA 11.2% -10.4% -8.0% 21.1% 16.0%
Six month performance31/01/10–31/07/10
JPM Europe Dynamic (ex-UK) A-Class Acc -1.1%
Benchmark IndexA 0.3%
Fund statisticsFund size £122.5m
Benchmark IndexA FTSE All World Developed Europe ex UK(Total Return Net)
Fund chargesA-Class Initial 4.25%, Annual 1.50%B-Class Initial Nil, Annual 1.00%
Top ten holdings %BNP Paribas 3.5UBS 3.3Siemens 3.2Daimler 2.8Novartis 2.7Nestle 2.3BASF 2.2Fischer (George) 2.0Banco Santander 1.9Lanxess 1.9

35
ContinuationReturn to Index�
�
Geographical breakdown %Germany 37.1Switzerland 17.9France 8.4Netherlands 7.7Sweden 4.9Belgium 3.4Italy 3.3Spain 3.3Norway 3.1Finland 2.9Denmark 2.4Ireland 1.5Austria 0.5Portugal 0.1Net other assets 3.5
Highest/lowest share price and distribution recordDistribution
Highest Lowest per shareCalendar year share price share price (net)
A-Class Accumulation Shares
2005 74.71p 54.62p –
2006 96.98p 75.13p 0.38p
2007 117.6p 96.30p 0.49p
2008 116.8p 68.10p 1.01p
2009 103.3p 62.69p 1.76p
2010B 107.2p 86.16p 1.22p
A-Class Income SharesC
2007 59.39p 48.63p –
2008 59.00p 34.03p 0.50p
2009 50.44p 30.62p 0.90p
2010B 51.77p 41.59p 0.52p
B-Class Accumulation SharesD
2007 100.0p 92.48p –
2008 99.73p 58.31p 0.14p
2009 88.75p 53.74p 1.87p
2010B 92.43p 74.44p 1.51p
B-Class Income SharesE
2008 105.8p 63.29p –
2009 94.68p 57.34p 1.21p
2010B 96.89p 77.95p 1.54p
B To 31 July 2010.C A-Class Income Shares were launched on 2 January 2007.D B-Class Accumulation Shares were launched on 2 November 2007.E B-Class Income Shares were launched on 24 April 2008.
Portfolio turnover rate31.07.09 465.85%
31.07.10 431.85%
The portfolio turnover rate (PTR) reflects the total of security purchases and sales, less the total of shareissues and cancellations, expressed as a percentage of the average daily net asset values over the period.
Net asset values and Total expense ratiosNet assetvalue per Net asset Total
share class Number value per expenseDate £’000 of shares share ratio
A-Class Accumulation Shares
31.01.08 184,935 185,503,822 99.69p 1.67%
31.01.09 93,719 126,010,933 74.37p 1.64%
31.01.10 128,028 136,691,403 93.66p 1.68%
31.07.10 119,957 129,518,693 92.62p 1.68%
A-Class Income Shares
31.01.08F 26,472 53,112,557 49.84p 1.67%
31.01.09F 24,419 67,255,062 36.31p 1.66%
31.01.10F 1,295 2,864,839 45.21p 1.68%
31.07.10 1,656 3,702,676 44.71p 1.68%
B-Class Accumulation Shares
31.01.08 752 883,973 85.14p 1.15%
31.01.09 5,399 8,472,834 63.72p 1.14%
31.01.10 2,077 2,571,913 80.74p 1.15%
31.07.10 922 1,152,109 80.06p 1.15%
B-Class Income Shares
31.01.09F 9 13,000 68.02p 1.15%
31.01.10F 10 12,000 84.55p 1.15%
31.07.10 11 13,000 83.83p 1.15%
F The Net asset value and the Net asset value per income share are shown ex-dividend at the financial year end.
The total expense ratio (TER) takes into account the ACD fee and any fixed expenses charged to revenue overthe financial period, expressed as a percentage of the average daily net asset values over the same period.

36
ContinuationReturn to Index�
�
Market value Total netInvestment Holding £’000 assets %
Portfolio statementAs at 31 July 2010
Germany – 37.1% (19.3%)Aixtron 36,400 718 0.6aleo solar 37,161 422 0.3Asian Bamboo 55,891 1,498 1.2BASF 75,039 2,762 2.2Bechtle 83,624 1,543 1.3Bertrandt 59,863 1,636 1.3BMW 55,451 1,878 1.5Brenntag 42,580 2,061 1.7Continental 30,324 1,224 1.0Daimler 98,477 3,387 2.8Deutsche Bank 38,129 1,709 1.4Deutsche Post 161,815 1,785 1.5Deutsche Telekom 79,482 680 0.6Dragerwerk Non-Voting Preference 8,382 357 0.3Drillisch 315,153 1,216 1.0Grammer 128,521 1,541 1.3Infineon Technologies 407,623 1,745 1.4Joyou 117,343 1,383 1.1Lanxess 74,282 2,310 1.9Leoni 35,918 695 0.6Merck 22,977 1,289 1.0Phoenix Solar 22,519 629 0.5ProSiebenSat.1 Media Preference 120,310 1,360 1.1Rheinmetall 21,967 837 0.7SGL Carbon 27,063 603 0.5Siemens 62,842 3,941 3.2SMA Solar Technology 25,773 2,057 1.7Solar World 51,375 442 0.4Stada Arzneimittel 34,203 716 0.6Symrise 38,276 606 0.5Tipp24 30,991 596 0.5Tom Tailor Holding 70,325 650 0.5Vossloh 13,633 871 0.7Wacker Construction Equipment 30,020 291 0.2
Switzerland – 17.9% (6.7%)Bossard 22,994 1,236 1.0Clariant 270,761 2,290 1.9Fischer (George) 9,924 2,503 2.0Forbo 6,691 2,067 1.7Nestle 89,960 2,862 2.3Novartis 105,498 3,294 2.7Orior 11,728 335 0.3Roche (Genusscheine) 10,321 864 0.7Schindler 10,983 616 0.5Sulzer 6,879 456 0.4Swatch Group 2,421 481 0.4UBS 366,765 4,030 3.3Zurich Financial Services 5,439 813 0.7
France – 8.4% (7.8%)Arkema 23,473 658 0.5BNP Paribas 97,997 4,317 3.5Ipsos 27,784 707 0.6Pages Jaunes 179,901 1,280 1.0Publicis Groupe 30,313 874 0.7Sanofi-Aventis 28,297 1,047 0.9Societe Generale 39,938 1,480 1.2
Netherlands – 7.7% (6.9%)Accell Group 21,596 615 0.5ASM International 92,912 1,493 1.2ASML 85,270 1,748 1.4DSM 58,347 1,771 1.4Imtech 19,413 348 0.3ING Groep 298,359 1,863 1.5Philips Electronics 39,030 771 0.6Ten Cate 58,640 981 0.8
Market value Total netInvestment Holding £’000 assets %
Sweden – 4.9% (6.6%)Byggmax 194,335 851 0.7Scania ‘B’ 88,563 1,037 0.8Svenska Cellulosa ‘B’ 64,423 597 0.5Tele2 ‘B’ 53,331 599 0.5TeliaSonera 438,764 2,016 1.6Volvo ‘B’ 119,604 945 0.8
Belgium – 3.4% (5.5%)Barco (New) 21,681 701 0.6Bekaert 17,128 2,298 1.9Tessenderlo Chemie 58,247 1,102 0.9
Italy – 3.3% (7.0%)Amplifon 144,377 456 0.4De Longhi 533,442 1,658 1.4Enel 288,555 909 0.7Indesit 134,555 1,025 0.8
Spain – 3.3% (9.0%)Banco Santander 282,179 2,364 1.9Obrascon Huarte Lain 27,773 463 0.4Repsol 80,042 1,215 1.0
Norway – 3.1% (11.6%)Electromagnetic Geoservices 141,000 95 0.1Leroy Seafood Group 37,126 479 0.4Morpol 351,170 740 0.6Questerre Energy 400,676 745 0.6Schibsted 93,615 1,306 1.1Seadrill 24,571 359 0.3
Finland – 2.9% (6.3%)Metso 58,386 1,459 1.2M-real ‘B’ 283,752 684 0.6Stora Enso ‘R’ 67,927 351 0.3Wartsila ‘B’ 29,700 1,010 0.8
Denmark – 2.4% (2.0%)A.P. Moller-Maersk ‘B’ 175 956 0.8Royal Unibrew 51,467 1,153 0.9Sydbank 53,810 855 0.7
Ireland – 1.5% (0.0%)Bank of Ireland 956,722 644 0.5Greencore Group 1,066,171 1,175 1.0
Austria – 0.5% (1.6%)MM Karton 9,179 599 0.5
Portugal – 0.1% (0.0%)Altri 39,404 130 0.1
Investment assets 118,214 96.5
Net other assets 4,332 3.5
Net assets 122,546 100.0
Unless otherwise stated the above securities are admitted to official stock exchange listings or trade on aregulated market.
The comparative percentage figures in brackets are at 31 January 2010.
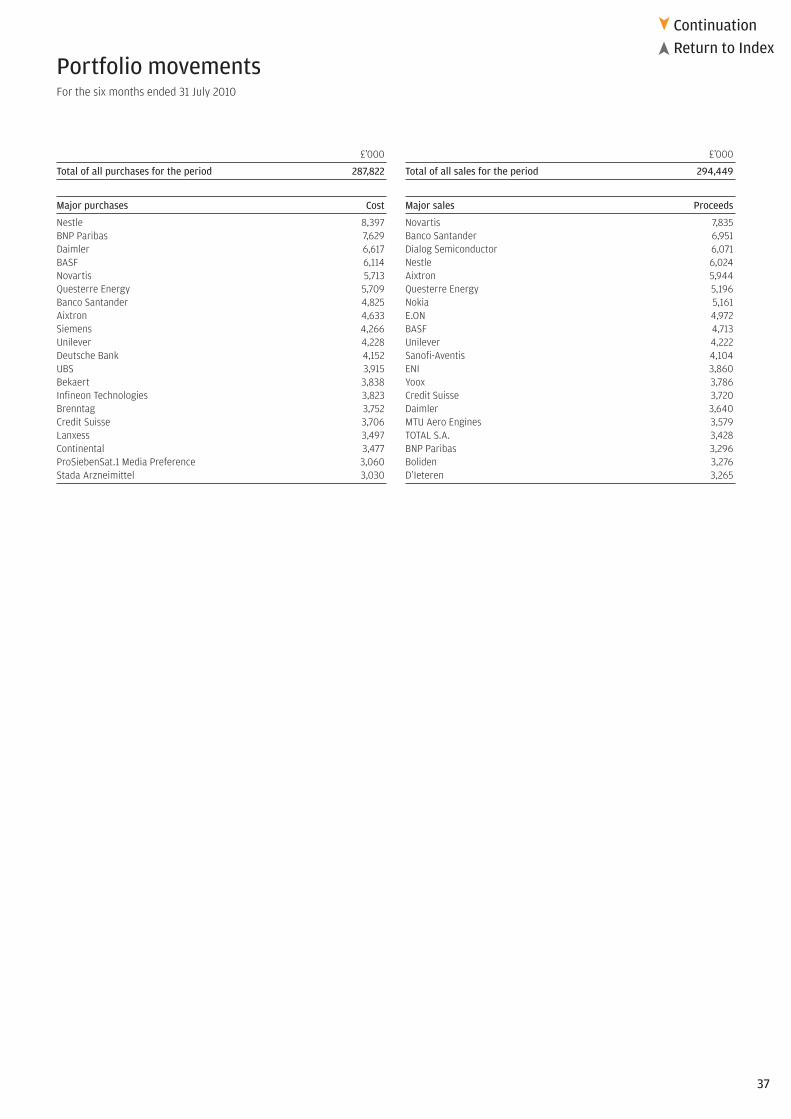
£’000
Total of all purchases for the period 287,822
Major purchases Cost
Nestle 8,397BNP Paribas 7,629Daimler 6,617BASF 6,114Novartis 5,713Questerre Energy 5,709Banco Santander 4,825Aixtron 4,633Siemens 4,266Unilever 4,228Deutsche Bank 4,152UBS 3,915Bekaert 3,838Infineon Technologies 3,823Brenntag 3,752Credit Suisse 3,706Lanxess 3,497Continental 3,477ProSiebenSat.1 Media Preference 3,060Stada Arzneimittel 3,030
£’000
Total of all sales for the period 294,449
Major sales Proceeds
Novartis 7,835Banco Santander 6,951Dialog Semiconductor 6,071Nestle 6,024Aixtron 5,944Questerre Energy 5,196Nokia 5,161E.ON 4,972BASF 4,713Unilever 4,222Sanofi-Aventis 4,104ENI 3,860Yoox 3,786Credit Suisse 3,720Daimler 3,640MTU Aero Engines 3,579TOTAL S.A. 3,428BNP Paribas 3,296Boliden 3,276D’Ieteren 3,265
Portfolio movements For the six months ended 31 July 2010
37
ContinuationReturn to Index�
�

38
Return to Index�
Financial statements
Statement of total return(Unaudited)
For the six months ended 31 July2010 2009
£’000 £’000 £’000 £’000
Income
Net capital (losses)/gains (2,045) 6,958
Revenue 2,899 3,397
Expenses (1,092) (864)
Net revenue before taxation 1,807 2,533
Taxation (363) (470)
Net revenue after taxation 1,444 2,063
Total return before distributions (601) 9,021
Finance costs: Distributions (6) (126)
Change in net assets attributable to shareholders from investment activities (607) 8,895
Statement of change in net assets attributable to shareholders(Unaudited)
For the six months ended 31 July2010 2009
£’000 £’000 £’000 £’000
Opening net assets attributable to shareholders 131,410 123,546
Amounts receivable on issue of shares 5,320 4,436
Amounts payable on cancellation of shares (13,576) (29,145)
(8,256) (24,709)
Change in net assets attributable to shareholders from investment activities (see above) (607) 8,895
Stamp duty reserve tax (1) –
Closing net assets attributable to shareholders 122,546 107,732
As the comparatives in the above table are for the previous interim period, the Net assets at the end ofthat period will not agree to the Net assets at the start of the current period.
Balance sheet(Unaudited)
As at31 July 2010 31 January 2010
£’000 £’000 £’000 £’000
ASSETS
Investment assets 118,214 127,773
Debtors 12,296 7,129
Cash and bank balances – 9,772
Total other assets 12,296 16,901
Total assets 130,510 144,674
LIABILITIES
Investment liabilities – (40)
Creditors (7,898) (13,209)
Bank overdraft (66) –
Distribution payable on income shares – (15)
Total other liabilities (7,964) (13,224)
Total liabilities (7,964) (13,264)
Net assets attributable to shareholders 122,546 131,410

39
ContinuationReturn to Index�
�
JPM Europe Fund
Investment objective and policyTo provide a portfolio primarily invested in the shares of European companiesin any economic sector. The Fund aims to provide capital growth over thelong term.
Risk profileThis equity based Fund is designed to give broad market exposure primarilyto European stock markets (which may include investments in emergingEuropean markets and smaller companies).
Equity investment is subject to specific risks relating to the performance ofthe individual companies held and the market’s perception of their performance.Equities are also subject to systematic risks such as general economicconditions, inflation, interest rates, foreign exchange rates and industry sectorrisks. In general terms, equities tend to be more volatile than bonds.
The underlying assets of the Fund are denominated in currencies other thanSterling and are not hedged back to Sterling. Investors will therefore beexposed to the currency risk of fluctuations between Sterling and the currencydenomination of the underlying assets.
Fund review• European stock markets experienced a volatile six months as worries over
government debt levels in some eurozone countries sparked concernsover the outlook for regional economic growth.
• Against this backdrop, the Fund produced a small negative return andmoderately underperformed its benchmark. Positive contributors torelative returns included stock selection in the industrial metals & mining,chemicals and construction & materials sectors. Stock selection detractedin the banks, industrial engineering and oil & gas producers sectors.
• At the stock level, the Fund benefited most from an overweight positionin Bekaert, the maker of steel wire and coatings, which reported stronger-than-expected first-half profit and raised its three-year profitability forecaston the growth of its operations in Asia. An overweight position in Lanxesswas also beneficial after the chemical producer reported a first-quarterprofit versus a loss in the same period a year earlier, citing a strongrecovery in demand.
• Stock-level detractors included an overweight position in Banco Santander,which suffered as investors became concerned about the exposure ofEuropean banks to peripheral eurozone sovereign debt. An underweightposition in ABB was also detrimental as the Swiss engineering groupreceived broker upgrades after reporting better-than-expected second-quarter earnings, driven by margin improvements.
• However, the Fund benefited in relative terms from an underweight positionin ArcelorMittal as steelmakers were hit by uncertainty over the metalprice outlook amid fears of weakening demand from Europe and China.
You should remember that past performance is not a guide to the future. The price of investments and the income from them may fall as well as rise andinvestors may not get back the full amount invested. For specific risks, please read the Simplified Prospectus.All performance returns are calculated using the quoted price of the accumulation or income shares. Performance returns are in Sterling.FX Adjusted returns have been calculated by JPMAM. Blended benchmarks have been calculated by JPMAM.Source: J.P. Morgan.A On 01/10/09 the name of the benchmark changed from the FTSE World Europe ex UK (Total Return Net) to the FTSE All World Developed Europe ex UK (Total Return Net).Source: FTSE International Limited (“FTSE”) © FTSE [2010]. “FTSE®” is a trade mark of London Stock Exchange Plc and The Financial Times Limited and is used by FTSE International Limited under licence. All rights inthe FTSE indices and/or FTSE ratings vest in FTSE and/or its licensors. Neither FTSE nor its licensors accept any liability for any errors or omissions in the FTSE indices and/or FTSE ratings or underlying data. No furtherdistribution of FTSE Data is permitted without FTSE’s express written consent.
Fund outlook• Investors remain concerned over the impact of the sovereign debt crisis
on the regional economic recovery, particularly given that austeritymeasures from several European governments are likely to weigh ongrowth. However, equity valuations have become more attractive followingstrong second-quarter corporate earnings reports and should providesupport if the economic outlook stabilises.
Rolling 12 month performance as at 31 July2010/2009 2009/2008 2008/2007 2007/2006 2006/2005
JPM Europe A-Class Acc 8.9% -15.2% -6.9% 23.6% 18.7%
JPM EuropeB-Class Acc 9.6% -15.0% – – –
JPM EuropeC-Class Inc 10.0% -12.4% – – –
Benchmark IndexA 11.2% -10.4% -8.0% 21.1% 16.0%
Six month performance31/01/10–31/07/10
JPM Europe A-Class Acc -0.5%
Benchmark IndexA 0.3%
Fund statisticsFund size £232.5m
Benchmark IndexA FTSE All World Developed Europe ex UK(Total Return Net)
Fund chargesA-Class Initial 4.25%, Annual 1.50% B-Class Initial Nil, Annual 1.00%C-Class Initial Nil, Annual 0.75%
Top ten holdings %Nestle 3.5BNP Paribas 2.7Banco Santander 2.7UBS 2.6TOTAL S.A. 2.3Credit Suisse 2.2Novartis 2.0Siemens 2.0Societe Generale 1.7BASF 1.7

40
ContinuationReturn to Index�
�
Geographical breakdown %Germany 20.6France 19.9Switzerland 17.4Italy 7.4Spain 7.4Sweden 5.6Netherlands 4.7Belgium 3.7Denmark 2.4Finland 1.7Norway 1.0Other 0.8United Kingdom 0.7Ireland 0.5Portugal 0.1Futures 0.1Net other assets 6.0
Highest/lowest share price and distribution recordDistribution
Highest Lowest per shareCalendar year share price share price (net)
A-Class Accumulation Shares
2005 593.6p 445.9p 3.03p
2006 716.9p 578.5p 2.94p
2007 839.7p 698.8p 3.31p
2008 844.8p 510.1p 7.29p
2009 770.6p 473.4p 15.72p
2010B 769.9p 634.6p 9.93p
A-Class Income SharesC
2007 53.92p 48.55p –
2008 54.25p 32.74p 0.00p
2009 48.17p 29.60p 0.98p
2010B 47.69p 38.49p 0.61p
B-Class Accumulation SharesD
2008 107.4p 65.54p –
2009 99.42p 60.90p 2.07p
2010B 99.58p 80.89p 1.70p
C-Class Income SharesD
2008 113.8p 69.54p –
2009 108.8p 65.39p 0.00p
2010B 108.0p 86.72p 2.19p
B To 31 July 2010.C A-Class Income Shares were launched on 1 September 2007.D B-Class Accumulation and C-Class Income Shares were launched on 14 April 2008.
Portfolio turnover rate31.07.09 289.82%
31.07.10 332.35%
The portfolio turnover rate (PTR) reflects the total of security purchases and sales, less the total of shareissues and cancellations, expressed as a percentage of the average daily net asset values over the period.
Net asset values and Total expense ratiosNet assetvalue per Net asset Total
share class Number value per expenseDate £’000 of shares share ratio
A-Class Accumulation Shares
31.01.08 341,139 46,482,814 733.9p 1.65%
31.01.09 271,102 48,155,095 563.0p 1.66%
31.01.10 286,965 42,326,548 678.0p 1.67%
31.07.10 228,448 33,866,381 674.6p 1.68%
A-Class Income Shares
31.01.08E 245 520,866 46.99p 1.68%
31.01.09E 310 879,482 35.20p 1.68%
31.01.10E 1,680 4,021,780 41.78p 1.68%
31.07.10 1,406 3,381,853 41.57p 1.68%
B-Class Accumulation Shares
31.01.09 2,125 2,935,880 72.37p 1.09%
31.01.10 2,858 3,262,022 87.60p 1.15%
31.07.10 2,564 2,934,163 87.39p 1.15%
C-Class Income Shares
31.01.09E 94 122,854 76.95p 0.85%
31.01.10E 313 333,963 93.81p 0.87%
31.07.10 81 86,863 93.72p 0.87%
E The Net asset value and the Net asset value per income share are shown ex-dividend at the financial year end.
The total expense ratio (TER) takes into account the ACD fee and any fixed expenses charged to revenue overthe financial period, expressed as a percentage of the average daily net asset values over the same period.

41
ContinuationReturn to Index�
�
Market value Total netInvestment Holding £’000 assets %
Portfolio statementAs at 31 July 2010
Germany – 20.6% (18.2%)Aixtron 46,067 909 0.4 Allianz 35,287 2,598 1.1 Asian Bamboo 73,783 1,977 0.9 BASF 104,194 3,836 1.7 BMW 62,442 2,114 0.9 Brenntag 49,258 2,385 1.0 Daimler 110,374 3,796 1.6 Deutsche Bank 51,185 2,294 1.0 Deutsche Post 269,506 2,973 1.3 Deutsche Telekom 167,627 1,434 0.6 Dragerwerk Non-Voting Preference 16,566 705 0.3 Infineon Technologies 440,480 1,886 0.8 Joyou 156,251 1,842 0.8 Lanxess 60,671 1,887 0.8 Merck 22,265 1,249 0.5 MunichRe 9,990 880 0.4 ProSiebenSat.1 Media Preference 177,667 2,009 0.9 Rheinmetall 29,071 1,108 0.5 SGL Carbon 53,221 1,185 0.5 Siemens 73,546 4,612 2.0 Stada Arzneimittel 58,255 1,220 0.5 Symrise 116,175 1,839 0.8 Vossloh 26,812 1,712 0.7 Wacker Chemie 12,714 1,302 0.6
France – 19.9% (19.6%)Air Liquide 12,797 916 0.4 Alstom 35,460 1,174 0.5 Arkema 62,400 1,749 0.8 AXA 293,829 3,426 1.5 BIC 24,234 1,165 0.5 BNP Paribas 142,841 6,292 2.7 Compagnie de Saint-Gobain 44,161 1,202 0.5 France Telecom 92,701 1,246 0.5 GDF Suez 86,091 1,839 0.8 Ipsos 51,909 1,322 0.6 Legrand Promesse 85,285 1,758 0.8 L’Oreal 11,807 795 0.3 LVMH 29,814 2,322 1.0 Pages Jaunes 212,282 1,511 0.6 Publicis Groupe 96,510 2,783 1.2 Rhodia 90,302 1,201 0.5 Sanofi-Aventis 70,286 2,601 1.1 Schneider Electric 38,762 2,859 1.2 Societe Generale 108,600 4,023 1.7 TOTAL S.A. 162,861 5,300 2.3 Vicat 19,334 856 0.4
Switzerland – 17.4% (12.2%)ABB 55,925 722 0.3 Clariant 372,855 3,153 1.4 Compagnie Financiere Richemont ‘A’ 45,520 1,140 0.5 Credit Suisse 170,907 5,065 2.2 Fischer (George) 9,963 2,513 1.1 Forbo 3,965 1,225 0.5 Nestle 255,562 8,130 3.5 Novartis 151,180 4,721 2.0 Roche (Genusscheine) 20,327 1,701 0.7 Schindler 26,778 1,501 0.6 Sulzer 13,542 898 0.4 Swatch Group 6,239 1,240 0.5 Swiss Reinsurance 29,651 871 0.4 UBS 556,385 6,114 2.6 Zurich Financial Services 10,750 1,606 0.7
Italy – 7.4% (6.1%)Amplifon 176,747 558 0.2 Azimut Holdings 189,590 1,214 0.5 Enel 764,891 2,410 1.0 ENI 221,366 2,890 1.2 Indesit 230,202 1,754 0.8 Intesa Sanpaolo 1,021,113 2,178 0.9 Recordati 268,079 1,280 0.6 Telecom Italia 1,253,895 1,028 0.4 Trevi Finanziaria Industriale 108,507 1,111 0.5 Unicredito Italiano 1,652,032 2,965 1.3
Market value Total netInvestment Holding £’000 assets %
Spain – 7.4% (9.0%)Amadeus IT Holdings 159,406 1,796 0.8 Banco Bilbao Vizcaya Argentaria 315,386 2,730 1.2 Banco Santander 742,331 6,218 2.7 Construcciones y Auxiliar de Ferrocarriles 4,195 1,191 0.5 Obrascon Huarte Lain 44,169 736 0.3 Repsol YPF 83,377 1,266 0.5 Telefonica 224,866 3,275 1.4
Sweden – 5.6% (4.9%)ASSA ABLOY ‘B’ 114,881 1,623 0.7 Gunnebo 158,056 429 0.2 Hoganas ‘B’ 37,585 658 0.3 Nordea Bank 180,419 1,148 0.5 Skandinaviska Enskilda Banken ‘A’ 187,593 819 0.4 Svenska Cellulosa ‘B’ 126,408 1,171 0.5 Tele2 ‘B’ 133,063 1,494 0.6 TeliaSonera 627,015 2,882 1.2 Trelleborg ‘B’ 397,127 1,836 0.8 Volvo ‘B’ 114,298 904 0.4
Netherlands – 4.7% (3.8%)ASM International 151,750 2,439 1.0 ASML 114,076 2,338 1.0 DSM 76,497 2,322 1.0 Imtech 69,699 1,250 0.5 ING Groep 336,483 2,101 0.9 Philips Electronics 34,018 672 0.3
Belgium – 3.7% (2.9%)Anheuser-Busch InBev 68,683 2,325 1.0 Bekaert 28,349 3,804 1.6 CFE 33,715 1,090 0.5 D’Ieteren 3,465 1,064 0.5 Recticel 30,642 193 0.1
Denmark – 2.4% (1.1%)A.P. Moller-Maersk ‘B’ 330 1,804 0.8 Danske Bank 65,324 992 0.4 FLSmidth & Co 30,570 1,387 0.6 Novo-Nordisk ‘B’ 23,912 1,316 0.6
Finland – 1.7% (3.7%)Huhtamaki ‘I’ 150,002 1,195 0.5 Metso 73,880 1,846 0.8 M-real ‘B’ 28,494 69 –Sampo ‘A’ 53,242 837 0.4
Norway – 1.0% (6.8%)Questerre Energy 694,788 1,292 0.6 Schibsted 69,542 970 0.4
Other – 0.8% (0.6%)JPM Europe Micro Cap ‘A’ (Income) 140,637 1,116 0.5 JPM Europe Strategic Value ‘A’ (Income) 75,847 692 0.3
United Kingdom – 0.7% (2.8%)Centamin Egypt 1,052,585 1,612 0.7
Ireland – 0.5% (0.1%)Allied Irish Banks 196,182 152 0.1 Bank of Ireland 1,451,167 978 0.4
Portugal – 0.1% (0.0%)Altri 79,288 261 0.1
Futures – 0.1% ((0.1)%)DJ Euro Stoxx 50 Index Futures Sep 2010 507 288 0.1
Investment assets 218,661 94.0
Net other assets 13,838 6.0
Net assets 232,499 100.0
Unless otherwise stated the above securities are admitted to official stock exchange listings or trade on aregulated market.
The comparative percentage figures in brackets are at 31 January 2010.

42
ContinuationReturn to Index�
�
£’000
Total of all purchases for the period 456,570
Major purchases Cost
Credit Suisse 9,791France Telecom 9,291Nestle 8,296Deutsche Bank 8,080Banco Santander 7,951BNP Paribas 7,746Societe Generale 7,538Daimler 7,519BASF 7,193Brenntag 6,408Novartis 5,741Infineon Technologies 5,525Philips Electronics 5,513UBS 5,487Compagnie Financiere Richemont ‘A’ 5,332Roche (Genusscheine) 5,078Unilever 4,927Stada Arzneimittel 4,877Lanxess 4,855Deutsche Telekom 4,698
£’000
Total of all sales for the period 508,307
Major sales Proceeds
Banco Santander 10,286Novartis 9,663Nestle 9,364France Telecom 9,193BNP Paribas 8,452Nokia 8,310Credit Suisse 7,930BASF 7,833Roche (Genusscheine) 7,518E.ON 7,450Deutsche Bank 6,942Aixtron 6,585Philips Electronics 6,441Lanxess 6,230Daimler 6,209Bayer 5,742Infineon Technologies 5,669Unilever 5,647SEB 5,374Telefonica 5,336
Portfolio movements For the six months ended 31 July 2010

43
Return to Index�
Financial statements
Statement of total return(Unaudited)
For the six months ended 31 July2010 2009
£’000 £’000 £’000 £’000
Income
Net capital (losses)/gains (3,547) 20,692
Revenue 6,768 8,501
Expenses (2,273) (2,151)
Net revenue before taxation 4,495 6,350
Taxation (868) (995)
Net revenue after taxation 3,627 5,355
Total return before distributions 80 26,047
Finance costs: Distributions (421) (60)
Change in net assets attributable to shareholders from investment activities (341) 25,987
Statement of change in net assets attributable to shareholders(Unaudited)
For the six months ended 31 July2010 2009
£’000 £’000 £’000 £’000
Opening net assets attributable to shareholders 291,816 273,631
Amounts receivable on issue of shares 2,686 5,153
Amounts payable on cancellation of shares (61,659) (19,811)
(58,973) (14,658)
Change in net assets attributable to shareholders from investment activities (see above) (341) 25,987
Stamp duty reserve tax (3) (2)
Closing net assets attributable to shareholders 232,499 284,958
As the comparatives in the above table are for the previous interim period, the Net assets at the end ofthat period will not agree to the Net assets at the start of the current period.
Balance sheet(Unaudited)
As at31 July 2010 31 January 2010
£’000 £’000 £’000 £’000
ASSETS
Investment assets 218,661 273,034
Debtors 17,205 9,959
Cash and bank balances 11,976 13,562
Total other assets 29,181 23,521
Total assets 247,842 296,555
LIABILITIES
Investment liabilities – (373)
Creditors (15,343) (4,334)
Distribution payable on income shares – (32)
Total other liabilities (15,343) (4,366)
Total liabilities (15,343) (4,739)
Net assets attributable to shareholders 232,499 291,816

44
ContinuationReturn to Index�
�
JPM Global Consumer Trends Fund
Investment objective and policyTo provide long term capital growth by investing primarily in companiesthroughout the world benefiting from consumer driven opportunities.Investments may include, but are not limited to, companies providing goodsand services relating to consumer related activities, wealth, leisure, lifestyle,health and wellness. Issuers of these securities may be located in any countryand the Fund may invest significantly in emerging markets and in smallercompanies (see section 11.5 and 11.10 of full Prospectus – Risk Warnings).Derivatives may be used for the purposes of Efficient Portfolio Management,including hedging, where appropriate (see section 11.14 of full Prospectus– Derivatives). The Fund may hold non-equity investments from time to timeas appropriate.
Risk profileEquity investment is subject to specific risks relating to the performance ofthe individual companies held and the market’s perception of theirperformance. Equities are also subject to systematic risks such as generaleconomic conditions, inflation, interest rates, foreign exchange rates andindustry sector risks. In general terms, equities tend to be more volatile than bonds.
The Fund is not managed with reference to its benchmark and its compositionmay significantly deviate from the benchmark. The benchmark is used forcomparison purposes only.
The Fund may be invested in emerging markets, which may be subject toadditional political and economic risks, low liquidity, poor transparencyand greater financial risks.
Smaller companies’ securities may be less liquid than the securities of largercompanies as a result of inadequate trading volume or restrictions on trading.Smaller companies may possess greater potential for growth, but can alsoinvolve greater risks, such as limited product lines and markets, and financialor managerial resources. Trading in such securities may be subject to moreabrupt price movements and greater fluctuations in available liquidity thantrading in the securities of larger companies.
The underlying assets of the Fund are denominated in currencies other thanSterling and are not hedged back to Sterling. Investors will therefore beexposed to the currency risk of fluctuations between Sterling and the currencydenomination of the underlying assets.
Fund review• For the period under review, the Global Consumer Trends Fund delivered
a strong absolute return and significantly outperformed the broader globalequity market.
• Aspirational stocks contributed positively to performance, including Westernbrands, such as Folli Follie and Abercrombie & Fitch. Melco CrownEntertainment, the owner and developer of casinos in Macau, China andAmerica Movil, Latin America’s largest mobile phone company alsoperformed well.
You should remember that past performance is not a guide to the future. The price of investments and the income from them may fall as well as rise andinvestors may not get back the full amount invested. For specific risks, please read the Simplified Prospectus.All performance returns are calculated using the quoted price of the accumulation shares. Performance returns are in Sterling.FX Adjusted returns have been calculated by JPMAM. Blended benchmarks have been calculated by JPMAM.Source: J.P. Morgan.A As at 01/11/09 the primary benchmark for the JPM Global Consumer Trends Fund changed from MSCI World Index Consumer Discretionary/MSCI World Index Consumer Staples – Market Cap Weighted (Total Return Net)
to MSCI World Index (Total Return Net).The Fund is not managed with reference to the indices shown. They are provided for comparison purposes only. The benchmark – the MSCI World Index – shows how the Fund has performed against the broader globalmarket. The Comparator – MSCI World Index Consumer Discretionary/MSCI World Index Consumer Staples – Market Cap Weighted – is a narrower composite index of consumer sectors.Benchmark Source: MSCI. The MSCI data is comprised of a custom index calculated by MSCI for, and as requested by JPMorgan Asset Management (UK) Ltd. The MSCI data is for internal use only and may not be redistributedor used in connection with creating or offering any securities, financial products or indices. Neither MSCI nor any other third party involved in or related to compiling, computing or creating the MSCI data (the “MSCIParties”) makes any express or implied warranties or representations with respect to such data (or the results to be obtained by the use thereof), and the MSCI Parties hereby expressly disclaim all warranties oforiginality, accuracy, completeness, merchantability or fitness for a particular purpose with respect to such data. Without limiting any of the foregoing, in no event shall any of the MSCI Parties have any liability for anydirect, indirect, special, punitive, consequential or any other damages (including lost profits) even if notified of the possibility of such damages.
• Demographics was another a positive theme in the Fund with Yum Brandsand Nestle contributing positively to returns. In health and wellness,performance was mixed as our holding in US organics food providerHain Celestial contributed positively, while Southern Cross Healthcare,the UK retirement home, detracted following disappointing earningsresults.
Fund outlook• We continue to identify companies that are benefiting from structural
changes in the consumer landscape. Within the aspiration theme, forexample, we have recently taken advantage of the market volatility toadd to positions such as Richemont, which is likely to be a key beneficiaryof strong demand from emerging markets. We are also finding a numberof attractive investment opportunities within the health and wellnesstheme, where select valuations are looking very attractive.
Rolling 12 month performance as at 31 July2010/2009 2009/2008
JPM Global Consumer Trends A-Class Acc 27.6% 13.3%
JPM Global Consumer Trends C-Class Acc – –
Benchmark IndexA 16.3% -6.3%
Comparator 21.8% 7.2%
Six month performance31/01/10–31/07/10
JPM Global Consumer Trends A-Class Acc 7.4%
Benchmark IndexA 4.0%
Comparator 6.9%
Fund statisticsFund size £32.7m
Benchmark IndexA MSCI World Index (Total Return Net)
Comparator MSCI World Index Consumer Discretionary/MSCI World Index Consumer Staples –
Market Cap Weighted (Total Return Net)
Fund chargesA-Class Initial 4.25%, Annual 1.50%C-Class Initial Nil, Annual 0.75%

45
ContinuationReturn to Index�
�
Top ten holdings %TOTAL S.A. 4.6Vodafone Group 3.7Nestle 3.5Merck 3.3China Hongxing Sports 3.3Esprit 2.6Abbott Laboratories 2.6Sanofi-Aventis 2.6Chevron 2.3Imperial Tobacco Group 2.2
Geographical breakdown %United States of America 43.3United Kingdom 13.9France 10.0Hong Kong 5.9Switzerland 5.5China 4.5Netherlands 4.4Singapore 3.3South Africa 1.6Italy 1.4Greece 1.3Israel 1.0Australia 0.9South Korea 0.9Net other assets 2.1
Highest/lowest share price and distribution recordDistribution
Highest Lowest per shareCalendar year share price share price (net)
A-Class Accumulation SharesB
2008 52.34p 34.94p –
2009 63.15p 37.62p 0.66p
2010C 71.47p 61.53p 0.32p
A-Class Income SharesB
2008 52.34p 34.94p –
2009 62.22p 37.07p 0.66p
2010C 70.05p 60.61p 0.31p
C-Class Accumulation SharesD
2010C 104.5p 95.74p –
B A-Class Accumulation and A-Class Income Shares were launched on 7 April 2008.C To 31 July 2010.D C-Class Accumulation Shares were launched on 9 June 2010.
Portfolio turnover rate31.07.09 168.87%
31.07.10 91.89%
The portfolio turnover rate (PTR) reflects the total of security purchases and sales, less the total of shareissues and cancellations, expressed as a percentage of the average daily net asset values over the period.
Net asset values and Total expense ratiosNet assetvalue per Net asset Total
share class Number value per expenseDate £’000 of shares share ratio
A-Class Accumulation Shares
31.01.09 1,732 4,020,600 43.08p 1.67%
31.01.10 5,234 8,525,355 61.39p 1.68%
31.07.10 17,498 26,562,763 65.88p 1.68%
A-Class Income Shares
31.01.09E 1,307 3,077,685 42.45p 1.68%
31.01.10E 1,968 3,270,027 60.18p 1.68%
31.07.10 789 1,221,264 64.59p 1.68%
C-Class Accumulation Shares
31.07.10 14,429 14,329,564 100.7p 0.87%
E The Net asset value and the Net asset value per income share are shown ex-dividend at the financial year end.
The total expense ratio (TER) takes into account the ACD fee and any fixed expenses charged to revenue overthe financial period, expressed as a percentage of the average daily net asset values over the same period

46
ContinuationReturn to Index�
�
Market value Total netInvestment Holding £’000 assets %
Portfolio statementAs at 31 July 2010
United States of America – 43.3% (47.6%)Abbott Laboratories 27,076 851 2.6Abercrombie & Fitch ‘A’ 19,921 466 1.4ACE 9,138 311 1.0Airmedia Group ADS 79,466 171 0.5Analog Devices 18,317 350 1.1Baxter International 17,756 498 1.5Chevron 15,144 739 2.3China Security & Surveillance 123,633 462 1.4Cisco Systems 36,153 539 1.6Coach 14,244 333 1.0Coca-Cola 14,014 495 1.5CSX 9,874 333 1.0ExxonMobil 16,337 633 1.9Google ‘A’ 1,349 420 1.3Guess 27,723 632 1.9Hewlett Packard 16,198 482 1.5IBM 3,528 290 0.9MasterCard 3,678 492 1.5Medtronic 28,893 670 2.1Merck 48,366 1,088 3.3Microsoft 20,035 335 1.0Staples 36,204 461 1.4Tiffany & Co 24,271 647 2.0Time Warner 21,005 421 1.3VF 7,484 381 1.2Walt Disney 30,583 662 2.0Yum Brands 18,914 502 1.5Zimmer 16,039 537 1.6
United Kingdom – 13.9% (9.1%)Autonomy 20,348 334 1.0British American Tobacco 22,408 496 1.5GAME Group 568,058 407 1.3GlaxoSmithKline 46,589 521 1.6Imperial Tobacco Group 39,708 723 2.2Southern Cross Healthcare Group 1,156,717 367 1.1Unilever 27,361 498 1.5Vodafone Group 808,786 1,211 3.7
France – 10.0% (5.4%)LVMH 4,079 318 1.0PPR 6,702 570 1.8Sanofi-Aventis 22,532 834 2.6TOTAL S.A. 46,214 1,504 4.6
Hong Kong – 5.9% (6.4%)Esprit 216,267 863 2.6Heng Tai Consumables Group 2,625 – –HengAn International 1,000 6 –Oriental Watch 1,105,400 202 0.6Ports Design 272,000 448 1.4Renhe Commercial Holdings 1,840,000 252 0.8SinoMedia 912,000 158 0.5
Switzerland – 5.5% (6.5%)Compagnie Financiere Richemont ‘A’ 12,001 300 0.9Nestle 36,221 1,152 3.5Roche (Genusscheine) 4,294 359 1.1
China – 4.5% (2.7%)China Digital TV ADR 14,736 56 0.2Melco Crown Entertainment ADR 119,199 289 0.9Perfect World ADR 31,068 471 1.4VisionChina Media ADR 68,221 169 0.5Zhejiang Expressway ‘H’ 810,000 489 1.5
Market value Total netInvestment Holding £’000 assets %
Netherlands – 4.4% (4.3%)Reed Elsevier 85,269 705 2.2Wolters-Kluwer 55,164 718 2.2
Singapore – 3.3% (2.7%)Beauty China† 133,000 – –China Hongxing Sports 14,769,000 1,079 3.3
South Africa – 1.6% (1.4%)MTN Group 51,508 515 1.6
Italy – 1.4% (1.0%)Geox 124,122 440 1.4
Greece – 1.3% (1.8%)Folli Follie 29,058 431 1.3
Israel – 1.0% (1.1%)Teva Pharmaceutical Industries ADR 10,990 332 1.0
Australia – 0.9% (0.7%)Billabong International 58,054 302 0.9
South Korea – 0.9% (0.0%)LG Electronics 5,588 302 0.9
Investment assets 32,022 97.9
Net other assets 694 2.1
Net assets 32,716 100.0
Unless otherwise stated the above securities are admitted to official stock exchange listings or trade on aregulated market.
The comparative percentage figures in brackets are at 31 January 2010.
† Suspended security

47
ContinuationReturn to Index�
�
£’000
Total of all purchases for the period 35,931
Major purchases Cost
TOTAL S.A. 1,406Vodafone Group 1,031Merck 1,007Sanofi-Aventis 895Nestle 879China Hongxing Sports 874Abbott Laboratories 810Guess 711ExxonMobil 684Medtronic 683Esprit 649Tiffany & Co 644Chevron 641Melco Crown Entertainment ADR 630Imperial Tobacco Group 622Southern Cross Healthcare Group 588Abercrombie & Fitch ‘A’ 580Wolters-Kluwer 562Baxter International 562Perfect World 548
£’000
Total of all sales for the period 10,681
Major sales Proceeds
Kellogg 474Kroger 459Melco Crown Entertainment ADR 455Philip Morris International 384General Mills 369Hain Celestial Group 365America Movil ADR 365Wal-Mart Stores 332CVS Caremark 315Abercrombie & Fitch ‘A’ 286Dow Chemical 266American Express 256Procter & Gamble 252The Travelers Companies 245Intel 241China Digital TV ADR 237Verizon Communications 237Parkson Retail Group 227United Business Media 223Principal Financial Group 215
Portfolio movements For the six months ended 31 July 2010

48
Return to Index�
Financial statements
Statement of total return(Unaudited)
For the six months ended 31 July2010 2009
£’000 £’000 £’000 £’000
Income
Net capital (losses)/gains (202) 611
Revenue 285 53
Expenses (128) (28)
Net revenue before taxation 157 25
Taxation (30) (5)
Net revenue after taxation 127 20
Total return before distributions (75) 631
Finance costs: Distributions 23 –
Change in net assets attributable to shareholders from investment activities (52) 631
Statement of change in net assets attributable to shareholders(Unaudited)
For the six months ended 31 July2010 2009
£’000 £’000 £’000 £’000
Opening net assets attributable to shareholders 7,202 3,039
Amounts receivable on issue of shares 29,206 242
Amounts payable on cancellation of shares (3,637) (25)
25,569 217
Change in net assets attributable to shareholders from investment activities (see above) (52) 631
Stamp duty reserve tax (3) –
Closing net assets attributable to shareholders 32,716 3,887
As the comparatives in the above table are for the previous interim period, the Net assets at the end ofthat period will not agree to the Net assets at the start of the current period.
Balance sheet(Unaudited)
As at31 July 2010 31 January 2010
£’000 £’000 £’000 £’000
ASSETS
Investment assets 32,022 6,982
Debtors 5,559 530
Cash and bank balances – 69
Total other assets 5,559 599
Total assets 37,581 7,581
LIABILITIES
Creditors (3,970) (369)
Bank overdraft (895) –
Distribution payable on income shares – (10)
Total liabilities (4,865) (379)
Net assets attributable to shareholders 32,716 7,202
49
ContinuationReturn to Index�
�
JPM Global Equity Income Fund
Investment objective and policyTo provide a portfolio designed to achieve high and rising income by investingglobally, primarily in equities, in any economic sector whilst participatingin long-term capital growth.
Risk profileThis equity based Fund may include investments in emerging market equitiesand smaller companies. The Fund may be hedged back to Sterling whereappropriate, to mitigate currency risk.
Equity investment is subject to specific risks relating to the performance ofthe individual companies held and the market’s perception of theirperformance. Equities are also subject to systematic risks such as generaleconomic conditions, inflation, interest rates, foreign exchange rates andindustry sector risks. In general terms, equities tend to be more volatile than bonds.
As the Fund is primarily focused on generating income, the Fund may deviatefrom its benchmark.
This Fund charges the fees of the ACD against capital, which will increasethe amount of income available for distribution to Shareholders, but mayconstrain capital growth. It may also have tax implications for certain investors.
Fund review• Global equity markets had a volatile six months as the pace of the global
economic recovery moderated. Equity markets continued to benefit fromaccommodative monetary policy and positive earnings momentum.However, uncertainty surrounding the sovereign debt crisis in Europe andfiscal tightening in China prevented markets replicating the returns of theprevious six months.
• Against this backdrop, the Fund produced a positive return andoutperformed the benchmark. Stock selection in energy, retail andtransport services & consumer cyclicals contributed positively, while stockselection in capital markets and healthcare detracted. By region, stockselection in the emerging markets, Japan and North America contributedpositively, while Europe & the Middle East ex UK and Pacific ex Japandetracted.
• In recent quarters we have seen a number of companies in the portfolioincreasing dividends. These increases may indicate a culture of betterdividend payments as we move further into 2010. At this stage of thecycle, equity income funds offer an income premium versus other assetclasses. Our current 2010 dividend yield is around 4.5%. Clients who aresearching for income should use this period as an opportunity to looktowards dividend-orientated stocks, with a focus on defensive sectorstrading at attractive valuations.
Fund outlook• Despite the recent calm in sovereign debt markets, the fiscal problems facing
the peripheral eurozone countries have not been resolved. While it isencouraging that Greece and Spain have successfully started the processof retrenchment, the cyclical weakness in their economies, along with aresilient euro, pose formidable headwinds. Meanwhile, Federal Reserve
You should remember that past performance is not a guide to the future. The price of investments and the income from them may fall as well as rise andinvestors may not get back the full amount invested. For specific risks, please read the Simplified Prospectus.All performance returns are calculated using the quoted price of the accumulation or income shares. Performance returns are in Sterling.FX Adjusted returns have been calculated by JPMAM. Blended benchmarks have been calculated by JPMAM.Source: J.P. Morgan.A On 01/05/09 the benchmark for the Fund was changed from MSCI World Index (Total Return Net) to MSCI World Index Hedged into GBP (Total Return Net). Benchmark Source: MSCI. Neither MSCI nor any other party involved in or related to compiling, computing or creating the MSCI data makes any express of implied warranties or representations with respect to such data(or the results to be obtained by the use thereof), and all such parties hereby expressly disclaim all warranties of originality, accuracy, completeness, merchantability or fitness for a particular purpose with respect toany of such data. Without limiting any of the foregoing, in no event shall MSCI, any of its affiliates or any third party involved in or related to compiling computing or creating the data have any liability for any direct,indirect, special, punitive, consequential or any other damages (including lost profits) even if notified of the possibility of such damages. No further distribution or dissemination of the MSCI data is permitted withoutMSCI’s express written consent.
chairman Ben Bernanke has noted ‘unusual uncertainty’ in the US economyas unemployment and housing data continue to disappoint. These factors,combined with ongoing fears of sustained monetary tightening in China,mean the global economic outlook remains uncertain.
• Much will depend on continued private sector growth to offset retrenchmentin the public sector. After a strong start to the second-quarter reportingseason, investors will continue to monitor company guidance as we moveinto the second half.
Rolling 12 month performance as at 31 July2010/2009 2009/2008 2008/2007
JPM Global Equity Income A-Class Acc 12.4% -10.4% -14.5%
JPM Global Equity IncomeC-Class Inc 13.2% -9.8% –
JPM Global Equity IncomeX-Class Acc 14.1% -9.2% -13.9%
Benchmark IndexA 9.8% 0.8% -8.6%
Six month performance31/01/10–31/07/10
JPM Global Equity Income A-Class Acc 3.1%
Benchmark IndexA 1.8%
Fund statisticsFund size £105.4m
Benchmark IndexA MSCI World Hedged into GBP (Total Return Net)
Fund chargesA-Class Initial 4.25%, Annual 1.50%C-Class Initial Nil, Annual 0.75% X-Class On application
Top ten holdings %Royal Dutch Shell ‘A’ 2.6Merck 2.5Time Warner 2.5Zurich Financial Services 2.3Coca-Cola 2.1Unilever 2.1Du Pont de Nemours 2.0GDF Suez 2.0GlaxoSmithKline 1.9Abbott Laboratories 1.9

50
ContinuationReturn to Index�
�
Geographical breakdown %United States of America 31.5France 13.2United Kingdom 12.6Netherlands 5.6Australia 4.1China 3.7Switzerland 3.6Germany 2.8Spain 2.6Hong Kong 2.5Brazil 2.1Japan 1.9Indonesia 1.4Italy 1.4Taiwan 1.4Singapore 1.4Sweden 1.3Norway 0.9Austria 0.8South Africa 0.8Forward currency contracts 0.9Futures 0.0Net other assets 3.5
Highest/lowest share price and distribution recordDistribution
Highest Lowest per shareCalendar year share price share price (net)
A-Class Accumulation Shares
2007 53.79p 47.18p 1.35p
2008 51.36p 32.81p 1.81p
2009 44.13p 29.50p 1.59p
2010B 46.08p 40.78p 1.25p
A-Class Income Shares
2007 52.73p 46.85p 1.33p
2008 49.99p 30.88p 1.73p
2009 39.41p 27.34p 1.46p
2010B 40.92p 35.87p 1.10p
C-Class Income SharesC
2008 107.3p 71.49p 2.96p
2009 92.05p 63.42p 3.42p
2010B 95.76p 83.99p 2.68p
X-Class Accumulation Shares
2007 105.1p 93.36p 0.00p
2008 100.7p 65.00p 3.10p
2009 88.78p 58.74p 3.18p
2010B 93.14p 82.57p 2.66p
X-Class Income Shares
2007 105.1p 93.36p 0.00p
2008 100.7p 63.17p 3.06p
2009 81.91p 56.16p 2.99p
2010B 85.38p 74.93p 2.43p
B To 31 July 2010.C C-Class Income Shares were launched on 28 March 2008.
Portfolio turnover rate31.07.09 38.16%
31.07.10 51.06%
The portfolio turnover rate (PTR) reflects the total of security purchases and sales, less the total of shareissues and cancellations, expressed as a percentage of the average daily net asset values over the period.
Net asset values and Total expense ratiosNet assetvalue per Net asset Total
share class Number value per expenseDate £’000 of shares share ratio
A-Class Accumulation Shares
31.01.08 33,150 72,467,474 45.74p 1.63%
31.01.09 25,877 74,101,030 34.92p 1.67%
31.01.10 73,237 174,307,430 42.02p 1.66%
31.07.10 88,331 203,948,627 43.31p 1.68%
A-Class Income Shares
31.01.08 11,926 26,925,133 44.29p 1.65%
31.01.09 9,950 30,762,510 32.35p 1.64%
31.01.10 13,385 35,867,126 37.32p 1.66%
31.07.10 15,135 40,261,785 37.59p 1.68%
C-Class Income Shares
31.01.09 727 968,827 74.99p 0.87%
31.01.10 1,668 1,913,828 87.17p 0.87%
31.07.10 1,887 2,140,763 88.14p 0.87%
X-Class Accumulation Shares
31.01.08 18 20,000 89.50p 3.94%
31.01.09 19 28,000 69.42p 0.06%
31.01.10 5 6,000 84.65p 0.06%
31.07.10 5 6,000 87.96p 0.06%
X-Class Income Shares
31.01.08 18 20,000 89.50p 3.94%
31.01.09 19 29,000 66.34p 0.06%
31.01.10 5 7,000 77.60p 0.06%
31.07.10 6 7,000 78.74p 0.06%
The Net asset value and the Net asset value per income share are shown ex-dividend.
The total expense ratio (TER) takes into account the ACD fee and any fixed expenses charged to revenue overthe financial period, expressed as a percentage of the average daily net asset values over the same period.

51
ContinuationReturn to Index�
�
Market value Total netInvestment Holding £’000 assets %
Portfolio statementAs at 31 July 2010
United States of America – 31.5% (30.2%)Abbott Laboratories 63,345 1,991 1.9Altria Group 134,297 1,897 1.8Bristol-Myers Squibb 107,201 1,725 1.6Carnival 60,539 1,337 1.3Coca-Cola 63,937 2,257 2.1ConocoPhillips 41,374 1,448 1.4Du Pont de Nemours 81,928 2,131 2.0Frontier Communications ‘B’ 17,452 86 0.1IBM 16,399 1,347 1.3McDonald’s 38,835 1,730 1.6Merck 117,405 2,641 2.5Microsoft 91,228 1,524 1.5Paychex 52,783 885 0.8Pfizer 154,195 1,492 1.4Philip Morris International 46,502 1,528 1.5Sysco 82,768 1,636 1.6Time Warner 128,669 2,582 2.5Verizon Communications 85,331 1,581 1.5VF 28,717 1,461 1.4Xcel Energy 126,954 1,813 1.7
France – 13.2% (7.6%)AXA 162,115 1,890 1.8BNP Paribas 36,356 1,601 1.5Bouygues 36,423 990 0.9Compagnie de Saint-Gobain 52,811 1,438 1.4GDF Suez 96,638 2,064 2.0PPR 17,879 1,521 1.4Schneider Electric 23,036 1,699 1.6Sodexo 29,571 1,196 1.1TOTAL S.A. 47,376 1,542 1.5
United Kingdom – 12.6% (13.5%)British American Tobacco 79,646 1,764 1.7Centrica 521,709 1,610 1.5GlaxoSmithKline 179,838 2,011 1.9HSBC 265,796 1,747 1.7National Grid 300,282 1,566 1.5Royal Dutch Shell ‘A’ 154,140 2,734 2.6Vodafone Group 1,192,186 1,785 1.7
Netherlands – 5.6% (6.3%)KPN 201,055 1,791 1.7Philips Electronics 97,126 1,917 1.8Unilever 118,243 2,229 2.1
Australia – 4.1% (1.6%)MacQuarie Group 58,748 1,262 1.2QBE Insurance Group 205,344 1,981 1.9Tatts Group 761,340 1,073 1.0
China – 3.7% (0.0%)China Construction Bank ‘H’ 2,866,000 1,559 1.5CNOOC 1,292,000 1,393 1.3Zhejiang Expressway ‘H’ 1,650,000 997 0.9
Switzerland – 3.6% (3.9%)Roche (Genusscheine) 16,130 1,350 1.3Zurich Financial Services 15,892 2,375 2.3
Germany – 2.8% (4.2%)Daimler 57,790 1,987 1.9Siemens 15,906 997 0.9
Spain – 2.6% (2.3%)Banco Santander 181,124 1,517 1.4Telefonica 89,162 1,298 1.2
Hong Kong – 2.5% (6.3%)Hang Lung Properties 390,000 1,038 1.0Hutchison Whampoa 369,000 1,559 1.5
Brazil – 2.1% (2.6%)Cia Energetica Minas Gerais ADR Preference 122,365 1,197 1.1Vale ADR Preference 69,566 1,077 1.0
Japan – 1.9% (5.3%)Canon 70,500 1,968 1.9
Indonesia – 1.4% (0.0%)Telekomunikasi Indonesia ADS ‘B’ 65,378 1,527 1.4
Market value Total netInvestment Holding £’000 assets %
Italy – 1.4% (1.6%)ENI 114,236 1,491 1.4
Taiwan – 1.4% (2.5%)Taiwan Semiconductor Manufacturing ADS 226,478 1,480 1.4
Singapore – 1.4% (1.1%)Singapore Airlines 198,000 1,458 1.4
Sweden – 1.3% (1.4%)Hennes & Mauritz ‘B’ 66,586 1,337 1.3
Norway – 0.9% (1.0%)Marine Harvest 1,878,264 924 0.9
Austria – 0.8% (1.8%)Oesterreichische Post 52,054 884 0.8
South Africa – 0.8% (0.8%)African Bank Investments 284,935 828 0.8
Forward currency contracts – 0.9% (0.6%)Australian DollarForward foreign currency position
17/08/10 £4,165,987 4,166 4.0Forward foreign currency position
17/08/10 AUD (7,209,196) (4,158) (3.9)EuroForward foreign currency position
17/08/10 £26,285,563 26,286 24.9Forward foreign currency position
17/08/10 u(31,587,543) (26,370) (25.0)Forward foreign currency position
17/08/10 £2,133,493 2,133 2.0Forward foreign currency position
17/08/10 u(2,553,052) (2,131) (2.0)Forward foreign currency position
17/08/10 u719,117 600 0.6Forward foreign currency position
17/08/10 $(926,845) (595) (0.6)Forward foreign currency position
16/09/10 £519,008 519 0.5Forward foreign currency position
16/09/10 u(621,840) (519) (0.5)Hong Kong DollarForward foreign currency position
17/08/10 £3,987,223 3,987 3.8Forward foreign currency position
17/08/10 HKD (46,741,011) (3,864) (3.7)Forward foreign currency position
17/08/10 HKD 2,825,865 234 0.2Forward foreign currency position
17/08/10 $(363,610) (234) (0.2)Japanese YenForward foreign currency position
17/08/10 £1,394,531 1,395 1.3Forward foreign currency position
17/08/10 ¥(185,535,067) (1,378) (1.3)Norwegian KroneForward foreign currency position
17/08/10 £579,379 579 0.5Forward foreign currency position
17/08/10 NOK (5,550,794) (582) (0.6)Singapore DollarForward foreign currency position
17/08/10 £1,119,729 1,120 1.1Forward foreign currency position
17/08/10 SGD (2,335,394) (1,101) (1.0)Swedish KronaForward foreign currency position
17/08/10 £1,009,185 1,009 1.0Forward foreign currency position
17/08/10 SEK (11,408,309) (1,009) (1.0)Swiss FrancForward foreign currency position
17/08/10 £3,549,026 3,549 3.4Forward foreign currency position
17/08/10 CHF (5,682,605) (3,511) (3.3)

52
ContinuationReturn to Index�
�
Portfolio statement – continuedAs at 31 July 2010
Market value Total netInvestment Holding £’000 assets %
US DollarForward foreign currency position
17/08/10 £25,945,641 25,946 24.6Forward foreign currency position
17/08/10 $(39,257,330) (25,205) (23.9)Forward foreign currency position
17/08/10 $1,256,115 807 0.8Forward foreign currency position
17/08/10 £(824,035) (824) (0.8)
Futures – 0.0% (0.0%)DJ Euro Stoxx 50 Index Futures Sep 2010 27 14 –FTSE 100 Index Futures Sep 2010 10 7 –S&P 500 E-Mini Futures Sep 2010 49 21 –Topix Index Futures Sep 2010 6 – –
Investment assets 101,635 96.5
Net other assets 3,729 3.5
Net assets 105,364 100.0
Unless otherwise stated the above securities are admitted to official stock exchange listings or trade on aregulated market.
The comparative percentage figures in brackets are at 31 January 2010.

53
ContinuationReturn to Index�
�
£’000
Total of all purchases for the period 42,036
Major purchases Cost
QBE Insurance Group 2,556AXA 2,243Daimler 1,992Schneider Electric 1,757Carnival 1,643PPR 1,595Sysco 1,593IBM 1,584Telekomunikasi Indonesia ADS ‘B’ 1,545Philip Morris International 1,510ConocoPhillips 1,495Telefonica 1,181Sodexo 1,137Siemens 1,009Xcel Energy 908MacQuarie Group 888GDF Suez 794Du Pont de Nemours 779Time Warner 670Abbott Laboratories 640
£’000
Total of all sales for the period 29,481
Major sales Proceeds
MunichRe 2,523Sampo ‘A’ 1,522Nintendo 1,495Nokia 1,476Pfizer 1,405RWE ‘A’ 1,399PG&E 1,174Toyota Motor 1,148Caterpillar 1,118McDonald’s 1,053AT&T 1,001Astellas Pharma 970Occidental Petroleum 957China Shenhua Energy ‘H’ 932Chunghwa Telecom ADR 913Vale ADR Preference 858OMV 843Telefonica 744Man Group 581British American Tobacco 545
Portfolio movements For the six months ended 31 July 2010

54
Return to Index�
Financial statements
Statement of total return(Unaudited)
For the six months ended 31 July2010 2009
£’000 £’000 £’000 £’000
Income
Net capital gains 1,768 8,349
Revenue 2,504 2,157
Expenses (772) (453)
Net revenue before taxation 1,732 1,704
Taxation (267) (264)
Net revenue after taxation 1,465 1,440
Total return before distributions 3,233 9,789
Finance costs: Distributions (2,132) (1,775)
Change in net assets attributable to shareholders from investment activities 1,101 8,014
Statement of change in net assets attributable to shareholders(Unaudited)
For the six months ended 31 July2010 2009
£’000 £’000 £’000 £’000
Opening net assets attributable to shareholders 88,300 36,592
Amounts receivable on issue of shares 19,685 23,200
Amounts payable on cancellation of shares (5,626) (5,155)
14,059 18,045
Change in net assets attributable to shareholders from investment activities (see above) 1,101 8,014
Retained distributions on accumulation shares 1,908 1,458
Stamp duty reserve tax (4) (1)
Closing net assets attributable to shareholders 105,364 64,108
As the comparatives in the above table are for the previous interim period, the Net assets at the end ofthat period will not agree to the Net assets at the start of the current period.
Balance sheet(Unaudited)
As at31 July 2010 31 January 2010
£’000 £’000 £’000 £’000
ASSETS
Investment assets 101,739 86,540
Debtors 607 14,408
Cash and bank balances 3,497 1,637
Total other assets 4,104 16,045
Total assets 105,843 102,585
LIABILITIES
Investment liabilities (104) (273)
Creditors (144) (13,926)
Distribution payable on income shares (231) (86)
Total other liabilities (375) (14,012)
Total liabilities (479) (14,285)
Net assets attributable to shareholders 105,364 88,300

55
ContinuationReturn to Index�
�
JPM Global (ex-UK) Bond Fund
Investment objective and policyTo provide income with the prospect of capital growth from investmentanywhere in the world, in non-sterling denominated interest-bearing securitiesin any economic sector. The Fund is primarily hedged back into sterling.The Fund may invest up to 100% in government and public securities (seesection 3.10(e) of the full Prospectus).
Risk profileThis bond Fund invests primarily in a broad range of investment gradegovernment securities (outside the UK). The Fund may also invest in otherinterest bearing securities including non-investment grade bonds.
Bond funds may not behave like direct investments in the underlying bondsthemselves. By investing in bond funds, the certainty of receiving a regularfixed amount of income for a defined period of time with the prospect of afuture known return of capital is lost.
There is a lower risk of capital loss because the Fund invests primarily ininvestment grade bonds.
Bond prices can fluctuate significantly depending not only on the globaleconomic and interest rate conditions but also on the general credit marketenvironment and the creditworthiness of the issuer.
Bond funds will normally distribute a combination of coupon and the expecteddiscount/premium on the securities. Therefore, a fund’s distribution willcomprise income received and an element of projected capital gains orlosses. This could result in an element of capital gain being taxed as incomein the hands of an investor.
Fund review• The Euro area was the focus of attention in the period. Peripheral spreads
widened violently prior to the announcement of the EUR 750 billioneurozone/IMF rescue package, which briefly calmed the market beforerenewed risk aversion set in. Bunds benefited from the resultant flight toquality, as did Treasuries. Credit market volatility persisted throughoutthe period.
• The Fund underperformed its benchmark over the period. The maindetractor from performance was our allocation to non-government spreadsectors as spreads widened on risk aversion, leading to a significant flightto quality. The overweight allocations to investment grade corporates andemerging market debt were the main detractors. We chose to implementcurve and cross-market trades rather than take outright duration positions.With yield curves globally at historically steep levels, we profitably ran10s/30s flatteners in both Canada and the EU. Our US two-year/five-yearflattener also profited on both curve flattening and positive carry. Weare happy to maintain it as central banks remain on hold and investorsseek yield in a low inflation environment. The overweight Greece versusGermany ten-year trade underperformed as risk aversion intensified, andthis position was cut.
You should remember that past performance is not a guide to the future. The price of investments and the income from them may fall as well as rise andinvestors may not get back the full amount invested. For specific risks, please read the Simplified Prospectus.All performance returns are calculated using the quoted price of the accumulation shares. Performance returns are in Sterling.FX Adjusted returns have been calculated by JPMAM. Blended benchmarks have been calculated by JPMAM.Source: J.P. Morgan.
Fund outlook• While we believe that a prolonged period of sub-trend growth is likely,
keeping central banks on hold, it appears that risk aversion flows arerunning out of momentum. We remain positive on emerging markets, andare confident that net capital flows into this sector will continue. Withininvestment grade credit, the projected low growth and low rate environmentremains supportive for corporate credit quality.
Rolling 12 month performance as at 31 July2010/2009 2009/2008 2008/2007 2007/2006 2006/2005
JPM Global (ex-UK) BondA-Class Acc 6.2% -0.6% -0.5% 3.3% 0.1%
JPM Global (ex-UK) BondI-Class Acc 6.8% -0.3% 0.0% 3.8% 0.4%
Benchmark Index 6.2% 8.5% 7.6% 4.9% 1.4%
Six month performance31/01/10–31/07/10
JPM Global (ex-UK) Bond A-Class Acc 3.6%
Benchmark Index 4.1%
Fund statisticsFund size £58.0m
Benchmark Index JPMorgan GBI ex UK hedged in GBP
Fund chargesA-Class Initial 3.50%, Annual 0.75% I-Class Initial Nil, Annual 0.45%
Top ten holdings %Japan 1.5% 2014 5.5Japan 1.3% 2020 5.0US Treasury 2.5% 2015 4.6Japan 1.1% 2013 3.9Japan 1.9% 2023 3.6JPM Sterling Liquidity ‘X’ (Income) 3.1US Treasury 3.625% 2020 3.1Japan 1.2% 2012 2.8US Treasury 1.875% 2015 2.6Japan 0.8% 2013 2.0

56
ContinuationReturn to Index�
�
Sector breakdown %Government stock 83.2Corporate debt 13.4Liquidity 3.1Forward currency contracts 0.0Futures 0.0Net other assets 0.3
Highest/lowest share price and distribution recordHighest Lowest Distribution
Calendar year share price share price per share
A-Class Accumulation Shares
2005 197.3p 187.4p 3.94p
2006 202.1p 192.7p 4.31p
2007 207.3p 198.7p 5.14p
2008 209.3p 195.4p 5.73p
2009 206.0p 194.8p 4.04p
2010A 212.5p 203.6p 2.82p
A-Class Income Shares
2005 182.5p 175.3p 3.50p
2006 182.5p 175.6p 3.81p
2007 182.3p 177.2p 4.54p
2008 183.9p 167.0p 5.01p
2009 173.4p 164.4p 3.44p
2010A 176.6p 170.5p 2.41p
I-Class Accumulation Shares
2005 121.3p 115.0p 2.84p
2006 124.8p 118.7p 3.10p
2007 128.5p 122.9p 3.64p
2008 129.8p 121.5p 4.04p
2009 128.5p 121.4p 2.89p
2010A 132.9p 127.1p 2.29p
I-Class Gross Accumulation SharesB
2007 104.6p 99.68p 2.00p
2008 105.8p 99.65p 4.10p
2009 106.0p 99.93p 3.05p
2010A 109.9p 104.9p 2.36p
I-Class Income Shares
2005 113.1p 108.5p 2.69p
2006 113.2p 108.8p 2.86p
2007 112.9p 109.8p 3.26p
2008 114.0p 103.5p 3.54p
2009 107.5p 101.9p 2.45p
2010A 109.5p 105.7p 1.89p
A To 31 July 2010.B I-Class Gross Accumulation Shares were launched on 1 February 2007.
Portfolio turnover rate31.07.09 92.06%
31.07.10 88.69%
The portfolio turnover rate (PTR) reflects the total of security purchases and sales, less the total of shareissues and cancellations, expressed as a percentage of the average daily net asset values over the period.
Net asset values and Total expense ratiosNet assetvalue per Net asset Total
share class Number value per expenseDate £’000 of shares share ratio
A-Class Accumulation Shares
31.01.08 6,680 3,211,382 208.0p 0.94%
31.01.09 6,246 3,138,822 199.0p 0.93%
31.01.10 6,881 3,360,911 204.7p 0.93%
31.07.10 29,201 13,757,813 212.3p 0.93%
A-Class Income Shares
31.01.08 6,245 3,467,880 180.1p 0.94%
31.01.09 4,452 2,651,621 167.9p 0.93%
31.01.10 3,589 2,109,182 170.2p 0.93%
31.07.10 2,956 1,685,746 175.4p 0.93%
I-Class Accumulation Shares
31.01.08 192 148,929 129.0p 0.45%
31.01.09 161 130,022 123.8p 0.45%
31.01.10 166 129,933 127.8p 0.45%
31.07.10 89 67,193 132.8p 0.45%
I-Class Gross Accumulation Shares
31.01.08 24,074 22,900,239 105.1p 0.45%
31.01.09 18,090 17,781,341 101.7p 0.45%
31.01.10 17,421 16,508,176 105.5p 0.45%
31.07.10 25,508 23,219,133 109.9p 0.45%
I-Class Income Shares
31.01.08 11,184 10,037,949 111.4p 0.45%
31.01.09 380 365,799 103.9p 0.45%
31.01.10 278 264,163 105.3p 0.45%
31.07.10 287 264,163 108.6p 0.45%
The Net asset value and the Net asset value per income share are shown ex-dividend.
The total expense ratio (TER) takes into account the ACD fee and any fixed expenses charged to revenue overthe financial period, expressed as a percentage of the average daily net asset values over the same period.

57
ContinuationReturn to Index�
�
Portfolio statementAs at 31 July 2010
Market value Total netInvestment Holding £’000 assets %
Government stock – 83.2% (77.8%)Austria – 0.6%Austria 2% 2012 u500,000 326 0.6Brazil – 0.7%Brazil 7.875% 2015 BRL 500,000 387 0.7Belgium – 2.2%Belgium 4% 2013 u500,000 446 0.8Belgium 4% 2014 u310,000 278 0.5Belgium 4% 2018 u297,000 266 0.5Belgium 3.75% 2020 u150,000 130 0.2Belgium 4.25% 2041 u120,000 102 0.2Canada – 2.3%Canada 3.75% 2012 CAD 450,000 292 0.5Canada 3.75% 2019 CAD 400,000 261 0.5Canada 5.75% 2033 CAD 322,000 260 0.5Canada 5% 2037 CAD 650,000 489 0.8Denmark – 0.8%Denmark 4% 2017 DKK 3,750,000 463 0.8France – 4.6%France 3% 2014 u620,000 545 0.9France 3.75% 2017 u830,000 751 1.3France 3.5% 2020 u880,000 767 1.3France 5.5% 2029 u180,000 190 0.3France 5.75% 2032 u150,000 166 0.3France 4% 2060 u305,000 275 0.5Germany – 10.8%Germany 1.5% 2012 $300,000 195 0.3Germany 4% 2012 u1,230,000 1,083 1.9Germany 2.5% 2014 u45,000 39 0.1Germany 4.25% 2014 u577,000 530 0.9Germany 2.25% 2015 u1,180,000 1,010 1.7Germany 2.5% 2015 u545,000 472 0.8Germany 3.75% 2017 u725,000 664 1.1Germany 4.25% 2018 u610,000 575 1.0Germany 3% 2020 u300,000 257 0.4Germany 4.75% 2028 u550,000 547 1.0Germany 4.75% 2034 u906,000 920 1.6Italy – 7.7%Italy 2% 2013 u850,000 707 1.2Italy 3.75% 2013 u1,042,000 908 1.6Italy 5.25% 2017 u790,000 738 1.3Italy 4.5% 2019 u382,000 337 0.6Italy 4% 2020 u900,000 755 1.3Italy 4.25% 2020 u592,000 509 0.9Italy 5% 2025 u500,000 442 0.8Japan – 27.1%Japan 1.2% 2012 ¥213,800,000 1,615 2.8Japan 0.8% 2013 ¥150,000,000 1,132 2.0Japan 1.1% 2013 ¥297,000,000 2,268 3.9Japan 1.5% 2014 ¥410,000,000 3,196 5.5Japan 1.3% 2020 ¥381,000,000 2,901 5.0Japan 1.9% 2023 ¥265,000,000 2,089 3.6Japan 1.9% 2025 ¥51,000,000 398 0.7Japan 2% 2030 ¥105,000,000 812 1.4Japan 2.5% 2035 ¥84,000,000 708 1.2Japan 2.3% 2039 ¥60,000,000 490 0.8Japan 2.4% 2048 ¥17,000,000 140 0.2Mexico – 0.9%Mexico 8% 2013 MXN 10,000,000 543 0.9Netherlands – 1.5%Netherlands 3.75% 2014 u145,000 131 0.2Netherlands 4% 2018 u707,000 649 1.1Netherlands 3.75% 2042 u125,000 109 0.2Qatar – 1.0%Qatar 4% 2015 QAR 650,000 432 0.7Qatar 5.15% 2015 QAR 210,000 146 0.3Russia – 1.0%Russian Federation FRN 2030 RUB 745,200 554 1.0Spain – 2.9%Spain 4.2% 2013 u950,000 834 1.4Spain 4% 2020 u355,000 292 0.5Spain 4.85% 2020 u593,000 519 0.9Spain 4.7% 2041 u104,000 81 0.1
Market value Total netInvestment Holding £’000 assets %
Sweden – 0.7%Sweden 5.5% 2012 SEK 3,730,000 358 0.6Sweden 4.25% 2019 SEK 500,000 50 0.1United States Of America – 18.4%US Treasury 0.625% 2012 $650,000 418 0.7US Treasury 1.875% 2015 $2,350,000 1,528 2.6US Treasury 2.5% 2015 $4,000,000 2,682 4.6US Treasury 3.125% 2016 $680,000 461 0.8US Treasury 4% 2018 $1,430,000 1,016 1.8US Treasury 3.125% 2019 $1,102,000 726 1.3US Treasury 3.625% 2020 $2,620,000 1,777 3.1US Treasury 6.25% 2030 $720,000 618 1.1US Treasury 5.375% 2031 $1,046,000 816 1.4US Treasury 4.5% 2038 $500,000 346 0.6US Treasury 4.375% 2039 $350,000 237 0.4
Corporate debt – 13.4% (17.7%)Australia – 0.5%Westpac Banking 3.25% 2011 $400,000 265 0.5Austria – 1.7%Autobahnen-UND Schnellstr 4.125% 2014 u1,083,000 969 1.7Denmark – 0.2%Spar Nord Bank 2.5% 2012 u150,000 127 0.2France – 1.5%Compagnie de Financement Foncier
1.25% 2011 ¥41,000,000 306 0.5Societe De Fin 2.125% 2012 u700,000 594 1.0Germany – 0.5%KFW 6.25% 2012 AUD 500,000 294 0.5Italy – 0.7%Buoni Poliennali del Tesoro 4% 2037 u565,000 417 0.7Netherlands – 1.3%Fortis Bank Nederland 3% 2012 u450,000 386 0.7ING Groep FRN 2011 u400,000 330 0.6Spain – 0.9%Fund For Ordered 3% 2014 u300,000 244 0.4Instituto de Credito Oficial 5.5% 2012 AUD 550,000 307 0.5Sweden – 0.4%Swedbank 3.125% 2012 u300,000 257 0.4United Kingdom – 2.6%Anglo 5.875% 2015 u350,000 324 0.6National Grid Electricity 6.625% 2014 u300,000 285 0.5Nationwide Building Society 2.5% FRN 2012 $560,000 368 0.6Permanent Financing No.8 4A FRN 2032 u400,000 332 0.6Royal Bank of Scotland 2.625% 2012 $300,000 198 0.3Themeleion Mortgage Finance FRN 2040 u44,576 29 –United States Of America – 3.1%Bank of America 4.625% 2014 u170,000 148 0.3Citigroup 6.5% 2013 $390,000 273 0.5CitiMortgage Alternative Loan Trust
2006-A1 IA5 5.5% 2036 $147,470 74 0.1General Electric Capital 2% 2017 ¥100,000,000 744 1.3Goldman Sachs Group 5.125% 2019 u150,000 128 0.2Morgan Stanley 4.2% 2014 $430,000 281 0.5Verizon Wireless Capital 5.5% 2014 $200,000 145 0.2
Liquidity – 3.1% (0.0%)JPM Sterling Liquidity ‘X’ (Income) £1,820,000 1,820 3.1
Forward currency contracts – 0.0% (2.7%)Australian DollarForward foreign currency position
03/08/10 £605,717 606 1.0Forward foreign currency position
03/08/10 AUD (1,066,185) (616) (1.1)Forward foreign currency position
01/09/10 AUD 198,886 115 0.2Forward foreign currency position
01/09/10 £(115,087) (115) (0.2)Forward foreign currency position
01/09/10 £610,169 610 1.1Forward foreign currency position
01/09/10 AUD (1,066,185) (614) (1.1)
58
ContinuationReturn to Index�
�
Market value Total netInvestment Holding £’000 assets %
Market value Total netInvestment Holding £’000 assets %
Portfolio statement – continuedAs at 31 July 2010
Canadian DollarForward foreign currency position
03/08/10 £1,077,527 1,078 1.9Forward foreign currency position
03/08/10 CAD(1,676,586) (1,044) (1.8)Forward foreign currency position
03/08/10 £154,874 155 0.3Forward foreign currency position
03/08/10 CAD(250,000) (156) (0.3)Forward foreign currency position
01/09/10 £1,197,410 1,197 2.1Forward foreign currency position
01/09/10 CAD(1,926,586) (1,199) (2.1)Danish KroneForward foreign currency position
03/08/10 £185,058 185 0.3Forward foreign currency position
03/08/10 DKK (1,639,470) (184) (0.3)Forward foreign currency position
03/08/10 £267,163 267 0.5Forward foreign currency position
03/08/10 DKK (2,452,296) (275) (0.5)Forward foreign currency position
01/09/10 £459,328 459 0.8Forward foreign currency position
01/09/10 DKK (4,091,766) (458) (0.8)EuroForward foreign currency position
03/08/10 £7,372,852 7,373 12.7Forward foreign currency position
03/08/10 u(8,765,000) (7,317) (12.6)Forward foreign currency position
03/08/10 u169,712 142 0.2Forward foreign currency position
03/08/10 £(142,159) (142) (0.2)Forward foreign currency position
03/08/10 £12,667,135 12,667 21.8Forward foreign currency position
03/08/10 u(15,624,241) (13,042) (22.5)Forward foreign currency position
01/09/10 £21,046,505 21,047 36.3Forward foreign currency position
01/09/10 u(25,179,529) (21,021) (36.2)Forward foreign currency position
01/09/10 £502,597 503 0.9Forward foreign currency position
01/09/10 u(602,461) (503) (0.9)Japanese YenForward foreign currency position
03/08/10 £17,026,981 17,027 29.3Forward foreign currency position
03/08/10 ¥(2,263,085,194) (16,803) (29.0)Forward foreign currency position
01/09/10 £16,614,836 16,615 28.6Forward foreign currency position
01/09/10 ¥(2,263,085,194) (16,810) (29.0)Swedish KronaForward foreign currency position
03/08/10 £233,212 233 0.4Forward foreign currency position
03/08/10 SEK (2,741,070) (242) (0.4)Forward foreign currency position
01/09/10 SEK 1,622,691 144 0.2Forward foreign currency position
01/09/10 £(143,413) (143) (0.2)Forward foreign currency position
01/09/10 £241,685 242 0.4Forward foreign currency position
01/09/10 SEK (2,741,070) (243) (0.4)
US DollarForward foreign currency position
03/08/10 £14,433,009 14,433 24.9Forward foreign currency position
03/08/10 $(21,853,795) (14,030) (24.2)Forward foreign currency position
03/08/10 $276,901 177 0.3Forward foreign currency position
03/08/10 £(183,442) (183) (0.3)Forward foreign currency position
01/09/10 £289,112 289 0.5Forward foreign currency position
01/09/10 $(450,000) (289) (0.5)Forward foreign currency position
01/09/10 £13,795,968 13,796 23.8Forward foreign currency position
01/09/10 $(21,576,893) (13,854) (23.9)
Futures – 0.0% (0.0%)Australia 3 Year Bond Futures Sep 2010 (4) (2) –Australia 10 Year Bond Futures Sep 2010 3 1 –Canada 10 Year Bond Futures Sep 2010 (11) (8) –Euro BOBL Futures Sep 2010 (34) (4) –Euro Bund Futures Sep 2010 (8) (4) –Euro-BTP Futures Sep 2010 4 14 –Euro-Schatz Futures Sep 2010 (4) 1 –Japan 10 Year Bond Futures Sep 2010 13 12 –US 2 Year Note Futures Sep 2010 (18) (12) –US 5 Year Note Futures Sep 2010 11 – –US 10 Year Note Futures Sep 2010 28 18 –
Investment assets 57,892 99.7
Net other assets 149 0.3
Net assets 58,041 100.0
Unless otherwise stated the above securities are admitted to official stock exchange listings or trade on aregulated market.
The comparative percentage figures in brackets are at 31 January 2010.
Market value Portfolio credit ratings £’000
AAA 27,095 AA+ 1,966 AA 14,893 A+ 8,525 A 1,876 A- 285 BBB 878 BBB- 387CCC 74
Total bonds 55,979
Liquidity funds 1,820Futures 16Forward currency contracts 77
Investment assets 57,892

59
ContinuationReturn to Index�
�
£’000
Total of all purchases for the period 46,745
Major purchases Cost
JPM Sterling Liquidity ‘X’ (Income) 7,325Japan 1.5% 2014 3,176Japan 1.3% 2020 2,818US Treasury 2.5% 2015 2,664US Treasury 3.625% 2020 1,762US Treasury 1.875% 2015 1,533Japan 0.8% 2013 1,101Germany 2.25% 2015 1,016France 4.75% 2012 978Autobahnen-UND Schnellstr 4.125% 2014 969Germany 4% 2012 838Spain 4.2% 2013 824Japan 2% 2030 802Italy 4% 2020 758France 3.5% 2020 758France 3.75% 2017 744Japan 1.9% 2023 736Italy 2% 2013 705Canada 5% 2037 629US Treasury 6.25% 2030 625
£’000
Total of all sales for the period 17,453
Major sales Proceeds
JPM Sterling Liquidity ‘X’ (Income) 5,505France 4.75% 2012 949Germany 1.5% 2012 795MBNA Master Credit Card 5.6% 2014 633Germany 4.25% 2018 544Japan 1.2% 2012 538Germany 3.5% 2013 535France 4.5% 2041 529Poland 5.75% 2014 465Germany 2.25% 2014 446Belgium 4% 2018 418Germany 3.25% 2020 404Spain 4.25% 2014 391Germany 3.5% 2016 370France 3% 2014 351General Electric Capital 2% 2017 346Japan 1.5% 2018 340Germany 4.25% 2039 337Japan 1.1% 2013 298Spain 4% 2020 278
Portfolio movements For the six months ended 31 July 2010

60
Return to Index�
Financial statements
Statement of total return(Unaudited)
For the six months ended 31 July2010 2009
£’000 £’000 £’000 £’000
Income
Net capital gains/(losses) 1,030 (104)
Revenue 423 410
Expenses (109) (89)
Net revenue before taxation 314 321
Taxation – –
Net revenue after taxation 314 321
Total return before distributions 1,344 217
Finance costs: Distributions (313) (319)
Change in net assets attributable to shareholders from investment activities 1,031 (102)
Statement of change in net assets attributable to shareholders(Unaudited)
For the six months ended 31 July2010 2009
£’000 £’000 £’000 £’000
Opening net assets attributable to shareholders 28,335 29,329
Amounts receivable on issue of shares 31,482 4,027
Amounts payable on cancellation of shares (3,240) (3,504)
28,242 523
Change in net assets attributable to shareholders from investment activities (see above) 1,031 (102)
Retained distributions on accumulation shares 433 269
Closing net assets attributable to shareholders 58,041 30,019
As the comparatives in the above table are for the previous interim period, the Net assets at the end ofthat period will not agree to the Net assets at the start of the current period.
Balance sheet(Unaudited)
As at31 July 2010 31 January 2010
£’000 £’000 £’000 £’000
ASSETS
Investment assets 58,591 27,941
Debtors 54,459 27,382
Cash and bank balances 368 320
Total other assets 54,827 27,702
Total assets 113,418 55,643
LIABILITIES
Investment liabilities (699) (104)
Creditors (54,657) (27,174)
Distribution payable on income shares (21) (30)
Total other liabilities (54,678) (27,204)
Total liabilities (55,377) (27,308)
Net assets attributable to shareholders 58,041 28,335

61
ContinuationReturn to Index�
�
JPM Global Financials Fund
Investment objective and policyTo provide capital growth over the long-term by investing throughout theworld primarily in financial services sectors.
Risk profileThis specialist equity based Fund focuses on one sector of the global stockmarket (and may include exposure to emerging markets and smallercompanies).
Equity investment is subject to specific risks relating to the performance ofthe individual companies held and the market’s perception of theirperformance. Equities are also subject to systematic risks such as generaleconomic conditions, inflation, interest rates, foreign exchange rates andindustry sector risks. In general terms, equities tend to be more volatile than bonds.
Funds that invest predominantly in a single market, asset class or sectormay be subject to greater volatility than those funds with a more diversifiedportfolio.
The underlying assets of the Fund are denominated in currencies other thanSterling and are not hedged back to Sterling. Investors will therefore beexposed to the currency risk of fluctuations between Sterling and the currencydenomination of the underlying assets.
Fund review• The period under review was one of high volatility for global equity markets,
as the pace of the global economic recovery moderated. Equity marketscontinued to benefit from accommodative monetary policy and positivecorporate earnings momentum. However, uncertainty surrounding thesovereign debt crisis in Europe and fiscal tightening in China preventedmarkets replicating the returns of the previous six months.
• Against this backdrop, the Fund produced positive returns andoutperformed the benchmark. Stock selection in regional banks contributedpositively to performance, while stock selection in capital marketsdetracted. On a regional basis, stock selection in the UK and emergingmarkets contributed positively to performance while Europe & the MiddleEast ex UK and Pacific ex Japan detracted.
Fund outlook• Despite the recent calm in sovereign debt markets, the fundamental fiscal
problems facing the peripheral countries in Europe have not been resolved.While it is encouraging that both Greece and Spain have successfullystarted the process of retrenchment, there is a long way to go, and thecyclical weakness in their economies, along with a resilient Euro, still poseformidable headwinds for their rebalancing efforts in the longer term.Across the Atlantic, Ben Bernanke, chairman of the Federal Reserve, hasnoted ‘unusual uncertainty’ in the US economy as unemployment andhousing data continue to disappoint. These factors, combined with ongoingfears of sustained monetary tightening in China, mean the global economicoutlook remains uncertain.
You should remember that past performance is not a guide to the future. The price of investments and the income from them may fall as well as rise andinvestors may not get back the full amount invested. For specific risks, please read the Simplified Prospectus.All performance returns are calculated using the quoted price of the accumulation shares. Performance returns are in Sterling.FX Adjusted returns have been calculated by JPMAM. Blended benchmarks have been calculated by JPMAM.Source: J.P. Morgan.Benchmark Source: MSCI. Neither MSCI nor any other party involved in or related to compiling, computing or creating the MSCI data makes any express of implied warranties or representations with respect to such data(or the results to be obtained by the use thereof), and all such parties hereby expressly disclaim all warranties of originality, accuracy, completeness, merchantability or fitness for a particular purpose with respect toany of such data. Without limiting any of the foregoing, in no event shall MSCI, any of its affiliates or any third party involved in or related to compiling computing or creating the data have any liability for any direct,indirect, special, punitive, consequential or any other damages (including lost profits) even if notified of the possibility of such damages. No further distribution or dissemination of the MSCI data is permitted withoutMSCI’s express written consent.
• Much will depend on continued private sector growth to offset retrenchmentin the public sector. After a strong start to the second-quarter reportingseason, investors will continue to monitor private sector health andcompany guidance as we move into the second half of the year.
Rolling 12 month performance as at 31 July2010/2009 2009/2008 2008/2007 2007/2006 2006/2005
JPM Global Financials A-Class Acc 12.7% -19.7% -24.8% 9.8% 14.2%
Benchmark Index 13.6% -16.8% -24.2% 2.5% 14.5%
Six month performance31/01/10–31/07/10
JPM Global Financials A-Class Acc 6.2%
Benchmark Index 5.3%
Fund statisticsFund size £137.1m
Benchmark Index MSCI World Financials (Total Return Net)
Fund charges Initial 4.25%, Annual 1.50%
Top ten holdings %Templeton Emerging Markets Investment Trust 7.7China Life Insurance ‘H’ 4.0Itau Unibanco Multiplo ADR Preference 3.7Royal Bank of Canada 2.5Bank of Montreal 2.4ACE 2.4Banco Bilbao Vizcaya Argentaria 2.3Prudential Financial 2.3BNP Paribas 2.3Hartford Financial Services Group 2.2

62
ContinuationReturn to Index�
�
Geographical breakdown %United States of America 24.8United Kingdom 21.7France 8.1China 6.1Canada 6.0Spain 4.3Brazil 3.7Australia 3.2Japan 2.7Switzerland 2.5Turkey 2.5Germany 2.0Russia 1.9Netherlands 1.8Indonesia 1.6India 1.5Cyprus 1.4Italy 1.2Ireland 0.8Greece 0.6Sweden 0.5Mexico 0.5Net other assets 0.6
Highest/lowest share price and distribution recordDistribution
Highest Lowest per shareCalendar year share price share price (net)
A-Class Accumulation Shares
2005 746.1p 578.7p 7.61p
2006 848.9p 696.4p 8.36p
2007 899.1p 729.8p 7.74p
2008 788.5p 341.5p 11.55p
2009 610.9p 276.2p 17.59p
2010A 626.5p 510.7p 4.99p
A-Class Income SharesB
2007 54.22p 45.89p –
2008 49.58p 21.44p 0.07p
2009 36.59p 16.54p 1.11p
2010A 37.16p 30.29p 0.30p
A To 31 July 2010.B A-Class Income Shares were launched on 1 September 2007.
Portfolio turnover rate31.07.09 17.18%
31.07.10 0.16%
The portfolio turnover rate (PTR) reflects the total of security purchases and sales, less the total of shareissues and cancellations, expressed as a percentage of the average daily net asset values over the period.
Net asset values and Total expense ratiosNet assetvalue per Net asset Total
share class Number value per expenseDate £’000 of shares share ratio
A-Class Accumulation Shares
31.01.08 207,900 30,011,698 692.7p 1.66%
31.01.09 103,149 27,999,273 368.4p 1.68%
31.01.10 132,596 25,230,201 525.5p 1.67%
31.07.10 133,597 23,944,338 557.9p 1.68%
A-Class Income Shares
31.01.08C 1,966 4,520,713 43.50p 1.68%
31.01.09C 1,574 7,144,108 22.04p 1.68%
31.01.10C 3,536 11,341,855 31.18p 1.67%
31.07.10 3,529 10,663,458 33.10p 1.68%
C The Net asset value and the Net asset value per income share are shown ex-dividend at the financial year end.
The total expense ratio (TER) takes into account the ACD fee and any fixed expenses charged to revenue overthe financial period, expressed as a percentage of the average daily net asset values over the same period.

63
ContinuationReturn to Index�
�
Portfolio statementAs at 31 July 2010
Market value Total netInvestment Holding £’000 assets %
United States of America – 24.8% (23.5%)ACE 95,000 3,231 2.4American Capital Strategies 375,000 1,281 0.9American Express 55,000 1,573 1.1Aon 50,000 1,176 0.9Bank of America 300,000 2,698 2.0Bank of New York Mellon 122,925 1,993 1.5Chubb 37,000 1,255 0.9Goldman Sachs Group 30,000 2,937 2.1Hartford Financial Services Group 205,000 3,064 2.2MBIA 144,500 808 0.6Metlife 80,000 2,065 1.5PNC Financial Services Group 25,000 956 0.7Prosperity Bancshares 120,000 2,588 1.9Protective Life 100,000 1,433 1.0Prudential Financial 87,104 3,132 2.3US Bancorp 77,500 1,191 0.9Wells Fargo 150,000 2,665 1.9
United Kingdom – 21.7% (20.1%)Ambrian CapitalB 2,000,000 465 0.3Aviva 550,000 1,995 1.5Barclays 873,000 2,909 2.1Caledonia Investments 100,000 1,611 1.2Close Brothers Group 200,000 1,356 1.0Corvus CapitalB 6,666,666 7 – ICAP 680,000 2,755 2.0Investec 300,000 1,492 1.1Land Securities 100,000 613 0.5Man Group 965,000 2,122 1.5Prudential 200,000 1,123 0.8Standard Chartered 150,000 2,803 2.0Templeton Emerging Markets Investment Trust 1,900,000 10,545 7.7
France – 8.1% (9.3%)AXA 217,418 2,535 1.9BNP Paribas 70,500 3,105 2.3CNP Assurances 140,000 1,804 1.3Credit Agricole 148,000 1,295 0.9Societe Generale 63,750 2,362 1.7
China – 6.1% (5.9%)China Life Insurance ‘H’ 1,933,029 5,505 4.0Industrial & Commercial Bank of China ‘H’ 6,000,000 2,941 2.1
Canada – 6.0% (5.3%)Bank of Montreal 84,000 3,270 2.4Royal Bank of Canada 100,000 3,359 2.5Sun Life Financial 80,000 1,445 1.1
Spain – 4.3% (5.2%)Banco Bilbao Vizcaya Argentaria 370,000 3,203 2.3Banco Santander 324,395 2,717 2.0
Brazil – 3.7% (3.7%)Itau Unibanco Multiplo ADR Preference 358,000 5,125 3.7
Australia – 3.2% (5.1%)ASX 120,000 2,000 1.5Australia & New Zealand Bank Group 100,000 1,328 1.0MacQuarie Group 47,500 1,021 0.7
Japan – 2.7% (2.8%)Fukuoka Financial Group 325,000 869 0.6Mitsubishi UFJ Financial Group 175,000 556 0.4NKSJ Holdings 360,000 1,347 1.0Nomura 150,000 536 0.4Sumitomo Mitsui Financial Group 22,500 447 0.3
Market value Total netInvestment Holding £’000 assets %
Switzerland – 2.5% (3.3%)Credit Suisse 60,000 1,778 1.3EFG International 60,000 441 0.3Zurich Financial Services 8,250 1,233 0.9
Turkey – 2.5% (2.5%)Akbank T.A.S. 611,107 2,127 1.5Akbank T.A.S. ADR 90,000 647 0.5Turkiye Vakiflar Bankasi ‘D’ 390,930 677 0.5
Germany – 2.0% (2.1%)Deutsche Bank 60,500 2,712 2.0
Russia – 1.9% (2.0%)Sberbank Rossii GDR 14,000 2,589 1.9
Netherlands – 1.8% (1.0%)ING Groep 400,000 2,498 1.8
Indonesia – 1.6% (1.1%)Bank Mandiri (Persero) 5,000,000 2,134 1.6
India – 1.5% (1.1%)HDFC Bank ADR 20,000 2,061 1.5
Cyprus – 1.4% (1.7%)Bank of Cyprus 230,000 799 0.6Marfin Popular Bank 700,000 1,052 0.8
Italy – 1.2% (1.4%)Intesa Sanpaolo 800,000 1,706 1.2
Ireland – 0.8% (0.1%)Allied Irish Banks 180,000 140 0.1Bank of Ireland 1,500,000 1,010 0.7
Greece – 0.6% (0.8%)Bank of Piraeus 195,000 815 0.6
Sweden – 0.5% (0.3%)Swedbank Non-Cumulative Preference 85,000 628 0.5
Mexico – 0.5% (0.4%)Grupo Financiero Banorte ‘O’ 250,000 623 0.5
Investment assets 136,282 99.4
Net other assets 844 0.6
Net assets 137,126 100.0
Unless otherwise stated the above securities are admitted to official stock exchange listings or trade on aregulated market.
The comparative percentage figures in brackets are at 31 January 2010.B Quoted on Alternative Investment Market

64
ContinuationReturn to Index�
�
£’000
Total of all purchases for the period 2,530
Major purchases Cost
Bank of Ireland 1,056ING Groep 1,054Prudential 439ACE (19)
£’000
Total of all sales for the period 8,096
Major sales Proceeds
MacQuarie Group 1,107Credit Suisse 936Standard Chartered 870CNP Assurances 868Itau Unibanco Multiplo ADR Preference 820Banco Santander 751Akbank T.A.S. ADR 656Deutsche Bank 562AMP 533Australia & New Zealand Bank Group 425Zurich Financial Services 403Bank of Cyprus 135Newland Resources 30
Portfolio movements For the six months ended 31 July 2010

65
Return to Index�
Financial statements
Statement of total return(Unaudited)
For the six months ended 31 July2010 2009
£’000 £’000 £’000 £’000
Income
Net capital gains 7,451 33,673
Revenue 2,419 2,607
Expenses (1,200) (943)
Net revenue before taxation 1,219 1,664
Taxation (175) (163)
Net revenue after taxation 1,044 1,501
Total return before distributions 8,495 35,174
Finance costs: Distributions (29) (28)
Change in net assets attributable to shareholders from investment activities 8,466 35,146
Statement of change in net assets attributable to shareholders(Unaudited)
For the six months ended 31 July2010 2009
£’000 £’000 £’000 £’000
Opening net assets attributable to shareholders 136,132 104,723
Amounts receivable on issue of shares 1,925 3,032
Amounts payable on cancellation of shares (9,392) (7,128)
(7,467) (4,096)
Change in net assets attributable to shareholders from investment activities (see above) 8,466 35,146
Stamp duty reserve tax (5) (7)
Closing net assets attributable to shareholders 137,126 135,766
As the comparatives in the above table are for the previous interim period, the Net assets at the end ofthat period will not agree to the Net assets at the start of the current period.
Balance sheet(Unaudited)
As at31 July 2010 31 January 2010
£’000 £’000 £’000 £’000
ASSETS
Investment assets 136,282 134,396
Debtors 388 2,069
Cash and bank balances 777 1,250
Total other assets 1,165 3,319
Total assets 137,447 137,715
LIABILITIES
Creditors (321) (1,549)
Distribution payable on income shares – (34)
Total liabilities (321) (1,583)
Net assets attributable to shareholders 137,126 136,132

66
ContinuationReturn to Index�
�
JPM Global Fund
Investment objective and policyTo provide capital growth over the long-term by investing throughout theworld in any economic sector.
Risk profileThis equity based Fund is designed to give broad market exposure to globalstock markets (which may include investment in emerging markets andsmaller companies).
Equity investment is subject to specific risks relating to the performance ofthe individual companies held and the market’s perception of theirperformance. Equities are also subject to systematic risks such as generaleconomic conditions, inflation, interest rates, foreign exchange rates andindustry sector risks. In general terms, equities tend to be more volatile than bonds.
The underlying assets of the Fund are denominated in currencies other thanSterling and are not hedged back to Sterling. Investors will therefore beexposed to the currency risk of fluctuations between Sterling and the currencydenomination of the underlying assets.
Fund review• The six months to the end of July was a period of high volatility for global
equity markets. Throughout the period, equity markets continued tobenefit from accommodative monetary policy and companies sustainedpositive earnings momentum. However, uncertainty surrounding thesovereign debt crisis in Europe and fiscal tightening in China preventedmarkets from replicating the returns of the previous half year.
• Against this uncertain backdrop the Fund produced positive returns butmoderately underperformed the benchmark. Stock selection in financials,consumer discretionary and telecoms contributed positively toperformance, while stock selection in materials, health care and energydetracted. On a regional basis, stock selection in the UK and emergingmarkets contributed positively to performance while Europe and theMiddle East ex-UK and Pacific ex Japan detracted.
• Although there is ample evidence that economic growth is moderatingfollowing a sharp rebound in activity, it remains our view that the prospectof a material and sustained slowdown is low. Therefore, we have usedrecent market volatility to reinforce a number of existing positions at whatwe view as exceptionally low valuations. We believe that the risk rewardprofile for stocks in the portfolio remains positive.
Fund outlook• Despite the recent calm in sovereign debt markets, the fundamental fiscal
problems facing the peripheral countries in Europe have not been resolved.Although it is encouraging that Greece and Spain have successfully startedthe process of retrenchment, they have a long way to go and the cyclicalweakness in their economies coupled with a resilient Euro pose formidableheadwinds for their rebalancing efforts in the long-term.
You should remember that past performance is not a guide to the future. The price of investments and the income from them may fall as well as rise andinvestors may not get back the full amount invested. For specific risks, please read the Simplified Prospectus.All performance returns are calculated using the quoted price of the accumulation shares. Performance returns are in Sterling.FX Adjusted returns have been calculated by JPMAM. Blended benchmarks have been calculated by JPMAM.Source: J.P. Morgan.Benchmark Source: MSCI. Neither MSCI nor any other party involved in or related to compiling, computing or creating the MSCI data makes any express of implied warranties or representations with respect to such data(or the results to be obtained by the use thereof), and all such parties hereby expressly disclaim all warranties of originality, accuracy, completeness, merchantability or fitness for a particular purpose with respect toany of such data. Without limiting any of the foregoing, in no event shall MSCI, any of its affiliates or any third party involved in or related to compiling computing or creating the data have any liability for any direct,indirect, special, punitive, consequential or any other damages (including lost profits) even if notified of the possibility of such damages. No further distribution or dissemination of the MSCI data is permitted withoutMSCI’s express written consent.
• Disappointing unemployment and housing data in the US, and fears ofsustained monetary tightening in China also contributed to investoruncertainty over the global economic outlook. Much will depend on theprivate sector continuing to grow in order to offset retrenchment in thepublic sector. Following a strong start to the second-quarter reportingseason, investors will continue to monitor private sector health andcompany guidance as we move into the second half of the year.
Rolling 12 month performance as at 31 July2010/2009 2009/2008 2008/2007 2007/2006 2006/2005
JPM Global A-Class Acc 15.7% -6.8% -9.0% 5.2% 6.2%
Benchmark Index 16.3% -6.3% -8.6% 10.4% 7.2%
Six month performance31/01/10–31/07/10
JPM Global A-Class Acc 3.3%
Benchmark Index 4.0%
Fund statisticsFund size £173.0m
Benchmark Index MSCI World (Total Return Net)
Fund charges Initial 4.25%, Annual 1.50%
Top ten holdings %TOTAL S.A. 2.4Vodafone Group 2.3Merck 1.9Cisco Systems 1.8Mitsubishi 1.7BHP Billiton 1.6Philip Morris International 1.6Standard Chartered 1.6United Technologies 1.6Bank of America 1.6

67
ContinuationReturn to Index�
�
Geographical breakdown %United States of America 48.0United Kingdom 13.5France 10.1Japan 5.0Switzerland 4.4Germany 4.0China 2.5Hong Kong 2.0Canada 1.6Netherlands 1.2Taiwan 1.0Israel 1.0Indonesia 0.9Italy 0.8Brazil 0.8Spain 0.8Mexico 0.7Luxembourg 0.7Ireland 0.3Net other assets 0.7
Highest/lowest share price and distribution recordDistribution
Highest Lowest per shareCalendar year share price share price (net)
A-Class Accumulation Shares
2005 639.7p 494.6p 1.02p
2006 679.5p 583.3p 0.72p
2007 692.9p 611.1p 1.49p
2008 690.4p 425.3p 2.62p
2009 654.1p 412.5p 7.03p
2010A 712.4p 601.4p 4.33p
A-Class Income SharesB
2007 53.98p 49.05p –
2008 53.80p 33.14p 0.00p
2009 50.30p 31.72p 0.54p
2010A 54.39p 45.92p 0.34p
A To 31 July 2010.B A-Class Income Shares were launched on 1 September 2007.
Portfolio turnover rate31.07.09 28.94%
31.07.10 42.10%
The portfolio turnover rate (PTR) reflects the total of security purchases and sales, less the total of shareissues and cancellations, expressed as a percentage of the average daily net asset values over the period.
Net asset values and Total expense ratiosNet assetvalue per Net asset Total
share class Number value per expenseDate £’000 of shares share ratio
A-Class Accumulation Shares
31.01.08 201,080 32,534,246 618.1p 1.67%
31.01.09 147,678 30,037,865 491.6p 1.68%
31.01.10 173,850 28,279,343 614.8p 1.67%
31.07.10 172,442 27,148,094 635.2p 1.68%
A-Class Income Shares
31.01.08C 328 681,827 48.16p 1.68%
31.01.09C 282 748,071 37.78p 1.68%
31.01.10C 402 855,589 46.94p 1.68%
31.07.10 559 1,152,337 48.50p 1.68%
C The Net asset value and the Net asset value per income share are shown ex-dividend at the financial year end.
The total expense ratio (TER) takes into account the ACD fee and any fixed expenses charged to revenue overthe financial period, expressed as a percentage of the average daily net asset values over the same period.

68
ContinuationReturn to Index�
�
Market value Total netInvestment Holding £’000 assets %
Portfolio statementAs at 31 July 2010
United States of America – 48.0% (45.3%)Abbott Laboratories 55,500 1,744 1.0Accenture ‘A’ 68,000 1,714 1.0ACE 49,501 1,683 1.0American Express 50,200 1,436 0.8Anadarko Petroleum 69,400 2,224 1.3Analog Devices 93,100 1,778 1.0Apple 10,900 1,806 1.0Bank of America 309,556 2,784 1.6Baxter International 54,177 1,519 0.9Chevron 41,700 2,035 1.2Cisco Systems 210,200 3,132 1.8Citigroup 468,400 1,236 0.7Comcast ‘A’ 209,450 2,571 1.5Dow Chemical 97,300 1,703 1.0El Paso 316,670 2,509 1.5Emerson Electric 57,700 1,844 1.1Exelon 33,600 904 0.5Goldman Sachs Group 11,700 1,145 0.7Google ‘A’ 8,200 2,553 1.5Guess 71,000 1,619 0.9Hartford Financial Services Group 101,800 1,521 0.9Hewlett Packard 70,689 2,104 1.2IBM 33,300 2,735 1.6Intel 160,700 2,169 1.3Medtronic 70,800 1,641 0.9Melco Crown Entertainment ADR 321,400 780 0.5Merck 146,664 3,299 1.9Newmont Mining 46,200 1,653 1.0News Corp ‘B’ 113,500 1,065 0.6Norfolk Southern 76,700 2,754 1.6PepsiCo 47,145 1,963 1.1Pfizer 154,640 1,496 0.9Philip Morris International 86,700 2,848 1.6PNC Financial Services Group 33,600 1,285 0.7Prudential Financial 61,300 2,204 1.3Qualcomm 76,775 1,910 1.1Tiffany & Co 42,200 1,124 0.6United Technologies 61,720 2,819 1.6VF 16,800 855 0.5Wal-Mart Stores 67,257 2,204 1.3Walt Disney 117,400 2,541 1.5Wells Fargo 113,642 2,019 1.2Yum Brands 58,300 1,547 0.9Zimmer 12,677 424 0.2
United Kingdom – 13.5% (14.7%)Autonomy 114,900 1,888 1.1Barclays 473,300 1,577 0.9BG Group 173,600 1,761 1.0BHP Billiton 146,078 2,857 1.6BP 332,800 1,351 0.8British American Tobacco 91,100 2,017 1.2ICAP 283,159 1,147 0.7Standard Chartered 151,729 2,835 1.6Tesco 500,808 1,975 1.1Vodafone Group 2,708,500 4,056 2.3Xstrata 197,126 2,022 1.2
France – 10.1% (10.0%)Accor 53,200 1,106 0.6AXA 96,131 1,121 0.6BNP Paribas 48,700 2,145 1.2Edenred 53,200 601 0.3Lafarge 48,204 1,670 1.0Pernod-Ricard 26,459 1,344 0.8PPR 21,500 1,829 1.1Sanofi-Aventis 54,880 2,031 1.2Societe Generale 41,298 1,530 0.9TOTAL S.A. 126,236 4,108 2.4
Japan – 5.0% (7.5%)East Japan Railway 48,000 1,985 1.1Honda Motor 130,000 2,614 1.5Kubota 231,000 1,175 0.7Mitsubishi 215,800 2,995 1.7
Market value Total netInvestment Holding £’000 assets %
Switzerland – 4.4% (4.6%)ABB 108,200 1,396 0.8Nestle 75,480 2,401 1.4Roche (Genusscheine) 24,265 2,031 1.2Zurich Financial Services 11,731 1,753 1.0
Germany – 4.0% (4.1%)Bayer 57,100 2,077 1.2E.ON 75,100 1,427 0.8Linde 21,200 1,569 0.9Siemens 29,170 1,829 1.1
China – 2.5% (0.0%)China Life Insurance ‘H’ 371,000 1,057 0.6China Merchants Bank ‘H’ 1,017,169 1,740 1.0CNOOC ADS 14,400 1,561 0.9
Hong Kong – 2.0% (3.8%)Esprit 325,753 1,301 0.8Hang Lung Properties 757,000 2,015 1.2
Canada – 1.6% (1.0%)Niko Resources 11,800 805 0.5Talisman Energy 168,700 1,853 1.1
Netherlands – 1.2% (0.7%)Reed Elsevier 249,700 2,064 1.2
Taiwan – 1.0% (0.7%)Taiwan Semiconductor Manufacturing ADS 276,951 1,810 1.0
Israel – 1.0% (1.2%)Teva Pharmaceutical Industries ADR 58,500 1,769 1.0
Indonesia – 0.9% (0.7%)Bank Rakyat Indonesia 2,342,500 1,638 0.9
Italy – 0.8% (0.9%)Intesa Sanpaolo 686,600 1,464 0.8
Brazil – 0.8% (0.9%)Petrobras ADS 61,200 1,400 0.8
Spain – 0.8% (0.8%)Telefonica 96,000 1,398 0.8
Mexico – 0.7% (1.3%)America Movil ADR 36,802 1,189 0.7
Luxembourg – 0.7% (0.6%)ArcelorMittal 59,300 1,156 0.7
Ireland – 0.3% (0.0%)Bank of Ireland 668,575 450 0.3
Investment assets 171,792 99.3
Net other assets 1,209 0.7
Net assets 173,001 100.0
Unless otherwise stated the above securities are admitted to official stock exchange listings or trade on aregulated market.
The comparative percentage figures in brackets are at 31 January 2010.
69
ContinuationReturn to Index�
�
£’000
Total of all purchases for the period 39,394
Major purchases Cost
BNP Paribas 2,307Dow Chemical 1,964BP 1,939Apple 1,860British American Tobacco 1,839Abbott Laboratories 1,825Medtronic 1,821Baxter International 1,509Guess 1,500American Express 1,421Goldman Sachs Group 1,375Citigroup 1,331ABB 1,262Kubota 1,250Tiffany & Co 1,248AFLAC 932Niko Resources 820Las Vegas Sands 805Sanofi-Aventis 796Xstrata 756
£’000
Total of all sales for the period 45,518
Major sales Proceeds
HSBC 2,885AT&T 2,197Procter & Gamble 2,179Nintendo 2,147Japan Tobacco 1,925Microsoft 1,680Corning 1,676Kroger 1,674Vedanta Resources 1,564WPP 1,554FEMSA ADR 1,426State Street 1,381Bristol-Myers Squibb 1,356BE Aerospace 1,351Bouygues 1,335Prudential 1,330Gilead Sciences 1,322Verizon Communications 1,281Yahoo 1,279Rhodia 1,126
Portfolio movements For the six months ended 31 July 2010

70
Return to Index�
Financial statements
Statement of total return(Unaudited)
For the six months ended 31 July2010 2009
£’000 £’000 £’000 £’000
Income
Net capital gains 5,009 15,467
Revenue 2,933 2,834
Expenses (1,537) (1,228)
Net revenue before taxation 1,396 1,606
Taxation (315) (283)
Net revenue after taxation 1,081 1,323
Total return before distributions 6,090 16,790
Finance costs: Distributions (19) (17)
Change in net assets attributable to shareholders from investment activities 6,071 16,773
Statement of change in net assets attributable to shareholders(Unaudited)
For the six months ended 31 July2010 2009
£’000 £’000 £’000 £’000
Opening net assets attributable to shareholders 174,252 147,960
Amounts receivable on issue of shares 354 425
Amounts payable on cancellation of shares (7,675) (4,437)
(7,321) (4,012)
Change in net assets attributable to shareholders from investment activities (see above) 6,071 16,773
Stamp duty reserve tax (1) (1)
Closing net assets attributable to shareholders 173,001 160,720
As the comparatives in the above table are for the previous interim period, the Net assets at the end ofthat period will not agree to the Net assets at the start of the current period.
Balance sheet(Unaudited)
As at31 July 2010 31 January 2010
£’000 £’000 £’000 £’000
ASSETS
Investment assets 171,792 172,918
Debtors 680 3,955
Cash and bank balances 1,210 1,346
Total other assets 1,890 5,301
Total assets 173,682 178,219
LIABILITIES
Creditors (681) (3,964)
Distribution payable on income shares – (3)
Total liabilities (681) (3,967)
Net assets attributable to shareholders 173,001 174,252

71
ContinuationReturn to Index�
�
JPM Global High Yield Bond Fund
Investment objective and policyTo provide a high return from a diversified portfolio of bond and other debtsecurities. The Fund will invest primarily in bond and other debt securities(mainly below investment grade securities or unrated securities) of issuersin developed countries, primarily corporations and banks. The Fund mayalso invest in bond and other debt securities of issuers of emerging countries.The Fund will aim to hedge non-sterling securities back to sterling.
Risk profileBond funds may not behave like direct investments in the underlying bondsthemselves. By investing in bond funds, the certainty of receiving a regularfixed amount of income for a defined period of time with the prospect of afuture known return of capital is lost.
There is an increased risk of capital loss because the Fund invests in non-investment grade high yield bonds.
Bond prices can fluctuate significantly depending not only on the globaleconomic and interest rate conditions but also on the general credit marketenvironment and the creditworthiness of the issuer.
The credit quality of high yield bonds is below investment grade and theyusually offer higher yields to compensate for the reduced creditworthinessand the increased risk of default relative to investment grade bonds.
Bonds with a lower credit rating may have a higher risk of defaulting whichmay in turn have an adverse effect on the performance of funds which investin them.
This Fund charges the fees of the ACD against capital, which will increasethe amount of income available for distribution to Shareholders, but mayconstrain capital growth. It may also have tax implications for certain investors.
Bond funds will normally distribute a combination of coupon and the expecteddiscount/premium on the securities. Therefore, a fund’s distribution willcomprise income received and an element of projected capital gains orlosses. This could result in an element of capital gain being taxed as incomein the hands of an investor.
Fund review• As a result of market volatility experienced during the review period, the
Fund underperformed its benchmark. In both February and May, volatilityin the high yield market surged and risk appetite levels were subdued.Significant uncertainty over the sustainability of the global economicrecovery contributed to the sharp increase in risk aversion. As would beexpected, low rate bonds underperformed due to market turmoil.
• Capital market activity notably decelerated in May and early June, aftersetting record levels of new issuance in both March and April. However,demand improved in late June and July’s market rally garnered healthyinflows and pushed year-to-date total fund flows into positive territory.Lower default trends continued throughout the period as the defaultrate for high yield bonds decreased to its lowest level since December2008.
You should remember that past performance is not a guide to the future. The price of investments and the income from them may fall as well as rise andinvestors may not get back the full amount invested. For specific risks, please read the Simplified Prospectus.All performance returns are calculated using the quoted price of the accumulation or income shares. Performance returns are in Sterling.FX Adjusted returns have been calculated by JPMAM. Blended benchmarks have been calculated by JPMAM.Source: J.P. Morgan.
Fund outlook• Improved clarity on the global economic environment and healthy demand
currently support the high yield market. Corporate profitability shouldcontinue to strengthen as revenue growth improves and margins hold.
• We believe that valuations are attractive based on forecasted GDP growth,strong credit fundamentals, and low default risk. Therefore, we expectspreads to tighten back toward the long-term average as issuerfundamentals remain solid. We also expect the default rate to continueto trend downward. We will continue to rely on our individual securityselection as the primary driver of performance in the current marketenvironment.
Rolling 12 month performance as at 31 July2010/2009 2009/2008 2008/2007 2007/2006 2006/2005
JPM Global High Yield BondA-Class Acc 16.8% -3.0% 3.0% 4.0% 0.7%
JPM Global High Yield BondB-Class Inc – – – – –
JPM Global High Yield BondI-Class Acc 17.7% -2.1% 4.0% 4.8% 1.6%
Benchmark Index 20.4% 0.3% 3.0% 6.3% 3.2%
Six month performance31/01/10–31/07/10
JPM Global High Yield Bond A-Class Acc 4.5%
Benchmark Index 6.4%
Fund statisticsFund size £138.8m
Benchmark Index ML High Yield US BB-B Constrained Index Hedged into GBP
Fund chargesA-Class Initial 3.50%, Annual 1.10%B-Class Initial Nil, Annual 0.75%I-Class Initial Nil, Annual 0.45%
Top ten holdings %HCA 9.625% 2016 2.6Biomet 10.375% 2017 1.3Sungard Data Systems 10.25% 2015 1.3EchoStar DBS 7.75% 2015 1.0Visant 10.25% 2013 1.0Sealy Mattress 8.25% 2014 1.0Harrahs Operating 11.25% 2017 1.0Sprint Capital 8.75% 2032 1.0Simmons 11.25% 2015 1.0Ford Motor Credit 8.7% 2014 0.9

72
ContinuationReturn to Index�
�
Sector breakdown %Corporate debt 92.5 Equities 0.3 Forward currency contracts (0.1)Net other assets 7.3
Highest/lowest share price and distribution recordHighest Lowest Distribution
Calendar year share price share price per share
A-Class Accumulation Shares
2005 62.14p 59.00p 3.26p
2006 66.26p 61.75p 3.82p
2007 69.08p 64.74p 3.90p
2008 69.45p 43.59p 4.99p
2009 71.79p 46.39p 4.06p
2010A 75.58p 70.48p 3.72p
A-Class Income Shares
2005 44.31p 41.89p 2.35p
2006 43.42p 41.41p 2.60p
2007 44.10p 40.87p 2.51p
2008 41.62p 24.74p 2.98p
2009 38.07p 25.79p 2.23p
2010A 39.25p 36.76p 1.94p
B-Class Income SharesB
2009 104.5p 100.0p 0.22p
2010A 107.8p 100.8p 5.27p
I-Class Accumulation SharesC
2005 101.8p 98.98p 2.04p
2006 109.8p 101.7p 6.53p
2007 115.3p 107.8p 8.61p
2008 116.5p 73.52p 8.83p
2009 122.3p 78.39p 7.14p
2010A 129.2p 120.2p 6.40p
I-Class Gross Accumulation SharesD
2007 101.2p 94.28p 3.28p
2008 103.3p 66.08p 9.34p
2009 111.5p 70.91p 7.89p
2010A 119.2p 109.9p 7.41p
I-Class Income SharesC
2005 101.8p 96.95p 2.03p
2006 100.8p 96.09p 6.34p
2007 102.9p 95.45p 6.03p
2008 97.70p 58.32p 7.18p
2009 90.33p 60.96p 5.49p
2010A 93.34p 87.30p 4.62p
A To 31 July 2010.B B-Class Income Shares were launched on 14 October 2009.C I-Class Income and Accumulation Shares were launched on 1 July 2005.D I-Class Gross Accumulation Shares were launched on 21 May 2007.
Portfolio turnover rate31.07.09 21.29%
31.07.10 69.16%
The portfolio turnover rate (PTR) reflects the total of security purchases and sales, less the total of shareissues and cancellations, expressed as a percentage of the average daily net asset values over the period.
Net asset values and Total expense ratiosNet assetvalue per Net asset Total
share class Number value per expenseDate £’000 of shares share ratio
A-Class Accumulation Shares
31.01.08 21,387 32,333,491 66.14p 1.26%
31.01.09 19,720 38,808,246 50.81p 1.27%
31.01.10 59,326 82,410,332 71.99p 1.27%
31.07.10 62,511 82,754,834 75.54p 1.28%
A-Class Income Shares
31.01.08 50,231 125,411,596 40.05p 1.25%
31.01.09 38,239 135,688,863 28.18p 1.27%
31.01.10 52,983 141,070,611 37.56p 1.27%
31.07.10 60,789 159,618,686 38.08p 1.28%
B-Class Income Shares
31.01.10 1,015 984,644 103.0p 0.89%
31.07.10 1,174 1,121,497 104.7p 0.90%
I-Class Accumulation Shares
31.01.08 5 5,000 110.8p 0.45%
31.01.09 6 7,000 85.76p 0.45%
31.01.10 6 5,000 122.6p 0.45%
31.07.10 5 4,000 129.1p 0.45%
I-Class Gross Accumulation Shares
31.01.08 4,719 4,842,889 97.44p 0.45%
31.01.09 8,773 11,364,034 77.20p 0.45%
31.01.10 10,068 8,981,680 112.1p 0.45%
31.07.10 12,332 10,354,676 119.1p 0.45%
I-Class Income Shares
31.01.08 2,313 2,464,253 93.86p 0.45%
31.01.09 2,559 3,845,121 66.55p 0.45%
31.01.10 14,401 16,157,110 89.13p 0.45%
31.07.10 1,989 2,194,250 90.66p 0.45%
The Net asset value and the Net asset value per income share are shown ex-dividend.
The total expense ratio (TER) takes into account the ACD fee and any fixed expenses charged to revenue overthe financial period, expressed as a percentage of the average daily net asset values over the same period.

73
ContinuationReturn to Index�
�
Portfolio statementAs at 31 July 2010
Market value Total netInvestment Holding £’000 assets %
Corporate debt – 92.5% (93.8%)US Dollar – 92.5%ACCO Brands 7.625% 2015 $505,000 311 0.2 ACCO Brands 10.625% 2015 $975,000 695 0.5 Aeroflex 11.75% 2015 $955,000 657 0.5 AES 9.75% 2016 $945,000 679 0.5 Aircastle 9.75% 2018 $215,000 140 0.1 ALH Finance 8.5% 2013 $1,300,000 840 0.6 Alliant Techsystems 6.75% 2016 $950,000 613 0.4 Ally Financial 6.625% 2012 $278,000 182 0.1 Ally Financial 6.875% 2012 $1,646,000 1,081 0.8 Ally Financial 6.75% 2014 $1,890,000 1,216 0.9 American Tire Distributors 9.75% 2017 $420,000 281 0.2 Ames True Temper 4.525% FRN 2012 $1,050,000 672 0.5 Ames True Temper 10% 2012 $215,000 138 0.1 Amkor Technology 9.25% 2016 $230,000 158 0.1 Amkor Technology 7.375% 2018 $565,000 369 0.3 Amsted Industries 8.125% 2018 $510,000 336 0.2 Arch Coal 8.75% 2016 $935,000 644 0.5 Arch Western Finance 6.75% FRN 2013 $270,000 175 0.1 Ashland 9.125% 2017 $430,000 314 0.2 Ashtead Capital 9% 2016 $780,000 508 0.4 Aspect Software 10.625% 2017 $255,000 167 0.1 Associated Materials 9.875% 2016 $230,000 160 0.1 Atlas Energy Operating 12.125% 2017 $280,000 208 0.2 Atlas Energy Operating 10.75% 2018 $995,000 713 0.5 Avaya 9.75% 2015 $540,000 336 0.2 Avaya 10.125% 2015 $469,196 289 0.2 Avis Budget Car Rental 7.75% 2016 $765,000 469 0.3 Avis Budget Group 9.625% 2018 $285,000 190 0.1 B&G Foods 7.625% 2018 $355,000 235 0.2 Baldor Electric 8.625% 2017 $530,000 360 0.3 Bank of America Corporation Bonds 8%
FRN Perpetual $355,000 229 0.2 Bausch & Lomb 9.875% 2015 $850,000 573 0.4 Belden 9.25% 2019 $390,000 271 0.2 Biomet 10.375% 2017 $2,610,000 1,850 1.3 Bon Ton Dept Stores 10.25% 2014 $480,000 300 0.2 Boyd Gaming 7.125% 2016 $655,000 359 0.3 Bumble Bee Foods 7.75% 2015 $485,000 321 0.2 Bway Holding 10% 2018 $590,000 402 0.3 Calpine 7.875% 2020 $475,000 308 0.2 Case New Holland 7.75% 2013 $570,000 385 0.3 Case New Holland 7.875% 2017 $545,000 369 0.3 CB Simmons 10% 2014 $3,305,000 – – CCH II Capital 13.5% 2016 $200,000 153 0.1 CCO Holdings 7.875% 2018 $700,000 472 0.3 CCO Holdings 8.125% 2020 $490,000 333 0.2 Central Garden & Pet 8.25% 2018 $625,000 403 0.3 Cequel Communications 8.625% 2017 $1,230,000 808 0.6 Chesapeake Energy 6.5% 2017 $774,000 506 0.4 Chesapeake Energy 7.25% 2018 $180,000 122 0.1 Chiquita Brands International 8.875% 2015 $955,000 621 0.4 CIT Group 7% 2014 $188,679 118 0.1 CIT Group 7% 2015 $283,679 175 0.1 CIT Group 7% 2016 $2,044,465 1,253 0.9 CIT Group 7% 2017 $395,253 239 0.2 Citigroup 8.30% FRN 2057 $355,000 235 0.2 Clean Harbors 7.625% 2016 $350,000 230 0.2 Clear Channel Worldwide ‘A’ 9.25% 2017 $385,000 260 0.2 Clear Channel Worldwide ‘B’ 9.25% 2017 $1,290,000 878 0.6 Clearwater Paper Corporation 10.625% 2016 $515,000 365 0.3 Clearwire Communications 12% 2015 $1,015,000 683 0.5 Cloud Peak Energy Resources 8.25% 2017 $690,000 461 0.3 Community Health Systems 8.875% 2015 $1,090,000 731 0.5 Consol Energy 8% 2017 $235,000 161 0.1 Consol Energy 8.25% 2020 $220,000 152 0.1 Constellation Brands 8.375% 2014 $295,000 205 0.1 Constellation Brands 7.25% 2016 $995,000 664 0.5 Cooper Companies 7.125% 2015 $595,000 380 0.3 Corrections Corporation of America 7.75% 2017 $765,000 520 0.4 Couche Tard USLP/Financing 7.5% 2013 $200,000 130 0.1 Cricket Communications 9.375% 2014 $675,000 447 0.3 Cricket Communications 10% 2015 $215,000 147 0.1 Crosstex Energy 8.875% 2018 $870,000 584 0.4 Crown Americas 7.75% 2015 $450,000 303 0.2 Crown Americas 7.625% 2017 $200,000 136 0.1 Crown Castle International 9% 2015 $685,000 479 0.3 Denbury Resources 7.5% 2013 $45,000 29 – Denbury Resources 9.75% 2016 $430,000 303 0.2 Digicel Group 8.25% 2017 $590,000 388 0.3 Digicel Group 10.5% 2018 $510,000 350 0.3
Market value Total netInvestment Holding £’000 assets %
Dish DBS 7.875% 2019 $635,000 434 0.3 DJO Finance 10.875% 2014 $1,085,000 747 0.5 Dole Food 13.875% 2014 $169,000 131 0.1 Dole Food 8% 2016 $365,000 242 0.2 Dynegy 7.75% 2019 $305,000 140 0.1 Easton-Bell Sports 9.75% 2016 $950,000 642 0.5 EchoStar DBS 7.75% 2015 $2,130,000 1,432 1.0 EchoStar DBS 7.125% 2016 $1,815,000 1,198 0.9 El Paso 8.25% 2016 $745,000 520 0.4 El Paso 7.25% 2018 $305,000 207 0.2 Energy Future Holdings 10.875% 2017 $710,000 333 0.2 Energy Future Holdings 10% 2020 $530,000 344 0.2 Entravision 8.75% 2017 $175,000 114 0.1 Esco 4.412% FRN 2013 $25,000 15 – Esco 8.625% 2013 $395,000 252 0.2 Esterline Technologies 7% Bonds 2020 $45,000 29 – Fidelity National Information Services
7.625% 2017 $95,000 63 – Fidelity National Information Services
7.875% 2020 $85,000 57 – First Data 9.875% 2015 $1,700,000 888 0.6 First Data 10.55% FRN 2015 $1,191,465 595 0.4 FMG Finance Property 10.625% 2016 $1,190,000 871 0.6 Ford Motor Credit 8.7% 2014 $1,835,000 1,276 0.9 Ford Motor Credit 7% 2015 $1,605,000 1,061 0.8 Ford Motor Credit 6.625% 2017 $240,000 153 0.1 Forest Oil 8.5% 2014 $220,000 152 0.1 Forest Oil 7.25% 2019 $100,000 65 – Freescale Semiconductor 9.25% 2018 $890,000 594 0.4 Freescale Semiconductor 10.125% 2018 $670,000 460 0.3 Frontier Communications 6.625% 2015 $540,000 351 0.3 GCI 8.625% 2019 $980,000 651 0.5 General Cable 7.125% 2017 $710,000 459 0.3 Georgia Pacific 8.25% 2016 $540,000 376 0.3 Georgia Pacific 7.125% 2017 $870,000 581 0.4 Georgia Pacific 7.75% 2017 $620,000 412 0.3 Glatfelter 7.125% 2016 $145,000 92 0.1 Glatfelter 7.125% 2016 $590,000 375 0.3 Goodyear Tire & Rubber 9% 2015 $500,000 335 0.2 Goodyear Tire & Rubber 10.5% 2016 $235,000 168 0.1 Goodyear Tire & Rubber 8.75% 2020 $30,000 21 – Graham Packaging 9.875% 2014 $1,465,000 975 0.7 GWR Operating Great Wolf 10.875% 2017 $480,000 317 0.2 GXS Worldwide 9.75% 2015 $740,000 457 0.3 Hanesbrands 8.735% 2014 $1,080,000 659 0.5 Hanesbrands 8% 2016 $215,000 144 0.1 Harrahs Operating 11.25% 2017 $1,995,000 1,391 1.0 Harrahs Operating 10% 2018 $893,000 482 0.3 HCA 9.25% 2016 $385,000 266 0.2 HCA 9.625% 2016 $5,249,000 3,643 2.6 Health Management Associates 6.125% 2016 $1,220,000 768 0.6 Hertz 8.875% 2014 $695,000 459 0.3 Hillman Group 10.875% 2018 $425,000 285 0.2 Host Hotels & Resorts 6.875% 2014 $530,000 344 0.2 Host Hotels & Resorts 9% 2017 $255,000 180 0.1 Host Marriott ‘Q’ 6.75% 2016 $640,000 416 0.3 Huntsman International 7.375% 2015 $360,000 228 0.2 Huntsman International 5.5% 2016 $435,000 257 0.2 Huntsman International 8.625% 2020 $400,000 250 0.2 Ineos Finance 9% 2015 $1,780,000 1,166 0.8 Inergy 8.75% 2015 $275,000 188 0.1 Inergy Finance Corp 8.25% 2016 $235,000 158 0.1 Intelsat 8.875% 2015 $115,000 76 0.1 Intelsat Bermuda 11.25% 2016 $905,000 628 0.5 Intelsat Jackson 8.5% FRN 2019 $885,000 597 0.4 Intelsat Jackson ‘H’ 9.5% FRN 2016 $1,170,000 804 0.6 Intelsat Subsidiary 8.875% 2015 $365,000 243 0.2 Interactive Data 10.25% 2018 $695,000 460 0.3 Interline Brands 8.125% 2014 $465,000 306 0.2 International Lease Finance 8.625% 2015 $1,160,000 755 0.5 International Lease Finance 8.75% 2017 $955,000 624 0.5 IPCS 3.594% FRN 2014 $1,169,795 702 0.5 Iron Mountain 8.75% 2014 $1,065,000 726 0.5 Isle of Capri 7% 2014 $385,000 226 0.2 ITC Deltacom 10.5% 2016 $435,000 275 0.2 Jarden 8% 2016 $500,000 340 0.2 Jarden 7.5% 2017 $855,000 563 0.4 JDA Software 8% 2014 $600,000 395 0.3 Johnsondiversey 8.25% 2019 $800,000 537 0.4 L-3 Communications 5.875% 2015 $490,000 320 0.2 LBI Escrow 8% 2017 $805,000 537 0.4 Lear 7.875% 2018 $225,000 150 0.1

74
ContinuationReturn to Index�
�
Market value Total netInvestment Holding £’000 assets %
Market value Total netInvestment Holding £’000 assets %
Portfolio statement – continuedAs at 31 July 2010
Lear 8.125% 2020 $175,000 117 0.1 Levi Strauss 8.875% 2016 $100,000 67 – Libbey Glass 10% 2015 $650,000 444 0.3 Linn Energy 11.75% 2017 $175,000 130 0.1 Linn Energy 9.875% 2018 $55,000 39 – Linn Energy Finance 8.625% 2020 $440,000 300 0.2 Lyondell Chemical 11% 2018 $1,260,000 872 0.6 Magnachip Semiconductor 10.5% 2018 $735,000 491 0.4 Manitowoc 9.5% 2018 $400,000 264 0.2 Markwest Energy Partners 8.75% 2018 $755,000 522 0.4 Mcjunkin Red Man 9.5% 2016 $290,000 183 0.1 MetroPCS Wireless 9.25% 2014 $1,345,000 906 0.7 MGM Mirage 5.875% 2014 $510,000 274 0.2 MGM Mirage 6.875% 2016 $575,000 302 0.2 MGM Mirage 7.5% 2016 $1,740,000 937 0.7 MGM Mirage 9% 2020 $495,000 334 0.2 MGM Resorts International 6.75% 2013 $265,000 156 0.1 MGM Resorts International 11.125% 2017 $855,000 623 0.5 Michael Food 9.75% 2018 $215,000 144 0.1 Michaels Store 13% FRN 2016 $280,000 168 0.1 Mirant Americas 8.5% 2021 $345,000 209 0.2 Mirant North America 7.375% 2013 $875,000 577 0.4 Mylan 7.625% 2017 $170,000 116 0.1 Mylan 7.875% 2020 $650,000 447 0.3 Neiman Marcus 9% FRN 2015 $1,095,560 719 0.5 Newpage 11.375% 2014 $330,000 195 0.1 Nexstar Broadcasting 8.875% 2017 $390,000 258 0.2 NFR Energy Finance Corporation 9.75% 2017 $385,000 252 0.2 NGC Corporation 7.625% 2026 $735,000 297 0.2 Noranda Alum Acquisition 5.373% FRN 2015 $1,113,982 567 0.4 Nordic Telephone 8.875% 2016 $1,040,000 703 0.5 Novelis 7.25% 2015 $470,000 306 0.2 NRG Energy 7.375% 2016 $950,000 624 0.5 NRG Energy 7.375% 2017 $580,000 379 0.3 NXP 10% 2013 $194,000 136 0.1 NXP 9.75% 2018 $1,170,000 794 0.6 NXP Bv/Funding 9.5% 2015 $410,000 260 0.2 Offshore 11.5% 2015 $170,000 109 0.1 Omnicare 7.75% 2020 $50,000 34 – OPTI Canada 9% 2012 $275,000 180 0.1 OPTI Canada 8.25% 2014 $405,000 227 0.2 Oshkosh 8.25% 2017 $315,000 211 0.2 Owens-Brockway 7.375% 2016 $180,000 123 0.1 Packaging Dynamics Finance 10% 2016 $500,000 270 0.2 Paetec 9.5% 2015 $770,000 492 0.4 Paetec 8.875% 2017 $915,000 605 0.4 Parker Drilling 9.125% 2018 $350,000 224 0.2 Petrohawk Energy 9.125% 2013 $525,000 352 0.3 Petrohawk Energy 7.875% 2015 $770,000 512 0.4 Pinnacle Foods Finance 9.25% 2015 $120,000 80 0.1 Pinnacle Foods Finance Unsecured 9.25%
2015 $300,000 199 0.1 Pioneer Drilling 9.875% 2018 $270,000 174 0.1 Plains Exploration & Production 7% 2017 $465,000 295 0.2 PolyOne 8.875% 2012 $380,000 260 0.2 Pride International 8.5% 2019 $860,000 624 0.5 Quebecor FCB Printing 6.5% 2027 $900,000 35 – Quebecor Media 7.75% 2016 $175,000 114 0.1 Quebecor Media 7.75% 2016 $1,715,000 1,119 0.8 Qwest Communications International 7.5%
2014 $1,510,000 991 0.7 Radiation Therapy Services 9.875% 2017 $345,000 220 0.2 RailAmerica 9.25% 2017 $568,000 395 0.3 Range Resource 7.5% 2016 $390,000 262 0.2 RBS Global & Rexnord 8.5% 2018 $1,510,000 979 0.7 Realogy 10.5% 2014 $735,000 407 0.3 Reichhold Industries 9% 2014 $1,160,000 674 0.5 Rental Service 9.5% 2014 $820,000 543 0.4 Reynolds Group Issuer 8.5% 2018 $1,190,000 778 0.6 Rite Aid 7.5% 2017 $660,000 390 0.3 Rite Aid 9.5% 2017 $290,000 153 0.1 Rite Aid Corporation 9.75% 2016 $445,000 308 0.2 Royal Caribbean Cruises 7% 2013 $180,000 118 0.1 Royal Caribbean Cruises 7.25% 2016 $710,000 456 0.3 RSC Equipment Rental 10% 2017 $465,000 325 0.2 Sable International Finance 7.75% 2017 $355,000 233 0.2 Sally Holdings 9.25% 2014 $975,000 660 0.5 Sandridge Energy 8.625% FRN 2015 $300,000 196 0.1 Sandridge Energy 9.875% 2016 $240,000 164 0.1 SBA Telecommunications 8% 2016 $180,000 124 0.1 Sealy Mattress 8.25% 2014 $2,155,000 1,395 1.0 Sequa Corporation 11.75% 2015 $625,000 401 0.3
Service Corporation International 7.375% 2014 $1,040,000 696 0.5
Service Corporation International 6.75% 2015 $260,000 169 0.1
Service Corporation International 7% FRN 2017 $375,000 245 0.2
Servicemaster 10.75% 2015 $1,145,000 771 0.6 Simmons 11.25% 2015 $1,920,000 1,328 1.0 Solo Cup 10.5% 2013 $425,000 285 0.2 Solo Cup 8.5% 2014 $355,000 206 0.2 Solutia 8.75% 2017 $310,000 217 0.2 Spectrum Brands 9.5% 2018 $390,000 265 0.2 Spectrum Brands 12% FRN 2019 $1,215,204 874 0.6 Spirit Aerosystems 7.5% 2017 $490,000 316 0.2 Sprint Capital 6.9% 2019 $1,470,000 903 0.7 Sprint Capital 8.75% 2032 $2,145,000 1,390 1.0 SSI Investment Management 11.125% 2018 $580,000 391 0.3 Starwood Hotels & Resorts Worldwide
6.75% 2018 $375,000 249 0.2 Steinway Musical Instruments 7% 2014 $1,030,000 645 0.5 Sun Media 7.625% 2013 $275,000 178 0.1 Sungard Data Systems 10.25% 2015 $2,650,000 1,792 1.3 SUPERVALU 8% 2016 $1,625,000 1,049 0.8 Surgical Care 8.875% 2015 $788,597 506 0.4 Tenet Healthcare 9.25% 2015 $1,130,000 767 0.6 Tenet Healthcare 10% 2018 $100,000 73 0.1 Tenet Healthcare 8.875% 2019 $280,000 198 0.1 Terex 10.875% 2016 $330,000 235 0.2 Terex 8% 2017 $865,000 537 0.4 Texas Competitive Electric 10.25% FRN 2015 $1,770,000 770 0.6 Travelport 5.163% FRN 2014 $130,000 80 0.1 Travelport 9.875% 2014 $385,000 255 0.2 Travelport 11.875% 2016 $395,000 273 0.2 Triumph Group 8% 2017 $155,000 99 0.1 Triumph Group 8.625% 2018 $225,000 151 0.1 TRW Automotive 7% 2014 $315,000 206 0.2 TRW Automotive 7.25% 2017 $715,000 461 0.3 UCI Holdco 8.53706% FRN 2013 $406,644 256 0.2 United Components 9.375% 2013 $625,000 407 0.3 United Rentals North America 9.25% 2019 $630,000 426 0.3 United Surgical Partners 8.875% 2017 $305,000 201 0.1 United Surgical Partners 9.25% 2017 $645,000 424 0.3 US Oncology 9.125% 2017 $1,015,000 689 0.5 Vail Resorts 6.75% 2014 $1,405,000 908 0.7 Videotron 6.375% 2015 $100,000 65 – Videotron 9.125% 2018 $390,000 280 0.2 Virgin Media Finance 8.375% 2019 $645,000 452 0.3 Visant 10.25% 2013 $2,155,000 1,418 1.0 Vitro 9.125% 2017 $295,000 90 0.1 Wind Acquisition 10.75% 2015 $1,140,000 776 0.6 Wind Acquisition 11.75% 2017 $295,000 201 0.1 Windstream 8.625% 2016 $1,295,000 867 0.6 Windstream 8.125% 2018 $245,000 160 0.1 WMG Acquisition 9.5% 2016 $420,000 293 0.2 Wynn Las Vegas 7.875% 2017 $35,000 23 – Wynn Las Vegas 7.75% 2020 $240,000 157 0.1 Wynn Las Vegas 7.875% 2020 $280,000 184 0.1 Yankee Acquisition 8.50% 2017 $305,000 202 0.1 Yankee Acquisition 9.75% 2017 $190,000 127 0.1 Zayo Group 10.25% 2017 $695,000 460 0.3
Equities – 0.3% (0.4%)US Dollar – 0.3%Dex One 37,795 435 0.3 Quad / Graphics 1,365 38 –
Forward currency contracts – (0.1)% ((0.5)%)Forward foreign currency position
31/08/10 £134,800,000 134,800 97.1 Forward foreign currency position
31/08/10 $(210,017,322) (134,848) (97.2)
Investment assets 128,654 92.7
Net other assets 10,146 7.3
Net assets 138,800 100.0
Unless otherwise stated the above securities are admitted to official stock exchange listings or trade on aregulated market.
The comparative percentage figures in brackets are at 31 January 2010.

75
ContinuationReturn to Index�
�
Portfolio statement – continuedAs at 31 July 2010
Market value Portfolio credit ratings £’000
BBB- 624BB+ 5,856BB 7,637BB- 26,717B+ 18,440B 24,784B- 25,123CCC+ 15,020CCC 2,901CC 333C 407Unrated 387
Total bonds 128,229
Equities 473Forward currency contracts (48)
Investment assets 128,654

76
ContinuationReturn to Index�
�
£’000
Total of all purchases for the period 60,889
Major purchases Cost
Ford Motor Credit 7% 2015 1,809Dex One 1,804Simmons 10% 2014 1,457Ally Financial 6.875% 2012 1,435Harrahs Operating 11.25% 2017 1,373Simmons 11.25% 2015 1,366Ineos Finance 9% 2015 1,184Ford Motor Credit 8.7% 2014 1,134CIT Group 7% 2016 1,088RBS Global & Rexnord 8.5% 2018 981Freescale Semiconductor 10.125% 2018 893Lyondell Chemical 11% 2018 889Sprint Capital 8.75% 2032 845International Lease Finance 8.625% 2015 796NXP 9.75% 2018 776ACCO Brands 10.625% 2015 764Reynolds Group Issuer 8.5% 2018 720International Lease Finance 8.75% 2017 696Terra Capital 7.75% 2019 659GCI 8.625% 2019 645
£’000
Total of all sales for the period 69,979
Major sales Proceeds
Ford Motor Credit 7.8% 2012 1,871Simmons 10% 2014 1,538Amkor Technology 7.75% 2013 1,318Macy’s Retail 7.875% 2015 1,260CCO Holdings 8.75% 2013 1,255RBS Global & Rexnord 9.5% 2014 1,212Ally Financial 6.875% 2012 932Harrahs Operating 11.25% 2017 903Dex Media 9% 2013 873ACCO Brands 10.625% 2015 851Terra Capital 7.75% 2019 837Sprint Capital 6.9% 2019 835NXP 7.875% 2014 808Ford Motor Credit 7% 2015 775Newell Rubbermaid 10.6% 2019 740Central Garden & Pet 9.125% 2013 717Arch Western Finance 6.75% FRN 2013 709PolyOne 8.875% 2012 684Qwest Communications International 7.125% 2018 677AES 9.75% 2016 676
Portfolio movements For the six months ended 31 July 2010

77
Return to Index�
Financial statements
Statement of total return(Unaudited)
For the six months ended 31 July2010 2009
£’000 £’000 £’000 £’000
Income
Net capital gains 2,676 18,787
Revenue 5,949 3,408
Expenses (785) (473)
Net revenue before taxation 5,164 2,935
Taxation – (2)
Net revenue after taxation 5,164 2,933
Total return before distributions 7,840 21,720
Finance costs: Distributions (5,852) (3,343)
Change in net assets attributable to shareholders from investment activities 1,988 18,377
Statement of change in net assets attributable to shareholders(Unaudited)
For the six months ended 31 July2010 2009
£’000 £’000 £’000 £’000
Opening net assets attributable to shareholders 137,799 69,297
Amounts receivable on issue of shares 18,909 20,807
Amounts payable on cancellation of shares (22,480) (6,506)
(3,571) 14,301
Change in net assets attributable to shareholders from investment activities (see above) 1,988 18,377
Retained distributions on accumulation shares 2,584 1,449
Unclaimed distributions – 1
Closing net assets attributable to shareholders 138,800 103,425
As the comparatives in the above table are for the previous interim period, the Net assets at the end ofthat period will not agree to the Net assets at the start of the current period.
Balance sheet(Unaudited)
As at31 July 2010 31 January 2010
£’000 £’000 £’000 £’000
ASSETS
Investment assets 128,702 129,768
Debtors 3,515 3,307
Cash and bank balances 10,363 8,883
Total other assets 13,878 12,190
Total assets 142,580 141,958
LIABILITIES
Investment liabilities (48) (681)
Creditors (2,694) (2,344)
Distribution payable on income shares (1,038) (1,134)
Total other liabilities (3,732) (3,478)
Total liabilities (3,780) (4,159)
Net assets attributable to shareholders 138,800 137,799

78
ContinuationReturn to Index�
�
JPM Global Property Securities Fund
Investment objective and policyTo provide long-term capital growth by investing primarily in Real EstateInvestment Trusts (REITs) and in equity and equity-linked securities of otherreal estate companies that, at the time of investment, are significant owners,developers or financiers of real estate or that provide real estate relatedservices.
Other instruments as permitted in the stated investment and borrowing powersof the Company including, but not limited to, fixed interest securities, cash andcash equivalents may be held on an ancillary basis, as appropriate.
The Fund will aim to hedge non-sterling exposures back to sterling.
Risk profilesThis specialist equity based Fund is designed to give broad market exposureto real estate markets across a number of countries, which may includeexposure to emerging markets and smaller companies.
Equity investment is subject to specific risks relating to the performance ofthe individual companies held and the market’s perception of theirperformance. Equities are also subject to systematic risks such as generaleconomic conditions, inflation, interest rates, foreign exchange rates andindustry sector risks. In general terms, equities tend to be more volatile than bonds.
Investments in equity securities issued by companies which are principallyengaged in the business of real estate will subject the strategy to risksassociated with the direct ownership of real estate. The majority of the REITsand other real estate companies that may be held by the Fund will be publiclylisted. The performance of any investment in such vehicles will thereforebe subject to normal market fluctuations, correlations and other risks inherentin investing in securities.
Smaller companies’ securities may be less liquid than the securities of largercompanies as a result of inadequate trading volume or restrictions on trading.Smaller companies may possess greater potential for growth, but can alsoinvolve greater risks, such as limited product lines and markets, and financialor managerial resources. Trading in such securities may be subject to moreabrupt price movements and greater fluctuations in available liquidity thantrading in the securities of larger companies.
Funds that invest predominantly in a single market, asset class or sectormay be subject to greater volatility than those funds with a more diversifiedportfolio.
Fund review• Global equity markets started the six-month period under review on a
positive note as strong economic data boosted investor confidence andeased fears of a potential double-dip recession. However, equities changedcourse in May as the European sovereign debt crisis and an apparentChinese slowdown heightened investor concerns over the sustainabilityof the global economic recovery. Markets then rallied in July, to end thesix-month period in positive territory.
You should remember that past performance is not a guide to the future. The price of investments and the income from them may fall as well as rise andinvestors may not get back the full amount invested. For specific risks, please read the Simplified Prospectus.All performance returns are calculated using the quoted price of the accumulation shares. Performance returns are in Sterling.FX Adjusted returns have been calculated by JPMAM. Blended benchmarks have been calculated by JPMAM.Source: J.P. Morgan.A On 01/04/10 the benchmark for the Fund was changed from GPR 250 (Total Return Net) Hedged to GBP to FTSE EPRA/NAREIT Developed Index Hedged to GBP (Total Return Net).Source: FTSE International Limited (“FTSE”) © FTSE [2010]. “FTSE®” is a trade mark of London Stock Exchange Plc and The Financial Times Limited and is used by FTSE International Limited under licence. All rights inthe FTSE indices and/or FTSE ratings vest in FTSE and/or its licensors. Neither FTSE nor its licensors accept any liability for any errors or omissions in the FTSE indices and/or FTSE ratings or underlying data. No furtherdistribution of FTSE Data is permitted without FTSE’s express written consent.
• The Fund outperformed its benchmark. At the regional level, investmentperformance in the US, Japan, and Hong Kong contributed most to relativereturns, while the biggest detractors were positions in the Netherlands,Canada and Germany. At the stock level, the biggest positive contributorsto relative returns included an overweight position in US REIT Digital RealtyTrust and an underweight position in Japanese developer Mitsubishi Estate.The largest stock detractors were underweight positions in US REITAvalonBay Communities and US Health Care REIT.
Fund outlook• The recovery in equity markets and the rebound in real economic activity
have in large part been a function of improving corporate sector profitabilitywhich, in turn, has been driven to a greater extent than usual by aggressivecorporate sector cost cutting. Despite the recent progress in regulatoryreform in Europe, China and the US, we expect equity markets to delivera modest level of returns for the remainder of the year. Nonetheless, westill believe the longer-term diversification provided by a global propertysecurities allocation versus a regional allocation should only be enhancedin this environment. The lower average leverage of property companiesin Asia/Australia, more optimistic expectations for a global economicrecovery and lower average volatility for a global mandate versus anysingle region should all be supportive.
Rolling 12 month performance as at 31 July2010/2009 2009/2008 2008/2007
JPM Global Property SecuritiesA-Class Acc 24.3% -35.8% -19.4%
JPM Global Property SecuritiesI-Class Acc 25.4% -35.3% -18.8%
JPM Global Property SecuritiesX-Class Acc 26.2% -35.0% -18.4%
Benchmark IndexA 21.8% -35.0% -17.2%
Six month performance31/01/10–31/07/10
JPM Global Property Securities A-Class Acc 8.3%
Benchmark IndexA 6.6%
Fund statisticsFund size £15.4m
Benchmark IndexA FTSE EPRA/NAREIT Developed Index Hedged to GBP(Total Return Net)
Fund chargesA-Class Initial 4.25%, Annual 1.50% I-Class Initial Nil, Annual 0.75%X-Class On application

79
ContinuationReturn to Index�
�
Top ten holdings %Sun Hung Kai Properties 5.0Simon Property Group 4.8Unibail 4.1Westfield Group 3.8Public Storage 2.6Equity Residential Properties Trust 2.5Mitsui Fudosan 2.5Boston Properties 2.4CapitaLand 2.4China Overseas Land & Investments 2.2
Geographical breakdown %United States of America 37.4Hong Kong 14.2Japan 11.4Australia 9.5Singapore 6.6France 4.7United Kingdom 4.5Canada 4.0Netherlands 3.3Sweden 0.7Germany 0.6Finland 0.5Belgium 0.1Norway 0.1Forward currency contracts 1.8Net other assets 0.6
Highest/lowest share price and distribution recordDistribution
Highest Lowest per shareCalendar year share price share price (net)
A-Class Accumulation Shares
2006 57.12p 49.79p –
2007 63.37p 50.33p 0.49p
2008 51.88p 21.76p 1.23p
2009 33.83p 18.47p 1.02p
2010B 36.41p 31.61p 0.79p
A-Class Income Shares
2006 57.12p 49.79p –
2007 63.15p 49.88p 0.49p
2008 51.41p 21.00p 1.21p
2009 31.41p 17.46p 0.98p
2010B 33.40p 29.00p 0.73p
I-Class Accumulation Shares
2006 114.6p 99.62p –
2007 127.3p 101.7p 1.89p
2008 104.8p 44.28p 4.17p
2009 69.38p 37.64p 2.51p
2010B 74.88p 64.91p 2.22p
I-Class Income Shares
2006 114.6p 99.62p –
2007 126.4p 99.95p 1.91p
2008 103.1p 42.09p 4.28p
2009 62.94p 34.88p 2.36p
2010B 66.82p 57.92p 2.02p
X-Class Accumulation SharesC
2006 108.9p 99.45p –
2007 121.0p 96.98p 1.90p
2008 100.0p 42.44p 3.62p
2009 66.92p 36.14p 2.72p
2010B 72.37p 62.65p 2.57p
B To 31 July 2010.C X-Class Shares were launched on 16 October 2006.
Portfolio turnover rate31.07.09 102.69%
31.07.10 95.50%
The portfolio turnover rate (PTR) reflects the total of security purchases and sales, less the total of shareissues and cancellations, expressed as a percentage of the average daily net asset values over the period.

80
ContinuationReturn to Index�
�
Net asset values and Total expense ratiosNet assetvalue per Net asset Total
share class Number value per expenseDate £’000 of shares share ratio
A-Class Accumulation Shares
31.01.08 10,559 21,484,462 49.15p 1.67%
31.01.09 4,827 19,496,656 24.76p 1.68%
31.01.10 8,563 26,479,382 32.34p 1.68%
31.07.10 6,503 18,486,994 35.17p 1.68%
A-Class Income Shares
31.01.08 4,764 9,895,024 48.15p 1.68%
31.01.09 1,891 8,086,704 23.38p 1.68%
31.01.10 2,582 8,705,970 29.66p 1.68%
31.07.10 2,604 8,160,957 31.91p 1.68%
I-Class Accumulation Shares
31.01.08 5 5,000 100.3p 0.75%
31.01.09 5 9,000 50.41p 0.75%
31.01.10 30 45,521 66.37p 0.75%
31.07.10 33 45,521 72.54p 0.75%
I-Class Income Shares
31.01.08 5 5,000 95.95p 0.75%
31.01.09 5 10,000 46.70p 0.75%
31.01.10 5 8,000 59.22p 0.75%
31.07.10 6 9,000 63.72p 0.75%
X-Class Accumulation Shares
31.01.08 5,513 5,811,256 94.86p 0.09%
31.01.09 4,490 9,281,392 48.38p 0.06%
31.01.10 5,700 8,899,205 64.06p 0.06%
31.07.10 6,251 8,899,205 70.24p 0.06%
The Net asset value and the Net asset value per income share are shown ex-dividend.
The total expense ratio (TER) takes into account the ACD fee and any fixed expenses charged to revenue overthe financial period, expressed as a percentage of the average daily net asset values over the same period.

81
ContinuationReturn to Index�
�
Market value Total netInvestment Holding £’000 assets %
Portfolio statementAs at 31 July 2010
United States of America – 37.4% (34.8%)AMB Properties 3,800 59 0.4American Campus Communities 4,700 87 0.6Apartment Investment & Management ‘A’ 12,157 166 1.1BioMed Realty Trust 7,900 91 0.6Boston Properties 7,100 370 2.4Brandywine Realty Trust 20,400 148 1.0BRE Properties ‘A’ 3,700 99 0.6Camden Property Trust 4,500 131 0.9Colonial Properties Trust 3,100 32 0.2DCT Industrial Trust 12,600 37 0.2Diamondrock Hospitality 12,500 74 0.5Digital Realty Trust 8,400 334 2.2Duke Realty 12,900 100 0.6DuPont Fabros Technology 4,000 64 0.4Equity Lifestyle Properties 1,600 54 0.4Equity Residential Properties Trust 13,200 383 2.5Excel Trust 4,500 33 0.2Federal Realty Investment Trust 3,000 150 1.0Health Care REIT 7,000 203 1.3Host Hotels & Resorts 22,300 205 1.3Kilroy Realty 2,600 55 0.4Kimco Realty 17,400 169 1.1Lasalle Hotel Properties 3,900 60 0.4Lexington Realty Trust 4,800 20 0.1Liberty Property Trust 7,200 147 1.0Macerich 2,900 76 0.5Mack Cali Realty 800 16 0.1Omega Healthcare Investors 2,800 40 0.3Pennsylvania Real Estate 10,000 78 0.5ProLogis 30,900 212 1.4Public Storage 6,300 399 2.6Regency Centers 7,100 170 1.1Simon Property Group 13,124 741 4.8SL Green Realty Corporation 2,100 80 0.5Strategic Hotels & Resorts 12,300 36 0.2UDR 11,100 150 1.0Ventas 2,116 68 0.4Vornado Realty Trust 6,336 335 2.2Weingarten Realty 4,700 64 0.4
Hong Kong – 14.2% (5.9%)Agile Property 54,000 45 0.3Cheung Kong 5,000 39 0.3China Overseas Land & Investments 248,000 340 2.2China Resources Land 112,000 153 1.0Hang Lung Properties 100,000 266 1.7Henderson Land Development 16,000 64 0.4Henderson Land Development Warrants 2011 2,000 – –Link Real Estate Investment Trust 52,500 87 0.6Sino Land 150,000 181 1.2Sun Hung Kai Properties 82,000 772 5.0Wharf 65,000 228 1.5
Japan – 11.4% (17.0%)Frontier Real Estate Investment 8 37 0.2Japan Excellent 31 97 0.6Japan Retail Fund Investment Trust 157 130 0.8Kenedix Realty Investment 70 148 1.0Mitsubishi Estate 16,000 145 0.9Mitsui Fudosan 40,000 380 2.5Nippon Building Fund 40 219 1.4Nomura Real Estate 63 213 1.4Nomura Real Estate Residential Fund Reit 33 85 0.6Premier Investment 18 45 0.3Sumitomo Realty & Development 11,000 127 0.8TOKYU REIT 40 142 0.9
Australia – 9.5% (9.9%)BGPA 577,927 – –CFS Retail Property Trust 164,180 178 1.2Commonwealth Property Office Fund 334,342 179 1.2Dexus Property Group 465,208 219 1.4Goodman Group 301,550 107 0.7Stockland Trust Group 82,572 180 1.2Westfield Group 83,001 586 3.8
Market value Total netInvestment Holding £’000 assets %
Singapore – 6.6% (5.6%)CapitaCommercial Trust (Units) 74,000 46 0.3CapitaLand 197,000 367 2.4Capitamall Trust 81,000 73 0.5City Developments 35,000 199 1.3Hong Kong Land 69,000 235 1.5Keppel Land 45,000 85 0.6
France – 4.7% (7.3%)Klepierre 4,634 93 0.6Unibail 5,087 637 4.1
United Kingdom – 4.5% (5.3%)British Land 49,458 230 1.5Hammerson 13,369 52 0.3Helical Bar 24,556 73 0.5Land Securities 6,410 39 0.3London & Stamford Property 45,489 52 0.3Segro 85,034 241 1.6
Canada – 4.0% (2.1%)Artis Real Estate Investment Trust 6,677 49 0.3Brookfield Properties 16,610 166 1.1CDN Apartment Property Trust Units 4,400 42 0.3Cominar Real Estate Investment Trust Units 5,100 63 0.4First Capital Reality 6,865 61 0.4Riocan Real Estate Trust 18,588 231 1.5
Netherlands – 3.3% (5.3%)Corio 4,854 181 1.2Nieuwe Steen Investments 8,470 98 0.6VastNed Offices/Industrial 3,670 33 0.2VastNed Retail 2,560 95 0.6Wereldhave 1,936 103 0.7
Sweden – 0.7% (0.7%)Castellum 16,560 110 0.7
Germany – 0.6% (0.9%)Alstria Office 2,320 17 0.1DIC Asset 3,070 17 0.1IVG Immobilien 13,838 61 0.4
Finland – 0.5% (0.9%)Sponda 34,800 84 0.5
Belgium – 0.1% (0.9%)Warehouses De Pauw 636 18 0.1
Norway – 0.1% (0.0%)Norwegian Property 15,660 16 0.1
Forward currency contracts – 1.8% (0.8%)Australian DollarForward foreign currency position
18/08/2010 £1,559,189 1,559 10.1Forward foreign currency position
18/08/2010 AUD (2,698,559) (1,556) (10.1)Canadian DollarForward foreign currency position
18/08/2010 £404,879 405 2.6Forward foreign currency position
18/08/2010 CAD (632,133) (394) (2.6)EuroForward foreign currency position
18/08/2010 u220,476 184 1.2Forward foreign currency position
18/08/2010 £(184,814) (185) (1.2)Forward foreign currency position
18/08/2010 £1,590,663 1,591 10.3Forward foreign currency position
18/08/2010 u(1,910,381) (1,595) (10.4)Hong Kong DollarForward foreign currency position
18/08/2010 £2,782,111 2,782 18.1Forward foreign currency position
18/08/2010 HKD (32,690,847) (2,703) (17.6)Forward foreign currency position
18/08/2010 HKD 3,160,330 261 1.7Forward foreign currency position
18/08/2010 £(261,082) (261) (1.7)

82
ContinuationReturn to Index�
�
Portfolio statement – continuedAs at 31 July 2010
Market value Total netInvestment Holding £’000 assets %
Japanese YenForward foreign currency position
18/08/2010 £2,058,328 2,058 13.4Forward foreign currency position
18/08/2010 ¥(274,307) (2,037) (13.2)Singapore DollarForward foreign currency position
18/08/2010 £746,970 747 4.9Forward foreign currency position
18/08/2010 SGD (1,562,498) (737) (4.8)Forward foreign currency position
18/08/2010 SGD 309,469 146 0.9Forward foreign currency position
18/08/2010 £(146,485) (147) (1.0)Swedish KronaForward foreign currency position
18/08/2010 £68,188 68 0.4Forward foreign currency position
18/08/2010 SEK (770,827) (68) (0.4)US DollarForward foreign currency position
18/08/2010 £7,259,225 7,259 47.1Forward foreign currency position
18/08/2010 $(10,993,741) (7,058) (45.8)Forward foreign currency position
18/08/2010 $156,231 100 0.6Forward foreign currency position
18/08/2010 AUD (176,658) (102) (0.7)Forward foreign currency position
18/08/2010 $217,860 140 0.9Forward foreign currency position
18/08/2010 £(143,389) (143) (0.9)Forward foreign currency position
18/08/2010 $1,371,900 881 5.7Forward foreign currency position
18/08/2010 £(884,930) (885) (5.7)
Investment assets 15,305 99.4
Net other assets 92 0.6
Net assets 15,397 100.0
Unless otherwise stated the above securities are admitted to official stock exchange listings or trade on aregulated market.
The comparative percentage figures in brackets are at 31 January 2010.A Unquoted security

83
ContinuationReturn to Index�
�
£’000
Total of all purchases for the period 10,297
Major purchases Cost
Sun Hung Kai Properties 1,062China Overseas Land & Investments 530ProLogis 287Sumitomo Realty & Development 283Host Hotels & Resorts 248City Developments 243Tanger Factory Outlet Centers 230Camden Property Trust 200Sino Land 198China Resources Land 197Brookfield Properties 194CapitaLand 193Nippon Building Fund 177Segro 172Westfield Group 172UDR 168Kilroy Realty 167Riocan Real Estate Trust 164Goodman Group 157Stockland Trust Group 148
£’000
Total of all sales for the period 13,466
Major sales Proceeds
Mitsubishi Estate 669Mitsui Fudosan 420Hang Lung Properties 363Unibail 363Japan Real Estate Investment 327Alexandria Real Estate 303Simon Property Group 297ProLogis 275Westfield Group 262British Land 251Tanger Factory Outlet Centers 241GPT Group 240ICADE 240Washington Real Estate Investment Trust 237Sun Hung Kai Properties 235Link Real Estate Investment Trust 216Health Care REIT 211Eurocommercial Properties 206CapitaCommerical Trust (Units) 193Riocan Real Estate Trust 185
Portfolio movements For the six months ended 31 July 2010

84
Return to Index�
Financial statements
Statement of total return(Unaudited)
For the six months ended 31 July2010 2009
£’000 £’000 £’000 £’000
Income
Net capital gains 1,247 1,367
Revenue 375 357
Expenses (94) (55)
Net revenue before taxation 281 302
Taxation (36) (64)
Net revenue after taxation 245 238
Total return before distributions 1,492 1,605
Finance costs: Distributions (245) (242)
Change in net assets attributable to shareholders from investment activities 1,247 1,363
Statement of change in net assets attributable to shareholders(Unaudited)
For the six months ended 31 July2010 2009
£’000 £’000 £’000 £’000
Opening net assets attributable to shareholders 16,880 11,218
Amounts receivable on issue of shares 2,346 1,263
Amounts payable on cancellation of shares (5,266) (734)
(2,920) 529
Change in net assets attributable to shareholders from investment activities (see above) 1,247 1,363
Retained distributions on accumulation shares 191 218
Stamp duty reserve tax (1) –
Closing net assets attributable to shareholders 15,397 13,328
As the comparatives in the above table are for the previous interim period, the Net assets at the end ofthat period will not agree to the Net assets at the start of the current period.
Balance sheet(Unaudited)
As at31 July 2010 31 January 2010
£’000 £’000 £’000 £’000
ASSETS
Investment assets 15,320 16,497
Debtors 3,124 472
Cash and bank balances 124 69
Total other assets 3,248 541
Total assets 18,568 17,038
LIABILITIES
Investment liabilities (15) (55)
Creditors (3,127) (71)
Distribution payable on income shares (29) (32)
Total other liabilities (3,156) (103)
Total liabilities (3,171) (158)
Net assets attributable to shareholders 15,397 16,880

85
ContinuationReturn to Index�
�
JPM Institutional Asia Fund
Investment objective and policyTo invest in a portfolio of securities in the markets of Asia (excluding Japan)and Australasia. The current policy is to invest for capital growth withoutany distribution target.
Risk profileThis equity based Fund is designed for institutional investors looking forbroad market exposure (which may include emerging markets and smallercompanies) to stock markets across the Asia (ex-Japan) and Australasiaregions.
Equity investment is subject to specific risks relating to the performance ofthe individual companies held and the market’s perception of theirperformance. Equities are also subject to systematic risks such as generaleconomic conditions, inflation, interest rates, foreign exchange rates andindustry sector risks. In general terms, equities tend to be more volatile than bonds.
The Fund may be invested in emerging markets, which may be subject toadditional political and economic risks, low liquidity, poor transparencyand greater financial risks.
The underlying assets of the Fund are denominated in currencies other thanSterling and are not hedged back to Sterling. Investors will therefore beexposed to the currency risk of fluctuations between Sterling and the currencydenomination of the underlying assets.
Fund review• Over the six month review period, the Fund produced a strong positive
return and outperformed its benchmark. Asset allocation contributedpositively, with an overweight Hong Kong/China and Thailand and anunderweight Australia benefiting relative returns. Stock selection in Koreaand Taiwan detracted.
• Asian markets were volatile at the start of the year on concerns over Greekfiscal stress, Chinese policy tightening and fears over US bank regulation.Markets rallied unconvincingly from mid-February. In the first quarter,positive stock selection in Hong Kong, India and Indonesia was partiallyoffset by negative stock selection in Taiwan and China. Indonesia andThailand were the best markets, while China continued to perform poorlydue to selective tightening measures centred on the residential propertymarket.
• The second quarter proved tough for Asia, amid heightened concernsover European sovereign debt, Chinese policy tightening and global growth.Australia was a significant underperformer due to the uncertaintiessurrounding the resources profit tax. The ASEAN markets were the strongestagain, while India outperformed on positive earnings revisions. In theFund, stock selection in Australia and Korea detracted.
Fund outlook• We continue to be cautious towards Asian stock markets because we can
see some downside to current earnings forecasts, although this mayalready be partially reflected in share prices.
You should remember that past performance is not a guide to the future. The price of investments and the income from them may fall as well as rise andinvestors may not get back the full amount invested. For specific risks, please read the Simplified Prospectus.All performance returns are calculated using the quoted price of the accumulation or income shares. Performance returns are in Sterling.FX Adjusted returns have been calculated by JPMAM. Blended benchmarks have been calculated by JPMAM.Source: J.P. Morgan.A On 01/08/09 the benchmark for the Fund changed from FTSE World Asia Pacific ex Japan (Total Return Net) to FTSE All World Asia Pacific ex Japan Index (Total Return Net).Source: FTSE International Limited (“FTSE”) © FTSE [2010]. “FTSE®” is a trade mark of London Stock Exchange Plc and The Financial Times Limited and is used by FTSE International Limited under licence. All rights inthe FTSE indices and/or FTSE ratings vest in FTSE and/or its licensors. Neither FTSE nor its licensors accept any liability for any errors or omissions in the FTSE indices and/or FTSE ratings or underlying data. No furtherdistribution of FTSE Data is permitted without FTSE’s express written consent.
• Continued global recovery now seems less certain, as fiscal consolidationand austerity measures will restrain growth in Europe while further USfiscal stimulus appears to be needed, as recent economic data has comein below expectations.
• In Asia we are seeing interest rate rises in ASEAN and Australia in responseto rising inflation. The slowdown in sequential growth in China shouldbring an end to policy tightening, boosting the market.
• Chinese valuations appear cheap, especially banks and property, and forthe second half of 2010 the Fund remains overweight in Hong Kong/Chinaand underweight in Australia, Singapore and Malaysia.
Rolling 12 month performance as at 31 July2010/2009 2009/2008 2008/2007 2007/2006 2006/2005
JPM Institutional Asia I-Class Acc 22.1% 7.6% -10.8% 38.2% 5.6%
JPM Institutional AsiaX-Class Inc 22.8% 8.3% -10.5% 39.0% 6.1%
Benchmark IndexA 23.6% 4.1% -8.6% 33.7% 10.3%
Six month performance31/01/10–31/07/10
JPM Institutional Asia I-Class Acc 10.4%
Benchmark IndexA 9.7%
Fund statisticsFund size £426.9m
Benchmark IndexA FTSE All World Asia Pacific ex Japan(Total Return Net)
Fund chargesH-Class Initial Nil, Annual 2.00% I-Class Initial Nil, Annual 0.70%X-Class On application
Top ten holdings %BHP Billiton 3.9Samsung Electronics 3.0Westpac Banking 2.8China Construction Bank ‘H’ 2.8KB Financial Group 2.6Jardine Matheson 2.4Industrial & Commercial Bank of China ‘H’ 2.4China Life Insurance ‘H’ 2.3China National Building Material ‘H’ 1.8Kerry Properties 1.8

86
ContinuationReturn to Index�
�
Geographical breakdown %Australia 20.2Hong Kong 18.3South Korea 14.2China 12.8India 12.1Taiwan 9.1Singapore 3.4Thailand 2.7Indonesia 1.0Malaysia 0.9New Zealand 0.6Futures 0.0Net other assets 4.7
Highest/lowest share price and distribution recordDistribution
Highest Lowest per shareCalendar year share price share price (net)
H-Class Accumulation SharesB
2009 163.0p 93.27p –
2010C 168.3p 149.9p 0.59p
I-Class Accumulation Shares
2005 147.9p 110.1p 1.80p
2006 165.9p 133.3p 2.67p
2007 235.9p 158.3p 2.10p
2008 217.2p 112.0p 2.66p
2009 224.6p 128.5p 3.83p
2010D 251.5p 205.2p 3.22p
X-Class Income Shares
2005 143.4p 106.6p 2.25p
2006 158.2p 126.7p 3.16p
2007 221.9p 148.5p 2.66p
2008 204.5p 103.9p 3.38p
2009 202.7p 114.6p 4.43p
2010D 223.2p 182.0p 3.49p
B H-Class Accumulation Shares were launched on 2 February 2009.C H-Class Accumulation Shares closed on 1 February 2010.D To 31 July 2010.
Portfolio turnover rate31.07.09 98.68%
31.07.10 62.74%
The portfolio turnover rate (PTR) reflects the total of security purchases and sales, less the total of shareissues and cancellations, expressed as a percentage of the average daily net asset values over the period.
Net asset values and Total expense ratiosNet assetvalue per Net asset Total
share class Number value per expenseDate £’000 of shares share ratio
H-Class Accumulation Shares
31.01.10 383,894 255,367,318 150.3p 2.00%
I-Class Accumulation Shares
31.01.08 407,205 217,104,104 187.6p 0.70%
31.01.09 333,954 242,203,334 137.9p 0.70%
31.01.10 10,902 5,258,749 207.3p 0.70%
31.07.10 408,185 178,298,411 228.9p 0.70%
X-Class Income Shares
31.01.08E 52,464 30,276,158 173.3p 0.09%
31.01.09E 35,134 28,383,249 123.8p 0.06%
31.01.10E 18,652 10,152,216 183.7p 0.06%
31.07.10 18,743 9,206,202 203.6p 0.06%
E The Net asset value and the Net asset value per income share are shown ex-dividend at the financial year end.
The total expense ratio (TER) takes into account the ACD fee and any fixed expenses charged to revenue overthe financial period, expressed as a percentage of the average daily net asset values over the same period.

87
ContinuationReturn to Index�
�
Portfolio statementAs at 31 July 2010
Market value Total netInvestment Holding £’000 assets %
Australia – 20.2% (24.3%)AMP 1,386,405 4,237 1.0Asciano Group 6,821,512 6,661 1.6Australia & New Zealand Bank Group 547,897 7,274 1.7BHP Billiton 719,440 16,672 3.9Brambles 1,283,989 3,991 0.9CSL 123,700 2,366 0.6Fairfax Media 3,878,130 3,305 0.8Leighton 121,900 2,071 0.5National Australia Bank 328,880 4,773 1.1Newcrest Mining 119,681 2,260 0.5Orica 270,650 3,939 0.9QBE Insurance Group 665,575 6,422 1.5Rio Tinto 137,702 5,615 1.3Westpac Banking 871,098 12,069 2.8Woodside Petroleum 200,796 4,824 1.1
Hong Kong – 18.3% (20.9%)BOC Hong Kong 2,825,000 4,638 1.1Cheung Kong 660,000 5,112 1.2China Mobile 372,500 2,423 0.6China Resources Land 942,000 1,283 0.3China Yurun Food Group 996,000 2,079 0.5Daphne International 8,130,000 4,839 1.1Esprit 580,400 2,317 0.5Glorious Property 15,834,000 3,311 0.8GOME Electrical Appliances 14,639,000 3,255 0.8Hong Kong Electronics 543,000 2,103 0.5Jardine Matheson 403,885 10,242 2.4Jardine Strategic 257,014 3,835 0.9Kerry Properties 2,352,000 7,582 1.8Li Ning 1,548,000 3,288 0.8Lifestyle International 2,685,500 3,552 0.8Parkson Retail Group 3,733,000 4,092 1.0Ports Design 2,893,500 4,769 1.1Standard Chartered 69,200 1,294 0.3Tencent 282,300 3,491 0.8Wharf 748,000 2,625 0.6Wynn Macau 1,494,400 1,631 0.4
South Korea – 14.2% (14.9%)Daelim Industrial 131,100 4,742 1.1GS Engineering & Construction 62,431 2,693 0.6Hanwha Chemical 4 – –Hyosung 44,400 1,966 0.5Hyundai Heavy Industries 9,700 1,408 0.3Kangwon Land 206,690 2,207 0.5KB Financial Group 393,183 10,947 2.6Korea Electric Power 75,620 1,357 0.3LG Electronics 31,200 1,687 0.4LG Uplus 1,099,936 4,745 1.1Lotte Shopping 24,567 4,735 1.1POSCO 16,280 4,330 1.1Samsung Electronics 29,430 12,888 3.0Samsung Engineering 50,218 3,353 0.8Shinsegae 11,000 3,366 0.8
China – 12.8% (12.2%)China Construction Bank ‘H’ 21,557,000 11,725 2.8China Life Insurance ‘H’ 3,406,000 9,699 2.3China National Building Material ‘H’ 6,388,000 7,741 1.8China Petroleum & Chemical ‘H’ 10,050,000 5,184 1.2China Shenhua Energy ‘H’ 1,445,000 3,571 0.8China Vanke ‘B’ 2,367,155 1,982 0.5CNOOC 2,805,000 3,023 0.7Industrial & Commercial Bank of China ‘H’ 20,628,000 10,111 2.4Jiangxi Copper ‘H’ 973,000 1,383 0.3
Market value Total netInvestment Holding £’000 assets %
India – 12.1% (10.2%)Ambuja Cements 1,303,425 2,123 0.5Bharat Heavy Electricals 37,000 1,247 0.3Bharat Heavy Electricals ELN 2013 (UBS) 61,700 2,093 0.5HDFC Bank 122,670 3,607 0.8HDFC Bank ELN 2014 (JPMorgan) 69,789 2,834 0.7Hindalco Industries ELN 2012 (Deutsche Bank) 2,762,900 6,079 1.4ICICI Bank ADR 125,000 3,123 0.7Infosys Technologies ADR 81,625 3,161 0.7Infrastructure Development Finance 2,734,240 7,029 1.7Maruti Suzuki India 254,500 4,226 1.0Reliance Industries GDR 223,000 6,236 1.5Rural Electrification 720,000 3,122 0.7Tata Motors 152,000 1,778 0.4Tata Motors ELN 2014 (JPMorgan) 110,400 1,314 0.3Tata Power 202,080 3,690 0.9
Taiwan – 9.1% (9.0%)Advanced Semiconductor Engineering 7,107,583 3,580 0.8AU Optronics 6,740,020 4,098 1.0Compal Electronics 4,540,000 3,818 0.9Fubon Financial 3,556,000 2,805 0.7Hon Hai Precision Industry 2,162,689 5,599 1.3Innolux Display 2,271,000 1,577 0.4MediaTek 307,633 2,673 0.6Taiwan Fertilizer 1,712,000 3,044 0.7Taiwan Semiconductor Manufacturing 3,986,237 4,976 1.2Unimicron Technology 3,286,000 3,515 0.8Yuanta Financial Holdings 8,353,000 3,001 0.7
Singapore – 3.4% (2.4%)CapitaLand 1,001,834 1,865 0.4DBS Group 1,011,808 6,868 1.6Sembcorp Industries 644,620 1,282 0.3SingTel 1,614,000 2,366 0.6Wilmar International 751,000 2,216 0.5
Thailand – 2.7% (1.9%)Banpu (Alien Market) 99,800 1,239 0.3Krung Thai Bank (Alien Market) 10,049,700 2,558 0.6Land & House Non-Voting Depository Receipt 9,255,800 1,031 0.2PTT Public (Alien Market) 436,000 2,194 0.5Siam Cement Non-Voting Depository Receipt 429,100 2,296 0.5Siam Commercial Bank (Alien Market) 1,413,800 2,495 0.6
Indonesia – 1.0% (2.7%)Bank Mandiri (Persero) 3,418,000 1,459 0.3Bank Rakyat Indonesia 2,426,000 1,697 0.4Indo Tambangraya Megah 450,500 1,212 0.3
Malaysia – 0.9% (0.4%)CIMB Group Holdings 2,000,800 2,984 0.7IOI 856,000 883 0.2
New Zealand – 0.6% (0.6%)Fletcher Building 763,967 2,700 0.6
Futures – 0.0% (0.0%)H-Shares Index Futures Aug 2010 135 (36) –MSCI Taiwan Index Futures Aug 2010 77 (6) –
Investment assets 406,734 95.3
Net other assets 20,194 4.7
Net assets 426,928 100.0
Unless otherwise stated the above securities are admitted to official stock exchange listings or trade on aregulated market.
The comparative percentage figures in brackets are at 31 January 2010.

88
ContinuationReturn to Index�
�
£’000
Total of all purchases for the period 132,849
Major purchases Cost
Hindalco Industries ELN 2012 (Deutsche Bank) 6,445Brambles 5,506DBS Group 5,084LG Electronics 4,919KB Financial Group 4,245Glorious Property 4,072Industrial & Commercial Bank of China ‘H’ 3,956Parkson Retail Group 3,846Tencent 3,487ICICI Bank ADR 3,414Unimicron Technology 3,330GOME Electrical Appliances 3,277POSCO 3,239China Unicom 3,190China Life Insurance ‘H’ 3,137Westpac Banking 3,114Rural Electrification 3,100Esprit 2,963CIMB Group Holdings 2,935AMP 2,764
£’000
Total of all sales for the period 175,872
Major sales Proceeds
Westpac Banking 7,208China Resources Land 6,991Cheung Kong 5,761Hindalco Industries ELN 2012 (Deutsche Bank) 5,566China Construction Bank ‘H’ 5,532Hang Lung Properties 5,235Woolworths 5,191Shinhan Financial Group 4,941Astra International 4,655Origin Energy 4,617China Overseas Land & Investments 4,382Wharf 4,127United Overseas Bank 3,864China Unicom 3,502LG Electronics 3,450Taishin Financial Holdings 3,344Hana Financial Group 3,175Evergreen Marine 3,060Wynn Macau 2,885CSL 2,841
Portfolio movements For the six months ended 31 July 2010

89
Return to Index�
Financial statements
Statement of total return(Unaudited)
For the six months ended 31 July2010 2009
£’000 £’000 £’000 £’000
Income
Net capital gains 38,871 121,779
Revenue 5,867 6,285
Expenses (1,490) (3,632)
Net revenue before taxation 4,377 2,653
Taxation (377) (310)
Net revenue after taxation 4,000 2,343
Total return before distributions 42,871 124,122
Finance costs: Distributions 9 (296)
Change in net assets attributable to shareholders from investment activities 42,880 123,826
Statement of change in net assets attributable to shareholders(Unaudited)
For the six months ended 31 July2010 2009
£’000 £’000 £’000 £’000
Opening net assets attributable to shareholders 413,448 369,088
Amounts receivable on issue of shares 392,088 338,667
Amounts payable on cancellation of shares (421,488) (404,549)
(29,400) (65,882)
Change in net assets attributable to shareholders from investment activities (see above) 42,880 123,826
Closing net assets attributable to shareholders 426,928 427,032
As the comparatives in the above table are for the previous interim period, the Net assets at the end ofthat period will not agree to the Net assets at the start of the current period.
Balance sheet(Unaudited)
As at31 July 2010 31 January 2010
£’000 £’000 £’000 £’000
ASSETS
Investment assets 406,776 411,651
Debtors 1,462 5,836
Cash and bank balances 19,574 7,281
Total other assets 21,036 13,117
Total assets 427,812 424,768
LIABILITIES
Investment liabilities (42) (87)
Creditors (842) (10,879)
Distribution payable on income shares – (354)
Total other liabilities (842) (11,233)
Total liabilities (884) (11,320)
Net assets attributable to shareholders 426,928 413,448
90
ContinuationReturn to Index�
�
JPM Institutional Continental Europe Fund
Investment objective and policyTo invest in a portfolio of Continental European securities. The current policyis to invest for capital growth without any distribution target.
Risk profileThis equity based Fund is designed for institutional investors looking forconservatively managed broad market exposure to Continental Europeanstock markets (which may include investment in emerging European marketsand smaller companies).
Equity investment is subject to specific risks relating to the performance ofthe individual companies held and the market’s perception of theirperformance. Equities are also subject to systematic risks such as generaleconomic conditions, inflation, interest rates, foreign exchange rates andindustry sector risks. In general terms, equities tend to be more volatile than bonds.
The underlying assets of the Fund are denominated in currencies other thanSterling and are not hedged back to Sterling. Investors will therefore beexposed to the currency risk of fluctuations between Sterling and the currencydenomination of the underlying assets.
Fund review• European stock markets experienced a volatile six months as worries over
government debt levels in some eurozone countries sparked concernsover the outlook for regional economic growth.
• Against this backdrop, the Fund’s preference for stocks with strong valueand/or growth characteristics resulted in it producing a positive returnand outperforming its benchmark. Positive contributors to relative returnsincluded stock selection in the chemicals, fixed line telecoms and nonlifeinsurance sectors. Stock selection in the industrial engineering sector andunderweight positions in the mobile telecoms and food producers sectorswere among the detractors.
• At the stock level, the Fund benefited from an overweight position inLanxess, the chemical producer, which reported a first-quarter profitversus a loss in the same period a year earlier, citing a strong recoveryin demand. An underweight position in Assicurazioni Generali was alsopositive in relative terms, as insurers were hurt by concerns over theirsovereign debt exposures.
• Stock-level detractors from relative returns included an underweightposition in Swiss engineering group ABB, which received broker upgradesafter reporting better-than-expected second-quarter earnings, driven bymargin improvements. An underweight in Nestle was also detrimental inrelative terms as the food producer reported better-than-expected first-quarter sales growth due to improving volumes.
• However, the Fund benefited in relative terms from an overweight positionin Bekaert, the maker of steel wire and coatings, which reported stronger-than-expected first-half profit and raised its three-year profitability forecaston the growth of its operations in Asia.
You should remember that past performance is not a guide to the future. The price of investments and the income from them may fall as well as rise andinvestors may not get back the full amount invested. For specific risks, please read the Simplified Prospectus.All performance returns are calculated using the quoted price of the accumulation or income shares. Performance returns are in Sterling.FX Adjusted returns have been calculated by JPMAM. Blended benchmarks have been calculated by JPMAM.Source: J.P. Morgan.A On 01/10/09 the name of the benchmark changed from the FTSE World Europe ex UK (Total Return Net) to the FTSE All World Developed Europe ex UK (Total Return Net).Source: FTSE International Limited (“FTSE”) © FTSE [2010]. “FTSE®” is a trade mark of London Stock Exchange Plc and The Financial Times Limited and is used by FTSE International Limited under licence. All rights inthe FTSE indices and/or FTSE ratings vest in FTSE and/or its licensors. Neither FTSE nor its licensors accept any liability for any errors or omissions in the FTSE indices and/or FTSE ratings or underlying data. No furtherdistribution of FTSE Data is permitted without FTSE’s express written consent.
Fund outlook• Investors remain concerned over the impact of the sovereign debt crisis
on the regional economic recovery, particularly given that austeritymeasures from several European governments are likely to weigh ongrowth. However, equity valuations have become more attractive followingstrong second-quarter corporate earnings reports and should providesupport if the economic outlook stabilises.
Rolling 12 month performance as at 31 July2010/2009 2009/2008 2008/2007 2007/2006 2006/2005
JPM Institutional Continental Europe I-Class Acc 13.8% -15.3% -10.2% 23.0% 18.7%
JPM Institutional Continental EuropeX-Class Inc 14.3% -14.9% -9.9% 23.5% 19.2%
Benchmark IndexA 11.2% -10.4% -8.0% 21.1% 16.0%
Six month performance31/01/10–31/07/10
JPM Institutional Continental Europe I-Class Acc 1.9%
Benchmark Index 0.3%
Fund statisticsFund size £102.0m
Benchmark IndexA FTSE All World Developed Europe ex UK(Total Return Net)
Fund chargesI-Class Initial Nil, Annual 0.60%X-Class On application
Top ten holdings %TOTAL S.A. 3.4Novartis 3.2Nestle 3.0BNP Paribas 2.6Banco Santander 2.3Sanofi-Aventis 2.1Telefonica 2.1Allianz 2.1BASF 2.0Daimler 2.0

91
ContinuationReturn to Index�
�
Geographical breakdown %France 20.4Germany 20.4Switzerland 15.1Italy 9.3Spain 9.0Netherlands 7.2Finland 4.3Sweden 3.8Belgium 3.4Denmark 2.0Norway 1.9Austria 1.0Ireland 0.5Portugal 0.3Greece 0.1Net other assets 1.3
Highest/lowest share price and distribution recordDistribution
Highest Lowest per shareCalendar year share price share price (net)
I-Class Accumulation Shares
2005 257.4p 201.3p 2.88p
2006 311.9p 253.1p 3.89p
2007 363.9p 309.0p 4.88p
2008 355.6p 201.2p 7.38p
2009 323.0p 188.9p 9.66p
2010B 326.2p 271.6p 6.95p
X-Class Income Shares
2005 251.0p 195.7p 3.69p
2006 299.6p 242.7p 4.67p
2007 343.8p 293.1p 5.79p
2008 334.6p 185.7p 8.31p
2009 285.9p 166.7p 10.08p
2010B 287.3p 234.4p 7.21p
B To 31 July 2010.
Portfolio turnover rate31.07.09 63.44%
31.07.10 76.61%
The portfolio turnover rate (PTR) reflects the total of security purchases and sales, less the total of shareissues and cancellations, expressed as a percentage of the average daily net asset values over the period.
Net asset values and Total expense ratiosNet assetvalue per Net asset Total
share class Number value per expenseDate £’000 of shares share ratio
I-Class Accumulation Shares
31.01.08 119,676 39,188,878 305.4p 0.60%
31.01.09 97,895 43,400,715 225.6p 0.60%
31.01.10 84,624 29,227,516 289.5p 0.60%
31.07.10 94,243 31,970,476 294.8p 0.60%
X-Class Income Shares
31.01.08C 31,862 11,337,554 281.0p 0.08%
31.01.09C 17,759 8,927,752 198.9p 0.06%
31.01.10C 10,589 4,245,028 249.4p 0.06%
31.07.10 7,762 3,048,897 254.6p 0.06%
C The Net asset value and the Net asset value per income share are shown ex-dividend at the financial year end.
The total expense ratio (TER) takes into account the ACD fee and any fixed expenses charged to revenue overthe financial period, expressed as a percentage of the average daily net asset values over the same period.

92
ContinuationReturn to Index�
�
Market value Total netInvestment Holding £’000 assets %
Portfolio statementAs at 31 July 2010
France – 20.4% (21.4%)Alstom 1,259 42 –Alten 2,291 43 –Arkema 21,791 611 0.6Atos Origin 16,025 433 0.4BIC 2,868 138 0.1BNP Paribas 60,040 2,645 2.6Bonduelle 831 46 –Bureau Veritas 20,129 786 0.8Carrefour 2,183 64 0.1Casino Guichard-Perrachon 9,486 520 0.5Christian Dior 12,192 850 0.8Ciments Francais ‘A’ 2,263 118 0.1CNP Assurances 19,812 255 0.2Compagnie de Saint-Gobain 5,981 163 0.2Credit Agricole 33,841 296 0.3Dassault Systemes 1,318 54 0.1France Telecom 36,011 484 0.5GDF Suez 9,994 213 0.2Groupe Steria 8,220 143 0.1Ipsos 5,655 144 0.1Legrand Promesse 21,842 450 0.4LVMH 860 67 0.1Natixis 17,070 58 0.1Pernod-Ricard 8,942 454 0.4Plastic-Omnium 2,296 76 0.1PPR 4,172 355 0.3Publicis Groupe 8,786 253 0.2Rallye 4,306 95 0.1Renault 13,403 381 0.4Rexel Promesses 15,741 168 0.2Rhodia 23,246 309 0.3Safran 16,297 281 0.3Sanofi-Aventis 58,064 2,149 2.1SCOR 15,489 214 0.2SEB 8,850 426 0.4Sequana 12,264 109 0.1Societe Generale 36,982 1,370 1.3Sodexo 4,922 199 0.2Technip 5,029 214 0.2TOTAL S.A. 105,807 3,443 3.4Valeo 19,460 444 0.4Vallourec (Usin a Tub de Lor Escaut) 10,810 682 0.7Vicat 2,185 97 0.1Vivendi 12,928 196 0.2Wendel 4,453 162 0.2Zodiac 9,620 350 0.3
Germany – 20.4% (16.6%)Aareal Bank 6,254 84 0.1Allianz 28,874 2,126 2.1Asian Bamboo 2,448 66 0.1Aurubis 13,353 390 0.4Axel Springer 1,128 86 0.1BASF 56,764 2,090 2.0Bauer 3,669 96 0.1Bayer 3,263 119 0.1Bechtle 9,207 170 0.2Bertrandt 4,048 111 0.1BMW 16,540 560 0.6Celesio 3,946 59 0.1Commerzbank 7,484 43 –Continental 2,822 114 0.1Daimler 57,993 1,994 2.0Delticom 1,778 58 0.1Deutsche Bank 43,030 1,929 1.9Deutsche Post 36,650 404 0.4Deutsche Telekom 10,592 91 0.1Dialog Semiconductor 4,863 42 –Dragerwerk Non-Voting Preference 2,371 101 0.1Drillisch 22,684 88 0.1E.ON 65,094 1,237 1.2Fuchs Petrolub Non-Voting Preference 3,490 228 0.2Hannover Rueckversicherungs 19,574 601 0.6Henkel Non-Voting Preference 19,907 632 0.6Hochtief 6,290 261 0.3Infineon Technologies 66,566 285 0.3Jungheinrich Non-Voting Preference 3,208 59 0.1Lanxess 30,459 947 0.9Leoni 10,724 207 0.2Merck 957 54 0.1Metro 3,943 138 0.1MTU Aero Engines 12,499 463 0.5
Market value Total netInvestment Holding £’000 assets %
MunichRe 5,606 494 0.5ProSiebenSat.1 Media Preference 47,230 534 0.6Rheinmetall 1,999 76 0.1RWE ‘A’ 27,604 1,250 1.2SAP 2,830 83 0.1Siemens 23,852 1,496 1.5Stada Arzneimittel 15,090 316 0.3Tognum 4,741 60 0.1Tui 6,039 40 –Wincor Nixdorf 3,418 125 0.1
Switzerland – 15.1% (14.4%)Austriamicrosystems 1,705 36 –Clariant 62,221 526 0.5Compagnie Financiere Richemont ‘A’ 34,494 864 0.8Credit Suisse 39,191 1,162 1.1EMS-Chemie Holding 655 65 0.1Fischer (George) 1,128 284 0.3Forbo 416 128 0.1Gategroup 3,833 83 0.1Helvetia 730 145 0.1Julius Baer 70,054 521 0.5Kuhne & Nagel 692 48 –Nestle 95,353 3,033 3.0Novartis 104,178 3,253 3.2Roche (Genusscheine) 14,029 1,174 1.2Sika 39 48 –Sonova 2,513 196 0.2Sulzer 5,632 374 0.4Swatch Group 1,475 293 0.3Swiss Life 4,627 310 0.3UBS 155,756 1,712 1.7Valora Holding 866 141 0.1Zurich Financial Services 7,403 1,106 1.1
Italy – 9.3% (9.1%)Amplifon 12,353 39 –Astaldi 25,724 100 0.1Autostrada Torino-Milano 14,452 126 0.1Banca Popolare Dell’Emilia Romagna 7,568 60 0.1Benetton Group 29,385 132 0.1Brembo 12,263 53 0.1Compagnie Industriali Riunite 150,744 183 0.2Danieli & Co 10,857 135 0.1DiaSorin 9,736 231 0.2Enel 560,751 1,767 1.7ENI 77,694 1,014 1.0Esprinet 10,848 66 0.1Finmeccanica 38,165 268 0.3Indesit 30,504 232 0.2Intesa Sanpaolo 376,685 803 0.8Iride 116,813 121 0.1Maire Tecnimont 75,633 180 0.2Marr 12,126 67 0.1Mediaset 85,358 352 0.3Parmalat 606,029 952 0.9Piaggio & C 49,867 89 0.1Prysmian 43,057 464 0.5Recordati 24,804 118 0.1Saipem 4,633 106 0.1Seat-Pagine Gialle 995,094 114 0.1SIAS 23,355 141 0.1Sorin 76,535 96 0.1Telecom Italia 85,801 70 0.1Tenaris 20,187 258 0.3Unicredito Italiano 558,033 1,002 1.0Yoox 18,615 97 0.1
Spain – 9.0% (13.1%)Antena 3 Television 10,527 50 –Banco Bilbao Vizcaya Argentaria 148,862 1,289 1.3Banco Santander 280,514 2,350 2.3Duro Felguera 8,346 57 0.1EBRO Puleva 17,153 194 0.2Endesa 32,415 518 0.5Gas Natural SDG 15,232 164 0.2Gestevision Telecinco 19,277 143 0.1Industria de Diseno Textil 22,131 940 0.9Obrascon Huarte Lain 11,959 199 0.2Prosegur Compania Securidad 5,397 171 0.2Repsol YPF 44,581 677 0.7Telefonica 147,428 2,147 2.1Viscofan 11,109 210 0.2
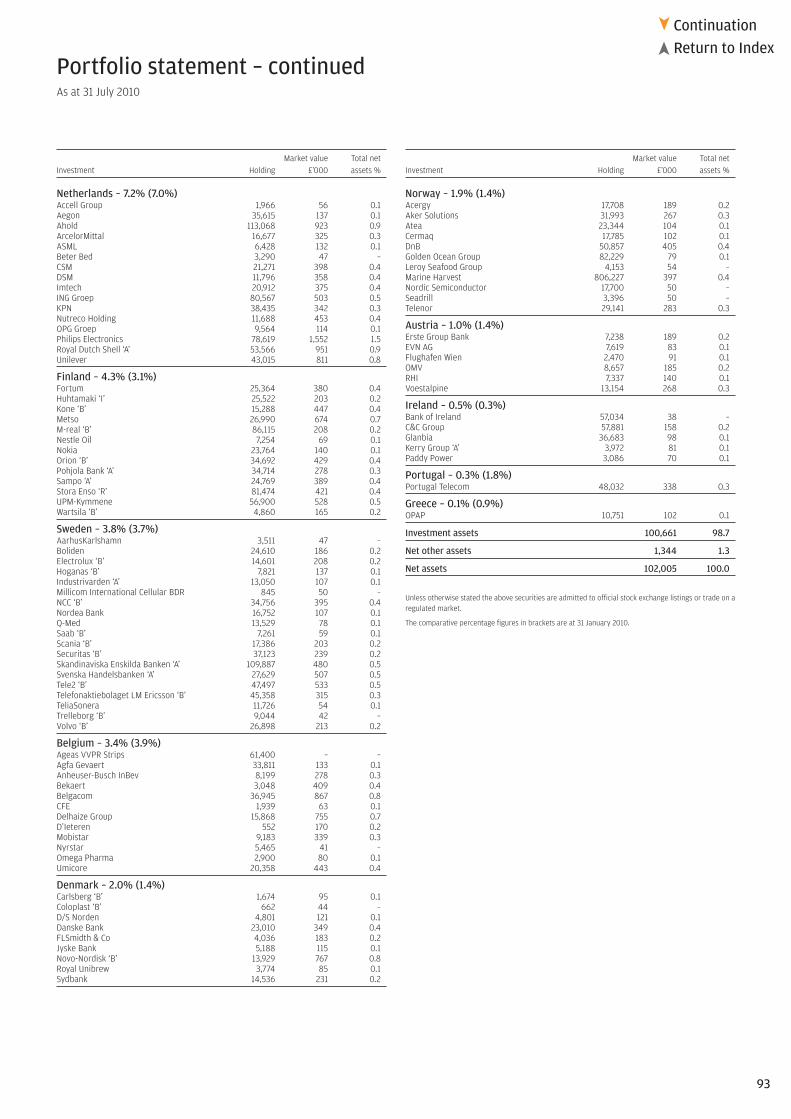
93
ContinuationReturn to Index�
�
Portfolio statement – continuedAs at 31 July 2010
Market value Total netInvestment Holding £’000 assets %
Netherlands – 7.2% (7.0%)Accell Group 1,966 56 0.1Aegon 35,615 137 0.1Ahold 113,068 923 0.9ArcelorMittal 16,677 325 0.3ASML 6,428 132 0.1Beter Bed 3,290 47 –CSM 21,271 398 0.4DSM 11,796 358 0.4Imtech 20,912 375 0.4ING Groep 80,567 503 0.5KPN 38,435 342 0.3Nutreco Holding 11,688 453 0.4OPG Groep 9,564 114 0.1Philips Electronics 78,619 1,552 1.5Royal Dutch Shell ‘A’ 53,566 951 0.9Unilever 43,015 811 0.8
Finland – 4.3% (3.1%)Fortum 25,364 380 0.4Huhtamaki ‘I’ 25,522 203 0.2Kone ‘B’ 15,288 447 0.4Metso 26,990 674 0.7M-real ‘B’ 86,115 208 0.2Nestle Oil 7,254 69 0.1Nokia 23,764 140 0.1Orion ‘B’ 34,692 429 0.4Pohjola Bank ‘A’ 34,714 278 0.3Sampo ‘A’ 24,769 389 0.4Stora Enso ‘R’ 81,474 421 0.4UPM-Kymmene 56,900 528 0.5Wartsila ‘B’ 4,860 165 0.2
Sweden – 3.8% (3.7%)AarhusKarlshamn 3,511 47 –Boliden 24,610 186 0.2Electrolux ‘B’ 14,601 208 0.2Hoganas ‘B’ 7,821 137 0.1Industrivarden ‘A’ 13,050 107 0.1Millicom International Cellular BDR 845 50 –NCC ‘B’ 34,756 395 0.4Nordea Bank 16,752 107 0.1Q-Med 13,529 78 0.1Saab ‘B’ 7,261 59 0.1Scania ‘B’ 17,386 203 0.2Securitas ‘B’ 37,123 239 0.2Skandinaviska Enskilda Banken ‘A’ 109,887 480 0.5Svenska Handelsbanken ‘A’ 27,629 507 0.5Tele2 ‘B’ 47,497 533 0.5Telefonaktiebolaget LM Ericsson ‘B’ 45,358 315 0.3TeliaSonera 11,726 54 0.1Trelleborg ‘B’ 9,044 42 –Volvo ‘B’ 26,898 213 0.2
Belgium – 3.4% (3.9%)Ageas VVPR Strips 61,400 – –Agfa Gevaert 33,811 133 0.1Anheuser-Busch InBev 8,199 278 0.3Bekaert 3,048 409 0.4Belgacom 36,945 867 0.8CFE 1,939 63 0.1Delhaize Group 15,868 755 0.7D’Ieteren 552 170 0.2Mobistar 9,183 339 0.3Nyrstar 5,465 41 –Omega Pharma 2,900 80 0.1Umicore 20,358 443 0.4
Denmark – 2.0% (1.4%)Carlsberg ‘B’ 1,674 95 0.1Coloplast ‘B’ 662 44 –D/S Norden 4,801 121 0.1Danske Bank 23,010 349 0.4FLSmidth & Co 4,036 183 0.2Jyske Bank 5,188 115 0.1Novo-Nordisk ‘B’ 13,929 767 0.8Royal Unibrew 3,774 85 0.1Sydbank 14,536 231 0.2
Market value Total netInvestment Holding £’000 assets %
Norway – 1.9% (1.4%)Acergy 17,708 189 0.2Aker Solutions 31,993 267 0.3Atea 23,344 104 0.1Cermaq 17,785 102 0.1DnB 50,857 405 0.4Golden Ocean Group 82,229 79 0.1Leroy Seafood Group 4,153 54 –Marine Harvest 806,227 397 0.4Nordic Semiconductor 17,700 50 –Seadrill 3,396 50 –Telenor 29,141 283 0.3
Austria – 1.0% (1.4%)Erste Group Bank 7,238 189 0.2EVN AG 7,619 83 0.1Flughafen Wien 2,470 91 0.1OMV 8,657 185 0.2RHI 7,337 140 0.1Voestalpine 13,154 268 0.3
Ireland – 0.5% (0.3%)Bank of Ireland 57,034 38 –C&C Group 57,881 158 0.2Glanbia 36,683 98 0.1Kerry Group ‘A’ 3,972 81 0.1Paddy Power 3,086 70 0.1
Portugal – 0.3% (1.8%)Portugal Telecom 48,032 338 0.3
Greece – 0.1% (0.9%)OPAP 10,751 102 0.1
Investment assets 100,661 98.7
Net other assets 1,344 1.3
Net assets 102,005 100.0
Unless otherwise stated the above securities are admitted to official stock exchange listings or trade on aregulated market.
The comparative percentage figures in brackets are at 31 January 2010.

94
ContinuationReturn to Index�
�
£’000
Total of all purchases for the period 51,679
Major purchases Cost
Novartis 1,372Allianz 1,085Philips Electronics 1,079Compagnie Financiere Richemont ‘A’ 1,022Ahold 1,022BNP Paribas 988Voestalpine 890Parmalat 887UBS 867Bureau Veritas 784Siemens 769ENI 763Societe Generale 731Saipem 649Deutsche Bank 631Sanofi-Aventis 609Lanxess 602Credit Suisse 593Arkema 588Daimler 578
£’000
Total of all sales for the period 44,903
Major sales Proceeds
Telefonica 1,181Credit Suisse 983Compagnie de Saint-Gobain 893Banco Santander 805DSM 801Portugal Telecom 779Roche (Genusscheine) 774Banco Bilbao Vizcaya Argentaria 756Bilfinger Berger 694Kinnevik Investment ‘B’ 618Voestalpine 598Mapfre 549Anheuser-Busch InBev 544Rheinmetall 536Adecco 534Saipem 509Svenska Cellulosa ‘B’ 503ArcelorMittal 502PPR 500Gas Natural SDG 486
Portfolio movements For the six months ended 31 July 2010

95
Return to Index�
Financial statements
Statement of total return(Unaudited)
For the six months ended 31 July2010 2009
£’000 £’000 £’000 £’000
Income
Net capital (losses)/gains (895) 13,525
Revenue 2,911 4,091
Expenses (276) (300)
Net revenue before taxation 2,635 3,791
Taxation (349) (711)
Net revenue after taxation 2,286 3,080
Total return before distributions 1,391 16,605
Finance costs: Distributions 23 (192)
Change in net assets attributable to shareholders from investment activities 1,414 16,413
Statement of change in net assets attributable to shareholders(Unaudited)
For the six months ended 31 July2010 2009
£’000 £’000 £’000 £’000
Opening net assets attributable to shareholders 95,213 115,654
Amounts receivable on issue of shares 12,583 8,127
Amounts payable on cancellation of shares (7,205) (19,906)
5,378 (11,779)
Change in net assets attributable to shareholders from investment activities (see above) 1,414 16,413
Closing net assets attributable to shareholders 102,005 120,288
As the comparatives in the above table are for the previous interim period, the Net assets at the end ofthat period will not agree to the Net assets at the start of the current period.
Balance sheet(Unaudited)
As at31 July 2010 31 January 2010
£’000 £’000 £’000 £’000
ASSETS
Investment assets 100,661 94,752
Debtors 1,877 16,783
Cash and bank balances 1,955 5,412
Total other assets 3,832 22,195
Total assets 104,493 116,947
LIABILITIES
Creditors (2,488) (18,965)
Bank overdraft – (2,463)
Distribution payable on income shares – (306)
Total liabilities (2,488) (21,734)
Net assets attributable to shareholders 102,005 95,213

96
ContinuationReturn to Index�
�
JPM Institutional Japan Fund
Highest/lowest share price and distribution recordDistribution
Highest Lowest per shareCalendar year share price share price (net)
I-Class Accumulation Shares
2005 158.3p 99.00p 0.38p
2006 161.6p 128.1p 0.45p
2007 145.1p 122.8p 0.46p
2008 130.9p 87.41p 0.84p
2009 114.8p 85.88p 1.36p
2010A 118.6p 105.4p 0.53p
X-Class Income Shares
2005 158.8p 98.86p 1.00p
2006 161.1p 127.9p 1.09p
2007 144.1p 122.4p 1.21p
2008 130.5p 86.36p 1.52p
2009 113.6p 83.73p 2.14p
2010A 115.3p 102.2p 1.40p
A To 23 April 2010.
Net asset values and Total expense ratiosNet assetvalue per Net asset Total
share class Number value per expenseDate £’000 of shares share ratio
I-Class Accumulation Shares
31.01.08 205,517 174,390,592 117.8p 0.70%
31.01.09 164,288 153,004,870 107.4p 0.70%
31.01.10 4,769 4,579,153 104.1p 0.70%
31.07.10 – – – –
X-Class Income Shares
31.01.08B 19,372 16,697,316 116.0p 0.06%
31.01.09B 15,627 15,015,683 104.1p 0.05%
31.01.10B 2,645 2,614,575 101.2p 0.06%
31.07.10 – – – –
B The Net asset value and the Net asset value per income share are shown ex-dividend at the financial year end.
The total expense ratio (TER) takes into account the ACD fee and any fixed expenses charged to revenue overthe financial period, expressed as a percentage of the average daily net asset values over the same period.
This Fund closed on 23 April 2010.

97
Return to Index�
Financial statements
Statement of total return(Unaudited)
For the six months ended 31 July2010 2009
£’000 £’000 £’000 £’000
Income
Net capital gains/(losses) 684 (4,082)
Revenue 45 164
Expenses (6) (56)
Net revenue before taxation 39 108
Taxation (3) (21)
Net revenue after taxation 36 87
Total return before distributions 720 (3,995)
Finance costs: Distributions (36) (31)
Change in net assets attributable to shareholders from investment activities 684 (4,026)
Statement of change in net assets attributable to shareholders(Unaudited)
For the six months ended 31 July2010 2009
£’000 £’000 £’000 £’000
Opening net assets attributable to shareholders 7,414 179,915
Amounts receivable on issue of shares 601 2,394
Amounts payable on cancellation of shares (8,699) (161,106)
(8,098) (158,712)
Change in net assets attributable to shareholders from investment activities (see above) 684 (4,026)
Closing net assets attributable to shareholders – 17,177
As the comparatives in the above table are for the previous interim period, the Net assets at the end ofthat period will not agree to the Net assets at the start of the current period.
Balance sheet(Unaudited)
As at31 July 2010 31 January 2010
£’000 £’000 £’000 £’000
ASSETS
Investment assets – 7,288
Debtors – 4,421
Cash and bank balances 6 29
Total other assets 6 4,450
Total assets 6 11,738
LIABILITIES
Creditors (6) (4,287)
Distribution payable on income shares – (37)
Total liabilities (6) (4,324)
Net assets attributable to shareholders – 7,414

98
ContinuationReturn to Index�
�
JPM Japan Fund
Investment objective and policyTo provide capital growth over the long term by investing primarily in theshares of Japanese companies.
Risk profileThis equity based Fund is designed for investors looking for broad marketexposure (including smaller company investments) primarily to a singledeveloped stock market.
Equity investment is subject to specific risks relating to the performance ofthe individual companies held and the market’s perception of their performance.Equities are also subject to systematic risks such as general economic conditions,inflation, interest rates, foreign exchange rates and industry sector risks. Ingeneral terms, equities tend to be more volatile than bonds.
This Fund is aggressively managed, which may result in higher volatility ofthe Fund’s performance and bigger differences between the performanceof the Fund and its benchmark when compared to core funds.
Funds that invest predominantly in a single market, asset class or sectormay be subject to greater volatility than those funds with a more diversifiedportfolio.
Smaller companies’ securities may be less liquid than the securities of largercompanies as a result of inadequate trading volume or restrictions on trading.Smaller companies may possess greater potential for growth, but can alsoinvolve greater risks, such as limited product lines and markets, and financialor managerial resources. Trading in such securities may be subject to moreabrupt price movements and greater fluctuations in available liquidity thantrading in the securities of larger companies.
The underlying assets of the Fund are denominated in a currency other thanSterling and are not hedged back to Sterling. Investors will therefore beexposed to the currency risk of fluctuations between Sterling and the currencydenomination of the underlying assets.
Fund review• During the review period, the Japanese stock market fell in local currency
terms but the strength of the Yen meant that it rose slightly in Sterlingterms. Valuations remain at levels typically seen at the bottom of aneconomic cycle, with the TOPIX index trading at a price-to-book ratio of1x versus a long-term average of 1.7x, while valuations in small cap stocksare even more extreme. Over the period, investors were concerned withsovereign debt issues in Europe, austerity measures from numerousgovernments that could potentially restrict global growth and the rate ofunemployment remaining at a stubbornly elevated level, particularly inEurope and the US.
• The Fund underperformed the benchmark over the period. Our stockselection in wholesale trade and machinery was positive but this was morethan offset by negative stock selection in autos and technology.
You should remember that past performance is not a guide to the future. The price of investments and the income from them may fall as well as rise andinvestors may not get back the full amount invested. For specific risks, please read the Simplified Prospectus.All performance returns are calculated using the quoted price of the accumulation shares. Performance returns are in Sterling.FX Adjusted returns have been calculated by JPMAM. Blended benchmarks have been calculated by JPMAM.Source: J.P. Morgan.
Fund outlook• The domestic political outlook is unclear and Japan now has its fifth Prime
Minister in four years.
• The Yen has remained strong and is trading close to a 14-year high againstthe US Dollar. One of the main drivers of Yen appreciation has been thedifference between interest rates in the US and in Japan, with interestrates in the US having fallen faster than in Japan, where they were alreadylow. Our most favoured themes are emerging markets, infrastructure,niche technology and internet services and we are also focusing on severalrestructuring names. Meetings with companies are currently very positiveas many have cut costs aggressively and will reap the rewards once theeconomy enters a fully fledged recovery.
Rolling 12 month performance as at 31 July2010/2009 2009/2008 2008/2007 2007/2006 2006/2005
JPM JapanA-Class Acc 7.4% 1.6% -25.2% -6.6% 3.7%
JPM JapanC-Class Acc 7.3% 3.1% – – –
Benchmark Index 5.6% 0.8% -12.3% -3.1% 21.7%
Six month performance31/01/10–31/07/10
JPM Japan A-Class Acc 0.0%
Benchmark Index 1.9%
Fund statisticsFund size £97.9m
Benchmark Index TOPIX (Total Return Net)
Fund chargesA-Class Initial 4.25%, Annual 1.50%C-Class Initial Nil, Annual 0.75%
Top ten holdings %Mitsui & Co 5.4Nippon Telegraph & Telephone 5.1Osaka Securities Exchange 4.8Trancom 4.7Gree 3.8Futaba Industrial 3.6Press Kogyo 3.4Musashi Seimitsu Industries 3.3Nissin Kogyo 3.2F.C.C. 3.2
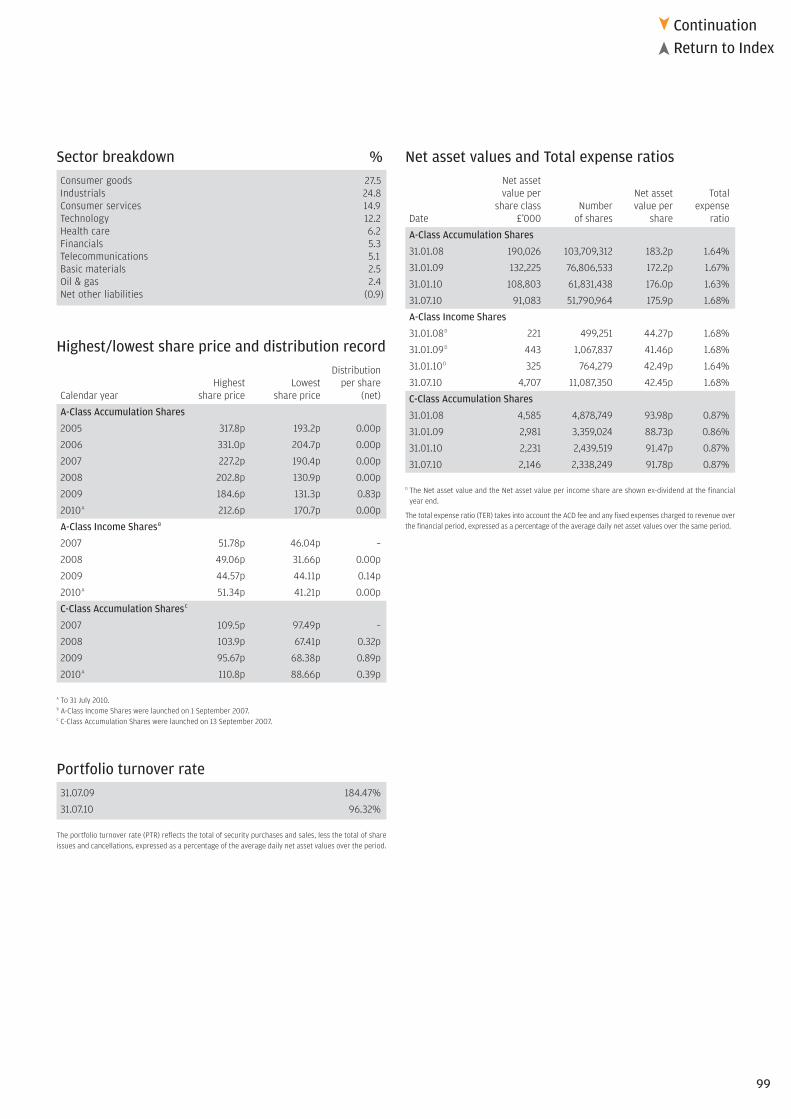
99
ContinuationReturn to Index�
�
Sector breakdown %Consumer goods 27.5Industrials 24.8Consumer services 14.9Technology 12.2Health care 6.2Financials 5.3Telecommunications 5.1Basic materials 2.5Oil & gas 2.4Net other liabilities (0.9)
Highest/lowest share price and distribution recordDistribution
Highest Lowest per shareCalendar year share price share price (net)
A-Class Accumulation Shares
2005 317.8p 193.2p 0.00p
2006 331.0p 204.7p 0.00p
2007 227.2p 190.4p 0.00p
2008 202.8p 130.9p 0.00p
2009 184.6p 131.3p 0.83p
2010A 212.6p 170.7p 0.00p
A-Class Income SharesB
2007 51.78p 46.04p –
2008 49.06p 31.66p 0.00p
2009 44.57p 44.11p 0.14p
2010A 51.34p 41.21p 0.00p
C-Class Accumulation SharesC
2007 109.5p 97.49p –
2008 103.9p 67.41p 0.32p
2009 95.67p 68.38p 0.89p
2010A 110.8p 88.66p 0.39p
A To 31 July 2010.B A-Class Income Shares were launched on 1 September 2007.C C-Class Accumulation Shares were launched on 13 September 2007.
Portfolio turnover rate31.07.09 184.47%
31.07.10 96.32%
The portfolio turnover rate (PTR) reflects the total of security purchases and sales, less the total of shareissues and cancellations, expressed as a percentage of the average daily net asset values over the period.
Net asset values and Total expense ratiosNet assetvalue per Net asset Total
share class Number value per expenseDate £’000 of shares share ratio
A-Class Accumulation Shares
31.01.08 190,026 103,709,312 183.2p 1.64%
31.01.09 132,225 76,806,533 172.2p 1.67%
31.01.10 108,803 61,831,438 176.0p 1.63%
31.07.10 91,083 51,790,964 175.9p 1.68%
A-Class Income Shares
31.01.08D 221 499,251 44.27p 1.68%
31.01.09D 443 1,067,837 41.46p 1.68%
31.01.10D 325 764,279 42.49p 1.64%
31.07.10 4,707 11,087,350 42.45p 1.68%
C-Class Accumulation Shares
31.01.08 4,585 4,878,749 93.98p 0.87%
31.01.09 2,981 3,359,024 88.73p 0.86%
31.01.10 2,231 2,439,519 91.47p 0.87%
31.07.10 2,146 2,338,249 91.78p 0.87%
D The Net asset value and the Net asset value per income share are shown ex-dividend at the financial year end.
The total expense ratio (TER) takes into account the ACD fee and any fixed expenses charged to revenue overthe financial period, expressed as a percentage of the average daily net asset values over the same period.

100
ContinuationReturn to Index�
�
Market value Total netInvestment Holding £’000 assets %
Portfolio statementAs at 31 July 2010
Consumer goods – 27.5% (26.3%)Automobiles & parts – 20.0%F.C.C. 250,000 3,107 3.2Futaba Industrial 800,000 3,546 3.6Musashi Seimitsu Industries 245,100 3,254 3.3Nippon Seiki 173,000 1,211 1.2Nissin Kogyo 336,600 3,137 3.2NOK 200,000 2,094 2.1Press Kogyo 1,800,000 3,341 3.4Beverages – 0.4%Mercian 338,000 386 0.4Leisure goods – 0.9%Sony 41,400 833 0.9Personal goods – 6.2%Dr. CI Labo 708 1,386 1.4Honeys 137,410 1,462 1.5Mandom 49,300 876 0.9Pigeon 97,900 2,308 2.4
Industrials – 24.8% (36.6%)Aerospace & defence – 1.5%Showa Aircraft Industry 310,000 1,505 1.5Construction & materials – 0.3%Kanamoto 93,000 294 0.3Electronics & electrical equipment – 1.8%Nippon Electric Glass 209,000 1,707 1.8Industrial engineering – 5.6%Nishio Rent All 305,000 1,264 1.3Star Micronics 263,200 1,794 1.8Wakita 64,000 151 0.2Yokogawa Electric 600,000 2,281 2.3Industrial transportation – 4.7%Trancom 398,900 4,591 4.7Support services – 10.9%Aeon Delight 85,500 1,047 1.1Fidec 36 3 –Hamakyorex 67,800 1,020 1.0Meitec 227,100 2,450 2.5Mitsui & Co 645,100 5,307 5.4Outsourcing 2,665 619 0.6World Intec 253,800 283 0.3
Consumer services – 14.9% (6.3%)General retailers – 8.9%daiei 838,650 2,572 2.6Don Quijote 88,800 1,484 1.5Gree 71,400 3,753 3.8Yamada Denki 23,290 1,008 1.0Media – 1.7%Septeni 3,940 1,697 1.7Travel & leisure – 4.3%PGM Holdings K.K. 4,067 1,594 1.6Round One 900,000 2,593 2.7
Market value Total netInvestment Holding £’000 assets %
Technology – 12.2% (14.4%)Software & computer services – 9.6%DTS 137,400 1,049 1.1GMO Internet 680,000 1,671 1.7Internet Initiative Japan 923 1,629 1.7Nihon Unisys 315,400 1,440 1.5Simplex Technology 3,098 1,525 1.6Yahoo 7,876 1,944 2.0Technology hardware & equipment – 2.6%Mimasu Semiconductor Industry 128,600 967 1.0United Technology Holdings 5,781 1,562 1.6
Health care – 6.2% (0.6%)Pharmaceuticals & biotechnology – 5.1%Astellas Pharma 140,900 3,065 3.1Shionogi 153,000 2,002 2.0Health care equipment & services – 1.1%Asahi Intecc 62,200 693 0.7EPS 215 358 0.4
Financials – 5.3% (16.4%)General financial – 4.8%Osaka Securities Exchange 1,460 4,661 4.8Real estate – 0.5%Hajime Construction 26,300 484 0.5
Telecommunications – 5.1% (0.0%)Fixed line telecommunications – 5.1%Nippon Telegraph & Telephone 188,300 5,019 5.1
Basic materials – 2.5% (0.9%)Chemicals – 1.0%Miraial 57,300 983 1.0Industrial metals – 1.5%JFE 72,700 1,444 1.5
Oil & gas – 2.4% (0.0%)Oil & gas producers – 2.4%JX Holdings 671,700 2,329 2.4
Investment assets 98,783 100.9
Net other liabilities (847) (0.9)
Net assets 97,936 100.0
Unless otherwise stated the above securities are admitted to official stock exchange listings or trade on aregulated market.
The comparative percentage figures in brackets are at 31 January 2010.

101
ContinuationReturn to Index�
�
£’000
Total of all purchases for the period 125,648
Major purchases Cost
Nippon Electric Glass 7,459Mitsui & Co 6,620JX Holdings 6,078Dena 5,383Nippon Telegraph & Telephone 5,282Sumco 4,770Round One 4,457Shinsei Bank 3,913NOK 3,711Leopalace21 3,678Gree 3,622Press Kogyo 3,386Astellas Pharma 3,135Yahoo 3,110JFE Shoji 2,869Nomura 2,741daiei 2,299Meitec 2,287Amada 2,248Koito Manufacturing 2,203
£’000
Total of all sales for the period 140,649
Major sales Proceeds
Yahoo 6,410Haseko 6,363Dena 5,761Nippon Electric Glass 5,432Toyota Motor 5,407THK 4,799Koito Manufacturing 4,799JX Holdings 4,475Sumitomo Mitsui Financial Group 4,445Toyota Boshoku 4,219Sumco 4,187CKD Corporation 4,143SBI 4,007Makino Milling Machine 3,981Mabuchi Motor 3,599JFE Shoji 3,259Yaskawa Electric 3,139Mori Seiki 2,950Shinsei Bank 2,926Sumitomo Heavy Industries 2,699
Portfolio movements For the six months ended 31 July 2010

102
Return to Index�
Financial statements
Statement of total return(Unaudited)
For the six months ended 31 July2010 2009
£’000 £’000 £’000 £’000
Income
Net capital gains/(losses) 586 (8,793)
Revenue 999 934
Expenses (972) (835)
Net revenue before taxation 27 99
Taxation (60) (65)
Net (expense)/revenue after taxation (33) 34
Total return before distributions 553 (8,759)
Finance costs: Distributions 9 (23)
Change in net assets attributable to shareholders from investment activities 562 (8,782)
Statement of change in net assets attributable to shareholders(Unaudited)
For the six months ended 31 July2010 2009
£’000 £’000 £’000 £’000
Opening net assets attributable to shareholders 111,359 135,649
Amounts receivable on issue of shares 34,668 5,246
Amounts payable on cancellation of shares (48,653) (18,863)
(13,985) (13,617)
Change in net assets attributable to shareholders from investment activities (see above) 562 (8,782)
Closing net assets attributable to shareholders 97,936 113,250
As the comparatives in the above table are for the previous interim period, the Net assets at the end ofthat period will not agree to the Net assets at the start of the current period.
Balance sheet(Unaudited)
As at31 July 2010 31 January 2010
£’000 £’000 £’000 £’000
ASSETS
Investment assets 98,783 112,978
Debtors 617 10,261
Cash and bank balances 577 1,061
Total other assets 1,194 11,322
Total assets 99,977 124,300
LIABILITIES
Creditors (2,041) (12,941)
Total liabilities (2,041) (12,941)
Net assets attributable to shareholders 97,936 111,359

103
ContinuationReturn to Index�
�
JPM Multi-Asset Income Fund
Investment objective and policyTo provide income by investing primarily in a global portfolio of incomegenerating securities.
The Fund will predominantly invest in fixed and floating rate debt securitiesand equity and equity linked securities to generate income. Whilst theremight be gains, there is also a risk of capital erosion. The Fund may investin high-yield bonds, convertible bonds, investment grade, non-investmentgrade and unrated securities, Real Estate Investment Trusts (“REITS”), smallercompanies and collective investment schemes as the investment adviserdeems appropriate. Issuers of securities may be located in any country,including emerging markets and the Fund may invest in assets denominatedin any currency. Non-sterling currency exposure (excluding emerging marketslocal currency) will be hedged back to sterling. The Fund may use derivativesand forward transactions for investment purposes and Efficient PortfolioManagement, including hedging.
Risk profileBond prices can fluctuate significantly depending not only on the globaleconomic and interest rate conditions but also on the general credit marketenvironment and the creditworthiness of the issuer.
The credit quality of high yield bonds is below investment grade and theyusually offer higher yields to compensate for the reduced creditworthinessand the increased risk of default relative to investment grade bonds.
The Fund may have a significant exposure to asset and mortgage backedsecurities (ABS and MBS). Owing to the nature of some ABS and MBS, theexact timing and size of cashflows paid by the securities may not be fullyassured.
The investment policy of the Fund permits the use of derivatives and/orforward transactions for investment purposes, potentially increasing thevolatility and therefore risk of the Fund.
Equity investment is subject to specific risks relating to the performance ofthe individual companies held and the market’s perception of theirperformance. Equities are also subject to systematic risks such as generaleconomic conditions, inflation, interest rates, foreign exchange rates andindustry sector risks. In general terms, equities tend to be more volatile thanbonds.
The Fund may be invested in emerging markets, which may be subject toadditional political and economic risks, low liquidity, poor transparencyand greater financial risks.
Investments in equity securities issued by companies which are principallyengaged in the business of real estate will subject the strategy to risksassociated with the direct ownership of real estate. The majority of the REITsand other real estate companies that may be held by the Fund will be publiclylisted. The performance of any investment in such vehicles will thereforebe subject to normal market fluctuations, correlations and other risks inherentin investing in securities.
You should remember that past performance is not a guide to the future. The price of investments and the income from them may fall as well as rise andinvestors may not get back the full amount invested. For specific risks, please read the Simplified Prospectus.All performance returns are calculated using the quoted price of the accumulation or income shares. Performance returns are in Sterling.FX Adjusted returns have been calculated by JPMAM. Blended benchmarks have been calculated by JPMAM.Source: J.P. Morgan.A On 01/04/10 part of the element of the composite benchmark for the Fund changed from 10% Global Property Research 250 (Total Return Net) hedged into GBP to 10% FTSE EPRA/NAREIT Developed Index hedged
into GBP (Total Return Net).Source: J.P. Morgan.Benchmark Source: MSCI. The MSCI data is comprised of a custom index calculated by MSCI for, and as requested by JPMorgan Asset Management (UK) Ltd. The MSCI data is for internal use only and may not be redistributedor used in connection with creating or offering any securities, financial products or indices. Neither MSCI nor any other third party involved in or related to compiling, computing or creating the MSCI data (the “MSCIParties”) makes any express or implied warranties or representations with respect to such data (or the results to be obtained by the use thereof), and the MSCI Parties hereby expressly disclaim all warranties oforiginality, accuracy, completeness, merchantability or fitness for a particular purpose with respect to such data. Without limiting any of the foregoing, in no event shall any of the MSCI Parties have any liability for anydirect, indirect, special, punitive, consequential or any other damages (including lost profits) even if notified of the possibility of such damages.Source: FTSE International Limited (“FTSE”) © FTSE [2010]. “FTSE®” is a trade mark of London Stock Exchange Plc and The Financial Times Limited and is used by FTSE International Limited under licence. All rights inthe FTSE indices and/or FTSE ratings vest in FTSE and/or its licensors. Neither FTSE nor its licensors accept any liability for any errors or omissions in the FTSE indices and/or FTSE ratings or underlying data. No furtherdistribution of FTSE Data is permitted without FTSE’s express written consent.
This Fund charges the fees of the ACD against capital, which will increasethe amount of income available for distribution to Shareholders, but mayconstrain capital growth. It may also have tax implications for certain investors.
As the Fund is primarily focused on generating income, the Fund is expectedto deviate from its benchmark in terms of asset allocation and performance.
Fund review• The Fund paid its third and fourth dividends in April and July, equivalent
to annualised yields of 5.6% and 5.9% net of basic rate tax and expenses,respectively.
• The six-month period to the end of July 2010 was a volatile time for markets.In this environment, the Fund’s capital value increased but this increasewas behind that of the benchmark. During the very difficult month of May,the portfolio’s diversification by region and asset class helped to cushionthe fall, with around 42% in high yield bonds and around 6% in emergingmarket debt remaining well supported in the volatile period.
• Changes to asset allocation over the review period included increases inREITs from 6% to 8% and emerging market debt from 5% to 10%, withreductions in investment grade credit from 3% to almost 0%, convertiblebonds from 7% to 5% and global equity from 31% to 29%. High yieldbonds remain a core allocation at around 43% of the portfolio.
Fund outlook• Fiscal policy is being tightened across much of the G20 group of nations,
which carries risks for growth in 2011. Monetary conditions have becomevery easy in Europe, but have tightened in the US, China and Japan. Wemaintain our long-standing thesis of a sub-par economic recovery in2010/11 and acknowledge that there is risk of disappointment.
• We do not anticipate any significant shifts in asset allocation in the Fundin the next few months.
Rolling 12 month performance as at 31 July2010/2009
JPM Multi-Asset IncomeA-Class Acc 15.2%
JPM Multi-Asset IncomeX-Class Inc –
Benchmark IndexA 17.1%
Six month performance31/01/10–31/07/10
JPM Multi-Asset Income A-Class Acc 4.1%
Benchmark IndexA 5.8%

104
ContinuationReturn to Index�
�
Fund statisticsFund size £31.9m
Benchmark IndexA 10% JPMorgan Government Bond Index – EmergingMarkets Global Index (Total Return Gross) in GBP,
45% Merrill Lynch High Yield BB-B Constrained(Total Return Gross) hedged into GBP, 10% FTSE EPRA/NAREIT
Developed Index hedged into GBP (Total Return Net), 25% Morgan Stanley Capital International
World Index (Total Return Net) hedged into GBP,10% Merrill Lynch Sterling Broad Market Index in GBP
Fund chargesA-Class Initial 4.25%, Annual 1.25%X-Class On application
Top ten holdings %Brazil 11% 2040 1.3Mexico 11.375% 2016 0.9Dominican Republic 9.04% 2018 0.9Royal Dutch Shell ‘A’ 0.8Merck 0.8Harrahs Operating 11.25% 2017 0.8Venezuela 9.25% 2028 0.7Zurich Financial Services 0.7Clear Channel Worldwide ‘B’ 9.25% 2017 0.7Coca-Cola 0.7
Sector breakdown %Corporate bonds 50.1Equities 35.1Government bonds 6.3Convertible bonds 4.2Forward currency contracts 2.3Net other assets 2.0
Highest/lowest share price and distribution recordDistribution
Highest Lowest per shareCalendar year share price share price (net)
A-Class Accumulation Shares
2009 59.42p 50.24p 0.94p
2010B 62.47p 58.35p 2.61p
A-Class Income Shares
2009 58.42p 50.24p 0.94p
2010B 60.57p 55.91p 2.53p
X-Class Income SharesC
2010B 104.2p 100.0p 0.24p
B To 31 July 2010.C X-Class Income Shares were launched on 7 July 2010.
Portfolio turnover rate31.07.09 22.69%
31.07.10 57.73%
The portfolio turnover rate (PTR) reflects the total of security purchases and sales, less the total of shareissues and cancellations, expressed as a percentage of the average daily net asset values over the period.
Net asset values and Total expense ratiosNet assetvalue per Net asset Total
share class Number value per expenseDate £’000 of shares share ratio
A-Class Accumulation Shares
31.01.10 12,826 21,878,031 58.62p 1.43%
31.07.10 14,070 23,032,001 61.09p 1.43%
A-Class Income Shares
31.01.10 6,623 11,651,616 56.84p 1.43%
31.07.10 7,481 13,006,290 57.52p 1.43%
X-Class Income Shares
31.07.10 10,317 10,005,000 103.1p 0.06%
The Net asset value and the Net asset value per income share are shown ex-dividend.
The total expense ratio (TER) takes into account the ACD fee and any fixed expenses charged to revenue overthe financial year, expressed as a percentage of the average daily net asset values over the same period.

105
ContinuationReturn to Index�
�
Market value Total netInvestment Holding £’000 assets %
Portfolio statementAs at 31 July 2010
Corporate bonds – 50.1% (54.0%)US Dollar – 49.4%1st Industrial 6.42% 2014 $25,000 15 – Abitibi-Consol of Canada 13.75% 2011 $109,129 77 0.2 ACCO Brands 10.625% 2015 $225,000 160 0.5 Ace Cash Express 10.25% 2014 $62,000 33 0.1 Advanced Micro Devices 8.125% 2017 $30,000 20 0.1 Aircastle 9.75% 2018 $10,000 6 – Affinia Group 9% 2014 $75,000 49 0.2 AK Steel 7.625% 2020 $28,000 18 0.1 Allbritton Communications 8% 2018 $50,000 32 0.1 Alliance One International 10% 2016 $50,000 33 0.1 Ally Financial 6.75% 2014 $200,000 129 0.4 Ally Financial 8% 2031 $115,000 72 0.2 Alon Refining Krotz Springs 13.5% 2014 $10,000 6 – AMB Properties ‘L’ 6.5% Perpetual Preference $7,450 110 0.3 AMC Entertainments 8.75% 2019 $50,000 34 0.1 American Petroleum Tan 10.25% 2015 $25,000 16 – Amkor Technology 9.25% 2016 $24,000 16 – Amkor Technology 7.375% 2018 $15,000 10 – Antero Resources Finance 9.375% 2017 $55,000 37 0.1 Appleton Papers 10.5% 2015 $75,000 48 0.2 Arch Coal 8.75% 2016 $250,000 172 0.5 Associated Materials 9.875% 2016 $50,000 35 0.1 Avis Budget Car Rental 7.75% 2016 $10,000 6 – Avis Budget Group 9.625% 2018 $55,000 37 0.1 Banc of America Alternative Loan Trust
2006-A1 6% 2021 $65,607 38 0.1 Banc of America Alternative Loan Trust
2004-CB1 6% 2035 $101,955 63 0.2 Banc of America Mortgage Trust 6% 2037 $74,730 41 0.1 Barclays Bank 5.926% Variable $100,000 54 0.2 Berry Plastics 8.875% 2014 $25,000 16 – Berry Plastics 8.875% SNR 2014 $35,000 23 0.1 Berry Plastics 8.25% 2015 $10,000 7 – Berry Plastics 9.5% 2018 $85,000 51 0.2 Bill Barrett 9.875% 2016 $35,000 25 0.1 Biomet 10.375% 2017 $250,000 177 0.6 Block Communications 8.25% 2015 $75,000 48 0.2 Blockbuster 11.75% 2014 $24,000 10 – Boise Paper Holdings 8% 2020 $50,000 33 0.1 Bombardier 7.5% 2018 $25,000 17 0.1 Bombardier 7.75% 2020 $25,000 17 0.1 Buenos Aires 12.5% 2015 $250,000 169 0.5 Burlington Coat Factory Warehouse
Corporation 11.25% 2014 $60,000 40 0.1 BWAY Holding 10% 2018 $10,000 7 – Cablevision Systems 7.75% 2018 $25,000 17 0.1 Cablevision Systems 8% 2020 $25,000 17 0.1 Calpine Construction Finance 8% 2016 $125,000 84 0.3 Capella Healthcare 9.25% 2017 $25,000 17 0.1 Capital One Financial 10.25% 2039 $85,000 60 0.2 Cardinal Health 409 FRN 2015 $18,922 12 – Carriage Services 7.875% 2015 $34,000 22 0.1 Cascades 7.75% 2017 $50,000 34 0.1 Cascades 7.875% 2020 $25,000 17 0.1 CCO Holdings 7.875% 2018 $20,000 13 – CCO Holdings 8.125% 2020 $25,000 17 0.1 Cenveo 10.5% 2016 $100,000 65 0.2 Cequel Communications 8.625% 2017 $130,000 85 0.3 CF Industries Holdings 6.875% 2018 $10,000 7 – CF Industries Holdings 7.125% 2020 $10,000 7 – Chiquita Brands International 8.875% 2015 $50,000 33 0.1 CHL Mortgage Pass-Through Trust 5.25% 2027 $260,133 142 0.4 Cincinnati Bell 8.25% 2017 $20,000 13 – Cincinnati Bell 8.75% 2018 $10,000 6 – CIT Group 7% 2016 $85,000 53 0.2 CITGO Petroleum 11.5% 2017 $30,000 20 0.1 CKE Restaurants 11.375% 2018 $50,000 33 0.1 Clear Channel Worldwide ‘B’ 9.25% 2017 $325,000 221 0.7 Clearwire 12% 2015 $116,000 78 0.2 Cloud Peak Energy Resources 8.25% 2017 $30,000 20 0.1 CNG Holdings 12.25% 2015 $25,000 17 0.1 Commercial Barge Line 12.5% 2017 $100,000 69 0.2 Comstock Resources 8.375% 2017 $65,000 43 0.1 Consol Energy 8% 2017 $20,000 14 – Consol Energy 8.25% 2020 $15,000 10 – Constar International FRN $100,000 55 0.2 Continental Airlines 7.875% 2020 $60,301 37 0.1 Continental Airlines 9.318% 2021 $15,577 9 – Continental Airlines 9.558% 2021 $14,916 9 –
Market value Total netInvestment Holding £’000 assets %
Continental Airlines 9.798% 2021 $56,941 35 0.1 Countrywide Capital III 8.05% Preference 2027 $50,000 33 0.1 Credit Agricole 6.637% FRN Perpetual $200,000 108 0.3 Cricket Communications 9.375% 2014 $45,000 30 0.1 CSA Escrow Corporation 8.5% Notes 2018 $40,000 27 0.1 CSC Holdings 8.5% 2014 $25,000 17 0.1 CWALT 2005-28CB 1A5 5.5% 2035 $154,753 93 0.3 CWALT 2005-J6 2-A-1 5.5% 2025 $44,667 28 0.1 Digitalglobe 10.5% 2014 $50,000 35 0.1 Dubai Electricity and Water 8.5% 2015 $310,000 210 0.7 DuPont Fabros Technology 8.5% 2017 $15,000 10 – Eastman Kodak 9.75% 2018 $35,000 22 0.1 EchoStar DBS 7.125% 2016 $250,000 165 0.5 Edison Mission Energy 7% 2017 $100,000 44 0.1 Edison Mission Energy 7.2% 2019 $50,000 22 0.1 El Paso Pipeline Partners 6.5% 2020 $10,000 7 – Elan Finance FRN 2011 $75,000 47 0.1 Entravision Communications 8.75% 2017 $50,000 33 0.1 Essar Steel Algoma 9.375% 2015 $15,000 9 – Eurasian Development Bank 7.375% 2014 $250,000 171 0.5 Ferrellgas Partners 8.625% 2020 $45,000 30 0.1 FGI Holdings11.25% Bonds 2015 $20,000 13 – Fidelity National Information Services
7.625% 2017 $25,000 17 0.1 Fidelity National Information Services
7.875% 2020 $25,000 17 0.1 Fisher Communications 8.625% 2014 $50,000 32 0.1 Ford Motor 8% 2016 $100,000 69 0.2 Ford Motor 7.75% 2043 $50,000 28 0.1 Ford Motor 9.98% 2047 $125,000 85 0.3 Ford Motor Credit 8.7% 2014 $250,000 174 0.6 Ford Motor Credit 7.375% 2031 $1,200 18 0.1 Ford Motor Credit 7.6% 2032 $1,200 19 0.1 Forest Oil 7.25% 2019 $70,000 46 0.1 Freescale Semiconductor 9.25% 2018 $270,000 180 0.6 Freescale Semiconductor 10.125% 2018 $40,000 27 0.1 Frontier Communications 8.25% 2017 $5,000 3 – Frontier Communications 7.125% 2019 $40,000 26 0.1 Frontier Communications 8.5% 2020 $5,000 3 – FTI Consulting 7.75% 2016 $50,000 33 0.1 Games Merger Corporation 11% 2018 $10,000 7 – Gannett 8.75% 2014 $50,000 34 0.1 Gannett 9.375% 2017 $75,000 52 0.2 Garda World Security 9.75% 2017 $25,000 17 0.1 GCI 8.625% 2019 $250,000 166 0.5 Genworth Financial 6.15% 2066 $50,000 23 0.1 Gibson Energy 11.75% 2014 $30,000 21 0.1 Gibson Energy 10% 2018 $20,000 13 – Glatfelter 7.125% 2016 $10,000 6 – Global Crossing 12% 2015 $5,000 4 – Global Geophysical Services 10.5% 2017 $10,000 6 – Graham Packaging Co 8.25% 2017 $250,000 161 0.5 Gray Television 10.5% 2015 $25,000 16 – Harland Clarke 9.5% 2015 $100,000 61 0.2 Harland Clarke FRN 2015 $40,000 22 0.1 Harrahs Operating 11.25% 2017 $350,000 244 0.8 Harrahs Operating 10% 2018 $100,000 54 0.2 HCA 9.25% 2016 $125,000 86 0.3 Health Management Associates 6.125% 2016 $250,000 157 0.5 Helix Energy Solutions Group 9.5% 2016 $55,000 34 0.1 Hertz 10.5% 2016 $30,000 20 0.1 Holly 9.875% 2017 $10,000 7 – Holly Energy Partners 6.25% 2015 $24,000 15 – Holly Energy Partners 8.25% 2018 $15,000 10 – Host Hotels & Resorts 9% 2017 $75,000 53 0.2 Hovnanian K Enterprises 10.625% 2016 $40,000 26 0.1 Hub International Holdings 10.25% 2015 $190,000 115 0.4 Ineos Finance 9% 2015 $200,000 131 0.4 Inergy 6.875% 2014 $25,000 16 – Ingles Market 8.875% 2017 $50,000 33 0.1 Intelsat 9.25% FRN 2014 $25,000 17 0.1 Intelsat Bermuda 11.25% 2016 $20,000 14 – Intelsat Bermuda 11.5% Pay In Kind 2017 $61,250 41 0.1 Intelsat Bermuda 11.5% Step Up 2017 $40,000 27 0.1 Intelsat Intermediate 2015 $35,000 23 0.1 Intelsat Jackson 8.5% FRN 2019 $80,000 54 0.2 Interactive Data 10.25% 2018 $25,000 17 0.1 International Lease Finance 8.625% 2015 $25,000 16 – International Lease Finance 8.75% 2017 $25,000 16 – International Wire Group 9.75% 2015 $50,000 32 0.1 Inventiv Health 10% 2018 $10,000 7 –

106
ContinuationReturn to Index�
�
Market value Total netInvestment Holding £’000 assets %
Portfolio statement – continuedAs at 31 July 2010
Iron Mountain 8.75% 2014 $250,000 171 0.5 Isle of Capri 7% 2014 $100,000 59 0.2 J.B. Poindexter 8.75% 2014 $150,000 90 0.3 Jarden 7.5% 2017 $250,000 164 0.5 KazMunaiGaz Finance 11.75% 2015 $230,000 187 0.6 Kemet 10.5% 2018 $35,000 23 0.1 Kilroy Realty ‘F’ 7.5% Preference 2009 $7,975 122 0.4 Knowledge Learning 7.75% 2015 $50,000 30 0.1 Kratos Defense & Security Solutions 10% 2017 $40,000 27 0.1 LBI Media 8.5% 2017 $50,000 28 0.1 Lennar Corporation 6.95% 2018 $30,000 17 0.1 Level 3 Financing 10% 2018 $55,000 33 0.1 Liberty Mutual Group FRN 2058 $193,000 136 0.4 Liberty Mutual Group 7.8% 2087 $60,000 34 0.1 Limited Brands 7% 2020 $50,000 33 0.1 Linn Energy Finance 8.625% 2020 $15,000 10 – Lyondell Chemical 11% 2018 $200,000 138 0.4 M/I Homes 6.875% 2012 $21,000 13 – M/I Homes Series ‘A’ $2,783 31 0.1 Mac Gray 7.625% 2015 $130,000 81 0.3 Majapahit Holding 7.875% 2037 $300,000 217 0.7 Master Alternative Loan Trust 5.75% 2035 $160,208 87 0.3 MCE Finance 10.25% 2018 $25,000 17 0.1 McJunkin Red Man 9.5% 2016 $35,000 22 0.1 McClatchy 11.5% 2017 $50,000 34 0.1 Media General 11.75% 2017 $100,000 68 0.2 Mediacom Capital 9.125% 2019 $40,000 26 0.1 Meritage Homes 7.15% Apr 2020 $35,000 20 0.1 MetroPCS Wireless 9.25% 2014 $60,000 40 0.1 MGM Mirage 5.875% 2014 $5,000 3 – MGM Mirage 7.5% 2016 $19,000 10 – MGM Mirage 11.125% 2017 $250,000 182 0.6 MGM Mirage 9% 2020 $40,000 27 0.1 MGM Resorts 6.625% 2015 $46,000 25 0.1 MGM Resorts 7.625% 2017 $6,000 3 – Michael Food 9.75% 2018 $50,000 34 0.1 Michaels Store 11.375% 2016 $75,000 51 0.2 Michaels Store 13% FRN 2016 $40,000 24 0.1 Midwest Gaming Borrower 11.625% 2016 $25,000 16 – Multiplan 10.375% 2016 $17,000 12 – Murray Energy 10.25% 2015 $40,000 27 0.1 Mylan 7.625% 2017 $22,000 15 – Mylan 7.875% 2020 $272,000 187 0.6 Nationwide Mutual Insurance 9.375% 2039 $50,000 36 0.1 Navios Maritime Holdings 8.875% 2017 $90,000 60 0.2 Navistar International 8.25% 2021 $125,000 85 0.3 Nebraska Book 8.625% 2012 $50,000 31 0.1 New Communications 7.875% 2015 $5,000 3 – New Communications 8.75% 2022 $5,000 3 – Newpage 11.375% 2014 $200,000 118 0.4 Nexstar Broadcasting 8.875% 2017 $25,000 17 0.1 Nextel Communications ‘D’ 7.375% 2015 $188,000 119 0.4 NFR Energy 9.75% 2017 $40,000 26 0.1 NGC Corporation 7.125% 2018 $100,000 43 0.1 Nielsen Finance 11.5% 2016 $75,000 54 0.2 NII Capital 8.875% 2019 $60,000 41 0.1 NRG Energy 7.375% 2017 $140,000 92 0.3 NXP 7.875% 2014 $50,000 32 0.1 NXP 9.75% 2018 $100,000 68 0.2 Omnicare 7.75% 2020 $5,000 3 – Oncure 11.75% 2017 $50,000 30 0.1 Paetec 8.875% 2017 $270,000 178 0.6 Patriot Coal Corporation 8.25% 2018 $15,000 9 – Peninsula Gaming 10.75% 2017 $100,000 66 0.2 Penn Virginia 10.375% 2016 $74,000 52 0.2 Penn Virginia Resources 8.25% 2018 $15,000 10 – Pep Boys – Manny Moe & Jack 7.5% 2014 $100,000 63 0.2 PHI 7.125% 2013 $35,000 21 0.1 Pinnacle Entertainment 8.75% 2020 $25,000 16 – Pioneer Drilling 9.875% 2018 $30,000 19 0.1 Pioneer Natural Resource 7.5% 2020 $20,000 14 – Plains Exploration & Production 7.625% 2020 $10,000 7 – PolyOne 8.875% 2012 $28,000 19 0.1 PS Business Parks ‘H’ Preference 7% 2009 $7,550 119 0.4 Public Storage 7.25% Depositary Receipts $6,525 106 0.3 Quebecor Media 7.75% 2016 $250,000 163 0.5 QVC 7.125% 2017 $5,000 3 – QVC 7.375% 2020 $5,000 3 – Qwest 7.625% 2015 $14,000 10 – Qwest Communications International
7.125% 2018 $75,000 50 0.2
Market value Total netInvestment Holding £’000 assets %
Radiation Therapy Services 9.875% 2017 $30,000 19 0.1 RailAmerica 9.25% 2017 $76,000 53 0.2 Range Resources 7.25% 2018 $30,000 20 0.1 Range Resources 6.75% 2020 $10,000 6 – RBS Global & Rexnord 8.5% 2018 $250,000 162 0.5 Real Mex Restaurants 14% 2013 $100,000 65 0.2 Rental Service 9.5% 2014 $100,000 66 0.2 Reynolds Group 8.5% 2018 $100,000 65 0.2 Rite Aid 7.5% 2017 $150,000 89 0.3 RSHB Capital 9% 2014 $230,000 169 0.5 San Pasqual Casino 8% 2013 $75,000 47 0.1 Seagate Technology 6.875% 2020 $15,000 10 – Seminole Hard Rock Entertainment FRN 2014 $75,000 42 0.1 Service Corporation International 6.75% 2015 $50,000 33 0.1 Service Corporation International 7% FRN 2017 $250,000 163 0.5 Servicemaster 10.75% 2015 $250,000 168 0.5 Shingle Springs Tribal 9.375% 2015 $125,000 66 0.2 Sirius Xm Radio 9.75% 2015 $50,000 35 0.1 Sitel 11.5% 2018 $15,000 8 – Smithfield Foods 7.75% 2017 $50,000 31 0.1 Solo Cup 10.5% 2013 $75,000 50 0.2 Solo Cup 8.5% 2014 $44,000 26 0.1 Spectrum Brands 9.5% 2018 $250,000 170 0.5 Spectrum Brands 12% FRN 2019 $106,000 76 0.2 Sprint Capital 8.75% 2032 $250,000 162 0.5 Sprint Nextel 6% 2016 $52,000 32 0.1 Sprint Nextel 8.375% 2017 $10,000 7 – Standard Pacific 6.25% 2014 $20,000 12 – Standard Pacific 7% 2015 $25,000 15 – Sterling Chemicals 10.25% 2015 $30,000 19 0.1 Stream Global 11.25% 2014 $50,000 32 0.1 Suburban Propane Partners 7.375% 2020 $10,000 7 – Sungard Data Systems 10.25% 2015 $250,000 169 0.5 SUPERVALU 8% 2016 $250,000 161 0.5 Susser Holdings 8.5% 2016 $25,000 17 0.1 Suzlon Energy ZCP 12/06/12 $130,000 84 0.3 Swift Energy Co 8.875% 2020 $50,000 33 0.1 Talecris Biotherapeutics 7.75% 2016 $10,000 7 – Targa Resources Partners 8.25% 2016 $15,000 10 – Targa Resources Partners 11.25% 2017 $35,000 26 0.1 Taubman Centres ‘G’ 8% Cumulative
Redemption Preference 2009 $7,550 125 0.4 TeamHealth 11.25% 2013 $17,000 11 – Telesat 11% 2015 $40,000 29 0.1 Tenet Healthcare 9.25% 2015 $200,000 136 0.4 Tenet Healthcare 8.875% 2019 $75,000 53 0.2 Texas Competitive Electric 10.25% FRN 2015 $75,000 33 0.1 Tops Markets 10.125% 2015 $85,000 58 0.2 Toys R Us Property 8.5% 2017 $125,000 84 0.3 Trimas Corp 9.75% 2017 $50,000 33 0.1 Triumph Group 8.625% 2018 $10,000 7 – TW Telecom Holdings 8% 2018 $100,000 67 0.2 UCI Holdco 8.53706% FRN 2013 $78,508 49 0.2 Ultrapetrol 9% 2014 $100,000 63 0.2 United Components 9.375% 2013 $25,000 16 – Universal City Development 8.875% 2015 $15,000 10 – Universal City Development 10.875% 2016 $70,000 48 0.2 UPC Germany GMBH 8.125% 2017 $50,000 33 0.1 US Concrete 8.375% 2014 $76,000 26 0.1 US Oncology 9.125% 2017 $250,000 170 0.5 USI Holdings 9.75% 2015 $134,000 81 0.3 Valeant Pharmaceuticals International
7.625% 2020 $15,000 11 – Vanguard 8% 2018 $50,000 32 0.1 Virgin Media Finance 8.375% 2019 $50,000 35 0.1 Wachovia Capital Trust I 5.8% 2042 $100,000 55 0.2 Warner Music Group 7.375% 2014 $150,000 94 0.3 Western Refining FRN 2014 $75,000 44 0.1 Western Refining 11.25% 2017 $50,000 29 0.1 Wind Acquisition 11.75% 2017 $100,000 68 0.2 Windstream 8.625% 2016 $250,000 167 0.5 Windstream 7.875% 2017 $60,000 39 0.1 Wynn Las Vegas 7.75% 2020 $35,000 23 0.1 XM Escrow LIC 13% 2013 $40,000 29 0.1 Sterling – 0.3%SVG Capital 8.25% 2016 £100,000 88 0.3 Australian Dollar – 0.2%CFS Retail Property Trust 5.075% 2014 AUD 100,000 56 0.2 Euro – 0.2%Q-Cells International 5.75% 2014 u100,000 54 0.2

107
ContinuationReturn to Index�
�
Portfolio statement – continuedAs at 31 July 2010
Market value Total netInvestment Holding £’000 assets %
Government bonds – 6.3% (3.2%)Brazil 11% 2040 $455,000 399 1.3 Dominican Republic 9.04% 2018 $382,543 277 0.9 Mexico 11.375% 2016 $320,000 293 0.9 Peru 9.875% 2015 $210,000 172 0.5 Russian Federation 12.75% 2028 $180,000 201 0.6 Turkey 11.5% 2012 $290,000 211 0.7 Ukraine 6.58% 2016 $270,000 174 0.5 Uruguay 8% 2022 $75,000 61 0.2 Venezuela 9.25% 2028 $520,000 227 0.7
Convertible bonds – 4.2% (6.7%)US Dollar – 1.9%Advanced Micro Devices 6% Convertible 2015 $150,000 96 0.3 HCP 7.1% Convertible Preference 2008 $7,500 116 0.4 Jaiprakash Power Ventures 5% Convertible 2015 $100,000 68 0.2 Petroleum Geo Services 2.7% Convertible 2012 $100,000 58 0.2 Petroplus Finance Ltd 4% Convertible 2015 $100,000 53 0.2 Salamander Energy 5% Convertible 2015 $200,000 124 0.4 Suntech Power Holdings 3% Convertible 2013 $150,000 78 0.2 Euro – 1.6%A-Tec Industries 8.75% Convertible 2014 u100,000 71 0.2 Artemis Conseil 2% Convertible 2011 u40,300 50 0.2 Beni Stabili 3.875% Convertible 2015 u100,000 81 0.2 Espirito Santo Financial Group 3.55%
Convertible 2025 u100,000 66 0.2 Fomento de Construcciones y Contra 6.5%
Convertible 2014 u100,000 73 0.2 International Power 4.75% Convertible 2015 u100,000 85 0.3 Pescanova 6.75% Convertible 2015 u100,000 84 0.3 Sterling – 0.3%TUI Travel 6% Convertible 2014 £100,000 96 0.3 Swedish Krona – 0.2%SAS 7.5% Convertible 2015 SEK 1,000,000 78 0.2 Australian Dollar – 0.2%Commonwealth Property Office Fund
5.25% Convertible 2016 AUD 100,000 56 0.2
Equities – 35.1% (32.8%)United States of America – 11.4%Abbott Laboratories 6,094 192 0.6 Altria Group 12,249 173 0.5 Bristol-Myers Squibb 10,076 162 0.5 Carnival 5,614 124 0.4 CoBank 1,700 47 0.1 CoBank ACB 700 24 0.1 Coca-Cola 6,220 220 0.7 ConocoPhillips 3,978 139 0.4 Digital Realty Trust ‘A’ Preference 6,575 107 0.3 Du Pont de Nemours 7,344 191 0.6 Frontier Communications ‘B’ 1,348 7 – IBM 1,610 132 0.4 McDonald’s 3,880 173 0.5 Merck 11,309 254 0.8 Microsoft 8,839 148 0.5 Paychex 5,068 85 0.3 Pfizer 14,313 138 0.4 Philip Morris International 4,399 145 0.4 Public Storage ‘M’ 7,300 117 0.4 Regency Centers Preference 7,725 118 0.4 Sysco 7,733 153 0.5 Time Warner 10,450 210 0.7 Verizon Communications 7,885 146 0.5 VF 2,640 134 0.4 Vornado Realty Trust ‘G’ Preference Shares 7,925 119 0.4 Xcel Energy 12,783 183 0.6 France – 4.1%AXA 11,238 131 0.4 BNP Paribas 3,197 141 0.4 Bouygues 3,802 103 0.3 Compagnie de Saint-Gobain 3,695 101 0.3 GDF Suez 9,529 204 0.6 PPR 1,746 149 0.5 Schneider Electric 2,113 156 0.5 Sodexo 3,014 122 0.4 TOTAL S.A. 4,600 150 0.5 Unibail 541 68 0.2
Market value Total netInvestment Holding £’000 assets %
United Kingdom – 3.5%British American Tobacco 7,535 167 0.5 British Land 25,070 116 0.4 Centrica 50,271 155 0.5 GlaxoSmithKline 17,637 197 0.6 HSBC 24,418 160 0.5 National Grid 27,875 145 0.5 Vodafone Group 108,318 162 0.5 Netherlands – 3.2%Eurocommercial Properties 2,878 70 0.2 KPN 18,550 165 0.5 Nieuwe Steen Investments 4,912 57 0.2 Philips Electronics 9,548 188 0.6 Royal Dutch Shell ‘A’ 14,556 258 0.8 Unilever 11,186 211 0.7 VastNed Retail 1,533 57 0.2 Australia – 2.2%CFS Retail Property Trust 62,569 68 0.2 Commonwealth Property Office Fund 131,887 70 0.2 Dexus Property Group 198,882 94 0.3 MacQuarie Group 5,180 111 0.4 QBE Insurance Group 19,488 188 0.6 Tatts Group 72,031 102 0.3 Westfield Group 10,134 71 0.2 Japan – 1.7%Advance Residence 52 48 0.1 Canon 7,000 195 0.6 Frontier Real Estate Investment REIT 18 83 0.3 Japan Retail Fund Investment Trust 153 126 0.4 Kenedix Realty Investment 41 86 0.3 Premier Investment 7 17 – China – 1.2%China Construction Bank ‘H’ 268,000 146 0.5 CNOOC 128,000 138 0.4 Zhejiang Expressway 160,000 97 0.3 Switzerland – 1.1%Roche (Genusscheine) 1,532 128 0.4 Zurich Financial Services 1,495 223 0.7 Hong Kong – 0.8%Hang Lung Properties 41,000 109 0.3 Hutchison Whampoa 38,000 161 0.5 Spain – 0.8%Banco Santander 16,898 142 0.4 Telefonica 7,788 113 0.4 Germany – 0.8%Daimler 4,259 146 0.5 Siemens 1,505 94 0.3 Brazil – 0.7%Cia Energetica Minas Gerais ADR Preference 12,537 123 0.4 Vale ADR Preference 6,581 102 0.3 Italy – 0.5%ENI 12,189 159 0.5 Singapore – 0.5%Singapore Airlines 20,000 147 0.5 Indonesia – 0.5%Telekomunikasi Indonesia ADS ‘B’ 6,174 144 0.5 Taiwan – 0.4%Taiwan Semiconductor Manufacturing ADS 21,781 142 0.4 Canada – 0.4%Riocan Real Estate Trust 10,374 129 0.4 Sweden – 0.4%Hennes & Mauritz ‘B’ 6,252 126 0.4 Austria – 0.3%Oesterreichische Post 6,306 107 0.3 South Africa – 0.2%African Bank Investments 24,562 71 0.2 Norway – 0.2%Marine Harvest 123,021 61 0.2 Belgium – 0.2%Befimmo 985 48 0.2

108
ContinuationReturn to Index�
�
Market value Total netInvestment Holding £’000 assets %
Portfolio statement – continuedAs at 31 July 2010
Forward currency contracts – 2.3% (0.4%)EuroForward foreign currency position
18/08/10 £167,094 167 0.5 Forward foreign currency position
18/08/10 u(200,000) (167) (0.5)Hong Kong DollarForward foreign currency position
18/08/10 HKD 416,833 34 0.1 Forward foreign currency position
18/08/10 $(53,621) (34) (0.1)US DollarForward foreign currency position
18/08/10 $969,485 622 2.0 Forward foreign currency position
18/08/10 AUD (1,110,511) (640) (2.0)Forward foreign currency position
18/08/10 $88,731 57 0.2 Forward foreign currency position
18/08/10 CAD (91,805) (57) (0.2)Forward foreign currency position
18/08/10 $482,911 310 1.0 Forward foreign currency position
18/08/10 CHF (511,506) (316) (1.0)Forward foreign currency position
18/08/10 $4,996,845 3,208 10.1 Forward foreign currency position
18/08/10 u(3,963,015) (3,308) (10.4)Forward foreign currency position
18/08/10 $264,888 170 0.5 Forward foreign currency position
18/08/10 £(175,760) (176) (0.6)Forward foreign currency position
18/08/10 £28,853,737 28,854 90.5 Forward foreign currency position
18/08/10 $(43,589,393) (27,986) (87.8)Forward foreign currency position
18/08/10 $641,268 412 1.3 Forward foreign currency position
18/08/10 HKD (4,988,468) (412) (1.3)Forward foreign currency position
18/08/10 $699,390 449 1.4 Forward foreign currency position
18/08/10 JPY (61,790,888) (459) (1.4)Forward foreign currency position
18/08/10 $127,896 82 0.3 Forward foreign currency position
18/08/10 SEK (955,880) (85) (0.3)Forward foreign currency position
18/08/10 $9,007 6 – Forward foreign currency position
18/08/10 ZAR (68,478) (6) –
Investment assets 31,216 98.0
Net other assets 652 2.0
Net assets 31,868 100.0
Unless otherwise stated the above securities are admitted to official stock exchange listings or trade on aregulated market.
The comparative percentage figures in brackets are at 31 January 2010.
Market value Portfolio credit ratings £’000
A 56 A- 108 BBB+ 172 BBB 924 BBB- 1,097 BB+ 830 BB 1,033 BB- 1,520 B+ 2,758 B 3,839 B- 2,374 CCC+ 3,697 C 340Unrated 554
Total bonds 19,302
Equities 11,189Forward currency contracts 725
Investment assets 31,216

109
ContinuationReturn to Index�
�
£’000
Total of all purchases for the period 20,638
Major purchases Cost
Israel Electric 9.375% 2020 414Brazil 11% 2040 298Harrahs Operating 11.25% 2017 239QBE Insurance Group 235Venezuela 9.25% 2028 232Turkey 11.5% 2012 217Majapahit Holding 7.875% 2037 207Dubai Electricity and Water 8.5% 2015 207Russian Federation 12.75% 2028 202Mexico 11.375% 2016 197Clear Channel Worldwide ‘B’ 9.25% 2017 189KazMunaiGaz Finance 11.75% 2015 187Mylan 7.875% 2020 187Dominican Republic 9.04% 2018 186MGM Mirage 11.125% 2017 184Paetec 8.875% 2017 181Biomet 10.375% 2017 180Freescale Semiconductor 9.25% 2018 180Ford Motor Credit 8.7% 2014 176Eurasian Development Bank 7.375% 2014 175
£’000
Total of all sales for the period 9,830
Major sales Proceeds
Israel Electric 9.375% 2020 418KazMunaiGaz Finance 11.75% 2015 179MunichRe 177Venezuela 9.375% 2034 155Triumph Group 8.625% 2018 139Artemis Conseil 2% Convertible 2011 129Nokia 107Sampo ‘A’ 106CapitaLand 2.95% Convertible 2022 105Kansas City Southern Mexico 7.625% 2013 103Rhodia 0.5% Convertible 2014 101RWE ‘A’ 1013i Group 3.625% Convertible 2011 101Nintendo 100TW Telecom Holdings 8% 2018 97Lucent Technologies FRN 2025 97Hovnanian K Enterprises 10.625% 2016 94Delta Air Lines 9.5% 2014 92SanDisk 1% Convertible 2013 92Mirant North America 7.375% 2013 89
Portfolio movements For the six months ended 31 July 2010

110
Return to Index�
Financial statements
Statement of total return(Unaudited)
For the six months ended 31 July2010 2009
£’000 £’000 £’000 £’000
Income
Net capital gains 572 546
Revenue 809 42
Expenses (149) (12)
Net revenue before taxation 660 30
Taxation (114) (5)
Net revenue after taxation 546 25
Total return before distributions 1,118 571
Finance costs: Distributions (649) (32)
Change in net assets attributable to shareholders from investment activities 469 539
Statement of change in net assets attributable to shareholders(Unaudited)
For the six months ended 31 July2010 2009
£’000 £’000 £’000 £’000
Opening net assets attributable to shareholders 19,449 –
Amounts receivable on issue of shares 12,096 10,100
Amounts payable on cancellation of shares (558) –
11,538 10,100
Change in net assets attributable to shareholders from investment activities (see above) 469 539
Retained distributions on accumulation shares 412 16
Closing net assets attributable to shareholders 31,868 10,655
As the comparatives in the above table are for the previous interim period, the Net assets at the end ofthat period will not agree to the Net assets at the start of the current period.
Balance sheet(Unaudited)
As at31 July 2010 31 January 2010
£’000 £’000 £’000 £’000
ASSETS
Investment assets 31,359 18,907
Debtors 442 355
Cash and bank balances 727 607
Total other assets 1,169 962
Total assets 32,528 19,869
LIABILITIES
Investment liabilities (143) (19)
Creditors (382) (308)
Distribution payable on income shares (135) (93)
Total other liabilities (517) (401)
Total liabilities (660) (420)
Net assets attributable to shareholders 31,868 19,449

111
JPM Multi-Manager Growth Fund
Investment objective and policyTo invest worldwide in any economic sector primarily through investmenttrusts. The Fund aims to provide capital growth over the long-term. Currently,in addition to investment trusts, the Fund may also invest in other closed-ended and open-ended funds.
Risk profileThis Fund is designed to give broad market exposure to global stock markets(including exposure to emerging markets and smaller companies) by investingin a broad range of investment trusts and other collective investment schemes.
Equity investment is subject to specific risks relating to the performance ofthe individual companies held and the market’s perception of theirperformance. Equities are also subject to systematic risks such as generaleconomic conditions, inflation, interest rates, foreign exchange rates andindustry sector risks. In general terms, equities tend to be more volatile thanbonds.
Shares of investment trusts can trade at a premium or at a discount to theirnet assets and this might affect the performance of a fund. Investment trustsmay use gearing (leverage) which will exaggerate market movements, bothdown and up. Some investment trusts may have warrants in issue, which ifexercised may affect share values.
The Fund invests in emerging markets, which may be subject to additionalpolitical and economic risks, low liquidity, poor transparency and greaterfinancial risks.
Smaller companies’ securities may be less liquid than the securities of largercompanies as a result of inadequate trading volume or restrictions on trading.Smaller companies may possess greater potential for growth, but can alsoinvolve greater risks, such as limited product lines and markets, and financialor managerial resources. Trading in such securities may be subject to moreabrupt price movements and greater fluctuations in available liquidity thantrading in the securities of larger companies.
Fund review• The six-month period to the end of July 2010 was a volatile time for markets.
In this environment, the Fund produced a positive return, but slightlyunderperformed the benchmark.
• The largest positive contributors to relative performance were overweightsin Mercantile Investment Trust and Jupiter European Opportunities Trust,an underweight in Alliance Trust and not holding Dexion Absolute, whichproduced a negative return over the period.
• The largest detractor from relative performance was a considerableunderweight in RIT Capital Partners, which provided very strong returnsover the period. Further negative contributions came from off-benchmarkpositions in Gartmore Growth Opportunities and a small position in PSourceStructured Debt, with the latter producing a disappointing negative return.
You should remember that past performance is not a guide to the future. The price of investments and the income from them may fall as well as rise andinvestors may not get back the full amount invested. For specific risks, please read the Simplified Prospectus.Formerly JPM Investment Trust Fund the Fund name was changed on 01/09/07.If you invest in JPM Multi-Manager Growth Fund, the shares within the underlying investment trusts can trade at a premium or a discount, and this might affect performance of the Fund.All performance returns are calculated using the quoted price of the accumulation shares. Performance returns are in Sterling.FX Adjusted returns have been calculated by JPMAM. Blended benchmarks have been calculated by JPMAM.Source: J.P. Morgan.Source: FTSE International Limited (“FTSE”) © FTSE [2010]. “FTSE®” is a trade mark of London Stock Exchange Plc and The Financial Times Limited and is used by FTSE International Limited under licence. All rights inthe FTSE indices and/or FTSE ratings vest in FTSE and/or its licensors. Neither FTSE nor its licensors accept any liability for any errors or omissions in the FTSE indices and/or FTSE ratings or underlying data. No furtherdistribution of FTSE Data is permitted without FTSE’s express written consent.
• Across the market, Asia ex-Japan, Emerging Market and Latin Americanfunds performed well, with commodity, technology and smaller companiesfunds producing the strongest returns over the review period. Meanwhile,financials funds generally produced disappointing returns. The aggregatefund discount to net asset value narrowed slightly during the period.
Fund outlook• Fiscal policy is being tightened across much of the G20 group of nations,
which carries risks for growth in 2011. Monetary conditions have becomevery easy in Europe, but have tightened in the US, China and Japan. Wemaintain our long-standing thesis of a sub-par economic recovery in2010/11 and acknowledge that there is risk of disappointment.
Rolling 12 month performance as at 31 July2010/2009 2009/2008 2008/2007 2007/2006 2006/2005
JPM Multi-Manager GrowthA-Class Acc 19.2% -17.9% -14.9% 17.4% 18.8%
Benchmark Index 22.1% -15.5% -11.2% 19.6% 18.7%
Six month performance31/01/10–31/07/10
JPM Multi-Manager Growth A-Class Acc 7.0%
Benchmark Index 7.5%
Fund statisticsFund size £320.3m
Benchmark Index FTSE Equity Investment Instruments Index (Total Return Net)
Fund charges Initial 4.25%, Annual 1.25%
Top ten holdings %Mercantile Investment Trust 4.8Scottish Mortgage Investment Trust 4.2Monks Investment Trust 3.3Blackrock World Mining Trust 3.2JPMorgan Asian Investment Trust 3.0Advance Developing Markets Fund 2.6Templeton Emerging Markets Investment Trust 2.6Schroder Asia Pacific Fund 2.5JPMorgan Emerging Markets Investment Trust 2.4Fidelity European Values 2.1
ContinuationReturn to Index�
�

112
ContinuationReturn to Index�
�
Sector breakdown %Investment funds 98.8Net other assets 1.2
Highest/lowest share price and distribution recordDistribution
Highest Lowest per shareCalendar year share price share price (net)
A-Class Accumulation Shares
2005 480.9p 363.0p 1.34p
2006 550.7p 457.6p 1.03p
2007 608.8p 539.5p 1.04p
2008 567.3p 322.4p 2.01p
2009 470.0p 301.0p 4.98p
2010A 513.9p 446.9p 1.34p
A-Class Income Shares
2005 467.1p 353.4p 1.35p
2006 533.8p 444.3p 1.02p
2007 589.6p 522.5p 1.02p
2008 548.4p 310.6p 1.95p
2009 446.9p 288.7p 4.78p
2010A 488.1p 424.5p 1.28p
A To 31 July 2010.
Portfolio turnover rate31.07.09 16.04%
31.07.10 11.26%
The portfolio turnover rate (PTR) reflects the total of security purchases and sales, less the total of shareissues and cancellations, expressed as a percentage of the average daily net asset values over the period.
Net asset values and Total expense ratiosNet assetvalue per Net asset Total
share class Number value per expenseDate £’000 of shares share ratio
A-Class Accumulation Shares
31.01.08 169,873 32,640,522 520.4p 1.39%
31.01.09 105,447 30,870,339 341.6p 1.43%
31.01.10 130,874 29,078,647 450.1p 1.42%
31.07.10 135,539 28,107,386 482.2p 1.43%
A-Class Income Shares
31.01.08 265,235 52,726,014 503.0p 1.39%
31.01.09 158,505 48,409,307 327.4p 1.43%
31.01.10 187,718 43,907,479 427.5p 1.42%
31.07.10 184,727 40,396,624 457.3p 1.43%
The Net asset value and the Net asset value per income share are shown ex-dividend.
The total expense ratio (TER) takes into account the ACD fee and any fixed expenses charged to revenue overthe financial period, expressed as a percentage of the average daily net asset values over the same period.

113
ContinuationReturn to Index�
�
Market value Total netInvestment Holding £’000 assets %
Portfolio statementAs at 31 July 2010
Investment funds – 98.8% (99.2%)3i Infrastructure 3,271,038 3,660 1.13i Infrastructure Warrants 2012 (GBP 1.00) 390,000 48 –Aberforth Smaller Companies Trust 675,807 3,572 1.1Advance Developing Markets Fund 2,037,986 8,361 2.6Alliance Trust 1,289,140 4,083 1.3Ashmore Global Opportunities 440,000 3,102 1.0Baillie Gifford Japan Trust 1,294,230 2,080 0.7BH Macro 138,377 2,416 0.8Biotech Growth Trust 2,385,183 3,530 1.1Blackrock Commodities Income Investment
Trust 750,109 923 0.3Blackrock World Mining Trust 1,808,019 10,279 3.2British Empire Securities & General Trust 1,536,132 6,711 2.1Caledonia Investments 363,554 5,857 1.8Candover Investments 360,443 2,235 0.7Castle Asia Alternative 3,152,650 2,727 0.9City Natural Resources High Yield Trust 2,091,400 4,078 1.3Damille Investments 2,251,098 2,319 0.7Dexion Trading 1,625,000 1,885 0.6Dolphin Capital Investors 1,548,750 604 0.2Ecofin Water & Power Opportunities 2,272,481 3,039 1.0Edinburgh Dragon Trust 2,037,076 4,384 1.4Edinburgh Investment Trust 419,097 1,658 0.5Edinburgh Worldwide Investment Trust 1,186,081 2,953 0.9Electra Private Equity 422,590 5,494 1.7F&C Private Equity Trust Restricted 1,500,000 79 –Fidelity China Special Situations 3,100,000 3,224 1.0Fidelity European Values 696,523 6,854 2.1Fidelity Special Values 310,925 1,719 0.5Finsbury Growth & Income Trust 1,193,000 3,436 1.1Finsbury Worldwide Pharmaceutical Trust 1,007,724 6,374 2.0Gartmore Fledgling Trust 876,835 3,209 1.0Gartmore Growth Opportunities 721,588 3,283 1.0Gartmore Irish Growth Fund 242,500 1,489 0.5Hansa Trust ‘A’ Non-Voting 685,380 5,044 1.6Henderson Eurotrust 508,000 2,446 0.8HG Capital Trust 405,448 3,211 1.0HG Capital Trust Subscriptions shares
(GBP 9.50) 111,189 43 –IIMIA Investment Trust 1,350,000 1,519 0.5Impax Asian Environmental Markets 2,050,000 2,358 0.7Impax Asian Environmental Markets
Subscription shares (GBP 100) 480,000 134 –Impax Environmental Markets 3,353,647 3,706 1.2ING Global Real Estate Securities 1,900,000 1,368 0.4JPMorgan American Investment Trust 551,458 3,987 1.2JPMorgan Asian Investment Trust 4,600,013 9,149 2.9JPMorgan Asian Investment Trust
Subscription shares (GBP 176) 997,275 364 0.1JPMorgan Brazil Investment Trust 2,710,000 2,751 0.9JPMorgan Brazil Investment Trust
Subscription Shares (GBP 100) 542,000 149 –JPMorgan Emerging Markets Investment Trust 1,425,875 7,358 2.3JPMorgan Emerging Markets Investment Trust
Subscription shares (GBP 422) 219,030 181 0.1JPMorgan European Fledgeling Investment
Trust 708,673 4,854 1.5JPMorgan European Investment Trust (Growth) 2,695,042 4,278 1.3JPMorgan Income & Capital Trust 1,688,037 1,131 0.4JPMorgan Income & Growth Investment Trust
(Capital) 4,836,729 406 0.1JPMorgan Income & Growth Investment Trust
(Income) 133,333 86 –JPMorgan Income & Growth Investment Trust
(Units) 317,875 229 0.1JPMorgan Indian Investment Trust 774,007 3,125 1.0JPMorgan Japanese Investment Trust 2,886,414 4,474 1.4JPMorgan Japanese Smaller Companies
Investment Trust 1,831,186 2,504 0.8JPMorgan Japanese Smaller Companies
Investment Trust Subscription shares (GBP 147) 326,000 68 –
JPMorgan Overseas Investment Trust 330,127 2,455 0.8JPMorgan Russian Securities 715,000 4,054 1.3JPMorgan Smaller Companies Investment Trust 982,127 3,575 1.1JPMorgan US Discovery Investment Trust 403,301 3,017 0.9Jupiter European Opportunities Trust 2,387,921 5,241 1.6Mercantile Investment Trust 1,593,490 15,337 4.8Midas Income & Growth Trust 1,387,867 1,537 0.5Monks Investment Trust 3,587,060 10,413 3.3
Market value Total netInvestment Holding £’000 assets %
Montanaro European Smaller Companies Trust 815,000 2,869 0.9Montanaro UK Smaller Companies
Investment Trust 1,425,000 3,791 1.2NB Distressed Debt Investment Fund 5,055,600 3,408 1.1NB Distressed Debt Investment Subscription
Shares (USD 1.00) 1,041,120 47 –North Atlantic Smaller Companies Investment
Trust 490,000 4,729 1.5Pacific Horizon Investment Trust 2,718,993 3,949 1.2Perpetual Income & Growth Investment Trust 754,605 1,664 0.5Perpetual Income & Growth Investment Trust
Subscription shares (GBP 218.94) 252,299 61 –Private Equity Investor 804,227 977 0.3PSource Structured Debt 2,569,751 1,028 0.3RCM Technology Trust 1,201,143 3,387 1.1RCM Technology Trust Subscription shares
(GBP 267) 228,000 68 –Renaissance US Growth Investment Trust 900,000 2,376 0.7RIT Capital Partners 439,239 5,183 1.6Schroder Asia Pacific Fund 4,206,652 8,056 2.5Schroder Asia Pacific Fund Subscription
shares (GBP 191) 981,330 108 –Schroder UK Growth 2,000,000 2,370 0.7Scottish Mortgage Investment Trust 2,244,278 13,511 4.2Standard Life UK Smaller Companies Trust 1,350,000 2,079 0.7SVG Capital 1,110,666 1,708 0.5SVM Global Fund 2,006,277 5,236 1.6SVM UK Active Fund 1,429,347 2,012 0.6Templeton Emerging Markets Investment Trust 1,487,000 8,253 2.6Thames River Multi Hedge 2,655,593 2,934 0.9The Cayenne Trust 2,808,000 3,145 1.0TR Property Investment Trust Sigma 3,968,030 2,579 0.8Utilico 970,000 1,135 0.4Utilico Warrants 2012 (GBP 3.15) 25,451 – –Vision Opportunity China 3,200,000 3,636 1.1
Investment assets 316,516 98.8
Net other assets 3,750 1.2
Net assets 320,266 100.0
Unless otherwise stated the above securities are admitted to official stock exchange listings or trade on aregulated market.
The comparative percentage figures in brackets are at 31 January 2010.

114
ContinuationReturn to Index�
�
£’000
Total of all purchases for the period 18,489
Major purchases Cost
Neuberger Berman Distressed Debt Investment Fund 3,600Fidelity China Special Situations 3,100JPMorgan Brazil Investment Trust 2,710Damille Investments 2,251Electra Private Equity 1,321Finsbury Worldwide Pharmaceutical Trust 1,031JPMorgan Indian Investment Trust 887The Cayenne Trust 496Vision Opportunity China 438JPMorgan Emerging Markets Investment Trust 427Caledonia Investments 395Ecofin Water & Power Opportunities 351HG Capital Trust 307JPMorgan Asian Investment Trust 304JPMorgan Japanese Smaller Companies Investment Trust 300Edinburgh Dragon Trust 251JPMorgan Japanese Investment Trust 240Schroder UK Growth 150Ashmore Global Opportunities (70)
£’000
Total of all sales for the period 39,885
Major sales Proceeds
Perpetual Income & Growth Investment Trust 3,337JPMorgan Asian Investment Trust 3,005Alliance Trust 2,336Bankers Investment Trust 2,180Fidelity European Values 1,944Schroder UK Mid & Small Cap Fund 1,653Scottish Investment Trust 1,443BH Macro 1,395AXA Property Trust 1,361Gartmore Growth Opportunities 1,327Schroder Asia Pacific Fund 1,281Edinburgh Investment Trust 1,262Electra Private Equity 1,225Fidelity Special Values 1,196Scottish Mortgage Investment Trust 1,193HG Capital Trust 1,181Insight Foundation Property Trust 1,175Scottish American Investment Company 1,032JPMorgan Overseas Investment Trust 1,025Melchior Japan Investment Trust 982
Portfolio movements For the six months ended 31 July 2010

115
Return to Index�
Financial statements
Statement of total return(Unaudited)
For the six months ended 31 July2010 2009
£’000 £’000 £’000 £’000
Income
Net capital gains 21,904 44,769
Revenue 2,978 4,379
Expenses (2,387) (1,955)
Net revenue before taxation 591 2,424
Taxation – –
Net revenue after taxation 591 2,424
Total return before distributions 22,495 47,193
Finance costs: Distributions (595) (2,421)
Change in net assets attributable to shareholders from investment activities 21,900 44,772
Statement of change in net assets attributable to shareholders(Unaudited)
For the six months ended 31 July2010 2009
£’000 £’000 £’000 £’000
Opening net assets attributable to shareholders 318,592 263,952
Amounts receivable on issue of shares 130 173
Amounts payable on cancellation of shares (20,588) (8,749)
(20,458) (8,576)
Change in net assets attributable to shareholders from investment activities (see above) 21,900 44,772
Retained distributions on accumulation shares 233 950
Stamp duty reserve tax (7) (3)
Unclaimed distributions 6 7
Closing net assets attributable to shareholders 320,266 301,102
As the comparatives in the above table are for the previous interim period, the Net assets at the end ofthat period will not agree to the Net assets at the start of the current period.
Balance sheet(Unaudited)
As at31 July 2010 31 January 2010
£’000 £’000 £’000 £’000
ASSETS
Investment assets 316,516 316,004
Debtors 178 677
Cash and bank balances 4,400 2,702
Total other assets 4,578 3,379
Total assets 321,094 319,383
LIABILITIES
Creditors (509) (576)
Distribution payable on income shares (319) (215)
Total liabilities (828) (791)
Net assets attributable to shareholders 320,266 318,592

116
ContinuationReturn to Index�
�
JPM Natural Resources Fund
Investment objective and policyTo provide a portfolio primarily of shares in companies throughout the worldengaged in the production and marketing of commodities. The Fund aimsto provide capital growth over the long term.
Risk profileThis specialist equity based Fund focuses on one sector of the global stockmarket (and will include exposure to emerging markets and smallercompanies).
Equity investment is subject to specific risks relating to the performance ofthe individual companies held and the market’s perception of theirperformance. Equities are also subject to systematic risks such as generaleconomic conditions, inflation, interest rates, foreign exchange rates andindustry sector risks. In general terms, equities tend to be more volatile than bonds.
The Fund will be invested in emerging markets, which may be subject toadditional political and economic risks, low liquidity, poor transparencyand greater financial risks.
Smaller companies’ securities may be less liquid than the securities of largercompanies as a result of inadequate trading volume or restrictions on trading.Smaller companies may possess greater potential for growth, but can alsoinvolve greater risks, such as limited product lines and markets, and financialor managerial resources. Trading in such securities may be subject to moreabrupt price movements and greater fluctuations in available liquidity thantrading in the securities of larger companies.
Funds that invest predominantly in a single market, asset class or sectormay be subject to greater volatility than those funds with a more diversifiedportfolio.
The Fund is not managed with reference to its benchmark and its compositionmay significantly deviate from the benchmark. The benchmark is used forcomparison purposes only.
The underlying assets of the Fund are denominated in a currency other thanSterling and are not hedged back to Sterling. Investors will therefore beexposed to the currency risk of fluctuations between Sterling and the currencydenomination of the underlying assets.
Fund review• The past six months have been a volatile period for commodities. The
period started positively with base metal stocks benefiting from optimismabout the global recovery. However, investor nervousness set in as fearof a slowdown in China and a possible double dip recession in Europemounted. Investors were also concerned with the Australian government’sproposal for a super profits tax on domestic mining assets, which weighedon the sector. Towards the end of the period the sector received a boostfrom positive European economic data. Base metal prices recovered, with the nickel price gaining 14% and the copper price closing 8% higher,while the oil price gained 8% over the six-month period. The gold pricetouched new highs for the year, before falling back to end the period atUSD 1,180.
You should remember that past performance is not a guide to the future. The price of investments and the income from them may fall as well as rise andinvestors may not get back the full amount invested. For specific risks, please read the Simplified Prospectus.All performance returns are calculated using the quoted price of the accumulation shares. Performance returns are in Sterling.FX Adjusted returns have been calculated by JPMAM. Blended benchmarks have been calculated by JPMAM.Source: J.P. Morgan.A On 01/03/07 a customised index was introduced in order to facilitate a comparison between the Fund’s performance and that of the broader Natural Resources sector. Please note that the Fund should not be expected
to look or perform similar to the index.
• The Fund delivered positive absolute six-month performance. Our goldholdings were the largest positive contributors to performance, withholdings in precious metals, such as silver, also performing well. Ourholdings in base metals, notably steel producers, were weak over theperiod.
Fund outlook• From a top down perspective, within base metals we can see some clear
distinctions in terms of attractiveness, where supply is tighter for certainmetals such as copper and less so for others, notably aluminum. Assuch, we are selective within this group, and prefer copper to aluminum.
• We will likely maintain an overweight position in gold, as a good defensiveinvestment to counteract any negative sentiment impact on base metals.In the long-term, we think the sector will continue to offer an attractiveinvestment proposition and, as always, we focus on identifying world-class exploration projects that offer the greatest investment returnpotential.
Rolling 12 month performance as at 31 July2010/2009 2009/2008 2008/2007 2007/2006 2006/2005
JPM Natural ResourcesA-Class Acc 32.6% -14.6% -6.6% 37.4% 48.1%
JPM Natural Resources B-Class Acc 33.3% -14.1% – – –
Benchmark IndexA 24.9% -6.6% 14.3% 17.0% 43.2%
Six month performance31/01/10–31/07/10
JPM Natural Resources A-Class Acc 9.3%
Benchmark IndexA 10.1%
Fund statisticsFund size £1,887.7m
Benchmark IndexA HSBC Gold Mining & Energy Index(Total Return Net)
Fund chargesA-Class Initial 4.25%, Annual 1.50%B-Class Initial Nil, Annual 1.00%

117
ContinuationReturn to Index�
�
Top ten holdings %Rio Tinto 3.8Pacific Rubiales Energy 2.7Anglo American 2.6Xstrata 2.2Red Back Mining 1.9Petropavlovsk 1.8BHP Billiton 1.5SEMAFO 1.5Freeport-McMoRan Copper & Gold 1.5Barrick Gold 1.4
Sector breakdown %Gold & silver 32.6Base metals & diversified 32.1Oil & gas 21.6Coal 3.8Others 3.0Platinum 2.6Diamonds & precious stones 1.9Uranium 1.1Net other assets 1.3
Highest/lowest share price and distribution recordDistribution
Highest Lowest per shareCalendar year share price share price (net)
A-Class Accumulation Shares
2005 475.4p 308.1p 0.00p
2006 668.3p 476.1p 0.00p
2007 906.6p 560.0p 0.00p
2008 933.5p 297.1p 0.00p
2009 827.4p 387.7p 0.00p
2010B 944.1p 729.7p 0.00p
A-Class Income SharesC
2007 64.27p 50.00p –
2008 66.18p 21.06p 0.00p
2009 58.66p 27.49p 0.00p
2010B 66.94p 51.73p 0.00p
B-Class Accumulation SharesD
2007 101.3p 86.67p –
2008 104.6p 33.38p 0.00p
2009 93.46p 43.59p 0.00p
2010B 106.8p 82.49p 0.00p
B To 31 July 2010.C A-Class Income Shares were launched on 1 September 2007.D B-Class Accumulation Shares were launched on 1 November 2007.
Portfolio turnover rate31.07.09 51.51%
31.07.10 16.10%
The portfolio turnover rate (PTR) reflects the total of security purchases and sales, less the total of shareissues and cancellations, expressed as a percentage of the average daily net asset values over the period.
Net asset values and Total expense ratiosNet assetvalue per Net asset Total
share class Number value per expenseDate £’000 of shares share ratio
A-Class Accumulation Shares
31.01.08 1,535,693 195,235,579 786.6p 1.65%
31.01.09 807,054 194,107,599 415.8p 1.67%
31.01.10 1,686,211 225,659,286 747.2p 1.67%
31.07.10 1,827,434 224,807,485 812.9p 1.68%
A-Class Income Shares
31.01.08E 3,204 5,745,880 55.76p 1.68%
31.01.09E 5,257 17,834,042 29.47p 1.66%
31.01.10E 22,938 43,296,995 52.98p 1.66%
31.07.10 32,680 56,703,214 57.63p 1.68%
B-Class Accumulation Shares
31.01.08 12,464 14,164,282 87.99p 1.15%
31.01.09 7,972 17,049,904 46.76p 1.14%
31.01.10 20,054 23,740,284 84.47p 1.14%
31.07.10 27,615 29,971,665 92.14p 1.15%
E The Net asset value and the Net asset value per income share are shown ex-dividend at the financial year end.
The total expense ratio (TER) takes into account the ACD fee and any fixed expenses charged to revenue overthe financial period, expressed as a percentage of the average daily net asset values over the same period.

118
ContinuationReturn to Index�
�
Market value Total netInvestment Holding £’000 assets %
Portfolio statementAs at 31 July 2010
Gold & silver – 32.6% (28.4%)Adamus Resources 15,571,729 4,363 0.2Alamos Gold 1,275,000 11,835 0.6Allied Gold (AUD) 11,265,966 2,050 0.1Allied Gold (GBP)B 9,150,000 1,739 0.1Andean Resources 2,875,000 5,963 0.3Andean Resources (Placing) 1,080,000 2,279 0.1Anglogold Ashanti 265,000 6,801 0.4Aura Minerals 2,910,000 6,576 0.4Avoca Resources 6,325,000 9,611 0.5Avocet MiningB 5,450,000 6,499 0.3Banro (CAD) 5,578,571 6,356 0.3Banro (USD) 1,160,000 1,318 0.1Banro Call Warrants 2011 (USD 2.20) 125,000 28 – Barrick Gold (CAD) 946,500 24,737 1.3Barrick Gold (USD) 63,462 1,651 0.1Bezant ResourcesB 1,050,000 200 – Carrick Gold 6,450,000 1,435 0.1Centamin Egypt (CAD) 3,200,000 4,881 0.3Centamin Egypt (GBP) 13,257,237 20,297 1.1Centerra Gold 1,880,000 15,333 0.8CGA MiningA 6,936,976 8,551 0.5Cluff GoldB 6,500,000 4,908 0.3Coeur D’Alene Minecom 1,190,000 11,528 0.6Detour Gold 1,042,791 15,568 0.8Eldorado Gold 1,522,840 15,634 0.8European GoldfieldsB 3,350,000 14,807 0.8Exeter Resources 1,696,563 6,179 0.3Extorre Gold Mines 1,696,563 2,905 0.2Galantas Gold (CAD) 750,712 14 – Galantas Gold (GBP)B 3,000,000 60 – Gammon Gold 1,957,000 7,396 0.4GMA ResourcesB 11,526,403 115 – Gold Wheaton Gold Warrants 2013 (CAD 1.00) 102,300 10 – Goldcorp 420,000 10,491 0.6G-Resources Group 292,503,000 9,550 0.5Greystar Resources 3,399,099 8,190 0.4Highland Gold MiningB 4,400,000 5,335 0.3IAMGOLD (CAD) 887,000 8,863 0.5IAMGOLD (USD) 368,000 3,657 0.2Integra Mining 22,860,000 4,491 0.2Jaguar Mining 2,378,724 11,773 0.6Kazakhgold Group GDR 1,811,396 5,117 0.3Keegan Resources 275,000 871 0.1Kinross Gold 1,595,000 16,623 0.9Kirkland Lake Gold 1,900,000 9,357 0.5Mala Noche Resources 2010 1,100,000 4,006 0.2Mariana ResourcesB 7,091,143 1,560 0.1Minera IRLB 3,530,000 2,153 0.1Mineral Deposits (AUD) 7,931,273 3,528 0.2Mineral Deposits (CAD) 3,700,000 1,566 0.1Monarch Gold Mining† 6,904,508 199 – Mungana Goldmines 1,037,500 498 – Nevsun Resources 6,547,835 14,757 0.8Newcrest Mining 620,000 11,710 0.6Newmont Mining 383,000 13,701 0.7Norseman Gold CDI 800,000 351 – Norseman GoldB 10,040,133 4,217 0.2Northern Star Mining 1,370,000 64 – Northern Star MiningA 8,500,000 397 – Northern Star Mining Warrants 2012
(CAD 0.70) 685,000 – – Northern Star Warrants 2012 4,250,000 – – Nyota Minerals 15,941,129 2,830 0.2Oceanagold 5,460,000 8,991 0.5Orezone Gold 2,962,500 1,476 0.1Osisko Mining 2,802,864 22,126 1.2Pan African Resources 35,000,000 2,172 0.1Pan American Silver 705,000 10,279 0.6Pan American Silver Warrants 2014 222,000 – – Perseus Mining 3,700,000 4,607 0.2Petropavlovsk 3,249,399 33,079 1.8Polyus Zoloto 55,793 1,626 0.1Rainy River Resources 1,116,400 4,170 0.2Rainy River Warrants 2012 325,000 – – Ramelius Resources 8,397,043 2,086 0.1Randgold Resources ADS 394,000 22,353 1.2Real Gold Mining 3,089,500 2,824 0.1Red Back Mining 2,265,000 35,958 1.9
Market value Total netInvestment Holding £’000 assets %
Rio Alto Mining 5,600,000 2,685 0.1Romarco Minerals 8,113,333 8,334 0.4Rubicon Minerals Corporation 700,000 1,565 0.1Rusoro Mining 13,000,000 1,619 0.1Saracen Mineral 3,957,143 960 0.1Saracen MineralA 2,000,000 439 – Scorpio Mining 5,170,317 2,092 0.1SEMAFO 6,470,000 29,243 1.5Silver Wheaton 1,660,300 19,670 1.0St Barbara 25,875,815 4,410 0.2Victoria Gold 3,770,000 1,666 0.1Victoria Gold Warrants 2012 (CAD 0.55) 685,000 68 – Yamana Gold 2,100,000 12,525 0.7
Base metals & diversified – 32.1% (34.9%)Aditya Birla Minerals 9,500,000 4,830 0.3African Eagle ResourcesB 13,970,509 524 – African MineralsB 3,263,400 13,486 0.7Alexander MiningB 4,700,000 458 – Alumina 8,300,000 7,433 0.4Anglo American 1,913,000 48,724 2.6Anvil Mining 3,000,000 5,566 0.3Apoquindo Mins Warrants 2014 2,350,000 – – AQM Copper 4,700,000 2,136 0.1Aquila Resources 1,622,500 6,937 0.4ArcelorMittal 1,080,000 21,424 1.1Archipelago MetalsA 1,608,002 16 – Archipelago Metals Warrants 2010
(GBP 0.20)A 804,001 – – Archipelago ResourcesB 8,956,035 3,358 0.2Augusta Resource (CAD) 3,450,400 4,404 0.2Augusta Resource (USD) 570,000 721 – BHP Billiton (AUD) 855,000 19,814 1.0BHP Billiton (GBP) 490,600 9,594 0.5Blackthorn Resources 4,521,912 1,698 0.1Blackthorn Resources Warrants 2010
(AUD 0.45) 456,250 – – Bluescope Steel 6,200,000 8,454 0.5Cape Lambert Iron Ore 14,000,000 2,912 0.2Equinox Minerals 6,025,000 17,517 0.9European NickelB 4,967,729 1,006 0.1Evraz Group GDR 560,000 9,635 0.5Ferrexpo 4,577,622 12,845 0.7Ferrox Holdings† 158,318 – – Ferrox Holdings Warrants 2014 79,158 – – First Quantum Minerals 272,000 11,393 0.6Fortescue Metals Group 3,790,000 9,372 0.5Freeport-McMoRan Copper & Gold 627,500 28,490 1.5Gindalbie Metals 21,821,019 12,166 0.6Global Alumina 6,532,449 3,942 0.2Globestar Mining 5,600,000 3,417 0.2Hudbay Minerals 2,143,998 16,952 0.9Inco 43,500,000 12,793 0.7International Ferro Metals 21,240,000 6,160 0.3Jabiru Metals 11,000,000 2,193 0.1Kagara Zinc 16,600,000 6,234 0.3Kazakhmys 1,750,000 21,402 1.1Lundin Mining 6,300,000 15,610 0.8Lundin Mining SDR 1,317,059 3,262 0.2Mano River ResourcesB 3,636,253 2,945 0.2Merafe Resources 95,068,000 11,384 0.6Metorex 22,500,000 7,218 0.4Minsur ‘I’ 2,505,089 3,618 0.2Mirabela Nickel (AUD) 3,637,374 4,476 0.2Mirabela Nickel (CAD) 2,732,727 3,420 0.2MMC Norilsk Nickel ADR 1,243,000 13,095 0.7Mount Gibson Iron 7,800,000 7,481 0.4Murchison Metals 9,900,000 10,439 0.6Mwana AfricaB 15,412,325 1,389 0.1Ormonde MiningB 12,683,333 476 – Pan Australian Resources 13,508,667 4,410 0.2Pluton Resources 7,708,373 1,870 0.1Quadra FNX Mining 1,052,500 8,191 0.4Rambler Metals & MiningB 4,500,000 1,237 0.1Rex Minerals 2,763,772 3,050 0.2Rio Tinto (AUD) 710,000 28,953 1.5Rio Tinto (GBP) 1,320,000 43,817 2.3Southern Copper 490,000 9,812 0.5Sundance Resources 13,130,287 1,100 0.1

119
ContinuationReturn to Index�
�
Portfolio statement – continuedAs at 31 July 2010
Market value Total netInvestment Holding £’000 assets %
Terramin 4,800,000 1,692 0.1Thompson Creek Metals 1,600,000 9,284 0.5Titanium Resources GroupB 19,540,704 1,465 0.1United States Steel 330,000 9,273 0.5Vale ADR Preference 575,000 8,900 0.5Vedanta Resources 250,000 6,140 0.3Windimurra Vanadium† 7,085,887 – – Xstrata 4,090,000 41,943 2.2Zincox ResourcesB 4,305,464 1,625 0.1
Oil & gas – 21.6% (19.9%)Afren 10,000,000 9,125 0.5Alange Energy 10,000,000 2,304 0.1Aminex 16,133,559 1,371 0.1Aminex Warrants 2009 (GBP 0.22)A 2,064,166 – – Antrim Energy 4,107,197 2,352 0.1Argos Resources 11,595,308 3,855 0.2Aurora Oil & Gas 10,000,000 4,738 0.3Bankers Petroleum 700,000 3,255 0.2Borders & Southern PetroleumB 7,000,000 4,918 0.3BowlevenB 8,400,000 13,146 0.7Cadogen Petroleum (Restricted Dec 2008) 7,500,000 1,256 0.1Calvalley Petroleum 5,024,000 9,540 0.5Canadian Natural Resources 560,506 12,489 0.7China Petroleum & Chemical ‘H’ 14,000,000 7,221 0.4CNOOC 23,650,000 25,492 1.4ConocoPhillips 325,000 11,375 0.6DNO International 19,400,000 17,028 0.9Exco Resources 18,000,000 2,808 0.2Exillon Energy 4,965,385 7,945 0.4Falkand Oil & GasB 1,939,394 2,415 0.1Gulf Keystone Petroleum 5,450,000 4,782 0.3Heritage Oil 1,375,968 5,683 0.3International Petroleum 15,540,367 2,604 0.1Ithaca Energy (CAD) 7,000,000 7,321 0.4Ithaca Energy (GBP) 2,572,897 2,650 0.1Jordan Energy and MiningA 188,512 1,815 0.1Lukoil ADR 225,000 8,414 0.5Maple EnergyB 1,595,563 766 – Mitra EnergyA 935,000 2,701 0.1Nexen 385,000 5,177 0.3Niko Resources 295,000 20,133 1.1Ophir EnergyA 1,810,000 2,715 0.1Pacific Rubiales Energy 3,390,000 51,771 2.7Parex Resources 1,180,000 4,070 0.2Petrobank Energy & Resources 485,000 12,953 0.7Petrobras ADS 620,000 14,178 0.8Petroceltic InternationalB 33,638,944 3,095 0.2Petrominerales 1,050,000 19,193 1.0PetroNeft ResourcesB 13,650,000 6,245 0.3Providence Group 1,674,000 2,678 0.1Providence Resources 12% Convertible 2012 3,000,000 1,252 0.1Quicksilver Resources 707,000 5,746 0.3Range Resources 272,500 6,702 0.4Regal PetroleumB 5,250,000 1,614 0.1Resaca ExploitationB 174,317 190 – Rialto Energy 11,675,000 2,226 0.1Rockhopper Exploration 870,725 2,667 0.1Sea Dragon Energy 14,350,000 2,502 0.1Sinopec Shanghai Petrochemical ‘H’ 55,500,000 13,900 0.7Southwestern Energy 338,000 7,966 0.4Tethys Petroleum 10,216,000 9,731 0.5Valero Energy 600,000 6,502 0.3Valiant PetroleumB 1,880,198 12,861 0.7Volga GasB 1,354,091 2,708 0.1Zhaikmunai LP GDR 2,049,800 9,541 0.5
Coal – 3.8% (4.2%)Caledon ResourcesB 6,750,000 3,324 0.2China Coal Energy ‘H’ 10,400,000 9,319 0.5China Shenhua Energy ‘H’ 7,200,000 17,795 0.9Coal of Africa (AUD) 1,500,000 1,547 0.1Coal of Africa (GBP)B 5,196,545 5,404 0.3New Hope Coal 2,275,000 6,178 0.3New World Resources ‘A’ 680,000 5,090 0.2Straits Asia Resources 3,797,000 3,687 0.2Straits Resources 4,450,000 3,600 0.2Western Canadian Coal 6,155,000 16,362 0.9Western Canadian Coal Warrants 2012 (CAD 3.25) 215,545 256 –
Market value Total netInvestment Holding £’000 assets %
Others – 3.0% (4.2%)Allied MedicalA 96,761 1 – Altus RenewablesA 715,000 – – Astra Agro Lestari 3,620,000 5,050 0.3Equatorial Biofuels 4,410,000 496 – Equatorial Palm Oil Warrants 2012 1,580,000 – – Equatorial Palm Oil Warrants 2013 630,000 – – IofinaB 3,355,000 772 – IOI 13,866,666 14,301 0.8Kenmare Resources 32,754,262 4,176 0.2Leaf Clean EnergyB 3,750,000 2,437 0.1Lynas 25,500,000 11,197 0.6New Britain Palm Oil 820,000 4,059 0.2Potash Corporation of Saskatchewan 130,000 8,610 0.5Potash One 1,074,000 1,645 0.1R.E.A. 598,900 3,084 0.2R.E.A. 9% Cum Preference 54,427 59 – White Rock Minerals 921,257 237 –
Platinum – 2.6% (3.4%)Aquarius Platinum 4,282,474 11,682 0.6Eastern Platinum 16,000,000 10,260 0.5Impala Platinum 543,000 9,310 0.5Jubilee Platinum (GBP)B 10,750,831 2,903 0.2Jubilee Platinum (ZAR) 700,000 199 – Platinum Australia 5,040,909 2,155 0.1Platinum Group Metals 4,983,850 5,864 0.3Platinum Group Metals Warrants 2010
(CAD 1.75) 700,000 179 – PlatminB 4,287,359 2,487 0.1Sylvania ResourcesB 9,595,000 4,653 0.3
Diamonds & precious stones – 1.9% (1.5%)African DiamondsB 5,250,000 1,575 0.1Diamond CorpB 7,729,121 464 – Diamonds North Resources 3,750,000 444 – DiamonEx (GBP)* 800,000 – – DiamonEx (AUD)* 6,500,000 – – Firestone DiamondsB 7,059,536 1,871 0.1Gem Diamonds 1,500,000 3,231 0.2Harry Winston Diamond 849,800 6,655 0.3IGE Resources 10,198,268 353 – Kopane DiamondsB 17,637,134 1,940 0.1Lucara DiamondA 4,545,455 2,151 0.1Mantle DiamondsA 1,693,365 169 – Mountain Province Diamonds 739,767 1,382 0.1Mountain Province Diamonds 982,500 1,835 0.1Pangea DiamondfieldsB 43,211,173 – – Petra DiamondsB 18,050,000 12,409 0.7Redox DiamondsA 2,000,000 12 – Stellar DiamondA 5,200,000 520 – Stornaway Diamond 4,400,000 1,616 0.1Target Resources* 6,155,800 1 – Tsar EmeraldA 9,400,000 1 –
Uranium – 1.1% (2.0%)Berkeley Resources (AUD) 1,097,600 796 – Berkeley Resources (GBP)B 2,100,000 1,554 0.1Berkeley Resources Warrants 2013 (AUD 0.75) 26,133 8 – Curnamona Energy 1,070,685 111 – Kalahari MineralsB 5,440,000 8,922 0.5Mantra Resources (CAD) 586,154 1,536 0.1Mantra Resources (AUD) 3,056,220 7,858 0.4
Investment assets 1,863,563 98.7
Net other assets 24,166 1.3
Net assets 1,887,729 100.0
Unless otherwise stated the above securities are admitted to official stock exchange listings or trade on aregulated market.
The comparative percentage figures in brackets are at 31 January 2010.A Unquoted securityB Quoted on Alternative Investment Market† Suspended security* Delisted security

120
ContinuationReturn to Index�
�
£’000
Total of all purchases for the period 236,343
Major purchases Cost
Anglo American 19,989Xstrata 14,310Vale ADR Preference 10,762Barrick Gold 10,073Newmont Mining 8,932Mala Noche Resources 8,329Valero Energy 8,082Harry Winston Diamond Corporation 7,504Kalahari Minerals 7,274Gindalbie Metals 6,842Vedanta Resources 6,315Anvil Mining 5,891Nexen 5,841Quadra Mining 4,478Jaguar Mining 4,378Aurora Oil & Gas Limited 4,371Perseus Mining (Placing) Apr10 4,336Sea Dragon Energy 4,213Bankers Petroleum 4,211Gulf Keystone Petroleum 4,053
£’000
Total of all sales for the period 234,249
Major sales Proceeds
First Quantum Minerals 22,532Vedanta Resources 19,018Freeport-McMoRan Copper & Gold 12,958The Mosaic Company 12,395Uranium One 12,207Rio Tinto 10,795ExxonMobil 10,356Newmont Mining 9,410Lynas 8,803Cameco 7,013Centennial Coal 6,605Heritage Oil 6,429African Minerals 6,332Capstone Mining 5,980Talisman Energy 5,794New Gold 5,098St Barbara 4,938FNX Mining 4,640Equinox Minerals 4,617Silvercorp Metals 4,344
Portfolio movements For the six months ended 31 July 2010

121
Return to Index�
Financial statements
Statement of total return(Unaudited)
For the six months ended 31 July2010 2009
£’000 £’000 £’000 £’000
Income
Net capital gains 157,476 417,151
Revenue 7,852 5,449
Expenses (16,338) (9,084)
Net expense before taxation (8,486) (3,635)
Taxation (642) (216)
Net expense after taxation (9,128) (3,851)
Total return before distributions 148,348 413,300
Finance costs: Distributions (50) (210)
Change in net assets attributable to shareholders from investment activities 148,298 413,090
Statement of change in net assets attributable to shareholders(Unaudited)
For the six months ended 31 July2010 2009
£’000 £’000 £’000 £’000
Opening net assets attributable to shareholders 1,729,203 820,283
Amounts receivable on issue of shares 88,948 164,019
Amounts payable on cancellation of shares (78,458) (25,029)
10,490 138,990
Change in net assets attributable to shareholders from investment activities (see above) 148,298 413,090
Stamp duty reserve tax (262) (101)
Closing net assets attributable to shareholders 1,887,729 1,372,262
As the comparatives in the above table are for the previous interim period, the Net assets at the end ofthat period will not agree to the Net assets at the start of the current period.
Balance sheet(Unaudited)
As at31 July 2010 31 January 2010
£’000 £’000 £’000 £’000
ASSETS
Investment assets 1,863,563 1,703,100
Debtors 15,510 8,270
Cash and bank balances 18,275 43,444
Total other assets 33,785 51,714
Total assets 1,897,348 1,754,814
LIABILITIES
Creditors (9,619) (25,611)
Total liabilities (9,619) (25,611)
Net assets attributable to shareholders 1,887,729 1,729,203

122
ContinuationReturn to Index�
�
JPM New Europe Fund
You should remember that past performance is not a guide to the future. The price of investments and the income from them may fall as well as rise andinvestors may not get back the full amount invested. For specific risks, please read the Simplified Prospectus.All performance returns are calculated using the quoted price of the accumulation shares. Performance returns are in Sterling.FX Adjusted returns have been calculated by JPMAM. Blended benchmarks have been calculated by JPMAM.Source: J.P. Morgan.A On 01/09/06 the benchmark was changed from MSCI EM Eastern Europe USD Net to MSCI Emerging Markets Europe Index (Total Return Net).Benchmark Source: MSCI. Neither MSCI nor any other party involved in or related to compiling, computing or creating the MSCI data makes any express of implied warranties or representations with respect to such data(or the results to be obtained by the use thereof), and all such parties hereby expressly disclaim all warranties of originality, accuracy, completeness, merchantability or fitness for a particular purpose with respect toany of such data. Without limiting any of the foregoing, in no event shall MSCI, any of its affiliates or any third party involved in or related to compiling computing or creating the data have any liability for any direct,indirect, special, punitive, consequential or any other damages (including lost profits) even if notified of the possibility of such damages. No further distribution or dissemination of the MSCI data is permitted withoutMSCI’s express written consent.
Fund outlook• Investor concerns have moved on from rate normalisation across the
emerging markets to doubts over the sustainability of the global recovery.We continue to believe in a half-speed developed market recovery givingway to a half-speed expansion. While not expecting a relapse in the globalcycle, we note that emerging markets retain far greater policy flexibilitythan developed markets. This is most evident in fiscal terms but also inmonetary policy given that most emerging market central banks havestarted to raise rates and so may cut again if needed.
• Any moderation in global growth will naturally feed through to earningsexpectations in emerging markets and developed markets. However, withvaluations looking attractive again we believe New Europe’s markets willbe able to absorb some moderation in 2011 consensus earnings growth.
Rolling 12 month performance as at 31 July2010/2009 2009/2008 2008/2007 2007/2006 2006/2005
JPM New EuropeA-Class Acc 51.0% -34.9% 7.8% 30.7% 47.5%
JPM New EuropeB-Class Acc 51.8% -34.7% – – –
Benchmark IndexA 34.3% -34.2% 3.5% 15.9% 51.5%
Six month performance31/01/10–31/07/10
JPM New Europe A-Class Acc 9.3%
Benchmark IndexA 2.1%
Fund statisticsFund size £250.0m
Benchmark IndexA MSCI Emerging Markets Europe Index(Total Return Net)
Fund chargesA-Class Initial 4.25%, Annual 1.50%B-Class Initial Nil, Annual 1.00%
Investment objective and policyTo provide long-term capital growth by investing primarily in companiesoperating or investing in central and eastern Europe and Russia.
Risk profileThis equity based Fund is designed for investors looking for enhanced long-term capital growth opportunities, but who are comfortable with exposureto emerging market and smaller company investments.
Equity investment is subject to specific risks relating to the performance ofthe individual companies held and the market’s perception of theirperformance. Equities are also subject to systematic risks such as generaleconomic conditions, inflation, interest rates, foreign exchange rates andindustry sector risks. In general terms, equities tend to be more volatile than bonds.
This Fund is aggressively managed, which may result in higher volatility ofthe Fund’s performance and bigger differences between the performanceof the Fund and its benchmark when compared to core funds.
The Fund will be invested in emerging markets, which may be subject toadditional political and economic risks, low liquidity, poor transparencyand greater financial risks.
Investors should be aware that the Fund will be exposed to the particularpolitical and economic risks of Russia.
Smaller companies’ securities may be less liquid than the securities of largercompanies as a result of inadequate trading volume or restrictions on trading.Smaller companies may possess greater potential for growth, but can alsoinvolve greater risks, such as limited product lines and markets, and financialor managerial resources. Trading in such securities may be subject to moreabrupt price movements and greater fluctuations in available liquidity thantrading in the securities of larger companies.
The underlying assets of the Fund are denominated in currencies other thanSterling and are not hedged back to Sterling. Investors will therefore beexposed to the currency risk of fluctuations between Sterling and the currencydenomination of the underlying assets.
Fund review• New Europe was the worst performing of the emerging market regions
for the review period as volatility affected returns and the severity of theGreek debt crisis left investor sentiment very fragile. While March providedsome relief, doubts about the stability of the eurozone and global growthcaused increased risk aversion. Turkey was the best performing marketthanks to a strong cyclical recovery, while Poland and Hungary didparticularly badly as nervousness over the European debt crisis spreadto the region.
• The Fund outperformed its benchmark over the period. Stock selectionin Russia and Turkey greatly contributed to performance and investmentideas in the Czech Republic and Ukraine also worked well. Exposure toKazakhstan was the worst performer and stock selection in Hungary alsodetracted from relative returns.

123
ContinuationReturn to Index�
�
Top ten holdings %Sberbank of Russia 9.2 Magnit GDR 7.8 Mobile Telesystems ADR 5.2 JPMorgan Russian Securities 4.7 Dragon Oil 4.1 MMC Norilsk Nickel ADR 4.0 Turkiye Garanti Bankasi 3.8 Magnitogorsk Iron & Steel Works GDR 3.3 AO Tatneft GDR 3.3CTC Media 3.2
Geographical breakdown %Russia 58.9Turkey 17.6Poland 7.1Turkmenistan 4.1Czech Republic 3.2Kazakhstan 3.0Sweden 1.2Ukraine 0.0Net other assets 4.9
Highest/lowest share price and distribution recordDistribution
Highest Lowest per shareCalendar year share price share price (net)
A-Class Accumulation Shares
2005 127.1p 77.50p 0.00p
2006 170.1p 121.4p 0.02p
2007 239.6p 154.6p 0.90p
2008 258.9p 74.00p 1.32p
2009 185.1p 74.22p 2.16p
2010B 226.8p 183.2p 0.14p
A-Class Income SharesC
2007 62.97p 49.31p –
2008 68.04p 19.45p 0.00p
2009 47.43p 18.90p 0.55p
2010B 58.08p 46.92p 0.04p
B-Class Accumulation SharesD
2008 123.9p 35.51p 0.00p
2009 89.34p 35.67p 1.33p
2010B 109.7p 88.50p 0.43p
B To 31 July 2010.C A-Class Income Shares were launched on 1 September 2007.D B-Class Accumulation Shares were launched on 22 January 2008.
Portfolio turnover rate31.07.09 54.49%
31.07.10 53.35%
The portfolio turnover rate (PTR) reflects the total of security purchases and sales, less the total of shareissues and cancellations, expressed as a percentage of the average daily net asset values over the period.
Net asset values and Total expense ratiosNet assetvalue per Net asset Total
share class Number value per expenseDate £’000 of shares share ratio
A-Class Accumulation Shares
31.01.08 165,653 79,188,622 209.2p 1.72%
31.01.09 77,026 97,538,652 78.97p 1.67%
31.01.10 218,852 115,642,873 189.3p 1.68%
31.07.10 244,633 118,363,385 206.7p 1.68%
A-Class Income Shares
31.01.08E 568 1,032,347 55.00p 1.68%
31.01.09E 424 2,092,307 20.25p 1.68%
31.01.10E 1,551 3,199,709 48.46p 1.68%
31.07.10 2,151 4,065,089 52.93p 1.68%
B-Class Accumulation Shares
31.01.08 1,095 1,094,191 100.1p 1.15%
31.01.09 305 804,772 37.94p 1.15%
31.01.10 2,133 2,334,456 91.40p 1.15%
31.07.10 3,180 3,177,120 100.1p 1.15%
E The Net asset value and the Net asset value per income share are shown ex-dividend at the financial year end.
The total expense ratio (TER) takes into account the ACD fee and any fixed expenses charged to revenue overthe financial period, expressed as a percentage of the average daily net asset values over the same period.

124
ContinuationReturn to Index�
�
Portfolio statementAs at 31 July 2010
Market value Total netInvestment Holding £’000 assets %
Russia – 58.9% (60.9%)AO Tatneft GDR 407,086 8,164 3.3 Cheliabinsk Elektrolit Zink Plant GDR 200,713 457 0.2 Cherkizovo Group GDR 216,748 2,059 0.8 Comstar United Telesystem GDR 1,068,610 4,377 1.8 CTC Media 695,373 7,946 3.2 DIXY Group 215,286 1,388 0.6 EurAsia Drilling Company GDR 168,367 2,135 0.9 Gazprom ADR 360,200 4,974 2.0 JPMorgan Russian Securities 2,081,349 11,801 4.7 Lukoil ADR 151,550 5,667 2.3 Magnit GDR 1,446,279 19,489 7.8 Magnitogorsk Iron & Steel Works GDR 1,231,772 8,327 3.3 MMC Norilsk Nickel ADR 948,346 9,991 4.0 Mobile Telesystems ADR 918,586 12,950 5.2 Novolipetsk Iron and Steel GDS 292,732 5,901 2.4 Sberbank of Russia 12,844,127 22,971 9.2 Sistema GDR 444,777 6,830 2.7 Surgutneftegaz ADR 672,700 4,371 1.7 Urals EnergyB 532,300 72 – Wimm Bill Dann Foods OJSC ADR 4,900 61 – X5 Retail Group GDR 288,400 6,919 2.8
Turkey – 17.6% (17.3%)Arcelik 487,100 1,509 0.6 Eastpharma GDR 124,930 108 – TSKB 856,103 752 0.3 Turk Ekonomi Bankasi 3,926,121 3,567 1.4 Turk Hava Yollari 1,265,737 2,321 0.9 Turkcell Iletisim Hizmetleri 640,805 2,380 1.0 Turkiye Garanti Bankasi 2,820,836 9,400 3.8 Turkiye Halk Bankasi 983,233 5,092 2.0 Turkiye Is Bankasi ‘C’ 2,594,215 6,167 2.5 Turkiye Petrol Rafinerileri 369,361 5,292 2.1 Turkiye Vakiflar Bankasi ‘D’ 1,666,383 2,886 1.2 Yapi ve Kredi Bankasi 2,291,003 4,474 1.8
Poland – 7.1% (4.8%)Bank Pekao 224,322 7,698 3.1 Eurocash 67,711 325 0.1 Kernel 195,400 2,577 1.0 Powszechna Kasa Oszczednosci Bank Polski 367,501 2,993 1.2 Powszechny Zaklad Ubezpieczen 50,632 4,148 1.7
Market value Total netInvestment Holding £’000 assets %
Turkmenistan – 4.1% (3.8%)Dragon Oil 2,417,678 10,287 4.1
Czech Republic – 3.2% (3.6%)CEZ 112,939 3,292 1.3 Telefonica O2 Czech Republic 329,108 4,785 1.9
Kazakhstan – 3.0% (4.2%)BMB Munai 172,609 63 – Halyk Savings Bank of Kazakhstan GDR 114,200 477 0.2 Kazakhgold Group GDR 170,004 480 0.2 Kazmunaigas Exploration Production GDR 333,300 4,241 1.7 Steppe Cement 721,262 317 0.1 Zhaikmunai LP GDR 453,959 2,113 0.8
Sweden – 1.2% (0.0%)Oriflame Cosmetics SDR 80,051 3,047 1.2
Ukraine – 0.0% (0.0%)XXI Century Investments† 88,591 – –
Investment assets 237,641 95.1
Net other assets 12,323 4.9
Net assets 249,964 100.0
Unless otherwise stated the above securities are admitted to official stock exchange listings or trade on aregulated market.
The comparative percentage figures in brackets are at 31 January 2010.B Quoted on Alternative Investment Market† Suspended security

125
ContinuationReturn to Index�
�
£’000
Total of all purchases for the period 97,464
Major purchases Cost
Gazprom ADR 11,130Lukoil ADR 8,546Bank Pekao 7,609Akbank T.A.S. 6,801Sberbank of Russia 6,711OTP Bank 6,372Powszechny Zaklad Ubezpieczen 5,264Magnit GDR 3,975Turk Ekonomi Bankasi 3,813Dragon Oil 3,206Oriflame Cosmetics SDR 3,205Raiffeisen International Bank 2,683Mobile Telesystems ADR 2,642Turk Hava Yollari 2,519Turkcell Iletisim Hizmetleri 2,509Turkiye Halk Bankasi 2,508Kernel 2,477Telefonica O2 Czech Republic 2,475Turkiye Vakiflar Bankasi ‘D’ 2,380Yapi ve Kredi Bankasi 1,954
£’000
Total of all sales for the period 98,005
Major sales Proceeds
OTP Bank 13,975Vimpel-Communications ADR 9,525Akbank T.A.S. 7,191Gazprom ADR 6,906MMC Norilsk Nickel ADR 5,929Turkiye Garanti Bankasi 5,208Turkcell Iletisim Hizmet ADS 4,412Sberbank of Russia 3,921Yapi ve Kredi Bankasi 3,892Telekomunikacja Polska 3,432Sistema GDR 3,349Komercni Banka 2,700KOC 2,463X5 Retail Group GDR 2,396Powszechna Kasa Oszczednosci Bank Polski 2,378Raiffeisen International Bank 2,339Lukoil ADR 2,318Powszechny Zaklad Ubezpieczen 1,724Polish Oil and Gas 1,658Turkiye Is Bankasi ‘C’ 1,369
Portfolio movements For the six months ended 31 July 2010

126
Return to Index�
Financial statements
Statement of total return(Unaudited)
For the six months ended 31 July2010 2009
£’000 £’000 £’000 £’000
Income
Net capital gains 18,404 55,617
Revenue 3,463 2,054
Expenses (2,042) (941)
Net revenue before taxation 1,421 1,113
Taxation (487) (126)
Net revenue after taxation 934 987
Total return before distributions 19,338 56,604
Finance costs: Distributions (24) 4
Change in net assets attributable to shareholders from investment activities 19,314 56,608
Statement of change in net assets attributable to shareholders(Unaudited)
For the six months ended 31 July2010 2009
£’000 £’000 £’000 £’000
Opening net assets attributable to shareholders 222,536 77,755
Amounts receivable on issue of shares 36,441 23,706
Amounts payable on cancellation of shares (28,311) (10,413)
8,130 13,293
Change in net assets attributable to shareholders from investment activities (see above) 19,314 56,608
Stamp duty reserve tax (16) (5)
Closing net assets attributable to shareholders 249,964 147,651
As the comparatives in the above table are for the previous interim period, the Net assets at the end ofthat period will not agree to the Net assets at the start of the current period.
Balance sheet(Unaudited)
As at31 July 2010 31 January 2010
£’000 £’000 £’000 £’000
ASSETS
Investment assets 237,641 219,871
Debtors 7,225 284
Cash and bank balances 11,026 4,981
Total other assets 18,251 5,265
Total assets 255,892 225,136
LIABILITIES
Creditors (5,928) (2,599)
Distribution payable on income shares – (1)
Total liabilities (5,928) (2,600)
Net assets attributable to shareholders 249,964 222,536

127
ContinuationReturn to Index�
�
JPM Premier Equity Growth Fund
Investment objective and policyTo provide long-term capital growth from investment in stocks and shares.The Fund currently invests predominantly in a portfolio of UK equities.
Risk profileThis equity based Fund is designed for investors looking for broad marketexposure (which may include smaller companies) predominantly to a singledeveloped stock market.
Equity investment is subject to specific risks relating to the performance ofthe individual companies held and the market’s perception of theirperformance. Equities are also subject to systematic risks such as generaleconomic conditions, inflation, interest rates, foreign exchange rates andindustry sector risks. In general terms, equities tend to be more volatile than bonds.
Funds that invest predominantly in a single market, asset class or sectormay be subject to greater volatility than those funds with a more diversifiedportfolio.
Fund review• The six months under review began strongly for UK equities, helped by
positive economic data. However, eurozone sovereign debt concernsand growing uncertainty about the strength of the recovery contributedto volatility as the period progressed.
• Against this backdrop, the Fund produced positive returns andoutperformed its benchmark. Positive contributors to relative returnsincluded stock selection and an overweight position in the industrialengineering sector and stock selection in the general retailers sectors.Stock selection in the oil & gas producers sector detracted, as did stockselection and an underweight position in the media sector.
• At the stock level, the Fund benefited most from an overweight positionin engineering company IMI, which received broker upgrades citing itssuccessful cost-cutting measures and attractive valuation. An overweightposition in Halfords Group was also positive as the auto part and cycleretailer said it expects earnings to grow about 15% a year in the medium-term on an expanded core retail business and recent acquisitions.
• The biggest stock-level detractor was an overweight position in BP, whichwas attractively valued, but which fell heavily following an explosion on one of its oil platforms in the Gulf of Mexico. An underweight positionin British Sky Broadcasting Group was also detrimental as Rupert Murdoch’s News Corp., which owned 39.1% of British Sky Broadcasting Group as ofmid June, made a GBP 7.8 billion offer for the remaining shares boostingthe share price.
• However, the Fund was boosted by an overweight position in Aggreko,the provider of mobile power-supply equipment, which reported an increasein first-half profit and said full-year results will be significantly ahead ofexpectations.
You should remember that past performance is not a guide to the future. The price of investments and the income from them may fall as well as rise andinvestors may not get back the full amount invested. For specific risks, please read the Simplified Prospectus.All performance returns are calculated using the quoted price of the accumulation shares. Performance returns are in Sterling.FX Adjusted returns have been calculated by JPMAM. Blended benchmarks have been calculated by JPMAM.Source: J.P. Morgan.Source: FTSE International Limited (“FTSE”) © FTSE [2010]. “FTSE®” is a trade mark of London Stock Exchange Plc and The Financial Times Limited and is used by FTSE International Limited under licence. All rights inthe FTSE indices and/or FTSE ratings vest in FTSE and/or its licensors. Neither FTSE nor its licensors accept any liability for any errors or omissions in the FTSE indices and/or FTSE ratings or underlying data. No furtherdistribution of FTSE Data is permitted without FTSE’s express written consent.
Fund outlook• Volatility may persist in the short-term given the ongoing uncertainty
over the global economic outlook. However, UK equities are supportedby low interest rates, while valuations are attractive both compared tohistory and compared to bonds.
Rolling 12 month performance as at 31 July2010/2009 2009/2008 2008/2007 2007/2006 2006/2005
JPM Premier Equity GrowthA-Class Acc 17.2% -22.9% -14.7% 4.0% 19.6%
Benchmark Index 19.4% -10.5% -13.3% 13.0% 17.3%
Six month performance31/01/10–31/07/10
JPM Premier Equity Growth A-Class Acc 5.3%
Benchmark Index 4.0%
Fund statisticsFund size £259.4m
Benchmark Index FTSE All-Share (Total Return Net)
Fund charges Initial 4.25%, Annual 1.50%
Top ten holdings %Royal Dutch Shell ‘B’ 8.2Vodafone Group 6.8BP 5.5HSBC 5.1GlaxoSmithKline 4.6BHP Billiton 4.5AstraZeneca 3.8Anglo American 3.8British American Tobacco 3.7Unilever 3.1

128
ContinuationReturn to Index�
�
Sector breakdown %Financials 18.5Basic materials 15.6Oil & gas 14.8Industrials 10.3Health care 9.1Consumer goods 8.9Consumer services 8.5Telecommunications 6.8Equity investment instruments 2.4Technology 1.5Utilities 0.8Futures 0.0Net other assets 2.8
Highest/lowest share price and distribution recordDistribution
Highest Lowest per shareCalendar year share price share price (net)
A-Class Accumulation Shares
2005 323.5p 263.0p 4.15p
2006 378.3p 323.9p 4.90p
2007 393.3p 332.0p 4.52p
2008 364.2p 193.6p 6.24p
2009 280.2p 186.2p 6.79p
2010A 303.3p 255.0p 5.19p
A-Class Income SharesB
2007 50.80p 42.73p 0.00p
2008 46.67p 24.81p 0.17p
2009 34.76p 23.10p 0.89p
2010A 36.89p 31.03p 0.65p
A To 31 July 2010.B A-Class Income Shares were launched on 2 January 2007.
Portfolio turnover rate31.07.09 109.05%
31.07.10 73.45%
The portfolio turnover rate (PTR) reflects the total of security purchases and sales, less the total of shareissues and cancellations, expressed as a percentage of the average daily net asset values over the period.
Net asset values and Total expense ratiosNet assetvalue per Net asset Total
share class Number value per expenseDate £’000 of shares share ratio
A-Class Accumulation Shares
31.01.08 453,251 144,888,992 312.8p 1.58%
31.01.09 235,433 110,294,125 213.5p 1.68%
31.01.10 264,112 99,063,456 266.6p 1.67%
31.07.10 258,951 92,212,890 280.8p 1.68%
A-Class Income Shares
31.01.08C 133 332,550 40.07p 2.41%
31.01.09C 164 617,682 26.48p 1.68%
31.01.10C 1,079 3,325,508 32.43p 1.66%
31.07.10 407 1,191,816 34.16p 1.68%
C The Net asset value and the Net asset value per income share are shown ex-dividend at the financial year end.
The total expense ratio (TER) takes into account the ACD fee and any fixed expenses charged to revenue overthe financial period, expressed as a percentage of the average daily net asset values over the same period.

129
ContinuationReturn to Index�
�
Portfolio statementAs at 31 July 2010
Market value Total netInvestment Holding £’000 assets %
Financials – 18.5% (19.5%)Banks – 12.2%Barclays 1,441,317 4,802 1.9HSBC 2,020,001 13,273 5.1Lloyds Banking Group 8,186,308 5,720 2.2Royal Bank of Scotland Group 1,088,377 544 0.2Standard Chartered 386,647 7,224 2.8General financial – 2.8%Hargreaves Lansdown 303,425 1,098 0.4Investec 778,646 3,872 1.5Tullett Prebon 655,697 2,292 0.9Life insurance – 0.7%Legal & General Group 2,072,595 1,887 0.7Nonlife insurance – 2.8%Admiral Group 214,155 3,129 1.2Amlin 661,295 2,822 1.1Beazley Group 1,128,925 1,348 0.5
Basic materials – 15.6% (12.7%)Forestry & paper – 2.1%Mondi 1,225,221 5,540 2.1Mining – 13.5%Anglo American 386,508 9,844 3.8BHP Billiton 599,210 11,718 4.5Eurasian Natural Resources 517,285 4,668 1.8Ferrexpo 1,025,679 2,878 1.1Kazakhmys 45,793 560 0.2Rio Tinto 159,675 5,300 2.1
Oil & gas – 14.8% (18.6%)Oil & gas producers – 14.8%BG Group 91,842 932 0.4BP 3,539,645 14,371 5.5Essar Energy 135,796 573 0.2Royal Dutch Shell ‘B’ 1,243,905 21,196 8.2Tullow Oil 110,697 1,365 0.5
Industrials – 10.3% (6.6%)Aerospace & defence – 0.9%Rolls Royce Group 151,963 889 0.3Senior 1,263,339 1,628 0.6Construction & materials – 0.4%Morgan Sindall 190,944 1,001 0.4Electronics & electrical equipment – 0.4%Domino Printing Sciences 104,582 475 0.2Halma 225,276 630 0.2General industrials – 3.0%Cookson Group 99,236 437 0.2Smith (DS) 1,121,322 1,617 0.6Smiths Group 350,805 3,926 1.5Tomkins 527,952 1,712 0.7Industrial engineering – 2.6%IMI 586,336 4,178 1.6Weir Group 213,224 2,497 1.0Support services – 3.0%Aggreko 164,289 2,514 1.0Atkins (WS) 84,912 619 0.2Davis Service Group 281,195 1,056 0.4eaga 223,524 238 0.1Electrocomponents 916,387 2,059 0.8Filtrona 354,247 851 0.3Galiform 530,767 381 0.2
Health care – 9.1% (9.6%)Pharmaceuticals & biotechnology – 9.1%AstraZeneca 302,743 9,850 3.8GlaxoSmithKline 1,063,549 11,891 4.6Reckitt Benckiser Group 56,352 1,764 0.7
Market value Total netInvestment Holding £’000 assets %
Consumer goods – 8.9% (9.9%)Beverages – 1.4%Barr A.G. 22,939 272 0.1Britvic 481,427 2,324 0.9Diageo 27,275 304 0.1SABMiller 39,260 757 0.3Food producers – 3.6%Cranswick 60,332 528 0.2Dairy Crest Group 227,123 880 0.3Unilever 442,466 8,057 3.1Household goods – 0.2%Persimmon 150,681 536 0.2Tobacco – 3.7%British American Tobacco 431,400 9,553 3.7
Consumer services – 8.5% (7.1%)Food & drug retailers – 0.9%Greggs 139,842 621 0.2Tesco 461,756 1,821 0.7General retailers – 3.3%Dunelm Group 42,638 165 0.1Halfords Group 578,262 2,795 1.1Next 256,682 5,542 2.1Media – 0.7%Daily Mail & General Trust ‘A’ Non-Voting 78,258 384 0.1ITE Group 329,846 489 0.2Pearson 10,783 107 –Trinity Mirror 498,715 537 0.2WPP 63,053 428 0.2Travel & leisure – 3.6%Compass Group 67,191 360 0.1Intercontinental Hotels Group 394,776 4,386 1.7Rank Group 735,222 863 0.3Restaurant Group 233,246 527 0.2Stagecoach Group 1,944,992 3,322 1.3
Telecommunications – 6.8% (6.6%)Mobile telecommunications – 6.8%Vodafone Group 11,690,774 17,507 6.8
Equity investment instruments – 2.4% (2.3%)JPM UK Smaller Companies ‘A’ (Accumulation) 3,447,049 6,115 2.4
Technology – 1.5% (3.7%)Software & computer services – 1.5%Aveva Group 158,422 2,109 0.8Computacenter 553,643 1,524 0.6Invensys 44,992 121 0.1
Utilities – 0.8% (0.4%)Gas, water & multiutilities – 0.8%Centrica 213,208 658 0.3Pennon Group 215,457 1,282 0.5
Futures – 0.0% ((0.1)%)FTSE 100 Index Futures Sep 2010 117 57 –
Investment assets 252,100 97.2
Net other assets 7,258 2.8
Net assets 259,358 100.0
Unless otherwise stated the above securities are admitted to official stock exchange listings or trade on aregulated market.
The comparative percentage figures in brackets are at 31 January 2010.

130
ContinuationReturn to Index�
�
£’000
Total of all purchases for the period 102,956
Major purchases Cost
BHP Billiton 5,478HSBC 5,285Mondi 5,150Lloyds Banking Group 4,829British American Tobacco 4,190Smiths Group 4,025Stagecoach Group 3,807Intercontinental Hotels Group 3,783Barclays 3,761Eurasian Natural Resources 3,698Next 3,069Weir Group 2,780Investec 2,778Unilever 2,481Anglo American 2,423Amlin 2,140Kazakhmys 1,903Electrocomponents 1,883Legal & General Group 1,861BP 1,753
£’000
Total of all sales for the period 118,978
Major sales Proceeds
HSBC 9,967Barclays 6,195Xstrata 5,394Kazakhmys 5,331Lloyds Banking Group 4,132Aviva 3,822AstraZeneca 3,486SABMiller 3,232Old Mutual 3,189Rolls Royce Group 3,163Petrofac 3,156Rio Tinto 3,047Antofagasta 2,877BP 2,822Charter International 2,594Prudential 2,356BT Group 2,301Travis Perkins 2,283Micro Focus International 2,161Next 1,968
Portfolio movements For the six months ended 31 July 2010

131
Return to Index�
Financial statementsFinancial statements
Statement of total return(Unaudited)
For the six months ended 31 July2010 2009
£’000 £’000 £’000 £’000
Income
Net capital gains 11,306 23,239
Revenue 5,299 6,310
Expenses (2,248) (1,946)
Net revenue before taxation 3,051 4,364
Taxation (3) (58)
Net revenue after taxation 3,048 4,306
Total return before distributions 14,354 27,545
Finance costs: Distributions (154) (86)
Change in net assets attributable to shareholders from investment activities 14,200 27,459
Statement of change in net assets attributable to shareholders(Unaudited)
For the six months ended 31 July2010 2009
£’000 £’000 £’000 £’000
Opening net assets attributable to shareholders 265,191 235,597
Amounts receivable on issue of shares 2,687 2,764
Amounts payable on cancellation of shares (22,702) (11,266)
(20,015) (8,502)
Change in net assets attributable to shareholders from investment activities (see above) 14,200 27,459
Stamp duty reserve tax (18) (23)
Closing net assets attributable to shareholders 259,358 254,531
As the comparatives in the above table are for the previous interim period, the Net assets at the end ofthat period will not agree to the Net assets at the start of the current period.
Balance sheet(Unaudited)
As at31 July 2010 31 January 2010
£’000 £’000 £’000 £’000
ASSETS
Investment assets 252,100 257,189
Debtors 1,069 369
Cash and bank balances 7,099 9,458
Total other assets 8,168 9,827
Total assets 260,268 267,016
LIABILITIES
Investment liabilities – (169)
Creditors (910) (1,634)
Distribution payable on income shares – (22)
Total other liabilities (910) (1,656)
Total liabilities (910) (1,825)
Net assets attributable to shareholders 259,358 265,191

132
ContinuationReturn to Index�
�
JPM Premier Equity Income Fund
Investment objective and policyTo provide income and prospects of capital growth by investing primarily inequity and equity-linked securities of UK companies. Other instruments aspermitted in the stated investment and borrowing powers of the Companyincluding, but not limited to, fixed interest securities, cash and cash equivalentsmay be held on an ancillary basis, as appropriate.
Risk profileThis equity based Fund is designed for investors looking for income from abroad market exposure (which may include smaller companies) predominantlyto a single developed stock market.
Equity investment is subject to specific risks relating to the performance ofthe individual companies held and the market’s perception of theirperformance. Equities are also subject to systematic risks such as generaleconomic conditions, inflation, interest rates, foreign exchange rates andindustry sector risks. In general terms, equities tend to be more volatile thanbonds.
Funds that invest predominantly in a single market, asset class or sectormay be subject to greater volatility than those funds with a more diversifiedportfolio.
This Fund charges the fees of the ACD against capital, which will increasethe amount of income available for distribution to Shareholders, but mayconstrain capital growth. It may also have tax implications for certain investors.
Fund review• The six months under review began strongly for UK equities, helped by
positive economic data. However, eurozone sovereign debt concernsand growing uncertainty about the strength of the recovery contributedto volatility as the period progressed.
• Against this backdrop, the Fund produced positive returns andoutperformed its benchmark. Positive contributors to relative returnsincluded stock selection and overweight positions in the general industrialsand industrial engineering sectors. Stock selection in the oil & gas producerssector detracted, as did stock selection and an underweight position inthe banks sector.
• At the stock level, the Fund benefited most from an overweight positionin Tomkins, the engineering group, which agreed to be acquired by Canadianprivate equity firm Onex Corp. and the Canadian Pension Plan InvestmentBoard for GBP 2.89 billion. An overweight position in Weir Group wasalso positive after the provider of engineering solutions to the miningindustry said it expects second-half profit to be significantly ahead oflast year.
• The biggest stock-level detractor was an overweight position in BP, whichwas attractively valued, but which fell heavily following an explosion onone of its oil platforms in the Gulf of Mexico. Also detrimental was anunderweight position in Royal Bank of Scotland Group, which rose sharplyafter brokers said it may return to profit this year.
• However, the Fund was boosted by an overweight position in drugmakerAstraZeneca, which raised its earnings forecast and doubled a sharebuyback plan after a US court upheld a patent on its Crestor cholesterolmedication through to 2016.
You should remember that past performance is not a guide to the future. The price of investments and the income from them may fall as well as rise andinvestors may not get back the full amount invested. For specific risks, please read the Simplified Prospectus.All performance returns are calculated using the quoted price of the accumulation shares. Performance returns are in Sterling.FX Adjusted returns have been calculated by JPMAM. Blended benchmarks have been calculated by JPMAM.Source: J.P. Morgan.Source: FTSE International Limited (“FTSE”) © FTSE [2010]. “FTSE®” is a trade mark of London Stock Exchange Plc and The Financial Times Limited and is used by FTSE International Limited under licence. All rights inthe FTSE indices and/or FTSE ratings vest in FTSE and/or its licensors. Neither FTSE nor its licensors accept any liability for any errors or omissions in the FTSE indices and/or FTSE ratings or underlying data. No furtherdistribution of FTSE Data is permitted without FTSE’s express written consent.
Fund outlook• Volatility may persist in the short-term given the ongoing uncertainty
over the global economic outlook. However, UK equities are supportedby low interest rates, while valuations are attractive both compared tohistory and compared to bonds.
Rolling 12 month performance as at 31 July2010/2009 2009/2008 2008/2007 2007/2006 2006/2005
JPM Premier Equity IncomeA-Class Acc 17.4% -13.4% -17.3% 7.5% 13.9%
Benchmark Index 19.4% -10.5% -13.3% 13.0% 17.3%
Six month performance31/01/10–31/07/10
JPM Premier Equity Income A-Class Acc 5.3%
Benchmark Index 4.0%
Fund statisticsFund size £283.1m
Benchmark Index FTSE All-Share (Total Return Net)
Fund charges Initial 4.25%, Annual 1.50%
Top ten holdings %Royal Dutch Shell ‘B’ 8.5Vodafone Group 6.4HSBC 6.1BP 5.4AstraZeneca 4.8British American Tobacco 4.2BHP Billiton 4.2GlaxoSmithKline 4.1Rio Tinto 3.5Barclays 2.6

133
ContinuationReturn to Index�
�
Sector breakdown %Financials 21.1Oil & gas 15.2Basic materials 14.4Industrials 10.6Consumer goods 10.5Consumer services 9.5Health care 8.9Telecommunications 7.4Utilities 1.1Technology 1.1Net other assets 0.2
Highest/lowest share price and distribution recordDistribution
Highest Lowest per shareCalendar year share price share price (net)
A-Class Accumulation Shares
2005 594.8p 493.3p 20.90p
2006 679.4p 580.4p 20.76p
2007 717.1p 613.6p 22.05p
2008 647.9p 377.8p 24.58p
2009 559.2p 356.7p 23.45p
2010A 610.5p 512.9p 18.88p
A-Class Income Shares
2005 513.1p 437.0p 18.56p
2006 566.4p 492.5p 17.70p
2007 598.8p 494.7p 18.19p
2008 522.3p 291.4p 19.64p
2009 409.1p 268.1p 17.91p
2010A 440.2p 369.9p 13.64p
A To 31 July 2010.
Portfolio turnover rate31.07.09 62.67%
31.07.10 55.54%
The portfolio turnover rate (PTR) reflects the total of security purchases and sales, less the total of shareissues and cancellations, expressed as a percentage of the average daily net asset values over the period.
Net asset values and Total expense ratiosNet assetvalue per Net asset Total
share class Number value per expenseDate £’000 of shares share ratio
A-Class Accumulation Shares
31.01.08 198,559 34,775,264 571.0p 1.65%
31.01.09 134,174 32,055,306 418.6p 1.67%
31.01.10 158,205 29,514,376 536.0p 1.67%
31.07.10 159,585 28,278,271 564.3p 1.68%
A-Class Income Shares
31.01.08 168,882 37,345,936 452.2p 1.65%
31.01.09 108,841 34,628,874 314.3p 1.67%
31.01.10 125,124 32,370,904 386.5p 1.67%
31.07.10 123,518 30,955,645 399.0p 1.68%
The Net asset value and the Net asset value per income share are shown ex-dividend.
The total expense ratio (TER) takes into account the ACD fee and any fixed expenses charged to revenue overthe financial period, expressed as a percentage of the average daily net asset values over the same period.

134
ContinuationReturn to Index�
�
Portfolio statementAs at 31 July 2010
Market value Total netInvestment Holding £’000 assets %
Financials – 21.1% (21.0%)Banks – 12.1%Barclays 2,197,421 7,322 2.6 HSBC 2,639,606 17,345 6.1 Lloyds Banking Group 6,106,819 4,267 1.5 Royal Bank of Scotland Group 1,659,961 830 0.3 Standard Chartered 244,427 4,567 1.6 Financial services – 0.2%H&T GroupB 19,981 47 – IG Group 94,726 449 0.2 General financial – 2.8%Brewin Dolphin 27,746 34 – City of London Investment GroupB 24,454 68 – GlobeOp Financial Services 53,458 144 0.1 Hargreaves Lansdown 278,439 1,008 0.4 International Personal Finance 107,019 255 0.1 Investec 848,377 4,219 1.5 Tullett Prebon 529,826 1,852 0.7 Life insurance – 2.5%Aviva 443,393 1,608 0.6 Chesnara 88,361 184 0.1 Legal & General Group 4,776,559 4,349 1.5 Old Mutual 787,526 964 0.3 Nonlife insurance – 2.8%Admiral Group 111,464 1,628 0.6 Amlin 714,576 3,049 1.1 Beazley Group 998,924 1,193 0.4 Catlin Group 361,104 1,386 0.5 Hardy Underwriting Bermuda 31,753 70 – Lancashire Holdings 110,482 593 0.2 Real estate – 0.7%CLS 27,949 125 – ING UK Real Estate Income Trust 261,500 125 – LSL Property Services 81,528 210 0.1 Minerva 170,513 174 0.1 Quintain Estates & Development 489,958 200 0.1 Safestore 22,306 27 – Shaftesbury 260,317 1,051 0.4 Unite Group 18,688 36 –
Oil & gas – 15.2% (20.1%)Oil & gas producers – 15.2%Aurelian Oil & Gas 138,650 53 – BG Group 328,610 3,334 1.2 Bowleven 53,200 83 – BP 3,780,553 15,349 5.4 Cove Energy 375,658 248 0.1 Gulfsands Petroleum 13,500 39 – Nautical Petroleum 68,000 90 – Nighthawk Energy 127,109 33 – Royal Dutch Shell ‘B’ 1,406,231 23,962 8.5 Salamander Energy 33,480 83 – Valiant PetroleumB 16,656 114 – Oil equipment, services & distribution – 0.0%Kentz Group 39,191 95 –
Basic materials – 14.4% (13.5%)Chemicals – 0.3%Elementis 481,018 358 0.1 Victrex 31,205 379 0.1 Yule Catto & Co 149,038 309 0.1 Forestry & paper – 1.5%Mondi 926,820 4,191 1.5 Mining – 12.6%Anglo American 242,188 6,169 2.2 Anglo Pacific Group 91,350 233 0.1 Avocet MiningB 28,600 34 – BHP Billiton 609,765 11,924 4.2 Eurasian Natural Resources 345,156 3,115 1.1 Kazakhmys 59,878 732 0.3 Ferrexpo 883,860 2,480 0.9 International Ferro Metals 340,000 99 – Rio Tinto 296,024 9,827 3.5 Xstrata 74,741 766 0.3
Market value Total netInvestment Holding £’000 assets %
Industrials – 10.6% (8.5%)Aerospace & defence – 0.6%Aero Inventory* 15,630 – – Chemring Group 1,155 34 – Hampson Industries 245,063 146 0.1 Rolls Royce Group 257,515 1,506 0.5 Construction & materials – 0.0%Costain 42,044 79 – Electronics & electrical equipment – 0.1%Dialight 26,831 91 – Oxford Instruments 44,381 140 0.1 Renishaw 4,400 37 – TT electronics 75,170 79 – Volex Group 53,700 111 – General industrials – 2.4%RPC Group 87,890 234 0.1 Smith (DS) 978,662 1,411 0.5 Smiths Group 87,775 982 0.3 Tomkins 1,278,042 4,145 1.5 Industrial engineering – 3.2%Charter International 71,012 510 0.2 Fenner 103,159 230 0.1 Hill & Smith 69,254 203 0.1 IMI 496,728 3,539 1.3 Senior 1,080,189 1,392 0.5 Weir Group 235,990 2,763 1.0 Industrial transportation – 0.0%Braemar Shipping Services 23,416 114 – Clarkson 12,000 103 – Goldenport 48,510 60 – Support services – 4.3%Aggreko 74,991 1,147 0.4 Atkins (WS) 158,507 1,156 0.4 Brammer 123,340 191 0.1 BSS Group 96,877 435 0.2 CapeB 64,834 170 0.1 CPP 264,444 637 0.2 Davis Service Group 347,898 1,306 0.5 Diploma 110,702 278 0.1 eaga 456,669 487 0.2 Education Development International 32,602 31 – Electrocomponents 1,054,767 2,370 0.8 Fiberweb 143,472 86 – Filtrona 538,217 1,292 0.5 Galiform 188,904 136 – Hargreaves ServicesB 9,044 56 – Harvey Nash Group 116,010 48 – Healthcare LocumsB 95,876 155 0.1 Hyder Consulting 85,412 290 0.1 Interserve 87,400 173 0.1 John Menzies 50,900 201 0.1 Robert Walters 65,799 148 0.1 SThree 192,122 500 0.2 Tribal Group 83,099 52 – WSP Group 54,527 182 0.1
Consumer goods – 10.5% (9.5%)Automobiles & parts – 0.3%GKN 604,900 817 0.3 Beverages – 1.3%Britvic 527,190 2,545 0.9 SABMiller 52,795 1,018 0.4 Food producers – 3.3%Cranswick 74,660 653 0.2 Dairy Crest Group 331,280 1,283 0.5 Devro 136,536 284 0.1 Hilton Food Group 87,981 221 0.1 MP Evans GroupB 10,819 39 – PureCircleB 15,700 28 – Robert Wiseman Dairies 56,708 284 0.1 Unilever 361,846 6,589 2.3 Household goods – 1.1%Barratt Developments 908,831 875 0.3 Bellway 101,340 585 0.2 Reckitt Benckiser Group 56,852 1,780 0.6

135
ContinuationReturn to Index�
�
Market value Total netInvestment Holding £’000 assets %
Portfolio statement – continuedAs at 31 July 2010
Personal goods – 0.3%Supergroup 90,178 866 0.3 Tobacco – 4.2%British American Tobacco 542,206 12,007 4.2
Consumer services – 9.5% (8.5%)Food & drug retailers – 1.0%Sainsbury (J) 343,900 1,186 0.4 Tesco 463,067 1,826 0.6 General retailers – 3.5%Brown (N.) Group 117,912 268 0.1 Dunelm Group 163,426 634 0.2 Halfords Group 509,444 2,463 0.9 JD Sports Fashion 70,694 539 0.2 JJB Sports 560,662 66 – Lookers 236,165 128 – Next 275,090 5,939 2.1 Pendragon 517,790 124 – Media – 1.6%Chime Communications 80,003 136 – Creston 45,282 42 – Daily Mail & General Trust ‘A’ Non-Voting 371,832 1,825 0.6 Entertainment One 53,800 41 – Euromoney Institutional Investor 54,820 327 0.1 ITE Group 83,443 124 – ITV 1,568,553 825 0.3 Trinity Mirror 182,990 197 0.1 WPP 213,636 1,450 0.5 Travel & leisure – 3.4%Avis Europe 346,849 73 – Cineworld Group 12,416 24 – Compass Group 577,435 3,092 1.1 Domino’s Pizza 14,760 61 – Goals Soccer CentresB 19,177 24 – Intercontinental Hotels Group 110,054 1,223 0.4 Mitchells & Butlers 181,774 568 0.2 Rank Group 370,096 435 0.2 Restaurant Group 214,045 484 0.2 Stagecoach Group 1,847,290 3,155 1.1 The Hotel CorporationB 34,375 34 – Whitbread 37,198 530 0.2
Health care – 8.9% (9.4%)Health care equipment & services – 0.0%CaretechB 16,650 49 – Immunodiagnostic Systems 6,144 45 – Optos 25,281 25 – Southern Cross Healthcare Group 172,248 55 – Pharmaceuticals & biotechnology – 8.9%Abcam 6,056 92 – AstraZeneca 413,556 13,455 4.8 GlaxoSmithKline 1,045,073 11,684 4.1 ProStrakan Group 142,431 105 –
Telecommunications – 7.4% (5.8%)Fixed line telecommunications – 1.0%Alternative NetworksB 40,240 63 – BT Group 1,778,078 2,543 0.9 KCOM Group 461,112 217 0.1 Mobile telecommunications – 6.4%Vodafone Group 12,015,210 17,993 6.4
Utilities – 1.1% (1.1%)Electricity – 0.3%Drax Group 230,246 891 0.3 OPG Power VentureB 83,783 65 – Gas, water & multiutilities – 0.8%Centrica 553,537 1,709 0.6 National Grid 82,636 431 0.2
Market value Total netInvestment Holding £’000 assets %
Technology – 1.1% (2.2%)Software & computer services – 1.0%Advanced Computer Software 107,166 35 – Alterian 65,200 102 – Anite 23,264 10 – Aveva Group 11,136 148 0.1 Computacenter 465,484 1,281 0.5 Intec Telecom Systems 258,034 187 0.1 Kofax 80,526 194 0.1 Micro Focus International 38,966 162 0.1 NCC Group 33,153 144 0.1 Technology, hardware & equipment – 0.1%CSR 17,100 59 – Pace 42,719 90 – Promethean World 53,784 72 – Wolfson Microelectronics 90,624 157 0.1
Investment assets 282,694 99.8
Net other assets 409 0.2
Net assets 283,103 100.0
Unless otherwise stated the above securities are admitted to official stock exchange listings or trade on aregulated market.
The comparative percentage figures in brackets are at 31 January 2010.B Quoted on Alternative Investment Market* Delisted security

136
ContinuationReturn to Index�
�
£’000
Total of all purchases for the period 81,667
Major purchases Cost
British American Tobacco 7,625BHP Billiton 3,996Compass Group 3,785Legal & General Group 3,670Investec 2,972Rio Tinto 2,791Mondi 2,544Tomkins 2,425Electrocomponents 2,374Vodafone Group 2,372Stagecoach Group 1,764Centrica 1,656Royal Dutch Shell ‘B’ 1,566Lloyds Banking Group 1,350Catlin Group 1,313Ferrexpo 1,306Amlin 1,269IMI 1,261Sainsbury (J) 1,203Anglo American 1,101
£’000
Total of all sales for the period 92,442
Major sales Proceeds
BP 3,573Antofagasta 3,452Petrofac 3,379Xstrata 3,329Reckitt Benckiser Group 3,202HSBC 2,514Kazakhmys 2,188Prudential 2,166Charter International 2,142Micro Focus International 2,089Aviva 1,896Anglo American 1,849Provident Financial 1,836Michael Page International 1,758Pearson 1,689British American Tobacco 1,608Admiral Group 1,575Lancashire Holdings 1,565Ladbrokes 1,507William Hill 1,480
Portfolio movements For the six months ended 31 July 2010

137
Return to Index�
Financial statements
Statement of total return(Unaudited)
For the six months ended 31 July2010 2009
£’000 £’000 £’000 £’000
Income
Net capital gains 11,368 29,395
Revenue 6,050 7,389
Expenses (2,439) (2,046)
Net revenue before taxation 3,611 5,343
Taxation (7) (17)
Net revenue after taxation 3,604 5,326
Total return before distributions 14,972 34,721
Finance costs: Distributions (5,782) (7,017)
Change in net assets attributable to shareholders from investment activities 9,190 27,704
Statement of change in net assets attributable to shareholders(Unaudited)
For the six months ended 31 July2010 2009
£’000 £’000 £’000 £’000
Opening net assets attributable to shareholders 283,329 243,015
Amounts receivable on issue of shares 47 133
Amounts payable on cancellation of shares (12,637) (9,721)
(12,590) (9,588)
Change in net assets attributable to shareholders from investment activities (see above) 9,190 27,704
Retained distributions on accumulation shares 3,144 3,769
Stamp duty reserve tax (7) (4)
Unclaimed distributions 37 37
Closing net assets attributable to shareholders 283,103 264,933
As the comparatives in the above table are for the previous interim period, the Net assets at the end ofthat period will not agree to the Net assets at the start of the current period.
Balance sheet(Unaudited)
As at31 July 2010 31 January 2010
£’000 £’000 £’000 £’000
ASSETS
Investment assets 282,694 282,104
Debtors 1,667 2,808
Cash and bank balances 2,119 3,908
Total other assets 3,786 6,716
Total assets 286,480 288,820
LIABILITIES
Investment liabilities – (3)
Creditors (898) (3,666)
Distribution payable on income shares (2,479) (1,822)
Total other liabilities (3,377) (5,488)
Total liabilities (3,377) (5,491)
Net assets attributable to shareholders 283,103 283,329

138
ContinuationReturn to Index�
�
JPM Sterling Corporate Bond Fund
Investment objective and policyThe Fund’s investment objective is to maximise total returns by investingprimarily in high quality sterling denominated bonds (or other bonds hedgedback to sterling).
The Fund’s investment policy will focus on investment grade corporate issues.The Fund may also invest in non-investment grade securities, includingcorporate and emerging market bonds when the investment adviser believesthese offer significant opportunities. The Fund may use derivatives forinvestment purposes or Efficient Portfolio Management including hedging,where appropriate. Although most of the non-sterling securities will behedged back to sterling, the investment adviser will also use opportunitiesin the foreign exchange market to maximise returns.
Risk profileBond funds may not behave like direct investments in the underlying bondsthemselves. By investing in bond funds, the certainty of receiving a regularfixed amount of income for a defined period of time with the prospect of afuture known return of capital is lost.
Bond prices can fluctuate significantly depending not only on the globaleconomic and interest rate conditions but also on the general credit marketenvironment and the creditworthiness of the issuer.
Bonds with a lower credit rating may have a higher risk of defaulting whichmay in turn have an adverse effect on the performance of funds which investin them.
The investment policy of the Fund permits the use of derivatives and/orforward transactions for investment purposes. As a result the Fund maysometimes be leveraged, potentially increasing the volatility and thereforerisk of the Fund.
Bond funds will normally distribute a combination of coupon and the expecteddiscount/premium on the securities. Therefore, a fund’s distribution willcomprise income received and an element of projected capital gains orlosses. This could result in an element of capital gain being taxed as incomein the hands of an investor.
Fund review• In the US, corporate fundamentals continued to improve and business
sentiment was upbeat. In Europe, sentiment improved following the newsthat the results of the stress tests of around 100 European banks wouldbe made public by mid-July. However, towards the end of the secondquarter, the decline in global equities, driven by concerns around weakerglobal growth, put upward pressure on credit spreads.
• The Fund underperformed the index over the period. General concernsabout the sovereign debt crisis and the economic recovery have causedthe sector to underperform versus similar duration Treasury securitiesover the year to date. Performance was weak across all subsectors –financial, industrial and utilities. Our allocation to high-yield detractedas market volatility surged and risk appetite waned. We believe thatvaluations are attractive based on strong credit fundamentals and lowdefault risk, even with low GDP growth. We reduced our spread marketexposure to the US and reduced the underweight to the UK. Withininvestment grade corporates we retain an overweight to communicationsand basic industry.
You should remember that past performance is not a guide to the future. The price of investments and the income from them may fall as well as rise andinvestors may not get back the full amount invested. For specific risks, please read the Simplified Prospectus.Formerly JPM UK Bond Fund, the Fund name was changed on 01/09/07.All performance returns are calculated using the quoted price of the accumulation shares. Performance returns are in Sterling.FX Adjusted returns have been calculated by JPMAM. Blended benchmarks have been calculated by JPMAM.Source: J.P. Morgan.
Fund outlook• The projected low growth and low rates environment remains supportive
for corporate credit quality. The upgrade-to-downgrade ratio globallycontinues to improve, as does the speculative grade default rate, whichfell to 7.9% in May. Whilst sovereign volatility has the potential to upsetthe situation, the strong state of investment grade corporate balancesheets should provide a buffer to volatility. We continue to see more valuein the US Dollar market versus the European.
Rolling 12 month performance as at 31 July2010/2009 2009/2008 2008/2007 2007/2006 2006/2005
JPM Sterling Corporate BondA-Class Acc 11.8% -4.4% -8.9% -2.6% 0.6%
JPM Sterling Corporate BondI-Class Acc 13.0% -3.9% -8.4% -2.1% 1.2%
Benchmark Index 15.1% 2.1% 1.1% -0.3% 3.1%
Six month performance31/01/10–31/07/10
JPM Sterling Corporate Bond A-Class Acc 2.8%
Benchmark Index 4.1%
Fund statisticsFund size £55.4m
Benchmark Index Barclays Capital UK Non-Gilt Index
Fund chargesA-Class Initial 3.50%, Annual 1.00% I-Class Initial Nil, Annual 0.40%
Top ten holdings %GE Capital UK Funding 6.25% 2038 2.5Barclays Bank 10% 2021 2.1HSBC 6% 2040 2.0Royal Bank of Scotland 7.5% 2024 1.9Citigroup 5.5% 2015 1.9Morgan Stanley 5.375% 2013 1.8Standard Chartered Bank 7.75% 2018 1.8Bank of America 6.125% 2021 1.7Santander Issuances 7.3% 2019 1.6National Grid Electricity Transmission 7.375% 2031 1.6

139
ContinuationReturn to Index�
�
Sector breakdown %Corporate debt 96.2Government stock 1.3Liquidity 0.5Forward currency contracts 1.0Futures (0.3)Net other assets 1.3
Highest/lowest share price and distribution recordDistribution
Highest Lowest per shareCalendar year share price share price (net)
A-Class Accumulation Shares
2005 65.99p 61.01p 2.30p
2006 67.16p 63.68p 2.32p
2007 65.69p 61.69p 2.35p
2008 63.32p 51.25p 2.37p
2009 59.04p 49.70p 2.04p
2010A 61.05p 58.11p 1.70p
A-Class Income Shares
2005 56.64p 53.77p 2.01p
2006 57.65p 53.40p 1.96p
2007 53.97p 49.43p 1.93p
2008 50.52p 39.21p 1.86p
2009 43.58p 37.63p 1.54p
2010A 44.10p 42.37p 1.24p
I-Class Accumulation Shares
2005 113.7p 104.6p 4.61p
2006 115.8p 110.1p 4.71p
2007 114.0p 107.4p 4.70p
2008 110.5p 89.88p 4.79p
2009 104.2p 87.36p 4.15p
2010A 108.1p 102.7p 3.51p
I-Class Income Shares
2005 107.8p 102.4p 4.48p
2006 109.8p 101.6p 4.38p
2007 102.7p 94.05p 4.23p
2008 96.16p 74.54p 4.09p
2009 82.94p 71.57p 3.37p
2010A 83.97p 80.58p 2.80p
A To 31 July 2010.
Portfolio turnover rate31.07.09 198.93%
31.07.10 106.69%
The portfolio turnover rate (PTR) reflects the total of security purchases and sales, less the total of shareissues and cancellations, expressed as a percentage of the average daily net asset values over the period.
Net asset values and Total expense ratiosNet assetvalue per Net asset Total
share class Number value per expenseDate £’000 of shares share ratio
A-Class Accumulation Shares
31.01.08 33,935 55,292,553 61.37p 1.16%
31.01.09 24,322 48,403,064 50.25p 1.18%
31.01.10 26,254 44,426,721 59.10p 1.18%
31.07.10 26,092 42,908,490 60.81p 1.18%
A-Class Income Shares
31.01.08 41,657 85,912,852 48.49p 1.17%
31.01.09 29,021 76,329,701 38.02p 1.18%
31.01.10 30,227 70,141,256 43.09p 1.18%
31.07.10 29,301 67,326,180 43.52p 1.18%
I-Class Accumulation Shares
31.01.08 5 5,000 107.1p 0.40%
31.01.09 5 6,000 88.24p 0.40%
31.01.10 5 5,000 104.4p 0.40%
31.07.10 5 5,000 107.7p 0.40%
I-Class Income Shares
31.01.08 6 6,000 92.18p 0.40%
31.01.09 5 7,000 72.25p 0.40%
31.01.10 6 7,000 81.92p 0.40%
31.07.10 6 7,000 82.74p 0.40%
The Net asset value and the Net asset value per income share are shown ex-dividend.
The total expense ratio (TER) takes into account the ACD fee and any fixed expenses charged to revenue overthe financial period, expressed as a percentage of the average daily net asset values over the same period.

140
ContinuationReturn to Index�
�
Market value Total netInvestment Holding £’000 assets %
Portfolio statementAs at 31 July 2010
Corporate debt – 96.2% (96.6%)3i Group 6.875% 2023 £260,000 265 0.5Aegon 6.625% 2039 £450,000 439 0.8Ahold Finance USA 6.5% 2017 £275,000 308 0.6Altria Group 9.25% 2019 $480,000 398 0.7America Movil 5.75% 2030 £155,000 156 0.3America Movil 6.125% 2040 $330,000 226 0.4American Express Credit 5.375% 2014 £450,000 473 0.8Amkor Technology 9.25% 2016 $250,000 172 0.3Anglo American Capital 6.875% 2018 £440,000 490 0.9Anheuser-Busch InBev 9.75% 2024 £440,000 629 1.1Annington Finance No.4 0% 2023 £1,000,000 471 0.8AT&T 7% 2040 £450,000 540 1.0Autostrade 6.25% 2022 £105,000 112 0.2Aviva 5.9021% 2020 £200,000 156 0.3Aviva FRN 2058 £475,000 471 0.8AXA 7.125% 2020 £440,000 478 0.9B.A.T. International Finance 6% 2022 £450,000 483 0.9B.A.T. International Finance 6% 2034 £225,000 233 0.4BAA Funding Limited 6.75% 2028 £425,000 426 0.8Bank of America 5.5% 2019 £250,000 253 0.5Bank of America 6.125% 2021 £900,000 934 1.7Barclays Bank 5.75% 2021 £475,000 502 0.9Barclays Bank 10% 2021 £902,000 1,154 2.1BBVA International Preferred Unipersonal
FRN 2007 £500,000 479 0.9Biomet 10.375% 2017 $500,000 354 0.6British Telecommunications 7.5% FRN 2016 £635,000 761 1.4British Telecommunications Call 6.375% 2037 £275,000 263 0.5Cadbury Schweppes Finance 7.25% 2018 £150,000 177 0.3Capital One Bank 8.8% 2019 $400,000 326 0.6Carlsberg FRN 2016 £230,000 267 0.5Chesapeake Energy 6.5% 2017 $500,000 327 0.6Citigroup 5.5% 2015 £1,000,000 1,038 1.9Citigroup 6.8% 2038 £530,000 542 1.0Commerzbank Capital Funding
5.905% FRN Perpetual £400,000 244 0.4Compagnie de Saint-Gobain 5.625% 2024 £150,000 146 0.3Constellation Brands 7.25% 2016 $450,000 300 0.5Corrections Corporation of America
7.75% 2017 $450,000 306 0.5Credit Agricole 7.375% 2023 £350,000 385 0.7Credit Agricole 8.125% Perpetual £300,000 294 0.5Credit Suisse London 6.75% FRN 2023 £600,000 647 1.2CRH Finance 8.25% 2015 £375,000 433 0.8Delta Air Lines 7.75% 2019 $398,362 278 0.5Discover Bank 8.7% 2019 $750,000 555 1.0E.ON International Finance 6.75% 2039 £650,000 786 1.4EchoStar DBS 7.125% 2016 $500,000 330 0.6EDP 8.625% 2024 £200,000 249 0.4Enel Finance International 5.75% 2040 £655,000 631 1.1Enterprise Products 7.55% 2038 $160,000 124 0.2Fiat 7.625% 2014 u150,000 133 0.2France Telecom 7.25% 2020 £375,000 454 0.8GDF Suez 7% 2028 £400,000 485 0.9GE Capital UK Funding 6.25% 2038 £1,330,000 1,388 2.5Georgia Pacific 7% 2015 $500,000 333 0.6Goldman Sachs Group 5.25% 2015 £625,000 645 1.2Goldman Sachs Group 5.5% 2021 £325,000 296 0.5Hammerson 6% 2026 £450,000 445 0.8HCA 9.625% 2016 $450,000 312 0.6Health Management Associates
6.125% 2016 $500,000 315 0.6Heidelbergcement 8% 2017 u375,000 319 0.6Holcim GB Finance 8.75% 2017 £360,000 440 0.8Host Marriott ‘Q’ 6.75% 2016 $450,000 293 0.5HSBC 6.5% FRN 2023 £350,000 370 0.7HSBC 6.5% 2024 £260,000 290 0.5HSBC 6% 2040 £1,100,000 1,099 2.0Hutchison Whampoa Finance UK
5.625% 2026 £250,000 258 0.5Imperial Tobacco Finance 9% 2022 £310,000 400 0.7Imperial Tobacco Finance 8.125% 2024 £500,000 611 1.1Intelsat Jackson ‘H’ 9.5% FRN 2016 $450,000 309 0.6Intesa Sanpaolo 5.25% 2022 £250,000 248 0.4
Market value Total netInvestment Holding £’000 assets %
Jarden 7.5% 2017 $450,000 296 0.5JC Penney 5.65% 2020 $330,000 212 0.4KPN 5.75% 2029 £275,000 280 0.5Kraft Foods 7% 2037 $215,000 166 0.3L-3 Communications 5.875% 2015 $500,000 326 0.6Land Securities Capital Markets
5.391% 2026 £525,000 527 0.9Legal & General Finance 5.875% 2033 £192,000 184 0.3Linde Finance 5.875% 2023 £140,000 153 0.3Lloyds Banking Group 7.5% 2024 £440,000 491 0.9Lloyds Banking Group 7.625% 2025 £425,000 432 0.8Macy’s Retail 7.875% 2015 $500,000 359 0.6Marks & Spencer 6.125% 2019 £370,000 384 0.7MBNA Master Credit Card Trust ‘B4’
5.45% 2016 £440,000 441 0.8Morgan Stanley 5.375% 2013 £980,000 1,018 1.8Munich Re Finance 7.625% 2028 £445,000 504 0.9National Australia Bank 5.125% 2021 £280,000 292 0.5National Capital Trust
5.62% FRN Perpetual £147,000 127 0.2National Grid Electricity Transmission
7.375% 2031 £700,000 864 1.6Nationwide Building Society
5.769% Perpetual £700,000 488 0.9Nomura Europe Finance 5.5% 2017 £500,000 518 0.9Northern Rock FRN Perpetual £200,000 100 0.2NRG Energy 7.375% 2016 $450,000 295 0.5Old Mutual 6.376% FRN Perpetual £300,000 222 0.4Pernod Ricard 7% 2015 u200,000 183 0.3Pfizer 6.5% 2038 £300,000 356 0.6Prudential Financial 7.375% 2019 $335,000 251 0.4Prudential FRN 2039 £360,000 479 0.9Rabobank Capital Funding Trust IV
5.556% Perpetual £550,000 479 0.9RL Finance 6.125% Perpetual STEP £520,000 390 0.7Royal Bank of Scotland 7.5% 2024 £941,000 1,043 1.9RWE Finance 6.25% 2030 £100,000 112 0.2RWE Finance 6.125% 2039 £250,000 277 0.5Santander Issuances 7.3% 2019 £850,000 885 1.6Scottish & Southern Energy 6.25% 2038 £200,000 224 0.4Scottish Widows FRN Perpetual STEP £388,000 289 0.5Service Corporation International
6.75% 2015 $450,000 293 0.5Societe Generale 5.4% 2018 £500,000 502 0.9Southern Gas Network 4.875% 2029 £300,000 282 0.5Sprint Capital 6.9% 2019 $500,000 307 0.6Standard Chartered Bank 7.75% 2018 £850,000 974 1.8Suntrust Bank FRN 2012 £250,000 233 0.4SUPERVALU 8% 2016 $250,000 161 0.3Telecom Italia 6.375% 2019 £250,000 258 0.5Telecom Italia 5.875% FRN 2023 £150,000 144 0.3Telecom Italia Capital 7.721% 2038 $470,000 332 0.6Telefonica Emisiones 5.375% 2026 £685,000 672 1.2Tesco 6.125% 2022 £250,000 277 0.5Tesco 6% 2029 £340,000 368 0.7Tesco Property Finance
5.744% Bonds 2040 £450,000 457 0.8Thames Water Utilities Finance
5.125% 2037 £750,000 712 1.3Three Valleys Water Finance FRN 2026 £300,000 320 0.6UBS London 6.625% 2018 £450,000 503 0.9US Oncology 9.125% 2017 $200,000 136 0.2Vail Resorts 6.75% 2014 $225,000 145 0.3Verizon Wireless Capital 8.875% 2018 £550,000 720 1.3Vodafone Group 5.375% 2017 £350,000 371 0.7Wal-Mart Stores 5.25% 2035 £710,000 726 1.3Windstream 8.625% 2016 $300,000 201 0.4WPP Group 6% 2017 £450,000 482 0.9Xstrata Finance Canada 7.375% 2020 £370,000 413 0.7Yorkshire Water Services 6.375% 2039 £200,000 226 0.4
Government stock – 1.3% (1.2%)Mexico 6.75% 2024 £693,000 717 1.3

141
ContinuationReturn to Index�
�
Market value Total netInvestment Holding £’000 assets %
Portfolio statement – continuedAs at 31 July 2010
Liquidity – 0.5% (0.0%)JPM Sterling Liquidity ‘X’ (Income) 300,000 300 0.5
Forward currency contracts – 1.0% ((0.2)%)EuroForward foreign currency position
12/08/10 u1,085,000 905 1.6Forward foreign currency position
12/08/10 £(899,085) (899) (1.6)Forward foreign currency position
12/08/10 £418,063 418 0.8Forward foreign currency position
12/08/10 u(500,000) (417) (0.8)Forward foreign currency position
12/08/10 £1,529,264 1,529 2.8Forward foreign currency position
12/08/10 u(1,842,171) (1,538) (2.8)Forward foreign currency position
12/08/10 u495,000 413 0.7Forward foreign currency position
12/08/10 £(414,387) (414) (0.7)US DollarForward foreign currency position
12/08/10 £12,288,306 12,288 22.2Forward foreign currency position
12/08/10 $(18,107,207) (11,625) (21.0)Forward foreign currency position
12/08/10 $4,203,755 2,699 4.9Forward foreign currency position
12/08/10 £(2,818,276) (2,818) (5.1)
Futures – (0.3)% ((0.1)%)Euro BOBL Futures Sep 2010 (4) – –Long Gilt Future Sep 2010 15 18 –US 5 Year Note Futures Sep 2010 (62) (121) (0.2)US 10 Year Note Futures Sep 2010 (39) (71) (0.1)US Long Bond Futures Sep 2010 (11) (25) –
Investment assets 54,675 98.7
Net other assets 729 1.3
Net assets 55,404 100.0
Unless otherwise stated the above securities are admitted to official stock exchange listings or trade on aregulated market.
The comparative percentage figures in brackets are at 31 January 2010.
Market value Portfolio credit ratings £’000
AAA 282AA+ 1,388AA 1,901AA- 2,647A+ 2,676A 12,603A- 10,852BBB+ 5,417BBB 6,464BBB- 2,520BB+ 2,061BB 933BB- 2,316B+ 843B 432B- 354C 344
Total bonds 54,033
Liquidity 300Forward currency contracts 541Futures (199)
Investment assets 54,675

142
ContinuationReturn to Index�
�
£’000
Total of all purchases for the period 29,786
Major purchases Cost
JPM Sterling Liquidity ‘X’ (Income) 7,340GE Capital UK Funding 6.25% 2038 1,391HSBC Holdings 6% 2040 1,087Citigroup 5.5% 2015 1,013Morgan Stanley 5.375% 2013 928Santander Issuances FRN 2019 884Wal-Mart Stores 5.25% 2035 699Verizon Wireless Capital 8.875% 2018 695Goldman Sachs Group 5.25% 2015 669Credit Suisse London 6.75% FRN 2023 648France Telecom 7.25% 2020 614Lloyds Bank 7.625% 2025 546Land Securities Capital Markets 5.391% 2026 525Nomura Europe Finance 5.5% 2017 498Barclays Bank 5.75% 2021 488Anglo American Capital 6.875% 2018 476Telecom Italia 6.375% 2019 463Tesco Property Finance 5.744% Bonds 2040 450Hammerson 6% 2026 447Telefonica Emisiones 5.375% 2026 443
£’000
Total of all sales for the period 32,506
Major sales Proceeds
JPM Sterling Liquidity ‘X’ (Income) 7,040GE Capital Funding 5.625% 2038 1,340Bank of America 7.375% 2014 1,226Morgan Stanley 6% 2014 901Morgan Stanley 5.375% 2013 847Metropolitan Life Global Funding 5.125% 2014 759RCI Banque 8.125% 2012 720HSBC 7% 2038 675Barclays Bank 6.05% 2017 650HSBC 5.75% 2027 648Citigroup 6.125% FRN 2017 571HCP 6.0% 2017 565Lloyds TSB Bank 7.5% 2024 548Goldman Sachs Group 7.5% 2019 547American Tower 4.625% 2015 523Telecom Italia Capital 6.999% 2018 488WR Berkley 7.375% 2019 482GlaxoSmithKline Capital 5.25% 2033 436Anadarko Petroleum 5.75% 2014 427CBS 8.2% 2014 422
Portfolio movements For the six months ended 31 July 2010

143
Return to Index�
Financial statements
Statement of total return(Unaudited)
For the six months ended 31 July2010 2009
£’000 £’000 £’000 £’000
Income
Net capital gains 537 3,000
Revenue 1,651 1,556
Expenses (329) (315)
Net revenue before taxation 1,322 1,241
Taxation – –
Net revenue after taxation 1,322 1,241
Total return before distributions 1,859 4,241
Finance costs: Distributions (1,319) (1,245)
Change in net assets attributable to shareholders from investment activities 540 2,996
Statement of change in net assets attributable to shareholders(Unaudited)
For the six months ended 31 July2010 2009
£’000 £’000 £’000 £’000
Opening net assets attributable to shareholders 56,492 53,353
Amounts receivable on issue of shares 415 298
Amounts payable on cancellation of shares (2,530) (2,464)
(2,115) (2,166)
Change in net assets attributable to shareholders from investment activities (see above) 540 2,996
Retained distributions on accumulation shares 486 451
Unclaimed distributions 1 1
Closing net assets attributable to shareholders 55,404 54,635
As the comparatives in the above table are for the previous interim period, the Net assets at the end ofthat period will not agree to the Net assets at the start of the current period.
Balance sheet(Unaudited)
As at31 July 2010 31 January 2010
£’000 £’000 £’000 £’000
ASSETS
Investment assets 55,021 55,464
Debtors 1,896 1,356
Cash and bank balances 390 860
Total other assets 2,286 2,216
Total assets 57,307 57,680
LIABILITIES
Investment liabilities (346) (410)
Creditors (1,082) (483)
Bank overdraft (206) –
Distribution payable on income shares (269) (295)
Total other liabilities (1,557) (778)
Total liabilities (1,903) (1,188)
Net assets attributable to shareholders 55,404 56,492

144
ContinuationReturn to Index�
�
JPM Strategic Bond Fund
Investment objective and policyTo maximise returns by investing primarily in a global portfolio of fixed andfloating rate debt securities.
The Fund may invest in developed and emerging market countries and holdinvestment grade, non-investment grade and unrated bonds. The Fundmay have a concentrated portfolio and may have a significant exposure toany one country, sector or issuer, which may include emerging markets andnon-investment grade or unrated bonds, at any time. Allocations betweencountries, sectors and ratings of bonds may vary significantly at any time.The Fund may use derivatives for investment purposes or Efficient PortfolioManagement including hedging, where appropriate. The Fund is also permittedto invest up to 100% in government and public securities (see section 3.10(e)of the full Prospectus). The Fund’s assets will be primarily either denominatedin Sterling or hedged back to Sterling.
Risk profileBond funds may not behave like direct investments in the underlying bondsthemselves. By investing in bond funds, the certainty of receiving a regularfixed amount of income for a defined period of time with the prospect of afuture known return of capital is lost.
Bond prices can fluctuate significantly depending not only on the globaleconomic and interest rate conditions but also on the general credit marketenvironment and the creditworthiness of the issuer.
The credit quality of high yield bonds is below investment grade and theyusually offer higher yields to compensate for the reduced creditworthinessand the increased risk of default relative to investment grade bonds.
Bonds with a lower credit rating may have a higher risk of defaulting whichmay in turn have an adverse effect on the performance of funds which investin them.
The investment policy of the Fund permits the use of derivatives and/orforward transactions for investment purposes. As a result the Fund maysometimes be leveraged, potentially increasing the volatility and thereforerisk of the Fund.
The Fund may have a significant exposure to asset and mortgage backedsecurities (ABS and MBS). Owing to the nature of some ABS and MBS, theexact timing and size of cashflows paid by the securities may not be fullyassured.
Bond funds will normally distribute a combination of coupon and the expecteddiscount/premium on the securities. Therefore, a fund’s distribution willcomprise income received and an element of projected capital gains orlosses. This could result in an element of capital gain being taxed as incomein the hands of an investor.
Fund review• The sovereign debt concerns in the eurozone and weak economic data in
the US caused a massive flight to quality over the period, with Treasuryprices climbing and yields falling to extremely low levels. Libor increasedas funding pressures resumed as a result of sovereign debt concerns.Credit market volatility continued to the end of the period.
• The Fund underperformed the benchmark over the period. Allocation tohigh yield was positive at the beginning of the period, as spreads tightened,default activity was minimal and new issues volume continued to rise.However, over the second quarter, allocation to investment grade andhigh yield credit detracted from performance, as the sectors marginallyunderperformed government bonds due to peripheral European sovereignconcerns, which caused spreads to widen again. Allocation to local currencyemerging market debt via Mexico, Turkey, Korea, Indonesia, Brazil andIsrael was also detrimental as most of these currencies depreciated againstSterling.
Fund outlook• While we believe that a prolonged period of sub-trend growth is likely,
keeping central banks on hold, it appears that risk aversion flows arerunning out of momentum. We remain positive on emerging markets, andare confident that net capital flows into this sector will continue. Withininvestment grade credit, the projected low growth and low rate environmentremains supportive for corporate credit quality.
Rolling 12 month performance as at 31 July2010/2009
JPM Strategic BondA-Class Acc 11.3%
JPM Strategic BondC-Class Inc –
JPM Strategic Bond I-Class Gross Acc –
Benchmark Index 10.3%
Six month performance31/01/10–31/07/10
JPM Strategic Bond A-Class Acc 2.7%
Benchmark Index 4.8%
Fund statisticsFund size £80.8m
Benchmark Index Merrill Lynch GBP Broad Market Index
Fund chargesA-Class Initial 3.50%, Annual 1.00% C-Class Initial Nil, Annual 0.50%I-Class Initial Nil, Annual 0.40%
You should remember that past performance is not a guide to the future. The price of investments and the income from them may fall as well as rise andinvestors may not get back the full amount invested. For specific risks, please read the Simplified Prospectus.All performance returns are calculated using the quoted price of the accumulation or income shares. Performance returns are in Sterling.FX Adjusted returns have been calculated by JPMAM. Blended benchmarks have been calculated by JPMAM.Source: J.P. Morgan.

145
ContinuationReturn to Index�
�
Top ten holdings %FHLMC Gold 6% 30 Yrs Aug 2033 4.8JPM Sterling Liquidity ‘X’ (Income) 4.4FNMA 5% 2036 4.1Indonesia 11.5% 2019 2.7Turkey 10% 2015 2.0Mexico 10% 2024 1.8Israel 6% 2019 1.8Citigroup 8.5% 2019 1.6Teck Resources 9.75% 2014 1.4Long Beach Mortgage Loan Trust FRN Feb 2034 1.3
Sector breakdown %Fixed interest securities 84.0Government bonds 10.9Liquidity 4.4Forward currency contracts 2.6Futures (1.3)Net other liabilities (0.6)
Highest/lowest share price and distribution recordHighest Lowest Distribution
Calendar year share price share price per share
A-Class Accumulation SharesA
2009 57.46p 49.55p 0.89p
2010B 60.01p 57.39p 1.53p
A-Class Income SharesA
2009 56.53p 49.55p 0.89p
2010B 58.63p 56.07p 1.49p
C-Class Income SharesC
2009 104.0p 99.80p 0.13p
2010B 107.8p 103.0p 3.16p
I-Class Gross Accumulation SharesD
2009 112.2p 100.0p 1.98p
2010B 117.8p 112.2p 4.39p
I-Class Gross Income SharesE
2010B 101.6p 98.44p 1.69p
A A-Class Accumulation and A-Class Income Shares were launched on 7 May 2009.B To 31 July 2010.C C-Class Income Shares were launched on 19 October 2009.D I-Class Gross Accumulation Shares were launched on 1 July 2009.E I-Class Gross Income Shares were launched on 06 April 2010.
Portfolio turnover rate31.07.09 224.68%
31.07.10 232.31%
The portfolio turnover rate (PTR) reflects the total of security purchases and sales, less the total of shareissues and cancellations, expressed as a percentage of the average daily net asset values over the period.
Net asset values and Total expense ratiosNet assetvalue per Net asset Total
share class Number value per expenseDate £’000 of shares share ratio
A-Class Accumulation Shares
31.01.10 38,003 66,142,739 57.46p 1.18%
31.07.10 51,886 87,882,369 59.04p 1.18%
A-Class Income Shares
31.01.10 3,390 6,037,885 56.14p 1.18%
31.07.10 9,337 16,502,743 56.58p 1.18%
C-Class Income Shares
31.01.10 1,031 1,000,681 103.1p 0.62%
31.07.10 7,177 6,908,668 103.9p 0.62%
I-Class Gross Accumulation Shares
31.01.10 3,934 3,503,290 112.3p 0.40%
31.07.10 6,508 5,590,376 116.4p 0.40%
I-Class Gross Income Shares
31.07.10 5,928 6,006,000 98.70p 0.40%
The Net asset value and the Net asset value per income share are shown ex-dividend.
The total expense ratio (TER) takes into account the ACD fee and any fixed expenses charged to revenue overthe financial period, expressed as a percentage of the average daily net asset values over the same period.

146146
ContinuationReturn to Index�
�
Market value Total netInvestment Holding £’000 assets %
Portfolio statementAs at 31 July 2010
Fixed interest securities – 84.0% (90.4%)US Dollar – 76.1%ABFC 2005-OPT1 Trust 2005-A2C FRN 2035 $275,252 164 0.2ACCO Brands 10.625% 2015 $600,000 428 0.5ACE Securities Home Equity Trust
Series 2005 FRN 2035 $150,000 92 0.1Aeroflex 11.75% 2015 $250,000 172 0.2AES 9.75% 2016 $600,000 431 0.5Alliant Techsystems 6.75% 2016 $600,000 387 0.5Ally Financial 6.75% 2014 $500,000 322 0.4Altria Group 9.75% 2018 $500,000 420 0.5America Movil 6.125% 2040 $500,000 343 0.4American Home Mortgage Assets 2046 $163,235 56 0.1Ameriquest Mortgage FRN 2034 $1,145,000 557 0.7Amkor Technology 9.25% 2016 $600,000 412 0.5Amsted Industries 8.125% 2018 $500,000 329 0.4Anglo American 9.375% 2019 $1,000,000 845 1.0Anglogold Ashanti 5.375% 2020 $740,000 488 0.6Arch Western Finance 6.75% FRN 2013 $600,000 389 0.5Avaya 9.75% 2015 $200,000 124 0.2Avaya 10.125% 2015 $400,000 246 0.3Banc of America Alternative Loan Trust
2004-CB1 6% 2035 $244,691 151 0.2Banc of America Mortgage Trust
2005-A31 5.5% 2035 $32,349 20 –Bank of America 5.65% 2018 $930,000 627 0.8Bank of America 5.625% 2020 $615,000 408 0.5Biomet 10.375% 2017 $600,000 425 0.5British Telecommunications 5.95% FRN 2018 $500,000 341 0.4Capital One Bank 8.8% 2019 $500,000 408 0.5Case New Holland 7.875% 2017 $500,000 339 0.4CBS 8.2% 2014 $150,000 113 0.1CCO Holdings 7.875% 2018 $600,000 404 0.5Cequel Communications 8.625% 2017 $600,000 394 0.5Chesapeake Energy 6.5% 2017 $600,000 392 0.5CIT Group 7% 2016 $400,000 245 0.3Citigroup 8.5% 2019 $1,625,000 1,270 1.6Citigroup Mortgage Loan Trust 2035 STEP $50,298 27 –Clear Channel Worldwide ‘B’ 9.25% 2017 $500,000 340 0.4Cloud Peak Energy Resources 8.25% 2017 $600,000 401 0.5Commercial Mortgage Trust
2001-J1 B 6.614% FRN 2034 $60,000 39 –Community Health Systems 8.875% 2015 $600,000 403 0.5Constellation Brands 7.25% 2016 $600,000 401 0.5Continental Airlines 7.25% 2019 $400,000 280 0.4Continental Airlines 6.545% 2020 $237,399 154 0.2Corrections Corporation of America
6.75% 2014 $500,000 329 0.4Corrections Corporation of America
7.75% 2017 $100,000 68 0.1Couche Tard USLP/Financing 7.5% 2013 $400,000 261 0.3Credit Suisse Guernsey FRN Perpetual $400,000 182 0.2Credit-Based Asset Servicing And
Securitization FRN 2035 $358,545 228 0.3CWALT 2005-28CB 1A5 5.5% 2035 $306,718 185 0.2Delta Air Lines 6.2% 2018 $1,500,000 980 1.2Delta Air Lines 7.75% 2021 $491,805 343 0.4Denbury Resources 9.75% 2016 $600,000 423 0.5Digicel Group 10.5% 2018 $250,000 172 0.2DIRECTV 7.625% 2016 $100,000 71 0.1Discover Bank 8.7% 2019 $1,000,000 740 0.9Discovery Communications 5.05% 2020 $1,200,000 811 1.0DTE Energy 7.625% 2014 $200,000 150 0.2Duke Realty 6.75% 2020 $300,000 207 0.3Easton Bell Sports 9.75% 2016 $600,000 405 0.5EchoStar DBS 7.75% 2015 $500,000 336 0.4EchoStar DBS 7.125% 2016 $100,000 66 0.1FHLMC Gold 6% 30 Yrs Aug 2033 $5,600,000 3,913 4.8First Data 9.875% 2015 $300,000 157 0.2First Union National Bank A2 6.136% 2033 $23,530 15 –FNMA 5% 2036 $4,771,612 3,271 4.1Ford Motor Credit 8.7% 2014 $500,000 348 0.4Freescale Semiconductor 9.25% 2018 $500,000 334 0.4Frontier Communications 8.5% 2020 $350,000 240 0.3GCI 8.625% 2019 $600,000 399 0.5Georgia Pacific 7% 2015 $100,000 67 0.1Georgia Pacific 7.75% 2017 $600,000 399 0.5Glatfelter 7.125% 2016 $600,000 381 0.5Goldman Sachs 6.15% 2018 $570,000 396 0.5Graham Packaging 9.875% 2014 $500,000 333 0.4
Market value Total netInvestment Holding £’000 assets %
Hanesbrands 8% 2016 $600,000 403 0.5Harrahs Operating 11.25% 2017 $500,000 349 0.4HCA 9.625% 2016 $600,000 416 0.5Health Care Reit 6.125% 2020 $300,000 202 0.2Health Management Associates
6.125% 2016 $600,000 377 0.5Host Marriott ‘Q’ 6.75% 2016 $600,000 390 0.5Huntsman International 5.5% 2016 $600,000 355 0.4Indymac Index Mortgage Loan Trust $624,858 250 0.3Ineos Finance 9% 2015 $500,000 327 0.4Intelsat Jackson ‘H’ 9.5% FRN 2016 $600,000 412 0.5Iron Mountain 8.75% 2014 $400,000 273 0.3Jarden 8% 2016 $600,000 408 0.5JC Penney 5.65% 2020 $905,000 582 0.7JDA Software 8% 2014 $600,000 395 0.5Jostens 7.625% 2012 $500,000 322 0.4JPMorgan Mortgage Trust 4.5% 2020 $404,825 247 0.3L-3 Communications 5.875% 2015 $600,000 392 0.5Long Beach Mortgage Loan Trust
FRN Feb 2034 $2,270,000 1,039 1.3Long Beach Mortgage Loan Trust
FRN Jul 2034 $400,000 181 0.2Lyondell Chemical 11% 2018 $500,000 346 0.4Mack Cali Realty 7.75% 2019 $500,000 377 0.5Macy’s Retail 7.875% 2015 $600,000 431 0.5Master Alternative Loan Trust 5.75% 2035 $381,446 208 0.3Master Asset Backed Securities Trust
1.38% 2033 $187,581 113 0.1MetroPCS Wireless 9.25% 2014 $600,000 404 0.5MGM Mirage 7.5% 2016 $300,000 162 0.2MGM Mirage 11.125% 2017 $100,000 73 0.1MGM Mirage 9% 2020 $250,000 169 0.2Morgan Stanley 5.5% Jan 2020 $500,000 323 0.4Morgan Stanley 5.5% Jul 2020 $350,000 226 0.3Morgan Stanley Capital 5.21% 2042 $405,000 280 0.4Mylan 7.875% 2020 $500,000 344 0.4Neiman Marcus FRN 2015 $300,000 197 0.2Nexen 5.875% Notes 2035 $300,000 192 0.2Nisource Finance 6.8% 2019 $1,000,000 721 0.9Nordic Telephone 8.875% 2016 $600,000 405 0.5NRG Energy 7.375% 2016 $600,000 394 0.5Owens Corning 6.5% 2016 $500,000 346 0.4Paetec 8.875% 2017 $600,000 397 0.5Park Place Securities FRN 2035 $150,000 86 0.1Petrohawk Energy 10.5% 2014 $600,000 429 0.5Plains All American 3.95% 2015 $935,000 612 0.8Quebecor Media 7.75% 2016 $625,000 408 0.5Qwest Communications International
7.5% 2014 $600,000 394 0.5Ramp Series Trust 0.95% 2034 $546,559 303 0.4RBS Global & Rexnord 8.5% 2018 $600,000 389 0.5Renaissance 0.91% 2034 $2,434,417 889 1.1Rental Service 9.5% 2014 $300,000 199 0.3RFMSI Series Trust 6% 2036 $273,184 163 0.2Sally Holdings 9.25% 2014 $500,000 339 0.4Sand Trust 2005-HE2 FRN 2035 $19,025 12 –Sealy Mattress 8.25% 2014 $600,000 388 0.5Service Corporation International
6.75% 2015 $600,000 390 0.5Servicemaster 10.75% 2015 $500,000 337 0.4Simmons 11.25% 2015 $470,000 325 0.4Simon Property Group 6.75% 2014 $600,000 436 0.5Spectrum Brands 9.5% 2018 $500,000 340 0.4Sprint Capital 6.9% 2019 $600,000 369 0.5Standard Chartered 9.5% FRN
Perpetual Preference $200,000 144 0.2Structured Asset Investment Loan Trust
1.33% 2033 $1,130,000 533 0.7Structured Asset Securities 0.67% 2035 $220,000 127 0.2Suncor Energy 6.5% 2038 $500,000 356 0.4Sungard Data Systems 10.25% 2015 $630,000 426 0.5SUPERVALU 8% 2016 $625,000 404 0.5Teck Resources 9.75% 2014 $1,400,000 1,090 1.4Telecom Italia Capital 6.999% 2018 $1,000,000 718 0.9Telefonica Emisiones 5.134% 2020 $1,000,000 670 0.8Tenet Healthcare 10% 2018 $500,000 365 0.5Terex 10.875% 2016 $500,000 357 0.4TRW Automotive 7% 2014 $500,000 327 0.4Tyco International 7% 2019 $1,000,000 774 1.0UBS 5.875% 2017 $1,000,000 703 0.9United Surgical Partners 9.25% 2017 $500,000 329 0.4

147
ContinuationReturn to Index�
�
Portfolio statement – continuedAs at 31 July 2010
Market value Total netInvestment Holding £’000 assets %
US Oncology 9.125% 2017 $600,000 407 0.5Vail Resorts 6.75% 2014 $450,000 291 0.4Viacom 5.50% 2033 $850,000 515 0.6Videotron 6.375% 2015 $600,000 391 0.5Visant 10.25% 2013 $600,000 395 0.5Wachovia Bank 5.274% 2044 $250,000 174 0.2Wells Fargo 4.75% 2020 $359,050 232 0.3Williams Partners 6.3% 2040 $560,000 381 0.5Wind Acquisition 11.75% 2017 $500,000 341 0.4Windstream 8.625% 2016 $500,000 335 0.4Xerox 4.25% 2015 $1,000,000 672 0.8
Euro – 7.0%AXA 5.25% FRN 2040 u150,000 121 0.2FCE Bank 9.375% 2014 u400,000 362 0.5Fiat 7.625% 2014 u150,000 133 0.2Fleet Street Finance Three FRN 2016 u1,265,367 795 1.0Heidelbergcement 8% 2017 u440,000 374 0.5Intesa Sanpaolo 5.15% 2020 u400,000 341 0.4Intesa Sanpaolo 8.375% Perpetual u100,000 84 0.1Nationwide Building Society FRN 2016 u200,000 149 0.2OTE Telecom 5% 2013 u300,000 245 0.3Pernod Ricard 7% 2015 u250,000 229 0.3Reynolds Group 7.75% 2016 u350,000 299 0.4Royal Bank of Scotland 6.934% 2018 u400,000 347 0.4Royal Caribbean Cruises 5.625% 2014 u350,000 272 0.3Santander Issuances FRN 2018 u700,000 572 0.7Smurfit Kappa Acquisition 7.25% 2017 u350,000 295 0.4UPCB Finance 7.625% 2020 u350,000 296 0.4Xstrata Finance Canada 5.25% 2017 u635,000 553 0.7Sterling – 0.9%Allstate Life Funding 6.375% 2011 £100,000 102 0.1Countrywide Financial 5.125% 2011 £100,000 101 0.1CRH Finance 8.25% 2015 £200,000 231 0.3Lloyds Banking Group 7.625% 2025 £230,000 234 0.3Suntrust Bank FRN 2012 £100,000 93 0.1
Government bonds – 10.9% (7.6%)Indonesia – 2.7%Indonesia 11.5% 2019 IDR 24,800,000,000 2,175 2.7Turkey – 2.0%Turkey 10% 2015 TRY 3,600,000 1,602 2.0Mexico – 1.8%Mexico 10% 2024 MXN 22,800,000 1,477 1.8Israel – 1.8%Israel 6% 2019 ILS 7,550,000 1,466 1.8South Korea – 1.2%Korea 4% 2012 KRW 1,805,000,000 981 1.2Brazil – 0.8%Brazil 10% 2017 BRL 184,000 617 0.8United States of America – 0.6%US Treasury 0% 2011 $717,000 460 0.6
Liquidity – 4.4% (5.3%)JPM Sterling Liquidity ‘X’ (Income) £3,513,500 3,514 4.4
Forward currency contracts – 2.6% (1.3%)EuroForward foreign currency position
07/09/10 £6,010,155 6,010 7.4Forward foreign currency position
07/09/10 u(7,268,890) (6,068) (7.5)Forward foreign currency position
07/09/10 u500,000 417 0.5Forward foreign currency position
07/09/10 £(405,225) (405) (0.5)US DollarForward foreign currency position
07/09/10 £64,858,335 64,858 80.2Forward foreign currency position
07/09/10 $(97,542,400) (62,632) (77.5)Forward foreign currency position
07/09/10 $2,800,000 1,798 2.2Forward foreign currency position
07/09/10 £(1,806,929) (1,807) (2.2)
Market value Total netInvestment Holding £’000 assets %
Futures – (1.3)% ((0.1)%)Euro BOBL Futures Sep 2010 (37) (1) –Euro Bund Futures Sep 2010 13 6 –US Long Bond Futures Sep 2010 (14) (32) –US 2 Year Note Futures Sep 2010 (138) (84) (0.1)US 5 Year Note Futures Sep 2010 (406) (755) (0.9)US 10 Year Note Futures Sep 2010 (131) (201) (0.3)
Investment assets 81,314 100.6
Net other liabilities (478) (0.6)
Net assets 80,836 100.0
Unless otherwise stated the above securities are admitted to official stock exchange listings or trade on aregulated market.
The comparative percentage figures in brackets are at 31 January 2010.
Market value Portfolio credit ratings £’000
AAA 2,637AA+ 830AA 2,276AA- 3,293A+ 703A 5,178A- 4,452BBB+ 1,825BBB 5,019BBB- 6,807BB+ 5,574BB 2,553BB- 10,102B+ 4,271B 5,446B- 3,563CCC+ 2,019CC+ 333CC 162Unrated 9,653
Total bonds 76,696
Liquidity 3,514Forward currency contracts 2,171Futures (1,067)
Investment assets 81,314

148
ContinuationReturn to Index�
�
£’000
Total of all purchases for the period 114,544
Major purchases Cost
JPM Sterling Liquidity ‘X’ (Income) 17,380FHLMC Gold 6% 30 Yrs Jul 2034 4,197FHLMC Gold 6% 30 Yrs Jun 2009 4,076FHLMC Gold 6% 30 Yrs Apr 2011 4,012FHLMC Gold 6% 30 Yrs Aug 2010 4,010FHLMC Gold 6% 30 Yrs May 2011 3,932FHLMC Gold 6% 30 Yrs Mar 2011 3,856Delta Airlines 6.2% 2018 1,988Mexico 10% 2024 1,976Turkey 10% 2015 1,612Israel 6% 2019 1,463Citigroup 8.5% 2019 1,297Long Beach Mortgage Loan Trust FRN Feb 2034 1,121Teck Resources 9.75% 2014 1,107Korea 4% 2012 1,036Renaissance 0.91% 2034 937Turkey 16% 2012 934AES 9.75% 2016 860Discovery Communications 5.05% 2020 825Fleet Street Finance Three FRN 2016 805
£’000
Total of all sales for the period 84,749
Major sales Proceeds
JPM Sterling Liquidity ‘X’ (Income) 16,320FHLMC Gold 6% 30 Yrs Jun 2009 4,209FHLMC Gold 6% 30 Yrs May 2011 4,088FHLMC Gold 6% 30 Yrs Mar 2011 4,025FHLMC Gold 6% 30 Yrs Jul 2034 4,019FHLMC Gold 6% 30 Yrs Apr 2011 3,938FHLMC Gold 6% 30 Yrs Feb 2011 3,867Mexico 10% 2024 1,846Turkey 16% 2012 1,727Delta Airlines 6.2% 2018 992Flextronics International 6.5% 2013 802Prudential Financial 7.375% 2019 765Darden Restaurants 6.8% 2037 745Suncor Energy 6.1% 2018 741CMS Energy 8.75% 2019 735Ameren Energy Generating 7% 2018 691DIRECTV 4.75% 2014 659Citigroup 6.125% 2017 651Monumental Global Funding III FRN 2014 649Lloyds Banking Group 5.8% 2020 628
Portfolio movements For the six months ended 31 July 2010

149
Return to Index�
Financial statements
Statement of total return(Unaudited)
For the six months ended 31 July2010 2009
£’000 £’000 £’000 £’000
Income
Net capital (losses)/gains (53) 156
Revenue 1,979 40
Expenses (339) (9)
Net revenue before taxation 1,640 31
Taxation – –
Net revenue after taxation 1,640 31
Total return before distributions 1,587 187
Finance costs: Distributions (1,640) (30)
Change in net assets attributable to shareholders from investment activities (53) 157
Statement of change in net assets attributable to shareholders(Unaudited)
For the six months ended 31 July2010 2009
£’000 £’000 £’000 £’000
Opening net assets attributable to shareholders 46,358 –
Amounts receivable on issue of shares 37,647 3,787
Amounts payable on cancellation of shares (4,262) (138)
33,385 3,649
Change in net assets attributable to shareholders from investment activities (see above) (53) 157
Retained distributions on accumulation shares 1,146 13
Closing net assets attributable to shareholders 80,836 3,819
As the comparatives in the above table are for the previous interim period, the Net assets at the end ofthat period will not agree to the Net assets at the start of the current period.
Balance sheet(Unaudited)
As at31 July 2010 31 January 2010
£’000 £’000 £’000 £’000
ASSETS
Investment assets 82,454 48,500
Debtors 3,039 2,045
Cash and bank balances 3,224 219
Total other assets 6,263 2,264
Total assets 88,717 50,764
LIABILITIES
Investment liabilities (1,140) (68)
Creditors (6,493) (4,306)
Distribution payable on income shares (248) (32)
Total other liabilities (6,741) (4,338)
Total liabilities (7,881) (4,406)
Net assets attributable to shareholders 80,836 46,358

150
ContinuationReturn to Index�
�
JPM UK Active 350 Fund
Investment objective and policyTo invest for capital growth with no distribution target by investing in aportfolio of UK equities primarily from the FTSE 350.
Risk profileThis equity based Fund is designed for investors looking for broad marketexposure to a single developed stock market.
Equity investment is subject to specific risks relating to the performance ofthe individual companies held and the market’s perception of theirperformance. Equities are also subject to systematic risks such as generaleconomic conditions, inflation, interest rates, foreign exchange rates andindustry sector risks. In general terms, equities tend to be more volatile thanbonds.
Funds that invest predominantly in a single market, asset class or sectormay be subject to greater volatility than those funds with a more diversifiedportfolio.
Fund review• The six months under review began strongly for UK equities, helped by
positive economic data. However, eurozone sovereign debt concernsand growing uncertainty about the strength of the recovery contributedto volatility as the period progressed.
• Against this backdrop, the Fund produced positive returns andoutperformed its benchmark. Positive contributors to relative returnsincluded stock selection in the financial services, aerospace & defenceand chemicals sectors, while stock selection detracted in the media andoil & gas producers sectors.
• At the stock level, the Fund benefited from an overweight position in Senior,the maker of parts for the aviation industry, which said full-year profit willexceed expectations on the improved outlook for large commercial aircraft.An overweight position in Croda International was also positive as thechemical producer reported better-than-expected first-half earnings andsaid strong trading was continuing in the second half.
• Stock-level detractors included an overweight position in BP. The oilproducer looked attractive given strong earnings momentum and a risingproduction profile, but the stock fell heavily following an explosion on oneof its rigs in the Gulf of Mexico. An overweight position in Trinity Mirrorwas also detrimental after the newspaper publisher reported disappointinginterim earnings and said its circulation figures and advertising revenuesfell over the first four months of 2010.
• However, the fund was boosted by an overweight position in Aggreko, theprovider of mobile power-supply equipment, which reported an increasein first-half profit and said full-year results will be significantly ahead ofexpectations.
You should remember that past performance is not a guide to the future. The price of investments and the income from them may fall as well as rise andinvestors may not get back the full amount invested. For specific risks, please read the Simplified Prospectus.All performance returns are calculated using the quoted price of the accumulation shares. Performance returns are in Sterling.FX Adjusted returns have been calculated by JPMAM. Blended benchmarks have been calculated by JPMAM.Source: J.P. Morgan.Source: FTSE International Limited (“FTSE”) © FTSE [2010]. “FTSE®” is a trade mark of London Stock Exchange Plc and The Financial Times Limited and is used by FTSE International Limited under licence. All rights inthe FTSE indices and/or FTSE ratings vest in FTSE and/or its licensors. Neither FTSE nor its licensors accept any liability for any errors or omissions in the FTSE indices and/or FTSE ratings or underlying data. No furtherdistribution of FTSE Data is permitted without FTSE’s express written consent.
Fund outlook• Volatility may persist in the short-term given the ongoing uncertainty
over the global economic outlook. However, UK equities are supportedby low interest rates, while valuations are attractive both compared tohistory and compared to bonds.
Rolling 12 month performance as at 31 July2010/2009 2009/2008 2008/2007 2007/2006 2006/2005
JPM Active 350A-Class Acc 19.8% -13.6% -16.3% 6.4% 18.7%
JPM Active 350I-Class Acc 20.5% -13.1% – – –
Benchmark Index 19.3% -10.5% -12.7% 12.7% 17.4%
Six month performance31/01/10–31/07/10
JPM Active 350 A-Class Acc 6.2%
Benchmark Index 4.1%
Fund statisticsFund size £57.8m
Benchmark Index FTSE 350 (Total Return Net)
Fund chargesA-Class Initial 3.50%, Annual 1.00%I-Class Initial Nil, Annual 0.60%
Top ten holdings %Royal Dutch Shell ‘B’ 7.4HSBC 6.5Vodafone Group 5.5BP 5.2GlaxoSmithKline 4.2AstraZeneca 3.6British American Tobacco 3.3BHP Billiton 3.3Rio Tinto 3.0Anglo American 2.5

151
ContinuationReturn to Index�
�
Sector breakdown %Financials 21.8Oil & gas 15.8Basic materials 13.6Consumer goods 11.7Consumer services 8.8Industrials 8.4Health care 8.2Telecommunications 6.0Utilities 2.8Technology 1.5Futures 0.0Net other assets 1.4
Highest/lowest share price and distribution recordDistribution
Highest Lowest per shareCalendar year share price share price (net)
A-Class Accumulation Shares
2005 177.4p 144.5p 2.65p
2006 207.1p 177.7p 3.37p
2007 217.6p 188.8p 3.70p
2008 201.0p 115.7p 4.37p
2009 174.0p 108.1p 5.43p
2010A 190.7p 160.7p 4.24p
A-Class Income SharesB
2007 51.10p 43.67p 0.00p
2008 46.41p 26.72p 0.00p
2009 38.73p 24.06p 1.08p
2010A 41.38p 34.87p 0.94p
I-Class Accumulation Shares
2005 184.2p 149.3p 3.50p
2006 216.2p 185.0p 4.40p
2007 227.6p 197.7p 4.89p
2008 211.1p 122.0p 5.76p
2009 184.8p 114.3p 6.74p
2010A 202.9p 171.1p 5.37p
I-Class Income SharesB
2007 104.5p 90.79p 0.00p
2008 96.90p 54.31p 2.63p
2009 78.26p 48.41p 2.93p
2010A 83.33p 70.30p 2.27p
A To 31 July 2010.B A-Class Income Shares and I-Class Income Shares were launched on 2 January 2007.
Portfolio turnover rate31.07.09 101.83%
31.07.10 63.00%
The portfolio turnover rate (PTR) reflects the total of security purchases and sales, less the total of shareissues and cancellations, expressed as a percentage of the average daily net asset values over the period.
Net asset values and Total expense ratiosNet assetvalue per Net asset Total
share class Number value per expenseDate £’000 of shares share ratio
A-Class Accumulation Shares
31.01.08 5,679 3,238,942 175.3p 1.14%
31.01.09 35,500 27,979,196 126.9p 1.18%
31.01.10 51,527 30,838,442 167.1p 1.16%
31.07.10 53,265 30,035,255 177.3p 1.18%
A-Class Income Shares
31.01.08C 18 44,741 40.50p 4.77%
31.01.09C 16 55,816 28.24p 1.18%
31.01.10C 19 52,672 36.25p 1.18%
31.07.10 22 57,721 38.48p 1.18%
I-Class Accumulation Shares
31.01.08 60,838 33,044,720 184.1p 0.60%
31.01.09 4,708 3,513,152 134.0p 0.60%
31.01.10 5,879 3,312,043 177.5p 0.60%
31.07.10 4,482 2,372,454 188.9p 0.60%
I-Class Income Shares
31.01.08C 684 834,630 81.95p 0.60%
31.01.09C 5 8,000 56.76p 0.60%
31.01.10C 5 7,000 72.92p 0.60%
31.07.10 6 8,149 77.61p 0.60%
C The Net asset value and the Net asset value per income share are shown ex-dividend at the financial year end.
The total expense ratio (TER) takes into account the ACD fee and any fixed expenses charged to revenue overthe financial period, expressed as a percentage of the average daily net asset values over the same period.

152
ContinuationReturn to Index�
�
Market value Total netInvestment Holding £’000 assets %
Portfolio statementAs at 31 July 2010
Financials – 21.8% (19.3%)Banks – 13.7%Barclays 320,333 1,067 1.9HSBC 575,416 3,781 6.5Lloyds Banking Group 1,928,082 1,347 2.3Royal Bank of Scotland Group 1,368,437 684 1.2Standard Chartered 55,233 1,032 1.8Life insurance – 3.4%Aviva 28,969 105 0.2Legal & General Group 633,536 577 1.0Old Mutual 490,584 600 1.0Prudential 50,142 282 0.5St James’s Place 139,071 385 0.7General financial – 2.4%Bluebay Asset Management 26,467 75 0.1Hargreaves Lansdown 65,003 235 0.4IG Group 58,161 276 0.5International Personal Finance 151,690 362 0.6Investec 18,908 94 0.2Tullett Prebon 106,790 373 0.6Nonlife insurance – 1.6%Admiral Group 13,841 202 0.3Amlin 105,264 449 0.8Beazley Group 108,806 130 0.2Brit Insurance 3,490 35 0.1Lancashire Holdings 19,783 106 0.2Real estate – 0.7%Shaftesbury 96,564 390 0.7
Oil & gas – 15.8% (19.3%)Oil & gas producers – 14.6%BG Group 95,534 969 1.7BP 734,958 2,984 5.2Melrose Resources 59,920 188 0.3Royal Dutch Shell ‘B’ 249,799 4,257 7.4Tullow Oil 3,281 40 –Oil equipment, services & distribution – 1.2%Lamprell 72,561 197 0.3Petrofac 36,902 462 0.8Wood Group (John) 11,426 41 0.1
Basic materials – 13.6% (12.7%)Mining – 11.7%Anglo American 56,002 1,426 2.5Antofagasta 18,596 185 0.3BHP Billiton 97,928 1,915 3.3Eurasian Natural Resources 47,197 426 0.7Ferrexpo 131,787 370 0.6Kazakhmys 2,324 28 0.1Rio Tinto 52,152 1,731 3.0Xstrata 69,249 710 1.2Chemicals – 1.1%Croda International 31,297 403 0.7Victrex 19,368 235 0.4Forestry & paper – 0.8%Mondi 95,838 433 0.8
Consumer goods – 11.7% (13.6%)Tobacco – 4.5%British American Tobacco 87,291 1,933 3.3Imperial Tobacco Group 36,892 672 1.2Beverages – 2.7%Britvic 77,884 376 0.6Diageo 60,982 681 1.2SABMiller 25,661 495 0.9Food producers – 2.0%Cranswick 6,871 60 0.1Dairy Crest Group 89,121 345 0.6Robert Wiseman Dairies 37,761 189 0.3Unilever 32,591 594 1.0Household goods – 1.6%Berkeley Group ‘B’ 9,307 76 0.1Persimmon 90,907 323 0.6Reckitt Benckiser Group 15,884 497 0.9Personal goods – 0.9%Burberry Group 60,634 514 0.9
Market value Total netInvestment Holding £’000 assets %
Consumer services – 8.8% (8.6%)Travel & leisure – 3.0%Carnival 20,301 472 0.8Compass Group 40,972 219 0.4Ladbrokes 42,577 58 0.1Mitchells & Butlers 111,220 348 0.6Rank Group 150,366 177 0.3Restaurant Group 34,409 78 0.2Stagecoach Group 205,491 351 0.6Food & drug retails – 2.3%Morrison (Wm.) Supermarkets 191,143 512 0.9Tesco 207,083 817 1.4Media – 1.9%Daily Mail & General Trust ‘A’ Non-Voting 76,192 374 0.6Euromoney Institutional Investor 55,854 333 0.6Informa 15,919 63 0.1ITE Group 232,539 344 0.6General retailers – 1.6%Dunelm Group 96,852 376 0.7Halfords Group 10,827 52 0.1Next 22,538 487 0.8
Industrials – 8.4% (7.2%)Support services – 4.0%Aggreko 28,022 429 0.8Atkins (WS) 50,521 368 0.6Bunzl 10,513 73 0.1Carillion 44,647 135 0.2Davis Service Group 22,658 85 0.2eaga 201,504 215 0.4Filtrona 172,033 413 0.7Galiform 155,276 111 0.2Homeserve 9,625 216 0.4Mitie Group 122,383 256 0.4Industrial engineering – 1.9%IMI 60,082 428 0.7Senior 278,458 359 0.6Weir Group 28,764 337 0.6Aerospace & defence – 1.2%BAE Systems 28,854 92 0.2Rolls Royce Group 100,647 589 1.0Electronics & electrical equipment – 0.7%Domino Printing Sciences 88,219 401 0.7General industrials – 0.6%Cookson Group 9,427 42 0.1Smith (DS) 123,272 178 0.3Tomkins 41,221 134 0.2
Health care – 8.2% (7.9%)Pharmaceuticals & biotechnology – 7.8%AstraZeneca 63,754 2,074 3.6GlaxoSmithKline 216,859 2,424 4.2Shire 2,116 31 –Health care equipment & services – 0.4%Smith & Nephew 41,564 230 0.4
Telecommunications – 6.0% (5.4%)Mobile telecommunications – 5.5%Vodafone Group 2,138,671 3,203 5.5Fixed line telecommunications – 0.5%BT Group 188,751 270 0.5
Utilities – 2.8% (2.3%)Gas, water & multiutilities – 2.4%Centrica 300,189 927 1.6National Grid 80,889 422 0.7Northumbrian Water Group 7,101 24 0.1Electricity – 0.4%Drax Group 31,232 121 0.2International Power 33,914 122 0.2Scottish & Southern Energy 1,906 21 –
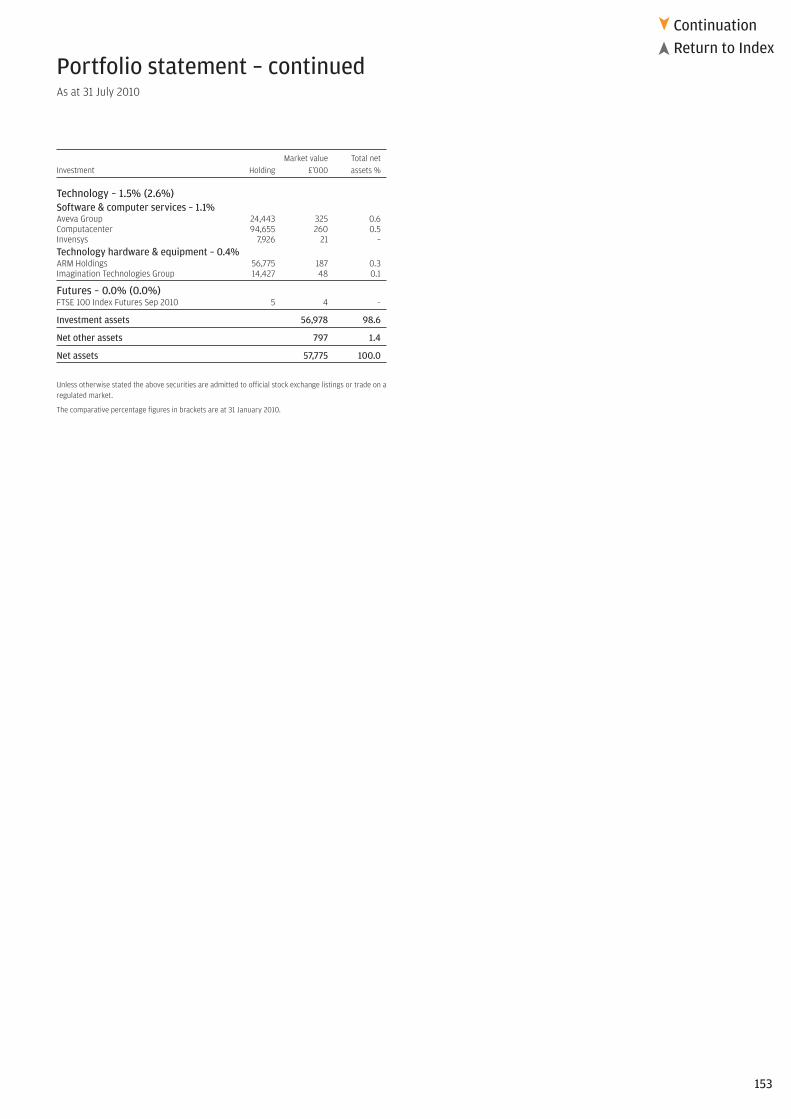
153
ContinuationReturn to Index�
�
Portfolio statement – continuedAs at 31 July 2010
Market value Total netInvestment Holding £’000 assets %
Technology – 1.5% (2.6%)Software & computer services – 1.1%Aveva Group 24,443 325 0.6Computacenter 94,655 260 0.5Invensys 7,926 21 –Technology hardware & equipment – 0.4%ARM Holdings 56,775 187 0.3Imagination Technologies Group 14,427 48 0.1
Futures – 0.0% (0.0%)FTSE 100 Index Futures Sep 2010 5 4 –
Investment assets 56,978 98.6
Net other assets 797 1.4
Net assets 57,775 100.0
Unless otherwise stated the above securities are admitted to official stock exchange listings or trade on aregulated market.
The comparative percentage figures in brackets are at 31 January 2010.
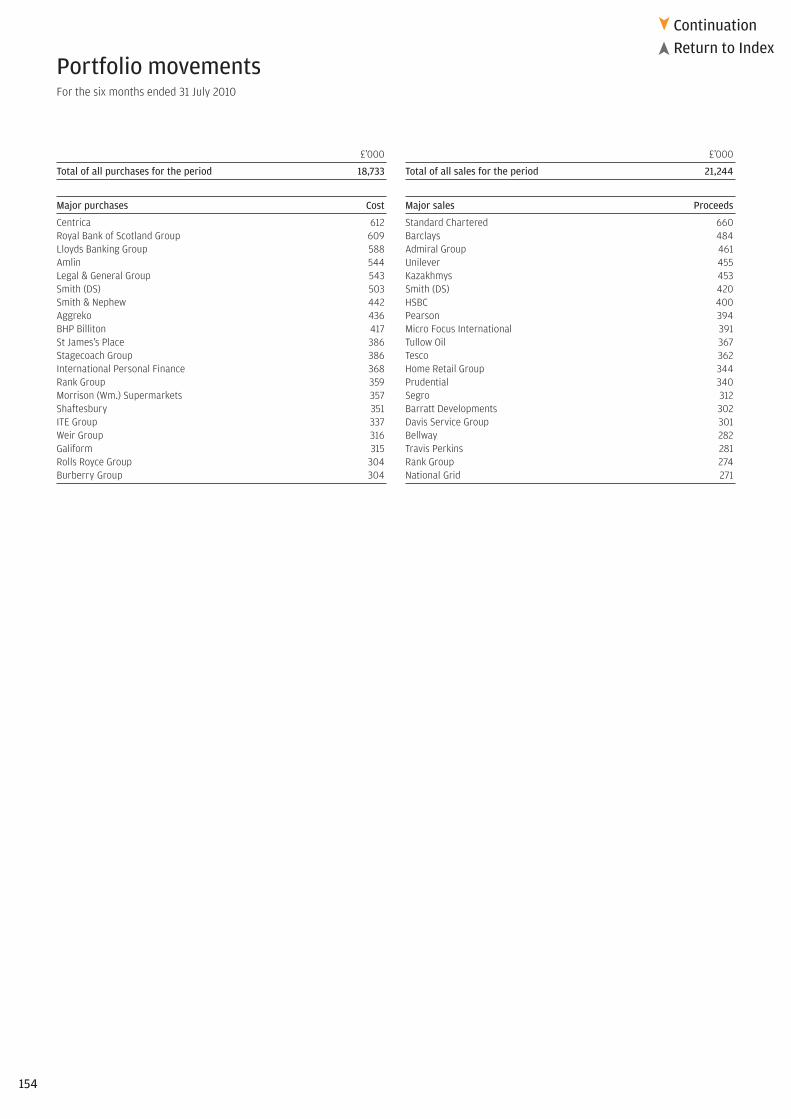
154
ContinuationReturn to Index�
�
£’000
Total of all purchases for the period 18,733
Major purchases Cost
Centrica 612Royal Bank of Scotland Group 609Lloyds Banking Group 588Amlin 544Legal & General Group 543Smith (DS) 503Smith & Nephew 442Aggreko 436BHP Billiton 417St James’s Place 386Stagecoach Group 386International Personal Finance 368Rank Group 359Morrison (Wm.) Supermarkets 357Shaftesbury 351ITE Group 337Weir Group 316Galiform 315Rolls Royce Group 304Burberry Group 304
£’000
Total of all sales for the period 21,244
Major sales Proceeds
Standard Chartered 660Barclays 484Admiral Group 461Unilever 455Kazakhmys 453Smith (DS) 420HSBC 400Pearson 394Micro Focus International 391Tullow Oil 367Tesco 362Home Retail Group 344Prudential 340Segro 312Barratt Developments 302Davis Service Group 301Bellway 282Travis Perkins 281Rank Group 274National Grid 271
Portfolio movements For the six months ended 31 July 2010

155
Return to Index�
Financial statements
Statement of total return(Unaudited)
For the six months ended 31 July2010 2009
£’000 £’000 £’000 £’000
Income
Net capital gains 2,651 6,502
Revenue 1,126 1,287
Expenses (328) (264)
Net revenue before taxation 798 1,023
Taxation – (11)
Net revenue after taxation 798 1,012
Total return before distributions 3,449 7,514
Finance costs: Distributions (20) 15
Change in net assets attributable to shareholders from investment activities 3,429 7,529
Statement of change in net assets attributable to shareholders(Unaudited)
For the six months ended 31 July2010 2009
£’000 £’000 £’000 £’000
Opening net assets attributable to shareholders 57,430 40,229
Amounts receivable on issue of shares 109 6,204
Amounts payable on cancellation of shares (3,193) (382)
(3,084) 5,822
Change in net assets attributable to shareholders from investment activities (see above) 3,429 7,529
Closing net assets attributable to shareholders 57,775 53,580
As the comparatives in the above table are for the previous interim period, the Net assets at the end ofthat period will not agree to the Net assets at the start of the current period.
Balance sheet(Unaudited)
As at31 July 2010 31 January 2010
£’000 £’000 £’000 £’000
ASSETS
Investment assets 56,978 56,816
Debtors 222 123
Cash and bank balances 627 687
Total other assets 849 810
Total assets 57,827 57,626
LIABILITIES
Investment liabilities – (12)
Creditors (52) (183)
Distribution payable on income shares – (1)
Total other liabilities (52) (184)
Total liabilities (52) (196)
Net assets attributable to shareholders 57,775 57,430

156
ContinuationReturn to Index�
�
JPM UK Dynamic Fund
Investment objective and policyTo maximise long-term capital growth by investing primarily in UK equities.
Risk profileThis equity based Fund invests only in those stocks, (which may includesmaller companies), which the Fund manager believes will outperform,irrespective of their benchmark weighting, and disregarding stocks mostlikely to underperform in the opinion of the Fund manager.
Equity investment is subject to specific risks relating to the performance ofthe individual companies held and the market’s perception of theirperformance. Equities are also subject to systematic risks such as generaleconomic conditions, inflation, interest rates, foreign exchange rates andindustry sector risks. In general terms, equities tend to be more volatile than bonds.
This Fund is aggressively managed, which may result in higher volatility ofthe Fund’s performance and bigger differences between the performanceof the Fund and its benchmark when compared to core funds.
Funds that invest predominantly in a single market, asset class or sectormay be subject to greater volatility than those funds with a more diversifiedportfolio.
Fund review• The six months under review began strongly for UK equities, helped by
positive economic data. However, eurozone sovereign debt concernsand growing uncertainty about the strength of the recovery contributedto volatility as the period progressed.
• Against this backdrop, the Fund’s preference for stocks with strong valueand/or growth characteristics resulted in it producing positive returnsand outperforming its benchmark. Positive contributors to relative returnsincluded stock selection and an overweight position in the chemicalssector, together with stock selection in pharmaceuticals and an overweightin personal goods. Detractors included stock selection in the media andfinancial services sectors.
• At the stock level, the Fund benefited most from an overweight positionin Burberry Group, the luxury goods maker, which reported a rise in second-quarter profit and received broker upgrades after it acquired fifty storesin China, which had previously been operated by franchise partner KwokHang Holdings. An overweight position in Croda International was alsopositive as the chemical producer reported better-than-expected first-halfearnings and said strong trading was continuing in the second half.
• Stock-level detractors included an overweight position in newspaperpublisher Trinity Mirror, which reported disappointing interim earningsand said its circulation figures and advertising revenues fell over thefirst four months of 2010. An overweight position in CSR was alsodetrimental after the chipmaker’s third-quarter revenue guidance fellshort of analysts’ estimates due to caution on the economic outlook.
• However, the Fund was boosted by an overweight position in Abcam, theantibody supplier, which said fiscal full-year earnings will be ahead ofexpectations as the weak pound and cost-cutting measures have liftedsales and profits.
You should remember that past performance is not a guide to the future. The price of investments and the income from them may fall as well as rise andinvestors may not get back the full amount invested. For specific risks, please read the Simplified Prospectus.All performance returns are calculated using the quoted price of the accumulation shares. Performance returns are in Sterling.FX Adjusted returns have been calculated by JPMAM. Blended benchmarks have been calculated by JPMAM.Source: J.P. Morgan.Source: FTSE International Limited (“FTSE”) © FTSE [2010]. “FTSE®” is a trade mark of London Stock Exchange Plc and The Financial Times Limited and is used by FTSE International Limited under licence. All rights inthe FTSE indices and/or FTSE ratings vest in FTSE and/or its licensors. Neither FTSE nor its licensors accept any liability for any errors or omissions in the FTSE indices and/or FTSE ratings or underlying data. No furtherdistribution of FTSE Data is permitted without FTSE’s express written consent.
Fund outlook• Volatility may persist in the short-term given the ongoing uncertainty
over the global economic outlook. However, UK equities are supportedby low interest rates, while valuations are attractive both compared tohistory and compared to bonds.
Rolling 12 month performance as at 31 July2010/2009 2009/2008 2008/2007 2007/2006 2006/2005
JPM UK Dynamic A-Class Acc 16.5% -15.6% -11.7% 14.2% 28.3%
JPM UK Dynamic B-Class Acc 17.1% -15.1% – – –
Benchmark Index 19.4% -10.5% -13.3% 13.0% 17.3%
Six month performance31/01/10–31/07/10
JPM UK Dynamic A-Class Acc 6.3%
Benchmark Index 4.0%
Fund statisticsFund size £219.8m
Benchmark Index FTSE All-Share (Total Return Net)
Fund chargesA-Class Initial 4.25%, Annual 1.50%B-Class Initial Nil, Annual 1.00%
Top ten holdings %HSBC 6.3Vodafone Group 5.4BP 5.0AstraZeneca 4.3BHP Billiton 3.7Standard Chartered 3.6Burberry Group 3.1Royal Dutch Shell ‘A’ 3.0Imperial Tobacco Group 2.2Lloyds Banking Group 2.2

157
ContinuationReturn to Index�
�
Sector breakdown %Industrials 18.4Financials 17.4Oil & gas 12.4Basic materials 11.5Consumer services 10.2Consumer goods 9.0Health care 7.0Telecommunications 5.4Technology 4.7Utilities 1.7Net other assets 2.3
Highest/lowest share price and distribution recordDistribution
Highest Lowest per shareCalendar year share price share price (net)
A-Class Accumulation Shares
2005 79.65p 60.07p 0.76p
2006 101.2p 80.13p 0.95p
2007 108.7p 92.43p 1.31p
2008 104.5p 59.99p 1.35p
2009 88.64p 57.47p 2.24p
2010A 97.34p 80.07p 1.08p
A-Class Income Shares
2005 75.74p 57.79p 0.73p
2006 95.16p 76.19p 0.90p
2007 101.5p 85.77p 1.24p
2008 96.69p 54.83p 1.25p
2009 78.51p 51.80p 2.03p
2010A 85.83p 70.60p 0.96p
B-Class Accumulation SharesB
2007 105.1p 98.00p –
2008 105.2p 60.54p 1.36p
2009 89.93p 58.11p 2.64p
2010A 99.03p 81.54p 1.56p
A To 31 July 2010.B B-Class Accumulation Shares were launched on 20 November 2007.
Portfolio turnover rate31.07.09 304.34%
31.07.10 304.27%
The portfolio turnover rate (PTR) reflects the total of security purchases and sales, less the total of shareissues and cancellations, expressed as a percentage of the average daily net asset values over the period.
Net asset values and Total expense ratiosNet assetvalue per Net asset Total
share class Number value per expenseDate £’000 of shares share ratio
A-Class Accumulation Shares
31.01.08 159,372 174,599,046 91.28p 1.64%
31.01.09 153,505 230,813,837 66.51p 1.66%
31.01.10 133,081 160,321,157 83.01p 1.67%
31.07.10 121,078 137,541,834 88.03p 1.68%
A-Class Income Shares
31.01.08 293,817 348,047,501 84.42p 1.64%
31.01.09 137,409 229,204,177 59.95p 1.67%
31.01.10 99,639 136,234,500 73.14p 1.67%
31.07.10 95,102 123,419,597 77.06p 1.68%
B-Class Accumulation Shares
31.01.08 855 931,900 91.76p 1.15%
31.01.09 3,147 4,682,069 67.22p 1.13%
31.01.10 3,485 4,132,104 84.35p 1.14%
31.07.10 3,593 4,005,804 89.68p 1.15%
The Net asset value and the Net asset value per income share are shown ex-dividend.
The total expense ratio (TER) takes into account the ACD fee and any fixed expenses charged to revenue overthe financial period, expressed as a percentage of the average daily net asset values over the same period.

158
ContinuationReturn to Index�
�
Portfolio statementAs at 31 July 2010
Market value Total netInvestment Holding £’000 assets %
Industrials – 18.4% (16.1%)Aerospace & defence – 2.7%Meggitt 1,096,142 3,308 1.5Senior 2,087,620 2,691 1.2Electronics & electrical equipment – 0.2%Chloride Group 134,716 503 0.2General industrials – 1.6%Smith (DS) 1,416,258 2,042 0.9Tomkins 467,101 1,515 0.7Industrial engineering – 6.4%Bodycote International 873,777 1,998 0.9Charter International 164,584 1,181 0.5IMI 626,304 4,462 2.0Melrose 701,051 1,636 0.7Spirax Sarco Engineering 237,220 3,675 1.7Weir Group 115,896 1,357 0.6Support services – 7.5%Aggreko 225,794 3,455 1.6BSS Group 345,449 1,552 0.7CapeB 808,430 2,116 1.0Diploma 134,443 337 0.2Filtrona 1,323,362 3,177 1.5Galiform 1,681,573 1,207 0.6Northgate 975,851 1,771 0.8Premier Farnell 1,018,064 2,435 1.1
Financials – 17.4% (17.3%)Banks – 12.1%HSBC 2,109,023 13,858 6.3Lloyds Banking Group 6,776,329 4,735 2.2Standard Chartered 428,042 7,998 3.6General financial – 1.4%Close Brothers Group 92,603 628 0.3Paragon Group of Companies 1,018,348 1,382 0.6Tullett Prebon 326,230 1,141 0.5Life insurance – 2.0%Legal & General Group 2,730,077 2,486 1.1Old Mutual 1,595,774 1,953 0.9Nonlife insurance – 1.2%Brit Insurance 97,524 973 0.4Lancashire Holdings 321,652 1,727 0.8Real estate – 0.7%Unite Group 778,974 1,501 0.7
Oil & gas – 12.4% (14.2%)Oil & gas producers – 11.6%Bowleven 2,075,438 3,248 1.5BP 2,730,849 11,087 5.0Chariot Oil & Gas 1,510,870 1,847 0.8Dana Petroleum 52,621 900 0.4Essar Energy 449,894 1,900 0.9Royal Dutch Shell ‘A’ (GBP) 126,835 2,250 1.0Royal Dutch Shell ‘A’ (EUR) 250,102 4,440 2.0Oil equipment, services & distribution – 0.8%Lamprell 649,968 1,763 0.8
Basic materials – 11.5% (15.5%)Chemicals – 3.2%Croda International 352,118 4,535 2.1Victrex 197,040 2,392 1.1Mining – 8.3%Avocet MiningB 1,342,192 1,601 0.7BHP Billiton 410,028 8,018 3.7Centamin Egypt 1,599,322 2,449 1.1Rio Tinto 140,606 4,667 2.1Xstrata 156,618 1,606 0.7
Market value Total netInvestment Holding £’000 assets %
Consumer services – 10.2% (12.7%)Food & drug retails – 0.6%Sainsbury (J) 391,933 1,351 0.6General retailers – 1.7%ASOS 134,393 1,240 0.6Next 52,061 1,124 0.5Sports Direct International 1,133,000 1,267 0.6Media – 5.4%British Sky Broadcasting Group 202,073 1,445 0.7Informa 582,628 2,294 1.0Mecom 940,440 2,060 0.9Pearson 278,829 2,763 1.3United Business Media 604,173 3,290 1.5Travel & leisure – 2.5%Arriva 430,423 3,317 1.5Whitbread 155,814 2,220 1.0
Consumer goods – 9.0% (10.6%)Beverages – 1.5%Britvic 682,521 3,295 1.5Food producers – 2.0%Dairy Crest Group 612,757 2,373 1.1New Britain Palm Oil 410,795 2,034 0.9Personal goods – 3.3%Burberry Group 801,764 6,795 3.1SSL International 27,653 326 0.2Tobacco – 2.2%Imperial Tobacco Group 262,122 4,773 2.2
Health care – 7.0% (6.4%)Pharmaceuticals & biotechnology – 7.0%Abcam 236,437 3,577 1.6AstraZeneca 288,087 9,373 4.3Shire 171,110 2,503 1.1
Telecommunications – 5.4% (3.8%)Mobile telecommunications – 5.4%Vodafone Group 7,965,157 11,928 5.4
Technology – 4.7% (3.9%)Software & computer services – 1.2%Blinkx 1,379,608 800 0.4Dimension Data 1,458,296 1,789 0.8Technology hardware & equipment – 3.5%ARM Holdings 775,333 2,559 1.2Nanoco Group 933,469 821 0.4Pace 1,775,851 3,744 1.7Promethean World 243,419 326 0.2
Utilities – 1.7% (1.1%)Electricity – 0.5%Drax Group 299,426 1,158 0.5Gas, water & multiutilities – 1.2%Northumbrian Water Group 393,729 1,328 0.6Pennon Group 219,831 1,308 0.6
Futures – 0.0% (0.1%)
Investment assets 214,684 97.7
Net other assets 5,089 2.3
Net assets 219,773 100.0
Unless otherwise stated the above securities are admitted to official stock exchange listings or trade on aregulated market.
The comparative percentage figures in brackets are at 31 January 2010.B Quoted on Alternative Investment Market

159
ContinuationReturn to Index�
�
£’000
Total of all purchases for the period 355,732
Major purchases Cost
BP 35,747HSBC 26,965Rio Tinto 17,063BHP Billiton 13,255Anglo American 10,222Lloyds Banking Group 9,779ARM Holdings 8,501Royal Dutch Shell ‘A’ (EUR) 8,102Barclays 7,469AstraZeneca 7,328Aggreko 7,077Royal Dutch Shell ‘A’ (GBP) 6,491Centrica 6,304Reckitt Benckiser Group 5,280Imperial Tobacco Group 5,160Cookson Group 4,905Shire 4,897Vodafone Group 4,877Rentokil Initial 4,771Lamprell 4,534
£’000
Total of all sales for the period 393,416
Major sales Proceeds
BP 39,402HSBC 28,875Rio Tinto 22,625Anglo American 17,490GlaxoSmithKline 10,499Cookson Group 9,497Barclays 8,357Kazakhmys 8,107Aggreko 8,064Eurasian Natural Resources 7,549Imperial Tobacco Group 7,246ARM Holdings 7,225Royal Dutch Shell ‘B’ 7,127Royal Dutch Shell ‘A’ (GBP) 6,492Centrica 6,362GKN 6,308Xstrata 5,354Reckitt Benckiser Group 5,299Lloyds Banking Group 5,159Daily Mail & General Trust ‘A’ Non-Voting 5,120
Portfolio movements For the six months ended 31 July 2010

160
Return to Index�
Financial statements
Statement of total return(Unaudited)
For the six months ended 31 July2010 2009
£’000 £’000 £’000 £’000
Income
Net capital gains 12,739 26,189
Revenue 3,768 7,721
Expenses (1,962) (2,254)
Finance costs: Interest (3) (3)
Net revenue before taxation 1,803 5,464
Taxation (26) (121)
Net revenue after taxation 1,777 5,343
Total return before distributions 14,516 31,532
Finance costs: Distributions (1,774) (5,345)
Change in net assets attributable to shareholders from investment activities 12,742 26,187
Statement of change in net assets attributable to shareholders(Unaudited)
For the six months ended 31 July2010 2009
£’000 £’000 £’000 £’000
Opening net assets attributable to shareholders 236,205 294,061
Amounts receivable on issue of shares 3,277 3,317
Amounts payable on cancellation of shares (33,278) (46,586)
(30,001) (43,269)
Change in net assets attributable to shareholders from investment activities (see above) 12,742 26,187
Retained distributions on accumulation shares 930 2,451
Stamp duty reserve tax (103) (43)
Closing net assets attributable to shareholders 219,773 279,387
As the comparatives in the above table are for the previous interim period, the Net assets at the end ofthat period will not agree to the Net assets at the start of the current period.
Balance sheet(Unaudited)
As at31 July 2010 31 January 2010
£’000 £’000 £’000 £’000
ASSETS
Investment assets 214,684 239,984
Debtors 12,205 16,425
Cash and bank balances 3 11,010
Total other assets 12,208 27,435
Total assets 226,892 267,419
LIABILITIES
Investment liabilities – (281)
Creditors (609) (30,402)
Bank overdraft (5,806) –
Distribution payable on income shares (704) (531)
Total other liabilities (7,119) (30,933)
Total liabilities (7,119) (31,214)
Net assets attributable to shareholders 219,773 236,205

161
ContinuationReturn to Index�
�
JPM UK Equity & Bond Income Fund
Investment objective and policyTo provide a high and stable income, with the prospect of capital and income growth over the long term, by investing in a balanced portfolio of securities. The Fund currently invests predominantly in a balanced portfolioof blue-chip UK equities, gilt edged securities and other UK fixed interestinstruments. The Fund may invest up to 100% in government and otherpublic securities (see section 3.10(e) of the full Prospectus).
Risk profileThis Fund invests in both equities (which may include smaller companies)and bonds.
Equity investment is subject to specific risks relating to the performance ofthe individual companies held and the market’s perception of theirperformance. Equities are also subject to systematic risks such as generaleconomic conditions, inflation, interest rates, foreign exchange rates andindustry sector risks. In general terms, equities tend to be more volatile than bonds.
Bond prices can fluctuate significantly depending not only on the globaleconomic and interest rate conditions but also on the general credit marketenvironment and the creditworthiness of the issuer.
This Fund charges the fees of the ACD against capital, which will increasethe amount of income available for distribution to Shareholders, but mayconstrain capital growth. It may also have tax implications for certain investors.
Funds that invest predominantly in a single market, asset class or sectormay be subject to greater volatility than those funds with a more diversifiedportfolio.
Fund review• The six months under review began strongly for UK equities and corporate
bonds, as investor sentiment was boosted by positive economic data.However, eurozone sovereign debt concerns and growing uncertaintyabout the strength of the recovery contributed to rising risk aversion asthe period progressed, benefiting government bonds.
• Against this backdrop, the Fund produced positive returns and moderatelyoutperformed its benchmark. In the equity portfolio, positive contributorsto relative returns included stock selection and overweight positions inthe general industrials and industrial engineering sectors. Stock selectionin the oil & gas producers and banks sectors detracted.
• At the stock level, the Fund benefited most from an overweight positionin Tomkins, the engineering group, which agreed to be acquired by Canadianprivate equity firm Onex Corp. and the Canadian Pension Plan InvestmentBoard for GBP 2.89 billion. The biggest stock-level detractor was anoverweight position in BP, which was attractively valued, but which fellheavily following an explosion on one of its oil platforms in the Gulf ofMexico.
• In the bond portfolio, we maintained a strategic underweight position incorporate bonds and were overweight UK sovereign debt. We added someadditional credit exposure at the beginning of March as positive corporateearnings were supportive for credit markets and balance sheets continuedto look strong. In May, we saw strong outperformance of UK Gilts, whichproved to be a useful hedge as risk assets suffered.
You should remember that past performance is not a guide to the future. The price of investments and the income from them may fall as well as rise andinvestors may not get back the full amount invested. For specific risks, please read the Simplified Prospectus.All performance returns are calculated using the quoted price of the accumulation shares. Performance returns are in Sterling.FX Adjusted returns have been calculated by JPMAM. Blended benchmarks have been calculated by JPMAM.Source: J.P. Morgan.Source: FTSE International Limited (“FTSE”) © FTSE [2010]. “FTSE®” is a trade mark of London Stock Exchange Plc and The Financial Times Limited and is used by FTSE International Limited under licence. All rights inthe FTSE indices and/or FTSE ratings vest in FTSE and/or its licensors. Neither FTSE nor its licensors accept any liability for any errors or omissions in the FTSE indices and/or FTSE ratings or underlying data. No furtherdistribution of FTSE Data is permitted without FTSE’s express written consent.
Fund outlook• The projected low growth and low interest rate environment remains
supportive for bonds. Meanwhile, equity valuations are attractive, althoughmarkets are likely to remain volatile in the short-term given uncertaintyover the economic outlook.
Rolling 12 month performance as at 31 July2010/2009 2009/2008 2008/2007 2007/2006 2006/2005
JPM UK Equity & Bond IncomeA-Class Acc 15.3% -7.2% -12.4% 5.3% 10.3%
Benchmark Index 16.3% -4.9% -8.0% 8.9% 13.0%
Six month performance31/01/10–31/07/10
JPM UK Equity & Bond Income A-Class Acc 4.7%
Benchmark Index 4.3%
Fund statisticsFund size £171.9m
Benchmark Index 70% FTSE All-Share/30% Merrill Lynch AA+Eurosterling Index
Fund charges Initial 3.50%, Annual 1.50%
Top ten holdings %Royal Dutch Shell ‘B’ 6.1Vodafone Group 4.6HSBC 4.5BP 4.0AstraZeneca 3.4BHP Billiton 3.1GlaxoSmithKline 3.0British American Tobacco 3.0Rio Tinto 2.5Barclays 1.9

162
ContinuationReturn to Index�
�
Sector breakdown %Financials 16.5Corporate bonds 15.4Oil & gas 11.1Basic materials 10.6Government bonds 9.5Consumer goods 7.9Industrials 7.6Consumer services 6.9Health care 6.4Telecommunications 5.4Utilities 0.7Technology 0.7Net other assets 1.3
Highest/lowest share price and distribution recordDistribution
Highest Lowest per shareCalendar year share price share price (net)
A-Class Accumulation Shares
2005 90.51p 77.86p 3.37p
2006 99.68p 88.74p 3.32p
2007 103.5p 92.70p 3.64p
2008 96.53p 67.03p 3.79p
2009 90.63p 65.29p 3.37p
2010A 97.14p 85.92p 2.45p
A-Class Income Shares
2005 76.48p 67.80p 2.93p
2006 81.32p 73.60p 2.76p
2007 82.99p 73.02p 2.93p
2008 75.91p 51.14p 2.94p
2009 65.27p 48.65p 2.49p
2010A 69.31p 60.64p 1.75p
A To 31 July 2010.
Portfolio turnover rate31.07.09 43.81%
31.07.10 42.11%
The portfolio turnover rate (PTR) reflects the total of security purchases and sales, less the total of shareissues and cancellations, expressed as a percentage of the average daily net asset values over the period.
Net asset values and Total expense ratiosNet assetvalue per Net asset Total
share class Number value per expenseDate £’000 of shares share ratio
A-Class Accumulation Shares
31.01.08 135,337 153,305,617 88.28p 1.65%
31.01.09 96,849 135,359,068 71.55p 1.67%
31.01.10 104,334 118,632,267 87.95p 1.67%
31.07.10 102,473 111,343,128 92.03p 1.68%
A-Class Income Shares
31.01.08 99,150 143,816,611 68.94p 1.64%
31.01.09 68,719 128,924,237 53.30p 1.67%
31.01.10 71,307 113,639,668 62.75p 1.67%
31.07.10 69,401 107,731,598 64.42p 1.68%
The Net asset value and the Net asset value per income share are shown ex-dividend.
The total expense ratio (TER) takes into account the ACD fee and any fixed expenses charged to revenue overthe financial period, expressed as a percentage of the average daily net asset values over the same period.

163
ContinuationReturn to Index�
�
Market value Total netInvestment Holding £’000 assets %
Portfolio statementAs at 31 July 2010
Fixed interest – 15.4% (22.2%)Corporate bonds – 15.4% (12.3%)Non-convertible – 15.4%Bank of Scotland 9.375% 2021 £1,750,000 1,957 1.1Centrica 5.875% 2012 £1,000,000 1,074 0.6Citigroup 5.125% 2018 £2,000,000 1,830 1.1EDF 5.875% 2031 £1,000,000 1,066 0.6France Telecom 8% 2017 £1,000,000 1,248 0.7GE Capital Funding 6.75% 2018 £1,000,000 1,130 0.7General Electric Capital 6.25% 2020 £1,691,000 1,838 1.1GlaxoSmithKline Capital 5.25% 2033 £1,500,000 1,524 0.9KFW International Finance 3.25% 2014 £1,000,000 1,040 0.6LCR Finance 4.75% 2010 £2,675,000 2,717 1.6National Westminster Bank 6.5% 2021 £1,200,000 1,128 0.7Procter & Gamble 6.25% 2030 £1,597,000 1,850 1.1 SLM Student Loan Trust 5.15% 2015 £1,539,000 1,497 0.9 Tesco 6.625% 2010 £1,400,000 1,414 0.8 United Parcels 5.5% 2031 £2,000,000 2,113 1.2 Wal-Mart Stores 4.75% 2013 £1,500,000 1,609 0.9 Wal-Mart Stores 5.75% 2030 £1,317,000 1,456 0.8
Government bonds – 9.5% (9.9%)International authority – 5.7%Bank Nederlandse Gemeenten 5.375% 2021 £889,000 998 0.6 European Investment Bank 6.25% 2014 £2,500,000 2,863 1.7 European Investment Bank 5.625% 2032 £560,000 645 0.4 International Bank for Reconstruction &
Development 5.75% 2032 £400,000 476 0.3 International Finance
Corporation 5.375% 2028 £2,043,000 2,288 1.3 Reseau Ferre de France 5.25% 2028 £2,145,000 2,314 1.4 Sovereign debt – 3.8%Italy 6% 2028 £1,500,000 1,564 0.9 Treasury 8% 2013 £1,300,000 1,565 0.9 Treasury 8% 2021 £1,380,000 1,953 1.1 Treasury 4.75% 2038 £1,500,000 1,616 0.9
UK equities – 73.8% (73.6%)Financials – 16.5% (16.2%)Banks – 8.9%Barclays 972,426 3,240 1.9 HSBC 1,178,365 7,743 4.5 Lloyds Banking Group 2,710,355 1,894 1.1 Royal Bank of Scotland Group 737,857 369 0.2 Standard Chartered 108,112 2,020 1.2 General financial – 3.3%Brewin Dolphin 12,888 16 – City of London Investment GroupB 11,329 31 – GlobeOp Financial Services 24,759 67 – Hargreaves Lansdown 121,915 441 0.3 IG Group 41,074 195 0.1 International Personal Finance 49,434 118 0.1 Investec 363,390 1,807 1.0 JPMorgan Income & Growth Investment
Trust (Income) 3,405,927 2,197 1.3 Tullett Prebon 237,711 831 0.5 Life insurance – 1.8%Aviva 198,314 719 0.4 Chesnara 40,816 85 0.1 Legal & General Group 2,137,677 1,946 1.1 Old Mutual 346,387 424 0.2 Nonlife insurance – 2.0%Admiral Group 49,012 716 0.4 Amlin 298,578 1,274 0.7 Beazley Group 440,725 526 0.3 Catlin Group 162,412 623 0.4 Hardy Underwriting Bermuda 14,682 32 –Lancashire Holdings 49,519 266 0.2 Real estate – 0.5%CLS 12,855 57 –ING UK Real Estate Income Trust 121,000 58 –LSL Property Services 37,580 97 0.1 Minerva 78,310 80 –Quintain Estates & Development 226,465 92 0.1 Safestore 10,273 12 –Shaftesbury 115,136 465 0.3 Unite Group 8,629 17 –
Market value Total netInvestment Holding £’000 assets %
Oil & gas – 11.1% (14.7%)Oil & gas producers – 11.1%Aurelian Oil & Gas 64,005 24 –BG Group 146,332 1,485 0.9 Bowleven 24,600 38 –BP 1,668,715 6,775 4.0 Gulfsands Petroleum 6,200 18 –Nautical Petroleum 30,934 41 –Nighthawk Energy 63,231 17 –Royal Dutch Shell ‘B’ 617,705 10,526 6.1 Salamander Energy 15,454 38 –Valiant PetroleumB 7,583 52 0.1 Oil equipment, services & distribution – 0.0%Kentz Group 18,159 44 –
Basic materials – 10.6% (10.0%)Chemicals – 0.3%Elementis 221,907 165 0.1 Victrex 13,864 168 0.1 Yule Catto & Co 68,835 142 0.1 Forestry & paper – 1.1%Mondi 412,429 1,865 1.1 Mining – 9.2%Anglo American 106,686 2,717 1.6 Anglo Pacific Group 42,242 108 0.1 Avocet MiningB 13,200 16 –BHP Billiton 268,904 5,258 3.1 Cove Energy 173,474 115 0.1 Eurasian Natural Resources 151,607 1,368 0.8 Ferrexpo 388,470 1,090 0.6 International Ferro Metals 156,860 46 –Kazakhmys 26,646 326 0.2 Rio Tinto 131,555 4,367 2.5 Xstrata 33,419 343 0.2
Consumer goods – 7.9% (7.1%)Automobiles & parts – 0.2% GKN 266,400 360 0.2 Beverages – 1.0%Britvic 233,050 1,125 0.7 SABMiller 23,388 451 0.3 Food producers – 2.4%Cranswick 34,002 298 0.2 Dairy Crest Group 146,580 568 0.3 Devro 62,946 131 0.1 Hilton Food Group 40,975 103 0.1 MP Evans GroupB 5,032 18 –PureCircleB 7,300 13 –Robert Wiseman Dairies 25,069 125 0.1 Unilever 154,539 2,814 1.6 Household goods – 1.1%Barratt Developments 418,572 403 0.2 Bellway 45,353 262 0.2 Dunelm Group 73,478 285 0.2 Reckitt Benckiser Group 25,146 787 0.5 Personal goods – 0.2%Supergroup 40,103 385 0.2 Tobacco – 3.0%British American Tobacco 233,431 5,169 3.0
Industrials – 7.6% (6.0%)Aerospace & defence – 0.4%Aero Inventory* 8,021 – –Chemring Group 535 16 –Hampson Industries 113,186 68 –Rolls Royce Group 115,840 678 0.4 Construction & materials – 0.0%Costain 19,426 37 –Electronics & electrical equipment – 0.1%Dialight 12,461 42 –Oxford Instruments 20,500 65 0.1 Renishaw 2,100 17 –TT electronics 34,665 37 –Volex Group 24,800 51 –

164
ContinuationReturn to Index�
�
Portfolio statement – continuedAs at 31 July 2010
Market value Total netInvestment Holding £’000 assets %
General industrials – 1.8%RPC Group 40,580 108 0.1 Smith (DS) 428,666 618 0.3 Smiths Group 39,234 439 0.3 Tomkins 572,426 1,856 1.1 Industrial engineering – 2.2%Charter International 32,968 237 0.1 Fenner 47,685 106 0.1 Hill & Smith 32,043 94 0.1 IMI 212,868 1,517 0.9 Senior 481,587 621 0.3 Weir Group 105,575 1,236 0.7 Industrial transportation – 0.1%Braemar Shipping Services 10,698 52 0.1 Clarkson 5,500 47 –Goldenport 22,382 28 –Support services – 3.0%Aggreko 33,112 507 0.3 Atkins (WS) 69,795 509 0.3 Brammer 56,990 88 0.1 BSS Group 43,885 197 0.1 CapeB 29,945 78 –CPP 122,107 294 0.2 Davis Service Group 154,446 580 0.3 Diploma 50,781 127 0.1 eaga 203,444 217 0.1 Education Development International 15,020 14 –Electrocomponents 465,110 1,045 0.6 Fiberweb 66,391 40 –Filtrona 238,233 572 0.3 Galiform 87,111 63 –Hargreaves ServicesB 4,108 25 –Harvey Nash Group 53,317 22 –Healthcare LocumsB 44,241 71 0.1 Hyder Consulting 39,414 134 0.1 Interserve 40,300 80 0.1 John Menzies 23,500 93 0.1 Robert Walters 30,123 68 –SThree 87,117 227 0.1 Tribal Group 38,537 24 –WSP Group 24,843 83 0.1
Consumer services – 6.9% (6.1%)Food & drug retailers – 0.8%Sainsbury (J) 152,400 525 0.3 Tesco 208,140 821 0.5 General retailers – 2.3%Brown (N.) Group 54,934 125 0.1 H&T Group 9,339 22 –Halfords Group 225,704 1,091 0.6 JD Sports Fashion 31,561 241 0.2 JJB Sports 258,765 30 –Lookers 109,088 59 –Next 113,662 2,454 1.4 Pendragon 239,580 58 –Media – 1.4%Chime Communications 36,934 63 0.1 Creston 21,454 20 –Daily Mail & General Trust ‘A’ Non-Voting 164,055 805 0.5 Entertainment One 24,800 19 –Euromoney Institutional Investor 24,255 145 0.1 ITE Group 38,477 57 –ITV 690,998 363 0.2 Trinity Mirror 83,950 90 0.1 WPP 96,962 658 0.4 Travel & leisure – 2.4%Avis Europe 160,177 34 –Cineworld Group 5,736 11 –Compass Group 259,492 1,390 0.8 Domino’s Pizza 6,850 28 –Goals Soccer CentresB 8,927 11 –Intercontinental Hotels Group 46,090 512 0.3 Mitchells & Butlers 81,169 254 0.2 Rank Group 166,948 196 0.1 Restaurant Group 96,130 217 0.1 Stagecoach Group 785,615 1,342 0.8 The Hotel Corporation 15,591 16 –Whitbread 16,840 240 0.1
Market value Total netInvestment Holding £’000 assets %
Health care – 6.4% (6.8%)Health care equipment & services – 0.0%CaretechB 7,718 23 –Immunodiagnostic Systems 2,848 21 –Optos 11,330 11 –Southern Cross Healthcare Group 79,447 25 –Pharmaceuticals & biotechnology – 6.4%Abcam 2,795 42 –AstraZeneca 179,223 5,831 3.4 GlaxoSmithKline 462,991 5,176 3.0 ProStrakan Group 65,889 48 –
Telecommunications – 5.4% (4.4%)Fixed line telecommunications – 0.8%Alternative NetworksB 18,424 29 –BT Group 794,383 1,136 0.7 KCOM Group 213,145 100 0.1 Mobile telecommunications – 4.6%Vodafone Group 5,291,887 7,925 4.6
Utilities – 0.7% (0.8%)Electricity – 0.2%Drax Group 101,463 393 0.2 OPG Power VentureB 38,988 30 –Gas, water & multiutilities – 0.5%Centrica 244,028 753 0.4 National Grid 36,404 190 0.1
Technology – 0.7% (1.5%)Software & computer services – 0.7%Advanced Computer Software 49,867 16 –Alterian 30,200 47 –Anite 10,766 5 –Aveva Group 5,157 69 –Computacenter 217,974 600 0.4 Intec Telecom Systems 119,155 86 0.1 Kofax 37,236 90 0.1 Micro Focus International 17,976 75 0.1 NCC Group 15,079 66 –Technology hardware & equipment – 0.0%CSR 7,900 27 –Pace 19,721 42 –Promethean World 24,654 33 –Wolfson Microelectronics 41,838 72 –
Investment assets 169,666 98.7
Net other assets 2,208 1.3
Net assets 171,874 100.0
Unless otherwise stated the above securities are admitted to official stock exchange listings or trade on aregulated market.
The comparative percentage figures in brackets are at 31 January 2010.B Quoted on Alternative Investment Market* Delisted security
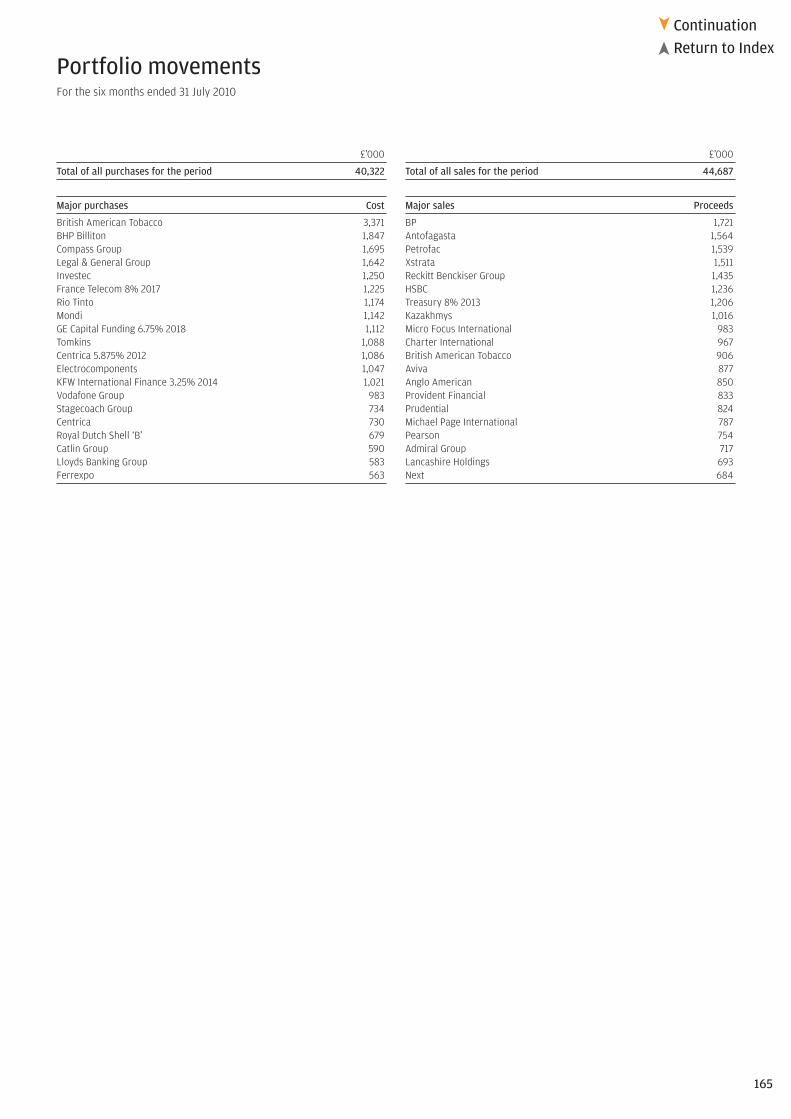
165
ContinuationReturn to Index�
�
£’000
Total of all purchases for the period 40,322
Major purchases Cost
British American Tobacco 3,371BHP Billiton 1,847Compass Group 1,695Legal & General Group 1,642Investec 1,250France Telecom 8% 2017 1,225Rio Tinto 1,174Mondi 1,142GE Capital Funding 6.75% 2018 1,112Tomkins 1,088Centrica 5.875% 2012 1,086Electrocomponents 1,047KFW International Finance 3.25% 2014 1,021Vodafone Group 983Stagecoach Group 734Centrica 730Royal Dutch Shell ‘B’ 679Catlin Group 590Lloyds Banking Group 583Ferrexpo 563
£’000
Total of all sales for the period 44,687
Major sales Proceeds
BP 1,721Antofagasta 1,564Petrofac 1,539Xstrata 1,511Reckitt Benckiser Group 1,435HSBC 1,236Treasury 8% 2013 1,206Kazakhmys 1,016Micro Focus International 983Charter International 967British American Tobacco 906Aviva 877Anglo American 850Provident Financial 833Prudential 824Michael Page International 787Pearson 754Admiral Group 717Lancashire Holdings 693Next 684
Portfolio movements For the six months ended 31 July 2010

166
Return to Index�
Financial statements
Statement of total return(Unaudited)
For the six months ended 31 July2010 2009
£’000 £’000 £’000 £’000
Income
Net capital gains 5,822 14,440
Revenue 3,819 4,746
Expenses (1,483) (1,294)
Net revenue before taxation 2,336 3,452
Taxation (3) (75)
Net revenue after taxation 2,333 3,377
Total return before distributions 8,155 17,817
Finance costs: Distributions (3,471) (4,345)
Change in net assets attributable to shareholders from investment activities 4,684 13,472
Statement of change in net assets attributable to shareholders(Unaudited)
For the six months ended 31 July2010 2009
£’000 £’000 £’000 £’000
Opening net assets attributable to shareholders 175,641 165,568
Amounts receivable on issue of shares 237 63
Amounts payable on cancellation of shares (10,698) (12,642)
(10,461) (12,579)
Change in net assets attributable to shareholders from investment activities (see above) 4,684 13,472
Retained distributions on accumulation shares 2,014 2,479
Stamp duty reserve tax (5) (3)
Unclaimed distributions 1 1
Closing net assets attributable to shareholders 171,874 168,938
As the comparatives in the above table are for the previous interim period, the Net assets at the end ofthat period will not agree to the Net assets at the start of the current period.
Balance sheet(Unaudited)
As at31 July 2010 31 January 2010
£’000 £’000 £’000 £’000
ASSETS
Investment assets 169,666 168,342
Debtors 1,866 2,401
Cash and bank balances 1,416 7,174
Total other assets 3,282 9,575
Total assets 172,948 177,917
LIABILITIES
Investment liabilities – (1)
Creditors (481) (1,729)
Distribution payable on income shares (593) (546)
Total other liabilities (1,074) (2,275)
Total liabilities (1,074) (2,276)
Net assets attributable to shareholders 171,874 175,641

167
ContinuationReturn to Index�
�
JPM UK Focus Fund
Investment objective and policyTo provide long-term capital growth by investing in a portfolio primarily ofUK Securities.
Risk profileThis equity based Fund uses a disciplined investment process for selectingstocks and a robust portfolio construction methodology. This may includeexposure to smaller companies.
Equity investment is subject to specific risks relating to the performance ofthe individual companies held and the market’s perception of theirperformance. Equities are also subject to systematic risks such as generaleconomic conditions, inflation, interest rates, foreign exchange rates andindustry sector risks. In general terms, equities tend to be more volatile than bonds.
This Fund is aggressively managed, which may result in higher volatility ofthe Fund’s performance and bigger differences between the performanceof the Fund and its benchmark when compared to core funds.
Funds that invest predominantly in a single market, asset class or sectormay be subject to greater volatility than those funds with a more diversifiedportfolio.
Fund review• The six months under review began strongly for UK equities, helped by
positive economic data. However, eurozone sovereign debt concernsand growing uncertainty about the strength of the recovery contributedto volatility as the period progressed.
• Against this backdrop, the Fund produced a small positive return, butunderperformed its benchmark. Although stock selection in the mediasector and the Fund’s exposure to the chemicals sector contributedsignificantly to relative performance, these returns were outweighed bynegative stock selection in the health care sector. Stock selection in thebanks, consumer non durable and construction & materials sectors alsodetracted from performance.
• At the stock level, the biggest detractor was an overweight holding inSouthern Cross Healthcare, which fell heavily after reporting that losseshad widened over the six months to 31 March. The company also warnedthat lower fee settlements with local authorities would impact its full-yearresults.
• The biggest contributor to returns was an overweight holding in BSS Group,a plumbing and heating materials company, which jumped after agreeingto a GBP 553m takeover offer from builders’ merchants Travis Perkins.Overweight exposure to United Business Media was also beneficial asthe advertising group reaffirmed its 2010 earnings outlook amid a recoveryin advertising revenues. The company also settled a capital gains taxdispute for less than many investors had feared.
• In the banks sector, the Fund was hit by its overweight holding in AlliedIrish Banks, the Irish lender that suffered from sovereign debt fears asIreland’s budget deficit climbed to 14.3% of GDP in 2009 – the highest inthe eurozone. The bank raised capital to defend against rising loan losses,and passed the European bank stress tests at the end of July.
You should remember that past performance is not a guide to the future. The price of investments and the income from them may fall as well as rise andinvestors may not get back the full amount invested. For specific risks, please read the Simplified Prospectus.All performance returns are calculated using the quoted price of the accumulation shares. Performance returns are in Sterling.FX Adjusted returns have been calculated by JPMAM. Blended benchmarks have been calculated by JPMAM.Source: J.P. Morgan.Source: FTSE International Limited (“FTSE”) © FTSE [2010]. “FTSE®” is a trade mark of London Stock Exchange Plc and The Financial Times Limited and is used by FTSE International Limited under licence. All rights inthe FTSE indices and/or FTSE ratings vest in FTSE and/or its licensors. Neither FTSE nor its licensors accept any liability for any errors or omissions in the FTSE indices and/or FTSE ratings or underlying data. No furtherdistribution of FTSE Data is permitted without FTSE’s express written consent.
• In contrast, the Fund gained from several holdings in the oil servicessector. Lamprell rose after receiving earnings upgrades on the back ofreceiving a number of new drilling contracts, while Petrofac jumped afterannouncing it would spin off its North Sea production assets, while thecompany was also boosted by new Iraq drilling contracts.
Fund outlook• Volatility may persist in the short-term given the ongoing uncertainty
over the global economic outlook. However, UK equities are supportedby low interest rates, while valuations are attractive both compared tohistory and compared to bonds.
Rolling 12 month performance as at 31 July2010/2009 2009/2008 2008/2007 2007/2006
JPM UK FocusA-Class Acc 18.3% -11.5% -19.0% 15.2%
Benchmark Index 19.4% -10.5% -13.3% 13.0%
Six month performance31/01/10–31/07/10
JPM UK Focus A-Class Acc 1.1%
Benchmark Index 4.0%
Fund statisticsFund size £52.0m
Benchmark Index FTSE All-Share (Total Return Net)
Fund charges Initial 4.25%, Annual 1.50%
Top ten holdings %Royal Dutch Shell 6.9HSBC 6.0BP 4.8Vodafone Group 3.9GlaxoSmithKline 3.8BHP Billiton 3.4Rio Tinto 2.7BG Group 2.5Unilever 2.4Lloyds Banking Group 2.3

168
ContinuationReturn to Index�
�
Sector breakdown %Oil & gas 18.7Financials 17.2Basic materials 11.3Consumer goods 9.9Consumer services 9.0Industrials 8.5Health care 8.4Telecommunications 6.1Technology 1.6Utilities 1.0Equity investment instruments 0.8Futures 0.1Net other assets 7.4
Highest/lowest share price and distribution recordDistribution
Highest Lowest per shareCalendar year share price share price (net)
A-Class Accumulation Shares
2006 54.33p 45.90p 0.18p
2007 59.82p 51.42p 0.66p
2008 54.36p 30.34p 1.06p
2009 49.36p 29.99p 1.04p
2010A 53.26p 44.06p 0.70p
A-Class Income Shares
2006 54.13p 45.90p 0.17p
2007 58.44p 49.31p 0.00p
2008 52.14p 28.63p 0.69p
2009 45.33p 27.99p 0.97p
2010A 48.70p 40.30p 0.63p
A To 31 July 2010.
Portfolio turnover rate31.07.09 11.05%
31.07.10 23.29%
The portfolio turnover rate (PTR) reflects the total of security purchases and sales, less the total of shareissues and cancellations, expressed as a percentage of the average daily net asset values over the period.
Net asset values and Total expense ratiosNet assetvalue per Net asset Total
share class Number value per expenseDate £’000 of shares share ratio
A-Class Accumulation Shares
31.01.08 58,999 125,285,153 47.09p 1.65%
31.01.09 43,057 124,970,360 34.45p 1.67%
31.01.10 39,887 84,008,210 47.48p 1.67%
31.07.10 51,999 108,260,550 48.03p 1.68%
A-Class Income Shares
31.01.08 32 72,437 44.30p 4.59%
31.01.09 29 88,339 32.16p 1.68%
31.01.10 47 107,788 43.42p 1.68%
31.07.10 49 112,825 43.49p 1.68%
The Net asset value and the Net asset value per income share are shown ex-dividend.
The total expense ratio (TER) takes into account the ACD fee and any fixed expenses charged to revenue overthe financial period, expressed as a percentage of the average daily net asset values over the same period.
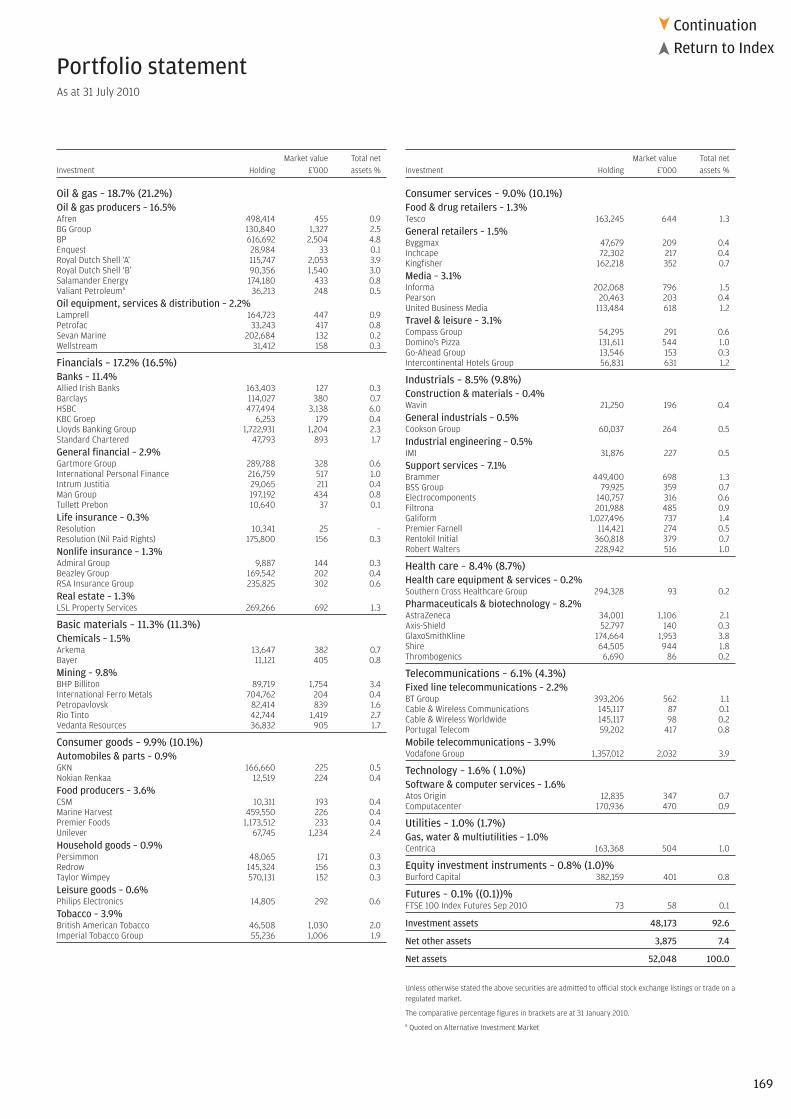
169
ContinuationReturn to Index�
�
Portfolio statementAs at 31 July 2010
Market value Total netInvestment Holding £’000 assets %
Oil & gas – 18.7% (21.2%)Oil & gas producers – 16.5%Afren 498,414 455 0.9BG Group 130,840 1,327 2.5BP 616,692 2,504 4.8Enquest 28,984 33 0.1Royal Dutch Shell ‘A’ 115,747 2,053 3.9Royal Dutch Shell ‘B’ 90,356 1,540 3.0Salamander Energy 174,180 433 0.8Valiant PetroleumB 36,213 248 0.5Oil equipment, services & distribution – 2.2%Lamprell 164,723 447 0.9Petrofac 33,243 417 0.8Sevan Marine 202,684 132 0.2Wellstream 31,412 158 0.3
Financials – 17.2% (16.5%)Banks – 11.4%Allied Irish Banks 163,403 127 0.3Barclays 114,027 380 0.7HSBC 477,494 3,138 6.0KBC Groep 6,253 179 0.4Lloyds Banking Group 1,722,931 1,204 2.3Standard Chartered 47,793 893 1.7General financial – 2.9%Gartmore Group 289,788 328 0.6International Personal Finance 216,759 517 1.0Intrum Justitia 29,065 211 0.4Man Group 197,192 434 0.8Tullett Prebon 10,640 37 0.1Life insurance – 0.3%Resolution 10,341 25 –Resolution (Nil Paid Rights) 175,800 156 0.3Nonlife insurance – 1.3%Admiral Group 9,887 144 0.3Beazley Group 169,542 202 0.4RSA Insurance Group 235,825 302 0.6Real estate – 1.3%LSL Property Services 269,266 692 1.3
Basic materials – 11.3% (11.3%)Chemicals – 1.5%Arkema 13,647 382 0.7Bayer 11,121 405 0.8Mining – 9.8%BHP Billiton 89,719 1,754 3.4International Ferro Metals 704,762 204 0.4Petropavlovsk 82,414 839 1.6Rio Tinto 42,744 1,419 2.7Vedanta Resources 36,832 905 1.7
Consumer goods – 9.9% (10.1%)Automobiles & parts – 0.9%GKN 166,660 225 0.5Nokian Renkaa 12,519 224 0.4Food producers – 3.6%CSM 10,311 193 0.4Marine Harvest 459,550 226 0.4Premier Foods 1,173,512 233 0.4Unilever 67,745 1,234 2.4Household goods – 0.9%Persimmon 48,065 171 0.3Redrow 145,324 156 0.3Taylor Wimpey 570,131 152 0.3Leisure goods – 0.6%Philips Electronics 14,805 292 0.6Tobacco – 3.9%British American Tobacco 46,508 1,030 2.0Imperial Tobacco Group 55,236 1,006 1.9
Market value Total netInvestment Holding £’000 assets %
Consumer services – 9.0% (10.1%)Food & drug retailers – 1.3%Tesco 163,245 644 1.3General retailers – 1.5%Byggmax 47,679 209 0.4Inchcape 72,302 217 0.4Kingfisher 162,218 352 0.7Media – 3.1%Informa 202,068 796 1.5Pearson 20,463 203 0.4United Business Media 113,484 618 1.2Travel & leisure – 3.1%Compass Group 54,295 291 0.6Domino’s Pizza 131,611 544 1.0Go-Ahead Group 13,546 153 0.3Intercontinental Hotels Group 56,831 631 1.2
Industrials – 8.5% (9.8%)Construction & materials – 0.4%Wavin 21,250 196 0.4General industrials – 0.5%Cookson Group 60,037 264 0.5Industrial engineering – 0.5%IMI 31,876 227 0.5Support services – 7.1%Brammer 449,400 698 1.3BSS Group 79,925 359 0.7Electrocomponents 140,757 316 0.6Filtrona 201,988 485 0.9Galiform 1,027,496 737 1.4Premier Farnell 114,421 274 0.5Rentokil Initial 360,818 379 0.7Robert Walters 228,942 516 1.0
Health care – 8.4% (8.7%)Health care equipment & services – 0.2%Southern Cross Healthcare Group 294,328 93 0.2Pharmaceuticals & biotechnology – 8.2%AstraZeneca 34,001 1,106 2.1Axis-Shield 52,797 140 0.3GlaxoSmithKline 174,664 1,953 3.8Shire 64,505 944 1.8Thrombogenics 6,690 86 0.2
Telecommunications – 6.1% (4.3%)Fixed line telecommunications – 2.2%BT Group 393,206 562 1.1Cable & Wireless Communications 145,117 87 0.1Cable & Wireless Worldwide 145,117 98 0.2Portugal Telecom 59,202 417 0.8Mobile telecommunications – 3.9%Vodafone Group 1,357,012 2,032 3.9
Technology – 1.6% ( 1.0%)Software & computer services – 1.6%Atos Origin 12,835 347 0.7Computacenter 170,936 470 0.9
Utilities – 1.0% (1.7%)Gas, water & multiutilities – 1.0%Centrica 163,368 504 1.0
Equity investment instruments – 0.8% (1.0)%Burford Capital 382,159 401 0.8
Futures – 0.1% ((0.1))%FTSE 100 Index Futures Sep 2010 73 58 0.1
Investment assets 48,173 92.6
Net other assets 3,875 7.4
Net assets 52,048 100.0
Unless otherwise stated the above securities are admitted to official stock exchange listings or trade on aregulated market.
The comparative percentage figures in brackets are at 31 January 2010.B Quoted on Alternative Investment Market

170
ContinuationReturn to Index�
�
£’000
Total of all purchases for the period 15,597
Major purchases Cost
HSBC 751GlaxoSmithKline 727BP 598Royal Dutch Shell ‘A’ 507BT Group 493Vodafone Group 490Centrica 477Rentokil Initial 458Lloyds Banking Group 456Atos Origin 428Portugal Telecom 417BHP Billiton 414Royal Dutch Shell ‘B’ 384Gartmore Group 368Kingfisher 364BG Group 347Rio Tinto 332Philips Electronics 323Unilever 317Cookson Group 306
£’000
Total of all sales for the period 5,669
Major sales Proceeds
International Power 677Vodafone Group 414Jeronimo Martins 394Reed Elsevier 354Man Group 316Greene King 315British American Tobacco 306Delta 296Brammer 281Zurich Financial Services 266Galiform 246Carillion 227Intercontinental Hotels Group 219Ahold 215Nokian Renkaa 205AstraZeneca 202T.Clarke 172Intercell 156Bank of Ireland 147Tullett Prebon 137
Portfolio movements For the six months ended 31 July 2010

171
Return to Index�
Financial statements
Statement of total return(Unaudited)
For the six months ended 31 July2010 2009
£’000 £’000 £’000 £’000
Income
Net capital gains 245 3,696
Revenue 780 965
Expenses (354) (296)
Net revenue before taxation 426 669
Taxation (16) (15)
Net revenue after taxation 410 654
Total return before distributions 655 4,350
Finance costs: Distributions (412) (663)
Change in net assets attributable to shareholders from investment activities 243 3,687
Statement of change in net assets attributable to shareholders(Unaudited)
For the six months ended 31 July2010 2009
£’000 £’000 £’000 £’000
Opening net assets attributable to shareholders 39,934 43,086
Amounts receivable on issue of shares 11,366 251
Amounts payable on cancellation of shares (26) (10,724)
11,340 (10,473)
Change in net assets attributable to shareholders from investment activities (see above) 243 3,687
Retained distributions on accumulation shares 531 590
Closing net assets attributable to shareholders 52,048 36,890
As the comparatives in the above table are for the previous interim period, the Net assets at the end ofthat period will not agree to the Net assets at the start of the current period.
Balance sheet(Unaudited)
As at31 July 2010 31 January 2010
£’000 £’000 £’000 £’000
ASSETS
Investment assets 48,173 38,217
Debtors 130 799
Cash and bank balances 3,808 1,015
Total other assets 3,938 1,814
Total assets 52,111 40,031
LIABILITIES
Investment liabilities – (42)
Creditors (63) (55)
Total other liabilities (63) (55)
Total liabilities (63) (97)
Net assets attributable to shareholders 52,048 39,934

172
ContinuationReturn to Index�
�
JPM UK Managed Equity Fund
Investment objective and policyTo provide long-term capital growth by investing primarily in largecapitalisation UK companies.
Derivatives may be used for the purpose of efficient portfolio management,including hedging, where appropriate. Shareholders will receive at least 60days’ notice of any intention to use derivatives within the Fund for investmentpurposes. Please refer to section 11.14 of the full Prospectus for Risk Warningson derivatives. The Fund may hold non-equity investments from time to timeas appropriate.
Risk profileEquity investment is subject to specific risks relating to the performance ofthe individual companies held and the market’s perception of theirperformance. Equities are also subject to systematic risks such as generaleconomic conditions, inflation, interest rates, foreign exchange rates andindustry sector risks. In general terms, equities tend to be more volatile than bonds.
Funds that invest predominantly in a single market, asset class or sectormay be subject to greater volatility than those funds with a more diversifiedportfolio.
Fund review• The six months under review began strongly for UK equities, helped by
positive economic data. However, eurozone sovereign debt concernsand growing uncertainty about the strength of the recovery contributedto volatility as the period progressed.
• Against this backdrop, the Fund produced a positive return, andoutperformed its benchmark, helped by strong stock selection in theinsurance and capital goods sectors. These returns outweighed negativestock selection in the oil sector.
• At the stock level, one of the biggest contributors to returns was anoverweight position in Tomkins, the engineering group, which agreed tobe acquired by Canadian private equity firm Onex Corp. and the CanadianPension Plan Investment Board for GBP 2.89 billion. The Fund also gainedfrom an overweight position in Next, the clothing retailer, which reportedan encouraging rise in first-quarter sales and maintained its guidancefor the first half of 2010.
• Among the major detractors in relative terms were an underweight positionin Royal Bank of Scotland, which rose as brokers said the bank may returnto profit this year, and an overweight position in BP, which was held forits attractive valuation, but which fell heavily following an explosion atits Deepwater Horizon rig in the Gulf of Mexico.
• However, the Fund was boosted by an overweight position in Aggreko,the provider of mobile power-supply equipment, which reported an increasein first-half profit and said full-year results will be significantly ahead ofexpectations.
You should remember that past performance is not a guide to the future. The price of investments and the income from them may fall as well as rise andinvestors may not get back the full amount invested. For specific risks, please read the Simplified Prospectus.All performance returns are calculated using the quoted price of the accumulation shares. Performance returns are in Sterling.FX Adjusted returns have been calculated by JPMAM. Blended benchmarks have been calculated by JPMAM.Source: J.P. Morgan.Source: FTSE International Limited (“FTSE”) © FTSE [2010]. “FTSE®” is a trade mark of London Stock Exchange Plc and The Financial Times Limited and is used by FTSE International Limited under licence. All rights inthe FTSE indices and/or FTSE ratings vest in FTSE and/or its licensors. Neither FTSE nor its licensors accept any liability for any errors or omissions in the FTSE indices and/or FTSE ratings or underlying data. No furtherdistribution of FTSE Data is permitted without FTSE’s express written consent.The JPMorgan UK Managed Equity Fund, an authorised unit trust, was converted into a new sub-fund of JPMorgan Fund ICVC, an umbrella open-ended investment company, on 1 August 2008.
Fund outlook• Volatility may persist in the short-term given the ongoing uncertainty
over the global economic outlook. However, UK equities are supportedby low interest rates, while valuations are attractive both compared tohistory and compared to bonds.
Rolling 12 month performance as at 31 July2010/2009 2009/2008
JPM Managed EquityA-Class Acc 15.7% -14.0%
Benchmark Index 18.2% -10.9%
Six month performance31/01/10–31/07/10
JPM Managed Equity A-Class Acc 4.4%
Benchmark Index 3.4%
Fund statisticsFund size £262.8m
Benchmark Index FTSE 100 (Total Return Net)
Fund charges Initial 4.25%, Annual 1.50%
Top ten holdings %Royal Dutch Shell ‘B’ 9.5 HSBC 7.2 Vodafone Group 6.5 BP 6.4 GlaxoSmithKline 5.4 AstraZeneca 4.9 British American Tobacco 4.3 BHP Billiton 4.2 Rio Tinto 3.8Barclays 3.3

173
ContinuationReturn to Index�
�
Sector breakdown %Financials 21.4Oil & gas 17.8Basic materials 14.6Consumer goods 11.3Health care 10.3Consumer services 9.3Telecommunications 7.3Industrials 5.9Utilities 1.2Technology 0.4Net other assets 0.5
Highest/lowest share price and distribution recordDistribution
Highest Lowest per shareCalendar year share price share price (net)
A-Class Accumulation Shares
2008 50.00p 30.40p 0.39p
2009 44.44p 28.53p 1.05p
2010A 48.40p 40.13p 0.63p
A-Class Income Shares
2008 45.50p 29.98p 0.37p
2009 42.09p 27.72p 1.02p
2010A 45.72p 37.64p 0.60p
A To 31 July 2010.
Portfolio turnover rate31.07.09 56.61%
31.07.10 54.94%
The portfolio turnover rate (PTR) reflects the total of security purchases and sales, less the total of shareissues and cancellations, expressed as a percentage of the average daily net asset values over the period.
Net asset values and Total expense ratiosNet assetvalue per Net asset Total
share class Number value per expenseDate £’000 of shares share ratio
A-Class Accumulation Shares
31.01.09 202,012 603,561,011 33.47p 1.68%
31.01.10 236,475 558,678,541 42.33p 1.67%
31.07.10 236,349 534,648,292 44.21p 1.68%
A-Class Income Shares
31.01.09 23,595 72,721,038 32.45p 1.68%
31.01.10 26,788 66,995,044 39.98p 1.68%
31.07.10 26,476 64,123,064 41.29p 1.68%
The Net asset value and the Net asset value per income share are shown ex-dividend.
The total expense ratio (TER) takes into account the ACD fee and any fixed expenses charged to revenue overthe financial period, expressed as a percentage of the average daily net asset values over the same period.

174
ContinuationReturn to Index�
�
Portfolio statementAs at 31 July 2010
Market value Total netInvestment Holding £’000 assets %
Financials – 21.4% (21.5%)Banks – 14.9%Barclays 2,588,677 8,626 3.3 HSBC 2,859,998 18,793 7.2 Lloyds Banking Group 8,323,341 5,816 2.2 Royal Bank of Scotland Group 3,688,780 1,844 0.7 Standard Chartered 213,801 3,995 1.5 General financial – 2.0%Hargreaves Lansdown 158,609 574 0.2 Investec 712,189 3,542 1.3 Tullett Prebon 352,797 1,233 0.5 Life insurance – 1.7%Aviva 357,392 1,296 0.5 Legal & General Group 3,483,036 3,171 1.2 Nonlife insurance – 2.5%Admiral Group 98,846 1,444 0.6 Amlin 306,918 1,310 0.5 Beazley Group 939,474 1,122 0.4 Catlin Group 321,589 1,234 0.5 Lancashire Holdings 222,336 1,194 0.5 Real estate – 0.3%Shaftesbury 198,931 803 0.3
Oil & gas – 17.8% (22.0%)Oil & gas producers – 17.8%BG Group 401,071 4,069 1.5 BP 4,126,887 16,755 6.4 Enquest 132,661 153 0.1 Royal Dutch Shell ‘B’ 1,459,553 24,871 9.5 Tullow Oil 61,595 759 0.3
Basic materials – 14.6% (14.0%)Forestry & paper – 0.5%Mondi 307,912 1,392 0.5 Mining – 14.1%Anglo American 306,873 7,816 3.0 BHP Billiton 565,440 11,057 4.2 Eurasian Natural Resources 348,040 3,141 1.2 Ferrexpo 399,844 1,122 0.4 Kazakhmys 70,655 864 0.3 Rio Tinto 301,639 10,013 3.8 Xstrata 305,345 3,131 1.2
Consumer goods – 11.3% (9.5%)Automobiles & parts – 0.3%GKN 582,200 787 0.3 Beverages – 1.7%Britvic 282,350 1,363 0.5 Diageo 291,655 3,255 1.2 Food producers – 3.7%Associated British Foods 51,290 529 0.2 Cranswick 42,658 373 0.1 Dairy Crest Group 149,236 578 0.2 Robert Wiseman Dairies 113,837 569 0.2 Unilever 428,893 7,810 3.0 Household goods – 1.3%Reckitt Benckiser Group 106,120 3,323 1.3 Tobacco – 4.3%British American Tobacco 506,839 11,224 4.3
Health care – 10.3% (10.2%)Pharmaceuticals & biotechnology – 10.3%AstraZeneca 393,448 12,801 4.9 GlaxoSmithKline 1,275,667 14,262 5.4
Market value Total netInvestment Holding £’000 assets %
Consumer services – 9.3% (8.1%)Food & drug retails – 1.4%Sainsbury (J) 368,400 1,270 0.5 Tesco 581,934 2,295 0.9 General retailers – 3.2%Brown (N.) Group 102,183 232 0.1 Dunelm Group 172,499 670 0.3 Halfords Group 238,177 1,151 0.4 JD Sports Fashion 33,328 254 0.1 Next 283,287 6,116 2.3 Media – 1.8%Daily Mail & General Trust ‘A’ Non-Voting 247,225 1,214 0.5 Euromoney Institutional Investor 52,390 313 0.1 Informa 209,279 824 0.3 ITE Group 351,570 521 0.2 ITV 896,910 472 0.2 Trinity Mirror 351,567 379 0.1 WPP 141,525 960 0.4 Travel & leisure – 2.9%Compass Group 492,240 2,636 1.0 Intercontinental Hotels Group 284,465 3,160 1.2 Mitchells & Butlers 178,696 559 0.2 Stagecoach Group 696,626 1,190 0.5
Telecommunications – 7.3% (7.4%)Fixed line telecommunications – 0.8%BT Group 1,526,524 2,183 0.8 Mobile telecommunications – 6.5%Vodafone Group 11,339,219 16,980 6.5
Industrials – 5.9% (4.9%)Aerospace & defence – 1.4%Rolls Royce Group 414,760 2,426 0.9 Senior 965,942 1,245 0.5 General industrials – 1.1%Smith (DS) 929,965 1,341 0.5 Tomkins 508,589 1,649 0.6 Industrial engineering – 1.1%IMI 173,082 1,233 0.5 Spirax Sarco Engineering 23,759 368 0.1 Weir Group 108,716 1,273 0.5 Support services – 2.3%Aggreko 136,304 2,085 0.8 eaga 257,383 274 0.1 Electrocomponents 595,421 1,338 0.5 Filtrona 505,617 1,214 0.5 Galiform 401,509 288 0.1 Premier Farnell 374,452 896 0.3
Utilities – 1.2% (0.6%)Gas, water & multiutilities – 0.9%Centrica 608,242 1,878 0.7 Pennon Group 106,405 633 0.2 Electricity – 0.3%Drax Group 201,773 781 0.3
Technology – 0.4% (1.4%)Software & computer services – 0.3%Computacenter 299,716 825 0.3 Technology hardware & equipment – 0.1%Promethean World 263,614 353 0.1
Investment assets 261,493 99.5
Net other assets 1,332 0.5
Net assets 262,825 100.0
Unless otherwise stated the above securities are admitted to official stock exchange listings or trade on aregulated market.
The comparative percentage figures in brackets are at 31 January 2010.

175
ContinuationReturn to Index�
�
£’000
Total of all purchases for the period 75,373
Major purchases Cost
British American Tobacco 4,775BHP Billiton 3,585Diageo 3,211Royal Dutch Shell ‘B’ 3,094Compass Group 2,974BP 2,825Legal & General Group 2,792Rio Tinto 2,785Investec 2,682Royal Bank of Scotland Group 1,989Reckitt Benckiser Group 1,926Intercontinental Hotels Group 1,775Centrica 1,756Anglo American 1,661Pearson 1,594Tomkins 1,465Electrocomponents 1,354Sainsbury (J) 1,288Amlin 1,287Senior 1,214
£’000
Total of all sales for the period 84,853
Major sales Proceeds
HSBC 4,397BP 4,183Old Mutual 3,882Petrofac 3,547SABMiller 3,169Vodafone Group 3,051Antofagasta 3,001Prudential 2,877Kazakhmys 2,684Tesco 2,393Whitbread 2,133Standard Chartered 2,050Eurasian Natural Resources 1,679National Grid 1,626Pearson 1,478Charter International 1,464Xstrata 1,405Unilever 1,401Admiral Group 1,376Compass Group 1,360
Portfolio movements For the six months ended 31 July 2010

176
Return to Index�
Financial statements
Statement of total return(Unaudited)
For the six months ended 31 July2010 2009
£’000 £’000 £’000 £’000
Income
Net capital gains 8,723 25,835
Revenue 5,430 6,423
Expenses (2,264) (1,896)
Net revenue before taxation 3,166 4,527
Taxation (5) (1)
Net revenue after taxation 3,161 4,526
Total return before distributions 11,884 30,361
Finance costs: Distributions (3,141) (4,532)
Change in net assets attributable to shareholders from investment activities 8,743 25,829
Statement of change in net assets attributable to shareholders(Unaudited)
For the six months ended 31 July2010 2009
£’000 £’000 £’000 £’000
Opening net assets attributable to shareholders 263,263 225,607
Amounts receivable on issue of shares 228 106
Amounts payable on cancellation of shares (12,165) (8,580)
(11,937) (8,474)
Change in net assets attributable to shareholders from investment activities (see above) 8,743 25,829
Retained distributions on accumulation shares 2,759 4,006
Stamp duty reserve tax (3) (2)
Closing net assets attributable to shareholders 262,825 246,966
As the comparatives in the above table are for the previous interim period, the Net assets at the end ofthat period will not agree to the Net assets at the start of the current period.
Balance sheet(Unaudited)
As at31 July 2010 31 January 2010
£’000 £’000 £’000 £’000
ASSETS
Investment assets 261,493 262,250
Debtors 1,532 665
Cash and bank balances 718 1,765
Total other assets 2,250 2,430
Total assets 263,743 264,680
LIABILITIES
Creditors (803) (1,343)
Distribution payable on income shares (115) (74)
Total liabilities (918) (1,417)
Net assets attributable to shareholders 262,825 263,263

177
JPM UK Strategic Equity Income Fund
ContinuationReturn to Index�
�
Investment objective and policyTo provide long-term capital growth and income through investment in avalue style biased portfolio of UK companies.
Risk profileThis equity based Fund invests in companies whose stock is believed to beundervalued (value stocks). This may include smaller companies.
Equity investment is subject to specific risks relating to the performance ofthe individual companies held and the market’s perception of theirperformance. Equities are also subject to systematic risks such as generaleconomic conditions, inflation, interest rates, foreign exchange rates andindustry sector risks. In general terms, equities tend to be more volatile than bonds.
As value stocks tend to outperform at different times to growth stocks,investors should be prepared for periods of underperformance when valuestocks are out of favour.
Funds that invest predominantly in a single market, asset class or sectormay be subject to greater volatility than those funds with a more diversifiedportfolio.
This Fund charges the fees of the ACD against capital, which will increasethe amount of income available for distribution to Shareholders, but mayconstrain capital growth. It may also have tax implications for certain investors.
Fund review• The six months under review began strongly for UK equities, helped by
positive economic data. However, eurozone sovereign debt concernsand growing uncertainty about the strength of the recovery contributedto volatility as the period progressed.
• Against this backdrop, the Fund’s preference for stocks with strong valuecharacteristics resulted in it producing positive returns and outperformingits benchmark. Positive contributors to relative returns included stockselection in the banks and general industrials sectors. The most significantdetractor was stock selection in the household goods & home constructionsector, while stock selection in oil & gas producers was also detrimental.
• At the stock level, the Fund benefited from an overweight position inTomkins, the engineering group, which agreed to be acquired by Canadianprivate equity firm Onex Corp. and the Canadian Pension Plan InvestmentBoard for GBP 2.89 billion. An overweight position in Royal Bank of Scotlandwas also positive as brokers said the bank may return to profit this year.
• The most significant stock-level detractor was an overweight position inBP, which was held for its attractive valuation, but which fell heavilyfollowing an explosion at its Deepwater Horizon rig in the Gulf of Mexico.An overweight in Taylor Wimpey, was also detrimental as the share priceof Britain’s second-largest homebuilder fell after saying its home sales inthe UK for the first half of 2010 will probably decline to 4,650 from 4,702a year earlier.
• However, the Fund was boosted by an overweight position in Senior, themaker of parts for the aviation industry, which said full-year profit willexceed expectations on the improved outlook for large commercial aircraft.
You should remember that past performance is not a guide to the future. The price of investments and the income from them may fall as well as rise andinvestors may not get back the full amount invested. For specific risks, please read the Simplified Prospectus.All performance returns are calculated using the quoted price of the accumulation shares. Performance returns are in Sterling.FX Adjusted returns have been calculated by JPMAM. Blended benchmarks have been calculated by JPMAM.Source: J.P. Morgan.Source: FTSE International Limited (“FTSE”) © FTSE [2010]. “FTSE®” is a trade mark of London Stock Exchange Plc and The Financial Times Limited and is used by FTSE International Limited under licence. All rights inthe FTSE indices and/or FTSE ratings vest in FTSE and/or its licensors. Neither FTSE nor its licensors accept any liability for any errors or omissions in the FTSE indices and/or FTSE ratings or underlying data. No furtherdistribution of FTSE Data is permitted without FTSE’s express written consent.
Fund outlook• Volatility may persist in the short-term given the ongoing uncertainty
over the global economic outlook. However, UK equities are supportedby low interest rates, while valuations are attractive both compared tohistory and compared to bonds.
Rolling 12 month performance as at 31 July2010/2009 2009/2008 2008/2007 2007/2006 2006/2005
JPM UK Strategic Equity IncomeA-Class Acc 16.4% -11.7% -17.5% 10.5% 18.2%
JPM UK Strategic Equity IncomeI-Class Acc 17.6% -10.7% – – –
Benchmark Index 19.4% -10.5% -13.3% 13.0% 17.3%
Six month performance31/01/10–31/07/10
JPM UK Strategic Equity Income A-Class Acc 5.6%
Benchmark Index 4.0%
Fund statisticsFund size £163.3m
Benchmark Index FTSE All-Share (Total Return Net)
Fund chargesA-Class Initial 4.25%, Annual 1.50%I-Class Initial Nil, Annual 0.60%
Top ten holdings %Royal Dutch Shell ‘B’ 7.3Vodafone Group 5.4BP 4.7GlaxoSmithKline 4.1Rio Tinto 3.7AstraZeneca 3.4British American Tobacco 3.3Barclays 3.1BHP Billiton 2.9Anglo American 2.7

178
ContinuationReturn to Index�
�
Sector breakdown %Financials 16.7Basic materials 15.2Oil & gas 13.7Industrials 12.6Consumer services 10.4Consumer goods 10.4Health care 7.5Telecommunications 6.7Utilities 3.0Technology 1.5Futures 0.0Net other assets 2.3
Highest/lowest share price and distribution recordDistribution
Highest Lowest per shareCalendar year share price share price (net)
A-Class Accumulation Shares
2005 92.15p 74.73p 1.33p
2006 109.4p 91.31p 1.52p
2007 117.5p 101.1p 1.73p
2008 107.7p 58.88p 4.34p
2009 93.40p 56.14p 2.98p
2010A 102.8p 83.77p 2.25p
A-Class Income Shares
2005 83.26p 68.23p 1.21p
2006 97.28p 82.04p 1.38p
2007 103.9p 88.60p 1.52p
2008 94.32p 49.86p 3.76p
2009 75.24p 46.42p 2.45p
2010A 81.73p 66.01p 1.79p
I-Class Accumulation SharesB
2008 112.7p 61.95p 4.04p
2009 99.40p 59.30p 3.30p
2010A 109.9p 89.71p 2.48p
I-Class Income SharesB
2008 110.9p 60.31p 3.99p
2009 91.82p 56.32p 3.10p
2010A 100.2p 81.06p 2.26p
A To 31 July 2010.B I-Class Accumulation and I-Class Income Shares were launched on 24 January 2008.
Portfolio turnover rate31.07.09 67.07%
31.07.10 27.39%
The portfolio turnover rate (PTR) reflects the total of security purchases and sales, less the total of shareissues and cancellations, expressed as a percentage of the average daily net asset values over the period.
Net asset values and Total expense ratiosNet assetvalue per Net asset Total
share class Number value per expenseDate £’000 of shares share ratio
A-Class Accumulation Shares
31.01.08 159,273 167,706,170 94.97p 1.66%
31.01.09 132,483 203,350,806 65.15p 1.67%
31.01.10 163,852 185,862,552 88.16p 1.67%
31.07.10 143,894 154,545,321 93.11p 1.68%
A-Class Income Shares
31.01.08 13,976 16,951,566 82.45p 1.64%
31.01.09 9,077 16,850,253 53.87p 1.68%
31.01.10 6,811 9,717,157 70.09p 1.68%
31.07.10 6,815 9,358,844 72.81p 1.68%
I-Class Accumulation Shares
31.01.08 5 5,000 99.14p 0.60%
31.01.09 5,202 7,567,851 68.74p 0.60%
31.01.10 6,285 6,688,114 93.98p 0.60%
31.07.10 5,527 5,538,768 99.79p 0.60%
I-Class Income Shares
31.01.08 5 5,000 99.01p 0.60%
31.01.09 5,529 8,468,481 65.28p 0.60%
31.01.10 6,844 7,985,710 85.71p 0.60%
31.07.10 7,054 7,886,088 89.45p 0.60%
The Net asset value and the Net asset value per income share are shown ex-dividend.
The total expense ratio (TER) takes into account the ACD fee and any fixed expenses charged to revenue overthe financial period, expressed as a percentage of the average daily net asset values over the same period.

179
ContinuationReturn to Index�
�
Portfolio statementAs at 31 July 2010
Market value Total netInvestment Holding £’000 assets %
Financials – 16.7% (18.1%)Banks – 9.0%Barclays 1,509,895 5,031 3.1Lloyds Banking Group 5,416,045 3,784 2.3Royal Bank of Scotland Group 3,791,518 1,896 1.2Standard Chartered 205,633 3,842 2.4General financial – 2.4%Close Brothers Group 99,234 673 0.4Intermediate Capital Group 260,627 705 0.4International Personal Finance 269,358 643 0.4Investec 236,318 1,175 0.7Paragon Group of Companies 293,243 398 0.2Tullett Prebon 155,589 544 0.3Life insurance – 4.4%Legal & General Group 1,344,194 1,224 0.8Old Mutual 1,345,629 1,647 1.0Prudential 425,988 2,392 1.5Resolution 33,348 80 0.1Resolution (Nil Paid Rights) 566,925 504 0.3St James’s Place 408,027 1,128 0.7Real estate – 0.9%Big Yellow Group 164,251 509 0.3Hammerson 233,589 903 0.6
Basic materials – 15.2% (12.9%)Chemicals – 0.3%Yule Catto & Co 206,781 428 0.3Forestry & paper – 0.7%Mondi 261,539 1,183 0.7Mining – 14.2%Anglo American 169,874 4,327 2.7BHP Billiton 244,732 4,786 2.9Eurasian Natural Resources 131,463 1,186 0.7Ferrexpo 348,601 978 0.6Kazakhmys 101,018 1,235 0.8Rio Tinto 182,421 6,055 3.7Vedanta Resources 53,989 1,326 0.8Xstrata 315,497 3,235 2.0
Oil & gas – 13.7% (18.2%)Oil & gas producers – 13.0%Afren 770,036 703 0.4Bowleven 378,626 592 0.4BP 1,891,334 7,679 4.7Royal Dutch Shell ‘B’ 699,105 11,913 7.3Valiant PetroleumB 54,644 374 0.2Oil equipment, services & distribution – 0.7%AMEC 131,269 1,148 0.7
Industrials – 12.6% (13.9%)Aerospace & defence – 0.7%Aero Inventory* 137,943 – – Meggitt 360,421 1,088 0.7Construction & materials – 0.3%Kier Group 41,835 435 0.3Electronics & electrical equipment – 0.9%Laird Group 756,840 929 0.6Morgan Crucible 239,805 525 0.3General industrials – 3.4%Cookson Group 217,111 956 0.6Melrose 450,196 1,051 0.6Rexam 307,614 964 0.6Smith (DS) 798,090 1,151 0.7Tomkins 465,006 1,508 0.9Industrial engineering – 1.5%Bodycote International 432,317 988 0.6Charter International 148,675 1,067 0.7Hill & Smith 117,406 344 0.2Industrial transportation – 0.6%BBA Aviation 510,814 1,004 0.6
Market value Total netInvestment Holding £’000 assets %
Support services – 5.2%Atkins (WS) 75,735 552 0.3Babcock International Group 181,461 1,007 0.6Bunzl 113,775 792 0.5Cape 140,095 367 0.2Carillion 217,483 659 0.4Davis Service Group 260,591 979 0.6Filtrona 413,744 993 0.6Galiform 1,182,738 849 0.5Mitie Group 187,506 393 0.2Travis Perkins 135,854 1,142 0.7Wolseley 71,552 1,032 0.6
Consumer services – 10.4% (14.1%)Food & drug retails – 0.8%Morrison (Wm.) Supermarkets 496,949 1,330 0.8General retailers – 3.3%Halfords Group 196,848 952 0.6Inchcape 347,331 1,043 0.6Kesa Electricals 483,309 609 0.4Lookers 712,599 387 0.2Next 62,598 1,351 0.8Pendragon 726,316 174 0.1Sports Direct International 849,258 949 0.6Media – 3.3%Chime Communications 194,908 331 0.2Daily Mail & General Trust ‘A’ Non-Voting 214,828 1,055 0.7Euromoney Institutional Investor 151,822 906 0.6Informa 301,834 1,189 0.7ITE Group 350,708 519 0.3Trinity Mirror 463,758 500 0.3United Business Media 135,531 738 0.5Travel & leisure – 3.0%Cineworld Group 226,047 441 0.3Easyjet 250,997 1,003 0.6Mitchells & Butlers 336,669 1,053 0.6Restaurant Group 428,723 969 0.6SportingbetB 560,693 339 0.2Stagecoach Group 418,601 715 0.4Thomas Cook Group 280,173 513 0.3
Consumer goods – 10.4% (10.6%)Automobiles & parts – 0.4%GKN 504,753 682 0.4Food producers – 1.7%Cranswick 78,198 684 0.4Dairy Crest Group 238,243 923 0.6Tate & Lyle 231,777 1,056 0.7Household goods – 3.3%Barratt Developments 911,133 877 0.5Bellway 147,894 854 0.5Berkeley Group ‘B’ 62,968 512 0.3Bovis Homes Group 258,680 883 0.5Persimmon 222,189 790 0.5Redrow 721,443 775 0.5Taylor Wimpey 3,036,212 809 0.5Tobacco – 5.0%British American Tobacco 241,132 5,340 3.3Imperial Tobacco Group 150,347 2,738 1.7
Health care – 7.5% (3.1%)Pharmaceuticals & biotechnology – 7.5%AstraZeneca 172,706 5,619 3.4GlaxoSmithKline 604,219 6,755 4.1
Telecommunications – 6.7% (6.7%)Fixed line telecommunications – 1.3%BT Group 1,428,231 2,042 1.3Mobile telecommunications – 5.4%Vodafone Group 5,912,680 8,854 5.4

180
ContinuationReturn to Index�
�
Market value Total netInvestment Holding £’000 assets %
Portfolio statement – continuedAs at 31 July 2010
Utilities – 3.0% (0.0%)Electricity – 0.8%International Power 361,008 1,302 0.8Gas, water & multiutilities – 2.2%Centrica 776,420 2,397 1.5Northumbrian Water Group 318,572 1,074 0.7
Technology – 1.5% (1.5%)Software & computer services – 1.1%Computacenter 292,397 805 0.5Logica 913,991 980 0.6Technology hardware & equipment – 0.4%Pace 305,777 645 0.4
Futures – 0.0% (0.0%)FTSE 100 Index Futures Sep 2010 60 36 –
Investment assets 159,499 97.7
Net other assets 3,791 2.3
Net assets 163,290 100.0
Unless otherwise stated the above securities are admitted to official stock exchange listings or trade on aregulated market.
The comparative percentage figures in brackets are at 31 January 2010.B Quoted on Alternative Investment Market* Delisted security

181
ContinuationReturn to Index�
�
£’000
Total of all purchases for the period 71,221
Major purchases Cost
HSBC 11,968GlaxoSmithKline 8,066British American Tobacco 5,426BHP Billiton 4,525National Grid 2,730Centrica 2,334BAE Systems 2,107Aviva 1,865Morrison (Wm.) Supermarkets 1,358International Power 1,196Close Brothers Group 1,189Legal & General Group 1,171Northumbrian Water Group 1,164Wolseley 1,133G4S 1,062Man Group 1,059Marks & Spencer 1,052Experian 997Rexam 947Hammerson 902
£’000
Total of all sales for the period 102,804
Major sales Proceeds
HSBC 12,113Aviva 4,340BP 2,840Royal Dutch Shell ‘B’ 2,698WPP 2,500National Grid 2,496Standard Chartered 2,128Vodafone Group 1,893BAE Systems 1,838Lamprell 1,667IMI 1,636Home Retail Group 1,634F&C Asset Management 1,577Spectris 1,571Morgan Crucible 1,571London Stock Exchange Group 1,518Aegis Group 1,518International Personal Finance 1,472Britvic 1,465GKN 1,460
Portfolio movements For the six months ended 31 July 2010

182
Return to Index�
Financial statements
Statement of total return(Unaudited)
For the six months ended 31 July2010 2009
£’000 £’000 £’000 £’000
Income
Net capital gains 8,818 31,254
Revenue 3,115 4,393
Expenses (1,371) (1,282)
Finance costs: Interest – (1)
Net revenue before taxation 1,744 3,110
Taxation (3) (40)
Net revenue after taxation 1,741 3,070
Total return before distributions 10,559 34,324
Finance costs: Distributions (2,975) (4,226)
Change in net assets attributable to shareholders from investment activities 7,584 30,098
Statement of change in net assets attributable to shareholders(Unaudited)
For the six months ended 31 July2010 2009
£’000 £’000 £’000 £’000
Opening net assets attributable to shareholders 183,792 152,291
Amounts receivable on issue of shares 1,136 7,095
Amounts payable on cancellation of shares (31,800) (17,271)
(30,664) (10,176)
Change in net assets attributable to shareholders from investment activities (see above) 7,584 30,098
Retained distributions on accumulation shares 2,587 3,813
Stamp duty reserve tax (11) (19)
Unclaimed distributions 2 1
Closing net assets attributable to shareholders 163,290 176,008
As the comparatives in the above table are for the previous interim period, the Net assets at the end ofthat period will not agree to the Net assets at the start of the current period.
Balance sheet(Unaudited)
As at31 July 2010 31 January 2010
£’000 £’000 £’000 £’000
ASSETS
Investment assets 159,499 182,205
Debtors 719 7,221
Cash and bank balances 3,666 2,517
Total other assets 4,385 9,738
Total assets 163,884 191,943
LIABILITIES
Creditors (484) (8,048)
Distribution payable on income shares (110) (103)
Total liabilities (594) (8,151)
Net assets attributable to shareholders 163,290 183,792

183
JPM UK Strategic Growth Fund
ContinuationReturn to Index�
�
Investment objective and policyTo provide long-term capital growth through investment primarily in a growthstyle biased portfolio of UK companies.
Derivatives may be used for the purpose of Efficient Portfolio Management,including hedging, where appropriate. Subject to at least 60 days notice toshareholders, the Fund may use derivatives for investment purposes. TheFund may hold non-equity investments from time to time as appropriate.
Risk profileThis equity based Fund invests primarily in companies that are selected fortheir prospects of above average earnings growth. This may include smallercompanies.
Equity investment is subject to specific risks relating to the performance ofthe individual companies held and the market’s perception of theirperformance. Equities are also subject to systematic risks such as generaleconomic conditions, inflation, interest rates, foreign exchange rates andindustry sector risks. In general terms, equities tend to be more volatile than bonds.
As growth stocks tend to outperform at different times to value stocks,investors should be prepared for periods of underperformance when growthstocks are out of favour.
Funds that invest predominantly in a single market, asset class or sectormay be subject to greater volatility than those funds with a more diversifiedportfolio.
Fund review• The six months under review began strongly for UK equities, helped by
positive economic data. However, eurozone sovereign debt concernsand growing uncertainty about the strength of the recovery contributedto volatility as the period progressed.
• Against this backdrop, the Fund’s preference for stocks with strong growthcharacteristics resulted in it producing positive returns and outperformingits benchmark. Positive contributors to relative returns included stockselection and overweight positions in the industrial engineering, personalgoods and chemicals sectors. Stock selection in the household goods &home construction sector and an underweight in the mobile telecomssector were among the detractors.
• At the stock level, the Fund benefited from an overweight position inTomkins, the engineering group, which agreed to be acquired by Canadianprivate equity firm Onex Corp. and the Canadian Pension Plan InvestmentBoard for GBP 2.89 billion. An overweight position in Supergroup alsobenefited returns as the owner of the Superdry fashion brand reportedan increase in full-year like-for-like sales.
• Stock-level detractors from relative returns included an underweightposition in Vodafone, which does not meet our growth criteria, but whichreported a return to service revenue growth, after eighteen months ofcontraction, helped by strong demand for Apple’s iPhone. An overweightposition in Bellway was also detrimental after the homebuilder said it hadseen a drop in sales following May’s UK general election on uncertaintyabout the potential repercussions of government spending cuts.
You should remember that past performance is not a guide to the future. The price of investments and the income from them may fall as well as rise andinvestors may not get back the full amount invested. For specific risks, please read the Simplified Prospectus.All performance returns are calculated using the quoted price of the accumulation shares. Performance returns are in Sterling.FX Adjusted returns have been calculated by JPMAM. Blended benchmarks have been calculated by JPMAM.Source: J.P. Morgan.Source: FTSE International Limited (“FTSE”) © FTSE [2010]. “FTSE®” is a trade mark of London Stock Exchange Plc and The Financial Times Limited and is used by FTSE International Limited under licence. All rights inthe FTSE indices and/or FTSE ratings vest in FTSE and/or its licensors. Neither FTSE nor its licensors accept any liability for any errors or omissions in the FTSE indices and/or FTSE ratings or underlying data. No furtherdistribution of FTSE Data is permitted without FTSE’s express written consent.
• However, the Fund was boosted by an overweight position in chemicalproducer Croda International, which reported better-than-expected first-half earnings and said strong trading was continuing in the second half.
Fund outlook• Volatility may persist in the short-term given the ongoing uncertainty
over the global economic outlook. However, UK equities are supportedby low interest rates, while valuations are attractive both compared tohistory and compared to bonds.
Rolling 12 month performance as at 31 July2010/2009
JPM UK Strategic GrowthA-Class Acc 21.6%
Benchmark Index 19.4%
Six month performance31/01/10–31/07/10
JPM UK Strategic Growth A-Class Acc 7.7%
Benchmark Index 4.0%
Fund statisticsFund size £3.9m
Benchmark Index FTSE All-Share (Total Return Net)
Fund charges Initial 4.25%, Annual 1.50%
Top ten holdings %HSBC 7.4Royal Dutch Shell ‘B’ 7.1Rio Tinto 3.4British American Tobacco 2.9BHP Billiton 2.9Standard Chartered 2.6Barclays 2.5BG Group 2.4Anglo American 2.3Diageo 1.9

184
ContinuationReturn to Index�
�
Sector breakdown %Financials 21.9Industrials 15.4Basic materials 14.4Oil & gas 13.3Consumer goods 12.7Consumer services 11.9Technology 4.6Health care 1.7Utilities 1.1Telecommunications 0.5Futures 0.1Net other assets 2.4
Highest/lowest share price and distribution recordDistribution
Highest Lowest per shareCalendar year share price share price (net)
A-Class Accumulation SharesA
2008 51.58p 49.70p –
2009 62.55p 43.33p 0.00p
2010B 69.19p 57.65p 0.81p
A-Class Income SharesA
2008 51.58p 49.70p –
2009 62.55p 43.33p 0.00p
2010B 68.25p 56.86p 0.81p
A A-Class Accumulation and A-Class Income Shares were launched on 18 December 2008.B To 31 July 2010.
Portfolio turnover rate31.07.09 162.74%
31.07.10 127.60%
The portfolio turnover rate (PTR) reflects the total of security purchases and sales, less the total of shareissues and cancellations, expressed as a percentage of the average daily net asset values over the period.
Net asset values and Total expense ratiosNet assetvalue per Net asset Total
share class Number value per expenseDate £’000 of shares share ratio
A-Class Accumulation Shares
31.01.09 1,501 3,040,000 49.37p 1.68%
31.01.10 1,841 3,126,449 58.88p 1.68%
31.07.10 2,012 3,171,430 63.46p 1.68%
A-Class Income Shares
31.01.09C 1,501 3,040,000 49.37p 1.68%
31.01.10C 1,765 3,040,402 58.07p 1.68%
31.07.10 1,910 3,050,735 62.60p 1.68%
C The Net asset value and the Net asset value per income share are shown ex-dividend at the financial year end.
The total expense ratio (TER) takes into account the ACD fee and any fixed expenses charged to revenue overthe financial period, expressed as a percentage of the average daily net asset values over the same period.

185
ContinuationReturn to Index�
�
Portfolio statementAs at 31 July 2010
Market value Total netInvestment Holding £’000 assets %
Financials – 21.9% (27.9%)Banks – 15.2%Barclays 29,893 100 2.5HSBC 43,977 289 7.4Lloyds Banking Group 107,561 75 1.9Royal Bank of Scotland Group 66,306 33 0.8Standard Chartered 5,439 102 2.6General financial – 3.5%Aberdeen Asset Management 7,970 11 0.3Bluebay Asset Management 3,212 9 0.2Close Brothers Group 1,334 9 0.2Hargreaves Lansdown 3,335 12 0.3Henderson Group 10,632 14 0.4IG Group 2,863 14 0.4Intermediate Capital Group 5,060 14 0.4International Personal Finance 5,628 13 0.3Investec 3,432 17 0.4Paragon Group of Companies 6,089 8 0.2Schroders 1,218 16 0.4Nonlife insurance – 0.6%Admiral Group 1,307 19 0.5Jardine Lloyd Thompson 910 5 0.1Real estate – 2.6%British Land 4,477 21 0.5CLS 1,725 8 0.2Derwent London 1,053 14 0.4Great Portland Estates 4,379 13 0.3Hammerson 3,787 15 0.4Savills 2,325 7 0.2Shaftesbury 3,496 14 0.4Unite Group 4,144 8 0.2
Industrials – 15.4% (10.9%)Aerospace & defence – 1.6%Chemring Group 311 9 0.2Meggitt 3,822 12 0.3Rolls Royce Group 6,286 37 0.9Senior 7,153 9 0.2Electronics & electrical equipment – 2.2%Domino Printing Sciences 3,041 14 0.4Halma 3,940 11 0.3Morgan Crucible 6,500 14 0.4Renishaw 1,619 14 0.4Spectris 1,606 14 0.4TT electronics 7,715 8 0.2Volex Group 2 0.1General industrials – 2.0%Cookson Group 2,824 12 0.3Rexam 4,323 14 0.4Smith (DS) 10,882 16 0.4Smiths Group 1,529 17 0.4Tomkins 6,531 21 0.5Industrial engineering – 2.8%Bodycote International 4,485 10 0.3Charter International 1,294 9 0.2Fenner 4,591 10 0.3IMI 2,445 17 0.4Melrose 6,229 15 0.4Rotork 797 12 0.3Spirax Sarco Engineering 958 15 0.4Weir Group 1,639 19 0.5Industrial transportation – 0.5%BBA Aviation 6,828 13 0.3Stobart Group 6,243 9 0.2Support services – 6.3%Aggreko 1,487 23 0.6Ashtead Group 8,256 8 0.2BSS Group 1,555 7 0.2Bunzl 1,786 12 0.3CPP 3,208 8 0.2Diploma 3,200 8 0.2Electrocomponents 3,833 9 0.2Filtrona 5,643 14 0.4G4S 4,530 12 0.3Hays 10,393 9 0.2
Market value Total netInvestment Holding £’000 assets %
Homeserve 480 11 0.3Intertek Group 816 13 0.3John Menzies 2,598 10 0.2Michael Page International 3,765 15 0.4Premier Farnell 4,700 11 0.3Rentokil Initial 13,724 14 0.4Robert Walters 3,678 8 0.2Serco Group 3,049 17 0.4SThree 3,544 9 0.2Travis Perkins 1,504 13 0.3Wolseley 1,270 18 0.5
Basic materials – 14.4% (16.8%)Chemicals – 1.8%Croda International 1,387 18 0.5Elementis 9,209 7 0.2Johnson Matthey 1,216 21 0.5Victrex 1,206 15 0.4Yule Catto & Co 4,296 9 0.2Forestry & paper – 0.4%Mondi 3,526 16 0.4Industrial metals – 0.2%Ferrexpo 3,683 10 0.2Mining – 12.0%Anglo American 3,547 90 2.3BHP Billiton 5,804 114 2.9Centamin Egypt 6,758 10 0.2Eurasian Natural Resources 1,952 18 0.5Randgold Resources 404 23 0.6Rio Tinto 3,977 132 3.4Vedanta Resources 765 19 0.5Xstrata 6,085 62 1.6
Oil & gas – 13.3% (11.5%)Oil & gas producers – 12.1%Afren 9,977 9 0.2BG Group 9,227 94 2.4Cairn Energy 6,265 29 0.7Essar Energy 2,468 10 0.2Heritage Oil 1,958 8 0.2Royal Dutch Shell ‘B’ 16,276 277 7.1SOCO International 2,452 10 0.2Tullow Oil 3,036 37 0.9Valiant PetroleumB 1,062 7 0.2Oil equipment, services & distribution – 1.2%Lamprell 5,206 14 0.4Petrofac 1,541 19 0.5Wood Group (John) 2,991 11 0.3
Consumer goods – 12.7% (7.0%)Automobiles & parts – 0.4%GKN 12,532 17 0.4Beverages – 4.0%Britvic 2,859 14 0.4Diageo 6,780 76 1.9SABMiller 3,351 65 1.7Food producers – 1.3%Associated British Foods 2,075 21 0.5Cranswick 1,364 12 0.3Devro 4,442 9 0.2Tate & Lyle 2,518 11 0.3Household goods – 2.6%Bellway 1,877 11 0.3Persimmon 3,323 12 0.3Reckitt Benckiser Group 1,998 63 1.6Redrow 9,290 10 0.2Taylor Wimpey 32,622 9 0.2Personal goods – 1.5%Burberry Group 2,539 22 0.6Supergroup 1,480 14 0.4SSL International 1,817 21 0.5Tobacco – 2.9%British American Tobacco 5,188 115 2.9

186
ContinuationReturn to Index�
�
Market value Total netInvestment Holding £’000 assets %
Portfolio statement – continuedAs at 31 July 2010
Consumer services – 11.9% (15.7%)Food & drug retails – 0.3%Greggs 2,630 12 0.3General retailers – 2.2%ASOS 1,077 10 0.2Carphone Warehouse Group 4,528 10 0.2Dunelm Group 3,117 12 0.3Halfords Group 2,637 13 0.3Inchcape 3,283 10 0.2JD Sports Fashion 978 7 0.2Next 981 21 0.5PZ Cussons 3,199 11 0.3Media – 4.2%British Sky Broadcasting Group 4,508 32 0.8Daily Mail & General Trust ‘A’ Non-Voting 2,908 14 0.4Euromoney Institutional Investor 1,260 8 0.2Informa 3,317 13 0.3ITE Group 5,418 8 0.2ITV 29,094 15 0.4Pearson 3,018 30 0.8Rightmove Group 1,820 12 0.3WPP 4,732 32 0.8Travel & leisure – 5.2%Arriva 1,944 15 0.4British Airways 7,766 17 0.4Carnival 829 19 0.5Compass Group 6,534 35 0.9Domino’s Pizza 3,285 14 0.4Easyjet 3,396 14 0.4Intercontinental Hotels Group 1,512 17 0.4Millennium & Copthorne Hotels 2,890 14 0.4Mitchells & Butlers 3,597 11 0.3Rank Group 6,933 8 0.2Restaurant Group 5,411 12 0.3Stagecoach Group 5,472 9 0.2Whitbread 1,204 17 0.4
Technology – 4.6% (5.9%)Software & computer services – 3.2%Autonomy 914 15 0.4Aveva Group 1,080 14 0.4Computacenter 3,622 10 0.3Dimension Data 15,041 18 0.5Kofax 3,198 8 0.2Misys 5,996 15 0.4Sage Group 6,097 15 0.4SDL 1,037 6 0.2Telecity Group 3,129 14 0.4Technology hardware & equipment – 1.4%ARM Holdings 7,322 24 0.6CSR – – –Imagination Technologies Group 4,865 16 0.4Spirent Communications 11,518 14 0.4
Health care – 1.7% (2.7%)Pharmaceuticals & biotechnology – 1.7%Abcam 832 13 0.3Genus 1,065 8 0.2Hikma Pharmaceuticals 1,910 14 0.4Shire 2,126 31 0.8
Utilities – 1.1% (0.0%)Gas, water & multiutilities – 1.1%Centrica 14,645 45 1.1
Telecommunications – 0.5% (1.0%)Mobile telecommunications – 0.5%Inmarsat 2,489 19 0.5
Futures – 0.1% (0.0%)FTSE 100 Index Futures Sep 2010 1 2 0.1
Investment assets 3,826 97.6
Net other assets 96 2.4
Net assets 3,922 100.0
Unless otherwise stated the above securities are admitted to official stock exchange listings or trade on aregulated market.
The comparative percentage figures in brackets are at 31 January 2010.
Market value Total netInvestment Holding £’000 assets %

187
ContinuationReturn to Index�
�
£’000
Total of all purchases for the period 2,466
Major purchases Cost
BP 279Royal Dutch Shell ‘B’ 276British American Tobacco 118BG Group 109Barclays 98Tesco 86Diageo 72Reckitt Benckiser Group 72Unilever 68Centrica 44Compass Group 35HSBC 30Anglo American 30Associated British Foods 25Rio Tinto 23Lloyds Banking Group 22Promethean World 21Autonomy 20Supergroup (Placing) 19Smiths Group 17
£’000
Total of all sales for the period 2,496
Major sales Proceeds
BP 443Barclays 82Tesco 78Unilever 64Experian 29Autonomy 29Kingfisher 28Anglo American 27Petropavlovsk 27Marks & Spencer 25Antofagasta 25Land Securities 25Smith & Nephew 25Old Mutual 24Fresnillo 243i Group 24Close Brothers Group 23AMEC 22Home Retail Group 21Capital Shopping Centres Group 21
Portfolio movements For the six months ended 31 July 2010

188
Return to Index�
Financial statements
Statement of total return(Unaudited)
For the six months ended 31 July2010 2009
£’000 £’000 £’000 £’000
Income
Net capital gains 270 128
Revenue 43 65
Expenses (32) (25)
Net revenue before taxation 11 40
Taxation – –
Net revenue after taxation 11 40
Total return before distributions 281 168
Finance costs: Distributions – –
Change in net assets attributable to shareholders from investment activities 281 168
Statement of change in net assets attributable to shareholders(Unaudited)
For the six months ended 31 July2010 2009
£’000 £’000 £’000 £’000
Opening net assets attributable to shareholders 3,606 3,002
Amounts receivable on issue of shares 37 9
Amounts payable on cancellation of shares (2) –
35 9
Change in net assets attributable to shareholders from investment activities (see above) 281 168
Closing net assets attributable to shareholders 3,922 3,179
As the comparatives in the above table are for the previous interim period, the Net assets at the end ofthat period will not agree to the Net assets at the start of the current period.
Balance sheet(Unaudited)
As at31 July 2010 31 January 2010
£’000 £’000 £’000 £’000
ASSETS
Investment assets 3,826 3,586
Debtors 21 15
Cash and bank balances 82 41
Total other assets 103 56
Total assets 3,929 3,642
LIABILITIES
Creditors (7) (12)
Distribution payable on income shares – (24)
Total liabilities (7) (36)
Net assets attributable to shareholders 3,922 3,606
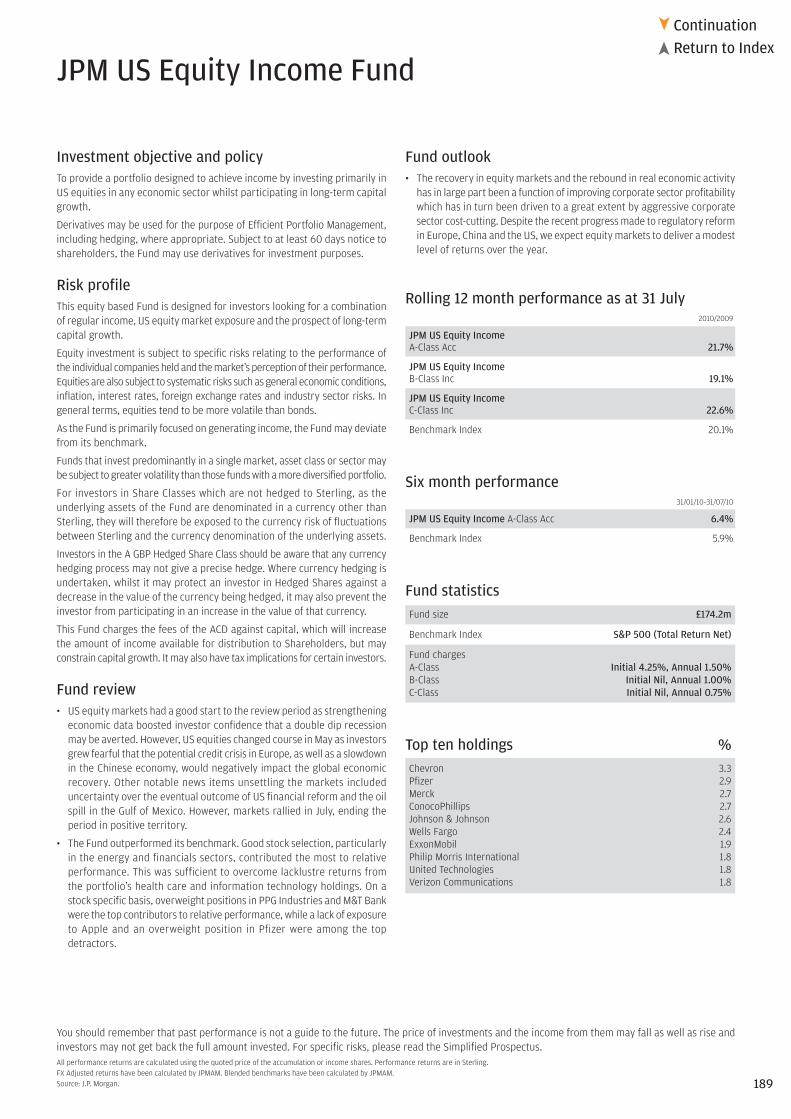
189
ContinuationReturn to Index�
�
JPM US Equity Income Fund
Investment objective and policyTo provide a portfolio designed to achieve income by investing primarily inUS equities in any economic sector whilst participating in long-term capitalgrowth.
Derivatives may be used for the purpose of Efficient Portfolio Management,including hedging, where appropriate. Subject to at least 60 days notice toshareholders, the Fund may use derivatives for investment purposes.
Risk profileThis equity based Fund is designed for investors looking for a combinationof regular income, US equity market exposure and the prospect of long-termcapital growth.
Equity investment is subject to specific risks relating to the performance ofthe individual companies held and the market’s perception of their performance.Equities are also subject to systematic risks such as general economic conditions,inflation, interest rates, foreign exchange rates and industry sector risks. Ingeneral terms, equities tend to be more volatile than bonds.
As the Fund is primarily focused on generating income, the Fund may deviatefrom its benchmark.
Funds that invest predominantly in a single market, asset class or sector maybe subject to greater volatility than those funds with a more diversified portfolio.
For investors in Share Classes which are not hedged to Sterling, as theunderlying assets of the Fund are denominated in a currency other thanSterling, they will therefore be exposed to the currency risk of fluctuationsbetween Sterling and the currency denomination of the underlying assets.
Investors in the A GBP Hedged Share Class should be aware that any currencyhedging process may not give a precise hedge. Where currency hedging isundertaken, whilst it may protect an investor in Hedged Shares against adecrease in the value of the currency being hedged, it may also prevent theinvestor from participating in an increase in the value of that currency.
This Fund charges the fees of the ACD against capital, which will increasethe amount of income available for distribution to Shareholders, but mayconstrain capital growth. It may also have tax implications for certain investors.
Fund review• US equity markets had a good start to the review period as strengthening
economic data boosted investor confidence that a double dip recessionmay be averted. However, US equities changed course in May as investorsgrew fearful that the potential credit crisis in Europe, as well as a slowdownin the Chinese economy, would negatively impact the global economicrecovery. Other notable news items unsettling the markets includeduncertainty over the eventual outcome of US financial reform and the oilspill in the Gulf of Mexico. However, markets rallied in July, ending theperiod in positive territory.
• The Fund outperformed its benchmark. Good stock selection, particularlyin the energy and financials sectors, contributed the most to relativeperformance. This was sufficient to overcome lacklustre returns fromthe portfolio’s health care and information technology holdings. On astock specific basis, overweight positions in PPG Industries and M&T Bankwere the top contributors to relative performance, while a lack of exposureto Apple and an overweight position in Pfizer were among the topdetractors.
You should remember that past performance is not a guide to the future. The price of investments and the income from them may fall as well as rise andinvestors may not get back the full amount invested. For specific risks, please read the Simplified Prospectus.All performance returns are calculated using the quoted price of the accumulation or income shares. Performance returns are in Sterling.FX Adjusted returns have been calculated by JPMAM. Blended benchmarks have been calculated by JPMAM.Source: J.P. Morgan.
Fund outlook• The recovery in equity markets and the rebound in real economic activity
has in large part been a function of improving corporate sector profitabilitywhich has in turn been driven to a great extent by aggressive corporatesector cost-cutting. Despite the recent progress made to regulatory reformin Europe, China and the US, we expect equity markets to deliver a modestlevel of returns over the year.
Rolling 12 month performance as at 31 July2010/2009
JPM US Equity Income A-Class Acc 21.7%
JPM US Equity Income B-Class Inc 19.1%
JPM US Equity Income C-Class Inc 22.6%
Benchmark Index 20.1%
Six month performance31/01/10–31/07/10
JPM US Equity Income A-Class Acc 6.4%
Benchmark Index 5.9%
Fund statisticsFund size £174.2m
Benchmark Index S&P 500 (Total Return Net)
Fund chargesA-Class Initial 4.25%, Annual 1.50% B-Class Initial Nil, Annual 1.00%C-Class Initial Nil, Annual 0.75%
Top ten holdings %Chevron 3.3Pfizer 2.9Merck 2.7ConocoPhillips 2.7Johnson & Johnson 2.6Wells Fargo 2.4ExxonMobil 1.9Philip Morris International 1.8United Technologies 1.8Verizon Communications 1.8

190
ContinuationReturn to Index�
�
Sector breakdown %Financials 20.2Industrials 17.0Consumer services 12.5Consumer goods 11.4Health care 10.3Oil & gas 10.3Utilities 7.1Telecommunications 4.0Basic materials 3.8Technology 3.5Forward currency contracts 0.0Net other liabilities (0.1)
Highest/lowest share price and distribution recordDistribution
Highest Lowest per shareCalendar year share price share price (net)
A-Class Accumulation SharesA
2008 53.75p 49.81p –
2009 58.98p 42.99p 1.18p
2010B 67.26p 56.37p 1.23p
A-Class Income SharesA
2008 53.75p 49.81p –
2009 57.70p 42.90p 1.15p
2010B 64.94p 55.04p 1.18p
A-Class Income GBP Hedge SharesC
2010B 62.22p 53.25p 0.74p
B-Class Income SharesD
2009 112.3p 83.31p 2.12p
2010B 126.7p 107.2p 2.29p
C-Class Income SharesE
2009 113.3p 83.86p 2.20p
2010B 127.9p 108.2p 2.34p
A A-Class Accumulation and A-Class Income Shares were launched on 15 December 2008.B To 31 July 2010.C A-Class Income GBP Hedge Shares were launched on 1 February 2010.D B-Class Income Shares were launched on 3 February 2009.E C-Class Income Shares were launched on 15 January 2009.
Portfolio turnover rate31.07.09 34.99%
31.07.10 35.52%
The portfolio turnover rate (PTR) reflects the total of security purchases and sales, less the total of shareissues and cancellations, expressed as a percentage of the average daily net asset values over the period.
Net asset values and Total expense ratiosNet assetvalue per Net asset Total
share class Number value per expenseDate £’000 of shares share ratio
A-Class Accumulation Shares
31.01.09 1,697 3,256,236 52.11p 1.68%
31.01.10 1,159 2,056,371 56.37p 1.66%
31.07.10 2,587 4,316,942 59.92p 1.68%
A-Class Income Shares
31.01.09 5,109 9,835,269 51.94p 1.68%
31.01.10 64,788 118,338,328 54.75p 1.68%
31.07.10 99,530 173,239,795 57.45p 1.68%
A-Class Income GBP Hedge Shares
31.07.10 341 602,635 56.65p 1.68%
B-Class Income Shares
31.01.10 1,761 1,651,280 106.7p 1.15%
31.07.10 2,923 2,605,893 112.2p 1.15%
C-Class Income Shares
31.01.09 276 271,694 101.6p 0.87%
31.01.10 21,773 20,228,038 107.6p 0.87%
31.07.10 68,780 60,671,162 113.4p 0.87%
The Net asset value and the Net asset value per income share are shown ex-dividend.
The total expense ratio (TER) takes into account the ACD fee and any fixed expenses charged to revenue overthe financial period, expressed as a percentage of the average daily net asset values over the same period.

191
ContinuationReturn to Index�
�
Portfolio statementAs at 31 July 2010
Market value Total netInvestment Holding £’000 assets %
Financials – 20.2% (22.2%)Banks – 7.8%BancorpSouth 71,760 646 0.4BB&T 82,580 1,327 0.8City National 44,140 1,612 0.9M&T Bank 30,830 1,721 1.0Northern Trust 81,300 2,478 1.4People’s United Financial 73,030 648 0.4TCF Financial 89,380 897 0.5Wells Fargo 234,350 4,163 2.4General financial – 2.5%American Express 69,140 1,977 1.1T. Rowe Price 76,840 2,403 1.4Life insurance – 1.3%Assurant 36,500 871 0.5Metlife 53,860 1,390 0.8Nonlife insurance – 4.5%Chubb 33,110 1,123 0.6Cincinnati Financial 64,570 1,149 0.6Old Republic International 159,840 1,280 0.7OneBeacon Insurance Group ‘A’ 72,160 737 0.4The Travelers Companies 79,620 2,581 1.5Validus 75,973 1,205 0.7Real estate – 4.1%Acadia Realty Trust 52,000 619 0.3Agree Realty 63,210 929 0.5Alexandria Real Estate 19,290 865 0.5National Health Investors 35,350 854 0.5Public Storage 27,215 1,724 1.0Regency Centers 94,370 2,266 1.3
Industrials – 17.0% (10.3%)Aerospace & defence – 1.8%United Technologies 68,580 3,133 1.8Construction & materials – 1.8%Sherwin-Williams 30,310 1,334 0.8Vulcan Materials 62,760 1,814 1.0Electronics & electrical equipment – 2.3%Cooper Industries 39,510 1,149 0.6Emerson Electric 57,940 1,852 1.1Tyco Electronics 61,600 1,069 0.6General industrials – 4.3%3M 36,870 2,044 1.2Bemis 128,370 2,443 1.4Honeywell International 105,980 2,905 1.7Industrial engineering – 1.6%Deere & Co 30,430 1,260 0.7Illinois Tool Works 57,760 1,607 0.9Industrial transportation – 2.7%Norfolk Southern 14,440 518 0.3Seaspan 204,530 1,467 0.8Teekay 91,840 1,644 0.9United Parcel Service ‘B’ 31,230 1,291 0.7Support services – 2.5%Fastenal 53,050 1,668 1.0Grainger (W.W.) 20,220 1,444 0.8Republic Services 57,380 1,178 0.7
Consumer services – 12.5% (11.4%)General retailers – 4.9%Gap 201,230 2,324 1.3Home Depot 60,560 1,090 0.6Tiffany & Co 85,500 2,278 1.3TJX Companies 53,970 1,417 0.8Wal-Mart Stores 48,490 1,589 0.9Media – 3.8%McGraw-Hill 42,730 826 0.5Omnicom Group 68,390 1,636 0.9Time Warner 96,040 1,927 1.0Time Warner Cable 47,020 1,680 1.1Washington Post Company ‘B’ 1,900 515 0.3Travel & leisure – 3.8%Darden Restaurants 18,040 486 0.3McDonald’s 54,400 2,423 1.4Regal Entertainment Group ‘A’ 195,440 1,720 1.0Yum Brands 70,700 1,876 1.1
Market value Total netInvestment Holding £’000 assets %
Consumer goods – 11.4% (12.1%)Automobiles & parts – 1.0%Genuine Parts 65,550 1,796 1.0Beverages – 1.6%Coca-Cola 77,510 2,736 1.6Food producers – 2.8%General Mills 68,840 1,508 0.9Mead Johnson Nutrition ‘A’ 30,150 1,012 0.6Smucker (J.M.) 56,290 2,206 1.3Household goods – 1.2%Procter & Gamble 21,590 855 0.5Snap-On 43,480 1,241 0.7Leisure goods – 0.4%Hasbro 23,750 638 0.4Personal goods – 1.9%Kimberly-Clark 23,800 977 0.6Nike ‘B’ 24,610 1,162 0.7VF 22,510 1,145 0.6Tobacco – 2.5%Lorrilard 24,010 1,168 0.7Philip Morris International 97,020 3,187 1.8
Health care – 10.3% (11.3%)Health care equipment & services – 1.7%Becton Dickinson & Co 41,240 1,788 1.0Lincare 79,300 1,213 0.7Pharmaceuticals & biotechnology – 8.6%Abbott Laboratories 24,480 769 0.4Johnson & Johnson 123,320 4,577 2.6Merck 209,930 4,722 2.7Pfizer 522,113 5,051 2.9
Oil & gas – 10.3% (10.9%)Oil & gas producers – 9.4%Chevron 117,280 5,723 3.3ConocoPhillips 134,560 4,710 2.7ExxonMobil 86,110 3,335 1.9Marathon Oil 31,340 671 0.4Occidental Petroleum 37,150 1,853 1.1Oil equipment, services & distribution – 0.9%Williams 122,560 1,504 0.9
Utilities – 7.1% (8.7%)Electricity – 4.5%CMS Energy 230,370 2,387 1.4Northeast Utilities 87,180 1,570 0.9PG&E 41,610 1,188 0.7Southern Company 52,680 1,200 0.7Xcel Energy 100,430 1,434 0.8Gas, water & multiutilities – 2.6%American Water Works 78,300 1,067 0.6Equitable Resources 65,970 1,559 0.9ONEOK 35,620 1,063 0.6Questar 1,290 14 –Spectra Energy 64,660 858 0.5
Telecommunications – 4.0% (6.5%)Fixed line telecommunications – 4.0%AT&T 126,570 2,114 1.2CenturyLink 69,930 1,589 0.9Frontier Communications ‘B’ 37,356 184 0.1Verizon Communications 166,520 3,085 1.8
Basic materials – 3.8% (2.7%)Chemicals – 3.8%Air Products & Chemicals 35,710 1,666 1.0Du Pont de Nemours 64,200 1,670 1.0PPG Industries 69,560 3,072 1.8
Technology – 3.5% (3.2%)Software & computer services – 2.5%IBM 22,675 1,863 1.1Microsoft 142,050 2,374 1.4Technology hardware & equipment – 1.0%Intel 128,490 1,734 1.0

192
ContinuationReturn to Index�
�
Market value Total netInvestment Holding £’000 assets %
Portfolio statement – continuedAs at 31 July 2010
Forward currency contracts – 0.0% (0.0%)US DollarForward foreign currency position
09/08/10 £308,292 308 0.2Forward foreign currency position
09/08/10 $(471,090) (302) (0.2)Forward foreign currency position
09/09/10 £28,950 29 –Forward foreign currency position
09/09/10 $(45,143) (29) –
Investment assets 174,316 100.1
Net other liabilities (155) (0.1)
Net assets 174,161 100.0
Unless otherwise stated the above securities are admitted to official stock exchange listings or trade on aregulated market.
The comparative percentage figures in brackets are at 31 January 2010.

193
ContinuationReturn to Index�
�
£’000
Total of all purchases for the period 108,258
Major purchases Cost
ConocoPhillips 3,020Chevron 2,815Pfizer 2,693Bemis 2,469Johnson & Johnson 2,437Wells Fargo 2,365Merck 2,364ExxonMobil 2,0833M 2,043Time Warner Cable 1,997Northern Trust 1,971Gap 1,783Verizon Communications 1,746Philip Morris International 1,740Tiffany & Co 1,724Du Pont de Nemours 1,652Lincare 1,573United Technologies 1,544Fastenal 1,488Honeywell International 1,473
£’000
Total of all sales for the period 23,865
Major sales Proceeds
Consolidated Communications 1,565ExxonMobil 1,500Bank of New York Mellon 1,392Nstar 1,385Verizon Communications 1,144M&T Bank 982Kimco Realty 946American Electric Power 883Goldman Sachs Group 882PepsiCo 862Darden Restaurants 762Windstream 705Emerson Electric 694Chubb 654H&R Block 612Marathon Oil 544Hasbro 504VF 498McGraw-Hill 440Plum Creek Timber 429
Portfolio movements For the six months ended 31 July 2010

194
Return to Index�
Financial statements
Statement of total return(Unaudited)
For the six months ended 31 July2010 2009
£’000 £’000 £’000 £’000
Income
Net capital gains/(losses) 912 (12)
Revenue 2,107 604
Expenses (940) (255)
Net revenue before taxation 1,167 349
Taxation (296) (85)
Net revenue after taxation 871 264
Total return before distributions 1,783 252
Finance costs: Distributions (1,693) (431)
Change in net assets attributable to shareholders from investment activities 90 (179)
Statement of change in net assets attributable to shareholders(Unaudited)
For the six months ended 31 July2010 2009
£’000 £’000 £’000 £’000
Opening net assets attributable to shareholders 89,481 7,082
Amounts receivable on issue of shares 89,419 50,030
Amounts payable on cancellation of shares (4,859) (1,721)
84,560 48,309
Change in net assets attributable to shareholders from investment activities (see above) 90 (179)
Retained distributions on accumulation shares 30 6
Closing net assets attributable to shareholders 174,161 55,218
As the comparatives in the above table are for the previous interim period, the Net assets at the end ofthat period will not agree to the Net assets at the start of the current period.
Balance sheet(Unaudited)
As at31 July 2010 31 January 2010
£’000 £’000 £’000 £’000
ASSETS
Investment assets 174,316 88,882
Debtors 4,439 3,691
Cash and bank balances 1,476 1,650
Total other assets 5,915 5,341
Total assets 180,231 94,223
LIABILITIES
Creditors (4,886) (4,102)
Distribution payable on income shares (1,184) (640)
Total liabilities (6,070) (4,742)
Net assets attributable to shareholders 174,161 89,481

195
ContinuationReturn to Index�
�
JPM US Fund
Investment objective and policyTo provide capital growth over the long term by investing primarily througha portfolio invested in the shares of US companies.
Risk profileThis equity based Fund is designed for investors looking for broad marketexposure, primarily to a single developed stock market.
Equity investment is subject to specific risks relating to the performance ofthe individual companies held and the market’s perception of theirperformance. Equities are also subject to systematic risks such as generaleconomic conditions, inflation, interest rates, foreign exchange rates andindustry sector risks. In general terms, equities tend to be more volatile than bonds.
Funds that invest predominantly in a single market, asset class or sectormay be subject to greater volatility than those funds with a more diversifiedportfolio.
The underlying assets of the Fund are denominated in a currency other thanSterling and are not hedged back to Sterling. Investors will therefore beexposed to the currency risk of fluctuations between Sterling and the currencydenomination of the underlying assets.
Fund review• US equity markets had a good start to the review period as strengthening
economic data boosted investor confidence that a double dip recessionmay be averted. However, US equities changed course in May as investorsgrew fearful that the potential credit crisis in Europe, as well as a slowdownin the Chinese economy, would negatively impact the global economicrecovery. Other notable news items unsettling the markets includeduncertainty over the eventual outcome of US financial reform and the oilspill in the Gulf of Mexico. However, markets rallied in July, ending theperiod in positive territory.
• The Fund underperformed its benchmark. While the portfolio experiencedstrong stock selection in the consumer staples and materials sectors, thiswas insufficient to overcome the difficulties experienced in the portfolio’sinformation technology and healthcare holdings, which hindered relativeperformance the most. On a stock specific basis, an overweight positionin Eaton was the top contributor to relative performance, while a lack ofexposure to Apple was among the top detractors.
Fund outlook• The recovery in equity markets and the rebound in real economic activity
has in large part been a function of improving corporate sector profitabilitywhich has in turn been driven to a great extent by aggressive corporatesector cost-cutting. Despite the recent progress made to regulatory reformin Europe, China and the US, we expect equity markets to deliver a modestlevel of returns over the year.
You should remember that past performance is not a guide to the future. The price of investments and the income from them may fall as well as rise andinvestors may not get back the full amount invested. For specific risks, please read the Simplified Prospectus.All performance returns are calculated using the quoted price of the accumulation or income shares. Performance returns are in Sterling.FX Adjusted returns have been calculated by JPMAM. Blended benchmarks have been calculated by JPMAM.Source: J.P. Morgan.
Rolling 12 month performance as at 31 July2010/2009 2009/2008 2008/2007 2007/2006 2006/2005
JPM USA-Class Acc 17.4% -4.3% -11.5% 6.0% 2.0%
JPM USI-Class Acc 18.2% -3.3% -10.6% – –
JPM USX-Class Inc 19.4% -2.5% -10.1% – –
Benchmark Index 20.1% -4.8% -9.1% 6.3% -1.2%
Six month performance31/01/10–31/07/10
JPM US A-Class Acc 3.8%
Benchmark Index 5.9%
Fund statisticsFund size £149.4m
Benchmark Index S&P 500 (Total Return Net)
Fund chargesA-Class Initial 4.25%, Annual 1.50%I-Class Initial Nil, Annual 0.60% X-Class On application
Top ten holdings %Microsoft 4.0ExxonMobil 3.8Bank of America 3.3IBM 3.1Hewlett Packard 3.0Wal-Mart Stores 3.0Chevron 2.8Eaton 2.7Capital One Financial 2.3Time Warner 2.3

196
ContinuationReturn to Index�
�
Sector breakdown %Technology 17.9Financials 16.8Consumer services 12.7Industrials 11.2Oil & gas 10.9Health care 10.2Consumer goods 9.1Basic materials 3.7Utilities 3.7Telecommunications 2.3Futures 0.1Net other assets 1.4
Highest/lowest share price and distribution recordDistribution
Highest Lowest per shareCalendar year share price share price (net)
A-Class Accumulation Shares
2005 348.1p 272.1p 0.00p
2006 363.0p 319.9p 0.00p
2007 386.7p 326.7p 0.12p
2008 358.7p 254.0p 0.00p
2009 364.9p 248.4p 1.61p
2010A 410.1p 339.2p 0.33p
A-Class Income SharesB
2007 52.31p 45.64p –
2008 50.10p 35.48p 0.00p
2009 50.65p 34.46p 0.26p
2010A 56.85p 47.01p 0.07p
I-Class Accumulation SharesC
2007 110.0p 93.37p 0.01p
2008 102.6p 73.25p 1.03p
2009 106.6p 71.92p 1.36p
2010A 119.9p 99.28p 0.74p
X-Class Income SharesC
2007 106.4p 90.59p 0.00p
2008 99.58p 70.70p 0.94p
2009 101.9p 68.43p 1.64p
2010A 113.5p 94.03p 1.17p
A To 31 July 2010.B A-Class Income Shares were launched on 1 September 2007.C I-Class Accumulation and X-Class Income Shares were launched on 2 January 2007.
Portfolio turnover rate31.07.09 80.50%
31.07.10 107.46%
The portfolio turnover rate (PTR) reflects the total of security purchases and sales, less the total of shareissues and cancellations, expressed as a percentage of the average daily net asset values over the period.
Net asset values and Total expense ratiosNet assetvalue per Net asset Total
share class Number value per expenseDate £’000 of shares share ratio
A-Class Accumulation Shares
31.01.08 126,102 38,221,070 329.9p 1.64%
31.01.09 144,235 48,329,897 298.4p 1.67%
31.01.10 164,884 48,171,126 342.3p 1.67%
31.07.10 137,507 38,730,574 355.0p 1.68%
A-Class Income Shares
31.01.08D 54 117,093 46.09p 1.68%
31.01.09D 258 622,540 41.39p 1.68%
31.01.10D 1,386 2,921,275 47.44p 1.66%
31.07.10 2,116 4,300,274 49.21p 1.68%
I-Class Accumulation Shares
31.01.08 96,259 101,906,418 94.46p 0.60%
31.01.09 51,508 59,693,964 86.29p 0.60%
31.01.10 10,317 10,349,229 99.69p 0.60%
31.07.10 6,243 6,003,467 104.0p 0.60%
X-Class Income Shares
31.01.08D 22,349 24,602,189 90.84p 0.06%
31.01.09D 14,365 17,563,817 81.79p 0.06%
31.01.10D 6,392 6,784,060 94.22p 0.06%
31.07.10 3,568 3,621,205 98.52p 0.06%
D The Net asset value and the Net asset value per income share are shown ex-dividend at the financial year end.
The total expense ratio (TER) takes into account the ACD fee and any fixed expenses charged to revenue overthe financial period, expressed as a percentage of the average daily net asset values over the same period.

197
ContinuationReturn to Index�
�
Market value Total netInvestment Holding £’000 assets %
Portfolio statementAs at 31 July 2010
Technology – 17.9% (16.6%)Software & computer services – 7.9%CA 10,900 136 0.1Computer Sciences 36,600 1,061 0.7IBM 55,700 4,575 3.1Microsoft 356,000 5,949 4.0Technology hardware & equipment – 10.0%Apple 13,200 2,187 1.5Harris 20,600 598 0.4Hewlett Packard 150,554 4,482 3.0Intel 46,900 633 0.4Intersil ‘A’ 106,800 784 0.5Lexmark International ‘A’ 27,100 634 0.4LSI Corporation 93,235 244 0.2Marvell Tech Group 57,400 548 0.4Novellus Systems 50,400 872 0.6Qualcomm 13,900 346 0.2SanDisk 6,700 188 0.1Seagate Technology 98,200 793 0.5Syniverse 8,400 121 0.1Western Digital 48,200 835 0.5Xerox 281,700 1,738 1.2
Financials – 16.8% (14.5%)Banks – 5.8%Bank of America 540,850 4,865 3.3PNC Financial Services Group 32,200 1,232 0.8Wells Fargo 139,700 2,482 1.7General financial – 6.1%Ameriprise Financial 50,900 1,404 0.9Apollo Investment 160,100 1,079 0.7Capital One Financial 127,100 3,461 2.3CME Group ‘A’ 8,000 1,467 1.0Goldman Sachs Group 12,950 1,268 0.9SLM 64,200 488 0.3Life insurance – 0.8%Prudential Financial 34,700 1,248 0.8Nonlife insurance – 2.7%Allied World Assurance 32,700 1,043 0.7Alterra Capital 113,400 1,415 0.9Endurance Speciality 20,900 518 0.4Xl Group 94,400 1,081 0.7Real estate – 1.4%Digital Realty Trust 11,500 458 0.3Realty Income 17,700 361 0.3Simon Property Group 9,878 558 0.4UDR 48,000 649 0.4
Consumer services – 12.7% (12.2%)Food & drug retailers – 1.7%Cardinal Health 21,400 444 0.3McKesson 50,800 2,083 1.4General retailers – 5.5%Macy’s 94,750 1,133 0.7Signet Jewelers 62,600 1,190 0.8TJX Companies 16,100 423 0.3Wal-Mart Stores 135,400 4,437 3.0Williams-Sonoma 66,000 1,127 0.7Media – 3.9%Gannett 159,200 1,354 0.9Time Warner 169,033 3,392 2.3Viacom ‘B’ 52,200 1,104 0.7Travel & leisure – 1.6%Starbucks 70,300 1,118 0.8UAL 32,400 494 0.3Wyndham Worldwide 49,400 803 0.5
Industrials – 11.2% (13.2%)Aerospace & defence – 2.7%General Dynamics 40,200 1,593 1.0Northrop Grumman 26,900 1,009 0.7United Technologies 31,700 1,448 1.0Electronics & electrical equipment – 1.5%Cooper 14,600 425 0.3Emerson Electric 12,200 390 0.2Jabil Circuit 10,800 102 0.1Thomas & Betts 51,800 1,333 0.9
Market value Total netInvestment Holding £’000 assets %
General industrials – 2.7%Eaton 80,400 3,998 2.7Industrial engineering – 1.4%Cummins 10,300 523 0.4Gardner Denver 9,200 301 0.2Oshkosh Truck 51,000 1,124 0.8Industrial transportation – 1.3%Norfolk Southern 30,200 1,084 0.7United Parcel Service ‘B’ 22,000 909 0.6Support services – 1.6%Alliance Data System 15,500 572 0.4Fidelity National Information Services 43,400 798 0.5R.R. Donnelley & Sons 93,900 1,020 0.7
Oil & gas – 10.9% (11.9%)Oil & gas producers – 8.8%Anadarko Petroleum 11,400 365 0.2Apache 10,600 649 0.4Chevron 87,100 4,250 2.8Cimarex Energy 14,900 660 0.4Devon Energy 33,700 1,352 0.9Energen 13,300 383 0.3ExxonMobil 145,246 5,626 3.8Oil equipment, services & distribution – 2.1%Cameron International 19,100 485 0.3Dresser Rand Group 17,300 411 0.3National Oilwell Varco 89,900 2,242 1.5
Health care – 10.2% (12.1%)Health care equipment & services – 5.2%Aetna 45,500 802 0.5Community Health Systems 24,400 471 0.3Health Net 74,800 1,127 0.8Humana 40,100 1,189 0.8Kinetic Concepts 45,100 1,015 0.7Medtronic 55,500 1,286 0.9United Health Group 88,200 1,722 1.2Pharmaceuticals & biotechnology – 5.0%Amgen 56,900 1,948 1.3Cephalon 19,900 725 0.5Endo Pharmaceutical 32,400 498 0.3Forest Laboratories 27,700 495 0.3Genzyme 6,200 278 0.2Hospira 27,300 905 0.6Johnson & Johnson 8,200 304 0.2Merck 59,100 1,329 0.9Warner Chilcott 62,000 970 0.7
Consumer goods – 9.1% (7.9%)Automobiles & parts – 0.4%Autoliv 17,600 650 0.4Beverages – 1.0%Dr Pepper Snapple Group 61,600 1,468 1.0Food producers – 3.2%ConAgra Foods 50,000 749 0.5Del Monte Foods 124,800 1,097 0.7Herbalife 41,200 1,327 0.9Smucker (J.M.) 10,500 411 0.3Tyson Foods ‘A’ 113,400 1,263 0.8Household goods – 1.6%Energizer 33,800 1,314 0.9Whirlpool 18,800 1,015 0.7Personal goods – 1.3%Kimberly-Clark 48,200 1,979 1.3Tobacco – 1.6%Lorrilard 49,800 2,423 1.6
Basic materials – 3.7% (4.3%)Chemicals – 2.1%Ashland 20,500 680 0.4Celanese ‘A’ 25,400 455 0.3PPG Industries 46,600 2,058 1.4Industrial metals – 1.6%Cliffs Natural Resources 15,700 566 0.4Freeport-McMoRan Copper & Gold 40,050 1,818 1.2

198
ContinuationReturn to Index�
�
Portfolio statement – continuedAs at 31 July 2010
Market value Total netInvestment Holding £’000 assets %
Utilities – 3.7% (3.1%)Electricity – 1.9%Alliant Energy 2,200 50 –American Electric Power 56,600 1,310 0.9DTE Energy 17,400 538 0.4PG&E 33,700 962 0.6Gas, water & multiutilities – 1.8%Sempra Energy 81,400 2,610 1.8
Telecommunications – 2.3% (2.4%)Fixed line telecommunications – 2.3%AT&T 48,800 815 0.5CenturyLink 26,235 596 0.4Frontier Communications ‘B’ 16,631 82 0.1Verizon Communications 69,100 1,280 0.9Windstream 89,600 664 0.4
Futures – 0.1% (0.0%)S&P 500 E-Mini Futures Sep 2010 80 86 0.1
Investment assets 147,285 98.6
Net other assets 2,149 1.4
Net assets 149,434 100.0
Unless otherwise stated the above securities are admitted to official stock exchange listings or trade on aregulated market.
The comparative percentage figures in brackets are at 31 January 2010.

199
ContinuationReturn to Index�
�
£’000
Total of all purchases for the period 122,546
Major purchases Cost
Chevron 5,441Capital One Financial 4,945ExxonMobil 4,527Microsoft 3,733Hewlett Packard 3,663Wal-Mart Stores 3,540IBM 3,531Lorrilard 3,283Boeing 3,070National Oilwell Varco 2,883Apple 2,772Eaton 2,587United Technologies 2,382PPG Industries 2,309Bank of America 2,045Devon Energy 2,008CME Group ‘A’ 1,792Aetna 1,784United Parcel Service ‘B’ 1,698Energizer 1,665
£’000
Total of all sales for the period 161,678
Major sales Proceeds
Pfizer 6,209Cisco Systems 4,247Occidental Petroleum 4,199Goldman Sachs Group 4,039United Technologies 4,021Dell 3,940Apache 2,962Coca-Cola Enterprises 2,925Philip Morris International 2,879United Health Group 2,766Capital One Financial 2,763Boeing 2,747Freeport-McMoRan Copper & Gold 2,490Chevron 2,347Bank of America 2,315Dow Chemical 2,310ConocoPhillips 2,266Walgreen 2,078National Oilwell Varco 1,985United Parcel Service ‘B’ 1,983
Portfolio movements For the six months ended 31 July 2010

200
Return to Index�
Financial statements
Statement of total return(Unaudited)
For the six months ended 31 July2010 2009
£’000 £’000 £’000 £’000
Income
Net capital gains 6,531 1,879
Revenue 1,776 2,147
Expenses (1,535) (1,295)
Net revenue before taxation 241 852
Taxation (244) (299)
Net (expense)/revenue after taxation (3) 553
Total return before distributions 6,528 2,432
Finance costs: Distributions (31) (99)
Change in net assets attributable to shareholders from investment activities 6,497 2,333
Statement of change in net assets attributable to shareholders(Unaudited)
For the six months ended 31 July2010 2009
£’000 £’000 £’000 £’000
Opening net assets attributable to shareholders 182,979 210,366
Amounts receivable on issue of shares 19,224 21,649
Amounts payable on cancellation of shares (59,266) (47,890)
(40,042) (26,241)
Change in net assets attributable to shareholders from investment activities (see above) 6,497 2,333
Closing net assets attributable to shareholders 149,434 186,458
As the comparatives in the above table are for the previous interim period, the Net assets at the end ofthat period will not agree to the Net assets at the start of the current period.
Balance sheet(Unaudited)
As at31 July 2010 31 January 2010
£’000 £’000 £’000 £’000
ASSETS
Investment assets 147,285 179,672
Debtors 417 6,729
Cash and bank balances 2,903 5,690
Total other assets 3,320 12,419
Total assets 150,605 192,091
LIABILITIES
Creditors (1,171) (9,031)
Distribution payable on income shares – (81)
Total liabilities (1,171) (9,112)
Net assets attributable to shareholders 149,434 182,979

201
JPM US Select Fund
Investment objective and policyTo invest in a portfolio of North American securities. The current policy isto invest for capital growth without any distribution target.
Risk profileThis equity based Fund is a core product designed to provide an exposureto US equities.
Equity investment is subject to specific risks relating to the performance ofthe individual companies held and the market’s perception of theirperformance. Equities are also subject to systematic risks such as generaleconomic conditions, inflation, interest rates, foreign exchange rates andindustry sector risks. In general terms, equities tend to be more volatile than bonds.
Funds that invest predominantly in a single market, asset class or sectormay be subject to greater volatility than those funds with a more diversifiedportfolio.
The underlying assets of the Fund are denominated in a currency other thanSterling and are not hedged back to Sterling. Investors will therefore beexposed to the currency risk of fluctuations between Sterling and the currencydenomination of the underlying assets.
Fund review• US equity markets had a good start to the review period as strengthening
economic data boosted investor confidence that a double dip recessionmay be averted. However, US equities changed course in May as investorsgrew fearful that the potential credit crisis in Europe, as well as a slowdownin the Chinese economy, would negatively impact the global economicrecovery. Other notable news items unsettling the markets includeduncertainty over the eventual outcome of US financial reform and the oilspill in the Gulf of Mexico. However, markets rallied in July, ending theperiod in positive territory.
• The Fund underperformed its benchmark. Although the Fund experiencedstrong stock selection in the industrial cyclical and basic materials sectors,it fell short of overcoming the difficulties experienced in the portfolio’sREITs and systems hardware holdings. On a stock specific basis, overweightpositions in Deere & Co. and Norfolk Southern were the top contributorsto relative performance, while overweight positions in Covidien and Merckwere among the top detractors.
Fund outlook• The recovery in equity markets and the rebound in real economic activity
has in large part been a function of improving corporate sector profitabilitywhich has in turn been driven to a great extent by aggressive corporatesector cost-cutting. Despite the recent progress made to regulatory reformin Europe, China and the US, we expect equity markets to deliver a modestlevel of returns over the year.
You should remember that past performance is not a guide to the future. The price of investments and the income from them may fall as well as rise andinvestors may not get back the full amount invested. For specific risks, please read the Simplified Prospectus.All performance returns are calculated using the quoted price of the accumulation shares. Performance returns are in Sterling.FX Adjusted returns have been calculated by JPMAM. Blended benchmarks have been calculated by JPMAM.Source: J.P. Morgan.Formerly JPM Institutional US Fund, the Fund name was changed on 28/04/08.A On 01/05/04 the benchmark for this Fund was changed from FTSE World USA Net to S&P 500 Net.
Rolling 12 month performance as at 31 July2010/2009 2009/2008 2008/2007 2007/2006 2006/2005
JPM US Select A-Class Acc 19.4% 0.5% – – –
JPM US Select C-Class Acc 20.4% – – – –
JPM US Select I-Class Acc 20.4% 1.4% -10.4% 9.0% -3.6%
JPM US Select X-Class Inc 21.2% 1.9% -10.0% 9.4% -3.2%
Benchmark IndexA 20.1% -4.8% -9.1% 6.3% -1.2%
Six month performance31/01/10–31/07/10
JPM US Select A-Class Acc 5.2%
Benchmark IndexA 5.9%
Fund statisticsFund size £55.0m
Benchmark IndexA S&P 500 (Total Return Net)
Fund chargesA-Class Initial 4.25%, Annual 1.50%C-Class Initial Nil, Annual 0.75%I-Class Initial Nil, Annual 0.60%X-Class On application
Top ten holdings %Apple 2.9Hewlett Packard 2.8Microsoft 2.7Wells Fargo 2.4Cisco Systems 2.2Procter & Gamble 2.2Merck 2.0IBM 2.0Abbott Laboratories 2.0ExxonMobil 2.0
ContinuationReturn to Index�
�

202
ContinuationReturn to Index�
�
Sector breakdown %Technology 20.5Financials 14.8Consumer services 14.2Oil & gas 10.4Consumer goods 9.5Health care 9.3Industrials 9.1Basic materials 4.3Utilities 3.7Telecommunications 2.9Net other assets 1.3
Highest/lowest share price and distribution recordDistribution
Highest Lowest per shareCalendar year share price share price (net)
A-Class Accumulation SharesB
2008 52.25p 38.08p –
2009 56.71p 37.02p 0.19p
2010C 62.94p 53.29p 0.21p
A-Class Income SharesB
2008 52.25p 38.08p –
2009 56.38p 36.78p 0.19p
2010C 62.34p 52.78p 0.22p
C-Class Accumulation SharesD
2009 135.6p 101.1p –
2010C 150.9p 127.7p 0.98p
I-Class Accumulation Shares
2005 224.8p 181.4p 1.38p
2006 228.7p 202.1p 1.90p
2007 244.8p 212.4p 2.07p
2008 229.7p 165.8p 2.42p
2009 249.8p 161.6p 2.93p
2010C 277.7p 235.2p 2.42p
X-Class Income Shares
2005 221.5p 178.2p 2.37p
2006 222.8p 196.9p 2.64p
2007 236.2p 205.4p 2.93p
2008 222.3p 158.3p 3.29p
2009 235.4p 151.8p 3.60p
2010C 258.5p 219.3p 3.01p
B A-Class Accumulation and A-Class Income Shares were launched on 28 April 2008.C To 31 July 2010.D C-Class Accumulation Shares were launched on 23 March 2009.
Portfolio turnover rate31.07.09 82.30%
31.07.10 70.71%
The portfolio turnover rate (PTR) reflects the total of security purchases and sales, less the total of shareissues and cancellations, expressed as a percentage of the average daily net asset values over the period.
Net asset values and Total expense ratiosNet assetvalue per Net asset Total
share class Number value per expenseDate £’000 of shares share ratio
A-Class Accumulation Shares
31.01.09 12,574 28,218,344 44.56p 1.65%
31.01.10 19,212 35,995,467 53.37p 1.68%
31.07.10 28,906 51,515,631 56.11p 1.68%
A-Class Income Shares
31.01.09E 12 28,052 44.35p 1.66%
31.01.10E 63 118,556 52.85p 1.68%
31.07.10 345 620,582 55.57p 1.68%
C-Class Accumulation Shares
31.01.10 14,833 11,621,789 127.6p 0.87%
31.07.10 18,836 13,977,942 134.8p 0.87%
I-Class Accumulation Shares
31.01.08 13,735 6,521,300 210.6p 0.60%
31.01.09 5,991 3,082,038 194.4p 0.55%
31.01.10 2,703 1,151,910 234.7p 0.60%
31.07.10 2,409 970,875 248.1p 0.60%
X-Class Income Shares
31.01.08E 13,653 6,805,652 200.6p 0.06%
31.01.09E 13,414 7,353,233 182.4p 0.06%
31.01.10E 8,950 4,103,609 218.1p 0.06%
31.07.10 4,458 1,928,158 231.2p 0.06%
E The Net asset value and the Net asset value per income share are shown ex-dividend at the financial year end.
The total expense ratio (TER) takes into account the ACD fee and any fixed expenses charged to revenue overthe financial period, expressed as a percentage of the average daily net asset values over the same period.
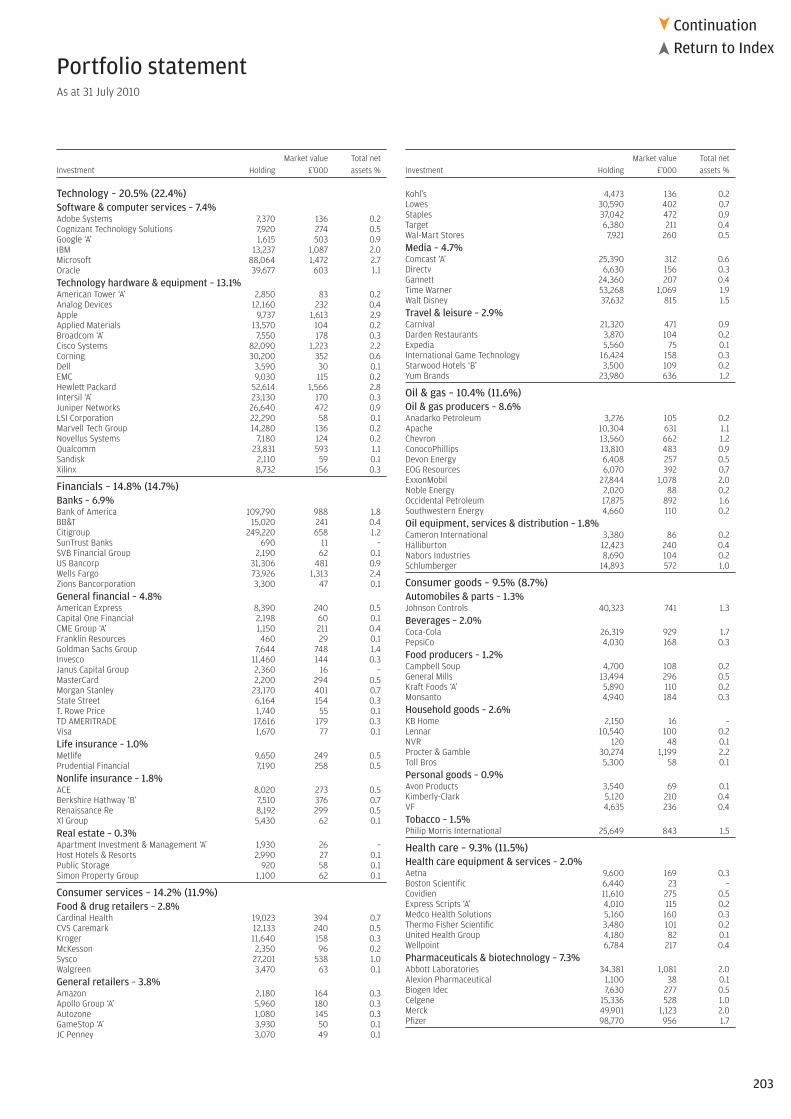
203
ContinuationReturn to Index�
�
Portfolio statementAs at 31 July 2010
Market value Total netInvestment Holding £’000 assets %
Technology – 20.5% (22.4%)Software & computer services – 7.4%Adobe Systems 7,370 136 0.2Cognizant Technology Solutions 7,920 274 0.5Google ‘A’ 1,615 503 0.9IBM 13,237 1,087 2.0Microsoft 88,064 1,472 2.7Oracle 39,677 603 1.1Technology hardware & equipment – 13.1%American Tower ‘A’ 2,850 83 0.2Analog Devices 12,160 232 0.4Apple 9,737 1,613 2.9Applied Materials 13,570 104 0.2Broadcom ‘A’ 7,550 178 0.3Cisco Systems 82,090 1,223 2.2Corning 30,200 352 0.6Dell 3,590 30 0.1EMC 9,030 115 0.2Hewlett Packard 52,614 1,566 2.8Intersil ‘A’ 23,130 170 0.3Juniper Networks 26,640 472 0.9LSI Corporation 22,290 58 0.1Marvell Tech Group 14,280 136 0.2Novellus Systems 7,180 124 0.2Qualcomm 23,831 593 1.1Sandisk 2,110 59 0.1Xilinx 8,732 156 0.3
Financials – 14.8% (14.7%)Banks – 6.9%Bank of America 109,790 988 1.8BB&T 15,020 241 0.4Citigroup 249,220 658 1.2SunTrust Banks 690 11 – SVB Financial Group 2,190 62 0.1US Bancorp 31,306 481 0.9Wells Fargo 73,926 1,313 2.4Zions Bancorporation 3,300 47 0.1General financial – 4.8%American Express 8,390 240 0.5Capital One Financial 2,198 60 0.1CME Group ‘A’ 1,150 211 0.4Franklin Resources 460 29 0.1Goldman Sachs Group 7,644 748 1.4Invesco 11,460 144 0.3Janus Capital Group 2,360 16 – MasterCard 2,200 294 0.5Morgan Stanley 23,170 401 0.7State Street 6,164 154 0.3T. Rowe Price 1,740 55 0.1TD AMERITRADE 17,616 179 0.3Visa 1,670 77 0.1Life insurance – 1.0%Metlife 9,650 249 0.5Prudential Financial 7,190 258 0.5Nonlife insurance – 1.8%ACE 8,020 273 0.5Berkshire Hathway ‘B’ 7,510 376 0.7Renaissance Re 8,192 299 0.5Xl Group 5,430 62 0.1Real estate – 0.3%Apartment Investment & Management ‘A’ 1,930 26 – Host Hotels & Resorts 2,990 27 0.1Public Storage 920 58 0.1Simon Property Group 1,100 62 0.1
Consumer services – 14.2% (11.9%)Food & drug retailers – 2.8%Cardinal Health 19,023 394 0.7CVS Caremark 12,133 240 0.5Kroger 11,640 158 0.3McKesson 2,350 96 0.2Sysco 27,201 538 1.0Walgreen 3,470 63 0.1General retailers – 3.8%Amazon 2,180 164 0.3Apollo Group ‘A’ 5,960 180 0.3Autozone 1,080 145 0.3GameStop ‘A’ 3,930 50 0.1JC Penney 3,070 49 0.1
Market value Total netInvestment Holding £’000 assets %
Kohl’s 4,473 136 0.2Lowes 30,590 402 0.7Staples 37,042 472 0.9Target 6,380 211 0.4Wal-Mart Stores 7,921 260 0.5Media – 4.7%Comcast ‘A’ 25,390 312 0.6Directv 6,630 156 0.3Gannett 24,360 207 0.4Time Warner 53,268 1,069 1.9Walt Disney 37,632 815 1.5Travel & leisure – 2.9%Carnival 21,320 471 0.9Darden Restaurants 3,870 104 0.2Expedia 5,560 75 0.1International Game Technology 16,424 158 0.3Starwood Hotels ‘B’ 3,500 109 0.2Yum Brands 23,980 636 1.2
Oil & gas – 10.4% (11.6%)Oil & gas producers – 8.6%Anadarko Petroleum 3,276 105 0.2Apache 10,304 631 1.1Chevron 13,560 662 1.2ConocoPhillips 13,810 483 0.9Devon Energy 6,408 257 0.5EOG Resources 6,070 392 0.7ExxonMobil 27,844 1,078 2.0Noble Energy 2,020 88 0.2Occidental Petroleum 17,875 892 1.6Southwestern Energy 4,660 110 0.2Oil equipment, services & distribution – 1.8%Cameron International 3,380 86 0.2Halliburton 12,423 240 0.4Nabors Industries 8,690 104 0.2Schlumberger 14,893 572 1.0
Consumer goods – 9.5% (8.7%)Automobiles & parts – 1.3%Johnson Controls 40,323 741 1.3Beverages – 2.0%Coca-Cola 26,319 929 1.7PepsiCo 4,030 168 0.3Food producers – 1.2%Campbell Soup 4,700 108 0.2General Mills 13,494 296 0.5Kraft Foods ‘A’ 5,890 110 0.2Monsanto 4,940 184 0.3Household goods – 2.6%KB Home 2,150 16 – Lennar 10,540 100 0.2NVR 120 48 0.1Procter & Gamble 30,274 1,199 2.2Toll Bros 5,300 58 0.1Personal goods – 0.9%Avon Products 3,540 69 0.1Kimberly-Clark 5,120 210 0.4VF 4,635 236 0.4Tobacco – 1.5%Philip Morris International 25,649 843 1.5
Health care – 9.3% (11.5%)Health care equipment & services – 2.0%Aetna 9,600 169 0.3Boston Scientific 6,440 23 – Covidien 11,610 275 0.5Express Scripts ‘A’ 4,010 115 0.2Medco Health Solutions 5,160 160 0.3Thermo Fisher Scientific 3,480 101 0.2United Health Group 4,180 82 0.1Wellpoint 6,784 217 0.4Pharmaceuticals & biotechnology – 7.3%Abbott Laboratories 34,381 1,081 2.0Alexion Pharmaceutical 1,100 38 0.1Biogen Idec 7,630 277 0.5Celgene 15,336 528 1.0Merck 49,901 1,123 2.0Pfizer 98,770 956 1.7

204
ContinuationReturn to Index�
�
Market value Total netInvestment Holding £’000 assets %
Portfolio statement – continuedAs at 31 July 2010
Industrials – 9.1 % (9.1%)Aerospace & defence – 1.9%Textron 8,870 118 0.2United Technologies 20,463 935 1.7Electronics & electrical equipment – 0.3%NV Energy 22,497 184 0.3General industrials – 2.6%General Electric 49,929 517 0.9Honeywell International 23,310 639 1.2Tyco International 12,240 290 0.5Industrial engineering – 2.2%Deere & Co 12,860 533 1.0Paccar 13,461 394 0.7Parker-Hannifin 7,420 293 0.5Industrial transportation – 2.0%Norfolk Southern 23,223 834 1.5Union Pacific 5,230 250 0.5Support services – 0.1%Genpact 3,440 33 0.1
Basic materials – 4.3% (3.4%)Chemicals – 2.7%Dow Chemical 34,510 604 1.1Du Pont de Nemours 33,420 869 1.6Mining – 1.6%Freeport-McMoRan Copper & Gold 18,608 845 1.6
Utilities – 3.7 % (2.7%)Electricity – 3.3%Constellation Energy Group 1,190 24 – Edison International 6,081 130 0.2Entergy 2,990 150 0.3Exelon 3,418 92 0.2Nextera Energy 8,414 283 0.5PG&E 8,870 253 0.5Public Service Enterprise Group 24,810 539 1.0Southern Company 7,090 161 0.3Xcel Energy 10,160 145 0.3Gas, water & multiutilities – 0.4%American Water Works 11,740 160 0.3Scana 2,870 71 0.1
Telecommunications – 2.9% (3.0%)Fixed line telecommunications – 1.3%AT&T 40,951 684 1.2Frontier Communications ‘B’ 8,074 40 0.1Mobile telecommunications – 1.6%Sprint Nextel 97,700 298 0.5Verizon Communications 33,640 623 1.1
Investment assets 54,259 98.7
Net other assets 695 1.3
Net assets 54,954 100.0
Unless otherwise stated the above securities are admitted to official stock exchange listings or trade on aregulated market.
The comparative percentage figures in brackets are at 31 January 2010.

205
ContinuationReturn to Index�
�
£’000
Total of all purchases for the period 31,842
Major purchases Cost
ExxonMobil 930E.I. du Pont de Nemours 747Freeport-McMoRan Copper & Gold 739Chevron 711Apache 687Abbott Laboratories 645Wells Fargo 625Apple 597Pfizer 558Qualcomm 551Goldman Sachs Group 546EOG Resources 515Merck 476Hewlett Packard 475Dow Chemical 475Johnson Controls 466United Technologies 446Bank of America 443Berkshire Hathway ‘B’ 443Microsoft 422
£’000
Total of all sales for the period 24,764
Major sales Proceeds
ExxonMobil 1,027Google ‘A’ 984Merck 770Goldman Sachs Group 672Hewlett Packard 593Occidental Petroleum 558Chevron 508Deere & Co 472Abbott Laboratories 427General Electric 423Praxair 408Wells Fargo 405Cisco Systems 397United States Steel 381Bank of America 366Philip Morris International 361AFLAC 339Wal-Mart Stores 332ConocoPhillips 327IBM 315
Portfolio movements For the six months ended 31 July 2010

206
Return to Index�
Financial statements
Statement of total return(Unaudited)
For the six months ended 31 July2010 2009
£’000 £’000 £’000 £’000
Income
Net capital gains 1,909 1,288
Revenue 514 357
Expenses (303) (111)
Net revenue before taxation 211 246
Taxation (74) (51)
Net revenue after taxation 137 195
Total return before distributions 2,046 1,483
Finance costs: Distributions (11) (32)
Change in net assets attributable to shareholders from investment activities 2,035 1,451
Statement of change in net assets attributable to shareholders(Unaudited)
For the six months ended 31 July2010 2009
£’000 £’000 £’000 £’000
Opening net assets attributable to shareholders 45,761 31,991
Amounts receivable on issue of shares 13,999 2,600
Amounts payable on cancellation of shares (6,841) (8,487)
7,158 (5,887)
Change in net assets attributable to shareholders from investment activities (see above) 2,035 1,451
Closing net assets attributable to shareholders 54,954 27,555
As the comparatives in the above table are for the previous interim period, the Net assets at the end ofthat period will not agree to the Net assets at the start of the current period.
Balance sheet(Unaudited)
As at31 July 2010 31 January 2010
£’000 £’000 £’000 £’000
ASSETS
Investment assets 54,259 45,300
Debtors 1,468 4,397
Cash and bank balances 736 4,243
Total other assets 2,204 8,640
Total assets 56,463 53,940
LIABILITIES
Creditors (1,509) (8,055)
Distribution payable on income shares – (124)
Total liabilities (1,509) (8,179)
Net assets attributable to shareholders 54,954 45,761

207
Return to Index�
Aggregated statement of total return(Unaudited)
For the six months ended 31 July2010 2009
£’000 £’000 £’000 £’000
Income
Net capital gains 414,675 1,084,181
Revenue 108,526 109,515
Expenses (59,741) (44,971)
Finance costs: Interest (3) (4)
Net revenue before taxation 48,782 64,540
Taxation (5,659) (4,986)
Net revenue after taxation 43,123 59,554
Total return before distributions 457,798 1,143,735
Finance costs: Distributions (38,524) (43,234)
Change in net assets attributable to shareholders from investment activities 419,274 1,100,501
Aggregated statement of change in net assetsattributable to shareholders(Unaudited)
For the six months ended 31 July2010 2009
£’000 £’000 £’000 £’000
Opening net assets attributable to shareholders 7,421,761 5,574,067
Amounts receivable on issue of shares 1,035,820 890,279
Amounts payable on cancellation of shares (1,066,215) (996,917)
(30,395) (106,638)
Change in net assets attributable to shareholders from investment activities (see above) 419,274 1,100,501
Retained distributions on accumulation shares 23,700 26,265
Stamp duty reserve tax (499) (224)
Unclaimed distributions 47 48
Closing net assets attributable to shareholders 7,833,888 6,594,019
As the comparatives in the above table are for the previous interim period, the Net assets at the end ofthat period will not agree to the Net assets at the start of the current period.
Aggregated Company financial statements
Aggregated balance sheet(Unaudited)
As at31 July 2010 31 January 2010
£’000 £’000 £’000 £’000
ASSETS
Investment assets 7,500,458 7,201,010
Debtors 170,815 196,964
Cash and bank balances 326,006 312,027
Total other assets 496,821 508,991
Total assets 7,997,279 7,710,001
LIABILITIES
Investment liabilities (10,430) (18,403)
Creditors (138,319) (260,463)
Bank overdraft (6,973) (2,475)
Distribution payable on income shares (7,669) (6,899)
Total other liabilities (152,961) (269,837)
Total liabilities (163,391) (288,240)
Net assets attributable to shareholders 7,833,888 7,421,761
Accounting policies
The interim financial statements of each of the sub-funds have bee prepared inaccordance with the Statement of Recommended Practice for Authorised Fundsissued by the Investment Management Association in November 2008.
The accounting policies applied are consistent with those of the annual financialstatements for the year ended 31 January 2010 and are described in those financialstatements.
This report has been prepared in accordance with the Financial Services Authority’sCollective Investment Schemes Sourcebook and was approved by the AuthorisedCorporate Director on 6 September 2010.
Ms T McDowall DirectorFor and on behalf of JPMorgan Funds Limited6 September 2010
Mr R ThompsonDirectorFor and on behalf of JPMorgan Funds Limited6 September 2010

Who to contact
Intermediaries
0800 727 770
If you are an investor with us please call
0800 20 40 20
Lines are open 9.00am to 5.30pm Monday to Friday.Telephone lines are recorded to ensure compliance with our legal and regulatory obligations and internal policies.
www.jpmorganassetmanagement.co.uk
Issued by JPMorgan Funds Limited which is authorised and regulated by the Financial Services Authority and is part of the J.P. Morgan Asset Management marketing group. Registered in England No 288533. Registered office 125 London Wall, London EC2Y 5AJ.
GB 09/10
Top Related