


Languages
Pages
Legal


INTERFERENCE METHODS FOR STANDARDIZING ANDTESTING PRECISION GAGE BLOCKS
By C. G. Peters and H. S. Boyd
ABSTRACT
Precision gages, which are blocks of metal (usually steel), having two opposite
faces plane, parallel, and a specified distance apart, are used in the shop as reference
end standards for checking micrometers and other measuring instruments, and also
as distance pieces or size blocks for precise mechanical work. The extensive use of
precision gages necessitated by the small tolerances allowed in the manufacture of
interchangeable machine parts has required more accurately determined end stand-
ards and more rapid and precise methods for comparing gages with these standards
than have been previously available.
Since comparisons of end standards with line standards by means of micrometer-
microscopes and of precision gages with end standards by means of contact instru-
ments are subject to appreciable errors, methods which make use of the interference
of light waves were used in making these measurements. With the interference
methods described in this article the planeness and parallelism errors of precision
surfaces can be measured, and the length of standard gages can be determined bydirect comparison with the standard light waves with an uncertainty of not more
than a few millionths of an inch. The errors of other gages can be determined bycomparison with these calibrated standards with equal precision. This process makesthe standard light waves, which have been determined to one part in four or five
million relative to the international meter the standards of length 'for this work.
The apparatus used for calibrating standards and comparing other gages with these
standards is illustrated by line drawings and thoroughly explained.
CONTENTSPage
I. Introduction 678
II. Optical method 679III. Interference of light 681
IV. Test for planeness of surfaces 684
1. Perpendicular incidence 684
2. Errors of interpretation 688
V. Adherence of surfaces 690
VI. Test for parallelism of surfaces 692
VII. Calibration of end standards with the Fabry and Perot interferometer. .
.
693
1. General plan pf apparatus 693
2. Source of light 694
3. Interferometer 694
4. Constant-temperature chamber 695
5. Spectrograph 695
6. Photographic 695
7. Determination of the order of interference 696
677

678 Scientific Papers of the Bureau of Standards [voi. t7
VII. Calibration of end standards with Fabry and Perot interferometer—Con.8. Correction of X 6979. Correction for the thickness of the platinum films 698
10. Correction for nonparallelism of the gage surfaces 69811. Computations 69912. Accuracy and sources of error 699
VIII. Comparison of gages with standards 7041. Comparison of length 7042. Comparison of parallelism of surfaces 706
IX. Intercomparison of three gages. 708X. Development of standard gages 7 10
XI. Comparison between gages and other objects 712XII. Summary 713
I. INTRODUCTION
Precision gages, which are blocks of metal (usually steel) having
two opposite faces plane, parallel, and a specified distance apart
are used in the shop as reference end standards for checking mi-
crometers and other measuring instruments, and also as distance
pieces or size blocks for precise mechanical work. The extensive
use of precision gages necessitated by the small tolerances allowed
in the manufacture of interchangeable machine parts, and the de-
velopment of the process of making these gages with errors of con-
struction that seldom amount to 0.5 micron (0.00002 inch)—in
most cases to not more than 0.25 micron (0.0000 1 inch)—have
created a need for more rapid and precise methods of test and also
for more accurately determined reference standards than have
been available. Since tests of the accuracy of precision gages can
be most readily made by comparison with secondary end stand-
ards of the same size and shape, gage blocks with very nearly per-
fect surfaces can be used in the testing laboratory as secondary end
standards when they have been accurately calibrated relative to
some fundamental standard of length and when it has been proved
that they retain their dimensions for a considerable period of time.
The fundamental standard of length, the International Proto-
type Meter, is a line standard whose length is the distance between
two lines ruled on a platinum-iridium bar carefully preserved in a
special vault at the International Bureau of Weights and Measures
near Paris. A duplicate of this bar, Meter No. 27, which is kept at
the Bureau of Standards, is the primary standard of length for the
United States. Other similar bars, graduated in various subdi-
visions of a meter and calibrated relative to the primary standards,
are Used as secondary or working standards. In calibrating these
secondary and intermediate line standards errors of 0.2 micron

zete
js
]Interference Methods for Testing Gage Blocks 679
(0.000008 inch) are possible, due to imperfections in the ruled
lines. «
The end standards of the Bureau of Standards have been cali-
brated heretofore by comparison with these line standards by the
methods of Fizeau 1 and Fischer. 2 These methods, requiring the
use of microscopes, are subject to errors of measurement which
may amount to 0.5 micron (0.00002 inch)
.
The comparisons between the secondary end standards and the
precision gages are usually made with contact comparators sub-
ject to errors of 0.5 micron (0.00002 inch).
Inasmuch as the tolerance on some machine work is ±2.5 mi-
crons ( ±0.0001 inch) , requiring the precision gage of the shop to be
correct within 0.25 to 0.5 micron (one or two hundred-thou-
sandths of an inch) , this degree of precision in the gages requires the
secondary end standards of the testing laboratory to be correct
within a few hundredths of a micron (millionths of an inch) . This
tolerance also requires that the errors of measurement in makingthe comparison between the gages and the standards should like-
wise be limited to a few hundredths of a micron. It is impossible
to attain this precision in measuring the irregularities in the sur-
faces of gages or end standards with any micrometric apparatus,
in calibrating end standards by comparison with line standards, or
or in making comparisons between end standards and precision
gages with any contact apparatus, because in each case the error
of measurement may be several times the allowable error. Theerror of measurement in the step from the standard meter to the
gage should not be more than 0.02 to 0.06 micron (one to three
millionths of an inch)
.
In December, 191 7, we undertook to develop an optical methodfor making these measurements, and in a short time, by applying
methods which make use of the interference of light waves, suc-
ceeded in solving the problem. 3
II. OPTICAL METHODInstead of calibrating the end standards by direct comparison
with line standards derived from the meter the lengths of stand-
ard light waves were chosen as the primary standards. These
1 Travaux et M&nories du Bureau International des Poids et Mesures, 10.2 Bull. Phil. Soc. of Washington, 18, p. 241 ; 1898.8 Reports on these methods have been given at the following meetings : Peters, American Society of Me-
chanical Engineers, New York, Dec. 5, 1918. Peters and Boyd, American Physical Society, Washington,Apr. 25, 1919; American Society of Mechanical Engineers, Washington, May 30, 1919; and PhilosophicalSociety of Washington, May 29, 1920. A popular article on the methods was published by Peters and Boydin the American Machinist, Sept. 30 and Oct. 7, 1930.

680 Scientific Papers of the Bureau of Standards [Vol. 17
waves possess all the necessary properties of fundamental units
' of length, the most important of which are constancy, reproduci-
bility, accuracy of measurement, and ease of application. As to
their constancy, reproducibility, and accuracy of determination
little need be said. The wave lengths of red, yellow, and green
radiations from cadmium have been determined by direct com-
parison with the standard meter by Michelson 4 in 1893 and re-
determined by Fabry and Benoit 5 in 1907, the values obtained
from these two independent determinations agreeing to one part
in sixteen million when corrected to similar conditions.
Numerous comparisons made by spectroscopists between these
fundamental wave lengths and the wave lengths emitted by other
luminous substances prove that the light waves are the most
dependable length units known. Their work has placed at our
disposal a large number of light sources which can be easily
obtained and operated and which emit radiations whose wavelengths are known to one part in four or five million. The only
remaining requirement is the easy application of these waves in
the calibration of end standards.
In making this application incandescent neon and helium gases,
giving wave lengths ranging from 0.40 to 0.75 micron (0.000016
to 0.000030 inch) were used. These have been determined 6 with
an accuracy of one part in four or five million and found to be exactly
reproducible within the limits of observational error. For an accu-
racy of one millionth of an inch a comparison with these waves is
therefore exactly equivalent to a comparison with the standard
meter.
Three sets of carefully selected gages, each containing 81 blocks
of various lengths from 0.05 to 4 inches, were chosen as the sec-
ondary end standards for gage calibration by interference methods.
The planeness and parallelism of the surfaces and length of the
gages were determined by means of the interference fringes seen
in monochromatic light. To test for planeness, a glass true plane
was placed over each gage surface and the curvature of the inter-
ference fringes in monochromatic light was determined by meansof the Pulfrich instrument described below. Each gage was then
made the separator for two interferometer plates, thus forming a
Fabry and Perot interferometer. Lack of parallelism of the sur-
1 Michelson, Travaux et Memoires du Bureau International des Poids et Mesures, 2 ; 1895.6 Fabry and Benoit, Travaux et Memoires, 15; 1913.
6 Burns, Meggers, and Merrill, B. S. Sci. Papers, No. 329; 1918.

Bw"] Interference Methods for Testing Gage Blocks 68
1
faces was determined on moving the eye across the plates by the
expansion or contraction of the circular (Haidinger) rings, pro-
duced when the interferometer was illuminated with radiation
from a helium source. The distance between the interferometer
plates was determined from measurements on the diameters of
these rings. From this determination, by applying corrections
for the density of the air, lack of parallelism of the gage surfaces,
and thickness of the metallic film on the interferometer plates,
the length of the gage was obtained.
Several independent determinations made the same day on a
given gage agreed to 0.025 micron (0.000001 inch). Intercom-
parisons between similar gages from different sets and between
combinations of different gages proved that errors in the deter-
minations of these gages were in no case greater than 0.07 micron
(0.000003 inch) , and these errors were due in most cases to irreg-
ularities in the surfaces of the gages. With perfect gages and
accurately controlled conditions the precision of the measure-
ments should be comparable with the highest precision obtainable
in wave-length measurements.
After these end standards were calibrated a large number of
precision gages were compared with them by means of an inter-
ferometer comparator. With this instrument one person is able
to test the planeness and parallelism of the surfaces and length of
about 100 gages per day with an uncertainty of not more than
0.07 micron (0.000003 inch) . During the past year about 30 000
precision gages have been tested at the Bureau of Standards bytwo workers, which shows that the method is sufficiently rapid
for quantity work.
Thus it has been possible to originate, by the method fully de-
scribed below, end standards directly from the standard light waves
and to compare large numbers of commercial gages with these
standards by means of light interference, with an accuracy far
greater than can be attained in the manufacturing shops of the
country.
III. INTERFERENCE OF LIGHT
The sensation of light is due to transverse waves radiated by
luminous bodies. These waves vary in length, giving rise to
different color sensations. The range of the wave lengths visible
to the eye is from about 0.4 micron (0.000016 inch) for blue light
to 0.7 micron (0.000028 inch) for red.

682 Scientific Papers of the Bureau of Standards [Vol. 17
If two trains of waves from one point in a source having trav-
ersed different paths fall upon a point on the retina of the eye,
the resultant amplitude of vibration determines the brightness.
If they are "in step," maximum brightness results. If, however,
the troughs of the one arrive with the crests of the other, destruc-
tive interference takes place, resulting in relative darkness. If
the two trains travel different distances, so that the difference in
path is some whole number of wave lengths, then the waves will
reach the eye in phase. If the difference in path is equal to somewhole number of wave lengths plus one-half wave length, the
waves in the two trains will be in opposite phase, so that destruc-
tive interference takes place. The conditions for interference are
realized when light from an extended source S, Fig. 1, falls on a
thin transparent film. Part of the light is reflected from the first
surface, ABCD, and the remainder is
transmitted to the second surface,
ABGF, where partial reflection again
takes place. Since the wave trains
reaching E from these two reflections
have traveled over different distances,
reinforcement or destructive interfer-
ence can, therefore, occur. When white
light is used and the film is sufficiently
Fig. 1.—interference of light re- thin, a few brightly colored bands arefleeted from the surfaces of a S£en acrosg it§ surface _ If monochrO-thin film . . .
matic light—that is, light of one color
or of very limited spectral extent—be employed, alternate light
and dark bands or interference fringes may be observed to cross
the film.
If one of the surfaces of the film be plane, the shape of the other
surface can be obtained from measurements of the film thickness
at several points. To derive the relation between the film thick-
ness t and the shape of the interference fringes, consider the thin
film formed by the two plane surfaces which are represented bythe traces AC and AG, Fig. 2, inclined at a slight angle <£. Ob-
serving the film at an angle 6 with the normal, rays of light origi-
nating at the point 5 in the source and reflected by the two sur-
faces AC and AG will appear to come from the two sources Sj
and S2 . The difference in path of two rays reaching E is N\,
where iV is the "order of interference" or number of waves in the

Bwd] Interference Methods for Testing Gage Blocks 683
distance S2K and X is the wave length of the monochromatic light.
Let the distance between the two images of the source StS2= h.
N\ = h cos (d + a)
= h cos d cosa — h sin 6 sina
= 2 (a + b) sin cos 6 — 2d sin </> sin 6
= 2{a + b) sin<f> cos 6 — 2b sin <j> cos 6
= 2a sin ^ cos
= 2/COS0. (i)
FlG. 2.
—
Relation between the film thickness and the order of interference
If N is an integer, the two wave trains will be opposite in phase,
due to the phase change (-
) by reflection at the denser medium, 7
and the point observed will in that case appear dark. The locus
of the points for which N is a given integer is the interference
fringe of the Nth order and appears as a dark band across the film.
7 Only under special cases is this phase change exactly a half wave length; but it is not necessary in the
present case to determine its exact value.
87643°—22 2

684 Scientific Papers of the Bureau of Standards [Vol. 17
Equation (1) may also be expressed in the form
t=N±~, (2)
where P represents the perpendicular distance from E to the film
and I the distance from E to the point at which t is taken.
IV. TEST FOR PLANENESS OF SURFACES
1. PERPENDICULAR INCIDENCE
In testing the planeness of polished surfaces, such as are pro-
duced on prisms, surface plates, precision gages, or micrometer
anvils, a test plate is placed in close contact with and slightly
inclined to the surface to be tested, thus forming a thin wedge-
shaped film discussed in the previous section. This test plate is
of glass, one surface of which has been polished accurately true
plane and tested against a master true plane or liquid surface of
large extent. The accuracy of the test is, of course, limited bythe irregularities of the test-plate surface. It is very difficult to
make glass surfaces 50 to 75 mm (2 to 3 inches) in diameter plane
within 0.25 micron (0.000010 inch), and to reduce this error re-
quires exceptional skill. For ordinary work, however, test
plates plane within 0.25 micron (0.00001 inch) are sufficient, but
when it is necessary to determine irregularities of a few hun-
dredths of a micron (millionths of an inch) in the surface under
test, great care must be exercised in selecting and testing the test
plate.
In order to give a definite value to the wave length X, the thin
wedge-shaped film of air formed between the plane surface of the
test plate and the surface under test is illuminated with mono-chromatic light. A convenient source of monochromatic light
is a Bunsen flame, in which is inserted a piece of asbestos soaked
in a salt solution, or a ground glass plate illuminated either by a
helium lamp operated on a 5000-volt ac circuit, or by a mercury
vapor lamp covered with a green glass screen. The wave lengths
of the most effective visible radiation from these sources are
approximately
:
Sodium (yellow) =0.589 micron (0.0000232 inch).
Helium (yellow) =0.588 micron (0.0000231 inch).
Mercury (green) =0.546 micron (0.0000215 inch).
A colored glass screen illuminated by an incandescent lamp or
ordinary daylight may be used as a source if high precision is not

Boyd] Interference Methods for Testing Gage Blocks 685
desired, but the light will not be sufficiently monochromatic to
allow assignment of a definite value to the most effective wavelength.
A very convenient instrument for illuminating the film and
at the same time viewing the interference fringes on the film is
one designed by Pulfrich8 and shown in Fig. 3. The light from
a helium lamp H is focused upon a small total reflection prism p.
After being collimated by the lens1it is reflected by the prism R
down to the interferometer ABD, which is in the focal plane of
the lens Ot
. The rays reflected by the film surfaces are brought
to a focus by the lenses Oxand 2 upon the slit S, and images of
the interference pattern and the reference marks on the test plate
are viewed with the eyepiece C. The direct-vision prism Kseparates the fringe patterns due to the helium light of different
wave lengths. A pair of cross wires located at 5 and operated
frfr0, X 0, s c k
XFig. 3.
—
Optical system of the Pulfrich instrument
by a micrometer head make it possible to measure small dis-
placements of the fringes from the straight reference lines ruled
on the test plate AB. XWith this instrument and an exceedingly
true test plate the planeness of an unknown surface can be meas-
ured with an accuracy of 0.025 micron (0.000001 inch). The only
objection to the instrument is that the field is limited to about
2.5 cm (1 inch), so in testing a large surface only a small portion
can be seen at one time. Instruments of similar optical design
described by Schultz , Schonrock10, and Laurent11 eliminate this
objection by having fields of view as large as 25 cm (10 inches).
With these four instruments the rays of light coming from the
source to the film surfaces are made parallel by the lens systems
and when reflected back to the eye pass along the perpendicular
B Pulfrich, Zeits. f. Inst., 18, p. 261; 1898.
• Schultz, Zeits. f. Inst., 86, p. 252; 1914.
10 Brodhun and Schonrock, Zeits. I. Inst., 22, p. 355; 1902.
11 Laurent, C. R., 96, p. 1035: 1883.
686 Scientific Papers of the Bureau of Standards ivoi. i7
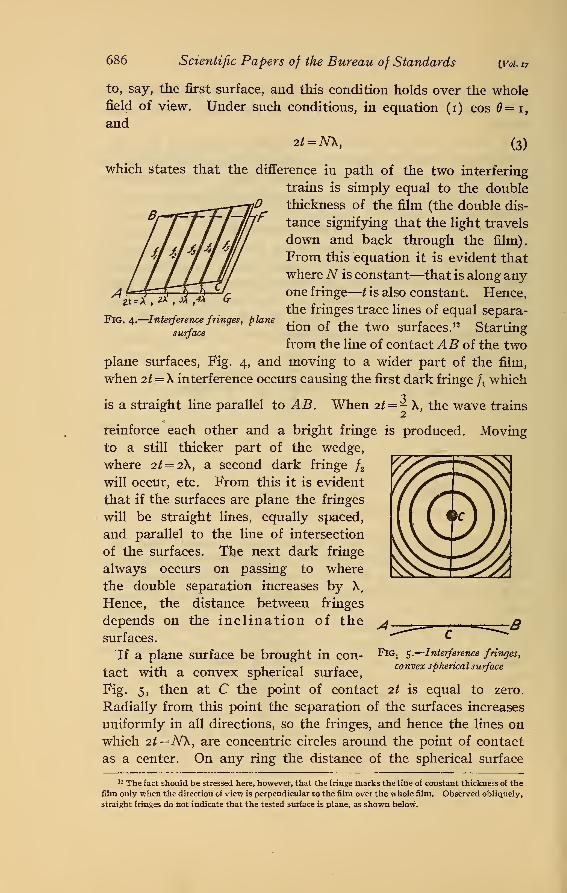
-Interference fringes, plane
surface
to, say, the first surface, and this condition holds over the wholefield of view. Under such conditions, in equation (i) cos 0=i,and
2t = N\, (3)
which states that the difference in path of the two interfering
trains is simply equal to the double
thickness of the film (the double dis-
tance signifying that the light travels
down and back through the film).
From this equation it is evident that
whereN is constant—that is along anyone fringe
—
t is also constant. Hence,
the fringes trace lines of equal separa-
tion of the two surfaces. 12 Starting
from the line of contact AB ot the twoplane surfaces, Fig. 4, and moving to a wider part of the film,
when 2t = X interference occurs causing the first dark fringe fxwhich
is a straight line parallel to AB. When 2t = - X, the wave trains
reinforce each other and a bright fringe is produced.
to a still thicker part of the wedge,
where 2t = 2\, a second dark fringe f2
will occur, etc. From this it is evident
that if the surfaces are plane the fringes
will be straight lines, equally spaced,
and parallel to the line of intersection
of the surfaces. The next dark fringe
always occurs on passing to where
the double separation increases by X.
Hence, the distance between fringes
depends on the inclination of thesurfaces.
If a plane surface be brought in con-
tact with a convex spherical surface,
Fig. 5, then at C the point of contact 2t is equal to zero.
Radially from this point the separation of the surfaces increases
uniformly in all directions, so the fringes, and hence the lines on
which 2t = N\, are concentric circles around the point of contact
as a center. On any ring the distance of the spherical surface
12 The fact should be stressed here, however, that the fringe marks the line of constant thickness of the
film only when the direction of view is perpendicular to the film over the whole film. Observed obliquely,
straight fringes do not indicate that the tested surface is plane, as shown below.
Fig. 5.
—
Interference fringes,
convex spherical surface

Peters']
Boyd JInterference Methods for Testing Gage Blocks 687
Fig. 6.
—
Interference fringes,
concave spherical surface
from the plane is equal to the number of the ring, counting from
the point of contact, times — By pressing down at A the plane
surface can be made to roll on the spherical surface, shifting the
point of contact and with it the center
of the ring system in the direction of Aor toward the point of application of the
pressure. With a convex surface, there-
fore, the center of the ring system lies
at the point of minimum separation.
If one of the surfaces be concave and
spherical, Fig. 6, a similar system of
concentric circular fringes is produced,
but in this case the center of the system
lies at the point of maximum separation.
Pressing down on A causes the center of
the ring system to shift toward B, the
direction of increasing separation, awayfrom the point of application of the
pressure. Thus, a slight pressure on one edge of the plane surface
AB serves to indicate whether the curved surface is convex or
concave.
With one surface plane and the other irregular the fringes are
irregular, each of which follows the
line of equal separation of the surfaces.
Whether the irregularity is a projection
or depression can be determined byapplying a slight pressure to one edge
of the upper surface and noting the
direction of shift of the fringes.
The amount a curved surface devi-
ates from a true plane can be readily
estimated as follows: Draw a straight
line FK, Fig. 7, across the center of
the true plane surface, parallel to the
line of contact AB of the surfaces.
Bring this line tangent to one of the
fringes at, say, the point H. It is
evident that this line represents the direction a fringe through Hwould take if the irregular surface could be converted into a
plane tangent to the irregular surface at H. The fractional
F L
Fig. 7.
—
Interference fringes
,
irregular surface

688 Scientific Papers of the Bureau of Standards {Vol. 17
part of the distance between two fringes by which the fringe ELdeviates from the straight line FK gives the fractional part of
a half wave length by which the irregular surface deviates along
FK from true plane. With AB as the line of contact, the point
F is estimated to be one-fourth wave length above and K one-
half wave length below the plane surface tangent at H.
2. ERRORS OF INTERPRETATION
Although the theory is quite explicit, it is a very common mis-
take to assume that straight fringes always indicate planeness
when a surface under test is placed on a true plane, and conversely
curved fringes indicate that the surface is not a true plane. Both
of these interpretations may be wrong. For example, the operator
may view the light reflected ob-
liquely by the film, and to makesure that the fringes are straight
he may lower his eye to sight
along them. Or, the fringes from
one position appearing curved,
he may shift to another and find
them quite straight, then draw
his conclusions from what he
observes under these, to him, best
conditions.
It is important to know something about the magnitude of the
errors which may be introduced by the assumption that straight
fringes always indicate planeness and curved ones indicate curva-
ture of the surface tested. The treatment of this falls under the
general case shown in Fig. 2, where the thickness of the film at any
point is given by equation (2)
Fig. 8.
—
Errors of interpretation caused
by viewing the film obliquely
JN\ I
2 P
which goes, for normal incidence, into equation (3)
(2)
(3)
Suppose from the point E, Fig. 8, a straight fringe is observed
along FK which is drawn parallel to AH. With one of the film
surfaces plane, how much does the other diverge from plane

BoT] Interference Methods for Testing Gage Blocks 689
between F and K? Using (3) instead of (2) in determining the
thickness of the film at any point gives
The error introduced is
t-t
<-£ (4)
'-<'(?-'}
<5)
The actual deviation from planeness between F and K is
At = h~ts. (6)
The observed deviation from (3) is
A*' = *',-&. (7)
The error introduced by using (3) instead of (2) is
S =U-W =(±-iy,-(±- i)*'k =(!-i)a*'+£aZ (8)
Where Al = h-ls.
This equation is seen to be consistent in that 5" becomes zero for
CHnormal incidence at both F and K, in which both( ^ — 1 ) and Al
are zero.
Sighting along a line from a normal position over K, ls = P;
S=K?->which states that the error in determining how much the tested
surface deviates from the plane is simply equal to that in deter-
mining the thickness of the film at F, equation (5)
.
If one observes the fringe obliquely at both F and K, If and Is
increasing and at the same time approaching equality, we have
for a given length FK the error represented by the term that
contains At', increasing with 6, while that represented by the
term containing Vs is decreasing. Take some numerical exam-ples:
(a) With the eye 10 inches aoove the center of a 6-inch surface
being tested on a true plane and viewing a diametrical fringe,
P = io, & = 10.445, Ik = P, applying (8)
5 — 0.044 A*' + 0.044 Vs.

690 Scientific Papers of the Bureau of Standards [Voi.17
(b) With the eye moved back 10 inches in a direction at right
angles to the fringe, P remaining constant, and viewing the center
K and the farthest edge F, ^ = 14.46 ZK = 14.14 we have from (8)
S=0.446 At' + 0.032 t'jL.
(c) With the eye moved back 20 inches instead of 10, h = 22.56,
Ik = 22.36,
5 = i .256 At' + o.o2o*'k.
A comparison of (a), (6), and (c) shows that the error arising
from the actual deviation in planeness increases rapidly with
oblique inspection, while the error rising from the thickness of the
film decreases. Both these effects
cause the fringes to straighten with
increasing 9. Therefore, using ob-
lique incidence slightly reduces the
error of measurement if the surface
under test is plane and greatly in-
creases the error if the surface de-
viates from plane. An improvementon the customary apparatus is madeby the addition of a thin plate of glass
P, set at an angle of 45 degrees to the
perpendicular EH from the eye to the
surface, Fig. 9. With this arrange-
ment the error due to deviation of
the surface from plane is eliminated
Fig. 9.
—
Optical system for testing
surfaces
and a correction can be applied for error due to the film thickness.
V. ADHERENCE OF SURFACES
When the plane surfaces of two gages, or of a gage and a glass
plate, are brought into intimate contact, they adhere to each
other, necessitating considerable force to separate them. Tocause this adherence the surfaces are first washed with benzol,
then with alcohol, and finally wiped with clean cotton to remove
all traces of grease and dust. The surface of the plate is brought
in contact with the gage surface and pressed on tightly to force
out the film of air. A drop of alcohol when placed on the plate
against the gage will spread out around the gage and pull the
two surfaces into very close contact. Any excess of liquid can
be forced out by sliding the surfaces on each other. When they

Bwd] Interference Methods for Testing Gage Blocks 691
come into close contact the adhesive force causes them to grip
each other and resist a large separating force.
A large number of measurements we have made show that
when two very plane surfaces are brought into contact in this
manner the separating film is not more than 0.025 micron
(0.000001 inch) thick. Doubtless the surfaces come into intimate
contact at the high points, the liquid filling the fine furrows or
scratches left by the finishing laps. Our tests show that two
gages with the ordinary lapped finish when brought into contact
as described require to separate them a pull in the direction
perpendicular to the surfaces of from 2.5 to 2.8 kg, per square
centimeter (35 to 40 pounds per square inch).
With gages possessing a high optical polish more intimate
contact is possible—that is, the capillary film is much thinner
—
and the required separating force ranges between 6.7 to 7 kg.
per square centimeter (95 and 100 pounds per square inch).
Considering the extreme thinness of the separating film whengood contact exists, the need of exceedingly plane surfaces is
apparent. A nick or burr on the edge or a small surface eleva-
tion which holds the two surfaces 0.25 micron (0.00001 inch)
apart makes adherence almost impossible. Two surfaces will
also adhere when covered with a film of grease or with moisture
from the hand. The thickness of these films, however, is a rather
indefinite quantity, in most cases about 0.07 micron (0.000003
inch), and while considerable force is required to slide the
gages on each other they can be pulled apart by a force of 5 to
10 pounds per square inch. With gages having slight surface
imperfections the oil film assists somewhat in holding them to-
gether and for the ordinary uses of gages the existence of the
oil or grease film introduces no appreciable error, but in makingaccurate calibration of the gages themselves it should be elim-
inated.
The results obtained with two different combinations of gages
are given in Table 1 to illustrate the effect produced by the film
between the gages. The five gages in the first set were brought
into contact as described above. The measured length of the
combination differed from the sum of lengths of the individual
gages by four millionths of an inch. The nine gages in the second
set were first brought into contact as described above. In this
case the measured length of the combination A differs from the
sum of the lengths of the individual gages by six millionths of an87643°—22 3
692 Scientific Papers of the Bureau of Standards [Vol. 17
inch. The gages were then separated, rubbed across the wrist,
and brought into contact again. The measured length B shows
that the length of the combination increased by thirty-four
millionths of an inch. This indicates that a film of moisture
about three to four millionths of an inch in thickness had been
introduced between each pair of gages.
TABLE 1.—Comparison of the Measured Lengths of Gage Combinations
Designation of length Inches
Gages 0. 30+0. 25+0. 20+0. 125+0. 120 inch:
Sum ol individual lengths
Measured length of combination
Gages 0. 15+0. 25+0. 30+0. 35+0. 40+0. 45+0. 55+0. 60+0. 90 inch
Sum of individual lengths
Measured length of combination AMeasured length of combination B
0.995011
. 995015
4. 000079
4. 000073
4. 000107
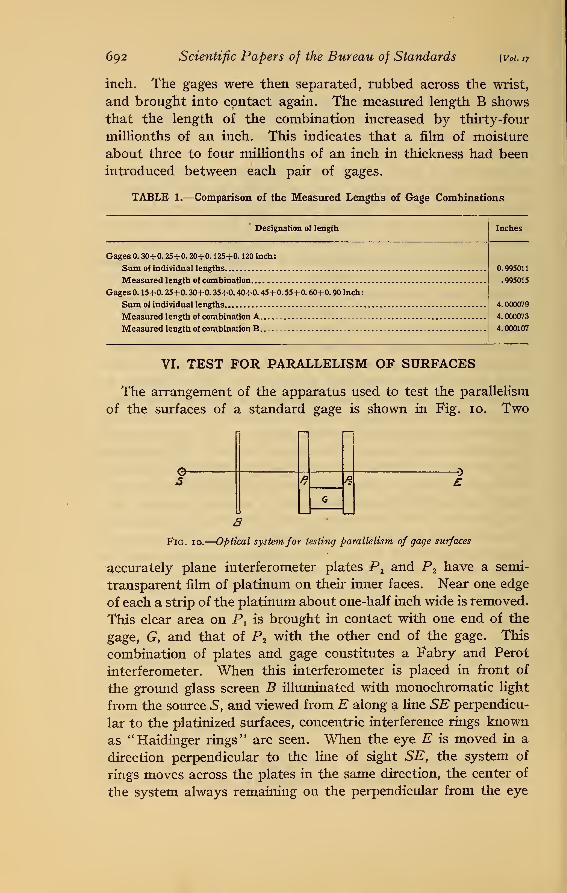
VI. TEST FOR PARALLELISM OF SURFACES
The arrangement of the apparatus used to test the parallelism
of the surfaces of a standard gage is shown in Fig. 10. Two
ff
Fig. 10.
—
Optical system for testing parallelism of gage surfaces
accurately plane interferometer plates Pxand P2 have a semi-
transparent film of platinum on their inner faces. Near one edge
of each a strip of the platinum about one-half inch wide is removed.
This clear area on Px is brought in contact with one end of the
gage, G, and that of P2 with the other end of the gage. This
combination of plates and gage constitutes a Fabry and Perot
interferometer. When this interferometer is placed in front of
the ground glass screen B illuminated with monochromatic light
from the source S, and viewed from E along a line SE perpendicu-
lar to the platinized surfaces, concentric interference rings known
as "Haidinger rings" are seen. When the eye E is moved in a
direction perpendicular to the line of sight SE, the system of
rings moves across the plates in the same direction, the center of
the system always remaining on the perpendicular from the eye

Peiers~\
Boyd JInterference Methods for Testing Gage Blocks 693
to the surface. If, now, the interferometer surfaces are parallel
to each other, which means that the two gage surfaces which are
in contact with them must also be parallel, each ring will retain
its original diameter when the eye is moved as designated. If
the plates are not parallel, the rings expand on moving opposite
points of greater separation and contract as the eye is moved in the
direction of smaller separation. Suppose that when the eye is
shifted, so that the center of the ring system moves across the
plates from one edge to the other, the first central ring expands
and takes the place originally occupied by the second (a new ring
forming within) ; then the distance between the two interferometer
plates has increased by one-half wavelength, which for yellow
helium light is about 0.29 micron (0.000011 inch). If the width
of the gage is one-fourth that of the platinized space, this would
mean a difference of about 0.07 micron (0.000003 inch) between
the gage lengths along opposite sides. Since an expansion of
Fig. 11.
—
Optical systemfor determining the length of a gage by means of light waves
the rings can be estimated to one-fourth of the diameter of the
first ring, an error of 0.025 micron (0.000001 inch) in the parallel-
ism of the gage surfaces can be detected. To realize this preci-
sion, however, special care must be taken to have the surfaces of
the gage in very close contact with the plates.
VII. CALIBRATION OF END STANDARDS WITH THE FABRYAND PEROT INTERFEROMETER
1. GENERAL PLAN OF APPARATUS
The arrangement of the apparatus used to measure gages in
wave lengths is shown in Fig. 1 1 . The interferometer formed bythe gage and plates of Fig. 10 is placed within a constant tempera-
ture chamber A in front of the slit of a grating or prism spectro-
graph. Light from the neon lamp 5 is focussed by the lens Lt
upon the interferometer P^P^ Part of the light is transmitted
directly through the interferometer, part is reflected by the

694 Scientific Papers of the Bureau of Standards [Vol. 17
platinized surface of P 2 to the platinized surface of P lt where it is
again partially reflected, and then a part of it passes on through
P2 , and so on through a large number of multiple reflections andtransmissions. The reflected and directly transmitted parts whencombined produce a system of interference rings which is focussed
by the lens L2 upon the slit F of the spectrograph. The images
of the slit corresponding to the different radiations from neon are
separated by the grating B and recorded on the photographic
plate K.
2. SOURCE OF LIGHT
The source of light used in this work was an electric discharge
tube filled with neon gas and operated on a 10 000 volt ac circuit.
Wave lengths between 0.58 and 0.70 micron (0.000023 an(i
0.000028 inch) were used in making the determinations. Theradiations from neon gas are very homogeneous and show good
interference with large path differences, making it possible to
measure gages 5 cm (2 inches) in length without difficulty. Longer
gages can be measured if a telescope is used in making the inter-
ferometer adjustments. A limit on the maximum length of gage
which can be compared directly with light waves by this inter-
ference method is imposed by the fact that no spectral lines are
ideally homogeneous or monochromatic. Under ordinary condi-
tions the neon lines fail to show interference when the retardation
exceeds 300 000 waves. This permits direct comparison with 10
cm gages. The spectral lines of krypton are sharper and would
allow 20 cm gages to be measured by this method.
3. INTERFEROMETER
The interferometer plates were glass disks 42 mm (1.7 inches)
in diameter and 8 mm (0.3 inch) in thickness, or glass plates 5 cm(2 inches) square and 1 cm (0.4 inch) thick. These plates were
covered with thin platinum films by the method of sputtering
from a platinum electrode in a vacuum. Bringing a gage in con-
tact with the platinum film causes the film to scale off, making
adherence impossible. To eliminate this difficulty, a strip ofthe
platinum a little larger than the gage surface was removed from
each plate and the gage surface brought into contact with the
clear glass surface. The gages which formed the separators or
^talons for the interferometer plates varied in length from 1 mmto 5 cm and from 0.05 to 2 inches.

Petersj Interference Methods for Testing Gage Blocks 695
4. CONSTANT-TEMPERATURE CHAMBER
Since the length of a gage varies with the temperature, it is
necessary to measure and specify the length at 20 C, which has
been chosen as the standard temperature for measuring instru-
ments. This was accomplished by placing the interferometer in
a chamber A surrounded by a thermostated bath previously de-
scribed. 13 The temperature of the bath was brought to the
desired point and held for a period of at least one-half hour before
beginning the photographic exposures in order to allow the gage
to assume a steady state.
5. SPECTROGRAPH
Dispersing apparatus of some kind is required in order that
length measurements may be made with various colors or spectral
lines such as are emitted by luminous neon gas. For this purpose
either a prism spectrograph or a diffraction grating may be used,
but the concave grating mounted in parallel light with the aid of
a mirror has certain advantages in stability, achromatism, and
minimum astigmatism over any other type of spectrograph which
might be considered as suitable for these measurements.
For most of the work the grating spectrograph of the spectro-
scopic laboratory was used. M is a speculum concave mirror and
B a concave grating. The mirror and grating each have a radius
of curvature of about 640 cm. (2 1 feet) . The grating was ruled byDr. Anderson and has 39 800 lines on a distance of 13.2 cm. (5.2
inches) . The linear dispersion at K with this apparatus is about
10 A per millimeter in the spectrum of the first order.
6. PHOTOGRAPHIC
The spectrum of neon between the wave length limits 0.58 and
0.70 micron (0.000023 and 0.000028 inch) was recorded on Seed
27 photographic plates after staining with pinacyanol. 14 Theexposure times ranged from 5 to 10 minutes. Since the slit wasilluminated by radiations, each of which produced a system of
interference rings, the photograph of the spectrum shows the
images of the slit crossed by arcs of the ring systems. The diam-
eters of the interference rings were measured by means of a mi-
crometer screw with a head graduated to 5 microns. By substi-
tuting a micrometer eyepiece for the photographic plate visual
observations could be made on the diameters of monochromatic
i» Meggers and Peters, B. S. Sci. Papers, No. 327, p. 713; 1918.
u Meggers and Stimson, J. Op. Soc. Am., i. No. 3; 1920.

696 Scientific Papers of the Bureau of Standards [Vol. 17
fringes, but a photographic impression of the interference phe-
nomena is generally to be preferred.
7. DETERMINATION OF THE ORDER OF INTERFERENCE
Neglecting here any difference in phase change by reflection at
the surfaces (treated in section 9) the thickness of the air space
between the two interferometer plates is given by the equation
NX(9)
= (n + n')- t
where N is the order of interference at the center of the ring sys-
tem, n that of the first ring, and hence n' the fraction difference in
order between the first ring and the center of the system. In
carrying out the computations n' is calculated as the fraction part
of the order by which any given ring differs from N, The formula
for calculating this is given by Meggers 15
, nu>2d2
. .
where d is the diameter of any given ring image, r the correspond-
ing length of the image of a stop placed across the slit, and o> the
angle subtended by this stop at the lens, L2 , which projects the
ring system on the slit. It is obvious that the approximate value
of n obtained by using the nominal length of the gage which sep-
arates the plates is sufficient for calculating the value of n'
.
The exact value of n is obtained as follows : If T be the nominal
length of the gage, the approximate value of n is, for any given
wave length,
2T
From this
t_n^2d2
Sr 2^ 1 Q„2
which, together with nlt gives a tentative value 7\ for the thick-
ness. This value T1 is then used to calculate the trial value
Nc =nc + n' of the order for each wave length used. From these
approximate values of n and the measured diameters of the rings,
n' for each wave length is obtained by substitution in (10). We16 Meggers, B. S. Sci. Papers, No. 351; 1915.

bI%s
]Interference Methods for Testing Gage Blocks 697
now have two values for the fraction part of the order—one, n',
obtained from the measured diameter of the rings, and the other,
n'c , from the trial thickness of the gage. If these magnitudes
coincide for the various wave lengths within the limits of experi-
mental accuracy, it shows that nxhas been correctly chosen.
Otherwise n^ must be corrected by some whole number, y, which
may be determined as follows:
Let R —^ be the ratio of the wave length used for obtaining theK
trial value to the wave length being used to correct it. Since
changing nxby the whole number y changes iV for a wave length
X by Ry, and hence n' by (1 —R)y, we have the difference between
the observed and calculated values
n' -n'c = (i -R)y,from which
n' — n'c
* i-R
This serves to calculate for \ a value tt for the thickness, which
is subject only to the errors of measurements, not to the inaccuracy
in the nominal length of the gage.
h--£ («i+y+»'i).
From this corrected thickness the order of the first ring is readily
computed for each wave length. These values of n and the com-puted fraction n' are then substituted in (9) . Each wave length
thus furnishes independently a value for t, from which the meanvalue is finally obtained.
8. CORRECTION OF X
The wave lengths which are given for standard conditions of
15 ° C and 760 mm pressure vary with changes in the density of
the air. The wave lengths must therefore be corrected to the
existing temperature and pressure conditions. Since this correc-
tion and the dispersion of the air are small, it is sufficient to apply
the correction factor
/ = —\ where /it = 1 + - / ^ »
/it 760 T

698 Scientific Papers of the Bureau of Standards [Vol. 17
to the mean value of the thickness t, given above, to obtain the
optical thickness tp of the space at EF between the two platinum
films.
9. CORRECTION FOR THE THICKNESS OF THE PLATINUM FILMS
With unplatinized interferometer plates the distance <fg (at EF,Fig. 11, between the two glass surfaces as computed above from
measurements of the rings would be the true distance between
the plates, because the phase change of -k due to the two air-glass
reflections is eliminated in the determination of n. With the
platinized surfaces, however, tg differs from tp by a small correc-
tion x = tg — tp , which is equal to the thickness of the films plus or
minus the change in the optical path due to the difference in phase
change for air-glass and air-platinum reflections. To measure
x, a glass test plate is placed over each interferometer plate so as
to cover both the clear and platinized parts. Each gives a system
of fringes arising from the interference between the front and back
surfaces of the thin air films inclosed. The system over the plati-
nized area, owing to the combined effect of difference in thickness
of the air film and difference in phase change by reflection, is dis-
placed (less than one order) relative to the system from the clear
portion. Multiplying by - the combined displacement resulting
at the two plates, when tested with the light in the same direction
as under working conditions, gives the correction x to be applied
to the thickness of the gage as calculated in section 8.
10. CORRECTION FOR NONPARALLELISM OF THE GAGE SURFACES
If the gage surfaces are parallel, the interferometer plates will
be parallel, and the length L of the gage is
L = tg= tp +x.
If the gage surfaces are not parallel, a correction must be
applied to tg to obtain L. Having the difference z =LC —LD in the
length of the gage along the two opposite sides C and D, Fig. 11,
obtained as explained in section VI, and making the distance from
EF to the gage at C equal to the width of the gage, the length
along C is obviously
and along D is
LD = tg — 2Z.

Bo£tfS
]Interference Methods for Testing Gage Blocks 699
11. COMPUTATIONS
An illustration of the method for making the computations for
a 25.4 mm (1 inch) gage is shown in Table 2. Column 1 gives the
wave lengths used; 2, the measured diameter d of the first and
second rings, respectively; 5, the fractional part n' of the order at
the center of each ring system; 6, the order of interference N or
number of waves in the double distance between the plates at the
center of the ring N = n + n'; and 7, the double optical thickness
of the air film or N\.
TABLE 2.—Computing Method for a 25.4 mm Gage
in Angstrom units
2a 3 4 5
d d'
8r2
n'
455676
207457
93205
0.8071.779
341602
116362
52
162
.4441.384
551
746304557
136205
.1331.083
495713
245508
110228
.9101.885
409667
167445
75199
.6011.596
295612
87375
39168
.3041.312
344631
118398
53178
.4031.354
2/ in microns
5852.488.
5944.834..
6096.163.
6143.062.
6334.428.
6506.528.
6678.276.
85
83
82
80
76
802. 793
454. 414
333. 108
693. 898
199. 599
077. 308
069. 379
/= 1.0000102
Mean value of UCorrected for density of air, 2tXf=2tp .
tB .
Correction for film thickness, x
Distance between glass plates, ts ...
Correction for slant of gage surface, -
50 801. 2304
50 801.2306
50 801. 2210
50 801. 2254
50 801.2251
50 801.2191
50 801. 2308
50 801.226150 801. 744225 400. 8721
.0701
25 400. 9422.0367
Length of gage at C, Lc-
Length of gage at D, Lb.
25. 4009789 mm1. 0000365 inch
25.4010156 mm1. 0000380 inch
<* In columns 2 to 5, the figures in each group of two refer, respectively, to the first and second rings.
12. ACCURACY AND SOURCES OF ERROR
A comparison of the values obtained for the thickness of the
air film, Table 2, column 7, shows that the maximum variation of
t for the several wave lengths is about one part in five million
when using a i-inch separator. The correction for the change in
X arising from a change in density of the air is about one part in
one hundred thousand. With the accurate values of the refractive
index of air 18 available, this correction should not introduce an
"Meggers-and Peters, B. S. Sci. Papers, No. 327; 1918.

7oo Scientific Papers of the Bureau of Standards [vol. n
error of one part in ten million in the total length. The combined
thickness and phase difference effect of the platinum films is
about 0.07 micron (0.000003 inch), and the probable error in
measuring this thickness about 0.003 micron (0.0000001 inch),
which would introduce an error in the value of the distance between
the plates of about one part in ten million. Therefore, using a
25 mm (1 inch) etalon and making measurements with several
wave lengths, the value of the distance te between the glass sur-
faces at EF should be correct relative to the International meter
to about 1 part in four or five million.
Transferring this measured distance to the gage introduces
the greatest error. With a perfect gage and perfectly plane
interferometer plates the only sources of error are the films
between the gage surfaces and the plates. If the surfaces are
thoroughly cleaned and carefully brought into contact, the
separation is less than 0.025 micron (0.00000 1 inch). It is prob-
able that slight projections on the surfaces are in intimate contact
and that the liquid film exists in the intervening spaces. There-
fore, with carefully controlled conditions, the error in the measure-
ment of perfect gages should be less than 0.025 micron (0.00000
1
inch)
.
In actual practice, however, most interferometer plates obtain-
able deviate from true plane by about 0.05 micron (0.000002
inch), and the surfaces of carefully selected gages deviate from
true plane and parallelism by about 0.13 micron (0.000005 inch)
on the average. Therefore, in transferring tg to the gage the
error introduced depends largely upon imperfections of the gage.
With carefully selected gages the errors in the values of the length
along the C and D sides range from 0.025 to 0.075 micron (one to
three millionths inch)
.
The measurements made on one of our standards (i-inch, set 7)
shown in Table 3 are representative of the values obtained for
several hundred other standards. Each value given is the result
of a single determination made after a separate assembling of the
interferometer and adjustment of the spectrograph. The first
determination of January n, 1921, was made with the grating
spectrograph shown in Fig. 11. The second determination of
that date was made with a different pair of interferometer plates
and a prism spectrograph.

Bwd] Interference Methods for Testing Gage Blocks 701
TABLE 3.—Length of 1-Inch Gage of Set 7 at 20° C
Date
Feb. 4, 1918
Feb. 7, 1918
DoDo
Length
Inches
1.0000008
. 9999996
. 9999990
. 9999993
Date
Feb. 7, 1918..
Mar. 17, 1920
Jan. 11,1921.
Do
Length
Inches
0. 9999992
. 9999983
. 9999974
.9999968
Another very important source of error that may be overlooked
is the thermal expansion of the material. A 25 mm (i-inch)
length of steel expands about 0.32 micron (0.000013 inch) per
degree Centigrade rise in temperature. The gage must therefore
be held at the constant temperature of 20 C within a few hun-
dredths of a degree. If the measurements are made at any other
temperature, this must be accurately measured and the expan-
sivity of the material known in order to reduce the length to
standard conditions. We have found expansion coefficients
ranging from 0.000011 to 0.000013 for gage steels of various com-
positions, hardness, and previous heat treatment. This shows
that it is unsafe to assume a value for the expansivity whenmeasuring the absolute length of a gage or comparing an unknowngage with a standard at a temperature that differs very muchfrom 20 C.
TABLE 4.—Thermal Expansion of Several Precision Gages
GageTempera-ture inter-
val
Coeffi-cient oi
expansionxio*
GageTempera-ture inter-
val
Coeffi-cient ofexpansionxio<
Johansson, set 5813, 10 mm .
.
Do
°C
20 -50
20 -50
20 -50
20 -50
19. 8-75. 5
32. 8-76. 5
56. 3-79.
6
19. 6-79.
6
21.3-82.4
20. 6-82. 4
0.129
.129
.125
.125
.124
.123
.131
.132
.128
.127
Bureau of Standards:
Steel A, 0.4 inch
°C
24.0-76.9
33. 0-82.
8
21 -78
5. 8-46.
5.8-46.0
0.132
Johansson, set 5813, 9 mm . .
.
DoSteel B, 0.4 inch .129
Pratt & Whitney, 0.375 inch.
.
Schuchardt and Schutte, 0.5
.135
Johansson, set 20, 0.4 inch . .
.
Do .116
Johansson, set 7, 0.4 inch ....
DoDo .115
Johansson, set 7, 0.35 inch . .
.
Do
• In Table 4 is shown the thermal expansion of several precision
gages. These measurements were made with the interferometer
and electrical furnace previously described in our publication 17
" Peters and Cragoe, B. S. Sci. Papers, No. 393; 1930.

702 Scientific Papers of the Bureau of Standards [Vol. 17
on the dilatation of optical glass. Column i gives the designation
of the gage under investigation; column 2, the temperature inter-
val; and column 3, the coefficient of expansion.
-£00 -loo too zoo JOO 400 SOOdegrees Centigrade
Fig. 12.
—
Curves showing the thermal expansion of the steel usedfor precision gages
The composition of steel B which is used for precision gages at
the Bureau of Standards is C, 1.00 to 1.10 per cent; Mn, 0.30 to
0.40 per cent; P, 0.025 per cent; S, 0.025 per cent; Si, 0.20 to
0.30 per cent; Cr, 1.30 to 1.50 per cent; balance, Fe. This is
almost identical with the compositions that have been published

Pelers\Boyd J
Interference Methods for Testing Gage Blocks 703
for the steels used in the Johansson and the Pratt & Whitneygages.
The thermal expansion of a gage about 1 cm long and 2 cm in
diameter made from steel B is shown in Fig. 12. It was hardened
by heating to 850 C and quenching in oil. The original hardness
was 95 as measured with a scleroscope, and length was 1 1 .024 mm.The sample was first cooled to — 114 C, the change in length
being represented by curve 1. On returning to room temperature
the hardness was 94.5 and the length 11.035 mm; that is, the
length had increased 12 microns due to this treatment. After
cooling again to — 135 C, represented by curve 2, and returning
to room temperature the hardness was 94 and length 11.035 mm.No further change in length took place. The sample was then
heated to 392 C and allowed to cool to 20 C, change in length
being represented by curve 3. The final hardness was 76 and
length 1 1 .004 mm. This treatment caused a permanent shorten-
ing of about 31 microns. The sample was then heated to 450° Cand allowed to cool to 20 C. The change in length is represented
by curve 4.
TABLE 5.—Changes of Length with Time
Gage Date Length Gage Date Length
1.000 inch Mar. 1,1919June 3,1919July 19.1919Aug. 19,1919Oct. 16,1919Mar. 20, 1920May 21,1920
May 21,1919May 29,1919June 17, 1919Aug. 19, 1919Oct. 17, 1919Jan. 7, 1920Mar. 20, 1920May 22,1920
Mar. 1,1919May 29,1919July 19,1919Aug. 19, 1919Oct. 16, 1919Mar. 18, 1920May 21,1920
Sept. 24, 1919Oct. 16,1919Jan. 9, 1920
Inches.1.000000.999998.999992.999992.999993.999988.999988
1.0000001.0000181.0000221.0000341.0000381.0000431.0000441.000047
2.0000001.9999761.9999661.9999631.9999511.9999381.999935
2.0000002. 00u0022.000u00
2.000 inches Mar. 19, 1920May 22,1920
Feb. 20,1919Apr. 28,1919Aug. 20, 1919Sept. 19, 1919Mar. 18, 1920May 21,1920
Apr. 29,1919June 2,1919July 19,1919Aug. 19,1919Oct. 16,1919Mar. 18, 1920May 21,1920
May 7, 1919June 3,1919Aug. 20,1919Nov. 26,1919May 21,1920
Dec. 22,1919Mar. 18, 1920May 21,1920
Inches.1.999993
3.000 inches
1.999992
J. 0000002,9999752.9999002.9998772.9998562.9998511.000 Inch
4.00'inches 4. 000000
4.00 inches
3.9999933.9999923.9999803.9999803.9999713.999970
4. 000000
4.00 inches
4.0000144.0000254.0000214.000025
4.0000003.9999993. 999993
Unless the material from which the standards are made is
exceedingly stable the high accuracy of the length determination
is soon lost due to changes in the length with time. While wehave found many steel gages that retain their dimensions remark-

704 Scientific Papers of the Bureau of Standards {Vol. 17
ably well, others have been found to change several microns—or
hundred thousandths of an inch—in a few months. A few exam-ples of gages that have undergone changes of length with time are
given in Table 5. The fact that these changes may take place
requires frequent intercomparisons and redeterminations of the
gages used as standards.
VIII. COMPARISON OF GAGES WITH STANDARDS
1. COMPARISON OF LENGTH
The accurate comparison of two gages, A and B, Fig. 13 (front),
of supposedly the same length, is made by the following method:
F Or H
A
C I t
Top
Wfront Side
Fig. 13.
—
Intercomparison of two similar gages of equal length
The two gages are placed side by side in intimate contact, as
described in V above, with the true plane surface of a glass plate
W. The lower surfaces of the two gages being in the same plane,
the problem is then simply to determine the distance between the
planes of the two upper surfaces. This is done by placing a test
plate T in contact with the gages along the line CDE, Fig. 13
(top), and somewhat inclined to these surfaces. This gives side
by side two thin wedge-shaped films. When illuminated and
viewed as shown in Figs. 3 or 9, two sets of straight fringes parallel
Peters']
Boyd JInterference Methods for Testing Gage Blocks 705
to the edge of the wedge are seen; see top view, Fig. 13. Since it
is only necessary then to determine the difference in thickness of
these films at some adjacent position, say K, we can assume zero
phase changes at the surfaces and calculate the distance at that
point between the planes of the two gage surfaces. If the two
gages are of the same length, their upper surfaces will lie in the
same plane, so when we pass to the thicker part of the wedge from
the line of contact CDE, the first fringe aton A will coincide with
the first fringe on b1on B, the second with the second, etc.
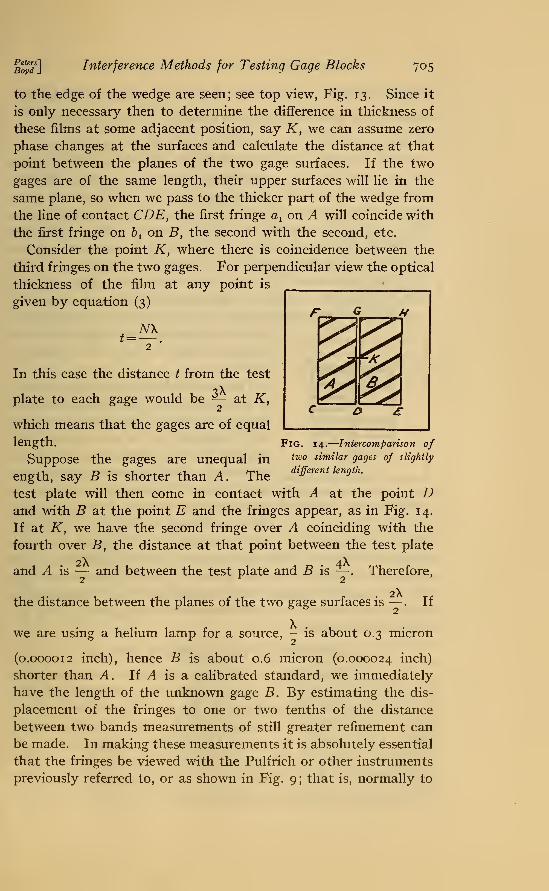
Consider the point K, where there is coincidence between the
third fringes on the two gages. For perpendicular view the optical
thickness of the film at any point is
given by equation (3)
t=iVX
In this case the distance t from the test
plate to each gage would be — at K,C & £
Fig. 14.
—
Intercomparison oftwo similar gages of slightly
different length.
which means that the gages are of equal
length.
Suppose the gages are unequal in
ength, say B is shorter than A. The
test plate will then come in contact with A at the point Dand with B at the point E and the fringes appear, as in Fig. 14.
If at K, we have the second fringe over A coinciding with the
fourth over B, the distance at that point between the test plate
and A is — and between the test plate and B is — . Therefore,
the distance between the planes of the two gage surfaces is —
.
If
we are using a helium lamp for a source, - is about 0.3 micron
(0.000012 inch), hence B is about 0.6 micron (0.000024 inch)
shorter than A. If A is a calibrated standard, we immediately
have the length of the unknown gage B. By estimating the dis-
placement of the fringes to one or two tenths of the distance
between two bands measurements of still greater refinement can
be made. In making these measurements it is absolutely essential
that the fringes be viewed with the Pulfrich or other instruments
previously referred to, or as shown in Fig. 9; that is, normally to

706 Scientific Papers of the Bureau of Standards [Vol. 17
the gage surfaces. If they are viewed at an angle to the perpen-
dicular, then the thickness is not equal to — , but equal to — „>
so that an incorrect interpretation of the distances is made.When observing with the unaided eye, as shown in Fig. 9, it is
not advisable to make comparisons between gages that differ in
length by more than five or six wave lengths. With the aid of the
Pulfrich instrument, however, comparisons between gages that
differ in length as much as % inch may be made. With this
method the fractional orders n' at the point K over each gage are
measured for several different radiations of helium gas. Theorders of interference N for each wave length are then computedfrom these fractions and the approximate distance between the
test plate and the upper surface of each gage by the method de-
scribed in Section VII, which holds for
straight fringes as well as for Haidinger
rings. 18
The absolute length of a gage is found
in the same way. The gage is brought
in contact with a steel base plate andthe thicknesses of the air columns over
the gage and base plate, respectively are
measured. The distance between the
test plate and the base plate minus the
distance from the test plate to the gage
gives the length of the gage. The steel
base plate is used in order to eliminate any difference in phase
losses on reflection. This method was used in calibrating most
of the end standards less than 5 mm (}4 inch) in length, because
the operation of making the measurement and computations
requires only about one-third the time consumed when using the
circular fringe method.
2. COMPARISON OF PARALLELISM OF SURFACES
The test for parallelism of the two surfaces of an unknown gage
B is made along with the length comparison. Assuming that the
two surfaces of the standard gage A, Fig. 15, are plane and parallel,
the test plate brought in contact with it along CD gives straight
fringes over A which are parallel to CD and equally spaced. If
the upper surface of the gage B is parallel to the plane of the
upper surface of A , the fringes over B will be parallel to those over
F a H
cj
"" wi? i
r
Fig. 15.
—
Test for parallelism
of gage surfaces. B shorter at
GH than DE
Peters, J. of Wash. Acad, of Sci., 9, p. 282; 1919.

Peters']
Boyd JInterference Methods for Testing Gage Blocks 707
A and have the same spacing. If, however, the length of B at
GH is less than at DE, then the wedge over B will be steeper than
over A and the fringes closer together. Therefore, if as indicated
7 fringes are observed over B and 5 over A, GH is — below DE,
or the gage is about 0.000022 inch shorter on the GH side than
on the DE side. If the length of Bat GH is greater than at DE, then
the wedge over B will be thinner than
over A and the fringes farther apart. If
the surfaces of the standard A are
not parallel, then to determine the
true slant or lack of parallelism of the
surfaces of B along DG, the apparent
slant is determined as described above.
Letting Afg, Bcm, etc., also denote the
lengths of the gages along those sides,
we have £gh--Bde = .s\ If now from
other sources it is known that the
slant of A is Am — Aco = a, then the true slant of B is
F a H
^c/r^"**'
<^^A
C D £
Fig. 16.
—
Test for parallelism
of gage surfaces. B longer at
HE than at GD
b = a + s, (11)
c, 6, and s being positive or negative, as the case may be.
Suppose, as in Fig. 16, that the edge GD of B is parallel to the
plane of the upper surface of A, but the
surface of B slopes slightly, so that HEis above GD. Since the fringes lie along
lines of equal thickness of the" air film,
they will extend across B at an angle to
those over A, being deflected toward
the open end of the film or toward H.
If HE is below GD, the fringes on B will
be deflected toward the thin edge of the
film or toward E, as in Fig. 17. If wedraw a line KL parallel to CE from the
left end of any fringe over B, the dis-
placement of the other end of that fringe
from KL divided by the distance between two consecutive fringes
gives the difference in height between GD and HE in half wavelengths. This difference gives the slant between the upper surface of
A and the upper surface of B. If the two surfaces of A are perfectly
parallel, it is also the slant between the two surfaces of B. If the
F G H
****++. JL
^A
c O £
Fig. 17.
—
Test for parallelism
of gage surfaces. B shorter at
HE than at GD

708 Scientific Papers of the Bureau of Standards ivoi. n
two surfaces of A are not parallel, but the slant Ago — Afc = c,
using the same expression for length as above, then the true slant
of B is equal to the observed apparent slant Bog — Bse = d minus
kc, where k is the ratio of the widths of the gages B and A; that is,
f= d-kc. (12)
The slant of the two surfaces of B can also be determined bymeasuring the perpendicular distances between them, say, at the
middle points of all four edges of B, by bringing them successively
contiguous to A at the point K.
When determining the length of a gage or standard with the
Pulfrich instrument, the fringes over the gage should be parallel
to and equally spaced with those over the base plate. Any devia-
tion from such a condition signifies that the gage surfaces are not
parallel, in which case the amount of nonparallelism may be
determined by the method just described on making a and c
equal to zero in the formulas (n) and (12).
uu TU
y X
A
x •
B
y y X>
B
X
C
y
2 z a z
Fig. 18.
—
Test for relative length of gages and parallelism of the surfaces by the intercom-
parison of three similar gages
IX. INTERCOMPARISON OF THREE GAGES
The lack of parallelism of the two faces at each of three unknowngages, A, B, and C, can be accurately determined and an inter-
comparisoa between their lengths made by bringing them in
contact with the base plate two at a time. Let A x , B X) Cx , A 7 ,
etc., denote the lengths of the gages at the points x, y, z, u, indi-
cated in Fig. 18, and
Ak—n t — Az) As —A x — Aj,
Bk =B u —B z, Bs =Bx —By ,
l^K. — C^u t^zj Cs = Cx — Cy,
represent, respectively, the slants of the gages A, B, and C in the
two perpendicular directions uz and xy. If the gages A and Bare brought into contact with the base plate, so that A u and B u ,
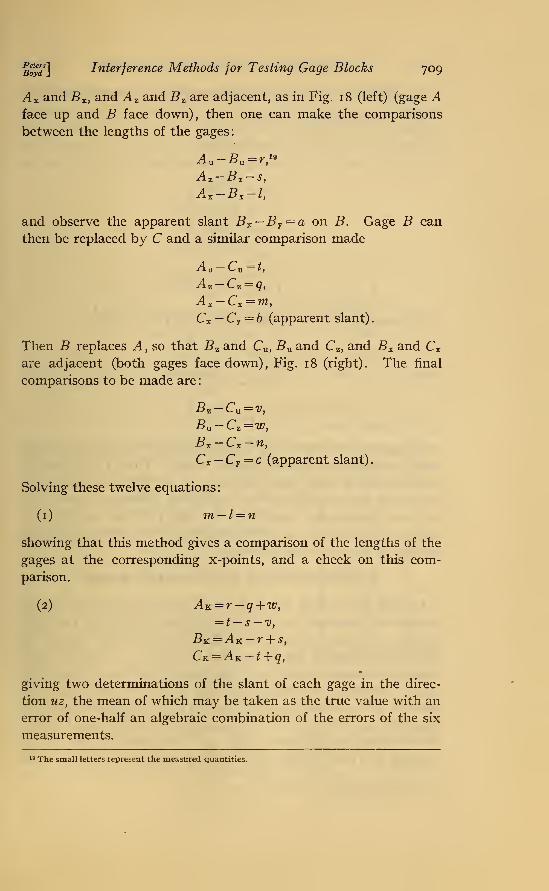
Bw"] Interference Methods for Testing Gage Blocks 709
A x and Bx , and A z and B z are adjacent, as in Fig. 18 (left) (gage Aface up and B face down), then one can make the comparisons
between the lengths of the gages:
A u -B u =r™A z hi z
= S,
Ax-Bx =l,
and observe the apparent slant Bx —B Y = a on B. Gage B can
then be replaced by C and a similar comparison made
A z — Cz = q,
^4 X -Cx = ra,
Cx — Cy =b (apparent slant)
.
Then B replaces A, so that B z and Cu , #u an(i Cz , and i?x and Cx
are adjacent (both gages face down), Fig. 18 (right). The final
comparisons to be made are
:
B z -Cn =v,
B n -Cz =w,Bx -Cx =n,
Cx — C7 = c (apparent slant)
.
Solving these twelve equations:
(1) m — l = n
showing that this method gives a comparison of the lengths of the
gages at the corresponding x-points, and a check on this com-
parison.
(2) AK = r — q + w,
= t — s — v,
BK = A K -r-\-s,
CK = A K -t + q,
giving two determinations of the slant of each gage in the direc-
tion uz, the mean of which may be taken as the true value with an
error of one-half an algebraic combination of the errors of the six
measurements.
19 The small letters represent the measured quantities.

710 Scientific Papers of the Bureau of Standards ivoi. 17
(3) If B and C are / and h times as wide as A , respectively, then
hC is r times as wide as B and
Bs = a — f As,
Cs = b — h As,
Cs = c — j Bs,
. f (b — c) +ahAb =—
Bs =
Cs =
2fh.
f (c-b) +ah2 h
h (b+c) —ah2/
If the gages are all the same width, then f= h = i and
b — c + aA s =
£s =
C8 =
2
c — b + a>
2
b+c —
a
showing that the error of each determination is one-half the alge-
braic combination of the individual errors. Thus, the method of
intercomparing three gages enables one to determine easily and
accurately the relative merits of each, their planeness errors hav-
ing been previously determined, so that the best one can be
chosen as a secondary standard of length and the others as working
standards for use in the laboratory.
X. DEVELOPMENT OF STANDARD GAGES
Having established the fact that two plane surfaces can be
brought into contact, so that the separation is less than two hun-
dredths of a micron (one millionth of an inch), and having the
interference method for comparing two gages of nearly equal
length, it is possible to calibrate long gages from line standards and
make comparisons between these long gages and equal combina-
tions of two or more shorter ones. The arrangements used byFischer 20 and Perard 21 for comparing a long end standard with a
line standard are shown in Fig. 19. Two gages, A and B, are
brought into close contact, and two fine lines, C and D, are ruled
2° Phil. Soc. Wash., Bull., 13, p. 241; 1898.
"C. R., 154, p. 1586; 191a.

Peters!Boyd J
Interference Methods for Testing Gage Blocks 711
on them parallel to their plane of contact, EF. The distance Xbetween the lines C and D is determined by comparison with the
line standard. A is then brought into contact with one surface
of the long gage G which is to be calibrated and B with the opposite
surface of G. The distance Y between the two lines C and D is
B
Fig. 19.
—
Calibration of end standards relative to line standards
again determined by comparison with the line standard. Thedifference in the two distances Y —X gives the length of the gage
G in terms of the line standard.
After the length of G has been accurately determined by com-
parison with the line standard or by direct measurement with
the light waves, combinations of shorter
gages can be compared with it by using
the interference comparator, as follows:
Suppose G is 6 inches long and we have
three gages, A, B, and C, each very nearly
3 inches in length. G is brought into con-
tact with the plane base plate W, Fig. 20,
B is also placed in contact with W, and Awith the upper surface of B. The differ-
ence a in the lengths of G and the combi-
nation of A and B is obtained from the
relative displacement of the interference
fringes as described in section VIII. Thecombined length of A and B is equal to
that of G plus a. In the same way the ob-
served difference b between the combined
lengths of B and C and that of G is ob-
tained. Likewise c for gages C and A. Letting the designation
of the gages also represent their lengths, we have
A+B =G + a,
B + C = G + b,
C+A=G+c,
\AJ
Fig. 20.
—
Comparison of two
short gages with one long gage

12 Scientific Papers of the Bureau of Standards [Vol. 17
where G is the known length of the standard and a, b, and c are
measured. These equations can be readily solved for the un-knowns, A , B, and C. Similarly, with four gages, A , B, C, and D,each nearly 2 inches long, we would have
A + B + C = G + a,
B + C + D = G + b,
C + D + A = G + c,
D + A + B = G + d.
Since the four independent simultaneous equations contain four
unknowns, the length of each unknown gage can be computed.In general, given n+ 1 unknown gages of nearly equal length, n
of which when combined are nearly equal to the known gage G,
there will be n + 1 combinations
which may be compared with G.
Hence, the length of each un-
known gage can be obtained bythis comparison method. Inter-
mediate sizes may be measured
by comparing the combinedlengths of a known and unknowngage with a known.
XI. COMPARISON BETWEENGAGES AND OTHER OB-JECTS
An accurate determination of
the dimensions of any body, say
a sphere, can be made by com-
parison with a gage of nearly the
same size. For this the gage A and the sphere B are placed in
contact with the base plate W, Fig. 2 1 , and the test plate T laid
over them. If B is slightly smaller than A, the test plate will
touch the gage along the edge E and the sphere at the point C.
When illuminated and viewed as shown in Fig. 3 or 9, straight
fringes parallel to E will be seen to cross the upper surface of the
gage. The number of fringes N across the face of the gage from
D to E multiplied by - gives the distance between the cover plate
and the gage surface at D. If the distance CE is equal to DE,
then the point C must be —: below the plane of the surface of the
*TD
A£
\N
Fig 21.
—
Compagat
rison of
je block
a sphere with a

bI%s
]Interference Methods for Testing Gage Blocks 713
NXgage, and hence the diameter of the sphere — less than the length
of the gage. If B is larger than A , the upper plate will touch the
gage along the edge D and be— above E. C would then be
above the plane of the surface of the gage and the diameter of
B equal to the length of the gage plus NX.
XII. SUMMARY
The extensive use of precision gages as reference standards
for precise mechanical work has required more accurately deter-
mined end standards and more rapid and precise methods for
comparing gages with these standards than have been previously
available. Since comparison of end standards with line standards
by means of micrometer-microscopes and of precision gages with
end standards by means of contact instruments are subject to
appreciable errors, methods which make use of the interference of
light waves were used in making these measurements. With the
interference methods described in this article, the planeness and
parallelism errors of precision surfaces can be measured and
the length of standard gages determined by direct comparison
with the standard light waves with an uncertainty of not morethan a few millionths of an inch. The errors of other gages can
be determined by comparison with these calibrated standards
with equal precision. This process makes the standard light waves
which have been determined to one part in four or five million
relative to the international meter, the standards of length for this
work. Three sets of gages each containing 8 1 blocks were selected
for end standards. These were tested for surface errors and cali-
brated by comparison with the light waves and have been recali-
brated every few months because changes with wear or time are
known to occur in material gages. Large numbers of precision
gages have been compared with these end standards with sufficient
speed and precision to meet all requirements.
Washington, May 3, 1921.


."'-
; -X


Top Related