


Languages
Pages
Legal


Intercollegiate Athletes and Effective Educational Practices:
Winning Combination or Losing Effort?
Paul D. Umbach Indiana University Center for Postsecondary Research
[email protected] 812.856.3004
Megan M. Palmer
Indiana University Purdue University Indianapolis [email protected]
317.274.1300
George D. Kuh Indiana University Center for Postsecondary Research
[email protected] (812) 856-5824
Stephanie J. Hannah
National Collegiate Athletic Association [email protected]
317.917.6032
Paper presented at the 44th Annual Association for Institution Research Forum, Boston, MA

2
Intercollegiate Athletes and Effective Educational Practices:
Winning Combination or Losing Effort?
Abstract
Scrutiny of intercollegiate athletics has intensified in recent years. Yet previous studies about the experience of student-athletes show that participation in intercollegiate sports has little influence on desirable outcomes of college. This study compares the engagement of student-athletes with those of non-athletes in effective educational practices. Contrary to many reports in the popular media, the findings from this study indicate that, on balance, student-athletes across a large number of colleges and universities do not differ greatly from their peers in terms of their participation in effective educational practices. In most instances, when differences do exist, they favor athletes.

3
Intercollegiate Athletes and Effective Educational Practices:
Winning Combination or Losing Effort?
Intercollegiate athletics at colleges and universities have been referred to as “American
higher education’s ‘peculiar institution.’ Their presence is pervasive, yet their proper balance
with academics remains puzzling” (Thelin, 1994, p. 1). For a host of reasons, scrutiny of this
“peculiar institution” -- intercollegiate athletics -- has intensified in recent years. Such articles as
“Jock Majors” (Suggs, 2003a) and “Grades and Money” (Suggs, 2003b) lament that academics
and athletics are out of balance. The recent scandal at the University of Colorado (Jacobson,
2004) highlights the almost weekly reports of problems in athletic departments across the
country. Calls for reforms (e.g., Bowen & Levin, 2003) are coming from inside and outside the
academy as well as from the National Collegiate Athletics Association (NCAA) national office.
Even federal legislation has been contemplated to bring intercollegiate athletics back into proper
perspective.
Some of the most scathing and influential critiques of college athletics are by Shulman
and Bowen (2001) and Bowen and Levin (2003). Their research suggests that student-athletes
routinely receive preferential treatment in the admissions process and are more likely to be
academically under-prepared than their peers. As a result, student-athletes earn lower grades in
college. Additionally, they argue that institutions allow athletes to create their own subculture
and that it flourishes, isolated and insulated from the larger campus culture.
The findings from other studies are somewhat less pejorative in terms of the effects of
participating in intercollegiate athletics on the quality of the undergraduate experience. For
example, competing in intercollegiate sports appears to have little influence on such college
outcomes as learning for self-understanding, higher-order cognitive activities, and motivation to

4
succeed academically (Wolniak, Pierson, & Pascarella, 2001). Other studies reveal no
differences between student-athletes and non-athletes with regard to cognitive development
(Pascarella, Bohr, Nora, & Terenzini, 1995; Terenzini, Pascarella, & Blimling, 1996), grades in
college (Hood, Craig, & Ferguson, 1992), or time devoted to studying or attending class (Richard
& Aries, 1999). For example, Richards and Aries found no significant difference in GPA
between athletes and non-athletes despite the fact that athletes entered college with significantly
lower SAT scores. But other studies, like the work of Shulman and Bowen (2001) and Bowen
and Levine (2003), report that student-athletes competing in Division III athletics at Ivy League
institutions perform at lower levels academically than non-athletes. Such differences are less
evident for female student-athletes and student-athletes in non-revenue generating sports
(Pascarella et al., 1999) as compared to male student-athletes and athletes playing revenue-
generating sports, such as football and men’s basketball.
The NCAA suggests that “institutions are to provide an environment in which the athlete
and the athletics program play an essential role in the student body” thereby creating social
bonds between and among student-athlete and non-athlete (Howard-Hamilton & Sina, 2001. p.
41). Yet, concerns remain that participating in intercollegiate athletics may lead to social
isolation (Riemer, Beal, & Schroeder, 2000; Wolf-Wendel, Toma, & Morphew, 2001). For
example, spending time with teammates may strengthen bonds between athletes, but limit
interaction with non-athletes (Wolf-Wendel, et al., 2001). Despite this possible isolation,
numerous researchers have reported that athletes were often more satisfied and involved than
their non-athlete peers (Astin, 1993; Pascarella & Smart, 1991; Ryan, 1989). In addition, the
findings are mixed in terms of whether participating in athletics is negatively associated with
self-understanding and openness to diversity (Wolniak, et al.,2001), or whether athletes interact

5
effectively with people from diverse backgrounds because “athletes compete with and against
people from socioeconomic, racial and ethnic, and religious backgrounds other than theirs”
(Wolf-Wendel, et al., 2001, p. 385).
Given their rigorous training and practice routines, it’s not surprising that student-athletes
devote significantly more time to extracurricular activities than members of other groups and
acquired valuable time management skills (Richards & Aries, 1999). Even so, in his study of
NCAA Division III basketball players at a small, private, liberal arts college, Schroeder (2000)
concluded that athletes were highly engaged in their academics, spending an average of 15 hours
per week studying with the majority earning GPAs exceeding 3.0.
While the harsh critiques of Shulman and Bowen (2001) and Bowen and Levin (2003)
may apply to some athletic programs and institutions, not enough is known about the extent to
which intercollegiate athletes devote time and energy to activities that are empirically linked to
desired outcomes of college. Most of the previous work on the collegiate experiences of student-
athletes focuses on a small segment of higher education drawing from elite Ivy League colleges
or the experiences of athletes at only a small number of institutions. Thus, it is difficult to get a
clear, definitive grasp of if, or the extent to which, intercollegiate athletes across a large number
of colleges and universities may be shortchanged in terms of the quality of their undergraduate
experience.
Purpose of the Study
This study uses a national sample of undergraduates to compare the engagement of
student-athletes in effective educational practices with that of their non-athlete counterparts.
Two research questions guide the study.

6
1. First, how do the educational experiences of student-athletes compare with those of non-
athletes?
2. Second, does the level of competition (NCAA division, NAIA membership) relate to
engagement in good practices in undergraduate education, perceptions of the campus
environment, and self reported gains?
Methods
We use data from The National Survey of Student Engagement (NSSE) to compare the
collegiate experiences of student-athletes with those of their non-athlete peers. The NSSE
database is especially well-suited for this study because research on the college student
experience indicates that students learn more when they are engaged at reasonably high levels in
a variety of educationally purposeful activities (Astin, 1984; Kuh, Douglas, Lund, & Ramin-
Gyurnek, 1994; Kuh, Schuh, Whitt & Associates, 1991; Pascarella & Terenzini, 1991; Tinto,
1987).
Student engagement represents activities traditionally associated with learning, such as
reading and writing, preparing for class, and interacting with instructors about various matters
(Kuh, 2001). Student engagement also includes other activities considered important outcomes
of college, such as learning how to effectively collaborate with peers on problem solving tasks
and working productively together in community service activities (Kuh, 2001). Thus,
participating in educationally purposeful activities directly influences the quality of students'
learning and their overall educational experience. In addition, Edgerton and Shulman (2002, p.
4) view engagement both a desired end in itself as well as an indirect indicator of learning (see
also Shulman, 2002):
We need to learn more about the forms and conditions of engagement that relate to student competence and commitment in arenas of practice. There are important

7
questions, too, about engagement not as a means to an end (the premise of NSSE) but as an experience worth having in itself. We go to the symphony, after all, not to improve ourselves but to hear the music, to have the experience. Similarly, there are aspects of the college experience—participating in a seminar, for instance, or a role in student governance—that have a kind of value we have not yet learned to describe in detail or to document.
NSSE was specifically designed to assess the extent to which students are engaged in
empirically derived good educational practices and what they gain from their college experience
(Kuh, 2001). Although NSSE doesn't assess student learning outcomes directly the main content
of the NSSE instrument, The College Student Report, represents student behaviors that are highly
correlated with many desirable learning and personal development outcomes of college.
NSSE collects information directly from random samples of first-year and senior
undergraduates at four-year institutions. Because of the potential bias introduced among athletes
due to attrition to the senior year, this study focuses only on first-year students. Table 1 displays
student-athlete status1, gender, and athletic division for the sample used for the study. Included in
the sample are 57,308 undergraduate students – 7,821 of whom were student-athletes and 49,407
who were non-athletes – who completed NSSE in the spring of 2003. Students from 395
different four-year colleges and universities were represented. Of these institutions, 107 are
NCAA Division I, 93 are NCAA Division II, 145 are NCAA Division III, and 50 are NAIA
schools.
Analysis
We conducted a series of hierarchical linear models (HLM) to explore the effects of
being a student-athlete on the collegiate experience. The dependent variables fall into four
categories: student engagement, perceptions of campus environment, self-reported gains, and
grade point average. Student engagement is measured using three scales: (1) level academic 1 Student-athletes are defined as anyone who responded yes to the following question: “Are you a student-athlete on a team sponsored by your athletics department?”

8
challenge, (2) student-faculty interactions, and (3) active and collaborative learning (see
Appendix A for a listing of the constructs used as dependent variables in the models and the
items contributing to each measure). The perceived campus environment category includes two
measures: a supportive campus environment scale and an overall satisfaction with college scale.
Students’ gains in learning and intellectual development are represented by three scales: gains in
personal and social development, gains general education knowledge, and gains in practical
competencies. Our final set of models predicts student-reported grades2.
In most studies of organizational or institutional effects, researchers must decide about
the appropriate unit of analysis (Hu & Kuh, 2004; Raudenbush and Bryk, 2002). Should they
build regression models by aggregating to the institution level, or should they attach institution-
level characteristics to individuals? If researchers build models at the institution level, they are
prone to the “ecologically fallacy,” whereby individual differences are masked (Hu & Kuh,
2003; King, 1999; Kreft & deLeeuw, 1998). For example, an analysis based on colleges might
reveal that students at small colleges are more engaged in effective educational practices than
students at large colleges, while an analysis of small colleges might reveal that many students at
large colleges are as engaged or more engaged than small college students. Because we are
especially interested in the differential impact of individual institutions on the experiences of
student-athletes, we must model “nested data structures.” According to Raudenbush and Bryk
(2002), HLM provides the only accurate way to estimate institutional and individual effects
when analyzing nested data.
Research where institution-level characteristics are attached to an individual also is
flawed (Ethington, 1997). First, it violates the general assumption of ordinary least squares
2 Student responses to the following question: What have most of your grades been up to now at this institution? A, A-, B+, B, B-/C+, C/C-/or lower.

9
regression (OLS): observations are independent of one another. Second, it assumes that
individuals within a group are affected identically by group-level characteristics. Finally, the
inclusion of group-level variables into an OLS regression equation leads to poorly estimated
standard errors and inaccurate numbers of degrees of freedom, increasing the likelihood of
committing a Type II error (i.e., two variables are different from one another at a level of
statistical significance, when they are not).
Using HLM overcomes the problems associated with unit of analysis by simultaneously
modeling both individual and institutional effects. HLM models individual-level and group-level
variables simultaneously, resulting in more accurate parameter estimates, making it possible to
determine what is an individual-level effect or a group-level effect. Because these effects can be
partitioned, each can be modeled with their respective characteristics.
HLM also allows the intercept to vary, thereby partitioning the variance between the
institution and the student. In other words, we are able to accurately attribute the variance
associated with the student and the variance associated with the institution. Additionally, if we
suspect the experiences of student-athletes are different at different college campuses, we can
allow the athlete slope to vary by institution. By allowing the student-athlete slope to vary, the
coefficient for student-athletes then represents the average institutional difference between
student-athletes and non-athletes. If the athlete effect varies significantly by institution, we can
then model the average athlete differential with institutional characteristics.
For each of the dependent variables, we estimated separate models for men and women.
In the first set of models, the within institution models (where we only model student
characteristics), we examine whether student-athletes differ, on average, from their non-student-
athlete peers on the outcomes of interest. We allow both the intercept and athlete slope to vary

10
but do not include any institutional controls that predict either the student-athlete slope or the
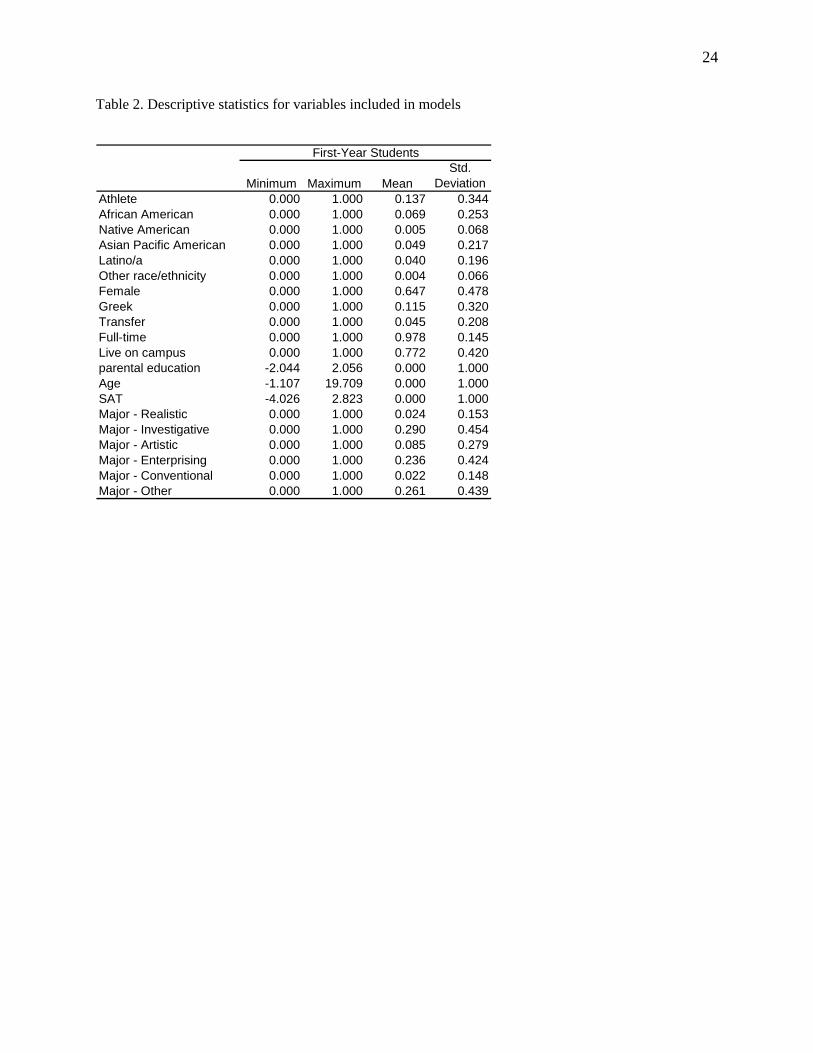
intercept. The model controls for student characteristics (age, race, gender, transfer, grades,
Greek, major, part-time status, residing on campus, parents' education)3. Table 2 shows the
descriptive statistics of variables included in our models.
The second set of models represents average institutional differences (intercept), and in
some cases the student-athlete slope, using institutional characteristics. At the institution level,
we created dummy-coded variables for the four athletic divisions (Division I, Division II,
Division III, and NAIA) to determine whether student experiences differ by division. Division III
was designated as the omitted group. Due to constraints presented by multicollinearity between
athletic division and other institutional characteristics (e.g., size, selectivity, Carnegie
Classification), we include athletic division in the intercept and slope models.
The continuous independent and dependent measures are standardized in the models,
meaning that the unstandardized coefficients in all of the tables represent effect sizes. An effect
size is the proportion of a standard deviation change in the dependent variable as a result of a
one-unit change in an independent variable. The larger the effect size the more likely the
differences between groups represent performance that warrants serious discussion and, perhaps,
intervention. Taking the advice of Rosenthal and Rosnow (1991) we consider an effect size of
.10 or less to reflect a trivial difference, between .10 and .30 small, between .30 and .50
moderate, and greater than .50 large.
Results
Engagement in Effective Educational Practices
Table 3 presents the effect sizes and significance levels for the models predicting student
engagement in effective educational practices. On average, student-athletes are as engaged in 3 Because of missing data, we include SAT as a control only for models self-reported grades.

11
most educationally purposeful activities as their peers. Compared with male non-athletes, male
student-athletes are as challenged academically, interact with faculty as frequently, and
participate as often in active and collaborative learning activities. Female student-athletes are
comparable on the academic challenge measure to their non-athlete peers. Although the effect
sizes are small, female student-athletes are more likely to interact with faculty and participate in
active and collaborative learning activities.
The variance component for the student-athlete slope indicates whether the impact of
being a student-athlete differs by institution. If the variance component for a slope is statistically
significant, one can conclude that the impact of being a student-athlete is different because of the
institution attended. Because none of the variance components for the student-athlete slope differ
significantly from zero for student engagement, it appears that the nature and frequency of
student-athlete engagement does not differ between institutions. This means, however, we cannot
model the student-athlete slope. Note the instances where the coefficient for the student-athlete
slope is statistically significant; this is the case for women on both active and collaborative
learning and student faculty interaction). At the same time, the variance component is not
statistically significant, which means that the impact of being an athlete on engagement in
effective educational practices is similar across institutions.
Because the variance components for all of the model intercepts (institutional averages)
are statistically significant, we then are able to model the average institutional engagement with
institution-level variables, in this case athletic division. For both men and women, students at
Division III schools report higher levels of academic challenge. Similarly, students at Division
III schools interact with faculty more than students at Division I and Division II schools.
Furthermore, men at Division I schools are statistically significantly less likely then men at

12
Division III schools to engage in active and collaborative learning activities. Women at Division
I and Division II schools are less likely than women at Division III schools to participate in
active and collaborative learning activities.
Some have suggested that for various reasons Division III athletes have a qualitatively
different, more well-rounded educational experience than their counterparts attending schools
that belong to other athletic divisions. The results from this study suggest that, in general, very
few differences exist between the engagement of student-athletes and non-athletes on a given
campus. However, because students at small residential liberal arts colleges (most of which are
Division III schools) generally are more engaged than students at other types of institutions
(Kuh, 2003; National Survey of Student Engagement, 2003), Division III their student-athletes
are more likely to be engaged than student-athletes in other divisions.
Perceptions of Campus Environment
Similar patterns of results emerge from the supportive campus environment models
(Table 4). Male and female student-athletes report that their campuses provide more academic
and social support than do their non-athlete peers. In addition, female student-athletes are more
satisfied with the overall college experience than female non-athletes. However, male student-
athletes appear to be less satisfied than other men on their campus.
After examining the variance components for the student-athlete slope, it appears that the
impact of being a student-athlete on support and satisfaction does not differ between institutions.
However, because the variance components are significant for the intercepts, we are able to
model them using athletic division. On average, both men and women at Division III schools
report they receive more support compared with students at Division II and Division I schools.

13
Also, men and women at Division III schools are more satisfied with their overall college
experience than their counterparts at Division II schools.
Self-reported Gains
Table 5 presents the results from the HLM analysis of self-reported gains. In general,
both male and female student-athletes report greater gains than non-athletes, especially in the
areas of personal/social development and practical competence. Male student-athletes report
greater gains in general education than their non-athlete peers.
Once again, the gains of athletes do not differ significantly by institution. We are,
however, able to model the intercepts (average institutional reports of gains). Few differences
between athletic divisions emerge. Women at Division III schools report greater gains in
personal/social development than women at Division I schools. Both men and women at
Division III schools report greater gains in general education than students at Division I and II
schools.
Grades
The final set of models predicts student self-reported grades. Male student-athletes report
earning lower grades than their peers, and the effect of being a student-athlete on grades does
differ significantly by institution. The student-athlete slope indicates that students at Division I
schools have statistically significantly higher self-reported grades than students at Division III
schools. Female student-athletes report similar grades as female non-athletes.
When we model average institutional grades (the intercept) for men, statistically
significant differences emerge by athletic division. On average, men at Division II and NAIA
schools report higher grades than men at Division III schools. In fact, the effects, .11 for Division
II and .17 for NAIA, erase the negative effect (-.06) of being a student-athlete on grades.

14
Limitations
This study is limited in four ways. The first is related to the validity of the self-reported
gains used in our models. As Pascarella (2001) and others point out, gain scores may be
confounded by students’ entering characteristics. However, Pike (1999) provides some evidence
to suggest that gain scores are not significantly related to entering ability. A fair amount of
research (Baird, 1976; Berdie, 1971; Pace, 1985; Pike, 1995; Pohlmann, 1974) has shown that
self-reports are likely to be valid if (1) the information requested is known to the respondents, (2)
the questions are phrased clearly and unambiguously, (3) the questions refer to recent activities,
(4) the respondents think the questions merit a serious and thoughtful response, and (5)
answering the questions does not threaten, embarrass, or violate the privacy of the respondent or
encourage the respondent to respond in socially desirable ways (Kuh et al., 2001). The NSSE
survey was designed to satisfy all of these conditions. Although the concerns about self-reported
data are legitimate, the gains measures are only one of several sets of dependent variables used in
this study.
Another limitation is the way in which the NSSE survey identifies student-athletes.
Students respond to the question, “Are you a student-athlete on a team sponsored by your
institution?” It is possible that some students participating in sports not sponsored by their
institution (e.g., club sports) responded affirmatively to the question. However, given the size of
our data set the impact of the error introduced by incorrect coding of athletes is likely to be
minimal.
Third, we cannot determine the sport(s) in which the athlete respondents participated.
Thus, we are unable to compare the experiences of athletes competing in revenue-generating or
non-revenue generating sports. Some previous research (Pascarella, Bohr, Nora, & Terenzini,

15
1995; Pascarella, Truckenmiller, Nora., Terenzini, Edison, & Hagedorn, 1999) suggests that there are
significant differences in the experiences of athletes in non-revenue and revenue generating
sports.
Finally, given that cross-sectional data are used in this study, we are unable to control for
self selection. Perhaps athletes and non-athletes who matriculate at Division III colleges are more
predisposed to seek out campuses where they are surrounded by people who are highly engaged.
Some of the divisional differences we see may be due, in part, to a self-selection bias. While not
likely, it is possible and warrants a cautionary note.
Discussion and Implications
Much has been made recently about the Bowen and Levin (2003) report that student-
athletes do not experience campus life in the same qualitatively beneficial ways as do their non-
athlete peers. This infers, then, that athletes do not engage in effective educational practices at
the same level as other students and, therefore, are not likely to gain as much from college.
Results from this study do not support such a sweeping conclusion. Rather, our findings indicate
that student-athletes are at least as engaged overall, and in some areas are more engaged,
compared with their non-athlete peers. In addition, student-athletes report that they perceived
their campus environment to be more supportive of their academic and social needs, and they
report making greater gains since starting college in several areas. This pattern of findings
corroborates other recent research into the collegiate experiences and outcomes associated with
being a student athlete (Pascarella et. al, 1995, 1999; Wolniak et. al 2001).
Of special interest are the results that illuminate the impact of being an athlete at different
types of institutions. Where differences exist between athletes and non-athletes, the impact of
being an athlete, on average, is the same across all types of institutions in our study. In only one

16
instance, that being grades earned by male athletes and non-athletes, did the impact of being a
student athlete have a statistically significant effect that differed across institutions.
Interpreting institutional effects and athlete status is more complicated when we consider
average institutional engagement, campus support, and gains. The experiences of athletes appear
to differ only slightly from their non-athlete counterparts. At the same time, the differences in
average institutional scores on several measures may point to differences in the experiences of
athletes that may be associated with the athletic division affiliation of their school. Because all
students at Division III schools are -- on average -- more engaged, feel more supported, and
report greater gains than their peers at other types of schools, it stands to reason that athletes at
Division III institutions will also be more engaged than students (both athletes and non athletes)
at other types of institutions.
Given the great variation in most aspects of student life, it is almost certain that some
student-athletes on a given campus are short changed in non-trivial ways in terms of what they
put into and get out of college (Umbach & Kuh, 2004). This is more likely to be the case for
men and student athletes at larger institutions where arguably athletics requires a greater
commitment of time, both in and out-of-season. Unfortunately, the NSSE database in 2003 did
not make it possible to identify the primary or secondary sports of the student-athletes. Perhaps
in subsequent years we will find systematic differences between student-athletes in the high and
low profile areas, such as football and fencing respectively.
Implications
The findings from this study provide a different picture of student-athletes than the one
typically presented in the national media. Most of the recent discussions have emphasized the
problems that athletes create or suffer from. Many of the deleterious effects are associated with

17
Division I revenue generating sports. Granted, our results indicate that male athletes may earn
slightly lower grades than their peers. At the same time, they appear to have similar or perhaps
better educational experiences than their non-athlete counterparts in other ways. This same
pattern of neutral or positive findings hold for women as well, as female athletes are more
engaged, report greater gains, feel more supported, and earn similar grades to their non-athlete
women. This is not to say that abuses do not occur or that athletes in certain sports or competing
for certain institutions are not shortchanged. Certainly, deplorable conditions exist within
intercollegiate athletic programs, just as the do in research laboratories, fraternity and sorority
houses, and classrooms (the latter evidence by the widespread reports of cyber-plagiarism
(National Survey of Student Engagement, 2003). However, it would be a mistake to tar all
athletes and institutions that host athletic programs with the same brush of ignominy.
The debate about the proper role of athletics and student success should be about more
than grades and class rank. Some our findings point to concerns, especially the lower grades
reported by male athletes. Even after controlling for pre-college achievement (SAT), male
athletes earn lower grades. Although our data suggest the trend is national, the gap between male
athletes and male non-athletes is greatest at Division III and NAIA schools. We caution against
over interpreting these differences, but do recommend further study as to the causes of lower
grades.
In addition to contributing to the discussion on the intercollegiate athletics, our findings
may be useful to high school athletes in their college choice process. They can take comfort in
the fact that whatever college they choose, their experiences probably will not differ greatly from
other students on their campus.

18
Finally, it is incumbent on colleges and universities to learn more about the experiences
of their student-athletes and determine whether they are taking part in educationally sound
activities and benefiting in desired ways from college at levels commensurate with their non-
athlete peers. After all, we know a good deal about how student-athletes perform on the playing
field. We should also keep score as to the quality of their educational activities elsewhere on
campus (Umbach & Kuh, 2004).
Conclusion
For such a popular topic, it’s surprising that there is so little evidence at the national level
about what student-athletes do during college and how their behavior compares to other students.
For example, until recently we knew almost nothing about how athletes spend their time when
not on the playing fields and courts. Contrary to many reports in the popular media, the findings
from this study indicate that, on balance, student-athletes across a large number of colleges and
universities do not differ greatly from their peers in terms of their participation in effective
educational practices. In most instances, when differences do exist, they favor athletes. That is a
very different picture than what is routinely presented in the popular press.
19
References Astin, A. W. (1993). What matters in college? Four critical years revisited. San Francisco:
Jossey-Bass.
Astin, A. W. (1984). Student involvement: A developmental theory for higher education. Journal
of College Student Personnel, 25(4), 297-308.
Bowen, W.G., & Levin, S.A. (2003). Reclaiming the game: College sports and educational
values. Princeton, NJ: Princeton University Press.
Edgerton, R., & Shulman, L.S. (2002). Foreword: From promise to progress: Exploring
engagement. In National Survey of Student Engagement, From promise to progress:
How colleges and universities are using student engagement results to improve collegiate
quality. Bloomington, IN: Indiana University Center for Postsecondary Research.
Ethington, C. A. (1997). A hierarchical linear modeling approach to studying college effects. In
J. Smart (ed.), Higher Education Handbook of Theory and Research, Vol. 12, pp. 165–
194. Edison, NJ: Agathon.9
Hood, A. B., Craig, A. F., & Ferguson, B. W. (1992). The impact of athletics, part-time
employment, and other activities on academic achievement. Journal of College Student
Development, 33, 447-453.
Howard-Hamilton, M. F., & Sina, J.A. (2001). How college affects student athletes. New
Directions for Student Services, 93, 35-45.
Hu, S., & Kuh, G.D. (2003). Maximizing what students get out of college: Testing a learning
productivity model. Journal of College Student Development, 44, 185-203.

20
Hu, S., & Kuh, G.D. (2004, April). Untangling organization-individual level conundrum:
Toward higher-level credibility research in higher education. Paper presented at the
annual meeting of the American Educational Research Association, San Diego.
Jacobsen, J. (2004, May 28). Panel blasts U. of Colorado for handling of scandal. Chronicle of
Higher Education, 50(38), A1.
King, G. (1999). A solution to the ecological inference problem: Reconstructing individual
behavior from aggregate data. Princeton, NJ: Princeton University Press.
Kreft, I., & De Leeuw, J. (1998). Introducing multilevel modeling. Thousand Oaks, CA: Sage. .
Kuh, G.D. (2001). Assessing what really matters to student learning: Inside the National Survey
of Student Engagement. Change, 33(3), 10-17, 66.
Kuh, G.D. (2003). What we’re learning about student engagement from NSSE. Change, 35(2),
24-32.
Kuh, G. D., Douglas, K. B., Lund, J. P., & Ramin-Gyurnek, J. (1994). Student learning outside
the classroom: Transcending artificial boundaries (8). Washington, D.C.: George
Washington University Graduate School of Education.
Kuh, G. D., Schuh, J. H., Whitt, E.J. & Associates (1991). Involving colleges: Successful
approaches to fostering learning and personal development outside the classroom. San
Francisco: Jossey-Bass.
National Survey of Student Engagement (2003). Converting data into action: Expanding the
boundaries of institutional improvement. Bloomington, IN: Indiana University Center for
Postsecondary Research.

21
Pascarella, E. T., Truckenmiller, R., Nora, A., Terenzini, P.T., Edison, M., & Hagedorn, L.S.
(1999). Cognitive impacts of intercollegiate athletic participation: Some further evidence.
Journal of Higher Education, 70(1), 1-26.
Pascarella, E. T., Bohr, L., Nora, A., & Terenzini, P. T. (1995). Intercollegiate athletic
participation and freshmen-year cognitive outcomes. Journal of Higher Education, 66(4),
369-387.
Pascarella, E. T., & Terenzini, P. T. (1991). How college affects students. San Francisco: Jossey-
Bass.
Raudenbush, S. W. & Bryk, A. S. (2002). Hierarchical linear models: Applications and data
analysis methods. Thousand Oaks, CA: Sage Publications.
Richards, S., & Aries, E. (1999). The division III student-athlete: Academic performance,
campus involvement, and growth. Journal of College Student Development, 40(3), 211-
218.
Riemer, B. A., Beal, B., & Schroeder, P. (2000). The influences of peer and university culture on
female student-athletes’ perceptions of career termination, professionalization, and social
isolation. Journal of Sport Behavior, 23(4), 364-378.
Rosenthal, R., & Rosnow, R. L. (1991). Essentials of behavioral research: methods and data
analysis (2nd ed.). New York: McGraw-Hill.
Schroeder, P. J. (2000). An assessment of student involvement among selected NCAA division
III basketball players. Journal of College Student Development, 41(6), 616-626.
Shulman, L.S. (2002). Making differences: A table of learning. Change, 34(6), 36-44.
Shulman, J.L., & Bowen, W. G. (2001). The game of life: College sports and educational values.
Princeton, NJ: Princeton University Press.

22
Suggs, W. (2003, April 18). Grades and money: NCAA considers new rules that would tie sports
participation to academic performance. Chronicle of Higher Education, 49(32), A43.
Suggs, W. (2003, January 17). Jock majors: Many colleges allow football players to take the
easy way out. Chronicle of Higher Education, 49(19), A33.
Terenzini, P. T., Pascarella, E. T., & Blimling, G. S. (1996). Students' out-of-classroom
experiences and their influence on learning and cognitive development: A literature
review. Journal of College Student Development, 37(2), 149-162.
Thelin, J.R. (1994). Games colleges play: Scandal and reform in intercollegiate athletics.
Baltimore: Johns Hopkins University Press.
Tinto, V. (1987). Leaving college: Rethinking the causes and cures of student attrition. Chicago:
University of Chicago Press.
Umbach, P.D, & Kuh, G.D. (2004). Disengaged jocks: Myth or reality? LiberalArtsOnline, 4,
(4). http://liberalarts.wabash.edu/cila/home.cfm?news_id=1593
Wolf-Wendel, L. E., Toma, J. D., & Morphew, C. C. (2001). There's no "I" in "Team": Lessons
from athletes on community building. The Review of Higher Education, 24(4), 369-396.
Wolniak, G. C., Pierson, C. T., & Pascarella, E. T. (2001). Effects of intercollegiate athletics
participation on male orientations toward learning. Journal of College Student
Development, 42(6), 604-624.

23
Table 1. Students by athlete status and athletic division
Athletic Division
Non-athlete Athlete Total
Non-athlete Athlete Total
Non-athlete Athlete Total
Division I 6,697 588 7,285 12,267 811 13,078 18,964 1,399 20,363 Division II 3,495 493 3,988 6,869 688 7,557 10,364 1,181 11,545 Division III 4,780 2,041 6,821 11,025 2,475 13,500 15,805 4,516 20,321 NAIA 1,475 347 1,822 2,879 378 3,257 4,354 725 5,079 Total 16,447 3,469 19,916 33,040 4,352 37,392 49,487 7,821 57,308
Division I 91.9% 8.1% 100.0% 93.8% 6.2% 100.0% 93.1% 6.9% 100.0%Division II 87.6% 12.4% 100.0% 90.9% 9.1% 100.0% 89.8% 10.2% 100.0%Division III 70.1% 29.9% 100.0% 81.7% 18.3% 100.0% 77.8% 22.2% 100.0%NAIA 81.0% 19.0% 100.0% 88.4% 11.6% 100.0% 85.7% 14.3% 100.0%Total 82.6% 17.4% 100.0% 88.4% 11.6% 100.0% 86.4% 13.6% 100.0%
Men Women Overall
24
Table 2. Descriptive statistics for variables included in models
Minimum Maximum MeanStd.
DeviationAthlete 0.000 1.000 0.137 0.344African American 0.000 1.000 0.069 0.253Native American 0.000 1.000 0.005 0.068Asian Pacific American 0.000 1.000 0.049 0.217Latino/a 0.000 1.000 0.040 0.196Other race/ethnicity 0.000 1.000 0.004 0.066Female 0.000 1.000 0.647 0.478Greek 0.000 1.000 0.115 0.320Transfer 0.000 1.000 0.045 0.208Full-time 0.000 1.000 0.978 0.145Live on campus 0.000 1.000 0.772 0.420parental education -2.044 2.056 0.000 1.000Age -1.107 19.709 0.000 1.000SAT -4.026 2.823 0.000 1.000Major - Realistic 0.000 1.000 0.024 0.153Major - Investigative 0.000 1.000 0.290 0.454Major - Artistic 0.000 1.000 0.085 0.279Major - Enterprising 0.000 1.000 0.236 0.424Major - Conventional 0.000 1.000 0.022 0.148Major - Other 0.000 1.000 0.261 0.439
First-Year Students

25
Table 3. Coefficients4 for level-two models predicting student engagement in effective educational practices
Within Full Within Full Within Full Within Full Within Full Within FullIntercept -0.02 -0.02 0.00 0.00 0.03 * 0.03 * 0.04 ** 0.04 ** 0.02 0.02 0.03 + 0.03 *
Division I -0.16 *** -0.17 *** -0.16 *** -0.18 *** -0.13 ** -0.18 ***Division II -0.24 *** -0.25 *** -0.08 * -0.10 ** -0.06 -0.11 **
NAIA -0.15 ** -0.19 *** -0.06 -0.02 0.04 0.05
Athlete slope 0.00 0.00 0.02 0.03 0.00 -0.01 0.05 ** 0.05 ** 0.03 0.03 0.03 * 0.03 *Division I
Division IINAIA
Variance Components
Intercept 0.06 *** 0.06 *** 0.07 *** 0.06 *** 0.05 *** 0.04 *** 0.06 *** 0.05 *** 0.07 *** 0.07 *** 0.08 *** 0.07 ***
Athlete Slope 0.01 0.01 0.00 0.00 0.01 0.01 0.01 0.01 0.00 0.00 0.00 0.00Level-1 0.88 0.88 0.88 0.88 0.92 0.92 0.92 0.92 0.89 0.89 0.90 0.90
Student Faculty Interaction Active and Collaborative LearningAcademic ChallengeMen Women Men Women Men Women
4 Level one controls (included in both blocks) - age, race, gender, transfer, live on campus, athlete, greek, major, full-time, parents' education ***p<.001, **p<.01, *<p.05, +p<.10

26
Table 4. Coefficients for level-two models predicting student perceptions of campus environment5
Within Full Within Full Within Full Within FullIntercept 0.02 0.02 0.01 0.02 -0.04 ** -0.04 ** -0.03 * -0.03 *
Division I -0.20 *** -0.26 *** 0.00 -0.03Division II -0.14 *** -0.15 *** -0.12 *** -0.10 **
NAIA -0.05 0.02 -0.04 -0.01
Athlete slope 0.05 * 0.05 * 0.08 *** 0.08 *** -0.04 * -0.04 * 0.04 ** 0.04 **Division I
Division IINAIA
Variance Components
Intercept 0.05 *** 0.05 *** 0.07 *** 0.06 *** 0.05 *** 0.05 *** 0.06 *** 0.06 ***
Athlete Slope 0.01 0.01 0.00 0.00 0.02 0.02 0.00 0.00Level-1 0.90 0.90 0.09 0.89 0.90 0.90 0.90 0.90
WomenMenWomenMenSupportive Campus Environment Satisfaction
5 Level one controls (included in both blocks) - age, race, gender, transfer, live on campus, athlete, greek, major, full-time, parents' education ***p<.001, **p<.01, *<p.05, +p<.10

27
Table 5. Coefficients for level-two models predicting student self-reported gains6
Men Women Men Women Men WomenWithin Full Within Full Within Full Within Full Within Full Within Full
Intercept 0.00 0.00 0.00 0.00 0.01 0.01 -0.01 -0.01 -0.05 ** -0.05 ** 0.04 0.00Division I -0.01 -0.05 + -0.13 *** -0.13 *** -0.03 -0.04
Division II -0.03 -0.07 * -0.13 *** -0.12 *** -0.04 -0.05NAIA -0.01 0.01 -0.08 + -0.04 -0.02 -0.01
Athlete slope 0.08 *** 0.08 *** 0.05 *** 0.05 *** 0.03 * 0.03 * 0.02 0.02 0.04 * 0.04 * 0.06 *** 0.06 ***Division I
Division IINAIA
Variance Components
Intercept 0.04 *** 0.04 *** 0.04 *** 0.04 *** 0.04 *** 0.04 *** 0.05 *** 0.04 *** 0.04 *** 0.04 *** 0.04 *** 0.04 ***
Athlete Slope 0.00 0.00 0.00 0.00 0.00 0.00 0.00 0.00 0.00 0.00 0.00 0.00Level-1 0.92 0.92 0.93 0.93 0.91 0.91 0.92 0.92 0.89 0.89 0.92 0.92
General Education Practical CompetenciesPersonal/social
6 Level one controls (included in both blocks) - age, race, gender, transfer, live on campus, athlete, greek, major, full-time, parents' education ***p<.001, **p<.01, *<p.05, +p<.10

28
Table 6. Coefficients for level-two models predicting student self-reported grade point average7
Within WithinIntercept 0.06 *** 0.06 *** 0.06 *** 0.06 ***
Division I 0.04 -0.05Division II 0.11 ** 0.11 *
NAIA 0.17 ** 0.18 **
Athlete slope -0.07 ** -0.06 * -0.02 -0.02Division I 0.09 +
Division II 0.07NAIA -0.01
Variance Components
Intercept 0.05 *** 0.05 *** 0.08 *** 0.08 ***
Athlete Slope 0.02 * 0.02 * 0.00 0.00Level-1 0.78 0.78 0.75 0.75
Full FullMen Women
7 Level one controls (included in both blocks) - age, race, gender, transfer, live on campus, athlete, greek, major, full-time, parents' education ***p<.001, **p<.01, *<p.05, +p<.10

29
APPENDIX A CONSTRUCTS AND VARIABLES QUESTION RESPONSE SETS
Student Engagement Level of Academic Challenge (a=.73-.75) Hours per week preparing for class (studying, reading, writing, rehearsing, and other activities related to your academic program) 0, 1-5, 6-10, 11-15, 16-20, 21-25, 26-30, More than 30 Worked harder than you thought you could to meet an instructor's standards or expectations Very often, often, sometimes, never Number of assigned textbooks, books, or book-length packs of course readings during the current school year None, 1-4, 5-10, 11-20, more than 20 Number of written papers or reports of 20 pages or more during the current school year None, 1-4, 5-10, 11-20, more than 20 Number of written papers or reports between 5 and 19 pages during the current school year None, 1-4, 5-10, 11-20, more than 20 Number of written papers or reports of fewer than 5 pages during the current school year None, 1-4, 5-10, 11-20, more than 20 Coursework emphasizes: Analyzing the basic elements of an idea, experience, or theory Very much, quite a bit, some, very little Coursework emphasizes: Synthesizing and organizing ideas, information, or experiences into new, more complex interpretations and relationships Very much, quite a bit, some, very little Coursework emphasizes: Making judgments about the value of information, arguments, or methods Very much, quite a bit, some, very little Coursework emphasizes: Applying theories or concepts to practical problems or in new situations Very much, quite a bit, some, very little Campus environments emphasize: Spending significant amounts of time studying and on academic work Very much, quite a bit, some, very little Active and Collaborative Learning (a=.61-.63) Asked questions in class or contributed to class discussions Very often, often, sometimes, never Made a class presentation Very often, often, sometimes, never Worked with other students on projects during class Very often, often, sometimes, never Worked with classmates outside of class to prepare class assignments Very often, often, sometimes, never Tutored or taught other students (paid or voluntary) Very often, often, sometimes, never Participated in a community-based project as part of a regular course Very often, often, sometimes, never Discussed ideas from your readings or classes with others outside of class (students, family members, coworkers, etc.) Very often, often, sometimes, never Student Faculty Interaction (a=.73-75) Discussed grades or assignments with an instructor Very often, often, sometimes, never Discussed ideas from your readings or classes with faculty members outside of class Very often, often, sometimes, never Received prompt feedback from faculty on your academic performance (written or oral) Very often, often, sometimes, never Talked about career plans with a faculty member or advisor Very often, often, sometimes, never Perceptions of the Campus Environment Supportive Campus Environment (a=.76-.79) Campus Environments Emphasize: Providing the support you need to help you succeed academically Very much, quite a bit, some, very little Campus Environments Emphasize: Helping you cope with your non-academic responsibilities (work, family, etc.) Very much, quite a bit, some, very little Campus Environments Emphasize: Providing the support you need to thrive socially Very much, quite a bit, some, very little
Quality: Relationships with other students 1=Unfriendly, unsupportive, sense of alienation; 7=friendly, supportive, sense of belonging
Quality: Relationships with faculty members 1=Unavailable, unhelpful, unsympathetic; 7=Available, helpful, sympathetic
Quality: Relationships with administrative personnel and offices 1=Unhelpful, inconsiderate, rigid 7=Helpful, considerate, flexible Satisfaction (a=.75-.78) How would you evaluate your entire educational experience at this institution? Excellent, good, fair, poor If you could start over again, would you go to the same institution you are now attending? Excellent, good, fair, poor

30
CONSTRUCTS AND VARIABLES QUESTION RESPONSE SETS
Gains in Learning and Intellectual Development Gains in Personal and Social Development (a=.80-.81) Contributed to: Developing a personal code of values and ethics Very much, quite a bit, some, very little Contributed to: Understanding people of other racial and ethnic backgrounds Very much, quite a bit, some, very little Contributed to: Understanding yourself Very much, quite a bit, some, very little Contributed to: Improving the welfare of your community Very much, quite a bit, some, very little Contributed to: Learning effectively on your own Very much, quite a bit, some, very little Contributed to: Working effectively with others Very much, quite a bit, some, very little Gains in General Education (a=.79-.82) Contributed to: Writing clearly and effectively Very much, quite a bit, some, very little Contributed to: Speaking clearly and effectively Very much, quite a bit, some, very little Contributed to: Thinking critically and analytically Very much, quite a bit, some, very little Contributed to: Acquiring broad general education Very much, quite a bit, some, very little Gains in Practical Competence (a= .76-.79) Contributed to: Acquiring job or work-related knowledge and skills Very much, quite a bit, some, very little Contributed to: Using computing and information technology Very much, quite a bit, some, very little Contributed to: Analyzing quantitative problems Very much, quite a bit, some, very little Contributed to: Solving complex real-world problems Very much, quite a bit, some, very little
Top Related