


Languages
Pages
Legal

Intelligent Digital Oilfield
Management Systems
User’s Guide
v.2.02
Developed by:
The University of Texas at Austin
iDOMS
Contents
Introduction .................................................................................................................................................. 1
iDOMS Licensing ........................................................................................................................................... 1
Requirements and Installation ...................................................................................................................... 1
The iDOMS interface ..................................................................................................................................... 1
Updates ......................................................................................................................................................... 2
The Network Diagram ................................................................................................................................... 2
Network Components ............................................................................................................................... 2
Network Visualization & Notations ........................................................................................................... 3
Notations ............................................................................................................................................... 3
Adding Network Elements ........................................................................................................................ 4
Editing Network Elements (Junctions, Pipelines or Separator) ................................................................ 4
Editing Network Elements (Wells) ............................................................................................................ 4
Properties of the Surface Flowline Network ............................................................................................. 4
Coupling of wells with the surface network ......................................................................................... 5
Managing Wells............................................................................................................................................. 6
Adding a new well ..................................................................................................................................... 6
Selecting a well to edit Reservoir, Wellbore or Completion Properties ................................................... 6
Operational Schedule ................................................................................................................................ 6
Reservoir properties ................................................................................................................................. 7
Wellbore Trajectory .................................................................................................................................. 7
PVT Properties .......................................................................................................................................... 8
Completion Properties & Production Constraints .................................................................................... 8
Numerical Preferences .................................................................................................................................. 9
Nodal Analysis ........................................................................................................................................... 9
Simulation Steps ......................................................................................................................................... 10
Step A: Nodal Analysis ............................................................................................................................ 10
Step B: Instantiation of the Branched Network ...................................................................................... 10
Step C: Construction of Loops ................................................................................................................. 10
Simulation / Optimization ....................................................................................................................... 11
Simulation Times ................................................................................................................................. 11
Optimization Methods ........................................................................................................................ 11
Simulation of Surface Network for user specified well rates ................................................................. 12
Output ......................................................................................................................................................... 13
Field Results ............................................................................................................................................ 13
Output as a function of time ............................................................................................................... 13
Field Production versus time .............................................................................................................. 13
Monitoring of the Surface flowline System ........................................................................................ 14
Individual Well Results ............................................................................................................................ 14
Well rates ............................................................................................................................................ 14
Well Pressures ..................................................................................................................................... 15
Constraints overview .......................................................................................................................... 15

www.idoms.net 1
Introduction
Welcome to iDOMS! iDOMS is a software application developed by the University of Texas at Austin that
assists operators in properly selecting choke sizes or ESP Frequencies in existing oilfields. Using state of
the art software architecture, iDOMS effectively integrates models for reservoir, wellbore and surfaces
facilities into an intuitive, user-friendly interface.
The purpose of this User’s Manual is to guide the user through iDOMS installation, briefly present iDOMS
capabilities and describe the process of providing the input parameters to the model.
iDOMS Licensing
New users may obtain a 60-day trial license by registering at the following link:
http://tinyurl.com/iDOMS-Registration
Following registration, our team will provide you with the iDOMS installation package.
Requirements and Installation
iDOMS Requirements:
• Windows 7 or later
• .NET Framework 4.5 or later
To install iDOMS, please run the iDOMSInstaller.exe provided to you by our developer team.
The iDOMS interface
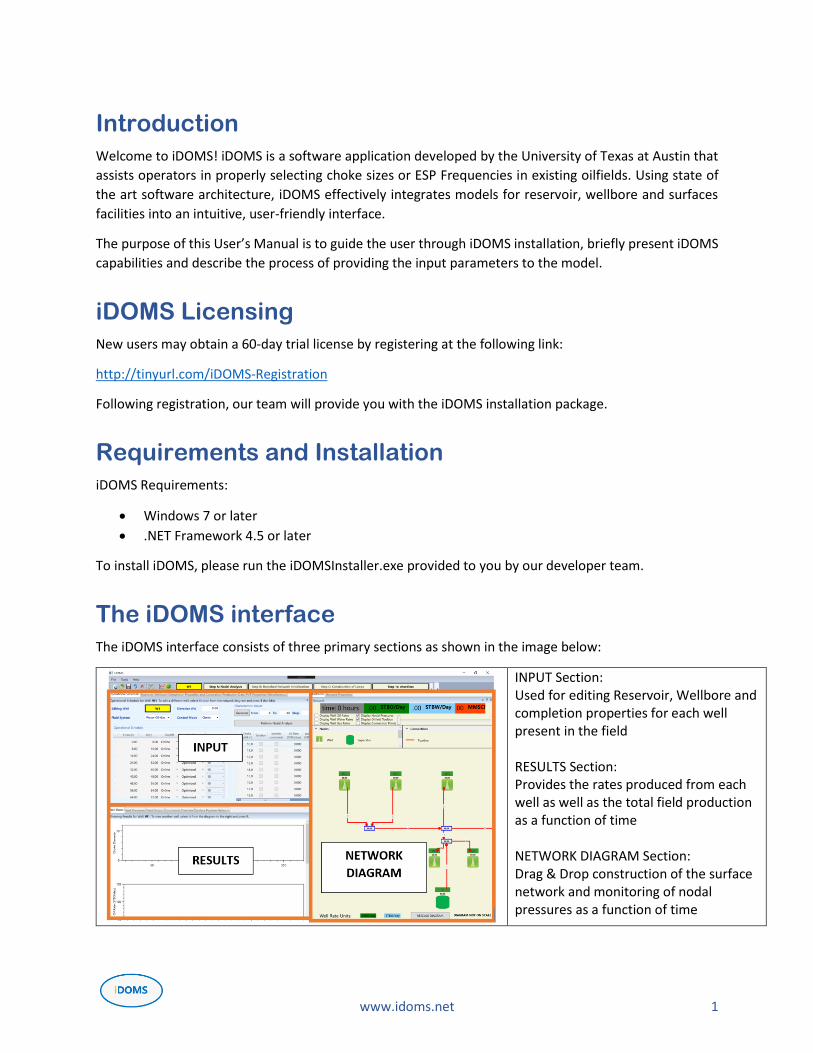
The iDOMS interface consists of three primary sections as shown in the image below:
INPUT Section: Used for editing Reservoir, Wellbore and completion properties for each well present in the field RESULTS Section: Provides the rates produced from each well as well as the total field production as a function of time NETWORK DIAGRAM Section: Drag & Drop construction of the surface network and monitoring of nodal pressures as a function of time
www.idoms.net 2
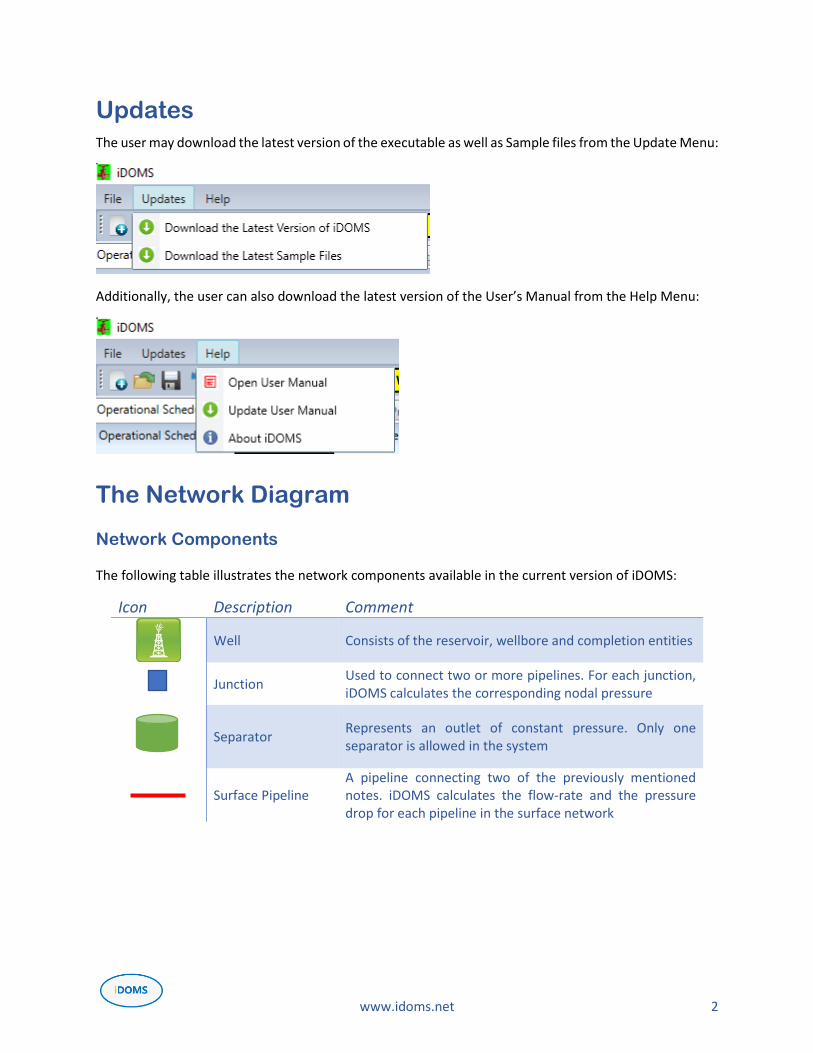
Updates
The user may download the latest version of the executable as well as Sample files from the Update Menu:
Additionally, the user can also download the latest version of the User’s Manual from the Help Menu:
The Network Diagram
Network Components
The following table illustrates the network components available in the current version of iDOMS:
Icon Description Comment
Well Consists of the reservoir, wellbore and completion entities
Junction Used to connect two or more pipelines. For each junction, iDOMS calculates the corresponding nodal pressure
Separator Represents an outlet of constant pressure. Only one separator is allowed in the system
Surface Pipeline A pipeline connecting two of the previously mentioned notes. iDOMS calculates the flow-rate and the pressure drop for each pipeline in the surface network
www.idoms.net 3
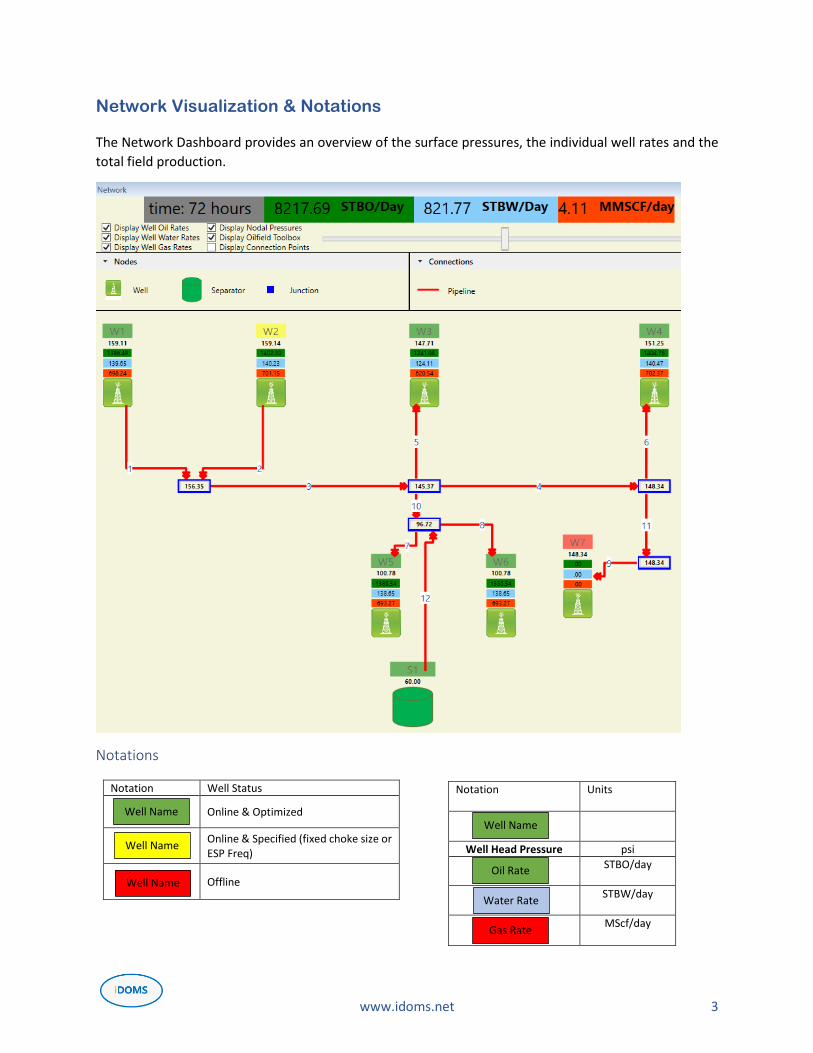
Network Visualization & Notations
The Network Dashboard provides an overview of the surface pressures, the individual well rates and the
total field production.
Notations
Notation Well Status
Online & Optimized
Online & Specified (fixed choke size or ESP Freq)
Offline
Notation Units
Well Head Pressure psi
STBO/day
STBW/day
MScf/day
Well Name
Well Name
Well Name
Well Name
Oil Rate
Water Rate
Gas Rate
www.idoms.net 4
Adding Network Elements
To add a network element to the network, simply drag & drop it from the diagram toolbox into the surface
network.
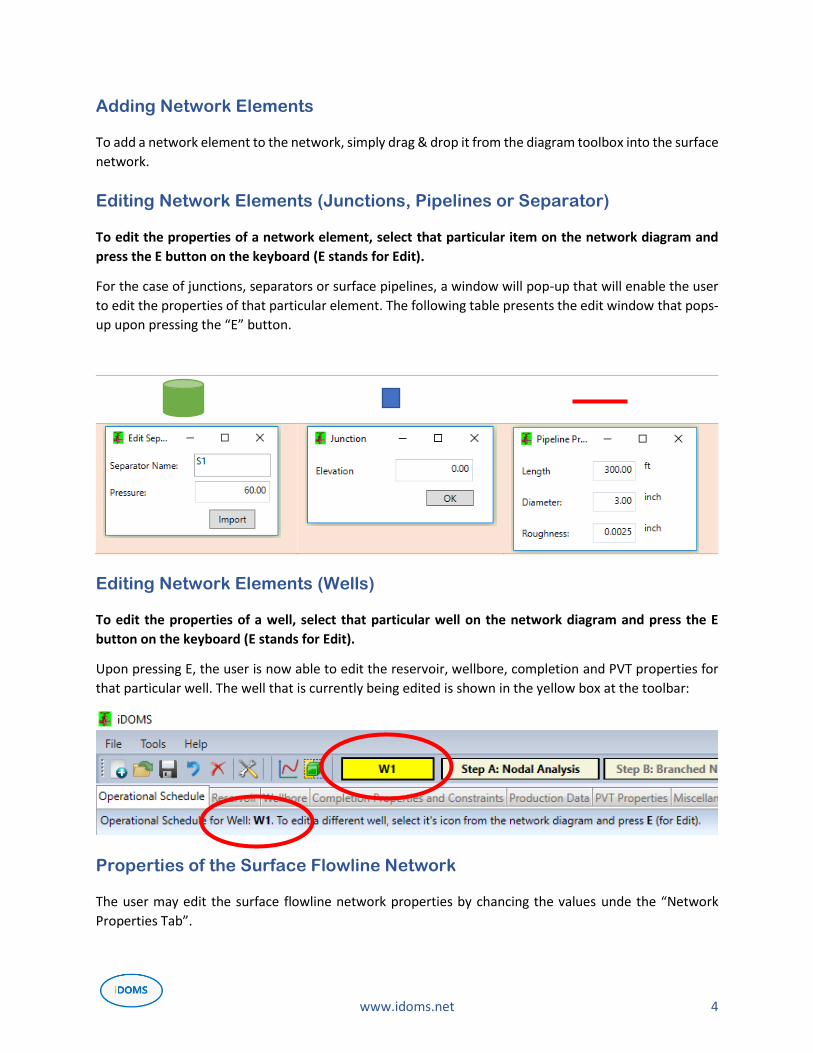
Editing Network Elements (Junctions, Pipelines or Separator)
To edit the properties of a network element, select that particular item on the network diagram and
press the E button on the keyboard (E stands for Edit).
For the case of junctions, separators or surface pipelines, a window will pop-up that will enable the user
to edit the properties of that particular element. The following table presents the edit window that pops-
up upon pressing the “E” button.
Editing Network Elements (Wells)
To edit the properties of a well, select that particular well on the network diagram and press the E
button on the keyboard (E stands for Edit).
Upon pressing E, the user is now able to edit the reservoir, wellbore, completion and PVT properties for
that particular well. The well that is currently being edited is shown in the yellow box at the toolbar:
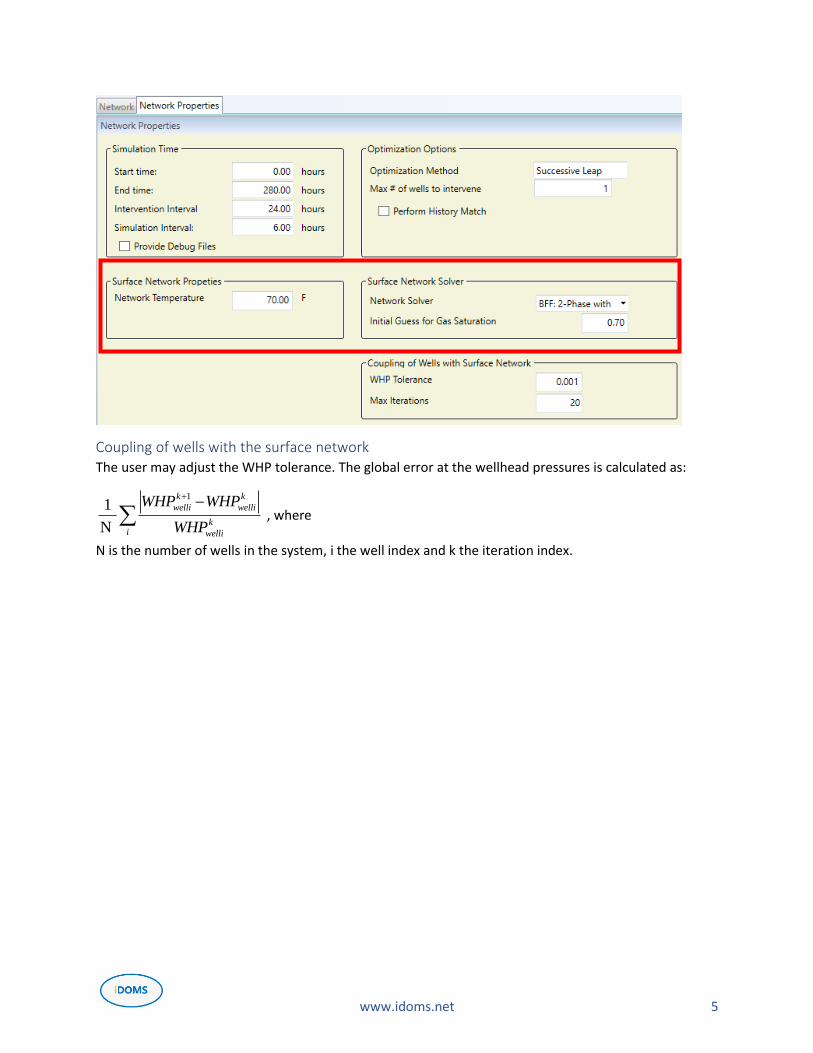
Properties of the Surface Flowline Network
The user may edit the surface flowline network properties by chancing the values unde the “Network
Properties Tab”.
www.idoms.net 5
Coupling of wells with the surface network The user may adjust the WHP tolerance. The global error at the wellhead pressures is calculated as:
1
1
N
k k
welli welli
ki welli
WHP WHP
WHP
, where
N is the number of wells in the system, i the well index and k the iteration index.
www.idoms.net 6
Managing Wells
Adding a new well
To add a new well, simply drag & drop the well icon from the oilfield toolbox into the network diagram.
The user will then be asked if he wants to inherit the well properties from a well that already exists in the
field
Selecting a well to edit Reservoir, Wellbore or Completion Properties
To edit the properties of a well, select that particular well on the network diagram and press the E
button on the keyboard (E stands for Edit).
Upon pressing E, the user is now able to edit the reservoir, wellbore, completion and PVT properties for
that particular well. The well that is currently being edited is shown in the yellow box at the toolbar
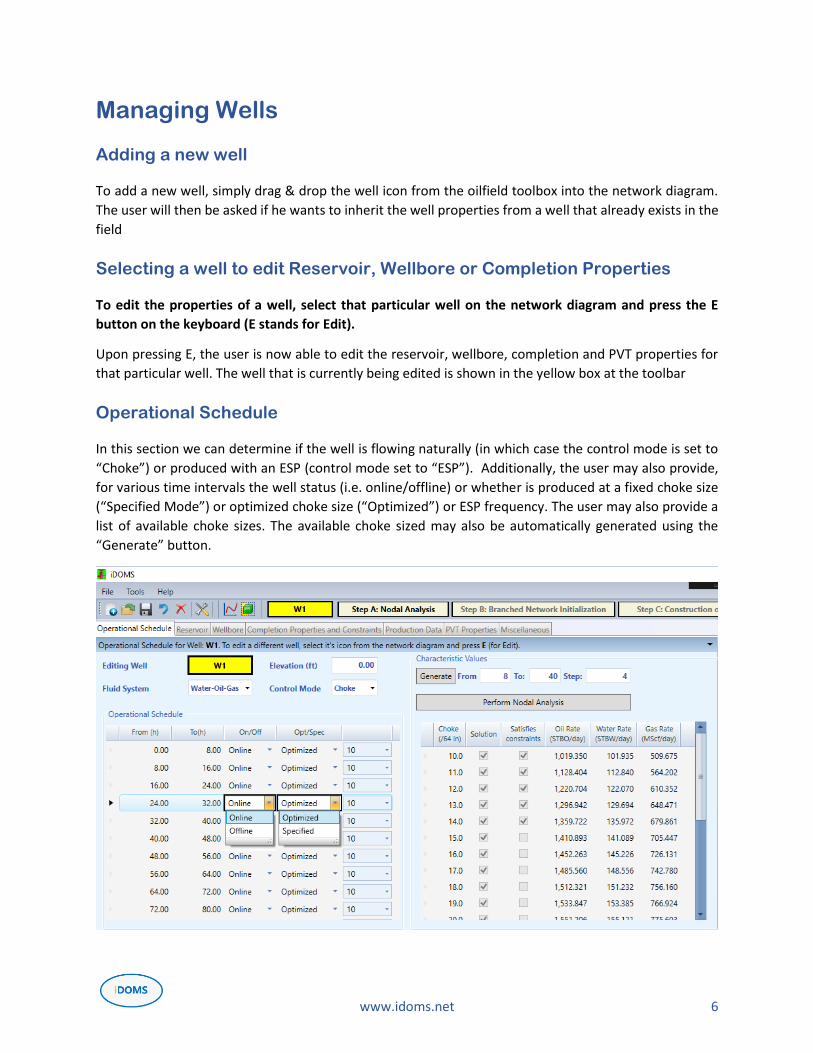
Operational Schedule
In this section we can determine if the well is flowing naturally (in which case the control mode is set to
“Choke”) or produced with an ESP (control mode set to “ESP”). Additionally, the user may also provide,
for various time intervals the well status (i.e. online/offline) or whether is produced at a fixed choke size
(“Specified Mode”) or optimized choke size (“Optimized”) or ESP frequency. The user may also provide a
list of available choke sizes. The available choke sized may also be automatically generated using the
“Generate” button.
www.idoms.net 7
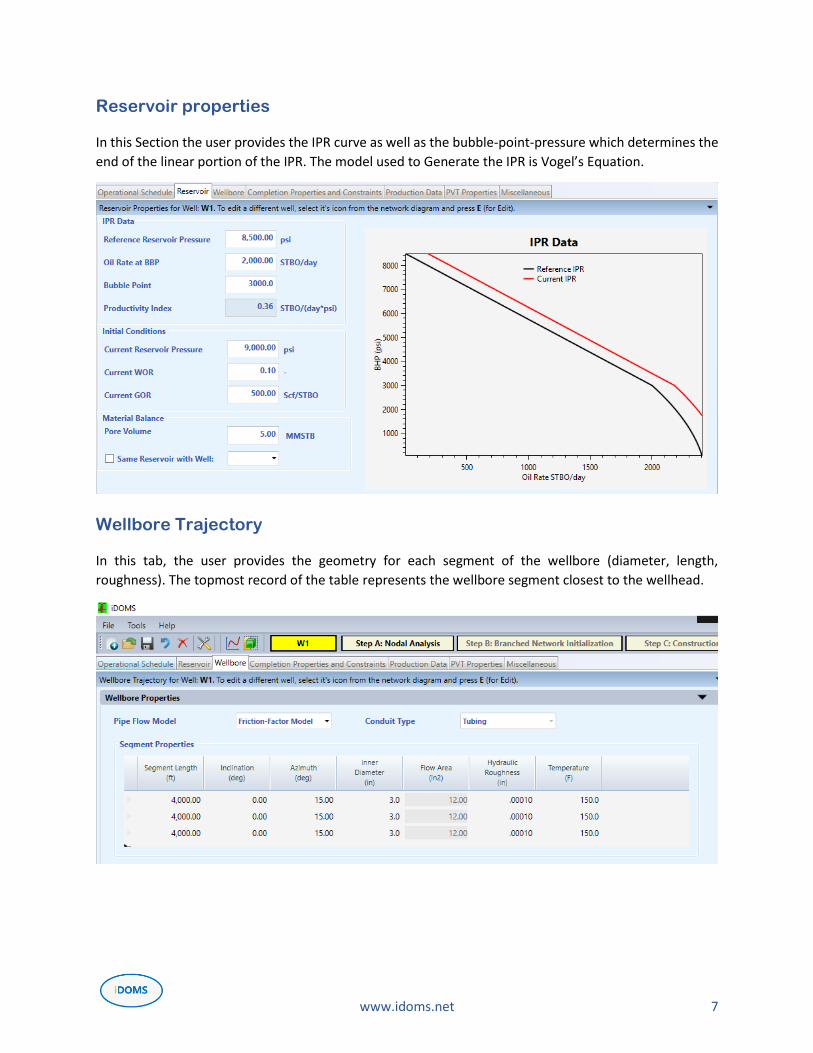
Reservoir properties
In this Section the user provides the IPR curve as well as the bubble-point-pressure which determines the
end of the linear portion of the IPR. The model used to Generate the IPR is Vogel’s Equation.
Wellbore Trajectory
In this tab, the user provides the geometry for each segment of the wellbore (diameter, length,
roughness). The topmost record of the table represents the wellbore segment closest to the wellhead.
www.idoms.net 8
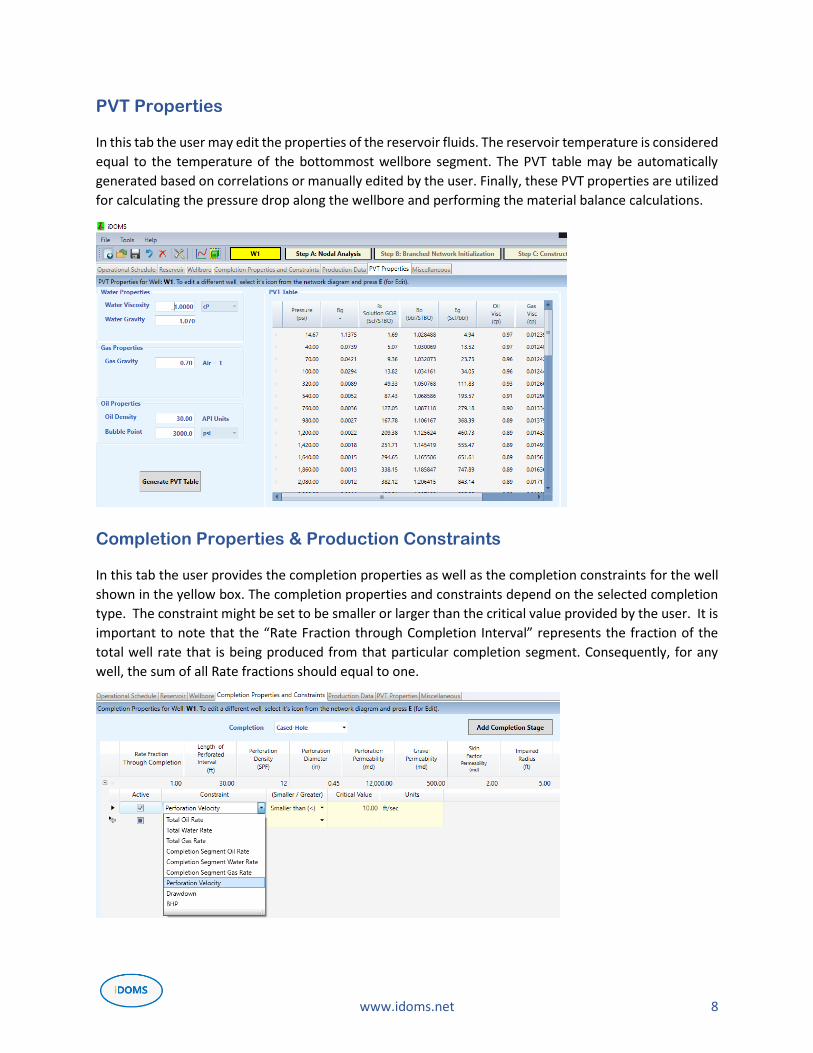
PVT Properties
In this tab the user may edit the properties of the reservoir fluids. The reservoir temperature is considered
equal to the temperature of the bottommost wellbore segment. The PVT table may be automatically
generated based on correlations or manually edited by the user. Finally, these PVT properties are utilized
for calculating the pressure drop along the wellbore and performing the material balance calculations.
Completion Properties & Production Constraints
In this tab the user provides the completion properties as well as the completion constraints for the well
shown in the yellow box. The completion properties and constraints depend on the selected completion
type. The constraint might be set to be smaller or larger than the critical value provided by the user. It is
important to note that the “Rate Fraction through Completion Interval” represents the fraction of the
total well rate that is being produced from that particular completion segment. Consequently, for any
well, the sum of all Rate fractions should equal to one.
www.idoms.net 9
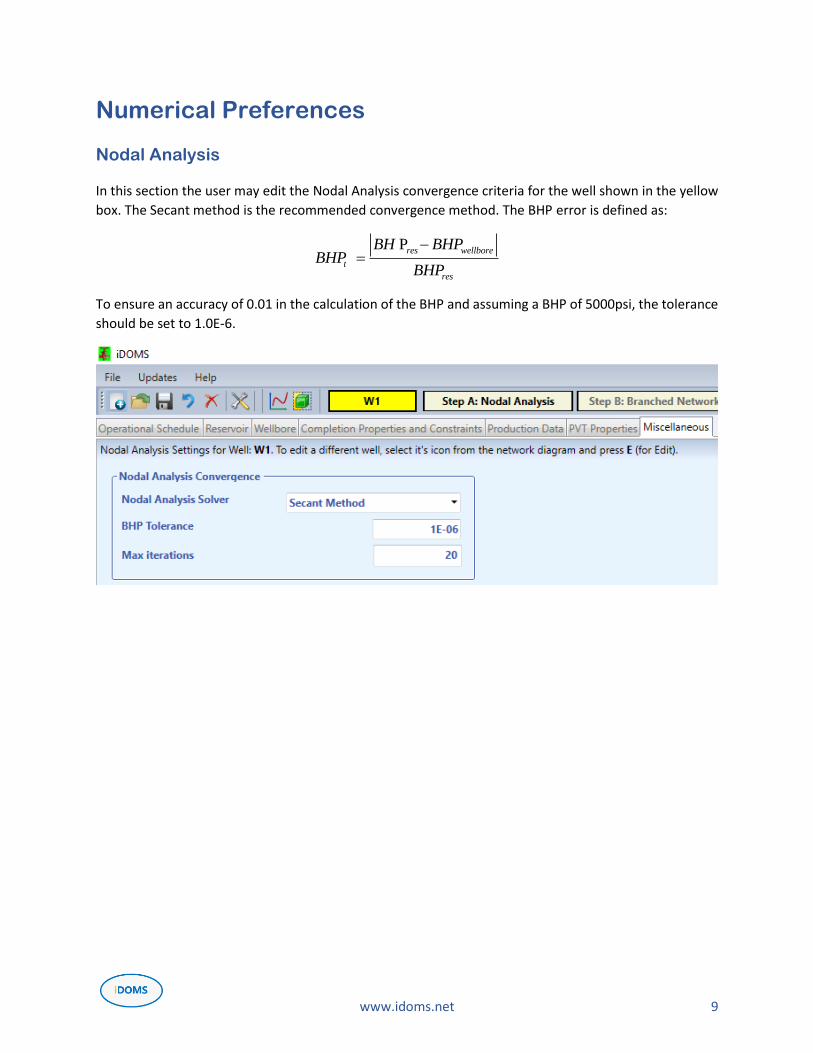
Numerical Preferences
Nodal Analysis
In this section the user may edit the Nodal Analysis convergence criteria for the well shown in the yellow
box. The Secant method is the recommended convergence method. The BHP error is defined as:
Pres wellbore
t
res
BH BHPBHP
BHP
To ensure an accuracy of 0.01 in the calculation of the BHP and assuming a BHP of 5000psi, the tolerance
should be set to 1.0E-6.
www.idoms.net 10
Simulation Steps
Step A: Nodal Analysis
In this Step, iDOMS performs the nodal analysis for all well in the field. If for the given well, flow is not
possible, iDOMS will display a message to the user. In this case the user will have to change the control
mode from “Choke” to “ESP”, relax the completion constraints or change the reservoir or wellbore
properties.
Step B: Instantiation of the Branched Network
In this Step iDOMS will couple the wells with the surface network using the smallest compatible choke
sizes or ESP frequencies. iDOMS will calculate the surface pressures as well as the oil, water and gas
production for each well.
If Convergence is not achieved, the user may alter the initial guesses by manually changing the value of
the surface pressures (values under flashing well names) and/or the pipeline fluid velocities by selecting
a pipeline and pressing E (for “Edit”).
Step C: Construction of Loops
In this step the user may construct loops, if any.
To add a loop to the network, the user should follow the following procedure:
a) Add one or more pipelines that close a loop
b) Set the gas saturation of this pipelines equal to the saturation of adjacent pipelines. (You may
set these values by selecting a pipeline and then pressing E);
c) Set the liquid and gas velocities (U1vel and U2vel) equal to the velocities of the adjacent
pipelines
d) Click on “Step C: Construction of Loops”
e) If Convergence is achieved procced with the next loop or process with iDOMS Optimization /
Simulation
www.idoms.net 11
iDOMS Simulation
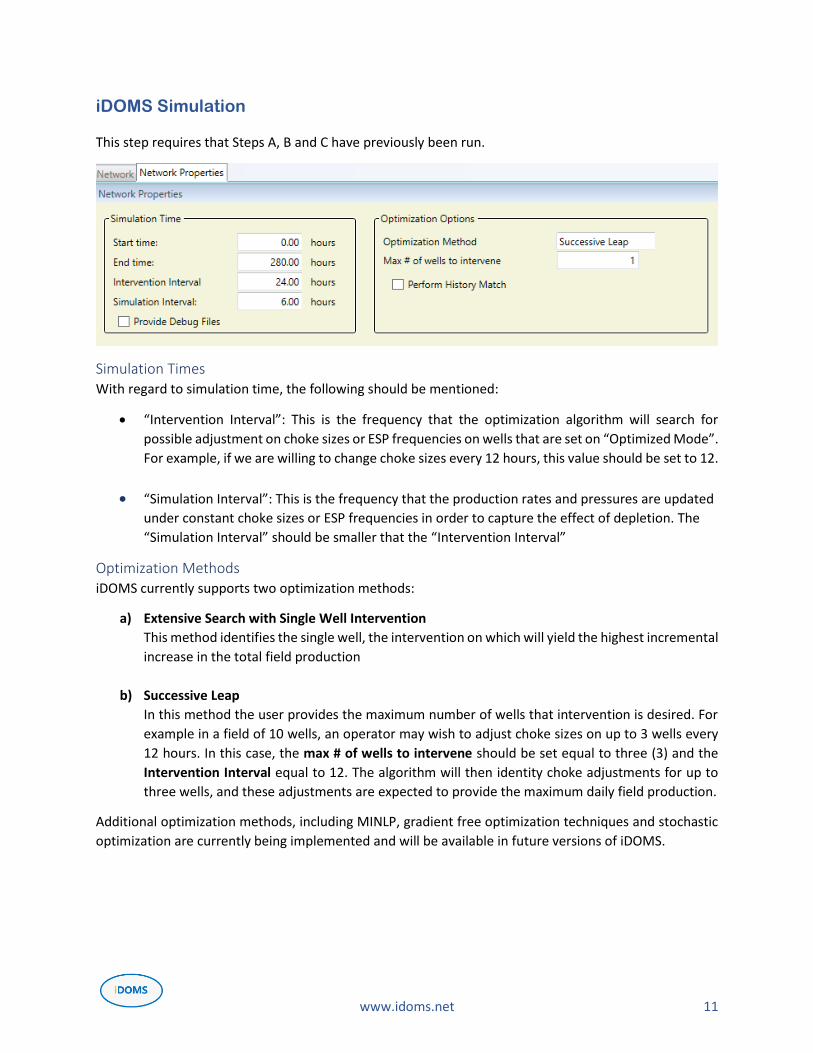
This step requires that Steps A, B and C have previously been run.
Simulation Times With regard to simulation time, the following should be mentioned:
• “Intervention Interval”: This is the frequency that the optimization algorithm will search for
possible adjustment on choke sizes or ESP frequencies on wells that are set on “Optimized Mode”.
For example, if we are willing to change choke sizes every 12 hours, this value should be set to 12.
• “Simulation Interval”: This is the frequency that the production rates and pressures are updated
under constant choke sizes or ESP frequencies in order to capture the effect of depletion. The
“Simulation Interval” should be smaller that the “Intervention Interval”
Optimization Methods iDOMS currently supports two optimization methods:
a) Extensive Search with Single Well Intervention
This method identifies the single well, the intervention on which will yield the highest incremental
increase in the total field production
b) Successive Leap
In this method the user provides the maximum number of wells that intervention is desired. For
example in a field of 10 wells, an operator may wish to adjust choke sizes on up to 3 wells every
12 hours. In this case, the max # of wells to intervene should be set equal to three (3) and the
Intervention Interval equal to 12. The algorithm will then identity choke adjustments for up to
three wells, and these adjustments are expected to provide the maximum daily field production.
Additional optimization methods, including MINLP, gradient free optimization techniques and stochastic
optimization are currently being implemented and will be available in future versions of iDOMS.
www.idoms.net 12
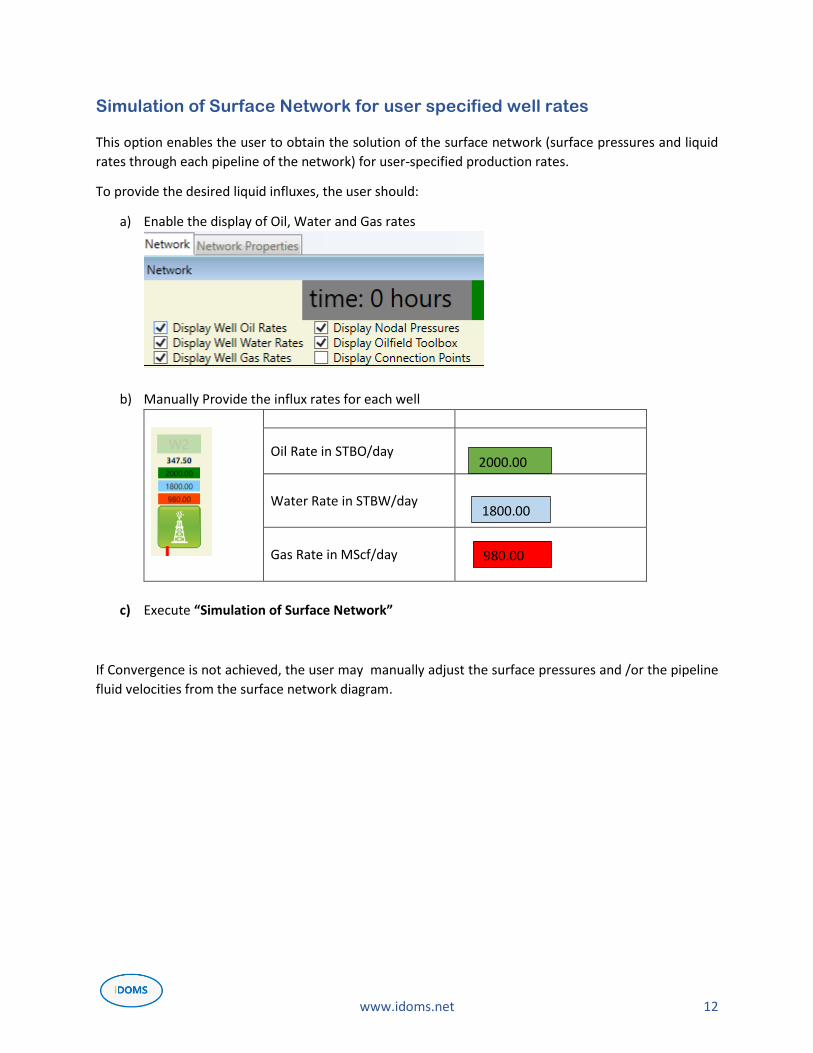
Simulation of Surface Network for user specified well rates
This option enables the user to obtain the solution of the surface network (surface pressures and liquid
rates through each pipeline of the network) for user-specified production rates.
To provide the desired liquid influxes, the user should:
a) Enable the display of Oil, Water and Gas rates
b) Manually Provide the influx rates for each well
Oil Rate in STBO/day
Water Rate in STBW/day
Gas Rate in MScf/day
c) Execute “Simulation of Surface Network”
If Convergence is not achieved, the user may manually adjust the surface pressures and /or the pipeline
fluid velocities from the surface network diagram.
1800.00
.00.00
2000.00
980.00
.00.00
www.idoms.net 13
Output
Field Results
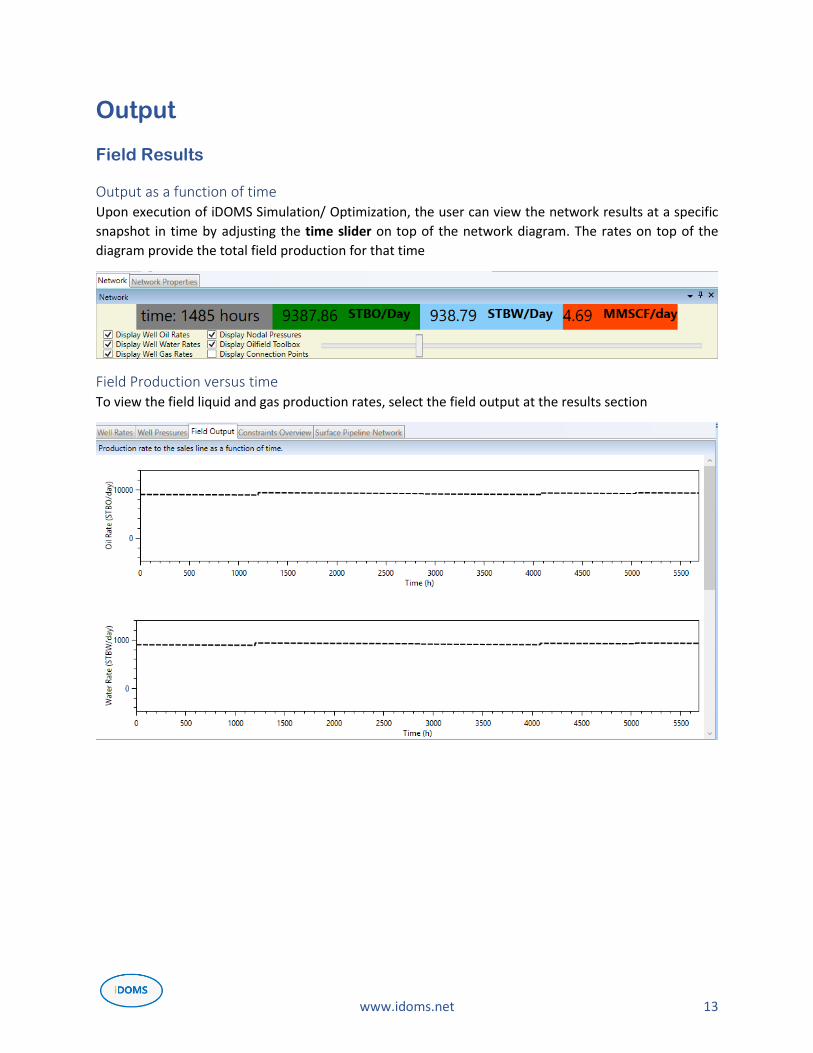
Output as a function of time Upon execution of iDOMS Simulation/ Optimization, the user can view the network results at a specific
snapshot in time by adjusting the time slider on top of the network diagram. The rates on top of the
diagram provide the total field production for that time
Field Production versus time To view the field liquid and gas production rates, select the field output at the results section
www.idoms.net 14
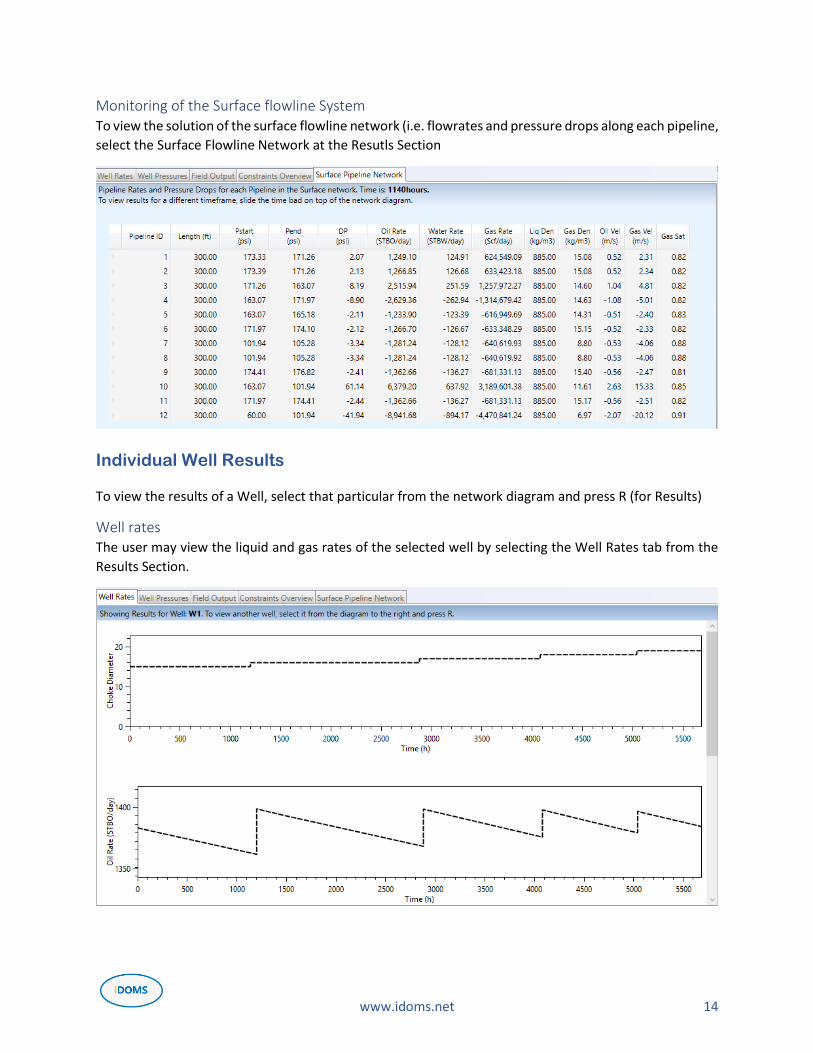
Monitoring of the Surface flowline System To view the solution of the surface flowline network (i.e. flowrates and pressure drops along each pipeline,
select the Surface Flowline Network at the Resutls Section
Individual Well Results
To view the results of a Well, select that particular from the network diagram and press R (for Results)
Well rates The user may view the liquid and gas rates of the selected well by selecting the Well Rates tab from the
Results Section.
www.idoms.net 15
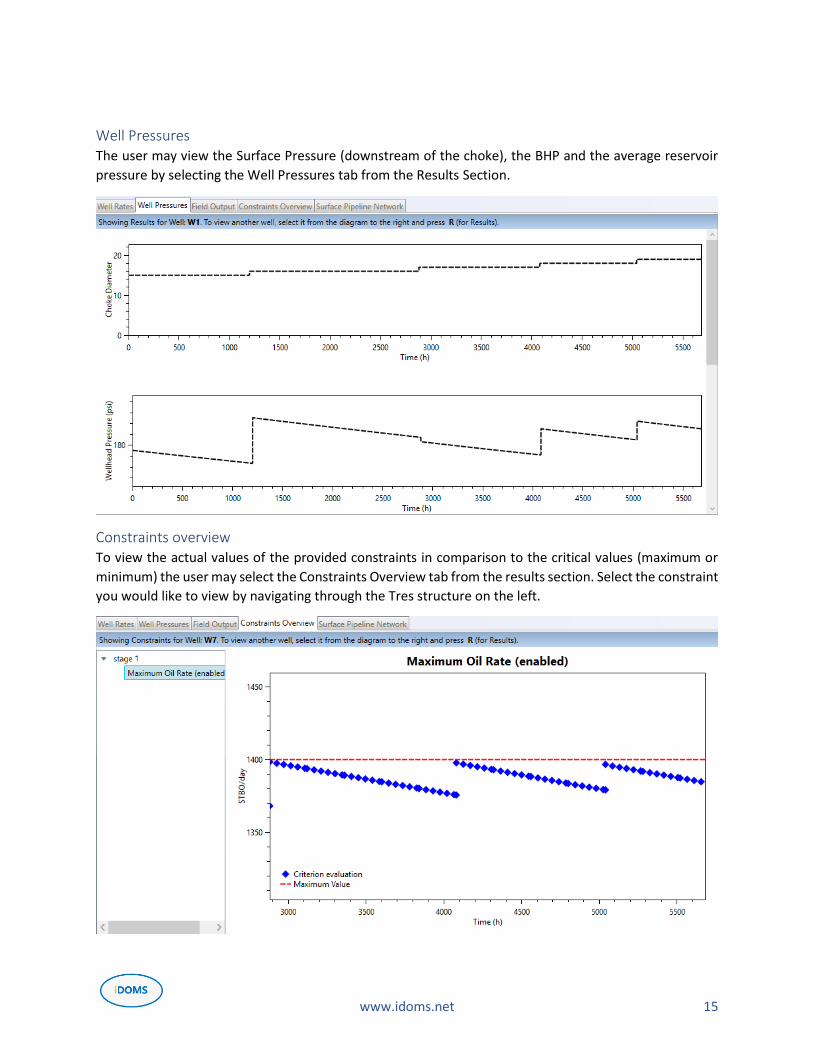
Well Pressures The user may view the Surface Pressure (downstream of the choke), the BHP and the average reservoir
pressure by selecting the Well Pressures tab from the Results Section.
Constraints overview To view the actual values of the provided constraints in comparison to the critical values (maximum or
minimum) the user may select the Constraints Overview tab from the results section. Select the constraint
you would like to view by navigating through the Tres structure on the left.
Top Related