


Languages
Pages
Legal


Integration of Renewable Sources into Hybrid Renewable Energy Systems
Contribution on Spreading Renewables in Low Voltage Grids
José Eduardo Monney de Sá Paiva
Dissertation submitted to the Faculty of Engineering of University of Porto in partial fulfilment of the requirements for the degree of
Doctor of Philosophy
Dissertation Supervisor: Professor Adriano da Silva Carvalho Associated Professor at the Department of Electrical and Computer Engineering
Faculty of Engineering, University of Porto
December, 2011

The author wishes to express his thanks to:
- Instituto Politécnico de Viseu (IPV) that supported his work through the
PROFAD scholarship.
- Escola Superior de Tecnologia de Viseu and Departamento de Engenharia
Electrotécnica that provided the means for the development of the experimental
work.

Acknowledgments I would like to dedicate this thesis to my parents without whom I would not arrive here.
I want to express my gratitude to my supervisor, Professor Adriano Silva Carvalho, for
the support that he always demonstrated, the skills and the valuable guidance. The
working holidays will be a lasting memory.
I also want to thank Joana, João, Adriana and Sofia for their support during these years.
For them, that endured the absence without complaint, my gratitude.
I would like to thank the rest of my family, and in particular to João Luís, my guru, for
the support they have given to me.
I would also like to thank all the anonymous people that somehow also contributed to
this work. In particular the Director of de Department of the Electrotechnical
Engineering, António Ferreira for all the support he provided.

Abstract
This thesis presents the approach and research of the concept of a controlled power
unit based on renewable sources interconnected to an electric grid, able to transform its
input stochastic energy into an output deterministic one.
Former attempts to supply the electric networks with renewable sources have caused
several issues, namely power quality issues due to the direct transfer of the renewable
sources stochastic nature to the power injected into the grids. This work proposes a
system with two renewable sources (sun and wind) that is able to present to its user an
energy that is free of that stochastic nature. To achieve this goal a storage element and
energy control strategies are used which allows regulating the power from the
renewable sources, presenting therefore a controlled and controllable power at its
output. Moreover it allows the raise of its economic value not only because it maintains
continuously the renewable sources in their maximum power but also because of the
capability of using the energy in more profitable periods as well as through the
attribution of control services to grids operators.
This type of controlled system is well suited to new grid concepts and architectures,
droved by the growing electricity consumption along with the decrease of the global
economic resources and also by the actual concerns about energy dependence and
environmental impacts. These new architectures require new capabilities from their
energy suppliers, namely the knowledge of their operational conditions and the
capability to control their power/energy in view of a better grid management for a better
quality of energy.
An experimental platform is built to validate the approach proposed. Using real
meteorological conditions the platform is used along with the proposed management
strategies to validate the concept of a controlled power source.
The obtained results are satisfactory and allow supporting the spreading of
renewable based energy sources interconnected to the grid. Although with a reduced
scale the obtained results can be extrapolated for larger systems.

Resumo
Esta tese apresenta a abordagem e pesquisa do conceito de uma unidade com
potência controlada, baseada em energies renováveis e interligada à rede eléctrica
pública, capaz de transformar a estocasticidade da energia primária numa energia
deterministica.
As anteriores ligações de unidades de produção, baseadas em energias renováveis, à
rede eléctrica resultaram numa série de problemas, designadamente ligadas à qualidade
da energia devido à transferência directa da característica estocástica daquelas para a
potência injectada na rede. Esta tese propõe um sistema com duas fontes de energia
renovável (photovoltaico e vento) que é capaz de apresentar aos seus utilizadores uma
energia livre daquela característica estocástica. Recorrendo à utilização de um elemento
de armazenamento e a estratégias de controlo adequadas, apresenta, ao utilizador, uma
energia controlada e controlável. Adicionalmente, permite aumentar a sua valia
económica dado manter contínuamente as fontes na sua potência máxima, ter
possibilidade de transferir energia captada para períodos tarifários mais rentáveis e
oferecer a possibilidade de atribuír o controlo de serviços a um operador de rede.
O conceito de gerador controlado adequa-se bem aos novos conceitos e
arquitecturas de rede que estão a emergir, impulsionadas pela crescente procura de
electricidade a par com a diminuíção dos recursos económicos mundiais bem como pelo
incremento das preocupações políticas de independência energética e das preocupações
com o meio ambiente. Estas novas arquitecturas requerem novas capacidades por parte
dos seus fornecedores de energia, designadamente da informação acerca do seu estado
operacional e da capacidade de os controlarem em termos de potência/energia, com
vista a melhorar a gestão da rede para uma melhor qualidade de energia.
Foi desenvolvida uma plataforma experimental para validação da abordagem
proposta. Utilizando condições reais de exploração, a plataforma experimental foi
utilizada para testes com as estratégias de gestão energética desenvolvidas de forma a
validar o conceito de uma unidade controlada de energia baseada em fontes renováveis.
Os resultados obtidos permitem apoiar a disseminação de fontes de energia baseadas
em energias renováveis ligadas à rede eléctrica. Embora a uma escala reduzida, os
resultados obtidos podem ser extrapolados para sistemas de maior potência.

i
Table of Contents Chap. I Context of renewable generation and new paradigms 1
1 - Decentralized generation 3 1.1 - Network impact of DG connection 5
1.1.1 - An economic and marketing view 8 1.2 - New grid architectures 11
2 - Renewable energies issues 15 2.1 - Hybridization 21 2.2 - Storage 21
3 - Objectives of the thesis 26 4 - Contributions 28 5 - Thesis layout 29 References 30
Chap. II DG energy system architectures and grid interconnection 33 1 - DG grid connection 35 2 - DG systems architectures 35
2.1 - Hybrid DG 38 2.2 - Energy storage 39
2.2.1 - Storage technologies 40 2.2.2 - Batteries 41
2.3 - DC bus based architectures 42 2.4 - New grid architectures 45
2.4.1 - Microgrid 45 2.4.2 - Technical challenges 48
3 - Conclusions 48 References 49
Chap. III Renewable sources integration 53 1 - Hybrid system elements modeling 54
1.1 - Wind source 54 1.1.1 - Wind turbine 55 1.1.2 - Electrical generator 56 1.1.3 - Rectifier 58 1.1.4 - DC-DC converter 59
1.2 - Photovoltaic source 59 1.2.1 - Photovoltaic generator 59 1.2.2 - DC-DC converter 64
1.3 - Grid connection 64 1.3.1 - Inverter 65 1.3.2 - Filter 67
1.4 - DC bus 67 1.5 - Storage system 67 1.6 - DC-DC converters 69
2 - Control characteristics 71 2.1 - Individual control of operating point for each source 71
2.1.1 - Maximum power extraction 71 2.1.1.1 - Wind generation 72 2.1.1.2 - Sun generation 74
2.1.2 - DC bus power regulation 76 2.2 - Global supervisor 77
3 - Simulation assessment of the HRES operation 79 3.1 - Simulink models 80
3.1.1 - Wind generator 80 3.1.2 - Photovoltaic generator 82 3.1.3 - Storage system 83 3.1.4 - DC bus 84 3.1.5 - DC-DC converters 85
3.2 - Analysis of computational results 85

ii
3.2.1 - MePPT 85 3.2.2 - DC-DC converters 87 3.2.3 - Hybrid system model test results 88
4 - Conclusions 90 References 92
Chap. IV HRES availability for scheduling 93 1 - Context 93 2 - Added value of determinism 94
2.1 - Technical value 94 2.2 - Economic value 95
3 - System behaviour under different dispatch rules 98 3.1 - Intraday market energy selling 98
3.1.1 - Available energy forecasting 99 3.1.2 - Scheduling 100 3.1.3 - Results and analysis 100
3.2 - Peak hours energy consumption reduction 103 3.2.1 - Results and analysis 104
3.3 - Peak hours energy consumption reduction with constant power 105 3.3.1 - Results 105
3.4 - Unscheduled grid requests 106 3.4.1 - Results and analysis 107
4 - Results analysis 108 5 - Conclusions 110 References 111
Chap. V – Experimental platform 113 1 - Experimental platform description 114 2 - Dynamic and control characteristics 118
2.1 - DC-DC converters 118 2.2 - DC bus voltage control 122 2.3 - Generated power control 125
3 - Validation of the system operation 132 References 140
Chap. VI System performance 141 1 - Pre-programmed stepped load 142 2 - Unscheduled power requests 150 3 - Conclusions 152 References 151
Chap. VII Conclusions 155 Anex1 161

iii
List of Figures Chapter I Fig. 1 - Electricity consumption and primary energy sources 1 Fig. 2 – Electricity demand trend – European Environment Agency, 2002 1 Fig. 3 - Types and technologies for distributed generation 4 Fig. 4 – Communication and investment ROI 7 Fig. 5 – Economics of DSO 10 Fig. 6 – Microgrid example 13 Fig. 7 – VPP example 13 Fig. 8 – Smart grid concept (Inovgrid) and technologies and solutions perspective 14 Fig. 9 - Basic smart grid ingredients 14 Fig. 10 – Smart grid pyramid 14 Fig. 11 - Levelized cost of electricity forecast for renewable energy technologies 16 Fig. 12 - System Impacts of Wind Power 16 Fig. 13 - Wind profile example for one week (local data) 17 Fig. 14 - Radiation profile example for six days 17 Fig. 15 – Combined wind-photovoltaic uncontrolled generation power example 19 Fig. 16 - Yearly system autonomy versus system cost for single photovoltaic, single wind and hybrid photovoltaic-wind system 19 Fig. 17 - Normalized spot market prices and electricity demand minus wind production 20 Fig. 18 – Main energy backup systems 23 Fig. 19 – Storage capital cost 24 Fig. 20 – Efficiency and cycle life of storage technologies 24 Fig. 21 – Synopsis of the key points outlined in Chapter I 26 Fig. 22 – Current and future electric systems 26 Fig. 23 – Generation unit (GU) global strategy 27 Fig. 24 – Small systems (GU) aggregation 28 Chapter II Fig. 1 - DG interconnection historical overview 34 Fig. 2 - Single source wind architectures for grid connection 37 Fig. 3 - Single source PV architectures for grid connection 37 Fig. 4 – Coupling structures 38 Fig. 5 – Hybrid system elements interconnection 39 Fig. 6 – Supply-demand control 40 Fig. 7 - DG generic hybrid main subsystems 45 Fig. 8 – Microgrid example 46 Fig. 9 – Microgrid EU concept 47 Fig. 10 – CERTS microgrid concept 47 Chapter III Fig. 25 - Hybrid system architecture 53 Fig. 26 – Uncontrolled wind and sun power injection 54 Fig. 27 – HRES controlled wind and sun power injection 54 Fig. 28 - Wind generator components 54 Fig. 29 - Turbine power variation with wind speed 56 Fig. 30 - Three-phase uncontrolled rectifier 58 Fig. 31 - booster DC-DC converter 59 Fig. 32 - Photovoltaic generator subsystem components 60 Fig. 33 - Photovoltaic model 61 Fig. 34 - P/V and I/V photovoltaic characteristic curves 61 Fig. 35 - P/V curves in function of temperature and radiation variations 62 Fig. 36 - Effect on photovoltaic equivalent load in function of converter duty change 64 Fig. 37 - Grid connection through inverter and filter 64 Fig. 38 - Three phase inverter 65 Fig. 39 - Battery model 68 Fig. 40 - Booster and buck DC-DC converters 70

iv
Fig. 41 – Different time responses for mechanical and electrical parts 73 Fig. 42 – MePPT for the wind generator 73 Fig. 43 – MPPT and the change in power and voltage 74 Fig. 44 - Fuzzy rules for MePPT 74 Fig. 45 - Locus of maximum power points for changing radiation 75 Fig. 46 - Global control 78 Fig. 47 - Flow chart of the global controller 79 Fig. 48 - Wind generator Simulink model 80 Fig. 49 - Turbine, generator and rectifier Simulink model 80 Fig. 50 - Aerodynamics Simulink model 81 Fig. 51 - Coefficient power (Cp) versus tip speed ration (λ) 81 Fig. 52 - Simulink first and second power coefficient polynomials 82 Fig. 53 - Generator power versus wind speed for Bergey XL.1 82 Fig. 54 - PV generator, Fuzzy controller and DC-DC converter Simulink model 83 Fig. 55 - Photovoltaic array Simulink model 83 Fig. 56 - PV Fuzzy logic control Simulink model 83 Fig. 57 - Lead-acid battery Simulink model 84 Fig. 58 - Voltage to current interconnecting model 84 Fig. 59 - booster converter Simulink model 85 Fig. 60 - Buck converter Simulink model 85 Fig. 61 - MePPT in wind generator startup 86 Fig. 62 – MePPT in normal operation with wind speed step changes 86 Fig. 63 - Comparison between average model and SimPowerSystems for booster DC-DC converter 87 Fig. 64 – Overal simulation system 88 Fig. 65 - wind speed serie 89 Fig. 66 - sun radiation serie 89 Fig. 67 – Programmed deliverable power 89 Fig. 68 - Delivered power 89 Chapter IV Fig. 69 - Costs and reliability involved with DG 95 Fig. 70 – Intraday market energy scheduling 99 Fig. 71 – Wind speed profile 101 Fig. 72 – Radiation profile 101 Fig. 73 - Delivered versus scheduled energy for 9 days 102 Fig. 74 - Delivered (grey areas) energy and wasted (black areas) renewable energy 102 Fig. 75 - SOC variation of battery bank during the 9 days 102 Fig. 76 - Load power profile and avoided grid energy for a winter day with wind (case 1) 104 Fig. 77 - SOC of the storage system 104 Fig. 78 - Peak load energy profile, grid purchased peak power and avoided grid peak energy for 9 winter days with variable wind 106 Fig. 79 - SOC of the storage system for the nine days 106 Fig. 80 - Load profile, purchased grid peak energy and avoided peak energy for one day 106 Fig. 81 – Assynchronous grid demands profile 107 Fig. 82 - Power profile for peak hours energy selling and services 107 Fig. 83 – Storage SOC 108 Fig. 84 - Energy profiles for grid energy requests, sold peak hours energy and gathered renewable energy for one day 108 Chapter V Fig. 85 - Layout of the system with data collection points 113 Fig. 86 – Control and interface units of the hybrid system 116 Fig. 87 – Hybrid system Labview interface 117 Fig. 88 - Overview of the four DC-DC converters 118 Fig. 89 – Labview currents – load, battery charge, discharge and photovoltaic display 119 Fig. 90 – Battery charge voltage without and with LCL filter (Labview display) 119 Fig. 91 – Bode plot of the converter and filter used in the PV booster (light load) 120 Fig. 92 - Bode plot of the converter and filter used in the PV booster 120 Fig. 93 – Wind and sun generation with no load 121

v
Fig.94 – Wind and sun generation power lower than loading 121 Fig.95 – Wind and sun generation slightly higher than loading 122 Fig.96 – Wind and sun generation lower than loading 122 Fig. 97 - DC bus voltage in steady operation (no load change) 124 Fig. 98 – DC bus voltage behavior to a load change from 0Wto 300W without renewable generation contribution 124 Fig. 99 – One hour display of DC bus voltage and currents from PV to battery 125 Fig. 100 – One hour display of DC bus voltage and current from the wind and PV to battery 125 Fig. 101 – Generators Fuzzy power control decentralization 126 Fig. 102 – Wind generator location (perspective erroneous shows wind generator higher than trees) 127 Fig. 103 – Local wind dynamics 127 Fig. 104 – Local wind dynamics (several hours) 127 Fig. 105 – Fuzzy MPPT controller 128 Fig. 106 – PV power curve and fuzzy inputs 128 Fig.107 – Fuzzy rule base 128 Fig. 108 – Fuzzy MPPT operation 129 Fig. 109 – Power vs Voltage characteristic curves for each of the three PV panels used – displays taken with Labview interface for consecutive duty cycle variation from 0 through 0.85 130 Fig. 110 - Power vs Voltage characteristic curve for the three parallel connected PV panels used 130 Fig. 111 – Power versus Voltage curves shapes for PV and wind generator 130 Fig. 112 – Experiment results with DC MPPT 131 Fig. 113 – Primary and secondary bus voltages with PV generation 132 Fig. 114 – Secondary bus voltage and PV PWM switching signal 132 Fig. 115 – Switch turn-on/off effect on the bus voltage 133 Fig. 116 – Turn-on/off effect on the bus voltage and PV current 133 Fig. 117 – Turn-off effect on the voltage and current from the PV (both quantities taken from the PV side of the converter) 134 Fig. 118 – Currents from the PV array – PV side and bus side 134 Fig. 119 – Switch commutation effect on null load current and bus voltage 135 Fig. 120 – Switching effects on load current and bus voltage 135 Fig. 121 – System with 50 W load, without renewable generation and storage operating to deliver the power to the load through the DC bus 135 Fig. 122 – System with 115 W load, without renewable generation and storage operating to deliver the power to the load through the DC bus 136 Fig. 123 – System with 173 W load, without renewable generation and storage operating to deliver the power to the load through the DC bus 136 Fig. 124 – System with reduced renewable generation (PV and wind) supplying a 50 W load. Bus voltage, load current, wind current and PV current 137 Fig.125 – System with PV and wind production supplying a load with 50 W (1.1 A). Bus voltage, load current, wind current and PV current 137 Fig. 126 – System with PV reduced production and wind supplying a 50 W load. Bus voltage, load current, wind current and PV current 137 Fig. 127 – Long term behaviour of the system with timed constant loading and renewable generation 138 Fig. 128 – Long term behavior of the system with step loading and renewable generation 138 Chapter VI Fig. 129 – Commutation spikes and the large ripple resultant of time compression and detail for a narrower time frame 142 Fig. 130 - Pre-programmed and delivered load 143 Fig. 131 - One day with preprogrammed load of 50W from 8:00 to 9:30, 10:30 to 18:00 and 19:00 to 22:00 and 160W from 9:30 to 10:30 and from 18:00 to 19:00 with varying sun and wind current generation. Battery current compensation with charge and discharge, battery state of charge and DC bus voltage are also diplayed 144 Fig. 132 – Windless, photovoltaic and battery currents for the time frame related with the load supply 144 Fig. 133 – Details of an increase in step load with battery charge to discharge changing in function of photovoltaic generation. DC bus voltage and SOC of the battery also shown 145

vi
Fig. 134 – Detail of the average and spikes values. Bus voltage, charge, discharge and photovoltaic generation for a load step increase 146 Fig. 135 – Detail of a decrease step load with change of the battery discharge to charge. Photovoltaic generation and bus voltage also displayed 146 Fig. 136 – Detail of the average and spikes values. Bus voltage, charge, discharge and photovoltaic generation for a load step decrease 146 Fig. 137 – On day charging only to store enough energy for next day pre-programmed load 147 Fig. 138 – One day with wind and cloudy sun 148 Fig. 139 – Wind, sun and battery waveforms 148 Fig. 140 – Step loading used in the test 149 Fig. 141 – Loadless system with highly variable and relatively strong wind and photovoltaic power 149 Fig. 142 - System with variable wind and sun as well as step loading for a 45 minutes period 149 Fig. 143 – System extemporaneous load requests (black) constant in 15 minutes interval and delivered load current 150 Fig. 144 – System behavior overview with extemporaneous external power requests for 15 minutes time frames. Wind and sun generation, battery SOC, charge and discharge, load and Dc bus voltage 151 Fig. 145 - Wind and sun generation and battery charge and discharge currents 151 Fig. 146 – Details of the various quantities variations during 40 minutes 152

vii
List of Tables Chapter I Table 1 – Possible applications and services provided by DG 9 Table 2 – Costs and benefits for the electricity system induced by DG 11 Table 3 - Payback time and emissions for various energy technologies 21 Table 4 – Applications and duration of storage technologies 22 Table 5 – Advantages and disadvantages of storage technologies 24 Chapter II Table 6 - Characteristics comparison of Li-ion and Pb batteries 42 Chapter III Table 1 – PV fuzzy rules 76 Chapter IV Table 2 - Analysis of the behaviour of the system for 9 days 102 Table 3 – DG investment payback period for energy different prices 103 Table 4 - Saved energy and costs and Payback period (PBP) for the investment in the HRES 105 Table 5 - Avoided peak energy and energy costs and Payback period (PBP) for the investment in the HRES 106 Chapter V Table 6 – Hybrid power elements characteristics 118
1
Chap. I – Context of renewable generation and new paradigms
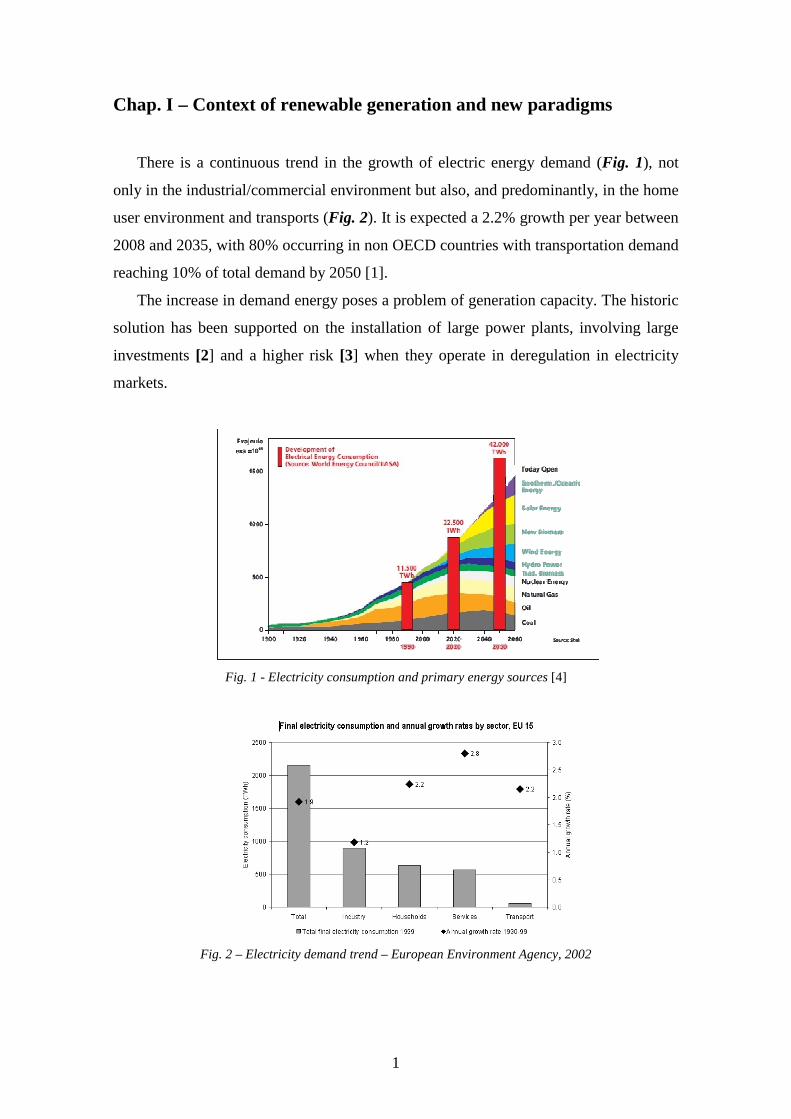
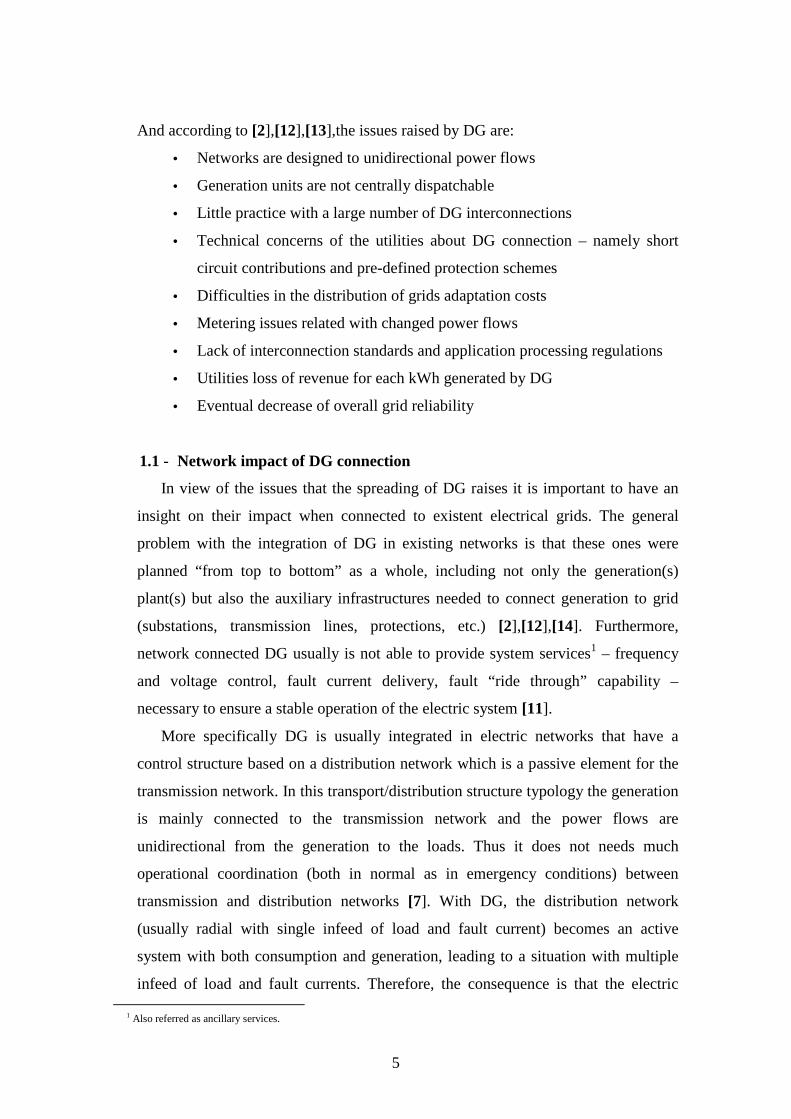
There is a continuous trend in the growth of electric energy demand (Fig. 1), not
only in the industrial/commercial environment but also, and predominantly, in the home
user environment and transports (Fig. 2). It is expected a 2.2% growth per year between
2008 and 2035, with 80% occurring in non OECD countries with transportation demand
reaching 10% of total demand by 2050 [1].
The increase in demand energy poses a problem of generation capacity. The historic
solution has been supported on the installation of large power plants, involving large
investments [2] and a higher risk [3] when they operate in deregulation in electricity
markets.
Fig. 1 - Electricity consumption and primary energy sources [4]
Fig. 2 – Electricity demand trend – European Environment Agency, 2002

2
Power generation and transmission facilities have found troubles meeting new
energy demands. Transmission load is projected to grow in the next ten years by 22–
25% but the grid however is expected to grow less than 4%, as a result of economic,
environmental, technical, and governmental regulation constraints [5][6].
Additionally, there are a certain number of issues that participants in the domain
have to consider, as:
Growing environmental concerns, namely with greenhouse gases (CO2
emissions associated with hydrocarbons).
Attempt to achieve energetic independence from third party countries in
order to reduce the primary fuel price and supply variations.
Development of new economic and financial rules that arise from the
deregulation of energetic markets.
These issues make the electrical environment more difficult to manage than in the
past.
They also contribute to a paradigms change. The five major factors that contribute to
changing views for electric systems as identified by International Energy Agency (IEA)
and are:
Developments in distributed generation technologies
Constraints on the construction of new transmission lines
Increase in the customer demand for highly reliable electricity
Liberalisation of the electricity market
Concerns about climate change
The solutions for these issues have been orientated towards the spread of
decentralized generation also referred as distributed generation (DG) and to the
development of new electrical system structures.
DG based on renewable sources of energy are particularly well positioned to address
actual concerns such as: environmental - they do not produce wastes in the conversion
process, economic - the primary energy is costless and political - the sources are
available anywhere.
An historical perspective [7] provides an understanding framework for those points:
To understand the structure and use of current electricity supply systems and to lean about possibilities and the barriers to changing these systems Verbong and Van der

3
Vleuten (2002) analysed in Work Package 1 the historic dynamics of long-term electricity supply systems. They observe that, in a long-term historical perspective, the current concern or critical problem for creating a level playing field for distributed and centralised generation is remarkable. This concern seems completely opposite to the dominant critical problem in the 1950s and 1960s, which was to reduce the contribution of distributed generation to public electricity supply as much as possible, in order to achieve advantages of scale. It is no surprise therefore, that current systems have an intrinsic bias towards centralised generation. Arguments for large scale power generation during the era of scale increase and expansion were economies of scale, construction of (coal) power plants located near mining sites and integrated with hydro, investment savings on back-up units and avoiding over-capacity. Later on in many countries the introduction of nuclear power plants lead also to centralised generation. Due to the increasing availability of natural gas in many countries, environmental concerns and technological development (such as; availability of competitive smaller generators) scale increase and siting of power generation locations became of lesser importance. As a result, in the 1970s and 1980s electricity systems in some countries started to develop from central systems in the direction of hybrid systems hosting centralised as well as decentralised generation units in one and the same system. The possibilities (barriers, opportunities) for DG in the current socio-technical electricity supply systems are conditioned by characteristics of the system developed in the era of centralisation and how actors since the 1970s have been dealing with these.
1 - Decentralized generation
Decentralized generation (Europe and Asia), also known as embedded generation
(South America), dispersed generation (North America), on-site generation, and
distributed generation, has not yet a formal accepted definition. It can, however, be
defined as the use of small-scale power generation technologies located close to the load
being served [8]. Also in [8] it is argued that there is no consensus about the definition
and presents some organizing view points such as: purpose, location, rating, delivery
area, technology type, environment impact, mode of operation, ownership and
penetration level. It also proposes a general definition as “electric power generation
within distribution networks or on the customer side of the network”.
In general the definition of DG (CIGRE, CIRED, IEEE, IEA) encompasses three
main ideas [9]:
i) Small source of energy (sub-kW to a few MW)
ii) Interconnected anywhere in the distribution network (on the customer side
of the meter)
iii) Beyond the control of transmission operator.
A DG synopsis is presented in Fig. 3.

4
Fig. 3 - Types and technologies for distributed generation [10]
DG has been developed and supported mainly by public incentives – CERTS (USA)
and Microgrids (EU) are exemplificative supported development projects – but is still
not economically competitive when compared with traditional bulk power plants.
The development of the power electronics as well as the development of the
information and communication technologies (ICT) have been (and are expected to
continue) a leverage towards the solutions for some of the problems that decentralized
generation poses to the electrical grids when (inter)connected.
While the adoption of DG appears to face difficulties related to specificities of each
country, namely the characteristics of the existing centralised power system [7], it is
nevertheless expected to continue to grow. A DG share that could reach 30% in next
years, where a large amount of locally generated energy will also be consumed locally,
will give the distribution network a local character [11].
Taking in consideration expected penetration figures, an analysis of the benefits and
drawbacks that come from the spread of DG when connected to the electric network is
required. From [2] the benefits of DG use are:
• to allow a reasonable span of reduced power (less than a kW to few MW)
• to be located close to the loads – dispersion capability through the network
and losses reducing capability
• to be grid-connected or islanded operated
• to perform services
• to allow grid investments deferment
• to have reduced investment, lower installation time and little maintenance
• to allow the use of renewable generation
5
And according to [2],[12],[13],the issues raised by DG are:
• Networks are designed to unidirectional power flows
• Generation units are not centrally dispatchable
• Little practice with a large number of DG interconnections
• Technical concerns of the utilities about DG connection – namely short
circuit contributions and pre-defined protection schemes
• Difficulties in the distribution of grids adaptation costs
• Metering issues related with changed power flows
• Lack of interconnection standards and application processing regulations
• Utilities loss of revenue for each kWh generated by DG
• Eventual decrease of overall grid reliability
1.1 - Network impact of DG connection
In view of the issues that the spreading of DG raises it is important to have an
insight on their impact when connected to existent electrical grids. The general
problem with the integration of DG in existing networks is that these ones were
planned “from top to bottom” as a whole, including not only the generation(s)
plant(s) but also the auxiliary infrastructures needed to connect generation to grid
(substations, transmission lines, protections, etc.) [2],[12],[14]. Furthermore,
network connected DG usually is not able to provide system services1 – frequency
and voltage control, fault current delivery, fault “ride through” capability –
necessary to ensure a stable operation of the electric system [11].
More specifically DG is usually integrated in electric networks that have a
control structure based on a distribution network which is a passive element for the
transmission network. In this transport/distribution structure typology the generation
is mainly connected to the transmission network and the power flows are
unidirectional from the generation to the loads. Thus it does not needs much
operational coordination (both in normal as in emergency conditions) between
transmission and distribution networks [7]. With DG, the distribution network
(usually radial with single infeed of load and fault current) becomes an active
system with both consumption and generation, leading to a situation with multiple
infeed of load and fault currents. Therefore, the consequence is that the electric
1 Also referred as ancillary services.

6
system needs to become more flexible and to require a more integrated operation
perspective [15],[16] to be able to manage the new power generated. Therefore, DG
must offer dispatch capabilities and participate in frequency control. If this is
attainable, DG can be viewed as a set of controllable conventional generation units
that can actively reduce or increase power production in function of the network
necessities. It should be noticed that most DG are connected to the network through
power electronic interfaces that offer several possibilities to control the power
delivered. For instance, their lack of inertia that can allow fast responses as when
power system disturbances occur and synchronous generators are not always able to
respond rapidly enough to keep the system stable [5].
One of the potential benefits of DG connected to low voltage network is an
increase in service quality, reliability and security, proving that it will be integrated
in an intelligent way in power system planning practices [17]. But the full potential
of DG at distribution levels – taking over some of the responsibilities of the large
conventional plants as support to the electric system in critical conditions – is still
not requested [17]. Increased DG penetration is even desirable if they are allowed at
participating in the power balance (frequency control) [15].
In networks with connected DG, while the magnitude of the DG power is
smaller than the utility feeding substation, the system operation is not critically
dependent on the local generation. If this is not the case, DG is viewed by network
operators as a problem mainly due to significant impact of fault current and pre-
existing protection systems – possibly the major technical barrier for wide-scale
integration [18][19]. In that case and assuming a non dispatchable capability of DG
units (which is the majority case when they are renewable based) there exist a
double effect of a reduction of the number of dispatchable units that were
substituted by the non dispatchable DG along with the increasing demand in the
remaining units. But it can also be viewed as having a beneficial effect on the
customer security of supply if islanding is allowed [15]. Presently, however, the
operational strategy in use requires the immediate disconnection of DG units in
abnormal conditions.
Another potential benefit effect of DG would be to support and assist the
network in abnormal conditions like black-start situations [15] since the energy
availability stays in the DG and is not dependent on the connection to the transport
network. The tripping of DG units can no longer be the standard procedure for all

7
sorts of disturbances and they must instead be able to withstand larger variations in
voltage and frequency [15]. According to [20], future power systems generation
units must be able to:
- stay connected during grid failures
- supply short-circuit current
- be able to supply reactive power
- reduce real power with over-frequency
Fig. 4 – Communication and investment ROI (AMR: automated meter reading; AMI:
advanced metering infrastructure) [21]
The lack of information about the operating conditions of DG units results in a
certain level of uncertainty that complicates the electric system operational
management. In order to achieve a more flexible and active network operation, high
penetration of DG must be provided with communication capabilities. That will
allow system operators to have information on which units are on-line, what are
their outputs and what are their future capacities [15]. The existence of
communication between user and provider even has an impact on the profitability of
the investments as Fig. 4 suggest. Actual ICT development creates a capability of
universal connectivity between large varieties of network devices [17]. This allows
real-time interaction between suppliers, operators and customers thus supporting the
needed for grid flexibility, integration and controllability. The widespread of
Internet can easily and costless support the penetration of small scale DG based on
two-way communication that enables new services like automation, dynamic pricing
and real-time power selling.

8
The existing Ethernet wiring is commonly used for local area networks (LANs)
which are commonly available due to its popular adoption for Internet use in
residential applications. So, it is an existing platform that could leverage the use of
communication for the purposes mentioned here. However, this technology must be
connected to a wide-area-network technology such as ADSL or a cable television
system to increase communication speed if it is to be used in contexts more
demanding like the electrical control and management one. Furthermore, the
reliability of these networks is maintained only at a convenience level and, as such,
it would be inappropriate for the transmission of the electrical protective functions
this way [22].
Another trend is to inject intelligence into the network in view of the need for
decentralized coordination and control. Software agents and electronic markets [17]
are an attempt to achieve that goal.
The increase of DG interconnection can also lead to unforeseen issues. The
excess of production, specifically when based on uncontrolled renewable sources is
an example, as the cascaded problems faced by Danish electric system in 2007 that
culminated in the forced stand-still of 200 MW wind production for 10 h [16]. The
difficulties in planning and in load forecasting when DG masks load growth, the
unintentional islanding that can cause safety issues and uncertainty in power system
stability when major disturbances occur caused by the reduction of generation
power by central units, are another examples of the complexity of DG integration.
An overview of DG applications [23] which helps to frame the subject is
presented in Table 1.
1.1.1 - An economic and marketing view
Electrical generation faces not only technological issues but also other
problems not yet very familiar to them. One of them is the change from a
monopoly view to an open market view. The inclusion of the marketing
perspective is another change of paradigm that imposes a new behavioural.
As DG is located close to the loads less energy transport is needed which is
the inverse situation faced by the central generation. This can negatively affect
Distribution System Operators (DSO) business as it represents decreasing
revenues to them. As DSO usually acts in a monopoly environment protected by
regulations and DG suppliers in a market environment not restricted by

9
regulations, the development of new business frameworks would be favourable
to the exploitation of opportunities perceived for DG [17].
Table 1 – Possible applications and services provided by DG
From an economic point of view the use of DG poses some problems,
considering a deregulated market environment. In the first place, while the
overall investment in DG represents a smaller value, their unit cost (€/kWh) is
bigger as they do not profit of the scale factor [24]. Secondly, DG poses
problems of reliability which is an essential concern in liberalised markets as a
high reliability implies investment and maintenance costs [9].
But DG also represents a good marketing opportunity as it has the potential
to fill niches – customers that are looking for their best suited service – in
saturated markets where differentiation is a need. Moreover, markets are
inherently dynamic and DG is well suited to respond to this characteristic: it is
able to be assembled anywhere, with diversified sources, in a very short time,
operated immediately and separately, with a size that can be increased or
decreased and with the ability to track and follow the unavoidable market
fluctuations [13].

10
Until now, DG developers and operators are essentially concerned with
energy production from their units but, based on current generic incentives, not
motivated to provide services associated with system security [17]. Although the
opportunities created by the deregulation and market framing, DG is often
insufficiently rewarded, or even not rewarded at all, for their benefits to the
electricity system and to the society [17]. They are strongly dependent on non-
market support schemes [7] which affect their profitability.
The necessity of regulation could ensure the compensation for those benefits
which, along the expected decrease costs of DG technologies, would increase
the profitability and therefore the spread of this type of generation. This leverage
to DG penetration allows, beside society and electric system benefits, to
increment operational experience with the connection of a large quantity of DG
and more particularly those based on renewable sources. A comparison of today
and future costs versus revenues structure is presented in Fig. 5. It shows clearly
and expected and wanted evolution to a regulation of DG units as active players
Fig. 5 – Economics of DSO [7]
In [7] it is suggested that the use of regulatory enactments could shape the
DSO profits and therefore to provide incentives for DSO to become more
efficient which will result in lower future network tariffs. Table 2 presents a
overview of the benefits and drawbacks for the electric system that arises from
the DG connection to the networks.
The use of the concept of net-metering can also encourage consumer’s
investment in alternative methods of energy generation like DG while still using

11
conventional utilities [25]. It provides them with an immediate refund and can
leverage the growth of small energy systems [26] that are fundamental to
encompass storage.
Some growing trends in DG domain can be described [27],[28]:
Real-time pricing (differentiation in electricity prices in function of
different time periods (e.g. hourly) according to its marginal cost)
Paid-for-Performance Incentives
Alternative Pricing and Rate Incentives
Regional Emergency Operating Procedures
Emerging Incentives that Differentiate Reliability Needs
Table 2 – Costs and benefits for the electricity system induced by DG [7]
1.2 - New grid architectures
The theme of new architectures for the electrical grids is object of a large
number of published materials.
In opposition to the transport grids, the conventional network design at the
distribution grid led to less sophisticated control and management structures and low

12
automation level. The increase of DG connections and ageing assets calls for more
active networks strategies and technologies at the distribution level [29].
Besides physical access to the network, DG faces a problem of access to the
energy trading market such as day ahead, intraday, balance and ancillary markets
[7]. With small DG units the problem is even worst as, besides access regulations,
they have a problem of scale not only of power but also economic. The restriction of
access to the markets by small power generation units is understandable since it
would be virtually impossible to manage (possibly) thousands of such small units.
Additionally, the costs of gathering knowledge necessary for a successful
participation in the market are largely fixed costs and it gives advantage to the
powerful participants [7]. The solution probably involves the aggregation of small
(or medium) units, where a single entity controls multiple units, allowing them to
act as a large generator and to be competitive with respect to large conventional
generation plants. Moreover this association allow at achieving not only scale but
also sources diversity and other applications can therefore be considered [26].
The separation of operational control and ownership is an important principle
that could enhance the flexibility of the electric systems through the coordination of
multiple units. The use of aggregation could allow the non-discrimination against
any specific generation technology by network operators which is especially
important for balancing and reserve markets [7]. In fact and under current rules, the
operators contract such services usually with minimum 1 MW quantities [30].
There is already some work developed about aggregation schemes such as
Microgrids and Virtual Power Plants (VPP) showed in Fig. 6 and Fig. 7. The former
encompasses generation and loads and as a geographical scope. It can be operated in
a grid-connected or islanded mode. The latter encompasses generation only and has
a commercial scope in the sense that generation can be physically located anywhere
[17],[31].

13
Fig. 6 – Microgrid example [32]
Fig. 7 – VPP example [http://fenix.iwes.fraunhofer.de/html/what.htm]
The advantage of the Microgrid concept is the ability to operate even when it is
not connected to the grid, as in the case of failure of the network, providing a local
continuity of supply [17] to the loads that it serves. The advantage of the VPP
concept is the ability to be a flexible representation of a portfolio of DG that can be
used to make contracts in the market and to offer services to the system operator
[31].
There are a large number of potential players that might be interested to serve as
aggregators: automobile constructors, battery manufacturer/distributors, cell phone
network providers, distributed generation manager, etc. [33],[17].
Besides the aggregation issue, a more generic concept is the concept of smart
grid which aims to foresee future networks. Smart grid is a relatively new concept
that points out to the application of information technology to power systems [35].
Although not significantly different from actual conventional electric grids it means
to lead to improved cost-efficiency and effectiveness [35]. In this architecture the
objectives includes activation of demand (based on two-way interactive ICT), grid

14
monitoring and management, advanced maintenance advanced metering
infrastructure, renewable integration, electric vehicle (EV) and vehicle to grid
(V2G) [36]. The concept aims to attain a grid that possesses the following
characteristics:
- self-heal
- motivate and include consumers in energy decisions
- resists attack
- provide power quality
- accommodate all generation and storage options
- enable markets
- optimise assets and operate efficiently
This concept is illustrated in Fig. 8, Fig. 9 and Fig. 10, presenting the
characteristics described above.
Fig. 8 – Smart grid concept (Inovgrid) and technologies and solutions perspective [35]
Fig. 9 - Basic smart grid ingredients [21]
Fig. 10 – Smart grid pyramid [21]
In the same sense [14],[37], refers that power delivery system of the future will
be:

15
– Interactive with consumers and markets
– Self-Healing and Adaptive (to correct problems before they become
emergencies)
– Optimized (to make best use of resources and equipment)
– Predictive rather than reactive (to prevent emergencies ahead rather than
solve after)
– Accommodates a variety of generation options
– Integrated to merge all critical information
– More Secure
The intelligent grid is the power system that is capable of assessing its health in
real-time, to predict its behaviour, to adapt to new environments, to handle
distributed resources and stochastic demand, and to optimize response to the smart
appliances. It is a tool that allows electric utilities to focus on evolving true business
drivers by enabling cost containment, end-to-end power delivery control, and a more
secure infrastructure [14].
2 - Renewable energies issues
According to the International Energy Agency (IEA), renewable energy resources
are resources that are generally not subjected to depletion. Such resources can be heat
and light from the sun, force of the wind, organic matter (biomass), falling water
(hydric), ocean energy and geothermal heat [8].
Renewable energy sources are valuable assets when considering their ‘anywhere’
availability (energetic independence, decentralized gathering) and free cost (economy).
It is expected a growth of renewable energy generation for the coming years, with a
baseline scenario developed for the EU-25 showing an increase of Combined Heat and
Power (CHP) and Renewable Energy Systems (RES) up to 36% in 2030 [7]. A
prognostic of 100% renewable energy supply based on domestic resources even being
physically possible [39]. Fig. 11 presents the past and forecasted cost for renewable
energy technologies that supports the idea of a renewable generation growth.

16
Fig. 11 - Levelized cost of electricity forecast for renewable energy technologies [40]
Nevertheless, renewable sources may contribute to aggravate grid congestion and
protection coordination problems. Indeed, the variability of primary resources as wind
and sun (Fig. 13 and Fig. 14) lead to significant power variations and flicker if they
remain uncontrolled as in the grid “connect and forget” strategy.
In EU some penetration levels of RES, namely those based on wind, are beginning
to undermine integrity and security of the electric system [17] due to that strategy that
was used so far. To evidence that issue Fig. 12 shows the effects of wind power in the
electric systems.
Fig. 12 - System Impacts of Wind Power [41]
The sun is also a variable source where the power gathered can quickly drop by 60%
causing sudden variations in node voltages which are not problematic if the connection
density is low but can become severe in the inverse case [42], especially in the case of
connection to long distribution feeders [43]. The match between the PV peak power
generation and the grids peak consumption is normally not met. However, there is

17
sometimes a coincidence of electrical consumption of some type of loads (commercial
for instance) that peak in the early afternoon. In these cases the total PV generation in a
utility system can help to reduce the peak network load, even though it may have no
impact on the peak load at the residence where the PV is installed [22].
Renewable type sources are stochastic and, in their genesis, uncontrollable and not
dispatchable therefore supposedly unable to ensure an adequate reliability of supply.
Fig. 13 and Fig. 14 evidences the stochastic nature of the primary input characteristics,
typical wind speed and sun radiation.
So, renewable generation adds significant uncertainty to power systems
management as they are extremely dependent on accurate forecasting for power balance
between generation and consumption [3],[11]. Moreover, renewable generation systems
are usually feeding their instantaneous maximum power, to achieve an economic
leverage [11]. An example of such connection problems is the economic question of
considering the expansion of the new transmission capacity for accommodating 60
strong wind days in a year [11].
0
2
4
6
8
10
12
6-M ai 7-M ai 8-M ai 9-M ai 10-M ai 11-M ai
Fig. 13 - Wind profile example for one week (local data). Values in m/s.
Fig. 14 - Radiation profile example for six days [http://geog-www.sbs.ohio-state.edu/weather/]

18
Therefore the uncontrolled connection of renewable generation to the power grid
translates directly in quality problems [44],[15],[18] – frequency and voltage variations
– or management – bidirectional power flows – if the used strategy is “connect and
forget” (feed power not controlled). This strategy only works well, if the amount of
renewable power is much lower than the grid power in the point of connection
[11],[15],[18]. Recently, transmission grid codes have started imposing voltage-ride-
through capabilities, voltage support and active power reserves for new wind farms
[45], showing a possible change in the usual connection strategy.
Although two survey respondents mentioned cumulative harmonics as a source of
concern for the future, and the topic arises in the literature occasionally, the literature,
experimental results, and utility feedback indicate that harmonic pollution and
excitation of power system resonances are not problems, as long as high-quality
sinewave inverters are used [22].
Even considering that the connection of generators with different renewable source
inputs can attenuate the issues of the power injected in the grid that does not solve all
the problems. Fig. 15 depicts the power delivered to the grid for a combined wind and
sun generators where one can see the variations not only in high frequencies (minutes or
seconds wind variations – power problem) but also in low frequencies (hour sun
variation – energy problem).
Such power profile can pose problems of congestion (midday period) or loss of load
(reduced or no generation periods) such as the eventual combination of high generation
and reduced consumption that could probably be shut down by a high frequency limit
set point [44] or be curtailed by a local dump load resulting in a net loss of available
energy and, consequently, a larger payback period.
As the penetration of renewable energy continues to increase, the variation of such
energy sources may become the single largest source of variability on the power system.
The variability must also be understood in terms of short-term behaviour affecting the
unit commitment and load following reserves [34].

19
Fig. 15 – Combined wind-photovoltaic uncontrolled generation power example
Grid connection issues related to stochastic renewable sources can be dealt through
a combination of load management and storage [30],[42],[34] providing that the
dimension of the generator unit in not very large, as it is difficult to store large
quantities of electric energy (excepting the case of hydro storage). Storage may be
purchased to allow for better operation of localized portions of the power system (taking
strain off transmission during constrained periods) or even using it to support the power
system as a whole. Alternatively, the storage may be sourced from an electric-vehicle-
to-grid arrangement, with an agreement on how often the system can cycle the batteries
and how much it is allowed to draw them down.
Another type of solution lies in the use of hybridisation [46] – compensation of the
weakness of one with the strength of another – whether in the sources (Fig. 16),
whether in the storage or even in the energy carrier [16].
PV
Hybrid
WG
Cost of the system (£)
Yea
rly
syst
em a
uto
no
my
1000 2000 3000 4000 5000
Fig. 16 - Yearly system autonomy versus system cost for single photovoltaic, single wind and hybrid
photovoltaic-wind system
An economic point of view is also relevant to the analysis of the use of renewable
sources. Fig. 17 shows the correlation between wind production and spot market prices
where one can notice that decreasing wind production drives up prices and increasing

20
wind production drives down prices [16]. This behaviour calls for RES that can be
controllable, not only to circumvent that problem but also to be able to take an
economic advantage of price variation.
Fig. 17 - Normalized spot market prices and electricity demand minus wind production
System design decisions, whether in terms of contractual agreements or the
instalment of physical equipment, must be based on accurate information about the
degree of flexibility that is required. If high levels of non-scheduled renewable energy
are employed in the system, these will tend to dominate the flexibility requirements. A
careful assessment of the renewable energy resources (their variability and its effects on
the power system) is vital when re-negotiating contracts or considering installation of
physical equipment [34].
It is worth to be noticed that despite the free cost of the primary energy involved in
renewable sources their use involves technology that is neither costless nor emissions
free.
The related renewable emissions issue is also referred in [23] where it is mentioned
that DG can have sources based on combustion that corresponds to the more mature DG
technologies and so, well placed to capture much of the early market but with a local
emissions impact. In order to have a more wide perception, Table 3 shows renewable
energy payback times and associated emissions for various technologies [8].

21
Table 3 - Payback time and emissions for various energy technologies [8]
2.1 - Hybridization
Hybrid systems are proved to more reliable and economic more advantageous as
they combine two less reliable sources [46]. The union of both sources can solve, to
some extent, some of the problems of sources variability but demands a more
complex control when compared to a single source [46]. The optimal operation of
combined different components requires a further and higher layer – supervisor –
that looks for individuals and coordinates them to accomplish some defined
objectives.
2.2 - Storage
There are multiple storage technologies available, such as:
biomass hydrogen fuel cell hydro based compressed air energy storage (CAES) heat pump redox flow cell electrochemical batteries (Pb, Li, …) flywheel superconducting magnetic energy storage (SMES) capacitor

22
There are many ways of categorizing the storage technologies, one of them,
which is interesting for the present context, is based on the time properties as
presented in Table 4 [47]:
Table 4 – Applications and duration of storage technologies
The main task of a storage unit is to insert flexibility in the manipulation of
electric energy as the ability to rapidly vary real power where storage can play a
significant role [5]. Investments in power storage have the potential to improve the
integration of DG into power networks and to optimize power output, producing
only when the demand is high [17], what improves systems availability [26] and
favours dispatch ability.
Storage technologies are therefore excellent candidates to overcome the
variability of renewable sources, compensating the excess or deficit of the relation
load consumption-generated power and allowing profits maximization by relating
time of delivery with cost of electricity and possibly providing services (which are
necessary to have energy available for) such as active and reactive power, voltage
and frequency control, emergency power during outages, etc. [47].
The connection to the network can also benefit from storage as into flexible AC
transmission systems (FACTS) devices providing services like independent real and
reactive power absorption/injection into/from the grid, leading to a more economical
and/or flexible transmission controller [5].
Custom power devices address problems found at distribution level such as
voltage sags, voltage swells, voltage transients, and momentary interruptions. The

23
most common approaches to mitigate these problems focus on customer side
solutions such as UPS systems based on battery energy storage [5].
Other benefits of storage, related by [5], are involved with deregulation, together
with transmission limitations and generation shortage that have recently changed the
power grid condition. These are related with system reliability and power quality.
The ability to rapidly damp oscillations, respond to sudden changes in load, supply
load during transmission or distribution interruptions, correct load voltage profiles
with rapid reactive power control, and still allow the generators to balance with the
system load at their normal speed.
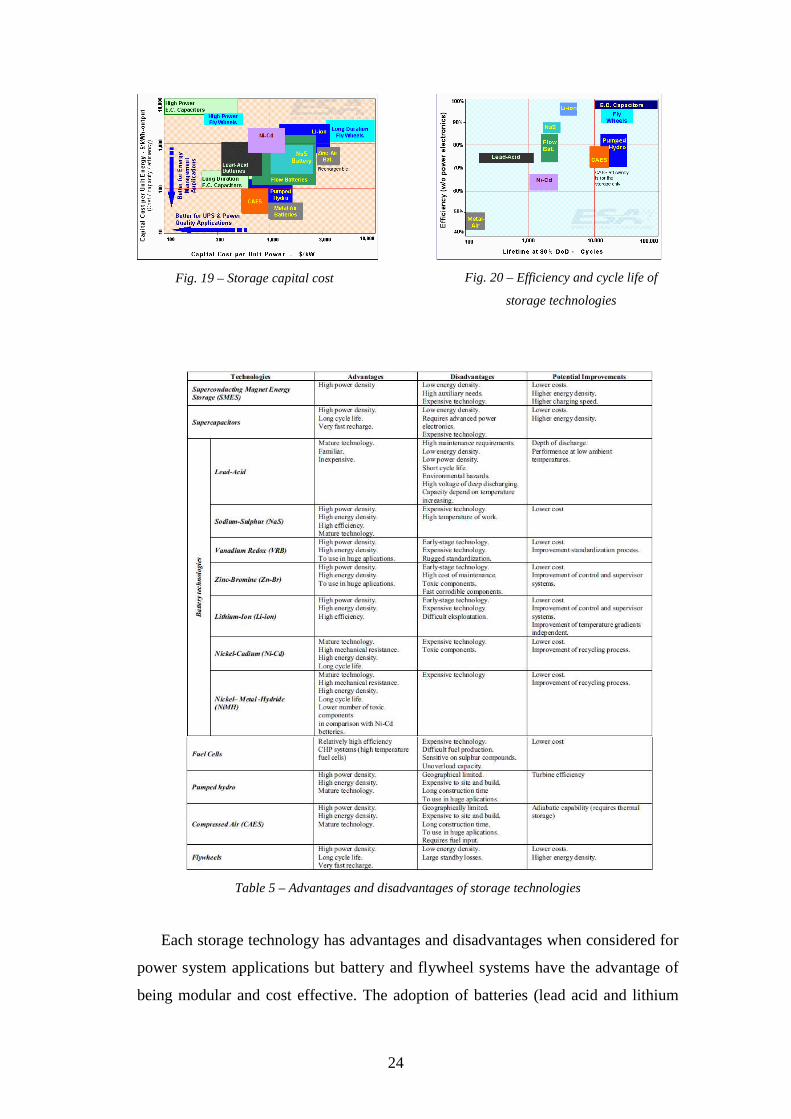
However, while storage is perceived as a good option to control renewable
power there is still problems related with their use, fundamentally the relation cost-
energy-power. Fig. 18 and Table 5 [48] give an overview of the advantages and
disadvantages for some storage related technologies. Fig. 19 and Fig. 20 [49] show
the cost and life cycle of several storage technologies and means to essentially
highlight the economic weight that specific storage technologies have in the
investment (cost) and re-investment (life-cycle) of RES (and especially small RES),
ultimately determining their financial viability.
Fig. 18 – Main energy backup systems
24
Fig. 19 – Storage capital cost
Fig. 20 – Efficiency and cycle life of
storage technologies
Table 5 – Advantages and disadvantages of storage technologies
Each storage technology has advantages and disadvantages when considered for
power system applications but battery and flywheel systems have the advantage of
being modular and cost effective. The adoption of batteries (lead acid and lithium

25
ion basically) as the usual storage type is related to the mature manufacturing
technology and relatively low cost of acquisition. Namely when compared with their
actual close competitor, the fuel cells, difference which is stressed when operational
(maintenance and substitution) costs are added.
However, the operation of batteries is still a complicated task. State of charge
(SOC) and state of health (SOH) determination, actual chemical conditions [50] and
operating temperature and finally the utilization conditions, are issues that have not
yet been satisfactory solved. For example, to maintain power balance between
stochastic sources and loads leads to high current charge/discharge variations in the
batteries which contrasts with the manufacturers recommendations and will shorten
their lifespan [51].
The “on-line” management operation is also problematic because it involves
dimensioning (usually oversizing) and control in order to avoid under/overcharge or
excessive stress (deep charging/discharging) in the batteries. One possible solution
is to hybridize storage, where the most common association are batteries with fuel
cells – the former with good power density and good dynamics, the latter one with
good energy density but slow dynamics [52].
Nevertheless, V2G is a domain of adoption of batteries to operationalize
electrical storage. Furthermore it is a solution that does not involve a large
investment in storage by using existing (and underused) capacity of vehicles [33]
what can also be used in non-vehicle based systems as the stationary home storage.
While batteries are the most used storage technology it must be stressed that
they do not solve all the problems related with power systems. Other storage
technologies are receiving attention for utility applications such as flywheels,
advanced capacitors and superconducting energy storage systems (still in the
prototype stage) [5]. In terms of power quality ultracapacitors are increasing its
relevance, presenting lower energy density than batteries but possessing a higher
power capacity. Recently, such capacitors have been explored for energy storage,
since they are more efficient than batteries and offer higher lifetime in terms of
charge-discharge cycles. However, they involve leakage (intrinsic and due to
parasitic paths in the external circuitry), which precludes their use for long term
energy storage [53].

26
Fig. 21 presents a synopsis roadmap of the points focused on the present
chapter.
Fig. 21 – Synopsis of the key points outlined in Chapter I
3 - Objectives of the thesis
Fig. 22 – Current and future electric systems [49]
According with future electric systems (Fig. 22), the main objective of the thesis is
to propose a small hybrid renewable energy based system architecture, with control and
management methods, which respond to the issues and concerns of modern and future
power systems turning it in an active and flexible electrical generator.
While the general approach is towards distributed generation, a perspective of
application in very small systems is adopted. The underlying idea is similar to the
strategy driving from V2G or CHP and is supported by the smart grid concept. That is,
to take advantage of existing infrastructures and willingness receptivity from electricity

27
customers to implement small systems that statistically contribute to solve network and
socio-political issues.
The dispersion of those infrastructures allows a statistical effect and the actual
political support to the spread of internet provides the necessary ICT infrastructure.
Aggregation modes have potential to solve scale related grid operators concerns and the
separation of ownership and operation can solve the eventual lack of necessary
operational knowledge.
Being a small system the economic performance is fundamental. Therefore the
control of the operation of the renewable energy sources at their optimal (maximum)
power output, managing the power balance by using (electrochemical) storage in the
DC bus is fundamental. This will allow the system to maximize the investment return.
Another concurrent intermediary strategy is to manage the available energy such as
to take advantage of variable market energy prices and/or providing services such as
peak shaving, reserve response, etc. in order to attain a reward that overcomes the mere
energy selling.
The global strategy is to turn stochastic energy sources into controlled deterministic
power through the use of common and cheap storage and suitable control schemes. Fig.
23 illustrates this underlying strategy. Power flows are controlled through power
electronics and global management is performed by a microcontroller enabling not only
a diversity of control and communication capabilities but also taking advantage of the
software flexibility. The use of software makes possible to rapidly and effortless to
change through diverse strategies thus making possible to adapt the generation system
to dynamic conditions.
Stochastic Deterministic
Storage
control
Generation unit
Stochastic Deterministic
Storage
control
Generation unit
Fig. 23 – Generation unit (GU) global strategy

28
GU Publicgrid
GU
GU
Com
me
rcia
l/Phys
ical
/...
Aggre
gat
ion
GU Publicgrid
GUGU
GUGU
Com
me
rcia
l/Phys
ical
/...
Aggre
gat
ion
Fig. 24 – Small systems (GU) aggregation
4 - Contributions
The main scientific contributions of this thesis are the following ones:
- To approach and research the integration of different renewable energy
sources into a unique electric generation system – an hybrid renewable energy
system (HRES) – in order to improve this type of systems in terms of energy
quality as well as its economic value;
- The proposition and validation of a power balancing strategy for a HRES in
order to control the power injected by renewable based units in the grid while
maximizing generated power through keeping running on MPPT algorithms
for all the sources;
- The proposition of a better economic value for hybrid generation units through
the attribution of control services to grid operators;
- The proposition of different energy management strategies with the definition
of the operating modes for the controlled HRES in order to ensure energy and
power availability;
- The design and experimental implementation of a HRES in order to
demonstrate the validity of renewable sources hybridization and its
controllability;
These contributions can be extended for different hybrid power systems, which
embody renewable energy sources, and a medium-term energy storage system. Also to
point out to advantages in monitoring, controlling and managing generation sites with

29
different renewable energy sources integrating, in the same space, energy storage
capacity, either electrical or non-electrical, as a unique generation system.
5 - Thesis layout
The thesis is structured in 7 chapters.
Chapter I provide a multi-environment framework of the needs and requirements of
active generation units in actual and future electric power systems. It establishes a clear
approach for the development of the work to be carried out. Within this approach the
main objectives and contributions to the field of hybrid renewable energy systems
(HRES) are presented.
Chapter II reviews distributed generation architectures and grid interconnection
issues in conjunction with modern grids structures that are arising. It concludes for the
need for new approaches to renewable based generation systems, namely for controlled
ones that suits well the requirements of functionalities for electrical grids.
Chapter III analyses and defines models for the different elements integrating the
HRES and establishes a suitable computational simulation tool appropriate to work out
the issues proposed for the thesis.
Chapter IV frames the domain of grid services, namely HRES availability and grid
operation safety, establishing appropriate strategies for developing HRES.
Chapter V presents the design and implementation of an experimental platform
suitable to validate the results carried out in the thesis. Relevant characteristics are
discussed and tested in order to validate the platform itself and dynamic as well as
management system features.
Chapter VI presents the application of control and management strategies to the
experimental HRES in order to prove the main contributions established within this
work.
Chap. VII draws the conclusions and suggests related future work.

30
References
[1] T. Mueller, “Energy and electricity supply and demand: Implications for the global environment”, IAEA bulletin, 3, 1991
[2] P. Dondi et all, “Network integration of distributed power generation”, Elsevier Journal of Power Sources 106, 2002
[3] L. M. Costa, “Scheduling of Power System Cells Integrating Stochastic Power Generation”, PhD thesis, 2008
[4] W. Kleinkauf et al, “Decentralized grid-compatible PV power supply – strategy for electrification and integration concepts with modular technology”, 2nd World Conference and Exhibition on Photovoltaic Solar Energy Conversion, Vienna, 1998
[5] P. Ribeiro et al., “Energy Storage Systems for Advanced Power Applications”, Proceedings of the IEEE 89, 2001
[6] S. Amin, B. Wollenberg, “Toward a smart grid”, IEEE Power and Energy Magazine, 2005 [7] M.J.J. Scheepers, “Policy and regulatory roadmaps for the integration of distributed generation and
the development of sustainable electricity networks”, Final Report of the SUSTELNET project, 2004, available online at http://www.ecn.nl/docs/library/report/2004/c04034.pdf
[8] T. Ackermann, G. Andersson, L. Soder, “Distributed generation: a definition”, Elsevier Electric Power Systems Research 57, 2001
[9] K. Purchala, R. Belmans, L. Exarchakos, A. Hawkes, “Distributed generation and the grid integration issues”, Imperial College London, EUSUSTEL, Work Package-3, Belgium
[10] W. Khattam, M. Salama, “Distributed generation technologies, definitions and benefits”, Elsevier Electric Power Systems Research 71, 2004
[11] B. Buchholz, Z. Styczynski, “Integration of renewable and dispersed resources: lessons learnt from German projects”, IEEE Power Engineering Society General Meeting, 2006
[12] K. Darrow et al., “Role of Distributed Generation in Power Quality and Reliability”, report by EEA, an ICF International Company, 2005, available online at www.icfi.com/markets/energy/doc_files/eea-dg-power-quality.pdf
[13] C. Patsios et al, “Control and analysis of a hybrid renewable energy-based power system”, XIX International Conference on Electrical Machines (ICEM), 2010
[14] J. Momoh, “Smart Grid Design for Efficient and Flexible Power Networks Operation and Control”, IEEE/PES Power Systems Conference and Exposition (PSCE '09), 2009
[15] P. Lund et al., Connection of distributed generation – effect on the power system, SINTEF technical report (www.energy.sintef.no), 2003
[16] M. Blarke, H. Lund, “The effectiveness of storage and relocation options in renewable energy systems”, Elsevier Renewable Energy 33, 2008
[17] M. S. Jiménez., “Towards Smart Power Networks”, Directorate-General for Research Sustainable Energy Systems, KI-NA-21970-EN-C, 2005
[18] A. Moore, “Distributed generation protection overview”, University of Western Ontario, 2008 [19] E. Coster, J. Myrzik, W. Kling, “Effect of DG on distribution grid protection”, Eindhoven
university, Intech, 2010 [20] V. Wachenfeld, “Towards a Harmonized European Grid Code”, available online at
http://www.epia.org/fileadmin/EPIA_docs/documents/WS090213/090213_Network_004_Wachenfeld.pdf, 2009
[21] H. Farhangi, “The path of the smart grid”, IEEE Power and Energy Magazine, 2010 [22] C. Whitaker et al., “Distributed Photovoltaic Systems Design and Technology Requirements”,
SANDIA Report SAND2008-0946 P, 2008, available online at http://www1.eere.energy.gov/solar/pdfs/distributed_pv_system_design.pdf
[23] G Dias, J. Montez, “Detailed review of the 2002/91/EC Directive focusing on identifying the current scope for deploying generic Distributed Generation solutions for energy efficiency improvement in new buildings”, 2006
[24] V. Thong, R. Belmans, “Distributed generation overview: current status and challenges”, International Review of Electrical Engineering, vol. 1, 2006
[25] ELEP - Detailed review of the implementation options for net metering and feed-in tariffs for DG and RES within the EU, and recommendations for implementation, 2007
[26] P. Nema, R. Nema, S. Rangnekar, A current and future state of art development of hybrid energy system using wind and pv-solar: a review, Elsevier Renewable and Sustainable Energy Reviews 13, 2009
[27] C. Gellings, R. Lordan, “The Power Delivery System of the Future”, Elsevier Electricity Journal 17, 2004
[28] A. Chuang, “Demand-side Integration for System Reliability”, Power Tech, 2007

31
[29] J. McDonald, “Adaptive intelligent power systems: Active distribution networks”, Elsevier Energy Policy36, 2008
[30] W. Kempton, J. Tomic, “Vehicle-to-grid power implementation: From stabilizing the grid to supporting large-scale renewable energy”, Elsevier Journal of Power Sources 144, 2005
[31] LSVPP FENIX project, http://fenix.iwes.fraunhofer.de/ [32] J. Pecas Lopes, et al., “Defining Control Strategies for MicroGrids Islanded Operation”, IEEE
Transactions on Power Systems, vol. 21, 2006 [33] A. Brooks, T. Gage, “Integration of Electric Drive Vehicles with the Electric Power Grid - a New
Value Stream”, 18th International Electric Vehicle Symposium and Exhibition, Germany, 2001 [34] C. Potter, A. Archambault, K. Westrick, “Building a Smarter Smart Grid through Better
Renewable Energy Information”, IEEE/PES Power Systems Conference and Exposition, 2009 [35] European Smart Grid Technology Platform, http://www.smartgrids.eu [36] S. Inage, “Modelling load shifting using electric vehicles in a smart grid environment”, OECD/IEA
working paper, 2010 [37] D. Dollen, "Enabling Energy Efficiency IntelliGrid," NARUC Summer Meeting, 2006, Available
online at http://mydocs.epri.com/docs/CorporateDocuments/AssessmentBriefs/NARUCIntelligrid.pdf.
[38] T. Ackermann, G. Andersson, L. Soder, “Distributed generation: a definition”, Elsevier Electric Power Systems Research 57, 2001
[39] H. Lund, B. Mathiesen, “Energy system analysis of 100% renewable energy systems - The case of Denmark in years 2030 and 2050”, Elsevier Energy 34, 2009
[40] A. Herzog, T. Lipman, D. Kammen, “Renewable energy sources”, Encyclopedia of Life Support Systems, 2001
[41] Holtinnen, “IEA Wind Task25”, 2007, available online at http://www.wind-energy-the-facts.org/en/executive-summary/part-iigrid-integration.html
[42] A. Baggini, Handbook of Power Quality, “Distributed Generation and Power Quality – Case Study”, John Wiley & Sons, 2008
[43] A. Woyte, V. Thong, R. Belmans, J. Nijs, “Voltage fluctuations on distribution level introduced by photovoltaic systems”, IEEE Transactions on Energy Conversion 21, 2006
[44] A. L. Pereira, “Modular supervisory controller for hybrid power systems”, PhD thesis, 2000 [45] I. Alegría, et al., “Connection requirements for wind farms: A survey on technical requirements
and regulation”, Elsevier Renewable and Sustainable Energy Reviews, 11, 2007 [46] A. Celik, “Optimisation and techno-economic analysis of autonomous photovoltaic-wind hybrid
energy systems in comparison to single photovoltaic and wind systems”, Pergamon Energy Conversion and Management 43, 2002
[47] J. Barton, D. Infield, “Energy Storage and its use with Intermittent Renewable Energy”, IEEE Transactions on Energy Conversion, Vol. 19, 2004
[48] J. Paska, P. Biczel, M. Kłos, “Technical and economic aspects of electricity storage systems co-operating with renewable energy sources”, 10th international conference on Electrical Power Quality and Utilization, Poland 2009
[49] http://www.electricitystorage.org/ESA/technologies [50] G. Bopp et al., “Energy Storage in Photovoltaic Stand-alone Energy Supply Systems”, Wiley
Progress In Photovoltaics: Research And Applications 6, 1998 [51] A. Voorden, G. Paap, L. Sluis, “The use of batteries in stand-alone renewable power systems”,
IEEE Power Tech, 2005 [52] T. Zhou, “Control and Energy Management of a Hybrid Active Wind Generator including Energy
Storage System with Super-capacitors and Hydrogen technologies for Microgrid Application”, PhD thesis Ecole Centrale de Lille, 2009
[53] V. Raghunathan, “Design Considerations for Solar Energy Harvesting Wireless Embedded Systems”, Proceedings IPSN '05 4th international symposium on Information processing in sensor networks, 2005
[54] C. Gellings, M. Samotyj, B. Howe, “The future’s smart delivery system”, IEEE Power & Energy Magazine 2, 2004

32
33
Chap. II - DG energy system architectures and grid interconnection
Distributed generation, decentralized and local control, self organization and
autonomy are trends of today's electric power systems. While several benefits like
addressing environmental concerns, energy independency and market participation in
the distributed nature of electric generation are recognized, there are still pending issues
and potential benefits in this form of electricity participation that must be solved and
developed. Increase of highly reliable electricity demand (power quality
interconnection) issues, new value-added services and effective integration in old and
new network architectures are main examples.
The use of the “connect and forget” DG has been the strategy commonly used to a
recent time but the increasing relative weight of this kind of generation in the network
has began to pose several interconnection problems. Those problems, along with the
actual operational effects on the grids, tend to divert the interest of the electric network
operators in their use. This reluctance of grid operators toward DG penetration lies in
the integration of such type of systems in networks not planned to support them as well
as the financial impacts that they also imply. The trend must therefore be to view DG
units as an integrated help to electric networks operation and not only as a generation
source. Furthermore, from a user point of view the perspective of simply selling energy
(or avoiding buying it) has proved to not being able to cover the investment made in
DG, specially that based on renewable sources, taking in consideration the comparative
energy prices of bulk generation. This means that from both perspectives DG is
expensive and a source of problems.
The existence of incentives towards the reduction of the financial barriers to the
spreading of DG has caused a rise in the renewable based units connected to the grid.
The issues raised by the injection on the grid of stochastic power have grown in a direct
proportion. The financial support to the DG as a passive generator is also not sufficient
to ensure an effective and harmonious integration with the existent electrical
infrastructures neither to reimburse the investment. Therefore the trend for a different
type of reward, other then the mere price of energy, to promote the existence of adapted
DG is necessary. This earning aims to reward not only the good DG grid behaviour but
also the potential offer of services to the grid as a contributor for the improvement of the
grid management.

34
The electric network must be seen as an actively manageable integrated unit (over-
passing problems as saturation lines by re-routing power for example) view that is
technically and economically advantageous and favours the integration of DG in
deregulated electricity markets [1]. This view is supported by the difficulty (both in
time duration and calculation capacity) of a system operator to schedule a large number
of DG units while maintaining a high efficiency and guarantee of safety during failures.
The trend to distributed nature, autonomy, coordination, cooperation and adaptability in
view of efficient integration of all network components, calls for innovative control,
architectures and communication capabilities, specifically in the case of DG.
Whereas the scale factor of large unit power plants allows a low cost for energy
delivered, they concurrently have an intrinsic stiff behaviour that is expressed in the use
of long term contracts. Inversely, DG has the potential to no longer be an isolated – in
the sense that it must sense the network and take actions to adapt the best way to
participate in a stable grid operation – but an integrated part of the electrical network.
That is, with possibility of reporting its operational (power) and future (energy)
conditions and being able to accept online requirements – operational coordination.
Fig. 1 depicts an historical overview of DG interconnection, presenting a typical
architecture for power flow between renewable sources and grid as well as the evolution
of the concept for renewable generators.
ProblemsPower qualityProtection systems
“Do nothing” (PDG << PGrid)
Use of storage (control of energy)• H2• Eletrochemical
Sources curtailment (poor economic efficiency)
Not
con
trol
led
Con
trol
led
DG
penetrationD
Gpenetration
Controllable and “intelligent” (control of energy and power)• services• help to grid• communication possibilities
PRen PHres PDG
Fig. 1 - DG interconnection historical overview

35
1 - DG grid interconnection
Power systems impose a set of restrictions for the connection of DG to the
electric network to prevent unexpected effects on their operation. The magnitudes of
the issues that arise from DG interconnection to electric networks are primarily
related with the penetration level of DG. A low penetration level is fairly innocuous,
diluted by bulk generation capabilities and grid control schemes, but the spreading
of such type of generation raises a large range of problems if the electric network
does not evolve from passive to a more active role. Operational issues such as power
quality, protection and reliability are among the first encountered, especially when
DG becomes the major ‘local’ source of power. DG units tripping at abnormal
conditions, grid connected fault detection, impact on network losses and islanding
behaviour are other issues to be considered [1],[2].
Effects of the DG connection to electric networks are related to the following
points [1],[3],[4]:
Voltage control (regulation)
Power quality
Fault levels
Protection schemes
Power losses
Network abnormal operation (islanding)
Therefore, taking in account the need of carbon alternatives to the power
production as well as the environmental concerns, the present need for power
generation based on renewable sources seems unavoidable. The valuation of the
electrical networks concerns, which are based on past issues caused by these
generation technologies connection to the grid, seems to favour the development of
studies and new solutions for grid connection.
2 - DG systems architectures
DG was initially looked as a way to supply remote or isolated areas with a small
amount of power and away from the more heavily loaded feeders. Their architecture
was simple and they were connected in weak feeders without concerns about the
quality of the energy they provided. In the past decades however they have evolved
towards more complex architectures more adaptable to the issues they found.

36
DG architectures and topologies embrace a large variety of items, such as:
nature of the power gathered (AC or DC)
system elements (single or hybrid sources and/or storage)
power levels (from few kW to hundreds of MW)
points of connection (low and high voltage distribution grids or
transmission grids)
primary energy source technologies (internal combustion, wind,
photovoltaic, hydrogen, etc.)
operation modes (stand alone or grid connected)
interfaces types (directly coupled and inverter coupled)
DG has begun with diesel generators in isolated sites and in weak grids but has
had a big development with wind energy followed by photovoltaic technologies. In
terms of energy sources the first wind based DG technology was non-hybrid and
based on asynchronous generators later replaced by synchronous generators.
Initially with fixed operation speed and pitch control directly connected to the grid –
which transfers the variability of the stochastic nature of the source to the electrical
network – they evolved to variable speed with the support of power electronics and
the development of sophisticated control algorithms [5].
The next evolutionary step consisted in the use of power electronics and then in
the integration of control strategies. This further allowed the control of active and
reactive power and consequently the control of frequency and voltage that is the
control of power quality. They face the stochastic nature of the wind contrarily to
the deterministic nature of diesel based generators which led to several issues such
as load following, disconnection after faults, turbulent power profiles (quality
problems) and voltage regulation [6].
These problems, mainly related to the interconnection to the public grids, were
diluted as long as their power weight was small when compared to the public grid
power. The architectures used in such type of DG were based on AC control but the
development of power electronics led the architectures to the generalized back-to-
back topology (AC/DC/AC) as shown in Fig. 2 [5],[7],[8].

37
Fig. 2 - Single source wind architectures for grid connection
The same configurations are applicable to non-wind based generation such as
diesel or, in a more generalized way, internal combustion engines and
microturbines. The formerly combination of diesel with wind generation [9] allowed
to bypass the stochastic behaviour of the last through the use of diesel fuel. The key
strategy was nevertheless to complement diesel generation in view to reduce fuel
consumption.
Photovoltaic based DG is actually one of the highest growing technologies. Its
advantage lies in the insurance of everyday sun existence, even with variations due
essentially to clouds, but with a distribution that does not match the load [10].
Similarly to wind based DG, initial PV generation (and later fuel cell and batteries
based systems) was also non-hybrid and with the growing power also faced the
same problems than wind as, for instance, the power variation caused by cloud
transients [11]. The main difference to wind is the DC nature of the generated power
which implied different topologies.
The architecture differences here are related to the modules association of PV
panels – initially centralized in a DC-AC converter, latter decoupled by strings each
one with its DC-AC converter and lately with a DC-AC converter by panel – see
Fig. 3 [7],[12]. The objectives of the different architectures were to make more
flexible the connection and not to be dependent on a central point of control.
Fig. 3 - Single source PV architectures for grid connection [12]

38
Fig. 4 – Coupling structures [13]
2.1 - Hybrid DG
The use of a single type of renewable source results in an over-sizing of the
DG power sources what implies a high investment. Due to the growing power
contribution of renewable based generation, DG tends to hybridize source
architectures. The objective is to mitigate the “weakness” of one stochastic
source by another stochastic source or by a deterministic one obtaining a
combined efficiency higher than that of a single source type. The most common
combination is the wind-PV but other associations are also used as wind-diesel,
wind-storage, PV-diesel, Fuel cell (FC)-diesel, etc.
The integration of different elements characteristics can be done based on
AC, DC or mixed coupling [14],[15] as depicted in Fig. 5. DC coupling is, in
general, simpler and DC/DC converters are easier and cheaper than DC/AC. By
far the most used configuration has a DC intermediary bus followed by a stand
alone or grid connected AC bus. There are nevertheless some cases where the
architecture is only DC [16] or only AC [17],[18] but they are a minority when
the system is involved with energy sources/storage hybridization. The
connection between the two buses is done with an inverter which deals also with
grid issues such as reactive power and power quality. A review of the literature
([30]-[57]) shows that the DC bus voltage is generally either maintained by
direct connection to batteries, by cascading control loops (first loop to control
power and secondary loop to control output voltage) or by the grid connected
inverter.

39
DC
Grid
WindPV
~H2
FC
HDiesel
~battery
hydrogen
supercapacitor
flywheel
AC load
AC
DC load
DC
Grid
WindPV
~~H2
FC
HDiesel
~battery
hydrogen
supercapacitor
flywheel
AC load
AC
DC load
DC
Grid
Wind
PV
~
H2
FC
H
Diesel
~
battery
hydrogen
supercapacitor
flywheel
AC load
AC
DC load
DC
Grid
Wind
PV
~~
H2
FC
H
Diesel
~
battery
hydrogen
supercapacitor
flywheel
AC load
AC
DC load
Fig. 5 – Hybrid system elements interconnection
DC bus voltage level is a key point in the DG systems. A high voltage level
favours the simplicity of connection of the DC bus to the inverter but is an
obstacle in the case of use of small power generation sources. The use of
transformers either of high frequency (before the inverter) or low frequency
(after the inverter) allows at matching voltage levels and avoids the solution of
paralleling large sources paralleling or the use of a DC-DC converter, besides
the isolation it can provide.
2.2 - Energy storage
Along with the growth of DG power the rise of the market perspective in the
energy business lead DG systems to embody the capability of storage. Storage
not only circumvents connection issues (supplying reactive power and voltage,
frequency control and other valences) [19] but also introduces an additional
freedom degree in the system control. As such DG is able to displace energy
from one time period to another [20] as suggested in Fig. 6. The first case refers
to short-term and the second to long-term storage. While initially storage was
used mainly to control stochastic renewable power (curtailment), the potential
management flexibility allows energy to be traded when it is more demanded or
when it is more profitable. This flexibility embraces the dependence on the
renewable sources variability therefore taking advantage of actual or potential
spot prices variation [20],[21]. Additionally it allows not only to provide
gathered renewable energy when needed or wanted but also to get energy from
the grid when there is excess in it and to participate actively in islanding
situations [22].

40
Fig. 6 – Supply-demand control [23]
2.2.1 - Storage technologies
There are several technologies available for storage from large to small
capacities and with very different capabilities (Chap.I, 2.2). A summary
listing of the existing technologies is presented:
Hydro
Thermal
Compressed air
Flow batteries
Hydrogen
Electrochemical
Flywheel
Superconducting magnetic
Capacitors
The analysis of the comparative merits of each technology can be
grouped by [24]:
Capacity
Power capability
Depth of discharge
Discharge time
Efficiency
Durability
Autonomy
Costs
Adaptability
Self discharge
Mass and volume density

41
Reliability
Monitoring and control requirements
2.2.2 - Batteries
By far the most used storage technology in small applications is the
electrochemical one (mostly batteries).
This technology further divides itself in several types that are listed
below:
Lead Acid Battery (Pb)
Sodium-Sulfur battery (NaS)
Vanadium Redox Battery (VRB)
Zinc Bromine Battery (ZnBr)
Nickel Cadmium (NiCd) Battery
Nickel Metal Hydride (NiMh) Battery
Lithium Ion (Li-ion) Battery
The most used one has been the Lead-acid due to its maturity, simplicity
of utilization and relatively low cost due to scale economy of their spread
use. They nevertheless suffer, in certain circumstances, from a lack of energy
capacity and/or a lack of power density.
Moreover they have a complex behaviour related with complex chemical
reactions and temperature that affects namely the estimation of their state of
charge [25]. Because SOC only can be misleading the concept of State of
Health (SOH) is a valuable indicator of how much energy a battery can
effectively supply. This is fundamental for predictable systems, as the
controllable generators with renewable sources are intended to be, since they
rely on the capacity of energy stored to complement the variability of their
sources [26]. The estimation of the SOC is mainly done by one of the
following forms:
Density measurement
Voltage measurement
Charge counting

42
Li-ion batteries have had a large growth lately as they are able to
circumvent some of the deficiencies of the Pb technology namely lifetime
and efficiency (see Table 1) but still suffers from a high comparative cost.
Their energy and power density are also higher than Pb batteries. Conversely
they have intrinsic potential for explosion and are less tolerant to voltage
deviations.
Table 1 - Characteristics comparison of Li-ion and Pb batteries [27]
Hidrogen storage (fuel cells) can be a good complement to the batteries
with their higher density of energy. Unlike batteries fuel cells does not need
to be charged for the consumed energy since the fuel is continuously
supplied. But they suffer from low efficiency (50-60%) when compared with
batteries (70-90%) [28] and are more expensive. Nevertheless as long as
small scale is concerned it is an effective alternative to be considered.
2.3 - DC bus based architectures
As referred in [29], the use of architectures based in a common DC bus
allows for simpler and cheaper system components and easier control. This is a
main advantage for small systems where the production cost of energy is higher,
as it does not have the leverage of economy of scale (neither in cost equipments
nor in energy production). Moreover the simplicity of the DC bus based
architectures supports modularity therefore turning it in a more widely
acceptable system and avoiding system specificity costs as replacement parts
and expertise from maintenance personnel. Modularity also potentially allows a
more widely manufacturing volume production of related system elements with
the corresponding reduction of components cost [15].
As long as the relative strength of DG delivered power compared with the
power necessary for the loads is small and therefore not causing any significant
problems to the grid, the main objective is to deliver as much as possible in

43
order to maximize the profits of the investment made on the renewable based
system. This strategy leaded to simpler control perspectives that mainly sought
to dump the maximum possible energy and use the grid as a back-up to balance
local loads when there are not enough renewable generation [30].
The spread of DG, and the corresponding issues that it causes in the grid,
calls for more elaborated control and management that encompasses dynamic
control, power dispatching, efficiency of storage and fuel based elements,
management set-points definition, sources power control and delivered power
quality. From another point of view the management of the system energy has to
deal not only with purely technical issues but also with economic analysis such
as sizing and market related relations with time and prices.
Literature on the subject is mainly focused in control [31]-[57],
sizing/economical analysis [58]-[59] and energy management strategies [60]-
[64]. Key points are stability, grid issues interconnection concerns (voltage and
frequency control). More particularly, the research on DG hybrid focus at the:
compensation of elements with slow dynamics
[31],[37],[38],[40],[55],[63]
DC bus power management
[14],[31],[32],[34],[42],[54]
DC bus voltage control
[14],[31],[60]
efficiency of hydrogen related units
[32],[37],[41],[47],[61],[62],[64]
efficiency of charge/discharge of batteries
[30],[32],[34],[45],[52],[57],[62],[63]
definition of operation set-points
[44],[59]
sources power control
[14],[30],[39],[45],[49],[50],[51],[53],[55 ],[56],[60],[63]
grid interconnection issues
[14],[30],[35],[36],[39],[41],[48],[54],[55 ]
The integration of renewable based DG from a perspective of energy
markets (namely short term markets – day ahead and intraday market) that

44
means a combined analysis of control and management seems to have not
received in the investigation of DG systems as much attention as it deserved.
With the spreading of DG, which means that in certain places the main
power generation tends to come from DG, issues arising from the
interconnection with utility grids imply a change in the strategy of operation of
renewable based DG. That change would be appreciated either from the
perspective of the grid as having less delivered power fluctuation (and, if
possible, with time control over the power) and from the perspective of the DG
owner as having larger flexibility of operation options (that could adapt
production to a better economical exploitation).
Therefore future DG systems must be controllable in a dynamical operation
as well as in interdependency with grid operators. As electricity is a form of
energy which is difficult to store in large quantities small systems using small
affordable storage capacities (batteries, hydrogen, capacitors, CHP), if
sufficiently disseminated, can work as a large storage capacity and, with suitable
control schemes, to be controllable.
A generic DC bus based generation system is presented in Fig. 7. In this
architecture the most used renewable sources are wind and sun along with
batteries for storage and an inverter to interconnection to the grid. The loading is
mostly composed by AC loads either in the public grid or in a private grid
(mostly stand-alone), but also by DC loads.
There are also cases where generation source is fossil based, mostly based on
diesel generators but also natural gas [14],[44],[51],[55],[59]. The use of diesel
based generation is nowadays only relevant in particular cases where an absolute
availability of power is mandatory. The most used storage technologies are
batteries – mostly lead acid because of cost, but lately with predominance for Li-
Ion – followed by hydrogen. Storage is either directly connected to the DC bus
or connected through DC-DC converters. Hydrogen has the advantage over
batteries that it can be used to completion and does not need recharging
strategies to enlarge life cycle [58],[61] but suffers from slow dynamics that
must be complemented with batteries or ultra-capacitors therefore adding
complexity and cost to the system.

45
DC
Grid
Wind
PV
~~
H2
FC
H
Diesel
~
battery
hydrogen
supercapacitor
flywheel
Storage
AC load
AC load
AC
DC load
Sourcing
Loading
Fig. 7 - DG generic hybrid main subsystems
2.4 - New grid architectures
The insertion in the grid of a multitude of individual DG units can cause as
many problems as it may solve [65]. As the number of DG increases
Distribution Systems Operators (DSO) face serious difficulties in controlling
and managing this large number of elements along with the increasing
complexity of the grid protection functions [66]. The resultant complexity can
be solved by some form of aggregation and consequent autonomous control and
management that allows at presenting to the utility grid operator a single entity.
From the point of view of the grid operator something that is therefore more
manageable. There is an aggregation concept presently that is relevant to the
controllable DG’s: the microgrid. Due to the relevance of the approach of
microgrids in recent developments in the domain, an explanation of them is
done.
2.4.1 - Microgrid
The microgrid concept allows at alleviating the high number of DG by
physically aggregate physical components – generators and loads – and

46
treating them as a single and manageable entity with a single point of
connection to the utility grid. As such, this arrangement masks to the grid
operators a certain number of technical items that are managed and
controlled internally.
Microgrids are clusters of loads and generators grouped in physical small
grids where DG and loads are controlled in an integrated fashion with the
possibility of working connected to grid or in an islanded way. They
therefore enhance reliability of loads supply and are especially useful in
areas where the grid is weak. Fig. 8 presents an example of a microgrid.
In grid connected mode the power delivered is constant and in islanded
mode – typically during abnormal conditions of operation – DG are
controlled in such a way that maintains suitable active and reactive power,
voltage and frequency levels for the internal loads [66].
Fig. 8 – Microgrid example
In order to be capable of satisfying the mentioned requirements and in
the assumption of a high weight of renewable generation in the DG part,
storage capacity [67] is mandatory since the time response capabilities of
certain generators or the stochastic characteristics of others do not ensure a
proper energy balance [65]. The use of inverters to connect DG to the
microgrid implies a low inertia turning microgrids sensitive to disturbances
but they also allow a flexible operation of the sources [68].
There are presently two concepts for microgrids architectures: the
European MicroGrid and the American CERTS (Fig. 9, Fig. 10).

47
Fig. 9 – Microgrid EU concept
Fig. 10 – CERTS microgrid concept
The EU MicroGrid optimizes generation and schedule loads based on
forecast and energy prices, ensures satisfaction of the regulations of the
distribution system operator (DSO), coordinates the different actors inside
the microgrid and supervises islanded operation, load shedding and
reconnection issues as black start and resynchronisation [69]. In the
MicroGrid concept storage is implemented in a central unit whereas in the
CERTS concept each generator possesses its own storage unit [69].
The basic operation of the CERTS MicroGrid depends on the
Microsource Controller to regulate power flow, voltage at each microsource
interface and insure that each microsource rapidly picks up its share of the
load when the system islands. In addition the ability of the system to island
smoothly and to automatically reconnect to the bulk power system is another
important operational function. The Energy Manager provides for system
operation of the MicroGrid through dispatch of power and voltage set points
to each Microsource Controller. The protection coordinator must respond to
both system and MicroGrid faults [70].

48
2.4.2 - Technical challenges
The control of a microgrid must ensure a plug and play capability, fast
grid connection and disconnection, active and reactive power independent
control and dynamic capacity to serve the loads [71].
Microgrids in islanded mode must ensure control of voltage and
frequency of several internal generators, switching capabilities including
black-start and protection of loads, lines and generators [66].
3 - Conclusions
The spread of DG generation especially with stochastic renewable sources raises a
series of issues when interconnected to the grids. These issues calls for new approaches
to renewable generation based systems. Namely microgrid architectures that have been
developed, that demands for controlled renewable generation units. These ones suits
well the requirements of new functionalities for grids with a high level of renewable
power.
Architectures along with the hybridization of the renewable generation sources
overcome some issues, namely the reduction of the stochastic nature of the power
injected at the interconnection to the grid.
If the increase of renewable power is to be performed, the use of storage is
mandatory to face their stochastic nature and to be able to add value to the energy either
in tariff earnings either in services offered. The adoption of lead acid technology while
not being the best technical solution allows to implement the storage with a lower initial
investment cost.
These conclusions are the support to the work developed in the next chapter where
the dynamic behaviour analysis of a hybrid renewable generation system (HRES) is
performed. Its sources are wind and photovoltaic integrated into the same power system
which includes a storage capacity. The system to be analysed will allow at concluding
on the behaviour of the HRES not only in technical issues but also in economic ones,
the both present in the microgrid approach.

49
References
[1] P. Lund et all., “Connection of distributed generation – effect on the power system”, SINTEF
Energy Research, 2003 [2] E. Coster, J. Myrzik, W. Kling, “Effect of DG on distribution grid protection”, Eindhoven
university, Intech, 2010 [3] D Kondoleon et al., “Integration of Distributed Energy Resources. The CERTS microgrid
concept”, CERTS Program Office Lawrence Berkeley National Laboratory, 2003 [4] V. Thong, J. Driesen, “Distributed Generation and Power Quality – Case Study”, available online
at http://www.wiley.com/legacy/wileychi/powerquality/supp/case16.pdf [5] L. Hansen et al., “Conceptual survey of Generators and Power Electronics for Wind Turbines”,
Risø National Laboratory, Risø-R-1205, 2001, available online at http://130.226.56.153/rispubl/VEA/veapdf/ris-r-1205.pdf
[6] C. Nicolas et al., “Guidelines for the design and control of electrical generator systems for new grid connected wind turbine generators”, IEEE Industrial Electronics Society - IECON 02, 2002
[7] W. Kramer, S. Chakraborty, B. Kroposki, H. Thomas, “Advanced power electronic interfaces for distributed energy systems”, Technical Report NREL/TP-581-42672, 2008
[8] S. Chakraborty, B. Kramera, B Kroposki, “A review of power electronics interfaces for distributed energy systems towards achieving low-cost modular design”, Elsevier Renewable and Sustainable Energy Reviews 13, 2009
[9] C. Supriyadi et al., “Robust Pitch Controller Design in Hybrid Wind-Diesel Power Generation System”, IEEE Conference on Industrial Electronics and Applications, 2008
[10] M. Eltawil, Z., “Grid-connected photovoltaic power systems: Technical and potential problems–A review”, Elsevier Renewable and Sustainable Energy Reviews 14, 2010
[11] S. Khadem, M. Basu M. Conlon, “Power quality in grid connected renewable energy systems: Role of custom power devices”, International Conference on Renewable Energies and Power Quality – ICREPQ’10, 2010
[12] S. Kjaer, J. Pedersen, F. Blaabjerg, “A review of single-phase grid-connected inverters for photovoltaic modules”, IEEE Transactions on Industry Applications, 41, N. 5, 2005
[13] T. Zhou, “Control and Energy Management of a Hybrid Active Wind Generator including Energy Storage System with Super-capacitors and Hydrogen technologies for Microgrid Application”, PhD thesis Ecole Centrale de Lille, 2009
[14] O. Omari, E. Ortjohann, “An online control strategy for DC coupled hybrid power systems”, IEEE Power Engineering Society General Meeting, 2007
[15] C. Wang, H. Nehrir, F. Lin, J. Zhao, “From hybrid energy systems to microgrids: hybridization techniques, configuration and control”, IEEE Power and Energy Society General Meeting, 2010
[16] V. Azbe, R. Mihalic, “Distributed generation from renewable sources in an isolated DC network”, Elsevier Renewable Energy 31, 2006
[17] F. Jurado, “Robust control for fuel cell/microturbine hybrid power plant using biomass”, Elsevier Energy 30, 2005
[18] C. Hatziadoniu et al., “A simplified dynamic model of grid-connected fuel cell generator”, IEEE Transactions on Power Delivery, 2002
[19] R. Walawalkar, J. Apt, “Market Analysis of Emerging Electric Energy Storage Systems”, OE/NETL-2008/1330, 2008
[20] J. Barton, D. Infield, “Energy storage and its use with intermittent renewable energy”, IEEE Transactions on Energy Conversion, 9, 2004
[21] K. Divya, J. Østergaard, “Battery energy storage technology for power systems-An overview”, Elsevier Electric Power Systems Research 79, 2009
[22] C. Schwaegerl et al., “Advanced Architectures and Control Concepts for More Microgrids”, DG3&DG4 Report on the technical, social, economic, and environmental benefits provided by Microgrids on power system operation, 2009
[23] T. Tanabe et al., “Optimized operation and stabilization of microgrids with multiple energy resources “, 7th Internatonal Conference on Power Electronics ICPE '07, 2007
[24] H. Ibrahima, A. Ilincaa, J. Perron, “Energy storage systems—Characteristics and comparisons”, Elsevier Renewable and Sustainable Energy Reviews, 12, 2008
[25] M. Coleman et al., “State-of-Charge Determination From EMF Voltage Estimation: Using Impedance, terminal Voltage, and Current for Lead-Acid and Lithium-Ion Batteries”, IEEE Transactions on Industrial Electronics, 54, 5, 2007
50
[26] B. Bhangu, P. Bentley, D. Stone, C. Bingham, “Nonlinear Observers for Predicting State-of-Charge and State-of-Health of Lead-Acid Batteries for Hybrid-Electric Vehicles”, IEEE Transactions on Vehicular Technology, 54, 3, 2005
[27] S. Inage, “Prospects for large-scale energy storage in decarbonised power grids”, OECD/IEA, 2009, available online at http://www.iea.org/papers/2009/energy_storage.pdf
[28] J. Paska, P. Biczel, M. Klos, “Technical and Economic Aspects of Electricity Storage Systems Co-operating with Renewable Energy Sources”, 10th International Conference on Electrical Power Quality and Utilisation - EPQU 2009, 2009
[29] A. Kwasinski, P. Krein, “A Microgrid-based Telecom Power System using Modular multiple-input DC-DC converters”, Twenty-Seventh International Telecommunications Conference - INTELEC '05, 2005
[30] S. Kim et al., “Dynamic modelling and control of a grid-connected hybrid generation system with versatile power transfer”, IEEE Transactions on Industrial Electronics, 55, 2008
[31] P. Thounthong, S. Raël, B. Davat, “Control strategy of fuel cell and supercapacitors association for a distributed generation system”, IEEE Transactions on Industrial Electronics, 54, 6, 2007
[32] A. Hajizadeh, M. Golkar, “Intelligent power management strategy of hybrid distributed generation system”, Elsevier Electrical Power and Energy Systems 29, 2007
[33] L. Gao, Z. Jiang, R. Dougal, “An actively controlled fuel cell/battery hybrid to meet pulsed power demands”, Elsevier Journal of Power Sources 130, 2004
[34] K. Jeong, W. Lee, C. Kim, “Energy management strategies of fuel cell/battery hybrid system using fuzzy logics”, Elsevier Journal of Power Sources 145, 2005
[35] C. Hatziadoniu, A. Lobo, F. Pourboghrat, M. Daneshdoost, “A simplified dynamic model of grid-connected fuel cell generator”, IEEE Transactions on Power Delivery, 17, 2, 2002
[36] M. Tanrioven, M. Alam, “Modelling, control and power quality evaluation of a PEM fuel cell based power supply system for residential use”, IEEE Transactions on Industry Applications, 42, 6, 2006
[37] O. Onar, M. Uzunoglu, M. Alam, “Dynamic modelling, design and simulation of a wind/fuel cell/ultra-capacitor based hybrid power generation system”, Elsevier Journal of Power Sources 161, 2006
[38] P. Thounthong, S. Rael, B. Davat, “Control algorithm of fuel cell and batteries for distributed generation system”, IEEE Transactions on Energy Conversion, 23, 1, 2008
[39] K. Strunz, E. Brock, “Hybrid plant of renewable stochastic source and multi-level storage for emission-free deterministic power generation”, CIGRE/IEEE PES International Symposium Quality and Security of Electric Power Delivery Systems - CIGRE/PES 2003, 2003
[40] J. Wang et al., “Low cost fuel cell converter system for residential power generation”, IEEE Transactions on Power Electronics, 19, 5, 2004
[41] C. Wang, M. Nehrir, H. Gao, “Control of PEM fuel cell distributed generation system”, IEEE Transactions on Energy Conversion, 21, 2, 2006
[42] I. Ortjohann et al., “A simulation model for expandable hybrid power systems”, available online at http://www.otti.de/ipv/ipvabstracts/6.4ortjohann.pdf
[43] C. Wang et al., “From hybrid energy systems to microgrids: hybridization techniques, configuration and control”, IEEE Power and Energy Society General Meeting, 2010
[44] M. Ashari, C. Nayar, “An optimum dispatch strategy using set points for a photovoltaic-diesel-battery hybrid power system”, Pergamon Solar Energy, 66, 1, 1999
[45] F. Valenciaga, P. Puleston, “Supervisor control for a stand alone hybrid generation system using wind and photovoltaic energy”, IEEE Transactions on Energy Conversion, 20, 2, 2005
[46] L. Krichten, “Modelling and control of a hybrid renewable energy production unit”, ICGST- ACSE Journal, 7, 1, 2007
[47] P. Thounthoung, B. Davat, “DC bus voltage regulation supplied by fuel cell/supercapacitor hybrid source”, ECTI Transactions on Electrical Engineering, Electronics and Communications, 4, 2, 2006
[48] I. Hiskens, E. Fleming, “Control of inverter-connected sources in autonomous microgrids”, American Control Conference, 2008
[49] D. Yu, S. Yuvarajan, “Load sharing in a hybrid power system with a PV panel and a PEM fuel-cell”, Twenty-First Annual Applied Power Electronics Conference and Exposition - APEC '06. IEEE, 2006
[50] N. Cutululis et al., “Robust multi-model control of an autonomous wind power system”, Wiley Wind Energy, 9, 2006
[51] A. Al-Alawia, S. Al-Alawib, S. Islam, “Predictive control of an integrated PV-diesel water and power supply system using an artificial neural network”, Elsevier Renewable Energy 32, 2007

51
[52] F.Valenciaga et al., “Passivity/sliding mode control of a stand-alone hybrid generation system”, IEE Proceedings Control Theory and Applications, 2000
[53] F. Valenciaga, P. Puleston, P. Battaiotto, “Power control of a solar/wind generation system without wind measurement: a passivity sliding mode approach”, IEEE Transactions on Energy Conversion, 18, 4, 2003
[54] K. Reddy, V. Agarwal, “Utility-interactive hybrid distributed generation scheme with compensation feature”, IEEE Transactions on Energy Conversion, 22, 3, 2007
[55] Z. Chen, Y. Hu, “A hybrid generation system using variable speed wind turbines and diesel units”, [56] D. Bechrakis, E. McKeogh, P. Gallagher, “Simulation and operational assessment for a small
autonomous wind-hydrogen energy system”, 29th Annual Conference of the IEEE Industrial Electronics Society - IECON '03, 2003
[57] M. Kolhe, K. Agbossou, J. Hamelin, T. Bose, “Analytical model for predicting the performance of photovoltaic array coupled with a wind turbine in a stand-alone renewable energy system based on hydrogen”, Pergamon Renewable Energy 28, 2003
[58] D. Nelson, M. Nehrir, C. Wang, “Unit sizing and cost analysis of stand-alone hybrid wind/PV/fuel cell power generation systems”, Elsevier Renewable Energy, 31, 2006
[59] R. Dufo-Lopeza, J. Bernal-Agustina, J. Contreras, “Optimization of control strategies for stand alone renewable energy systems with hydrogen storage”, Elsevier Renewable Energy 32, 2007
[60] T. El-Shatter, M. Eskander, M. El-Hagry, “Energy flow and management of a hybrid wind/PV/fuel cell generation system”, Elsevier Energy Conversion and Management, 47, 2006
[61] T. El-Shatter, M. Eskandar, M. El-Hagry, “Hybrid PV/fuel cell system design and simulation”, Pergamon Renewable Energy, 27, 2002
[62] P. Ghosh et al., “Ten years of operational experience with hydrogen-based renewable energy supply system”, Elsevier Solar Energy, 75, 2003
[63] K. Agbossou, M. Kolhe, J. Hamelin, T. Bose, “Performance of a stand-alone renewable energy system based on energy storage as hydrogen”, IEEE Transactions on Energy Conversion, 19, 3, 2004
[64] Ø. Ulleberg, “The importance of control strategies in PV-hydrogen systems”, Elsevier Solar Energy, 76, 2004
[65] H. Jiayi, J. Chuanwena, X. Rong “A review on distributed energy resources and MicroGrid”, Elsevier Renewable and Sustainable Energy Reviews, 2008
[66] A. Salam, A. Mohamed, M. Hannan “Technical Challenges on Microgrids”, ARPN Journal of Engineering and Applied Sciences, 3, 2008
[67] M. Batic, A. Vitorovic, Ž. Despotovic, “The consideration of optimal control algorithms for hybrid renewable energy systems”, XVI International Conference YU INFO, 2010 available online at http://www.institutepupin.com/RnDProfile/robotics/pdf/despotovic-publ_37.pdf
[68] E. Barklund et al., “Energy Management in Autonomous Microgrid Using Stability-Constrained Droop Control of Inverters”, IEEE Transactions on Power Electronics, 23, 2008
[69] B. Awad, J. Wu, N. Jenkins, “Control of distributed generation”, Elektrotechnik & Informationstechnik 25/12: 409–414. DOI 10.1007/s00502-008-0591-3, 2008
[70] R. Lasseter et al., “Integration of distributed energy resources. The CERTS Microgrid Concept”, Lawrence Berkeley National Laboratory, 2002, available online at http://escholarship.org/uc/item/9w88z7z1
[71] R. Lasseter, P. Paigi, “Microgrid: A Conceptual Solution”, IEEE 35th Annual Power Electronics Specialists Conference - PESC 04, 2004

52

53
Chap. III – Renewable sources integration
The proposed hybrid renewable sources based system is composed by two renewable
generation sources – wind generator and photovoltaic panels – a storage system –
batteries – and loading through a grid connection (Fig.1). The integration of the various
modules is made through a DC bus.
DC
~Wind
PV
Battery
Grid
Fig.1 - Hybrid system architecture
The objective is to attain a controllable and deterministic power delivery in view of
overcoming the variability of the renewable sources. Fig. 2 depicts the profile of the sum
of the power of the two renewable energy sources, wind and sun. If these sources are
directly connected to a load (grid) the power injected at the common connection point
would consist in power spikes, due to the wind, in the top of a bell shaped power, due to
the sun. The sudden power changes of the spikes interfere with power regulation and the
power distribution density of the sun does not coincide with the general load profile of a
grid. It is supposed that the injected power value is relatively high in relation with the
power at the point of connection such as it can cause interference. Fig. 3 shows the power
delivered to the load (grid) after being processed by the HRES. In the case it presents to
the point of connection not only constant power for a well-defined time periods but also a
known and pre-determined power profile.

54
Fig. 2 – Uncontrolled wind and sun power
injection
Fig. 3 – HRES controlled wind and sun power
injection
The remainder of the chapter deals with the definition of the hybrid system simulation
model that allows assessing the validity of the HRES objectives. The system is separated
in relevant units and adequate models to assess its behaviour are built. Control and
operation strategies for the system as a whole are defined and tested and conclusions are
taken. The simulations are based on real wind and sun radiation input values. The
development of such a system will bring an added economic value to the generated power
which is also analysed.
1. Hybrid system elements modeling
1.1. Wind source
The wind generator subsystem is composed of a turbine, a permanent magnet
synchronous generator (PMSG), a rectifier and a DC-DC converter (Fig. 4). It should
be noticed that usually small wind generators have the rectifier in the nacelle in order
to save wire (three wires in three phases AC to two in DC) and reduce the number of
slip-rings (three to two).
turbine
generator
rectifier
converter
DC bus
Fig. 4 - Wind generator components

55
1.1.1. Wind turbine
The power captured from the wind by the turbine is a mechanical power
represented by:
( )θλρ ,21 3
pwm CAvP = (1)
where ρ [kg/m3] is the air density, A [m2] is the blades surface, wv [m/s] is the
wind speed and pC is the turbine power coefficient that is related with the
fraction of wind power that is possible to capture by the particular mechanical
configuration of the wind turbine. The specific mechanical characteristics are
represented by the blade pitch angle θ and the tip speed ratioλ , defined as:
wv
Rωλ = (2)
where ω [rad/s] is the mechanical angular speed and R [m] is the length of the
blades. The control of a wind turbine is usually accomplished through the control
of the tip speed ratio what implies the control of the rotational speed according to
the linear velocity of the wind. The rotational speed is in turn a function of the
equilibrium between the “motor” torque (turbine) and the “load” torque (electrical
generator). The power coefficient of a turbine is a parameter that is difficult to get
and is usually obtained by tabular methods (that supposes knowledge of all
mechanical characteristics parameters) or by polynomials (obtained through non-
linear interpolation methods). Typical curves that express the relation between
output power and rotational speed for different linear wind speeds is shown in
Fig. 5.
The relation between torque and angular speed is obtained through the known
relation:
ωmm TP = (3)
with P [W] the power and T [Nm] the torque.

56
The torque in conjunction with the masses of the turbine and generator results
in an angular speed given in a simplified form by:
( )∫ ⋅−−= dtFTTJ mem ωω 1
(4)
where J [kg/m2] is the moment of inertia1 of the rotational parts, mT [Nm] is
the turbine torque, eT [Nm] is a resistant torque and F the friction associated to
rotating components. In the studied case the electromagnetic torque (eT ) is easily
established as a function of the current that results from the application of the
output voltage to a load.
ω
P
v
12.5 m/s
11 m/s9.5 m/s8 m/s
Fig. 5 - Turbine power variation with wind speed (dash-point line is the locus of maximum
power for various wind speeds)
1.1.2. Electrical generator
The resulting torque is applied to the axle of an generator that produces an
electrical output which, in the case of a permanent magnet synchronous generator,
is characterized by output voltage and frequency variable with the wind speed.
Modelling of the PMSG can be done by the d-q theory [1]:
ses
sss jdt
dRiv Ψ+Ψ+=− ω (5)
( )( )dqqdqPMe iiLLipT ⋅−+Φ= 5.1 (6)
1 The used value of moment of inertia was obtained through local experimentation of a Bergey XL.1 wind generator

57
with,
( )mmem FTT
Jdt
d ωω −−= 1 (7)
relating the angular speed with the system masses, the angular forces and the
friction,
mm
dt
d ωθ = (8)
relating the angular position and the angular speed,
me pωω = (9)
relating the electrical and mechanical angular speed through the number of
poles
Using space vector variables, equation 5 becomes:
qds jvvv += (10)
qds jΨ+Ψ=Ψ (11)
ddPMd iL+Φ=Ψ (12)
qqq iL=Ψ (13)
qds jiii += (14)
the PMSG dynamic equations are given by:
( )qeqdsdd
d iLiRVLdt
di ω+−= 1 (15)
( )ePMdedqsqq
q iLiRVLdt
diωω Φ−−−= 1
(16)
where sv [V], si [A] and sΨ [Wb] are the phase voltage, current and flux
linkage respectively, mω and eω [rad/s] are the mechanical and electrical angular
speeds, mT and eT [Nm] are the mechanical and electrical torques, mθ [rad] is the

58
mechanical position angle, di [A], dv [V], dΨ [Wb] and dL [H] are the d-axis
current, voltage, flux linkage and inductance and qi [A], qv [V], qΨ [Wb] and
qL [H] are the q-axis current, voltage flux linkage and inductance, PMΦ [Wb] is
the permanent magnet flux linkage, sR [Ω] is the phase resistance, J [kg.m2] is the
moment of inertia, F [Nm/rad.s] the viscosity friction and p is the number of
pairs of poles.
1.1.3. Rectifier
Wind turbines with synchronous generators have their three phase voltage and
frequency dependant on the wind speed. Such small wind turbines usually have
their generator output applied to an uncontrolled rectifier in order to reduce the
number of mechanical switches and connection cables. In a generated power
perspective the difference is not a major concern as the diode losses are minor
than semiconductors losses in controlled rectifiers.
i1i2i3
v0
i0
~~
~
v1v2
v3
Fig. 6 - Three-phase uncontrolled rectifier
In this case, resulting output voltage can be represented by a DC and ripple
components [2]:
mVVπ
330 = (17)
( )∑∞
= −−=
120 6cos
136
233~k
m tkk
Vv ωπ
(18)
where Vm is the amplitude of vi:
( )tVv m ωcos1 = ,
−=3
2cos2
πωtVv m ,
−=3
4cos3
πωtVv m (19)

59
1.1.4. DC-DC converter
In order to control the operating electrical characteristics of the wind
generator to achieve power control, namely maximum power extraction, a DC-DC
converter is used. The DC-DC converter allows at presenting to the wind
generator a controlled equivalent resistance. As the resistance seen by the
generator influences electrical output power, and in consequence turbine
rotational speed, it is therefore able to change its operating point thus allowing at
optimizing turbine power coefficient by choosing optimal operational tip ratio and
therefore to extract the maximum available wind power.
C
L
vi v0
iL
iC
i0
Fig. 7 - booster DC-DC converter
In the case of a booster converter,
iVD
V−
=1
10 (20)
where Vi [V] and V0 [V] are the average voltages of input and output
respectively and D is the duty factor of the PWM wave applied to the converter
semiconductor switch.
Supposing a constant output load (Ro) the DC-DC converter is able to present
to the wind generator output an equivalent resistance (Ri):
oo
o
o
o
i
ii RD
I
VD
D
IVD
I
VR 2
2
)1()1(
)1(
)1( −=−=
−
−== (21)
1.2. Photovoltaic source
1.2.1. Photovoltaic generator

60
The sun subsystem is composed of a photovoltaic panel connected to a DC
bus trough a DC-DC booster converter. As in the wind generator the role of the
converter is to dynamically change the operating point of the photovoltaic panel
in order to extract the maximum available power from the sun and injecting it into
a regulated voltage DC bus.
photovoltaic
converter
DC bus
Fig. 8 - Photovoltaic generator subsystem components
There are several models to represent photovoltaic panels, being the most
usual the one based on either single or double diode [3].
For the scope of this thesis a single diode model (Fig. 9) is adopted which
characteristics model the panel behaviour as an individual power source. The
relation between current and voltage is [4]:
( )
SH
SAKT
IRVe
rsph R
IRVeIII
S
000 1
00 +−
−−=
+
(22)
where I0 [A] is the output (load) current, Iph [A] is the photovoltaic generated
current, Irs [A] is the diode reverse saturation current, V0 [V] is the panel terminal
voltage, RS [Ω] is the series resistance, RSH [Ω] is the shunt resistance, e [C] is the
electron charge (1.6x10⁻¹⁹), T [K] is the cell temperature, K [J/K] the Boltzmann
constant (1.38x10⁻²³) and A is a factor representing the diode quality (1-2).
As the shunt resistance is much higher than the series resistance the second
term of the equation can be eliminated.
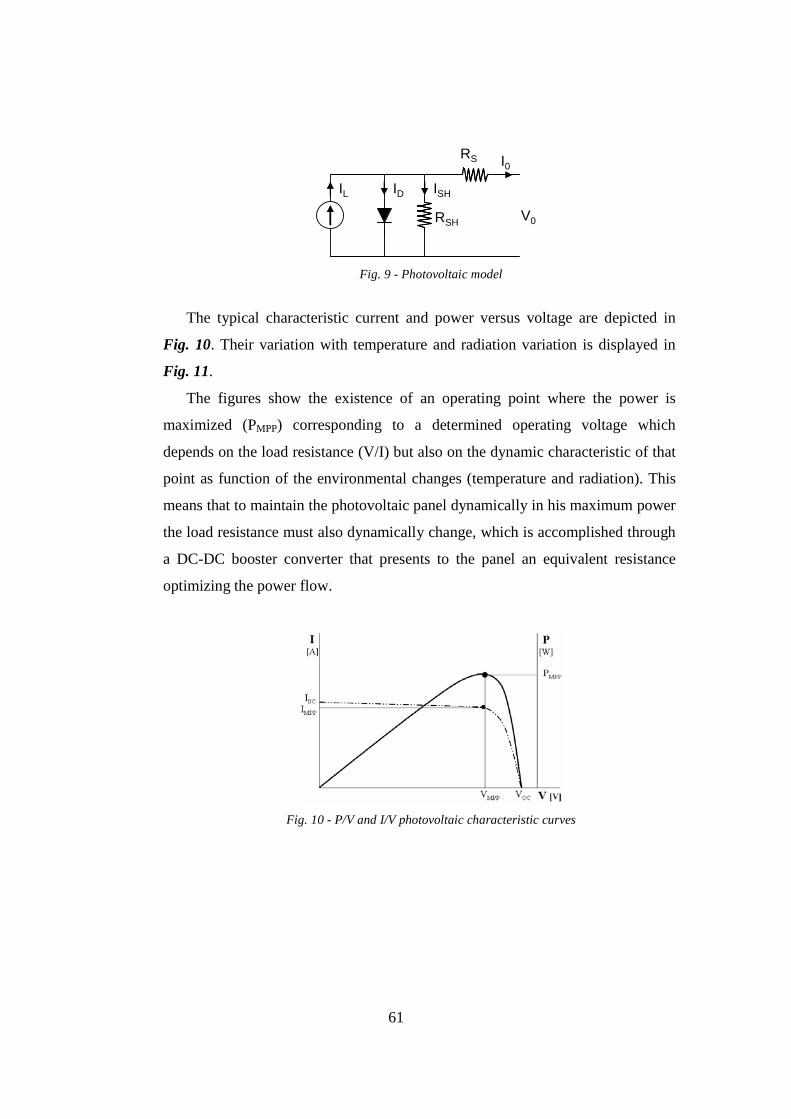
61
RSH
RS
ID ISH
I0
V0
IL
Fig. 9 - Photovoltaic model
The typical characteristic current and power versus voltage are depicted in
Fig. 10. Their variation with temperature and radiation variation is displayed in
Fig. 11.
The figures show the existence of an operating point where the power is
maximized (PMPP) corresponding to a determined operating voltage which
depends on the load resistance (V/I) but also on the dynamic characteristic of that
point as function of the environmental changes (temperature and radiation). This
means that to maintain the photovoltaic panel dynamically in his maximum power
the load resistance must also dynamically change, which is accomplished through
a DC-DC booster converter that presents to the panel an equivalent resistance
optimizing the power flow.
Fig. 10 - P/V and I/V photovoltaic characteristic curves

62
Fig. 11 - P/V curves in function of temperature and radiation variations
Equation 21 can also be presented as [5]:
( )11
21 −−=mVK
sc eKII (23)
with:
01175.01 =K (24)
mocV
KK 4
2 = (25)
( )
−+=
sc
mppsc
IK
IKIK
1
13
1ln (26)
+=1
14
1ln
K
KK (27)
oc
mpp
V
VK
K
m
ln
ln4
3
= (28)
Where Impp [A] and Vmpp [V] are the current and voltage at the maximum
power, Isc [A] is the short circuit current and Voc [V] is the open-circuit voltage.
Manufacturers provide characteristic parameters under standard test
conditions (STC) with a radiation of 1000 W/m2, temperature of 25ºC and an air
mass2 of 1.5. Therefore adaptation of the Equation 22 must be made to adapt
photovoltaic panels to changing radiation and temperature which is made through
2 Angle the sun makes with the perpendicular to the earth surface (AM = 1.5 corresponds to an angle of 48.2º)

63
short-circuit current temperature coefficient (α [A/ºC]) and open-circuit voltage
temperature coefficient (β [V/ºC]).
ccrefref
IX
XT
X
XI
−+∆
=∆ 1α (29)
IRTV S∆−∆−=∆ β (30)
Cell operating temperature (TC) [ºC] can be extracted from actual ambient
temperature (Ta) [ºC] and from values of normal operating cell temperature
(NOCT) provided by the manufacturer:
( )faNOCTaC TTG
TT Re,800−+= (31)
where Ta,Ref [ºC] is the temperature used to specify NOCT and G [W/m2] is the
actual radiation. The NOCT is defined as the temperature reached by open circuit
cell with 800 W/m2, air temperature of 20ºC, 1 m/s wind speed and open back
side of the cell. This parameter aims to adapt a model to operating conditions that
are different from the STC conditions (25ºC for 1000 W/m2).
The effect of actual operating conditions is then computed as a new value of
voltage and current for equation 22 as:
VVV STC ∆+=' (32)
III STC ∆+=' (33)
where
STCSCSTC
STCC
STC
IG
GGT
G
GI ,
−+∆=∆ α (34)
IRTV SC ∆−∆−=∆ β (35)
STCCC TTT −=∆ (36)

64
1.2.2. DC-DC converter
In order to control the operating electrical characteristics of the photovoltaic
generator to achieve power control, namely maximum power extraction, a DC-DC
converter is used. The DC-DC converter allows at changing the load resistance as
seen by the photovoltaic panel as referred in section 1.1.4 and is depicted in Fig.
12.
oR
1
( )i
o
RR
D =− 21
MPP
V
I
P
Fig. 12 - Effect on photovoltaic equivalent load in function of converter duty change
This way and considering a constant load, the operating point of the
photovoltaic panel can be changed in response to changing environmental
conditions in order to operate as to generate the maximum power.
1.3. Grid connection
The grid connection can be implemented by a voltage source inverter, also
responsible to regulate the DC bus voltage, as depicted in Fig. 13. The role of the
several elements is described in the following sections.
Inverter Filter
DC bus Grid
Fig. 13 - Grid connection through inverter and filter
As the inverter is supplying a grid which is a regulated voltage source its
operation is identical to a controlled rectifier, operating in the second quadrant, which

65
regulates the input DC bus voltage. This operating characteristic is important in the
development of this thesis. For these conditions, to control the generated power to be
injected into the grid means to control the power injected into the DC bus, controlling
the several power flows of system components connected to it.
As the key proposal of the thesis is to control the different power flows,
controlling the power that the HRES puts available in the DC bus, no further research
is made on the inverter operation.
1.3.1. Inverter
The inverter is modelled by equivalent average equations where the voltages
are obtained through the DC bus voltage and the average current from the line
currents [6],[7],[8].
Liinv
DCvinv
imi
vmv
⋅=⋅=
(37)
where mx is the inverter command (modulation index). As the grid is a voltage
source, the power flow is regulated controlling iL.
vdc
iaib
ic
vanvbnvcn
0vdc
iaib
ic
vanvbnvcn
vdc
iaib
ic
vanvbnvcn
0
Fig. 14 - Three phase inverter
The inverter output voltages are given by:
[ ] ( )dccabcab vfvvv =,, (38)
and the resulting currents are:
[ ]( )Tcbadc iiifi ,,= (39)

66
Where f is a transfer function related to the switching functions of six switches
(S) of the inverter, resulting from the comparison of a triangular wave with a
sinusoid representing the desired sinusoidal output voltage (control voltage):
[ ]cSbSaSV ffff 111 ,,= and [ ]cSbSaSI ffff 222 ,,= (40)
The resulting voltages are then:
aSdc
a fv
v 10 2= , bS
dca f
vv 10 2
= , cSdc
a fv
v 10 2= (41)
where “0” is the reference point and fS1x is the result of the comparison of the
magnitude of the control signal with the triangular signal.
From the voltage to reference voltages the line-line voltages are computed as:
00 baab vvv −= , 00 cbbc vvv −= , 00 acca vvv −= (42)
The phase voltages are then:
00 naan vvv −= , 00 nbbn vvv −= , 00 nccn vvv −= (43)
and the currents are:
z
vi ana = ,
z
vi bnb = ,
z
vi cnc = (44)
where z is the impedance seen by the inverter.
The DC current is then computed as:
cScbSbaSadc fififii 222 ++= (45)
Expression (45) shows that the three-phase currents injected in the grid are a
function of the DC current supplying a DC load.
The assumptions made in 1.3 along with the expression (45) supports the
analysis of power flows at the DC bus only.

67
1.3.2. Filter
In order to model the connection of the voltage source inverter to the grid it is
used the following expression:
( ) LLgridinvL irvv
dt
diL −−= (46)
where iL is the line current, L [H] and rL [Ω] are the line inductance and
resistance used to connect the inverter voltage (vinv) to the grid voltage (vgrid).
In state space form:
[ ] LLgridinvL irvv
dt
diL −−
−−
=21
12
3
1 (47)
1.4. DC bus
The expression of the DC bus voltage for the hybrid system given by:
∫= dtIC
v Cbus
bus
1 (48)
where IC [A] is the current through the capacitor resulting from the current
contributions of the various elements,
BBInvEolPVC IIIII ±−+= (49)
with IPV the current of the photovoltaic generator, IEol the current of the wind
generator, IInv the current to the inverter and IBB the current to or from the battery
bank.
1.5. Storage system
The storage system is responsible to deliver power when the combined wind and
photovoltaic are insufficient to satisfy the programmed load or to store it in the
inverse case (excess of renewable power).
The used energy storage is based on electrochemical technology, specifically
lead-acid batteries.

68
There are several models for batteries [9],[10],[11],[12]. The model used is based
on a simple model and considers initial and maximum SOC (State Of Charge) that
indicates the available energy, efficiency of the energy charge and discharge and the
self discharge rate [13], as it is accurate enough for the goals of this thesis. The model
of the battery represents a voltage source in series with a resistance (Fig. 15) which
values depend on the specific operation at every time (charge and discharge over
time) and presents to the exterior a voltage Vbat.
R
V Vbat
Ibat
Fig. 15 - Battery model
The state of charge of the battery is defined as the percentage of the actual
capacity to its nominal capacity. This expression does not take in account the
degradation of the battery due to its age and conditions of use usually expressed in
terms of State of Health (SOH).
Qn
QSOC= (50)
where Q [Wh] is the battery capacity and Qn is the nominal capacity.
During the operation of the battery the values of its internal resistance (R) and
internal voltage (V) change. Therefore the equations used to reflect these dynamic
characteristics in the battery model are:
( ) Sech nkV ×+= 148.02arg (51)
( ) Sedisch nkV 124.0926.1arg += (52)

69
Sech nSOC
kR ×
−+
=max
arg06.11309.0
758.0 (53)
Sedisch nSOC
kR ×
−+
=max
arg14.0
1037.019.0
(54)
maxSOC
SOCk = (55)
where Sn is the number of 2 V cells and maxSOC [%] is the maximum capacity of
the used battery.
The battery voltage at a given instant is therefore:
cdbatcdbat RIVV += (56)
where the index cd represents charge or discharge depending on the particular
situation and Ibat is negative if the battery is discharging.
The instantaneous value of the SOC is given by:
( ) ( ) ( ) ( )236003600 batcdbatbat IRIVtsd
tSOCttSOC −+∆−=∆+ ε (57)
where ε is the charge/discharge efficiency and sd [h-1] is the self discharge rate.
1.6. DC-DC converters
There are two types of DC-DC converter used in the hybrid system: a booster for
control of sources and discharge of stored energy and a buck for storing energy. The
modeling is made considering the two possible states of the switch (On and OFF) and
averaging them by duty factor times.
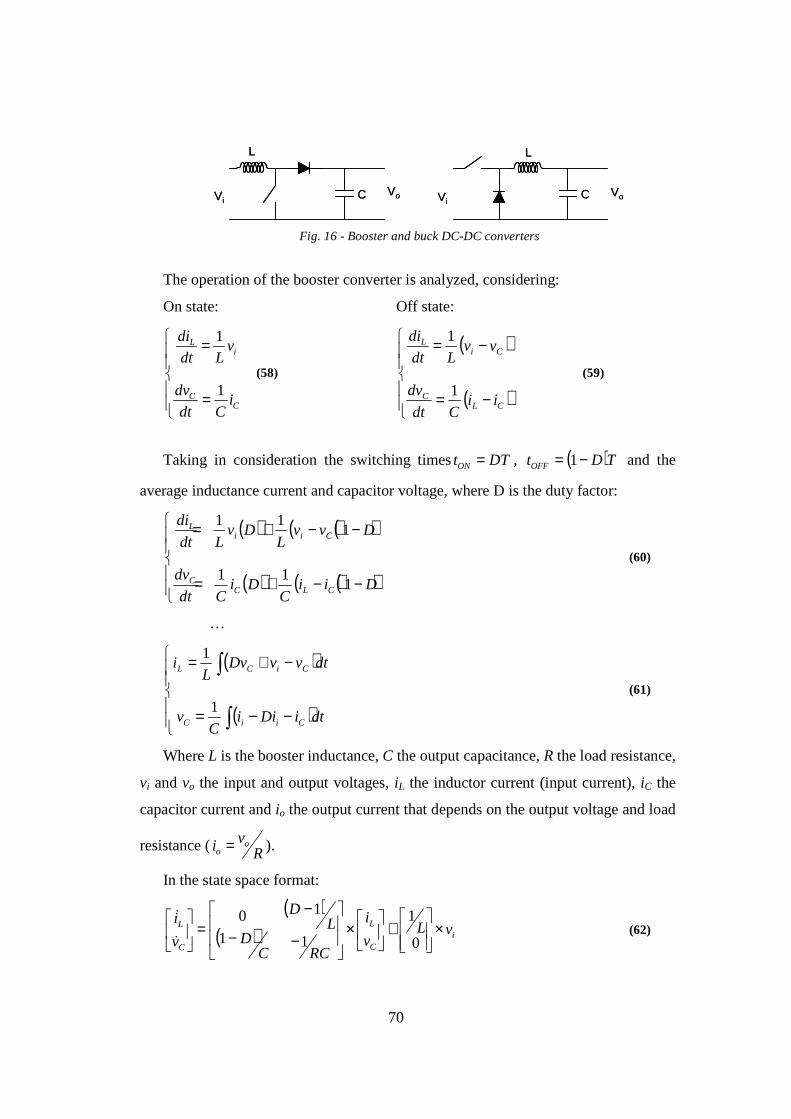
70
L
CViVo
L
CViVo
L
CViVo
L
CViVo
Fig. 16 - Booster and buck DC-DC converters
The operation of the booster converter is analyzed, considering:
On state: Off state:
=
=
CC
iL
iCdt
dv
vLdt
di
1
1
(58)
( )
( )
−=
−=
CLC
CiL
iiCdt
dv
vvLdt
di
1
1
(59)
Taking in consideration the switching times DTtON = , ( )TDtOFF −= 1 and the
average inductance current and capacitor voltage, where D is the duty factor:
( ) ( )( )
( ) ( )( )
−−+=
−−+=
DiiC
DiCdt
dv
DvvL
DvLdt
di
CLCC
CiiL
111
111
(60)
…
( )
( )
−−=
−+=
∫
∫
dtiDiiC
v
dtvvDvL
i
CiiC
CiCL
1
1
(61)
Where L is the booster inductance, C the output capacitance, R the load resistance,
vi and vo the input and output voltages, iL the inductor current (input current), iC the
capacitor current and io the output current that depends on the output voltage and load
resistance ( Rvi o
o = ).
In the state space format:
( )( ) i
C
L
C
L vLv
i
RCCD
LD
v
i×
+
×
−−
−=
0
1
11
10
&
&
(62)

71
Considering the duty factor as the control input of the booster converter the
transfer function may be expressed as [14]:
(63)
The operation of the buck converter is analyzed, considering:
On state: Off state
( )
=
−=
CC
CiL
iCdt
dv
vvLdt
di
1
1
(64)
( )
=
−=
CC
CL
iCdt
dv
vLdt
di
1
1
(65)
Taking in consideration the switching times DTtON = , ( )TDtOFF −= 1 :
( )
( )
−=
−=
∫
∫
dtiiC
v
dtvDvL
i
oLC
CiL
1
1
(66)
In the state space format:
DvLv
i
RCC
Lv
ii
C
L
C
L ×
+
×
−=
0
1
11
10
&
&
(67)
2. Control characteristics
2.1. Individual control of operating point for each source
2.1.1. Maximum power extraction
Most generators exhibit a non-linear characteristic with their power curve
presenting normally a somehow bell shape. Furthermore renewable energy based
generators are subjected to climatic changes (wind speed in wind generator and
radiation and temperature in photovoltaic) that result in changes in their operating

72
points. Therefore a dynamic seeking of maximum power through time is needed
in order to achieve the best economic efficiency.
2.1.1.1.Wind generation
Wind generators have a non-linear power characteristic (Fig. 5) and their
maximum power changes with the wind speed. The global objective is to
develop a control method that does not require measurement of wind speed
(sensorless system) either directly with an anemometer or indirectly through
rotor speed or frequency measurement and that it is independent from the
system characteristics. Several methods to achieve maximum power
extraction are reported in the literature such as Tip Speed Ratio (TSR), Hill
Climbing (HC), Artificial Neural Networks (ANN), Fuzzy logic and others
[5],[15],[16],[17],[18]. From these alternatives, fuzzy control method is
adopted as it presents the advantages of not needing an accurate model of the
controlled system, of using control rules based on linguistic description (easier
tuning) and of having a non-linear and adaptive operation mode which gives it
a robust performance under input and output variations [19].
As the hybrid renewable based system is a small system with concerns
about the investment cost, it is decided to take the DC output of the wind
generator as input to the DC-DC converter. This strategy avoids the addition
of mechanical slip-rings to transfer the three phase PMSG voltage lines from
the moving part of the wind generator to the fixed one or the use of additional
sensors to get control conditions as wind speed sensors.
The control of the wind generator to achieve maximum power extraction
is therefore made through the controlled operation of a booster DC-DC
converter. As the mechanical time constant is much higher than the converter
time constant there is a lag between the electrical and mechanical power and
since the converter output is essentially capacitive, having a response as the
shape showed in Fig. 17.
This behaviour restrains the control, as the smooth relation between the
mechanical power and angular speed is lost (dashed line). Instead, what the

73
controller sees is a sharp increase, followed by a smooth decrease of power
over the time (solid line). The Maximum electric Power Point Tracking
(MePPT) control mechanism has, therefore, to wait for a new equilibrium
point for the electric power, after a change in system conditions caused by
changes of duty factor in the DC-DC converter, before deciding to increase or
decrease the duty factor. After reaching this point, the fuzzy controller
computes the next duty factor for the converter PWM controller.
The equilibrium point is determined by the slope of the electric power
through time (∆P/∆t). When the slope reaches a minimum value it generates a
clock impulse that activates the fuzzy control computation of the new duty
factor. Fig. 18 presents the blocks of the controller. The value of this
minimum slope determines the stability and the speed of convergence – such
high the minimum slope, higher is the speed of convergence to the MPP but it
also results in some oscillation in the convergence process. The fuzzy
controller takes the change in power and voltage to compute the duty factor of
the PWM for the DC-DC booster converter (Fig. 19). Fuzzy rules are shown
in Fig. 20.
Fig. 17 – Different time responses for mechanical and electrical (booster output) parts
Fig. 18 – MePPT for the wind generator

74
Fig. 19 – MPPT and the change in power and voltage
Fig. 20 - Fuzzy rules for MePPT
The operation of the MePPT is inherently slow, as it must wait for the
settling of power, which is dependent on inertia. Therefore, the MePPT will
only work efficiently in sites with low turbulence in the wind. It produces
nevertheless an improvement in the operation of the generator with a fixed
operating point and an improvement in the start-up, where the operating point
can be very far from the MPP.
2.1.1.2.Sun generation
Photovoltaic generators present a non-linear output characteristic (Fig.
10). Their maximum power point location changes with radiation and
temperature changes. Therefore, if the operating characteristics remain fixed
the power extracted from them will be lower than the maximum attainable.
This behaviour implies a dynamic seeking of maximum power facing to
changing environmental conditions. Several methods to achieve maximum
power extraction from photovoltaic sources are reported: Hill climbing,
Perturb and Observe (P&O), Incremental Conductance (IncCond), Fractional
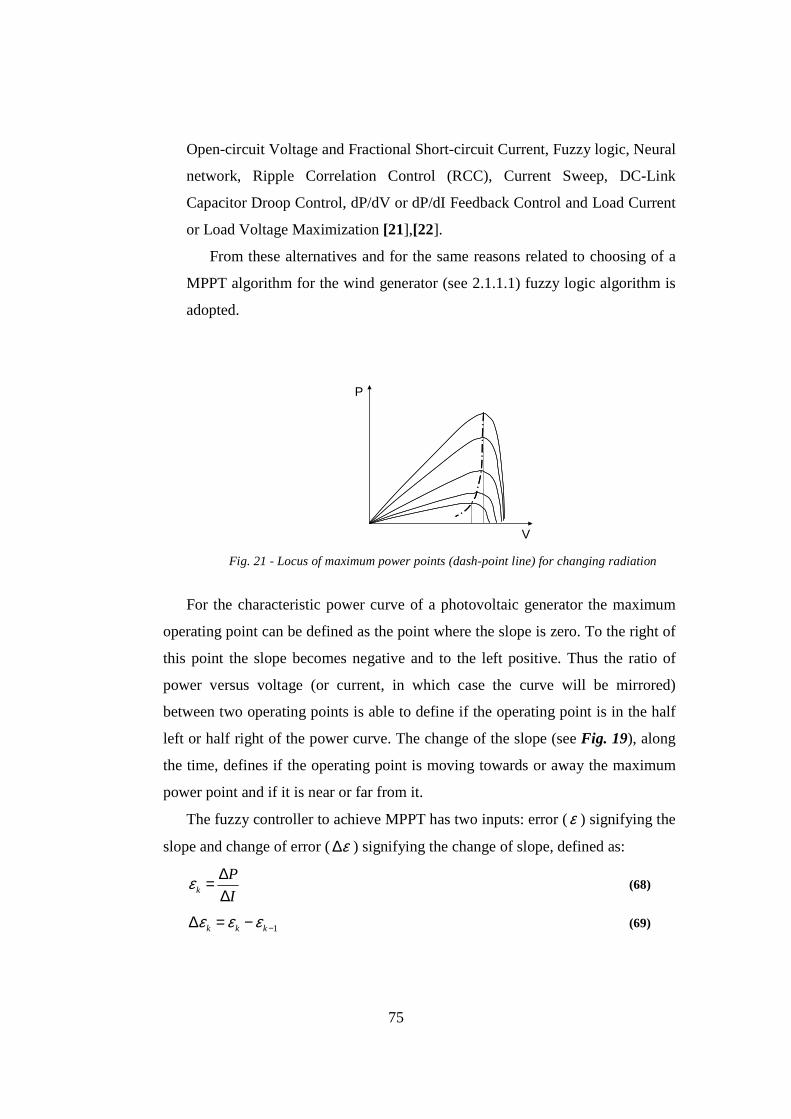
75
Open-circuit Voltage and Fractional Short-circuit Current, Fuzzy logic, Neural
network, Ripple Correlation Control (RCC), Current Sweep, DC-Link
Capacitor Droop Control, dP/dV or dP/dI Feedback Control and Load Current
or Load Voltage Maximization [21],[22].
From these alternatives and for the same reasons related to choosing of a
MPPT algorithm for the wind generator (see 2.1.1.1) fuzzy logic algorithm is
adopted.
P
V Fig. 21 - Locus of maximum power points (dash-point line) for changing radiation
For the characteristic power curve of a photovoltaic generator the maximum
operating point can be defined as the point where the slope is zero. To the right of
this point the slope becomes negative and to the left positive. Thus the ratio of
power versus voltage (or current, in which case the curve will be mirrored)
between two operating points is able to define if the operating point is in the half
left or half right of the power curve. The change of the slope (see Fig. 19), along
the time, defines if the operating point is moving towards or away the maximum
power point and if it is near or far from it.
The fuzzy controller to achieve MPPT has two inputs: error (ε ) signifying the
slope and change of error (ε∆ ) signifying the change of slope, defined as:
I
Pk ∆
∆=ε (68)
1−−=∆ kkk εεε (69)

76
and one output (D ), the PWM duty factor controlling the DC-DC converter.
The change of the duty factor will change the operating point and the resultant
set of voltage and current is obtained. The controller compares the new point
against the former one and through the analysis of ε and ε∆ values
decrements/increments the duty factor such as the operating point approaches the
maximum. The controller implements this algorithm with the fuzzy rules
presented in Table 1.
The rules used in the controller design are:
Z Z NS PS PBZ Z Z PS PB
NB NS Z PS PBNB NS Z Z ZNB NS PS Z Z
ε
∆ε
NB NS Z PS PB
Z
Z
NB
NB
NB
NBNSZPSPB
NBNSZPSPB
Table 1 – PV fuzzy rules
2.1.2. DC bus power regulation
The power equilibrium between renewable sources generation and load
consumption is a condition for system stability. So the excess of power generated
must be withdrawn and deficit power must be provided such as a constant power
to the load is ensured even if the renewable power is floating.
The power difference is managed through the storage battery using two DC-
DC converters connecting the battery to the DC bus to allow the bidirectional
power transfer. A booster converter is used to provide power to the bus and a
buck converter to store power from the bus, each of them working independently
but exclusively. Although other topologies could be used (as Sepick or buck-
booster) it is found that modularity is best served this way because in the eventual
failure of one the remainder could continue to operate. Since the system is
dependent of the power equilibrium through the battery regulation, this
architecture allows it to remain working subjected obviously to restrictions (for
instance, if the charging module is out of service only in situations where load is
higher than generation the system could remain in operation).

77
The power flow regulation is ensured by two proportional-integral (PI)
controllers, one for each battery connected converter.
A digital PI controller is governed by the expression:
[ ] [ ] [ ]∑=
+=k
iIP ieTKkeKku
0
(70)
where u[k] is the control variable – the duty factor of one of the two battery
connection converters – and e[k] is the error between actual bus voltage and its
reference. k is the discrete time, T the sampling period and KP and KI the
proportional and integral gains respectively.
As the imbalance between generated and consumed power increases, the error
between reference and actual bus voltage also increases too. The use of this error
into the PI controller makes the duty factor of the concerned converter to rise as
faster as the error is larger, subjected to the proportional and integral gains, and
therefore to compensate the power imbalance.
2.2. Global supervisor
While there are several units independently controlled they have to be globally
managed in order to operate the system towards a certain objective and in an
integrated form. The HRES needs therefore to include a global supervisor to
guarantee renewable sources maximum power and storage-bus power flow
interactions to keep dynamic stability of the bus and to provide a controlled power to
the load.
The supervisor role is to proceed to the sampling of the different values at a
defined time period, compute controller’s values and to command each one. It is also
its responsibility to avoid inadmissible stresses over the units as battery currents and
electronic switches. Finally it takes operation decisions subordinated to some defined
operation strategy as for instance to supply or not the load or the amount of power to
be delivered.
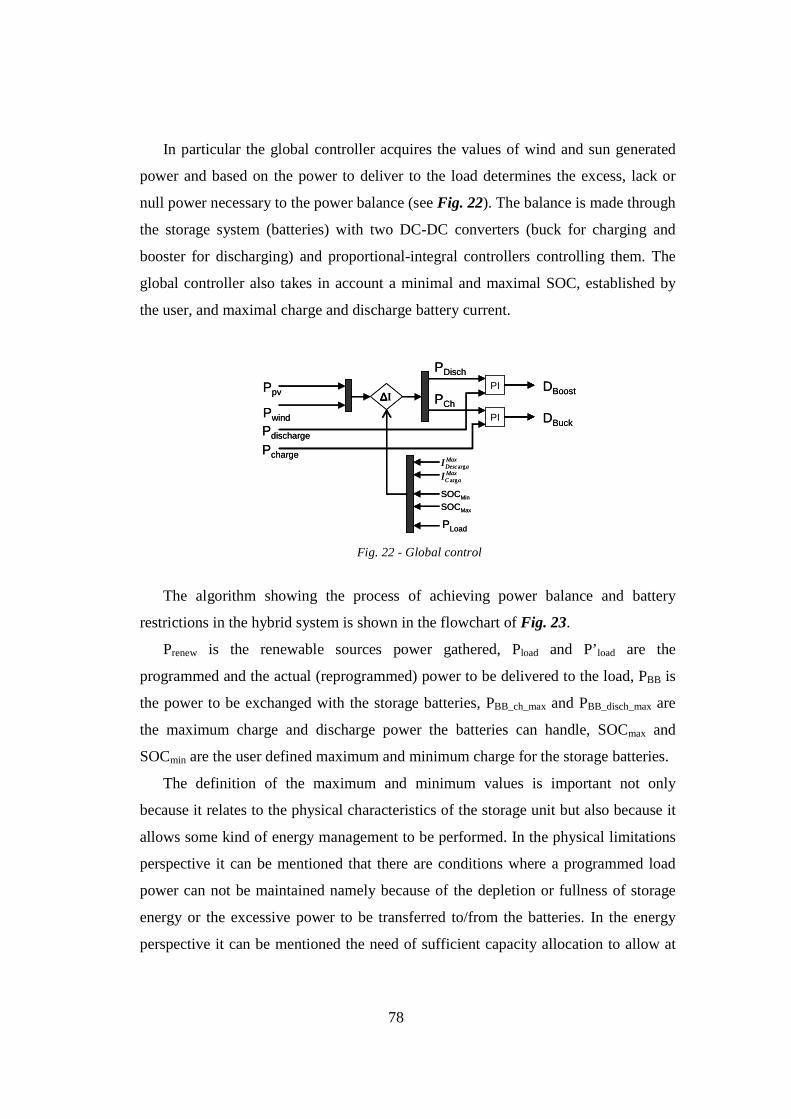
78
In particular the global controller acquires the values of wind and sun generated
power and based on the power to deliver to the load determines the excess, lack or
null power necessary to the power balance (see Fig. 22). The balance is made through
the storage system (batteries) with two DC-DC converters (buck for charging and
booster for discharging) and proportional-integral controllers controlling them. The
global controller also takes in account a minimal and maximal SOC, established by
the user, and maximal charge and discharge battery current.
MaxaCI arg
MaxaDescI arg
SOCMax
SOCMin
DBuck
DBoostPI
PI
PDisch
PCh∆∆∆∆I
PLoad
Pdischarge
Pcharge
Pwind
Ppv
MaxaCI arg
MaxaDescI arg
SOCMax
SOCMin
DBuck
DBoostPI
PI
PDisch
PCh∆∆∆∆I
PLoad
Pdischarge
Pcharge
Pwind
Ppv
Fig. 22 - Global control
The algorithm showing the process of achieving power balance and battery
restrictions in the hybrid system is shown in the flowchart of Fig. 23.
Prenew is the renewable sources power gathered, Pload and P’load are the
programmed and the actual (reprogrammed) power to be delivered to the load, PBB is
the power to be exchanged with the storage batteries, PBB_ch_max and PBB_disch_max are
the maximum charge and discharge power the batteries can handle, SOCmax and
SOCmin are the user defined maximum and minimum charge for the storage batteries.
The definition of the maximum and minimum values is important not only
because it relates to the physical characteristics of the storage unit but also because it
allows some kind of energy management to be performed. In the physical limitations
perspective it can be mentioned that there are conditions where a programmed load
power can not be maintained namely because of the depletion or fullness of storage
energy or the excessive power to be transferred to/from the batteries. In the energy
perspective it can be mentioned the need of sufficient capacity allocation to allow at
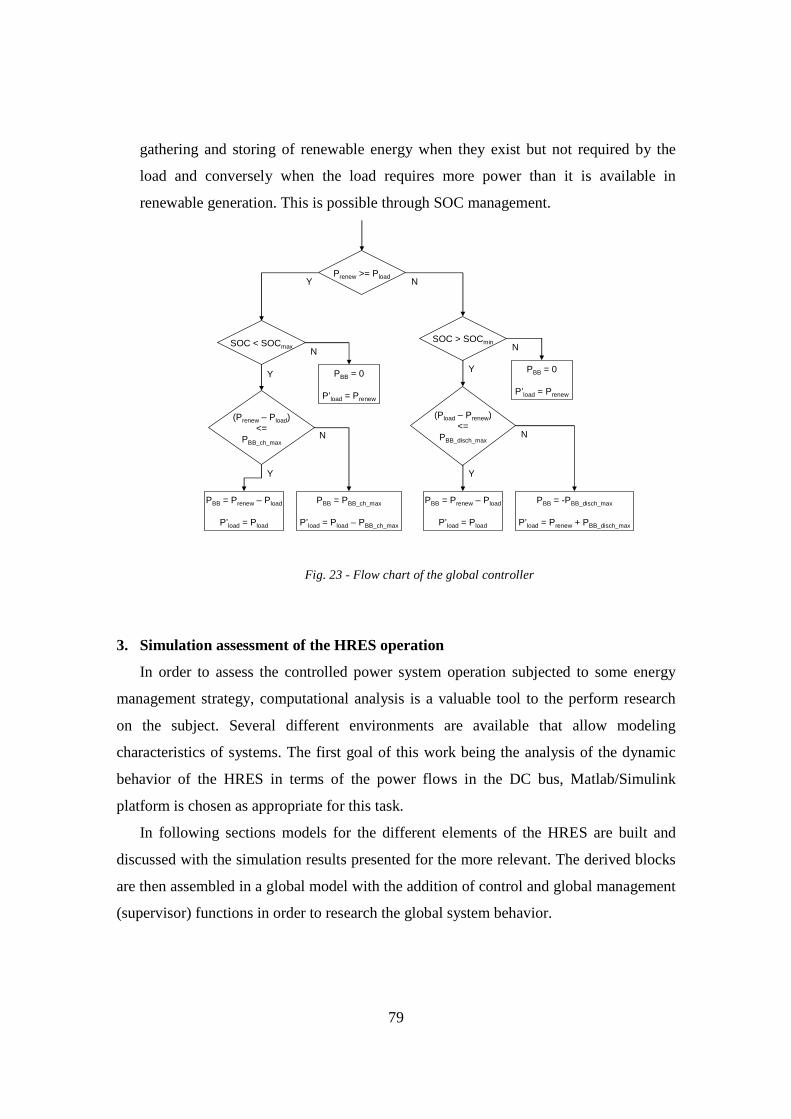
79
gathering and storing of renewable energy when they exist but not required by the
load and conversely when the load requires more power than it is available in
renewable generation. This is possible through SOC management.
PBB = Prenew – Pload
P’load = Pload
Prenew >= Pload
SOC < SOCmax
(Prenew – Pload)<=
PBB_ch_max
PBB = PBB_ch_max
P’load = Pload – PBB_ch_max
Y
Y
Y
N
PBB = 0
P’load = Prenew
NSOC > SOCmin
(Pload – Prenew)<=
PBB_disch_max
PBB = Prenew – Pload
P’load = Pload
N
Y
Y
PBB = -PBB_disch_max
P’load = Prenew + PBB_disch_max
N
PBB = 0
P’load = Prenew
N
Fig. 23 - Flow chart of the global controller
3. Simulation assessment of the HRES operation
In order to assess the controlled power system operation subjected to some energy
management strategy, computational analysis is a valuable tool to the perform research
on the subject. Several different environments are available that allow modeling
characteristics of systems. The first goal of this work being the analysis of the dynamic
behavior of the HRES in terms of the power flows in the DC bus, Matlab/Simulink
platform is chosen as appropriate for this task.
In following sections models for the different elements of the HRES are built and
discussed with the simulation results presented for the more relevant. The derived blocks
are then assembled in a global model with the addition of control and global management
(supervisor) functions in order to research the global system behavior.

80
3.1. Simulink models
3.1.1. Wind generator
The wind source is composed by a wind turbine, a PMSG and a booster DC-
DC converter to achieve power flow established according to the fuzzy maximum
power point tracker. The control of the wind generator is based on the rectified
DC output power as presented in 2.1.1.1. Fig. 24 presents the wind turbine and
generator coupled to a DC-DC converter controlled by the fuzzy maximum DC
power tracking module. The output of the model is a voltage to be connected to
the central DC bus and the input is the wind speed.
Fig. 24 - Wind generator Simulink model
The wind generator is further decoupled in mechanical and electrical
subsystems (Fig. 25). A mechanical subsystem receives wind speed and returns a
mechanical torque which is then transformed in an angular speed. The resulting
value is used to input to the generator model that returns an AC voltage which is
then rectified to return the DC voltage.
Fig. 25 - Turbine, generator and rectifier Simulink model

81
The angular speed (ω) is obtained from:
( )∫ ⋅−= dtTTJ elemec
1ω (71)
Where J [kg/m2] is the moment of inertia of the turbine and generator and Tmec
[Nm] is the mechanical torque and Tele [Nm] is the resistant electrical torque. The
moment of inertia was obtained through local experimentation of a Bergey XL.1
wind generator. Additionally, the mechanical block incorporates a condition to
simulate the real start-up of the wind generator (that is, the output power is zero
for winds below 3 m/s). The permanent magnet synchronous generator (PMSG)
and the rectifier are modelled according to [23].
Fig. 26 - Aerodynamics Simulink model
The coefficient power (Cp) is calculated by two sixth grade polynomials,
obtained from polynomial trend in an excel spreadsheet as illustrated in Fig. 27
and applied to the model as depicted in Fig. 28.
CP
λ
1º polinom.
2º polinom.
Fig. 27 - Coefficient power (Cp) versus tip speed ration (λ)
1st
2nd

82
Fig. 28 - Simulink first and second power coefficient polynomials
The model uses one additional block to represent the decrease of generated
power when wind speed rises above a certain limit (Fig. 29) which represents the
physical mechanical breaking of the turbine.
v [m/s]
P[W
]
Fig. 29 - Generator power versus wind speed for Bergey XL.1
3.1.2. Photovoltaic generator
The photovoltaic source is modelled according to 1.2.1 and implemented in
Simulink as depicted in Fig. 30. The array has as inputs the radiation and
temperature values as well as the resultant current drained. Also showed are the
booster converter to control the PV array operating point which receives the
voltage from the PV and the DC bus and the DC bus corresponding current. The
converter is controlled through the duty factor defined by the fuzzy controller
which receives the power and voltage from the array as its inputs.
The PV array is further decoupled in several blocks which implements the
equations 23-36, defined in 1.1.2, and presented in Fig. 31. The model
incorporates the possibility to define different combinations of parallel/series
arrangements based on the characteristics of one panel.

83
Fig. 30 - PV generator, Fuzzy controller and DC-DC converter Simulink model
Fig. 31 - Photovoltaic array Simulink model
The fuzzy controller to achieve MPPT has two inputs: error (ε ) and change of
error ( ε∆ ) and one output (D ) as depicted in the blocks of Fig. 32. The resulting
duty factor is the input of the DC-DC converter depicted in Fig. 35 and Fig. 36.
Fig. 32 - PV Fuzzy logic control Simulink model
3.1.3. Storage system
Equations 51-57 of section 1.5 are implemented in Simulink and the model is
shown in Fig. 33. The model is divided in three components: SOC calculation,
internal charge and discharge voltage and resistance and output voltage. It takes a
current (positive or negative depending on the need to charge or discharge the
battery) as input and outputs the battery voltage and the correspondent SOC.
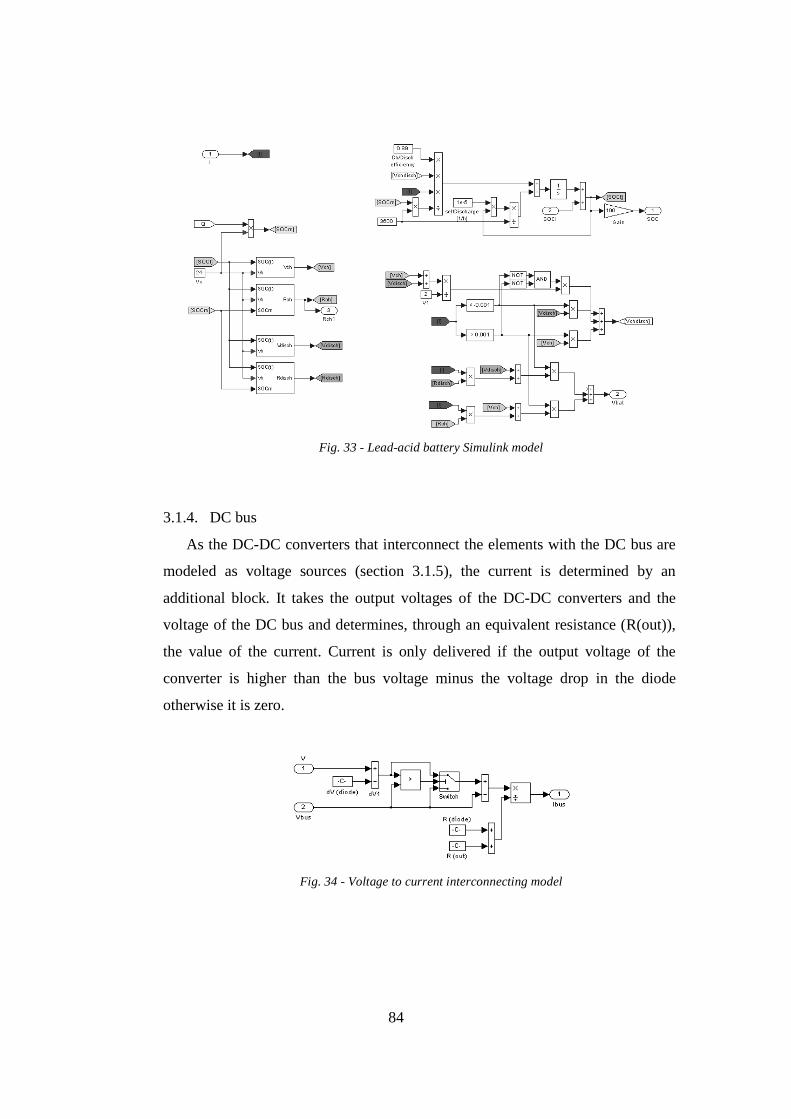
84
Fig. 33 - Lead-acid battery Simulink model
3.1.4. DC bus
As the DC-DC converters that interconnect the elements with the DC bus are
modeled as voltage sources (section 3.1.5), the current is determined by an
additional block. It takes the output voltages of the DC-DC converters and the
voltage of the DC bus and determines, through an equivalent resistance (R(out)),
the value of the current. Current is only delivered if the output voltage of the
converter is higher than the bus voltage minus the voltage drop in the diode
otherwise it is zero.
Fig. 34 - Voltage to current interconnecting model

85
3.1.5. DC-DC converters
The expressions obtained in section 1.6 model the operation of the DC-DC
converters. The Simulink models of the booster and buck converters are shown in
Fig. 35 and Fig. 36.
Fig. 35 - booster converter Simulink model
Fig. 36 - Buck converter Simulink model
3.2. Analysis of computational results
The behavior of two components – MePPT controller and DC-DC converters – is
presented in the following sections.
The MePPT algorithm uses the same algorithm than the PV MPPT the difference
being the additional method of triggering the fuzzy computation. The triggering is
periodic in the PV MPPT since it has no inertia, the remainder being the same that in
MePPT.
The DC-DC converters because they are the key elements that effectively regulate
the power flows in the system and therefore important in the analysis of the dynamic
behavior of the system.
3.2.1. MePPT

86
The MePPT algorithm and methods were described in section 2.1.1.1 and its
operation simulated. The results on the operation of the wind generator are
presented in Fig. 37 and in Fig. 38.
Fig. 37 - MePPT in wind generator startup
Fig. 38 – MePPT in normal operation with wind speed step changes
These displays show an increase in the output power in both the cases
especially in the situation where the wind generator as started to operate (Fig. 37).
As mentioned the MePPT is slow as it depends on the mechanical inertia not
operating adequately in conditions of high turbulence. It takes around 180 seconds

87
to attain the maximum power for the start up situation and around 70 seconds for
a wind speed step change of 6.5 m/s to 8 m/s. With these time figures the control
is ineffective as long as the wind speed changes within a time frame lower than
the time taken by the generator inertia to settle down, since the power change due
to wind speed change is undistinguishable from a power change due to the
converter action. But it will be able to increase the power gathered as soon as the
wind settles for a while being therefore an improvement when compared with its
uncontrolled operation.
3.2.2. DC-DC converters
The operation of the averaged DC-DC converters was compared with their
counterpart model of SimPowerSystems Toolbox. The results are satisfactory as it
can be seen in Fig. 39. They therefore can be used with the assumption that the
more dynamic characteristics of the converters are not important for the purpose
of this thesis.
Fig. 39 - Comparison between average model (grey line) and SimPowerSystems (black line)
for booster DC-DC converter

88
3.2.3. Hybrid system model test results
After validation of the several elements, they were assembled in a global
model (Fig. 40) and its behavior assessed. As the HRES presents a set of state
conditions imposing different operation conditions the analysis to be performed
requires the creation of a scenario that embraces those possible states in order to
validate the global model.
Fig. 40 – Overal simulation system
The operation of the hybrid HRES with wind, sun and programmed load
power (Fig. 41 to Fig. 43) is analyzed and results presented in Fig. 44. The test is
conducted by applying the presented wind and sun radiation series as inputs to the
sources models along with the load conditions and activating the control and
management referred in previous sections. The simulation is conducted with a
variable step type solver during one complete day with averaged results saved for
every simulation second. The control algorithm runs every 100 ms and the step
size optimized for minimum error considering the one day simulation duration.

89
Fig. 41 - wind speed serie
Fig. 42 - sun radiation serie
Fig. 43 – Programmed deliverable power
Fig. 44 - Delivered power

90
Analysis of the results shows that the system is able to workout real
conditions operation as the results obtained by simulation are in accordance with
the ones expected from calculation.
From the energy management perspective results show that storage capacity
plays a key role on the management of the energy and has implications in the load
commitment. Depicted in Fig. 44 are two cases caused by relatively low capacity
storage: A and B. In A, the power provided to the load is superior to the
programmed value (the part of the excessive power, already transferred to the
batteries) what will mean a lost of part of the captured energy and a possible
penalty for violation of the programmed load power. This case represents an
excessive power supply (EPS) of 8%, defined as the ratio between the excess of
energy from the system to the required load energy. In B, the lack of power also
means a violation of the programmed load power. This case represents a loss of
power supply (LPS) of 1.48%, defined as a ratio between the deficits of energy of
the system to the required load energy. The increase of the capacity from 220 to
440 Ah solves those deviations even in situations where one of the sources (wind
or sun) would not be present during the 24 hours.
Analysis of global results although not contemplating all of the
semiconductors switches and sources dynamic characteristics seems adequate for
testing the behavior of the hybrid power system in a control perspective as also in
a energy management perspective. This allows performing tests where control
factors can be changed and different management strategies can be implemented
which is to be done in chapter IV.
4. Conclusions
This chapter has established the models for the several required HRES elements.
Initially with an analytically approach followed by their implementation in terms of
computational analysis the models are discussed then integrated in a whole system.

91
The computational analysis is performed in the Matlab-Simulink environment as it
reveals to be adequate for the thesis purposes with results conforming to the analyzed
system expected performance.
In the following chapter the HRES model is used to analyze its behavior under
several operational strategies and to asses its response to different cases related with its
application as a controlled generator connected to the electric grid.

92
References [1] A. Mahdi et al., “A comparative study on variable-speed operations of a wind generation system
using vector control”, International Conference on Renewable Energies and Power Quality (ICREPQ’10), 2010
[2] P. Pejovic, “Three phase diode bridge rectifier with low harmonics”, Springer, 2007 [3] D. Picault, B. Raison, S. Bacha, J. de la Casa, J. Aguilera, “Forecasting photovoltaic array power
production subject to mismatch losses”, Elsevier, Solar Energy 84, 2010 [4] J. Gow, C. Manning, ”Development of a photovoltaic array model for use in power-electronics
simulation studies”, IEE Proceedings Electric Power Applications, vol. 146 2, 1999 [5] F. Ishengoma, L. Norum, ”Design and implementation of a digitally controlled stand-alone
photovoltaic power supply”, Nordic Workshop on Power and Industrial Electronics, 2002 [6] A. Bouscayrol, P. Delarue, X. Guillaud, “Power strategies for maximum control structure of a wind
energy conversion system with a synchronous machine”, Elsevier Renewable Energy, 30, 2005 [7] B. Lee, M. Ehsani, “A simplified Functional simulation model for three-phase voltage source
inverter using switching function concept”, IEEE Transactions on Industrial Electronics, 48 – 2, 2001
[8] T. Zhou, “Control and Energy Management of a Hybrid Active Wind Generator including Energy Storage System with Super-capacitors and Hydrogen technologies for Microgrid Application”, Ph.D dissertation, Laboratoire d’Electrotechnique et d’Electronique de Puissance de Lille, 2009
[9] M. Durr, A. Cruden, S. Gair, J. McDonald, “Dynamic model of a lead acid battery for use in a domestic fuel cell system”, Elsevier Journal of Power Sources, 161, 2006
[10] M. Coleman, C. Lee, C. Zhu, W. Hurley, “State-of-charge determination from EMF voltage estimation: Using impedance, terminal voltage and current for lead-acid and lithium-ion batteries”, IEEE Transactions on Industrial Electronics, 54, 5 , 2007
[11] D. Guasch, S. Silvestre, “Dynamic battery model for photovoltaic applications”, Wiley Progress In Photovoltaics: Research And Applications, 11, 2003
[12] M. Ross, “A simple but comprehensive lead-acid battery model for hybrid system simulation”, available online at http://www.rerinfo.ca/documents/artPVHorizon2001battmodel.pdf
[13] L. Castaner, S. Silvestre, “Modelling photovoltaic systems using PSpice”, Wiley, 2002, available online at http://www.knovel.com
[14] L. Guo, “Design and implementation of digital controllers for buck and boost converters using linear and nonlinear control methods”, PhD Dissertation, Auburn University, 2006
[15] Q. Wang, L. Chang, “An intelligent maximum power extraction algorithm for inverter-based variable speed wind turbine systems”, IEEE Transactions on Power Electronics, 19, 5, 2004
[16] H. Li, K. Shi, P. McLaren, “Neural network-based sensorless maximum wind energy capture with compensated power coefficient”, IEEE Transactions on Industry Applications, 41, 6, 2005
[17] B. Neammanee, S. Sirisumrannukul, S. Chatratana, “Control strategies for variable speed fixed-pitch wind turbines”, available online at http://www.intechopen.com/articles/show/title/control-strategies-for-variable-speed-fixed-pitch-wind-turbines
[18] Q. Zeng, L. Chang, R. Shao, “Fuzzy-Logic-based Maximum Power Point Tracking strategy for PMSG variable speed wind turbine generation systems”, Canadian Conference on Electrical and Computer Engineering, 2008
[19] K. Passino, S. Yurkovich, “Fuzzy Control”, Addison-Wesley, 1997, available online at http://www2.ece.ohio-state.edu/~passino/books.html
[20] M. Veerachary, T. Senjyu, K. Uezato, “Neural-Network-Based Maximum-Power-Point Tracking of Coupled-Inductor Interleaved-Boost-Converter-Supplied PV System Using Fuzzy Controller”, Ieee Transactions On Industrial Electronics, 50, 4, 2003
[21] T. Esram, P. Chapman, “Comparison of Photovoltaic Array Maximum Power Point Tracking Techniques”, Ieee Transactions On Energy Conversion, 22, 2, 2007
[22] E. Solodovnik, S. Liu, R. Dougal, “Power controller design for maximum power tracking in solar installations”, IEEE Transactions on Power Electronics, Vol. 19, 5, 2004
[23] J. Martinez et al., “Analysis and simulation of a wind-electric battery charging system”, International Journal of Energy Research, Vol. 30, 2006

93
Chap. IV – HRES availability for scheduling
1 - Context
DG generation, either renewable source based or not, presents relevant benefits due to
its modularity and it can therefore be easily integrated in distribution systems. This fact
can allow the relieving or postponing of investments in system expansion [1].
Furthermore although peak load represents about 20-30% of the supplying daily time in
practice the networks operate most of the time in off-peak mode [2].
The stability of the electrical grid is critically dependant on the availability of power
as without a sufficient amount it can become unstable and collapse (blackout) [3]. The
electrical systems reliability and availability are strongly related with the link between
consumption profile and generation capability to deliver power when needed.
In view of future power systems, renewable based DG units must be able to flexibly
control their operation. Interruptible load programs that earn compensation in exchange
for a commitment to control power delivered are needed but they require, besides control
capability, an exchange of information between the producer and the grid operators. In
the perspective of small DG connected in the low voltage grid the controllability is
important since the majority of the customer interruptions happens in these networks [4].
As referred in Chap I, it is generally accepted that with the increasing of DG
connected to the low voltage grids these can no longer be regarded as passive elements of
the electrical network. Due to fluctuating power from uncontrolled renewable energy
sources and loads the frequency and voltage fluctuation of power system becomes an
issue as bigger as the renewable weight is increased. The benefits of the connection of
DG to the grid are only ensured as long as they are integrated up to the planning level and
not only connected. In the other side owners of DG units are essentially concerned with
energy production and therefore not motivated to provide services associated with system
safety as voltage support and active power reserves [4].
The main role of the electrical networks tends to change not only because the former
reasons but also due to the spreading of the concept of micro, smart and virtual grids. In

94
[5] it is presented the concept of active network with the grid being essentially a
connectivity provider, allowing links between generation and consumption. The
implications are a need of cooperation to balance generation and consumption that may
involve curtailment of renewable power generation, changing the ratio of heat/power of
CHP or changing the power scheduling of V2G. This means that the DG units must not
only be ‘contactable’ but, for the sake of the investment economic health, also be capable
of supporting a dynamic management.
2 - Added value of determinism
The DG added value of achieving the attribute of determinism when involved with
renewable sources can be analyzed in a technical as well as in an economic base. The
first analysing the characteristics of the power delivered to the grid and the second
viewing and analysing the generated power as a product to the grid operator.
2.1 - Technical value
The uncertainty of the renewable power generation, together with real-time load
variation and system contingencies, leads to a higher level of unsafety of the power
system. As a consequence the grid operator must increase reserve margins, adopt
generation rescheduling strategies to counteract the effects of estimation errors and of
the next possible contingencies, and finally update old tools for power system safety
analysis. If the above actions are not performed, black-out episodes might take place
[6].
Periodic maintenance outages are usually used in electrical systems to ensure their
adequate operation. The use of new generation technologies, when connected to a
grid not planned to support them, embodies eventual operation problems that can lead
to unexpected outages. These ones are generally disruptive and threatening to people
and property. Not only the effects means the unavailability of dependant power
equipments and processes, leading to economical as well as other losses more
difficult to compute, but they also implies the consequent run-on of local backup
generation that are costly (both because of the cost of primary fuel and its stocking as

95
well as the opportunity cost) and environmentally damaging [7]. This security, quality
and availability context, in a grid analysis point of view, can be illustrated with Fig.
2.
Fig. 1 - Costs and reliability involved with DG [7]
Power, frequency and voltage control, congestion management, power losses
reduction and power quality control are named ancillary system services that are
required to help managing the grids. These services are usually provided by
conventional generation but recently also requested to DG as long as their weight
increases.
Power quality can be increased by supporting voltage and reducing voltage dips,
perform active filtering and phase balancing. While some of these issues are mainly
dependent on the use of power electronic (grid connected) inverters operational
capabilities, they have nevertheless to rely on their input power availability and
stability to perform adequately. With an uncontrolled, renewable energy based, power
input feeding the inverter it will be difficult to ensure those services and benefits.
2.2 - Economic value
One of the major concerns in liberalised markets is the satisfactory response to
customer requirements, particularly the supply continuity. Industrial and commercial
company’s competitiveness, safety, public health and others factors are dependant on
electricity and on its continuous availability.
As the load energy is an uncertain quantity the grids operators have to match
generation with consumption power through the time. This match is made by several
96
forms including the use of the day and intraday market where, as in all markets, the
prices are regulated through demand and supply laws as also by the law of ‘need’
which is related with opportunity time. As such a lowering of the costs of energy
supply when compared to spot peak market prices is a strong possibility for the DG
to explore.
Therefore to achieve that the DG is able to ensure its capability of delivering the
energy and power contracted with the market becomes an issue. Moreover those
contracts are negotiated with some antecedence which turns the energy availability
less reliable especially when DG has stochastic sources as the primary source of
power.
Within a large time frame a small DG unit is unable to ensure energy continuity
even with associated storage capacity.
Not serving as substitutes for large power plants the concept of controlled DG has
an inherent economic value. Such value although not usual and visible encompasses
the help they can offer to the grid by producing local power, reduction of demand
during peak power periods and minimizing line congestions. In [8] electrical losses
values of 4.2 to 8.9 % are referred caused by aging of the transmission and
distribution equipment and congestion. The substitution of generation based on fossil
fuels also means less carbon emissions and therefore has an economic as well as an
environmental benefit, this last one of difficult evaluation.
Although DG uses more expensive sources, particularly in the renewable sources
cases, this cost is quickly offset by the increase of the benefits they can bring such as
the avoidance of down-time expenses and the reduced installation and operational
costs [9].
To compute the economic value of a power system the cost of energy (COE) can
be used [10]:
CFCOMICCOE ++= (1)

97
where IC is the system investment which encompasses the cost of equipment and
its installation, COM is the operation and management cost and CF is the fuel cost,
zero in the case of renewable sources.
The financial merit of an investment can be analysed by the Internal Rate of
Return (IRR) which is a planning indicative figure to whether or not proceed with the
installation. The investment is as much worthy as the IRR exceeds the interest rate,
the difference being the net earning. As the interest rate is changing through the time
and due to inflation the IRR is actualized by the Net Present Value:
( ) 010
=+
=∑=
n
tt
t
ir
CFNPV (2)
where CF are the cash flows, ir the interest rate and t the time period.
CF can be approximated by:
( ) NECCCF ××= 8760 (3)
where CC is the capacity credit, 8760 the annual number of hours and EN the
nominal energy that the system is able to generate.
The operational evaluation of the system can then be computed through the
Return On Investment (ROI), and the Payback Time (PB):
IC
ICCFROI
−= (4)
where CF is the investment gains (cash flows) and IC the investment costs
CF
SCPB= (5)

98
where SC is the system cost along the time.
Capacity Credit, Effective Load Carrying Capability (ELCC) that uses Loss of
Load Expectation (LOLE) or Loss of Load Probability (LOLP) are expressions trying
to assess the relative contribution of a particular generator to the electrical network to
which it is connected to [3]. They could be used in a planning phase to better assess
the values used in the cash flows which are dependant on the expected energy
production.
3 - System behaviour under different dispatch rules
The present work proposes a hybrid power system exclusively based on renewable
energies that intends to answer some of the issues of grid connected DG. It relies on the
storage capacity to cope with the variability of its sources in order to deliver a
controllable power to a load as well as in integrating into the same site renewable sources
with different generating conditions.
The controllability concept embraces constancy of delivered power during a specified
time interval and the capability of freely change its value, as needed, from one time
interval to another. It also aims to be able to adequately service abnormal and
unscheduled requests from a grid manager. The term grid operator has a wide meaning
that encompasses microgrid, VPP, smartgrid or utility grid operators.
In that sense it matters to define several modes of operation to assess the value of a
controlled, renewable based, power generator system. Those modes of operation are
viewed, besides the usual energy selling, in a service perspective and under market laws
of operation.
3.1 - Intraday market energy selling
If the HRES plans to sell energy in the day market it has to comply with the rules
of operation markets: that is to present the offer with some antecedence (14 hours in

99
the case of MIBEL) for one complete day (see Fig. 2). In that sense it has to ensure
the reliability of the system, that is, the availability of the energy and power offered
for the next 24 hours of supply. To comply with those constraints and to maximize
the economic value of his operation, the HRES must incorporate a forecast method
and a scheduling mechanism.
0 24h 48h
EnergyPlanning
(d+1)
PlannedEnergyDelivering(d+2)
PlannedEnergy
Delivering(d+1)
EnergyPlanning
(d+2) Fig. 2 – Intraday market energy scheduling
3.1.1 - Available energy forecasting
The expected stored energy at the beginning of the next day is determined by:
LrenBBBB EEcEE 2410)*(
241010)*(
24 −− −×+= (6)
where BBE10 is the energy in the storage at the time of prediction (10:00), c a
coefficient accounting for the variation of actual renewable energy from normal
values, )*(2410
renE − the expected renewable energy from the remaining time of the
present day and LE 2410− the remaining load energy programmed for the present day.
The coefficient c is computed as the ratio of gathered to expected renewable
energy for the period from 0h to 10h:
*100
100
−
−=E
Ec (7)
where the expected energy is the statistical mean energy for the site.
The energy that can be expected to be sold in the next day is determined as:
)*(4824
)*(24
)*(4824
renBBL EEE −− += (8)
where )*(4824
renE − is the expected normal renewable energy for the next day.

100
3.1.2 - Scheduling
The scheduling of the energy is accomplished taking the energy available to
deliver in the period and computing the energy deliverable in peak hours:
peakDCbusBB tVI ∆××max (9)
where maxBBI is determined by the batteries characteristics. This value ensures
that the system is always capable of delivering the maximum scheduled power
(not being dependant on wind and sun variability) and therefore capable of always
maintaining the availability provided that there is enough energy in the system.
If the energy available is higher than the maximum energy deliverable in peak
hours, then the remaining is delivered in full hours:
)(4824)( peakhfullh EEE −= − (10)
This strategy avoids the eventual saturation of the storage and the consequent
incapacity of gathering and use of ‘future’ renewable energy, while incrementing
the earnings of sold energy.
If it is supposed that the HRES is connected to the LV grid one can
additionally compute the avoided losses as [11]:
25.12 ffavoid −=Ρ (11)
2
=
refLVgrid
delivered
I
If (12)
with AI refLVgrid 1000= for a urban grid in a branch fed by a 400 kVA
transformer. The earning due to this power is determined at the same commercial
price and tariff periods than the normal purchased energy.
3.1.3 - Results and analysis
The behavior of a HRES upon the discussed issues is analyzed by simulation
of the system. The analysis is performed based on typical conditions of wind and
sun and adopting the architecture established for the HRES.

101
The simulation is conducted with the wind and sun radiation profiles
presented in Fig. 3 and Fig. 4. These profiles correspond to a sunny day with
running clouds and modest wind with an average velocity of 4.8 m/s and a
standard deviation of 2.4 m/s.
Fig. 3 – Wind speed profile
Fig. 4 – Radiation profile
The analysis test is performed with varying environmental conditions: the first
three days with winter radiation but no wind, the next three days with winter
radiation and wind followed by one day with only winter radiation and the last
two again with winter radiation and wind. The bank of batteries has a capacity of
225 Ah to 630 Ah, 36 V, with a maximum SOC of 95% and a minimum one of
20% (~4 kWh). The maximum current is 70A and 66A for discharge and charge
respectively.

102
Fig. 5 - Delivered versus scheduled energy for 9 days
Fig. 6 - Delivered (grey areas) energy and wasted (black areas) renewable energy
Fig. 7 - SOC variation of battery bank during the 9 days
1 2 3 4 5 6 7 8 9Renewable energy kWh/day 3,8 3,8 3,8 5,9 5,9 5,9 3,8 5,9 5,9Schedulled energy kWh/day 3,3 3,7 3,4 3,4 6,9 4,2 5,7 1,5 7,2Delivered (peak hours) kWh/day 3,3 3,7 3,4 3,4 4,6 4,2 4,6 1,5 4,6Delivered (full hours) kWh/day 0 0 0 0 2,361 0 1,128 0 2,641Availlability 100% 100% 100% 100% 100% 100% 100% 100% 100%€ (total) / year 182,5 193,5 192,2 191,6 226,3 227,5 238,8 219 236,8Payback term years 39,8 37,5 37,8 37,9 32,1 31,9 30,4 33,2 30,7Avoided losses kWh/year 38,0 39,9 39,5 42,8 50,1 50,1 52,2 47,8 53,0
day
Table 1 - Analysis of the behaviour of the system for 9 days

103
Table 2 – DG investment payback period for energy different prices
Fig. 5 shows the scheduled and the delivered energy for 9 days, while Fig. 6
shows the time details of the energy delivered and the part that was wasted. Fig. 7
details the SOC behaviour along the period considered.
The system reflects the environmental variations ensuring a 100% availability
for the scheduled energy. The wasted energy (back areas of Fig. 6) could be
solved by an increase of the storage capacity.
A projection for one year based on energy prices is presented in Table 1 for an
investment of 7,000 € (actual market costs, although it is expected a reduction in
commercial prices) on the HRES. The payback period for different energy prices
is presented in Table 2, the first for current day market prices, the second and
third ones for hypothetical subvention prices. The adoption of a subvention
similar to the used in photovoltaic energy in 2009 (0.6 €/kWh) would bring the
payback period to 7 years. As these subventions tend to decrease in the course of
time the payback time obviously increases.
3.2 - Peak hours energy consumption reduction
The objective is to reduce the quantity of purchased energy for a plant (load) in
the periods where that energy is more expensive (peak hours).
peakHRES
peakLoad
peakGrid PPP −= (13)
The role of the HRES is to gather renewable energy when available, store it and
deliver it to a local load when the grid energy is more expensive. The management
system stores the renewable energy outside peak hours, except when the storage
capacity is full or the power gathered is higher than the maximum admissible for the
storage system. In these last cases the management allows at reducing the power
gathered from the grid diverting the excess to the load. The same method is applied in
peak hours when the load power is higher than the maximum combined renewable

104
power and storage maximum power or storage is depleted. In these cases the
management complements the deficit with power from the grid.
3.2.1 - Results and analysis
The results for the peak energy operation mode are presented in Fig. 8, Fig.
9 and Table 3. The energy prices used are retailer commercial prices (0.152,
0.1332 and 0.0742 €/kWh for peak, full and empty hours respectively). The
simulations are conducted for a winter day with (case 1 of Table 3) and without
(case 2 of Table 3) wind and a summer day with wind (case 3 of Table 3). The
reduction in the purchased energy, outside peak hours, when storage is full or
renewable gathered power is higher than maximum storage power is also visible.
In all days the power reduction in peak hours is attained as can be seen in table 3.
Fig. 8 - Load power profile and avoided grid energy (grey areas) for a winter day with wind
(case 1)
Fig. 9 - SOC of the storage system

105
tariff €/kWh
0,152 (peak)
0,1332 (full)
0,0742 (empty)
€ total per day
€ saved per day
€ saved per year
PBP (years)
kWh 11,063 36,571 2,501€ 1,68 4,87 0,19kWh 6,152 36,283 2,501€ 0,94 4,83 0,19kWh 6,656 36,570 2,501€ 1,01 4,87 0,19kWh 5,473 35,190 2,501€ 0,83 4,69 0,19
(Load) 6,74
(Grid) Case 1
5,96 0,78 187,2 37
(Grid) Case 2
6,07 0,67 160,8 44
28(Grid)
Case 35,71 1,03 247,2
Table 3 - Saved energy and costs and Payback period (PBP) for the investment in the HRES
The projection shows a payback period ranging from 44 to 28 years,
depending on the atmospheric conditions, without subsidized energy prices. The
used storage capacity is the minimum (225 Ah) to achieve the objectives. The
energy deficits are covered by the grid, although in that period of time the power
profile would be fluctuating and therefore not coping with grid power stability.
The earning achieved by the reduction of the power demand is therefore
conditioned by the storage capacity which is related with the investment and re-
investment (operational costs) in storage.
3.3 - Peak hours energy consumption reduction with constant power
The strategy is the same as in 3.2 but with the difference of maintaining the power
consumed from the grid at a constant level. The system is therefore responsible to
adapt the variable renewable generation and battery power to the difference between
the load power and the constant grid power value.
3.3.1 - Results and analysis
Results for the peak energy with constant power are presented in Fig. 10,
Fig. 11, Fig. 12 and Table 4. The simulation is performed for the same
environmental conditions and the same forecast method as in the energy selling
strategy. The storage capacity used is of 600 Ah as the strategy only relates to
peak hours. Results show the respect of the planned grid purchase constant power
for the 9 simulated days. The payback period is of 136 years at commercial prices
and 20 years if the peak hour’s energy is paid with a subsidized price of 1.02
€/kWh

106
Fig. 10 - Peak load energy profile (dashed line), grid purchased peak power (dashed area)
and avoided grid peak energy (grey area) for 9 winter days with variable wind
Fig. 11 - SOC of the storage system for the nine days
Fig. 12 - Load profile, purchased grid peak energy (solid) and avoided peak energy (grey
areas) for one day
Table 4 - Avoided peak energy and energy costs and Payback period (PBP) for the investment
in the HRES
3.4 - Unscheduled grid requests
In this operation mode the HRES uses the previous pre-programmed peak hours
selling of energy strategy, coupled with a dynamic management strategy. This means

107
that besides the capability to deliver the previous day contracted energy the HRES is
also available to accept unscheduled power requests from the grid. The power and
energy amounts are previously accorded and contracted with the grid operator.
3.4.1 - Results and analysis
The results from the dynamic grid management are presented in Fig. 13, 14
and 15. The used environmental conditions correspond to the winter day with
wind. The system is able to respond to the extemporaneous requests of power
from the grid while selling peak hour’s energy, as programmed in the previous
day.
Fig. 13 – Assynchronous grid demands profile
Fig. 14 - Power profile for peak hours energy selling and services

108
Fig. 15 – Storage SOC
Fig. 16 - Energy profiles for grid energy requests, sold peak hours energy and gathered
renewable energy for one day 4 - Results analysis
Performed analysis shows that the system remains controlled, for several different
operational modes, presenting a constant power along the periods predefined. It is able to
manage the varying power from the stochastic renewable sources while maintaining a
constant pre-defined power during the pre-determined time frames.
Carried out results demonstrate that an integration of two different stochastic
renewable sources is possible while ensuring the control of the power delivered, not only
in value but also in time.
This characteristic allows at adding an economic value that is new in the context of
the renewable generation, namely at the micro-generation level. Considering a scenario
that generalizes the concept of microgrids at the distribution level, the spread of house
based self-generation systems with communication capabilities can be potentially
beneficial to all players.

109
Power exchange between storage and DC bus strongly determines the efficiency of
the system. In conditions where the sun radiation is weak and there is no wind available
the stress is on the power transfer from the battery to the DC bus the battery having to
support all the power to the load. Not only because it obligates the battery to an effort that
it has difficulty to cope with but also because the losses increase exponentially. So the
best efficiency is attained in conditions of low power exchange and high energy delivered
which is not at all the usual case. The use of a deterministic primary energy generator
such as CHP could be an alternative. Also the use of hydrogen (by fuel cell form) and
supercapacitors, the former to help in energy density the later to help in power capacity,
are technologies that could help to improve the system.
Several operation strategies which are believed to have relevance in actual and future
electrical environment show that such a system is able to add value to the management of
the electrical grids.
These strategies allow the owner to leverage its revenues while providing valuable
services to the electrical networks. The first being possible by the transfer of energy to
periods where the energy is more expensive, thereby turning is investment more
attractive and by that reason aiding to spread generation systems based on renewable
energies.
The second one is possible by the transfer of energy to periods when it is necessary in
the exact required amount and without raising the issues that have caused problems in the
electrical networks management.
The HRES system tests show that its economic viability is strongly dependent on
some subvention or on a complementary earning due to the services they can provide.
No considerations are done on some fields related to the economic value of renewable
based production such as employment increase, social and environmental value as well as
CO2 reduction and others.
Being typically small systems this type of DG units allows their placement anywhere.
They therefore contribute not only to solve the usual problem of weak grids but to
support an effective contribution to the increase penetration of renewable based
110
generation. The union of the freedom of placement with the power controllability and the
freely primary fuel can make them a powerful instrument to solve electrical networks
management and aid to their enhancement.
The weak point is the storage due primarily to its cost and life span. Batteries that are
subjected to extreme conditions, in order to reduce their investment weigh in the system
cost, do not survive much time. This characteristic has an important impact in
maintenance cost (batteries replacement) and therefore in the ROI. Their limited energy
density furthermore subjected to the current limitations calls for another technology
either replacing them either aiding them.
To optimize charging/discharging operations and to improve battery management
system is out of the scope of this work as the technology in the field is moving fast and
new technological approaches show some kind of complete changes, reducing costs,
increasing charge/discharge cycling and so on.
The improvement of the forecasting capabilities, namely ultra-short forecasting, could
also improve the system efficiency as it can reduce the variability of the excursion of the
energy stored.
The use of two complementary stochastic energy sources is relevant as they allow
relieving some of the energy weight from the battery.
5 - Conclusions
The present chapter is focused in the analysis of the improvements brought by the
evolution from uncontrolled renewable generation systems to hybrid renewable sources
with storage capacity. The focus is at technical issues, mainly safety and availability of
power what means control services for grid operators, as well as economic consequences
through the increase of the added value of generated power. The capability of using the
HRES in different modes of operation is undoubtedly beneficial for the grid operators.
The next chapter deals with the description of the experimental HRES designed to
validate this work as well as to analyse its behaviour in real conditions of use.

111
References [1] H Püttgen, P. Macgregor, F. Lambert, “Distributed Generation: Semantic Hype or the Dawn of a
New Era?”, IEEE Power & Energy magazine, 2003 [2] T. Jin, J. Jimenez, “A Review on Planning and Automation Technologies for Distributed Generation
Systems”, 6th IEEE Conference on Automation Science and Engineering, 2010 [3] B. Kirby et al., “Renewable Generation Integration Cost Analysis – Phase III”, California Wind
Energy Collaborative, 2004 [4] Jürgen Schmid et al., “Towards Smart Power Networks”, Directorate-General for Research
Sustainable Energy Systems, 2005 [5] K. Brabandere, et al., “Control of Microgrids”, IEEE Power Engineering Society General Meeting,
2007 [6] D. Menniti, N. Scordino, N. Sorrentino, “ Secure and economic management of a power system in
the presence of wind generation”, Elsevier, Electric Power Systems Research 80, 2010 [7] E. Lawrence, “ Microgrids and Heterogeneous Security, Quality, Reliability and Availability”, Power
Conversion Conference PCC '07, 2007 [8] R. Hirsh, B. Sovacool, “Technological systems and momentum change: American electrical utilities,
restructuring and distributed generation technologies”, The Journal of Technology Studies, v32 n2, 2006
[9] A. Kwasinski, P. Krein, “A Microgrid-based Telecom Power System using Modular Multiple-Input DC-DC Converters”, INTELEC '05 Telecommunications Conference, 2005
[10] A. Kwasinski and P. Krein, “Optimal Configuration Analysis of a Microgrid-Based Telecom Power System”, INTELEC '06 Telecommunications Energy Conference, 2006
[11] P. Costa, M. Matos, J. Lopes, “Regulation of microgeneration and microgrids”, Elsevier, Energy Policy 36, 2008

112

113
Chap. V – Experimental platform
The experimental validation of the results carried out with the computational
analysis performed in previous chapter requires the design and implementation of a
hybrid generation system. So a small but scalable experimental platform was built based
on two primary energy sources, wind and photovoltaic, and a DC bus provided with a
storage system. The system architecture is according to the analyzed one.
According to previous chapters, renewable based distributed power systems
connected to a grid must namely be able of controlling the power they deliver and to be
economically efficient. That allows this type of systems to be accepted as a grid power
generator and to be attractive to investors.
The controllability of the generation system can be analysed through dynamics of
the controlled DC bus supplying an AC load, based on integrated operation of an
inverter and load. The grid interconnection is not realized as it is not important for
analysis in the context of this thesis, as the main issue is to control the DC bus voltage
with dynamic conditions similar to those adopted in power electronics based systems
interconnected to the grid.
The integration of the different energy sources is architected through the DC bus. Its
controlled operation demands for monitoring a set of variables needed for system
control as well as for results demonstration proposals. The layout of the experimental
system is shown in Fig. 1. It depicts generation, storage and conditioning elements as
well as data gathering points.
Load
ElectricNetwork
Load
ElectricNetwork
Fig. 1 - Layout of the system with data collection points

114
1 - Experimental platform description
The hybrid system is based on a 1.1 kW Bergey XL.1 wind generator , two BP
polycrystalline (80 Wp) and one BP monocrystalline photovoltaic (PV) panels (85
Wp) parallel coupled, and a 195 Ah lead acid battery. Detailed characteristics of
each component are presented in Annex 1. Each unit is coupled to a 20 mF DC bus
through DC-DC converters: three Booster converters for interconnection of the two
renewable sources and the battery, in delivering power mode, to the DC bus and a
Buck converter to store the excessive power in the DC bus in the battery.
These system elements are very similar to the ones used in the computational
analysis and are scalable to larger power with minor changes.
The use of four independent DC-DC converters allows at validating the all
operating conditions, with none, one or the both generators and with charging or
discharging modes for storage subsystem. Appropriated and managed scheduling of
operating subsystems increases the service availability of the generation system in
delivering power mode and therefore its economic value.
The control platform is implemented over a digital signal processor (DSP),
through a Spectrum Digital evaluation module eZdsp f2812 (Fig. 2) running at 150
MHz.
This clock speed ensures that the processor has the capability of taking care of
the dynamics of the electrical quantities involved in the control of the system. The
module incorporates a 12 bit ADC with a maximum clock speed of 25 MHz, two
sample and hold units allowing the acquisition of two simultaneous values (voltage
and current usually) and sixteen input channels available. The ADC clock speed
used was nevertheless inferior – 9.38 MHz which features 5.76 us for a burst of 8x2
consecutive channels conversion – in order to reduce conversion noise. The eZdsp
module includes four independently modulated PWM signals used to control the
DC/DC converters of the system and several I/O digital lines necessary to be used
either as specific peripheral I/O signals (as for instance the serial communication
interface (SCI) used to send and receive data from a RS232) or programmed as
digital general input or output lines.

115
DSP/BIOS1 is a built-in operating system that allows to use a real time operating
system features, providing an visual programming interface for task scheduling,
interrupts and periodic functions as well as other capabilities. It is an alternative to
the interrupt driven code programming and was used to program the various tasks
controlling the present hybrid power system. Several periodic timed tasks were
defined in the DSP/BIOS each one taking care of a specific function as bus voltage
control and MPPT computation along with support tasks as serial communication
and system state conditions.
The capture of the maximum power of the renewable sources is accomplished in
a continuous mode not restricted by power control requirements such as DC bus
voltage control. A fuzzy based maximum power point tracking (MPPT) is selected
to implement this capability as it is well adapted to non linear systems like the
photovoltaic and wind sources. As the implementation of the fuzzy controllers
(namely the rules) occupies a large memory space, related computation is
transferred to an additional computer running Visual C++ under Windows XP. The
communication between the DSP and this computer is implemented through a serial
connection (SCI with 16 byte FIFO capability) with a custom board to convert the
DSP to the RS232 voltage levels. The use of the FIFO further relieves the DSP from
the task of directly controlling the communication bit to bit.
The acquisition of voltage is made with voltage dividers as well as the
acquisition of currents is performed with 50 A Hall effect transducers (LEM has
50). A custom board to adapt their output voltages to the voltage level of the DSP is
adopted. The current transducers were adapted to each particular current level case
through several turns in order to raise the measurement accuracy. The current
measurements were taken at the output of the generators for maximum power point
tracking computation and between each unit and the DC bus for DC-DC converters
control. The data gathering points are depicted in Fig. 1 with small open circles.
1 Built In Operating System

116
An additional analog interface (push buttons for commands and led’s to view
current state - see Fig. 2) is used to avoid interruption of the processor control tasks1
as the experimental operating conditions could need on-time change of parameters
values. This interface encompasses manual controls – system initialization,
parameters of MPPT manual/fuzzy computation, serial communication reset – and
viewing of the main current state of the system – system on/off, manual/fuzzy
MPPT, charging/discharging mode, serial connection malfunction and reset, bus
voltage levels. The interface is implemented through several general purpose digital
I/O (GPIO) lines of the DSP.
State and CommandInterface
eZdspf2812 unit
Aconditioningunit
Serial Communit
Fig. 2 – Control and interface units of the hybrid system
A National Instruments (NI) data acquisition board (low cost NI 6024E) with an
interface implemented in Labview was also developed (Fig. 3). This interface
allows at tracing the general short term as well as the long time behavior of the
global system. It captures and displays the values of voltages in the battery,
photovoltaic and wind generators and the DC bus, currents flowing in and out the
DC bus, shows the activation of the converters in use and their eventual malfunction
and implements a input/output battery current counting in order to display an
assessment of the state of charge (SOC) of the battery. It also implements the saving
of runtime values for pos-processing and an external command of the system load.
The acquisition frequency in this interface is 10 HZ and results are saved with a
frequency of 1 Hz. These frequencies are much lower than the 10 kHz frequency of
the PWM control signals and the dynamic variations that they cause, but the
averaged values are well suited to the long term behavior display. The faster
dynamic characteristics are taken with digital oscilloscopes.
1 These interrupts to transfer data from the dsp to the host control computer can even lead to the damage the electronic switches if the transfer happens during a high level switch state (short circuiting). This is dependant of the communication transfer type and the protection schemes used in the switch.

117
The interface is also used to command system loading either manually – as in
the case of asynchronous requests of load power (referred in chapter IV as dynamic
grid control strategy) or through a pre-programmed schedule – as in the case of peak
shaving, with power control. This allows the simulation of various forms of system
loading for experimental tests.
It should be noticed that the reduced power of load combinations are directly
related with the maximum power capacity of the battery element. The battery is a 12
V 195 Ah unit with approximately 20 A safe maximum (C/10) which represents a
current of 5 A on the 48 V bus side, that is around 250 W. Although the system is
theoretically able to deliver more power regarding the battery limitations it would
only be possible when renewable power is sufficient to ensure that increment. This
however would be contradictory with the constant power objective and thus not
considered.
The use of a common internet connection also allows not only to view the
present behavior of the system but also to command the loading from a remote
location (see Fig. 3). This capability allows at simulating the control of the system
by a network manager which is one of the requirements of grid services offering.
Fig. 4 depicts the power electronics converters.
Fig. 3 – Hybrid system Labview interface

118
Battery convertersBoost and Buck
PVBoost converter
WindBoost converter
Fig. 4 - Overview of the four DC-DC converters
2 - Dynamic and control characteristics
2.1 - DC-DC converters
According to output characteristics of the wind and photovoltaic sources and
battery voltage as well as the regulated voltage of the DC bus the system
requires the operation of four DC-DC converters, three of them operating in
stepping up and the fourth in stepping down mode. Table 1 displays the main
electrical characteristics.
Element P [W] V [V] I [A] Vbus [V] Ibus [A]
Wind generator 1100 20 55,0 22,9Photovoltaic 245 17 14,4 5,1Battery 1345 12 112,1 28,0
48
Table 1 – Hybrid power elements characteristics
The converters are built with switches from Semikron, 1200 V IGBT’s with
current capacity of 100 A for the battery converters, 50 A for the wind converter
and of 40 A for the photovoltaic panels. These ratings are adequate to the
currents expected – Table 1.
Converters include output filters: the Booster DC-DC converters use LC
filters where C is the DC bus capacity; for the Buck DC-DC converter a LCL
filter is adopted in order to improve dynamical behaviour.
As the stepping up action of the Booster converters is based on its operation
as a current source at the input, inductances are key elements in power transfer
from unregulated input to regulated output. Considering the frequency operation

119
of the converter some attention has to be paid to conditions of low power in the
sources, which is the common condition of the average wind power as well as
the case of winter and cloudy periods for the photovoltaic source.
Consequently it implies a focus on the battery contribution. In those cases to
be able to transfer power to the bus it is necessary to have a high duty factor due
to the voltage ratio between the battery (12 V) and the bus (48 V) voltages.
Therefore to achieve the necessary gain to transfer energy from the battery to the
bus within the converter frequency the Booster converter inductance has to be as
small as possible in order to regulate the bus voltage with good dynamics. This
implies a larger ripple in the current delivered to the DC bus as well as high
commutation spikes present in it. That behaviour can be observed in Fig. 5
where the IGBT’s commutation spikes due to the compressed time span used in
the Laview displays appear as a continuous variation of load current. This
subject is detailed in the following sections.
Fig. 5 – Labview currents – load (red), battery charge (light green), discharge (magenta) and
photovoltaic (yellow) display
In the case of the charge converter (Buck) of the battery and in view of its
current limitations as also to preserve as much as possible its life span – as the
lead-acid battery is the element which degrades faster and has a relatively high
cost (replacement) over the overall system – an LCL filter was implemented.
The charge voltage behaviour is presented in Fig. 6.
Fig. 6 – Battery charge voltage without and with LCL filter (Labview display)

120
Values of 20 uH for battery Boost; 48 uH, 220 uF, 170 uH for battery Buck,
25 uH for photovoltaic Booster and 50 uH for wind Booster were used in the
DC-DC converters.
Converter stability can be analysed through the Bode plot for its transfer
function and considering phase and gain margins.
It is only analysed the booster converter as well as related filter as the design
and consequently the stability characteristic can be established by the same
method.
The Bode plot for the PV booster and its filter are displayed in Fig. 7 and
Fig. 8. The converter stability and so the dynamic behaviour is good enough as
the phase and gain margins present good figures.
Fig. 7 – Bode plot of the converter and filter used in the PV booster (light load)
Fig. 8 - Bode plot of the converter and filter used in the PV booster
Converters are controlled by a PWM signal generated by the DSP system,
based on TI TMS320F2812 microcontroller. The control is accomplished
through the command of the generators converters, their duty factor established
by the MPPT algorithms, as well as the DC bus voltage regulation and delivery
of the pre-programmed load balancing the power flow among the different
elements in operation.
A custom board to match the voltage levels of the DSP PWM outputs (0/3.3
V) with those of the IGBT drivers (Semikron SKHI22A) input (0/15 V) had to
be built. It also includes switch short circuit protection as well as its error
information transmission.
The following figures show the PWM waveforms that control the DC-DC
booster converters interfacing the PV array (yellow) and the wind generator

121
(blue) to the DC bus. The current exchanged by the bus with the battery
converters (negative: to the battery; positive: from the battery) is also shown
(violet) as well as the load current (green).
Fig. 9 – Wind and sun generation with no load
Fig. 9 shows a low duty cycle for the PV indicating its reduced generation
and a load current of zero. Although the duty factor of the wind generator is high
(for the reasons pointed in chapter III and related with the MePPT controller)
there was no wind and therefore no power from that source. The excess of power
in the DC bus is transferred to the battery. As the charging converter uses a LCL
filter the current has a fairly stable behavior. The electronic switches
commutation spikes are also visible in the battery current.
Fig.10 depicts the same situation type excepting that the load is now higher
than the photovoltaic generated power. The power imbalance in the bus has lead
to the deactivation of the previous converter and to the activation of the one that
injects battery power in the bus. The voltage level difference between the battery
and the bus, which led to the use of a small inductance, reflects in the delivered
current that has now a more sharp profile. As it can be seen the commutation
spikes reflects in the load current with a relatively higher amplitude.
Fig.10 – Wind and sun generation power lower than loading

122
Fig.11 depicts the same case but now with a photovoltaic generated power
approximately equal to the load power. As in the last case the spikes in the load
are still exists with relatively high amplitude.
Fig.11 – Wind and sun generation slightly higher than loading
Fig.12 shows the case where the load was increased and higher than PV
generation. The figure now reveals spikes in the load current for two situations:
the commutation of the switch of the PV converter and of the battery booster
converter.
Fig.12 – Wind and sun generation lower than loading
2.2 - DC bus voltage control
The DC bus is the key element of the system performing the role of
integrating all the energy sources and load ensuring the power flows demanded
in the different generating conditions. This role implies to operate with regulated
voltage.

123
If the DC bus delivers energy to a grid the bus voltage is regulated by the
DC-AC converter as the grid is a regulated voltage source. In hybrid generation
systems each source as well as the storage element are required to inject power
into the DC bus operating at that controlled output voltage.
In the experimental platform a DC bus with regulated voltage is therefore
adopted. The output voltage regulation is achieved by the battery DC-DC
controllers compensated with a proportional-integral (PI) block. It controls each
of the two battery connected DC-DC converters in order to deliver/extract the
difference between generated and delivered power to/of the DC bus. The
controllers measure the actual bus voltage at a 1 kHz frequency and through the
error to the 48 V reference computes the duty factor needed to maintain the
power controlled, choosing the stepping up or stepping down operation.
The computation of the necessary duty factor of the battery converters for
the bus power compensation is accomplished by digital PI controllers that follow
the expression:
( ) ( )( )121
1 −− ×+×−= nnnn errorKerrorKDD (1)
where D is the duty factor that controls the converters and the exponent is
the discretized time: n for the actual sampling and n-1 for the former sampling.
error is the difference between reference voltage and actual voltage as define
below. The expression is derived from the continuous PID general equation [1],
without the derivative component.
The two constants K1 and K2 are computed as:
+=21
ISP
KTKK (2)
+−=22
ISP
KTKK (3)
where KI and KP are the integrative and proportional gains respectively and
TS is the sampling period.
The error is determined by:
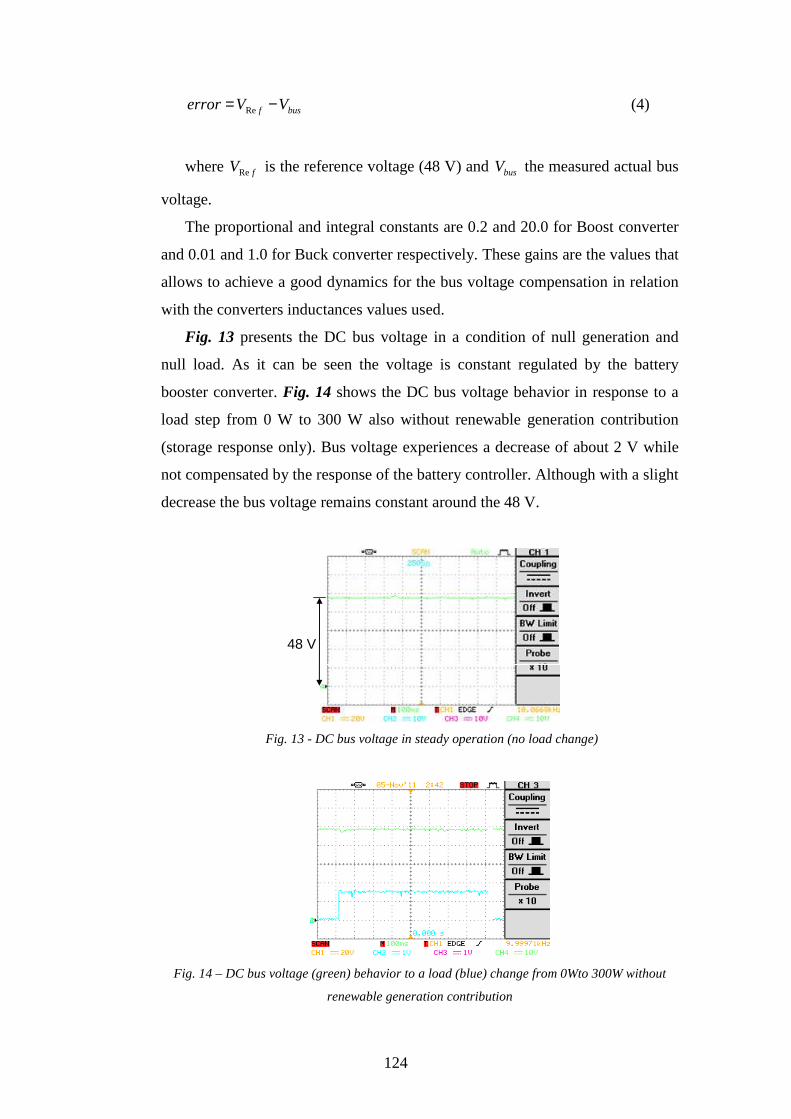
124
busf VVerror −= Re (4)
where fVRe is the reference voltage (48 V) and busV the measured actual bus
voltage.
The proportional and integral constants are 0.2 and 20.0 for Boost converter
and 0.01 and 1.0 for Buck converter respectively. These gains are the values that
allows to achieve a good dynamics for the bus voltage compensation in relation
with the converters inductances values used.
Fig. 13 presents the DC bus voltage in a condition of null generation and
null load. As it can be seen the voltage is constant regulated by the battery
booster converter. Fig. 14 shows the DC bus voltage behavior in response to a
load step from 0 W to 300 W also without renewable generation contribution
(storage response only). Bus voltage experiences a decrease of about 2 V while
not compensated by the response of the battery controller. Although with a slight
decrease the bus voltage remains constant around the 48 V.
48 V
Fig. 13 - DC bus voltage in steady operation (no load change)
Fig. 14 – DC bus voltage (green) behavior to a load (blue) change from 0Wto 300W without
renewable generation contribution
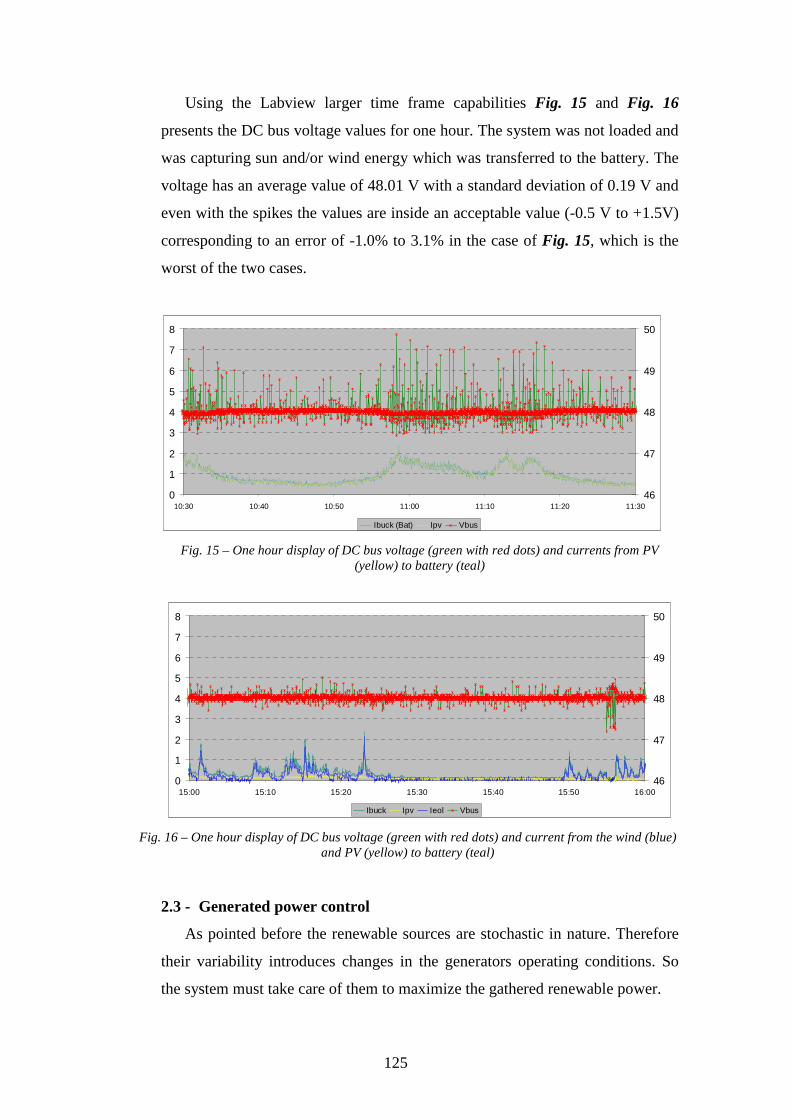
125
Using the Labview larger time frame capabilities Fig. 15 and Fig. 16
presents the DC bus voltage values for one hour. The system was not loaded and
was capturing sun and/or wind energy which was transferred to the battery. The
voltage has an average value of 48.01 V with a standard deviation of 0.19 V and
even with the spikes the values are inside an acceptable value (-0.5 V to +1.5V)
corresponding to an error of -1.0% to 3.1% in the case of Fig. 15, which is the
worst of the two cases.
0
1
2
3
4
5
6
7
8
10:30 10:40 10:50 11:00 11:10 11:20 11:3046
47
48
49
50
Ibuck (Bat) Ipv Vbus Fig. 15 – One hour display of DC bus voltage (green with red dots) and currents from PV
(yellow) to battery (teal)
0
1
2
3
4
5
6
7
8
15:00 15:10 15:20 15:30 15:40 15:50 16:0046
47
48
49
50
Ibuck Ipv Ieol Vbus Fig. 16 – One hour display of DC bus voltage (green with red dots) and current from the wind (blue)
and PV (yellow) to battery (teal)
2.3 - Generated power control
As pointed before the renewable sources are stochastic in nature. Therefore
their variability introduces changes in the generators operating conditions. So
the system must take care of them to maximize the gathered renewable power.

126
The use of a MPPT schemes allows at maximizing the extracted power from
the renewable sources. As analyzed before, there are different algorithms
performing the role. In the present system fuzzy controllers are adopted.
Due to the relatively high number of rules that must be coded as permanent
variables, demanding for a large memory space, decision to transfer the fuzzy
controller from the DSP to a secondary computer was taken. As the sun
conditions vary slowly and the wind generator inertia also implies a time
constant in the order of several seconds the solution has a reduced effect on
tracking the maximum power.
RS232
Generator
DC busFuzzy MPPT
Voltageconverter
Fig. 17 – Generators Fuzzy power control decentralization
A custom board with an integrated circuit (MAX3232) was built to allow the
interconnection of the serial interface of the DSP (SCI) to a running Windows
computer, through a standard RS232 connection (see Fig. 17). The used transfer
speed used is 34200 baud in order to reduce the communication time while
maintaining the error of clock differences in 0.06% (not covering errors due to
noise and other factors).
The fuzzy MPPT algorithm is worked out with a period of one second for
the photovoltaic and five seconds for the wind generator. The ‘long’ five
seconds update period of the MPPT of the wind generator is related with the
time constant of the generator and the algorithm used to implement it – MePPT.
Due to the high wind turbulence at the generator site1 – presented in Fig. 19 and
Fig. 20 – and large turbine inertia, for most of the experiments a fixed duty
factor for the wind generator is used.
1 Near tall trees of a military compound in a small valley field

127
Fig. 18 – Wind generator location (perspective erroneous shows wind generator higher than
trees)
0
0,5
1
1,5
2
2,5
3
3,5
4
15:25:00 15:26:00 15:27:00 15:28:00 15:29:00 15:30:00
I [ A
]
Fig. 19 – Local wind dynamics
0
0,5
1
1,5
2
2,5
3
3,5
4
11:45 12:45 13:45 14:45 15:45 16:45 17:45 18:45
I [A
]
Fig. 20 – Local wind dynamics (several hours)
To avoid the commutation glitches on the voltage/current values caused by
the DC-DC converter commutation a delay before sampling of voltage and
current, necessary to compute the duty cycle of the converters to achieve the
maximum power, is implemented. A measure of the time to settle is taken and
this value transformed in a dummy delay before the actual ADC sampling and
conversion.
for (i=0; i<N; i++) ;
get_adc_values();
With each iteration taking approximately 133 ns, N was defined as 15 giving
a delay of 2 us.

128
BoostDC-DC
converter
DC bus
VI
ε∆ε
Fig. 21 – Fuzzy MPPT controller
The fuzzy algorithm takes the error (1
1
−
−
−−=
kk
kkk VV
PPε ) and change of error
( 1−−=∆ kkk εεε ) of the PV power using five membership functions for each
input and five memberships for coding of the output – the duty factor for the
converter. The fuzzy controller (Fig. 21) seeks to reach an null error (MPP
where dP/dV = 0 – see Fig. 22) with the sign of error defining the right or left
side from the MPP and with the sign of change of error defining if the iteration
is approaching or moving away the operating point from the MPP.
MPPε = 0
dε
P
V Fig. 22 – PV power curve and fuzzy inputs
The fuzzyfication of the inputs is made through 5 triangular shape
membership functions, from left to right: NB, NS, Z, PS, PB, for both the inputs
and the output. N means negative, P means positive, B means big, S means
small and Z means zero.
Z Z PB PB PBZ Z PS PS PS
PS Z Z Z NSNS NS NS Z ZNB NB NB Z Z
NB NS Z PS PBNBNSZ
PSPB
dε
ε
Fig.23 – Fuzzy rule base

129
The table of Fig.23 implements the inference between the inputs and the
outputs driving the operating point to move towards the MPP. For instance, if
the operating point is in the right side of the power curve and is moving to the
right – ε(t) = Nx and dε(t) = Nx (where x means either B or S) – then the output
is Z, that is the operating point tend to stop near the last point. This condition
makes ε(t) to stay Nx but now dε(t) tends to be Z. This present condition makes
the output to be Px, which implies an increase of the duty factor that, applied to
the booster converter, makes the operating point to move to the left towards a
increase of the power (reducing the voltage and increasing the current).
0
20
40
60
80
100
120
140
160
14:20:30 14:20:45 14:21:00 14:21:15 14:21:30 14:21:45 14:22:00 14:22:15 14:22:30
Ppv
[W]
MPPT OFF
MPPT ON
Fig. 24 – Fuzzy MPPT operation
Fig. 24 shows that the PV MPPT tracks correctly the maximum power
operating point increasing the power until returning to the maximum power
level. The results were taken turning off the MPPT and turning it on again to
observe the behavior of the fuzzy controller. The display is made in Excel based
on the values stored in file by the Labview interface since it is a relatively slow
process.
Individual PV power-voltage characteristics are showed in Fig. 25 and the
parallel connection power voltage characteristic curve in Fig. 26. These results
are obtained varying linearly the duty factor from 0% to 85% (allowed
maximum for switch protection) and obtained from the data saved on file by the
Labview interface and created with Excel.

130
Policrystalin (80 Wp) Monocrystalin (85Wp)Policrystalin (80 Wp) Fig. 25 – Power vs Voltage characteristic curves for each of the three PV panels used – displays
taken with Labview interface for consecutive duty cycle variation from 0 through 0.85.
Fig. 26 - Power vs Voltage characteristic curve for the three parallel connected PV panels used
P
V Fig. 27 – Power versus Voltage curves shapes for PV and wind generator
The MPPT controller for the wind generator uses the same fuzzy controller
with different membership values since the shape of the power curve is
approximately the same as can be seen in Fig. 27. The difference would be the
triggering time: fixed in 1 second for the PV and a function of the DC power for
the wind power. The wind MPPT mechanism is presented in chapter 3 and is
based on the wind generator DC power output. A new duty factor is computed
when the power produced following the previous duty factor change settles in a
constant value. Tests on the wind generator showed a delay between the change
of operating conditions (converter duty factor change) and the settle of the new

131
generated power governed by the generator inertia in the order of the 5 seconds.
The MePPT mechanism changes the operating conditions increasing or
decreasing the duty factor and waits for the DC power generated to be stable to
move to the next MPPT iteration. This scheme is operational if the time constant
of the wind speed change is larger than the inertia time constant.
Experiments with the MePPT are presented in a Code Composer Studio
display (TI DSP programming environment) for a time frame of 45 seconds -
Fig. 28. The wind speed was taken from a wind sensor, located in the mast of
the wind generator for test purposes. It can be seen the increase of power in
response to the variation of the power converter duty cycle, but only when the
wind speed is relatively constant otherwise the dynamics of the wind change
overcomes the MePPT control. While the particular location of the wind
generator does not favour the operation, a less turbulent wind location makes the
MePPT a contributor to the maximization of the gathered wind.
w in d ~ c te .
D
P
w in d ~ c te .
D
P
Fig. 28 – Experiment results with DC MPPT
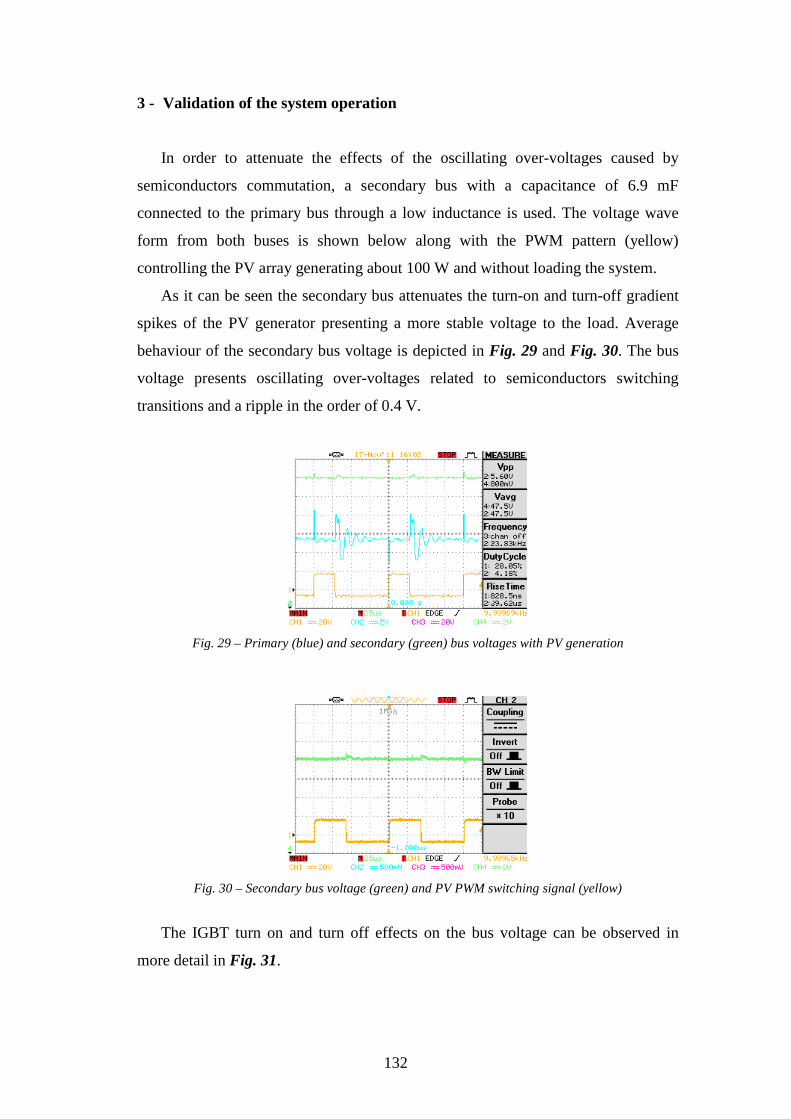
132
3 - Validation of the system operation
In order to attenuate the effects of the oscillating over-voltages caused by
semiconductors commutation, a secondary bus with a capacitance of 6.9 mF
connected to the primary bus through a low inductance is used. The voltage wave
form from both buses is shown below along with the PWM pattern (yellow)
controlling the PV array generating about 100 W and without loading the system.
As it can be seen the secondary bus attenuates the turn-on and turn-off gradient
spikes of the PV generator presenting a more stable voltage to the load. Average
behaviour of the secondary bus voltage is depicted in Fig. 29 and Fig. 30. The bus
voltage presents oscillating over-voltages related to semiconductors switching
transitions and a ripple in the order of 0.4 V.
Fig. 29 – Primary (blue) and secondary (green) bus voltages with PV generation
Fig. 30 – Secondary bus voltage (green) and PV PWM switching signal (yellow)
The IGBT turn on and turn off effects on the bus voltage can be observed in
more detail in Fig. 31.

133
Fig. 31 – Switch turn-on/off effect on the bus voltage (green)
The effect on the bus voltage (green) and on the PV array current generated
(blue) is depicted in Fig. 32
Fig. 32 – Turn-on/off effect on the bus voltage (green) and PV current (blue)
From these displays it can be observed that the turn-on/off of the switch
generates glitches that must be taken in consideration at the sampling/conversion of
voltage/current values for the MPPT and power control to avoid obtaining erroneous
values. The analysis of the displays shows a relatively longer effect off the turn-off
– about 2 us (Fig. 33) – and therefore that is this time that will be taken in
consideration. This time is integrated in the control of the system by adding a
software delay of approximately 2 us before actual sampling and conversion.

134
2 us
Fig. 33 – Turn-off effect on the voltage and current from the PV (both quantities taken from the PV
side of the converter)
Fig. 34 – Currents from the PV array – PV side (blue) and bus side (green)
Fig. 34 shows the currents of the PV array at the PV side (blue) and at the bus
side of the converter (green). The bus side has a relation of 1 V to 2.5 A which
means a glitch in the order of 5A at the moment of turn off and of 1 A in the turn on
and a negligible DC ripple. The PV side has a relation of 1V to 16.7 A which means
a glitch in the order of 10 A at turn off and 3.33 A at turn on also with a negligible
DC ripple. The smaller glitches appearing at a ratio of approximately 32% are due to
the turn off of the battery buck converter working to transfer the excess of power
from the bus to the storage unit. This PWM wave is not showed in the display due to
the used converters topology and system architecture which would cause a short
circuit since the voltage references of the oscilloscope are all the same.
The switching effects by the generating (PV) and storage units also appear in
non working units as the load current as can be observed in Fig. 35 and with more
detail in Fig. 36.

135
Fig. 35 – Switch commutation effect on null load current (blue) and bus voltage (green)
Fig. 36 – Switching effects on load current (blue) and bus voltage (green)
The spikes in the load current correspond to a current variation of 3.5 A
Fig. 37, Fig. 38 and Fig. 39 show the system response to three different loads,
respectively 50, 115 and 173 W. Bus voltage remains at steady-state regimen with a
ripple from 0.1 V to 0.2 V in the first and third case respectively. The load current
presents a DC ripple of 0.15 A to 0.2 A in the case of 50 W and 173 W respectively.
Fig. 37 – System with 50 W load (blue), without renewable generation (yellow) and storage
(magenta) operating to deliver the power to the load through the DC bus (green)

136
Fig. 38 – System with 115 W load (blue), without renewable generation (yellow) and storage (magenta) operating to deliver the power to the load through the DC bus (green)
Fig. 39 – System with 173 W load (blue), without renewable generation (yellow) and storage (magenta) operating to deliver the power to the load through the DC bus (green)
While in fact existing, the fast spikes caused by the physical commutation of the
switches (IGBT and diodes) are not a major obstacle to the correct functioning of
the system as the DC components demonstrates. They could nevertheless be
controlled by appropriate snubbers but as the present work is not fundamentally
related with the electronics particularities it was not treated. They nevertheless
appear in the long term displays as the used in the Labview interface that could lead
to erroneous interpretation of the behaviour of the hybrid power system. Therefore
“hiding” those spikes through filters shows a system that behaves correctly
managing the input and output energy and maintaining the system controlled in the
presence of renewable generation fluctuations.
The dynamic characteristics of the system with both generators producing and
with a load consuming are presented in the following displays (Fig. 40 to Fig. 42).

137
Fig. 40 – System with reduced renewable generation (PV and wind) supplying a 50 W load. Bus
voltage (green), load current (magenta), wind current (blue) and PV current (yellow)
Fig.41 – System with PV and wind production supplying a load with 50 W (1.1 A). Bus voltage
(green), load current (magenta), wind current (blue) and PV current (yellow)
Fig. 42 – System with PV reduced production and wind supplying a 50 W load. Bus voltage (green),
load current (magenta), wind current (blue) and PV current (yellow)
The previous displays show the voltage in the DC bus and the current to a load
which remain constant for different values of renewable generation.
Fig. 43 shows the behaviour of the system with renewable generation – wind
and photovoltaic – and loading for a time of 7 minutes. Data collected in the
Labview interface (1 second period) and the display created in Excel. Load
consisted in two constant values 225 W and 115 W respectively higher and lower

138
than the sum of PV and wind generation. As referred before, data was filtered at the
input of the Labview interface to hide the spikes showing therefore only the DC
value. The change of load was accomplished through the interface at 14:55:05.
Consistent with the former displays taken with the oscilloscope the bus voltage and
the power delivered to the load remains constant while the wind variation caused
renewable generation to fluctuate causing either excess either deficit of power in the
bus. The battery controllers take care of that difference with the battery delivering
the deficit and storing the excess. The change from charge (DC bus excess power) to
discharge (DC bus power deficit) appears in a smooth way not reflecting it in the
bus voltage neither in the load power. Fig. 44 shows about the same context but
with continuous load stepping in order to demonstrate the storage control
capabilities to follow continuous differences of load.
0
50
100
150
200
250
300
350
400
450
500
14:53 14:54 14:55 14:56 14:57 14:58 14:59 15:00
[ W ]
0
10
20
30
40
50
[ V ]
Pload Pboost (Bat) Pbuck (Bat) Ppv Peol Vbus Fig. 43 – Long term behaviour of the system with timed constant loading and renewable generation
0
50
100
150
200
250
300
350
400
450
500
14:46:00 14:46:10 14:46:20 14:46:30 14:46:40 14:46:50 14:47:00 14:47:10 14:47:20 14:47:30
[ W ]
0
10
20
30
40
50
[ V ]
Pload Pboost (Bat) Pbuck (Bat) Ppv Peol Vbus Fig. 44 – Long term behavior of the system with step loading and renewable generation
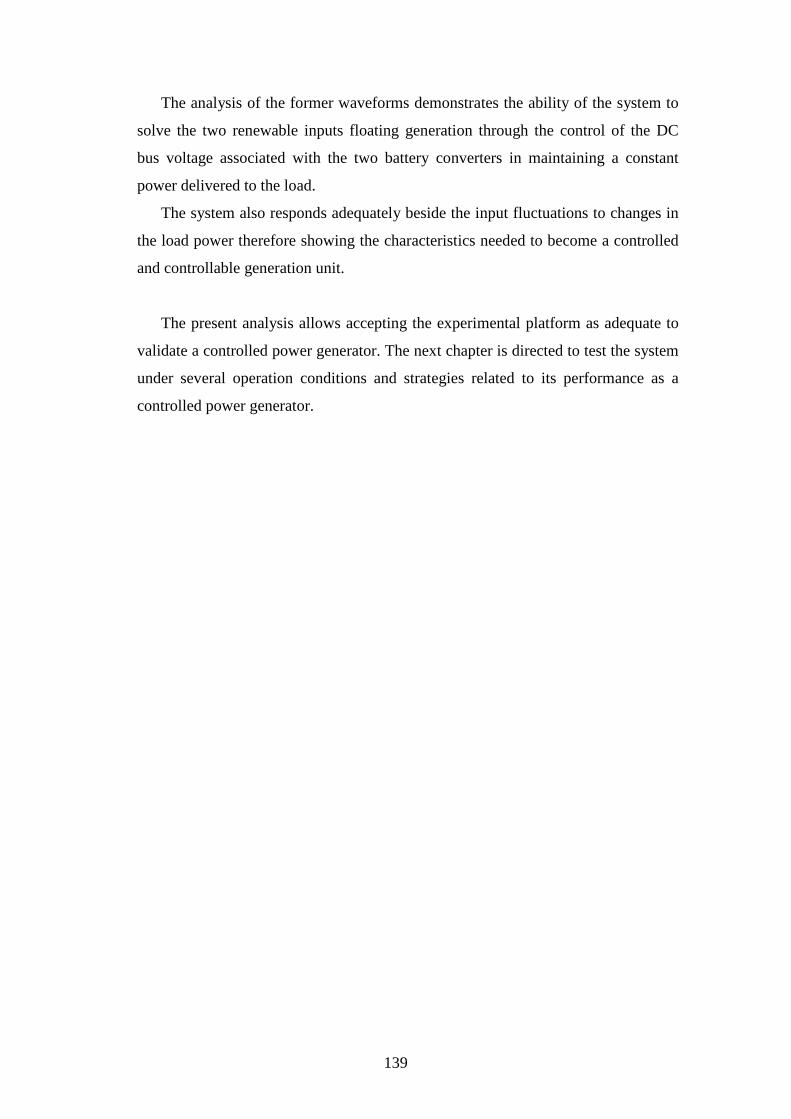
139
The analysis of the former waveforms demonstrates the ability of the system to
solve the two renewable inputs floating generation through the control of the DC
bus voltage associated with the two battery converters in maintaining a constant
power delivered to the load.
The system also responds adequately beside the input fluctuations to changes in
the load power therefore showing the characteristics needed to become a controlled
and controllable generation unit.
The present analysis allows accepting the experimental platform as adequate to
validate a controlled power generator. The next chapter is directed to test the system
under several operation conditions and strategies related to its performance as a
controlled power generator.

140
References
[1] J. Murphree, B. Brzezinski, J. Parker, “Using a Fixed-Point Digital Signal Processor as a PID
Controller”, Proceedings of the 2002 American Society for Engineering Education Annual
Conference & Exposition, 2002

141
Chap. VI – System performance
As stated in previous chapters modern hybrid power systems are intended to be able
of transforming stochastic power in deterministic power and energy. This capability
aims at increasing the grid power quality and enlarging the potential of offering grid
services. Both characteristics leverage the economic value of distributed generation
systems not only because they can present stable and known power delivering but also
because they allow an owner to be free to deliver power when he considers it beneficial.
A renewable sources based hybrid power system which is controllable is well fit to
political trends toward energy independence and to the environmental concerns while
providing an answer to technical concerns from the grid operators.
Considering this framework several operation strategies are possible with the
present hybrid system. These strategies have already been presented in chapter IV and
are recalled briefly here:
- The selling of renewable energy in a constant power format (day ahead market
energy selling with constant power delivering).
- The reduction of the energy acquired from the grid in a constant/not constant
amount format, the hybrid system providing the difference from the local
necessity (peak hour’s energy shaving).
- Satisfying extemporaneous requests of energy from the grid (spin reserve
service like).
The referred operating strategies can be tested through:
- The ability to provide a constant power over a pre-defined period even when the
renewable sources are floating.
- The ability to change delivered constant power without affecting its quality.
- The ability to manage renewable gathered energy so that it is available when
needed.
- The ability to forecast the inaptitude to maintain the expected deliverable power.
- The ability to satisfy extemporaneous power requests in unscheduled times
(although with previously agreed maximum energy).

142
Tests to assess these capabilities are conducted with real meteorological conditions
and controlled load changes. The load changes are performed in a pre-programmed
form in order to simulate real operating conditions of external and/or previously agreed
(contracted) load requests. The loading is applied, when applicable, following the
commercial conditions of tariffs and correspondent timing: higher power at peak hours
followed by medium power over full hours. In all delivering periods the power is
intended to remain constant and equal to the pre-defined value. The deliverable load
power amounts encompass several possible associations of 5, 17, 48, 115 and 173 W the
maximum attainable power being the sum of all (374 W). This last value is conditioned
by the actual lead-acid battery capabilities.
Displays shown are built in Excel and are based on results acquired and saved by the
Labview data acquisition interface. Because these displays have a large time frame the
resultant time compression shows the spikes mentioned in chapter V as a large value
ripple. This note is evidenced in Fig. 1 for the photovoltaic case and analogous to other
variables shown in displays.
Fig. 1 – Commutation spikes and the large ripple resultant of time compression and detail for a narrower
time frame
1 - Pre-programmed stepped load
The present experiment consists in supplying two hours with a constant power of
160 W and twelve hours with a constant power of 50 W. The rest of the time the loading
is zero. The first value is related with peak hours and is further divided in two periods of

143
time: from 09:00 to 10:30 and from 18:00 to 20:30. The second value is related with full
hours and is further divided in three periods: from 08:00 to 09:00, from 10:30 to 18:00
and from 20:30 to 22:00. These values, both pre-programmed and delivered, are
depicted in Fig. 2. The period initial capacity of the battery is 92% (QN = 195 Ah)
thereafter allowing to deliver a higher energy amount value than the pre-programmed
value for the experiment day.
Fig. 2 - Pre-programmed (black) and delivered (red) load
The aggregated results of all relevant values are presented in Fig. 3. The experiment
is performed in late fall in a windless and cloudy sky day. The renewable sources
gathered power and the behaviour of the battery power transfer are depicted in Fig. 4.
Several relevant details of the running operation of the HRES are displayed in Fig. 5
through Fig. 8.
Without accounting for the spikes, the delivered power that was scheduled is
respected (see also Fig. 3). The floating PV power behaviour is followed by the battery
controllers/converters with the battery charging and discharging as needed to maintain
the bus voltage and load power constant. The constancy of the bus voltage and load
current during the power excursions of the PV, the changes from charging to
discharging of battery power and changes of load power is evidenced in Fig. 5 to Fig. 8.
As the scheduled load energy has revealed to be higher than the actual gathered
renewable energy the charge of the battery decreases to 66%.
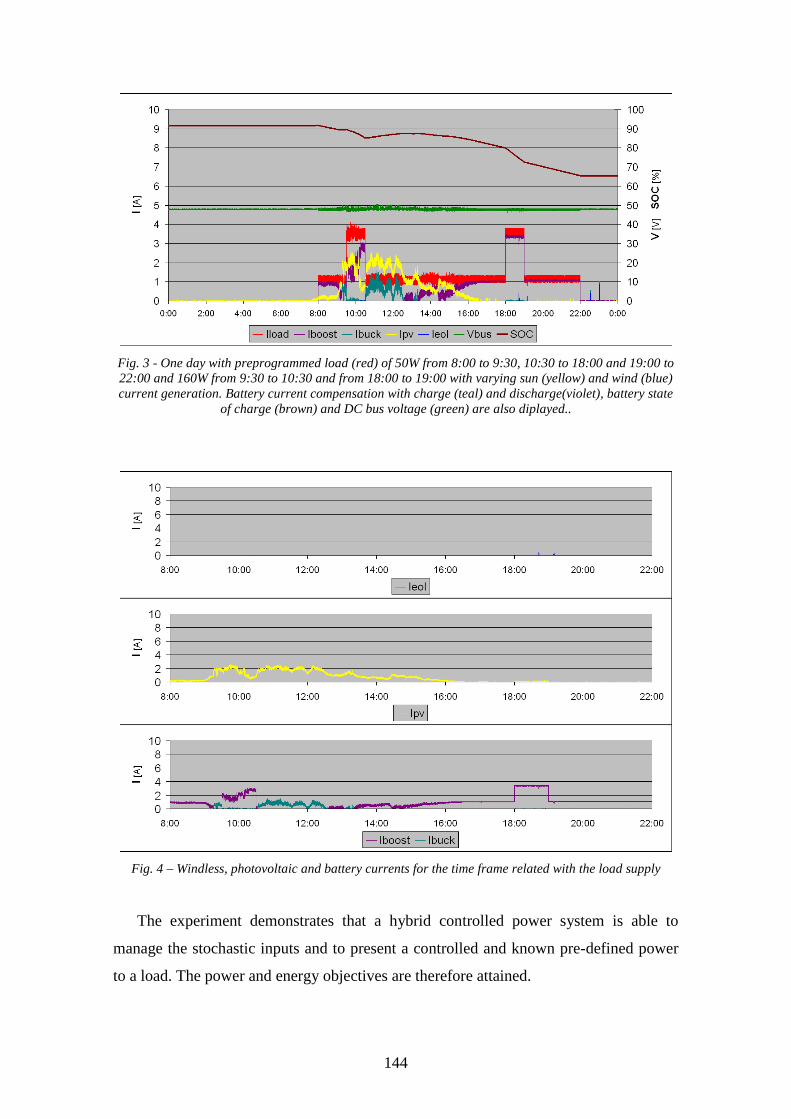
144
Fig. 3 - One day with preprogrammed load (red) of 50W from 8:00 to 9:30, 10:30 to 18:00 and 19:00 to 22:00 and 160W from 9:30 to 10:30 and from 18:00 to 19:00 with varying sun (yellow) and wind (blue) current generation. Battery current compensation with charge (teal) and discharge(violet), battery state
of charge (brown) and DC bus voltage (green) are also diplayed..
Fig. 4 – Windless, photovoltaic and battery currents for the time frame related with the load supply
The experiment demonstrates that a hybrid controlled power system is able to
manage the stochastic inputs and to present a controlled and known pre-defined power
to a load. The power and energy objectives are therefore attained.
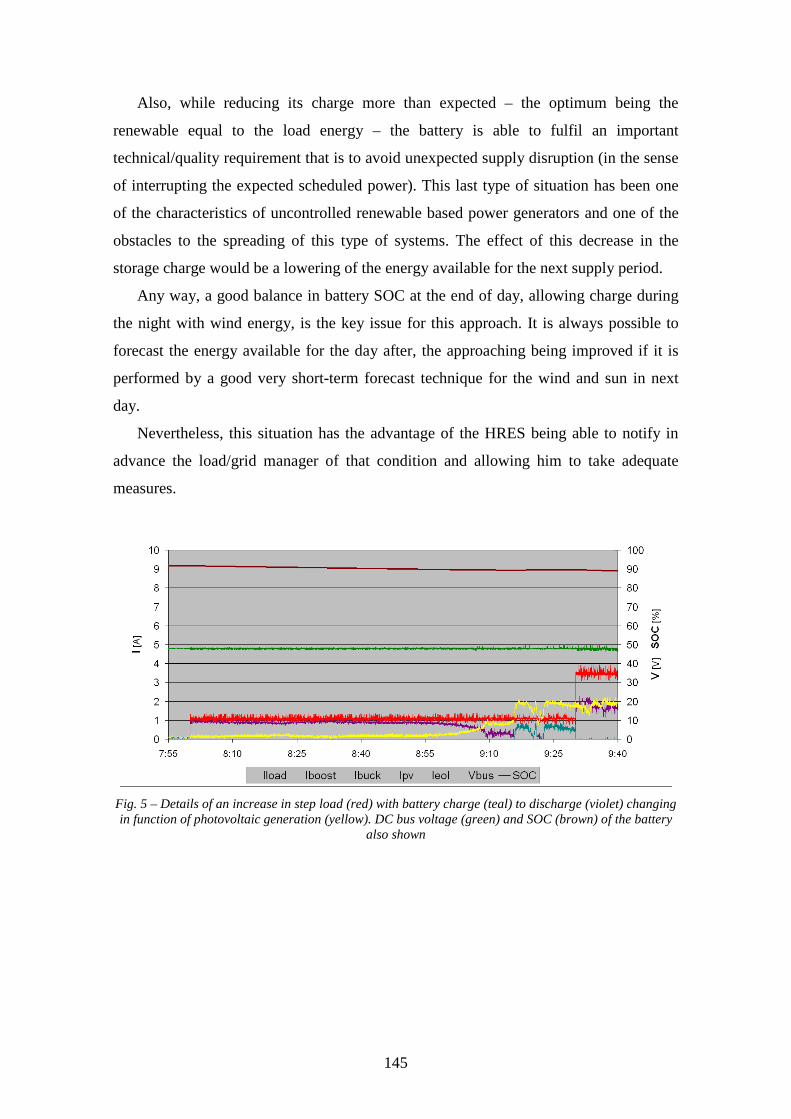
145
Also, while reducing its charge more than expected – the optimum being the
renewable equal to the load energy – the battery is able to fulfil an important
technical/quality requirement that is to avoid unexpected supply disruption (in the sense
of interrupting the expected scheduled power). This last type of situation has been one
of the characteristics of uncontrolled renewable based power generators and one of the
obstacles to the spreading of this type of systems. The effect of this decrease in the
storage charge would be a lowering of the energy available for the next supply period.
Any way, a good balance in battery SOC at the end of day, allowing charge during
the night with wind energy, is the key issue for this approach. It is always possible to
forecast the energy available for the day after, the approaching being improved if it is
performed by a good very short-term forecast technique for the wind and sun in next
day.
Nevertheless, this situation has the advantage of the HRES being able to notify in
advance the load/grid manager of that condition and allowing him to take adequate
measures.
Fig. 5 – Details of an increase in step load (red) with battery charge (teal) to discharge (violet) changing in function of photovoltaic generation (yellow). DC bus voltage (green) and SOC (brown) of the battery
also shown

146
Fig. 6 – Detail of the average and spikes values. Bus voltage (green), charge (teal), discharge (violet) and
photovoltaic generation (yellow) for a load (red) step increase
Fig. 7 – Detail of a decrease step load (red) with change of the battery discharge (violet) to charge (teal).
Photovoltaic generation (yellow) and bus voltage (green) also displayed
Fig. 8 – Detail of the average and spikes values. Bus voltage (green), charge (teal), discharge (violet) and
photovoltaic generation (yellow) for a load (red) step decrease

147
In order to be able to satisfy the preprogrammed load and taking in consideration
that it was not expected wind in the day, the previous day was dedicated to store enough
energy in the battery – Fig. 9. Load was activated only to avoid the lead acid battery
voltage rise higher than the manufacturer recommended values.
Fig. 9 – On day charging only to store enough energy for next day pre-programmed load
In order to show system behaviour with both renewable sources active another
experiment is performed. Fig. 10 shows the system behaviour in a day with wind and
clouds and Fig. 11 shows the details of the wind and sun currents generation and the
charge and discharge currents of the battery.
Load was activated during the day with the following characteristics: 9:00 to 10:00
with a light load then with a fast and brief load at 10:15 then with a very light load until
15:15 and again with stepped load from until 16:45 (see Fig. 12). This loading is
performed in order to analyze the HRES reacting to changing in both renewable inputs
along with load changes. Fig. 13 shows system behaviour faced to a relatively intense
and highly variable wind and sun variation by clouds. In this time frame there is no load
active and the battery controller is taking care of the highly fluctuating generated power,
charging the battery. The DC bus voltage remains constant as the battery controller
takes care of the power generated.
The behaviour of the system with both the power sources generating and a load
being supplied is presented in Fig. 14. While with a less intense but still variable wind
and sun the system maintains the bus voltage and therefore the load current stable.

148
Changes from battery charge to discharge can be observed without any appreciable
effect on system stability which is a determinant condition to the power quality of
controlled systems.
Fig. 10 – One day with wind and cloudy sun
Fig. 11 – Wind, sun and battery waveforms

149
Fig. 12 – Step loading used in the test
Fig. 13 – Loadless system with highly variable and relatively strong wind and photovoltaic power
Fig. 14 - System with variable wind and sun as well as step loading for a 45 minutes period

150
2 - Unscheduled power requests
The present experiment assesses the system capability for power availability in the
event of an unknown power and time external request. The experiment considers a time
frame of 15 minutes during which the power requested is constant to adapt to general
energy counting practice. Although the unscheduled power is unknown it is supposed a
restriction to a maximum deliverable power related with the maximum battery discharge
current capability.
The experiment is conducted in a cloudless day with relatively high intensity and
also very variable wind regime.
The loading that somehow follows the characteristic curve of grids power
consumption is presented in Fig. 15. It means to mimic a somehow ‘spinning reserve’
although the power remains constant for 15 minutes period. It is nevertheless possible to
implement another, more narrowed, time frame to adapt the system response to other
type of load/grid needs.
Fig. 15 – System extemporaneous load requests (black) constant in 15 minutes interval and delivered
load current (red)
Aggregated behaviour of all quantities involved in the system is depicted in Fig. 16
and the correspondent two renewable sources generation and battery charge and
discharge are presented in Fig. 17.
With higher dynamics than the previous experiment the system is still able to
control and regulate the various quantities in order to maintain bus voltage and load
constant during the required periods. The unscheduled power requests are satisfied as
required the system maintaining its stability. Fig. 18 depicts a 40 minutes interval where
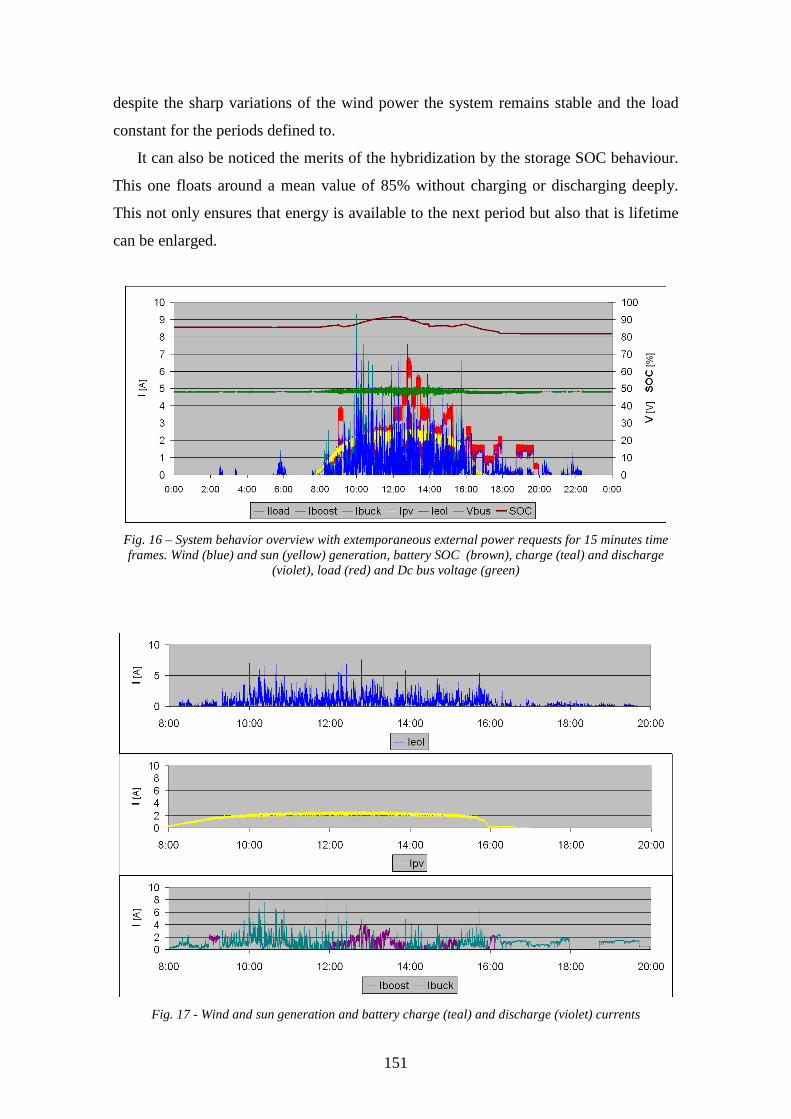
151
despite the sharp variations of the wind power the system remains stable and the load
constant for the periods defined to.
It can also be noticed the merits of the hybridization by the storage SOC behaviour.
This one floats around a mean value of 85% without charging or discharging deeply.
This not only ensures that energy is available to the next period but also that is lifetime
can be enlarged.
Fig. 16 – System behavior overview with extemporaneous external power requests for 15 minutes time frames. Wind (blue) and sun (yellow) generation, battery SOC (brown), charge (teal) and discharge
(violet), load (red) and Dc bus voltage (green)
Fig. 17 - Wind and sun generation and battery charge (teal) and discharge (violet) currents

152
Fig. 18 – Details of the various quantities variations during 40 minutes
3 - Conclusions
The experimental HRES was tested for the fundamental operating conditions which
represent the main system operating states, in order to validate it as a controllable
generation system based on renewable sources.
Tests with conditions of real variable input conditions were performed with the
HRES maintaining its stability while managing efficiently the power flows among its
inputs and the battery. The transitions between charge and discharge are also presented
without interfering with the HRES stability.
Accompanying the inputs variations, two types of loading were performed. The first
type corresponds to the pre-programmed one, either in time or in value, and the second
one corresponds to an unscheduled, also either in time or in value. For the both cases
the HRES is able to maintain its stability and to comply with the required pre-
programmed load.
The battery unit is able to fulfil its requirements charging and discharging as needed
to ensure the availability of power namely in the more demanding case of one complete
day with peak and full tariff hours. Tests demonstrate the viability of the energy transfer
from one period to other which is one of the objectives established for such type of

153
systems and therefore the viability of an economic management for the renewable
energy.
Finally the power control of the sources is able of keeping on extracting the
maximum power of the sources.

154

155
Chap. VII – Conclusions and future research
As stated in chapter I distributed generation benefits encompass the possibility of
using small systems with the advantages of possessing the following characteristics:
reduced power – adaptable to the local needs
fast installation time
locatable near the loads
isolated or grid interconnected operated
able of offering grid services
allow the deferment of grid investments due to delaying of grid
expansion
embrace renewable generation sources
In the other side, issues like the non-dispatch ability of renewable based generation,
causing grid quality degradation and the incapability of services provision (namely
system services), are concerns that must be addressed to ensure the spread of such type
of systems.
Part of the system services, regarding DG electronically interconnected to the grid,
are presently a function of the inverter control characteristics. But they are dependent on
their own input power availability to be addressable.
Availability of power over certain periods is a central issue for power quality and
leverages the merits of controllable power units. Considering new grid architectures like
microgrids and their capability to operate in islanded mode, the existence of renewable
based generation units which are controllable further reinforces their role as energy
generation systems.
For renewable based sources generation units the controllability along with external
control, made possible through communication capabilities, are base requirements for
what is perceived as the future of electrical grids.
Being able to provide constant power over the renewable power variations and over
the load changing is one of the main objectives of the hybrid renewable based power
system - HRES. As showed in chapter 5 and 6 this objective is accomplished as the
services provision is possible.

156
The ability of the system to gather continuously the sources maximum power
regardless of the environment dynamics along with the stability of the delivered load
power also demonstrates the economic potential of the present HRES.
Finally the successful energy transfer from lower to higher profitable time periods
also evidences that the possibility of taking advantage of the price tariffs is attainable
although being dependant of the energy characteristics of the storage technology.
This energy transfer also reflects on technical possibilities for grid operators to
move energy between low and high consumption periods. This operational objective
can be accomplished either directly through the injection of stored energy plus
renewable controlled generation or by some agreement established with consumers
where the power gathered from the grid in those periods is limited, the remaining being
delivered by the controlled HRES (peak shaving concept).
In all the cases the system allows the user to be notified, in advance, of eventual
change of operating conditions (for instance the depletion of storage along with low
renewable power generation), giving him time to take preventive measures.
The applied hybridization (photovoltaic and wind) lowers the dependence on each
of the sources and, consequently, on the storage. The last one is a weak link of the
system, not only technically – it is a highly nonlinear dynamic element – but also
financially. The type of charging/discharging in such type of systems is not favourable
to a large life cycle thus increasing their cost (replacement).
The bus voltage being controlled by the battery converters, allows at freeing the
control of the sources for continuous extraction of their maximum available renewable
energy. This characteristic leverages the ratio that relates energy value to investment
made in the renewable technology, by the increase of the gathered energy amount by
period of time. It nevertheless is conditioned by the storage characteristics.
The last issue calls for further research in storage technologies. Namely capacitor
based technology to cope with fast power density and hydrogen to cope with energy
density. These are two storage technologies that are relatively mature actually although
the latter one suffering from hydrogen generation issues. The use of different, more
performing, electrochemical technologies is also a possible immediate improvement.
The storage of energy in a kinetic form, as in free-wheels, is another particular
technology that has been applied in specific applications.

157
The effect of the decrease in the storage charge would be a lowering of the energy
available for the next supply period. Nevertheless, this situation has the advantage of
being able of notifying in advance the load/grid manager of that eventuality and
allowing him to take adequate measures such as to provide an alternative supplier. This
last consequence, which has commercial and financial repercussions for the energy
producer, stresses a strong need for a more effective forecasting, namely for very short-
term conditions.
Being digitally controlled opens additional possibilities such communication and
consequently external control from, as an example, a grid operator interested in
controlling the power injected not only in an energy perspective but also in a power
perspective. Also interesting is the possibility of programming the system to accomplish
pre-defined different strategies.
The present system implements those perspectives in a satisfactorily way justifying
the deepening of research and development of renewable based power systems with
some connection to the electric grids. It responds affirmatively to the requirements of
controllability, flexibility and economic needs as well as to environmental concerns.
Beside the very small scale involved in the present platform, although scalable to higher
power, the dissemination of such a type of systems – similar to the V2G strategy of
using already existent but temporarily not used capacity – has potential to join
environmental concerns with grid operators concerns in a single system.
The strategy of selling and avoiding buying can lower the need for measures to
ensure power quality and for the expansion of generation capacity, specially in cases
dictated by short peak power needs and not by steady consumption growth. In a more
private home owner perspective such type of system also has an importance in the
reduction of the local grid consumption in high tariff periods which reflects in a bill
reduction and in a lowering of the grids peak power. The last component should be
considered as a service to the grids and as such to be the object of a rewarding value.
Therefore it can be concluded that:
- The integration of different renewable energy sources into a unique electric
energy generation system (HRES) improves generated energy quality as
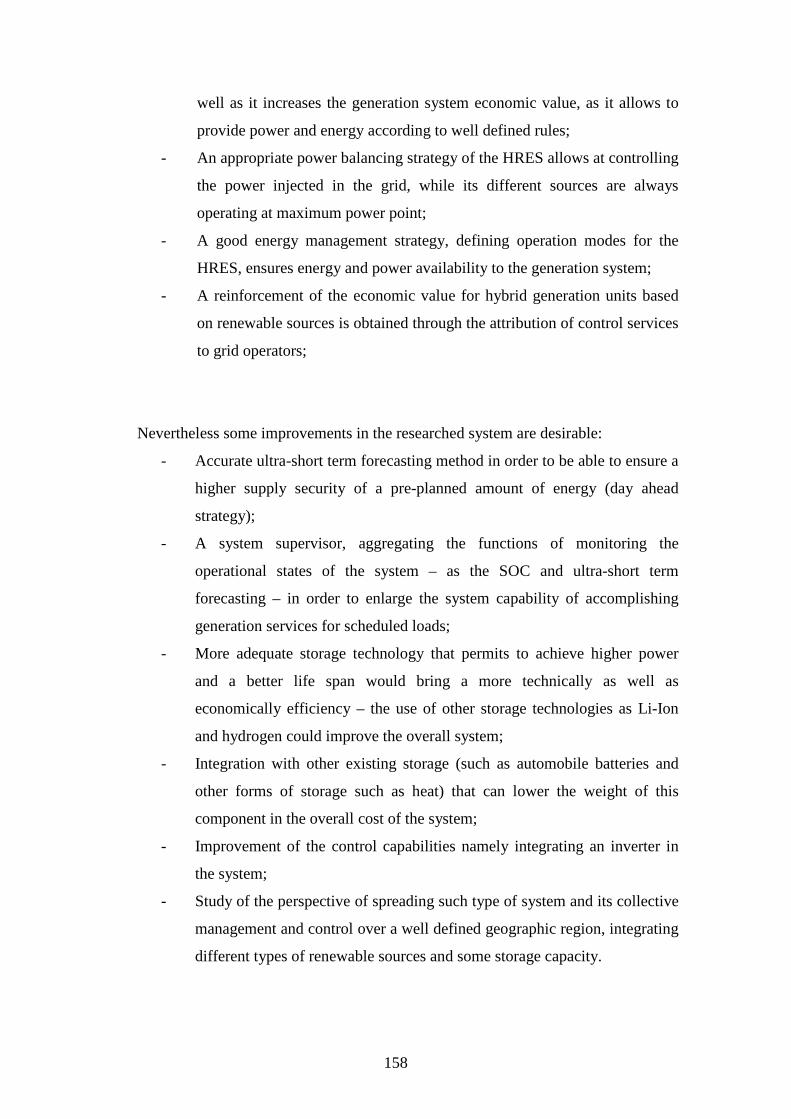
158
well as it increases the generation system economic value, as it allows to
provide power and energy according to well defined rules;
- An appropriate power balancing strategy of the HRES allows at controlling
the power injected in the grid, while its different sources are always
operating at maximum power point;
- A good energy management strategy, defining operation modes for the
HRES, ensures energy and power availability to the generation system;
- A reinforcement of the economic value for hybrid generation units based
on renewable sources is obtained through the attribution of control services
to grid operators;
Nevertheless some improvements in the researched system are desirable:
- Accurate ultra-short term forecasting method in order to be able to ensure a
higher supply security of a pre-planned amount of energy (day ahead
strategy);
- A system supervisor, aggregating the functions of monitoring the
operational states of the system – as the SOC and ultra-short term
forecasting – in order to enlarge the system capability of accomplishing
generation services for scheduled loads;
- More adequate storage technology that permits to achieve higher power
and a better life span would bring a more technically as well as
economically efficiency – the use of other storage technologies as Li-Ion
and hydrogen could improve the overall system;
- Integration with other existing storage (such as automobile batteries and
other forms of storage such as heat) that can lower the weight of this
component in the overall cost of the system;
- Improvement of the control capabilities namely integrating an inverter in
the system;
- Study of the perspective of spreading such type of system and its collective
management and control over a well defined geographic region, integrating
different types of renewable sources and some storage capacity.

159

160

161
Anex 1 Wind turbine
Manufacturer: Bergey Model XL.1 Nominal power : 1 kW (max: 1.3 kW) Rotor diameter: 2.5 m Start-up Wind Speed: 3 m/s Cut-in Wind Speed: 2.5 m/s Rated Wind Speed: 11 m/s Furling Wind Speed: 13 m/s Max. Design Wind Speed: 54 m/s Type: 3 Blade Permanent Magnet Alternator In nacelle diode rectification Overspeed Protection: AUTOFURL
Photovoltaic panels
Manufacturer: BP Model: 380U Multicrystalline Peak power: 80 W VMPP: 17.6 V IMPP: 4.55 A Short circuit current: 4.8 A Open circuit voltage: 22.1 V Temperature coefficient of short circuit current: (0.065±0.015)%/ºC Temperature coefficient of voltage: -(80±0.05)mV/ºC Manufacturer: BP Model: 585U Monocrystalline Peak power: 85 W VMPP: 18 V IMPP: 4.72 A Short circuit current: 5 A Open circuit voltage: 22.1 V Temperature coefficient of short circuit current: (0.065±0.015)%/ºC Temperature coefficient of voltage: -(80±10)mV/ºC
Lead acid battery
Manufacturer: Autosil Model: E series, E12-195 Voltage: 12 V Capacity: 195 Ah
Top Related