


Languages
Pages
Legal


431
Inherent Variation in Stable Isotope Values and Discrimination
Factors in Two Life Stages of Green Turtles
* Corresponding author; e-mail: [email protected].
Physiological and Biochemical Zoology 85(5):431–441. 2012. � 2012 by TheUniversity of Chicago. All rights reserved. 1522-2152/2012/8505-1175$15.00.DOI: 10.1086/666902
Hannah B. Vander Zanden1,*Karen A. Bjorndal1
Walter Mustin2
Jose Miguel Ponciano3
Alan B. Bolten1
1Archie Carr Center for Sea Turtle Research and Departmentof Biology, University of Florida, P.O. Box 118525,Gainesville, Florida 32611; 2Cayman Turtle Farm, P.O. Box812, Grand Cayman KY1-1301, Cayman Islands;3Department of Biology, University of Florida, P.O. Box118525, Gainesville, Florida 32611
Accepted 5/26/2012; Electronically Published 8/3/2012
Online enhancements: appendixes.
ABSTRACT
We examine inherent variation in carbon and nitrogen stableisotope values of multiple soft tissues from a population ofcaptive green turtles Chelonia mydas to determine the extentof isotopic variation due to individual differences in physiology.We compare the measured inherent variation in the captivepopulation with the isotopic variation observed in a wild pop-ulation of juvenile green turtles. Additionally, we measure diet-tissue discrimination factors to determine the offset that occursbetween isotope values of the food source and four green turtletissues. Tissue samples (epidermis, dermis, serum, and redblood cells) were collected from captive green turtles in twolife stages (40 large juveniles and 30 adults) at the CaymanTurtle Farm, Grand Cayman, and analyzed for carbon andnitrogen stable isotopes. Multivariate normal models were fitto the isotope data, and the Bayesian Information Criterionwas used for model selection. Inherent variation and discrim-ination factors differed among tissues and life stages. Inherentvariation was found to make up a small portion of the isotopicvariation measured in a wild population. Discrimination factorsnot only are tissue and life stage dependent but also appear tovary with diet and sea turtle species, thus highlighting the needfor appropriate discrimination factors in dietary reconstruc-tions and trophic-level estimations. Our measures of inherentvariation will also be informative in field studies employing
stable isotope analysis so that differences in diet or habitat aremore accurately identified.
Introduction
Stable isotope analysis is commonly used to investigate con-sumer foraging patterns in ecological studies. Dietary recon-structions through mixing models and trophic-level estimationsrely on diet-tissue discrimination factors (the difference be-tween stable isotope values of an organism’s tissue and diet).More recent applications using carbon and nitrogen stable iso-tope compositions (d13C and d15N, respectively) to examinetrophic niche and specialization rely on measures of stable iso-tope variance within the population (Araujo et al. 2007; Laymanet al. 2007b; Newsome et al. 2007; Vander Zanden et al. 2010).The isotopic niche is used as a proxy for ecological dimensionsof resource use because the stable isotope ratios in the tissueof an organism represent the assimilated diet (Layman et al.2007a; Vaudo and Heithaus 2011). Additionally, specializationcan be inferred by examining the isotopic variation of a pop-ulation or an individual through time. Low variation indicatesspecialization, while substantial variation indicates generaliza-tion (Bearhop et al. 2004; Martınez del Rio et al. 2009a; New-some et al. 2009; Vander Zanden et al. 2010).
In many studies, isotopic variation is attributed to diet andhabitat differences, but it can also result from variation in theisotopic composition within a prey species, inherent variationin the consumer, and measurement error (Bearhop et al. 2002;Matthews and Mazumder 2004; Phillips and Eldridge 2006;Barnes et al. 2008). Inherent variation in stable isotope values(hereafter referred to as “inherent variation”) is a consequenceof isotopic deviations that arise from individual differences inphysiology despite consuming the same diet and experiencingcontrolled conditions. Although not often quantified, inherentvariation could substantially affect conclusions based on stableisotope data. Inherent variation can depend on the species, life-history stage, and environment (Barnes et al. 2008), yet mea-surements of such variation from animals on controlled dietsare sparse (Matthews and Mazumder 2004; Sweeting et al. 2005;Barnes et al. 2008; Seminoff et al. 2009). In one case, inherentvariation made up a large portion of the isotopic variance mea-sured in a wild population of sea bass Dicentrachus labrax(Barnes et al. 2008). Therefore, inherent variation should beconsidered when generating inferences about foraging patternsin wild populations. If it is assumed that all isotopic variationobserved is due to differences in diet and habitat use, then the
432 H. B. Vander Zanden, K. A. Bjorndal, W. Mustin, J. M. Ponciano, and A. B. Bolten
resulting isotopic niche or level of generalization may beoverestimated.
Diet-tissue discrimination is represented as D p d �tissue
and results from processes such as fractionation duringddiet
metabolic transformations and isotopic routing (Martınez delRio et al. 2009b). Accurate diet-tissue discrimination factorsare essential to estimate trophic level and reconstruct diets, andvariation in the discrimination factor should be accounted forin mixing models (Post 2002; Wolf et al. 2009). Many studieshave used generalized discrimination factors because of the lackof species-specific values, yet the use of such values can leadto large errors or meaningless results in the output of mixingmodels (Caut et al. 2009).
Consumer tissues are often enriched in 15N and 13C comparedwith their diets (DeNiro and Epstein 1978; DeNiro and Epstein1981; Post 2002), though discrimination factors may vary withlife stage, environment, form of nitrogenous waste excretion,taxon, species, tissue, diet quality, and diet isotopic composition(Vander Zanden and Rasmussen 2001; Vanderklift and Ponsard2003; Caut et al. 2009). The commonly used diet-tissue dis-crimination value for nitrogen (D15N) is 3.4‰ (DeNiro andEpstein 1981; Post 2002). Values of D13C are typically muchsmaller than D15N values, resulting in a reduced trophic shiftin d13C values as nutrients are transferred through the foodweb (DeNiro and Epstein 1978).
The first objective of our study was to quantify the inherentvariation in a captive population of green turtles Chelonia my-das fed a consistent diet. We examined the variation in stableisotope values—our measure of inherent variation—in fourtissue types (epidermis, dermis, serum, and red blood cells)and two life stages (large juveniles and adults). We then com-pared our measure of inherent variation in epidermis with theisotopic variance observed in a wild population. The secondobjective of our study was to measure discrimination factorsfor each of the four tissues in both juvenile and adult greenturtles maintained on an isotopically consistent diet. Further-more, we incorporated the measure of inherent variation inour estimates of the discrimination factors. We also comparedthe discrimination factors found here with other sea turtlespecies.
Material and Methods
Study Conditions
Green turtles were housed at the Cayman Turtle Farm (CTF)in Grand Cayman, British West Indies. These turtles are de-scendants of a mixed breeding stock made up of turtles fromat least four nesting populations (Wood and Wood 1980).Adults ranged from 10 to approximately 70 yr of age, from 92to 110 cm curved carapace length (CCL), and from 75 to 186kg. The large juveniles were approximately 4–6 yr of age andhad been raised in captivity. Their size ranged from 64 to 92cm CCL and 30 to 63 kg. At CTF, large juveniles grow atsubstantially higher rates (about 14 cm CCL/yr) than the samesize class in the wild (Wood and Wood 1993; Bjorndal et al.
2000), and adults at CTF grow very little, if at all, after sexualmaturity (Wood and Wood 1993).
The turtles were fed an extruded floating pellet diet man-ufactured by Southfresh Feeds at 0.5% body weight/d for 4 yrbefore sampling. The feed consists of at least 36% crude protein,3.5% crude fat, 12% moisture, 6% crude fiber, and 1% phos-phorus. A complete list of the feed ingredients is available inappendix A in the online edition of Physiological and Biochem-ical Zoology. The diet is highly digestible, and a similar diet(35% protein and 3.9% fat) had a dry-matter digestibility of85.9% and a protein digestibility of 89.4% (Wood and Wood1981). The turtles were assumed to be at isotopic equilibriumwith the diet.
Juveniles and adults were maintained in tanks or an artificialpond. The water intake pipes for each were directed to createa slow circular current against which the turtles swam. Theywere almost constantly in motion during daylight hours, withresting periods at night. The maximum depth of the adult pondwas 5.2 m, and there was an artificial beach available for femalesto lay eggs. The depth of the juvenile tanks was 0.9 m.
Sample Collection
During April and May 2010, tissue samples were collected from30 adult female green turtles and from 40 large juvenile greenturtles. Blood samples of 2–8 mL were drawn from the carotidarteries using sterile 16G # 2′′ IV catheters (SURFLO I.V. cath-eters) and were immediately transferred to 9-mL drawCORVAC serum separator tubes. Serum and red blood cellswere separated by centrifugation at 2,195 g and frozen sepa-rately at �20�C until analysis. Skin samples were taken with6-mm Miltex sterile biopsy punches in the region between thefront flipper and the head, just below the carapace, and placedin 70% ethanol. Isotope values of sea turtle epidermis preservedin ethanol were not different from those that were dried at60�C, indicating that the preservation method does not affectthe tissue stable isotope ratios (Barrow et al. 2008). At the timeof sample collection, CCL was measured from the anteriormidpoint of the nuchal scute to the posteriormost tip of therear marginal scutes, and most individuals were weighed. Body-condition index was calculated as (mass/CCL3) # 104, withmass in kilograms and CCL in centimeters (Bjorndal and Bolten2010). At the time of tissue sampling, two diet samples ofapproximately 100 g from the same commercial batch were setaside for stable isotope analysis. The manufacturer producesfeed approximately once per month. The diet was specificallyformulated for the CTF and is held as constant as possible bythe manufacturer. Although there might be slight isotopic dif-ferences in different food lots, we are confident that these areminimal. Because all turtles are fed daily from the same lots,any differences we found in the captive population would notbe a result of the different lots, as they would have experiencedthe variation equally. Samples were collected under Universityof Florida Institutional Animal Care and Use Committee pro-tocol Z994/200801985.
Inherent Variation and Discrimination in Green Turtles 433
Table 1: Bayesian Information Criterion (BIC) values for the 10 models
Model parameterization
HypothesesMean andvariance
Mean (with pooledvariance)
Variance (withcentered mean)
1. Null (all data in one group) 1,331.7 ... ...2. Life stage (two groups) 1,250.0 1,306.5 1,272.53. Tissue (four groups) 589.1 725.1 555.34. Life stage and tissue (eight groups) 365.3 589.2 286.5
Note. The data were grouped according to four hypotheses in which all data were considered together or were grouped by
life stage, tissue, or both. Three model parameterizations were considered in which the mean, variance, or both were allowed
to differ in maximizing the function. The first model could not be considered with alternative parameterizations.
Sample Preparation and Isotope Analysis
Serum and red blood cell samples were thawed, dried at 60�Cfor 24 h, and homogenized with a mortar and pestle to a finepowder. Skin samples were rinsed in distilled water, and theepidermis was removed from the dermis with a scalpel. A smallportion of the dermis closest to the skin surface was subsampledto provide the dermis sample. Both dermis and epidermis sam-ples were homogenized by dicing with a scalpel and then weredried at 60�C for 24 h. Diet samples were ground in a Wileymill to a !1-mm particle size.
Tissue samples weighing 0.5–0.6 mg and diet samples rangingfrom 0.45 to 1.5 mg were analyzed for carbon and nitrogenisotopes at the University of Florida Department of GeologicalSciences Light Isotope Lab. Samples were combusted in an ECS4010 elemental analyzer (Costech) interfaced via a ConFlo IIIdevice to a Delta Plus XL isotope ratio mass spectrometer(ThermoFisher Scientific). The standards used for 13C and 15Nwere Vienna Pee Dee Belemnite and atmospheric N2, respec-tively. Delta notation is used to express stable isotope abun-dances, defined as parts per thousand (‰) relative to the stan-dard
R sampled p � 1 # 1,000,( )R standard
where Rsample is the ratio of heavy to light isotopes (13C/12C or15N/14N) in the sample and Rstandard is the isotope ratio of thecorresponding international standard. The reference materialUSGS40 (L-glutamic acid) was used as a calibration standardin all runs, with standard deviation (SD) p 0.12‰ for d13Cand 0.14‰ for d15N ( ). Repeated measurements of an p 32laboratory reference material, loggerhead sea turtle Caretta ca-retta scute, were used to examine consistency in a homogeneoussample with isotopic composition similar to that of the tissuesamples in this study. The SD of the loggerhead scute was0.07‰ for d13C and 0.25‰ for d15N ( ).n p 13
A subset of six dermis samples weighing approximately 1.0mg plus diet samples weighing 3.0–4.5 mg was also analyzedfor dry-mass percent carbon (C) and nitrogen (N) to calculatethe C : N ratio. Lipids were extracted from a different subsetof six dermis samples using petroleum ether in an acceleratedsolvent extractor (Dionex ASE300) and analyzed for carbon
and nitrogen isotopes to examine the effect of lipids on theisotope composition and isotopic variation.
Data Analysis
Ten multivariate normal models were fitted to the carbon andnitrogen isotope data to examine how to best group the datawhile considering means and variances among groups (table1). Four hypotheses were examined to determine whether thedata were best described by considering (1) all samples together,(2) samples grouped by life stage (large juveniles, adults), (3)samples grouped by tissue type (epidermis, dermis, serum, redblood cells), or (4) samples grouped by both life stage andtissue type. Three model parameterizations were applied to eachhypothesis (except the first) to create a total of 10 models (table1). The second and third parameterizations were not appliedto the first hypothesis because there was only one group, mean-ing that creating a pooled variance or centered mean had noeffect.
In these parameterizations, the vector of means, the vari-ances, or both were allowed to differ in the resulting multi-variate normal likelihood function (Johnson and Wichern2002) of the observed data. The maximum likelihood (ML)estimates also correspond to the vector of arithmetic meansand the sample variance-covariance matrix (Johnson and Wich-ern 2002). The four tissues were assumed to be independentsamples, and the analysis diagnostics (residuals) were examinedto ensure that there were no major departures from the modelassumptions.
The first hypothesis was a null model that assumed that thevariability among all life stages and tissue types was best de-scribed with only one set of parameters: a single set of meansand a single variance-covariance matrix. In the second hy-pothesis, the data were divided by life stage to determinewhether adult and large juvenile samples were different in theirisotopic values irrespective of tissue type. Thus, the sampleswere assumed to come from just two sampling multivariatenormal models with different mean vectors and variance-covariance matrices. In the third hypothesis, each tissue typewas considered separately, though adult and large juvenile val-ues of the same tissue type were grouped. Hence, four differentmultivariate normal sampling models were needed to explain
434 H. B. Vander Zanden, K. A. Bjorndal, W. Mustin, J. M. Ponciano, and A. B. Bolten
Table 2: Mean and variance of d13C and d15N values
Chelonia mydas (ourstudy; adult n p 30,
juveniles n p 40) C. mydas (n p 8)a
Dermochelys coriacea(n p 7)b
d13C d15N d13C d15N d13C d15N
Diet �23.05 (.29) 2.49 (.05) �19.03 (.97) 6.24 (.24) �17.71 (.12) 8.64 (.22)Diet (lipid extracted) �18.64 (.20) 6.21 (.34) �17.76 (.08) 8.59 (.53)Adults:
Epidermis �21.44 (.08) 6.57 (.14)Dermis �20.47 (1.14) 7.47 (.29)Serum �22.80 (.08) 6.70 (.12)Red blood cells �22.75 (.04) 5.01 (.07)
Juveniles:Epidermis �21.18 (.03) 6.31 (.11) �18.54 (.04)c 9.00 (.32)c �15.46 (.24)c 10.50 (.03)c
Dermis �20.88 (.05) 6.69 (.16) ... ... ... ...Serum/plasma �21.89 (.02) 6.59 (.08) �19.18 (.05) 9.14 (.03) �18.35 (.21) 11.45 (.14)Red blood cells �22.54 (.03) 4.89 (.09) �20.15 (.03) 6.52 (.04) �17.31 (.05) 10.08 (.03)
Note. Mean d13C and d15N values (‰) and inherent variation (in parentheses) are reported for each of the four tissues in both life stages
from our study and other juvenile sea turtle tissues at isotopic equilibrium reported from the literature. Diet sample mean d13C and d15N values
and variance are also included. The values in our study were reported for serum, but plasma was used in the other studies. Because of the
similarity in these two tissues, they are reported on the same line.aSeminoff et al. 2006.bSeminoff et al. 2009.cLipid-extracted tissue.
the data. In the fourth hypothesis, the samples were dividedby both life stage and tissue type, creating eight groups. Thus,the joint likelihood of all the data needed for parameter esti-mation becomes the product of eight different multivariatenormal probability density functions.
Model selection was carried out using Bayesian InformationCriterion (BIC; Raftery 1995). Adding more parameters to afixed model may improve the fit of the model, but the trade-off is that it increases uncertainty in the estimation process.The BIC includes a term to penalize the ML score with aquantity proportional to the number of parameters used by themodel. The BIC was calculated as
ˆBIC p �2 ln (L) � p ln (q),
where is likelihood function evaluated at the ML estimates,Lp is the number of parameters, and q is the sample size.
To evaluate whether there were differences in means andvariances among the eight groups, pairwise comparisons weremade between the mean vectors and variance-covariance ma-trices for a subset of all possible pairs. Each of the four tissuetypes were compared within the same life stage, but compar-isons across life stages were made only for the same tissue type.In these pairwise comparisons, ML estimates and BIC valueswere calculated first assuming that the observed samples allcame from a single sampling multivariate normal model andthus could be combined for the parameter estimation processand then assuming that the samples from the two differentgroups actually resulted from two separate multivariate normalsampling models where the means, variances, or both wereassumed to differ. Differences in BIC values (DBIC) were cal-
culated as BICcombined � BICseparate. A DBIC value greater than2, 6, or 10 corresponds to positive, strong, or very strong evi-dence, respectively, for favoring the separate model over thecombined model (Raftery 1995). Therefore, two groups wereconsidered significantly different in their bivariate means orvariances if . Negative values occurred when theDBIC 1 2BICseparate was larger than the BICcombined.
Green turtle discrimination factors were calculated as D pfor carbon and nitrogen. Variance from both thed � dtissue diet
diet samples and the tissue was integrated into estimates of thediscrimination factors through parametric bootstrapping. Nor-mal distributions were used to represent the d13C and d15Nvalues for the diet and each tissue for both life stages. The meandiet-tissue discrimination values � SD were calculated by run-ning 50,000 iterations.
The relationships between body-condition index and d13Cdermis values were examined using Spearman’s rank correla-tion. All statistical analyses were performed using R (R Devel-opment Core Team 2011). Annotated R code for the modelingis available in appendix B, available as a PDF in the onlineedition of Physiological and Biochemical Zoology.
Results
The variance in the stable isotope values, the inherent variation,of each tissue type and life stage differed among some tissuesand life stages (tables 2, 3). The highest variance in the adulttissues occurred in dermis, which was significantly greater thanthe variance in other tissues, and the lowest variance in adulttissues was observed in red blood cells. For juvenile tissues, the
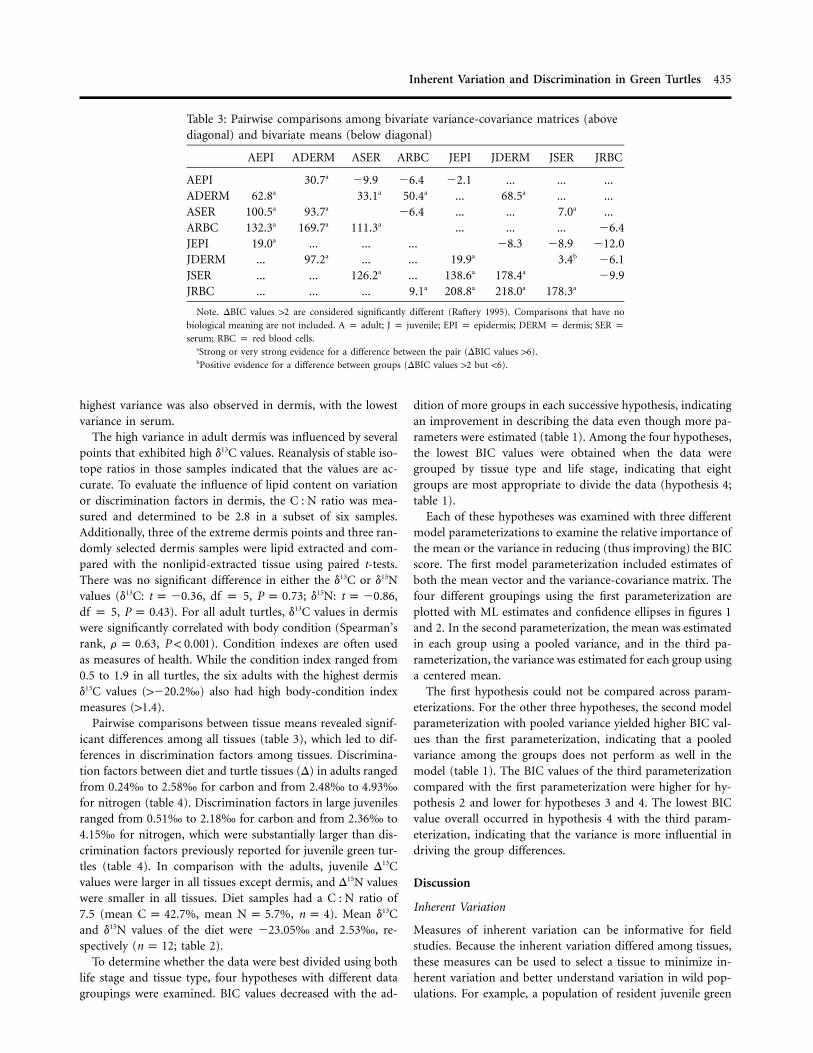
Inherent Variation and Discrimination in Green Turtles 435
Table 3: Pairwise comparisons among bivariate variance-covariance matrices (abovediagonal) and bivariate means (below diagonal)
AEPI ADERM ASER ARBC JEPI JDERM JSER JRBC
AEPI 30.7a �9.9 �6.4 �2.1 ... ... ...ADERM 62.8a 33.1a 50.4a ... 68.5a ... ...ASER 100.5a 93.7a �6.4 ... ... 7.0a ...ARBC 132.3a 169.7a 111.3a ... ... ... �6.4JEPI 19.0a ... ... ... �8.3 �8.9 �12.0JDERM ... 97.2a ... ... 19.9a 3.4b �6.1JSER ... ... 126.2a ... 138.6a 178.4a �9.9JRBC ... ... ... 9.1a 208.8a 218.0a 178.3a
Note. DBIC values 12 are considered significantly different (Raftery 1995). Comparisons that have no
biological meaning are not included. A p adult; J p juvenile; EPI p epidermis; DERM p dermis; SER pserum; RBC p red blood cells.
aStrong or very strong evidence for a difference between the pair (DBIC values 16).bPositive evidence for a difference between groups (DBIC values 12 but !6).
highest variance was also observed in dermis, with the lowestvariance in serum.
The high variance in adult dermis was influenced by severalpoints that exhibited high d13C values. Reanalysis of stable iso-tope ratios in those samples indicated that the values are ac-curate. To evaluate the influence of lipid content on variationor discrimination factors in dermis, the C : N ratio was mea-sured and determined to be 2.8 in a subset of six samples.Additionally, three of the extreme dermis points and three ran-domly selected dermis samples were lipid extracted and com-pared with the nonlipid-extracted tissue using paired t-tests.There was no significant difference in either the d13C or d15Nvalues (d13C: 6, df p 5, ; d15N: ,t p �0.3 P p 0.73 t p �0.86df p 5, ). For all adult turtles, d13C values in dermisP p 0.43were significantly correlated with body condition (Spearman’srank, , ). Condition indexes are often usedr p 0.63 P ! 0.001as measures of health. While the condition index ranged from0.5 to 1.9 in all turtles, the six adults with the highest dermisd13C values (1�20.2‰) also had high body-condition indexmeasures (11.4).
Pairwise comparisons between tissue means revealed signif-icant differences among all tissues (table 3), which led to dif-ferences in discrimination factors among tissues. Discrimina-tion factors between diet and turtle tissues (D) in adults rangedfrom 0.24‰ to 2.58‰ for carbon and from 2.48‰ to 4.93‰for nitrogen (table 4). Discrimination factors in large juvenilesranged from 0.51‰ to 2.18‰ for carbon and from 2.36‰ to4.15‰ for nitrogen, which were substantially larger than dis-crimination factors previously reported for juvenile green tur-tles (table 4). In comparison with the adults, juvenile D13Cvalues were larger in all tissues except dermis, and D15N valueswere smaller in all tissues. Diet samples had a C : N ratio of7.5 (mean , mean , ). Mean d13CC p 42.7% N p 5.7% n p 4and d15N values of the diet were �23.05‰ and 2.53‰, re-spectively ( ; table 2).n p 12
To determine whether the data were best divided using bothlife stage and tissue type, four hypotheses with different datagroupings were examined. BIC values decreased with the ad-
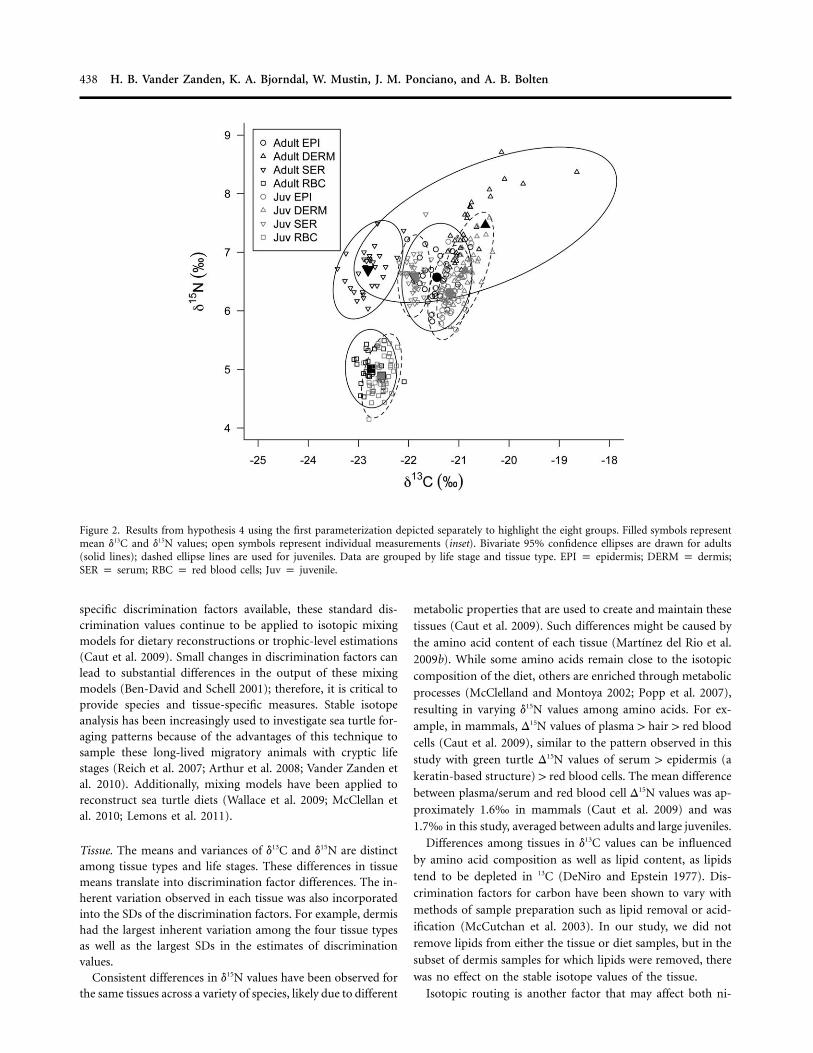
dition of more groups in each successive hypothesis, indicatingan improvement in describing the data even though more pa-rameters were estimated (table 1). Among the four hypotheses,the lowest BIC values were obtained when the data weregrouped by tissue type and life stage, indicating that eightgroups are most appropriate to divide the data (hypothesis 4;table 1).
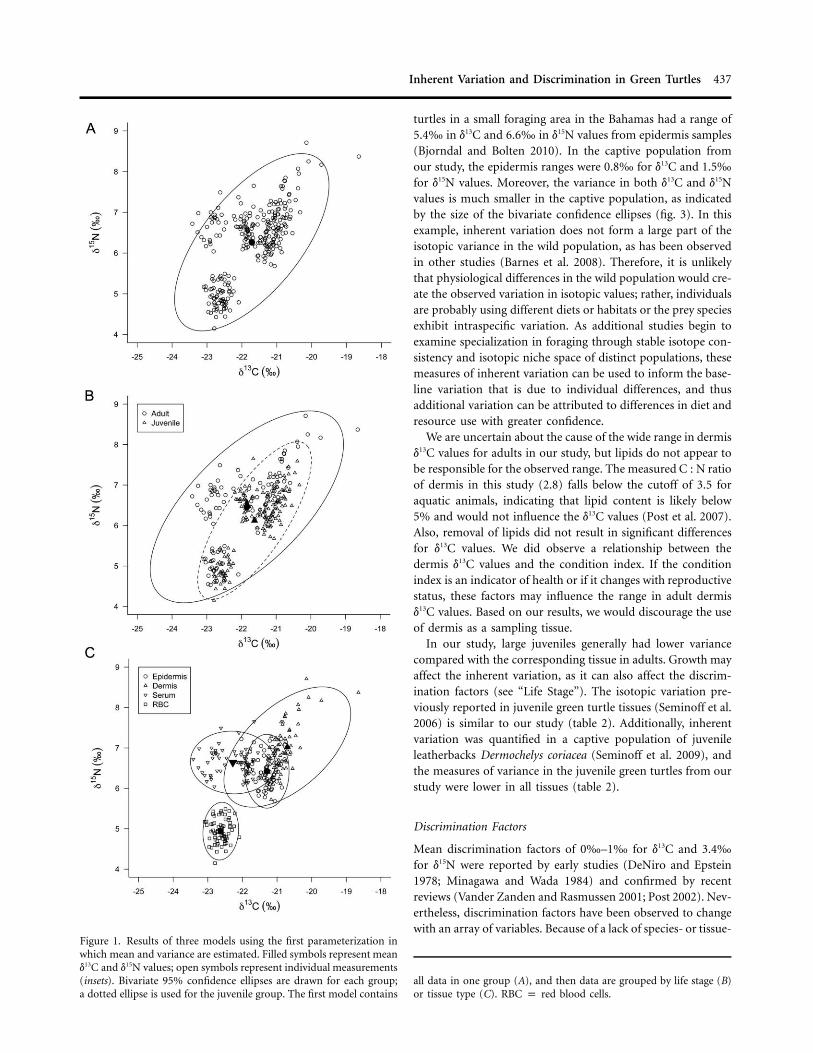
Each of these hypotheses was examined with three differentmodel parameterizations to examine the relative importance ofthe mean or the variance in reducing (thus improving) the BICscore. The first model parameterization included estimates ofboth the mean vector and the variance-covariance matrix. Thefour different groupings using the first parameterization areplotted with ML estimates and confidence ellipses in figures 1and 2. In the second parameterization, the mean was estimatedin each group using a pooled variance, and in the third pa-rameterization, the variance was estimated for each group usinga centered mean.
The first hypothesis could not be compared across param-eterizations. For the other three hypotheses, the second modelparameterization with pooled variance yielded higher BIC val-ues than the first parameterization, indicating that a pooledvariance among the groups does not perform as well in themodel (table 1). The BIC values of the third parameterizationcompared with the first parameterization were higher for hy-pothesis 2 and lower for hypotheses 3 and 4. The lowest BICvalue overall occurred in hypothesis 4 with the third param-eterization, indicating that the variance is more influential indriving the group differences.
Discussion
Inherent Variation
Measures of inherent variation can be informative for fieldstudies. Because the inherent variation differed among tissues,these measures can be used to select a tissue to minimize in-herent variation and better understand variation in wild pop-ulations. For example, a population of resident juvenile green
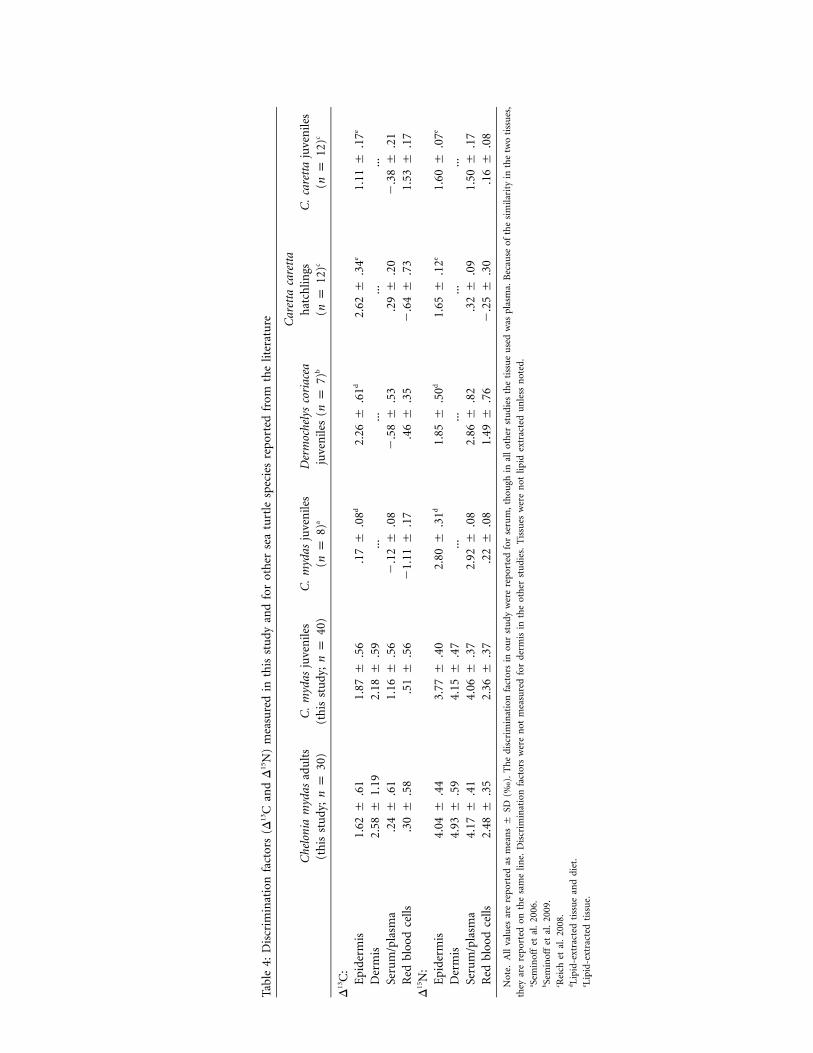
Tabl
e4:
Dis
crim
inat
ion
fact
ors
(D13
Can
dD
15N
)m
easu
red
inth
isst
udy
and
for
othe
rse
atu
rtle
spec
ies
repo
rted
from
the
liter
atu
re
Che
loni
am
ydas
adu
lts
(thi
sst
udy
;n
p30
)C
.m
ydas
juve
nile
s(t
his
stu
dy;
np
40)
C.
myd
asju
ven
iles
(np
8)a
Der
moc
hely
sco
riac
eaju
ven
iles
(np
7)b
Car
etta
care
tta
hat
chlin
gs(n
p12
)c
C.
care
tta
juve
nile
s(n
p12
)c
D13
C:
Epi
derm
is1.
62�
.61
1.87
�.5
6.1
7�
.08d
2.26
�.6
1d2.
62�
.34e
1.11
�.1
7e
Der
mis
2.58
�1.
192.
18�
.59
......
......
Seru
m/p
lasm
a.2
4�
.61
1.16
�.5
6�
.12
�.0
8�
.58
�.5
3.2
9�
.20
�.3
8�
.21
Red
bloo
dce
lls.3
0�
.58
.51
�.5
6�
1.11
�.1
7.4
6�
.35
�.6
4�
.73
1.53
�.1
7D
15N
:E
pide
rmis
4.04
�.4
43.
77�
.40
2.80
�.3
1d1.
85�
.50d
1.65
�.1
2e1.
60�
.07e
Der
mis
4.93
�.5
94.
15�
.47
......
......
Seru
m/p
lasm
a4.
17�
.41
4.06
�.3
72.
92�
.08
2.86
�.8
2.3
2�
.09
1.50
�.1
7R
edbl
ood
cells
2.48
�.3
52.
36�
.37
.22
�.0
81.
49�
.76
�.2
5�
.30
.16
�.0
8
Not
e.A
llva
lues
are
repo
rted
asm
ean
s�
SD(‰
).T
he
disc
rim
inat
ion
fact
ors
inou
rst
udy
wer
ere
port
edfo
rse
rum
,th
ough
inal
lot
her
stu
dies
the
tiss
ue
use
dw
aspl
asm
a.B
ecau
seof
the
sim
ilari
tyin
the
two
tiss
ues
,
they
are
repo
rted
onth
esa
me
line.
Dis
crim
inat
ion
fact
ors
wer
en
otm
easu
red
for
derm
isin
the
oth
erst
udi
es.
Tis
sues
wer
en
otlip
idex
trac
ted
un
less
not
ed.
a Sem
inof
fet
al.
2006
.bSe
min
off
etal
.20
09.
c Rei
chet
al.
2008
.dLi
pid-
extr
acte
dti
ssu
ean
ddi
et.
e Lipi
d-ex
trac
ted
tiss
ue.
Inherent Variation and Discrimination in Green Turtles 437
Figure 1. Results of three models using the first parameterization inwhich mean and variance are estimated. Filled symbols represent meand13C and d15N values; open symbols represent individual measurements(insets). Bivariate 95% confidence ellipses are drawn for each group;a dotted ellipse is used for the juvenile group. The first model contains
all data in one group (A), and then data are grouped by life stage (B)or tissue type (C). RBC p red blood cells.
turtles in a small foraging area in the Bahamas had a range of5.4‰ in d13C and 6.6‰ in d15N values from epidermis samples(Bjorndal and Bolten 2010). In the captive population fromour study, the epidermis ranges were 0.8‰ for d13C and 1.5‰for d15N values. Moreover, the variance in both d13C and d15Nvalues is much smaller in the captive population, as indicatedby the size of the bivariate confidence ellipses (fig. 3). In thisexample, inherent variation does not form a large part of theisotopic variance in the wild population, as has been observedin other studies (Barnes et al. 2008). Therefore, it is unlikelythat physiological differences in the wild population would cre-ate the observed variation in isotopic values; rather, individualsare probably using different diets or habitats or the prey speciesexhibit intraspecific variation. As additional studies begin toexamine specialization in foraging through stable isotope con-sistency and isotopic niche space of distinct populations, thesemeasures of inherent variation can be used to inform the base-line variation that is due to individual differences, and thusadditional variation can be attributed to differences in diet andresource use with greater confidence.
We are uncertain about the cause of the wide range in dermisd13C values for adults in our study, but lipids do not appear tobe responsible for the observed range. The measured C : N ratioof dermis in this study (2.8) falls below the cutoff of 3.5 foraquatic animals, indicating that lipid content is likely below5% and would not influence the d13C values (Post et al. 2007).Also, removal of lipids did not result in significant differencesfor d13C values. We did observe a relationship between thedermis d13C values and the condition index. If the conditionindex is an indicator of health or if it changes with reproductivestatus, these factors may influence the range in adult dermisd13C values. Based on our results, we would discourage the useof dermis as a sampling tissue.
In our study, large juveniles generally had lower variancecompared with the corresponding tissue in adults. Growth mayaffect the inherent variation, as it can also affect the discrim-ination factors (see “Life Stage”). The isotopic variation pre-viously reported in juvenile green turtle tissues (Seminoff et al.2006) is similar to our study (table 2). Additionally, inherentvariation was quantified in a captive population of juvenileleatherbacks Dermochelys coriacea (Seminoff et al. 2009), andthe measures of variance in the juvenile green turtles from ourstudy were lower in all tissues (table 2).
Discrimination Factors
Mean discrimination factors of 0‰–1‰ for d13C and 3.4‰for d15N were reported by early studies (DeNiro and Epstein1978; Minagawa and Wada 1984) and confirmed by recentreviews (Vander Zanden and Rasmussen 2001; Post 2002). Nev-ertheless, discrimination factors have been observed to changewith an array of variables. Because of a lack of species- or tissue-
438 H. B. Vander Zanden, K. A. Bjorndal, W. Mustin, J. M. Ponciano, and A. B. Bolten
Figure 2. Results from hypothesis 4 using the first parameterization depicted separately to highlight the eight groups. Filled symbols representmean d13C and d15N values; open symbols represent individual measurements (inset). Bivariate 95% confidence ellipses are drawn for adults(solid lines); dashed ellipse lines are used for juveniles. Data are grouped by life stage and tissue type. EPI p epidermis; DERM p dermis;SER p serum; RBC p red blood cells; Juv p juvenile.
specific discrimination factors available, these standard dis-crimination values continue to be applied to isotopic mixingmodels for dietary reconstructions or trophic-level estimations(Caut et al. 2009). Small changes in discrimination factors canlead to substantial differences in the output of these mixingmodels (Ben-David and Schell 2001); therefore, it is critical toprovide species and tissue-specific measures. Stable isotopeanalysis has been increasingly used to investigate sea turtle for-aging patterns because of the advantages of this technique tosample these long-lived migratory animals with cryptic lifestages (Reich et al. 2007; Arthur et al. 2008; Vander Zanden etal. 2010). Additionally, mixing models have been applied toreconstruct sea turtle diets (Wallace et al. 2009; McClellan etal. 2010; Lemons et al. 2011).
Tissue. The means and variances of d13C and d15N are distinctamong tissue types and life stages. These differences in tissuemeans translate into discrimination factor differences. The in-herent variation observed in each tissue was also incorporatedinto the SDs of the discrimination factors. For example, dermishad the largest inherent variation among the four tissue typesas well as the largest SDs in the estimates of discriminationvalues.
Consistent differences in d15N values have been observed forthe same tissues across a variety of species, likely due to different
metabolic properties that are used to create and maintain thesetissues (Caut et al. 2009). Such differences might be caused bythe amino acid content of each tissue (Martınez del Rio et al.2009b). While some amino acids remain close to the isotopiccomposition of the diet, others are enriched through metabolicprocesses (McClelland and Montoya 2002; Popp et al. 2007),resulting in varying d15N values among amino acids. For ex-ample, in mammals, D15N values of plasma 1 hair 1 red bloodcells (Caut et al. 2009), similar to the pattern observed in thisstudy with green turtle D15N values of serum 1 epidermis (akeratin-based structure) 1 red blood cells. The mean differencebetween plasma/serum and red blood cell D15N values was ap-proximately 1.6‰ in mammals (Caut et al. 2009) and was1.7‰ in this study, averaged between adults and large juveniles.
Differences among tissues in d13C values can be influencedby amino acid composition as well as lipid content, as lipidstend to be depleted in 13C (DeNiro and Epstein 1977). Dis-crimination factors for carbon have been shown to vary withmethods of sample preparation such as lipid removal or acid-ification (McCutchan et al. 2003). In our study, we did notremove lipids from either the tissue or diet samples, but in thesubset of dermis samples for which lipids were removed, there
was no effect on the stable isotope values of the tissue.
Isotopic routing is another factor that may affect both ni-

Inherent Variation and Discrimination in Green Turtles 439
Figure 3. Comparison of isotopic variation in epidermis samples fromjuvenile green turtles. The inherent variation for the captive population( ) is considerably smaller than the variation observed in then p 40wild population resident on a small foraging area off Inagua, Bahamas,for at least 1 yr ( ). Bivariate 95% confidence ellipses are includedn p 42for each group. Wild population data are modified from Bjorndal andBolten (2010) for samples collected in 2002 and 2003.
trogen and carbon discrimination (Gannes et al. 1998). We areunable to evaluate the effects of isotopic routing in our study.
Life Stage. Nitrogen discrimination factors were larger in adultscompared with the respective large juvenile tissues in our study.The differences between life stages may be due to protein bal-ance differences rather than age, as animals with a positiveprotein balance should have lower D15N values than animalsthat have a neutral or negative protein balance (Martınez delRio and Wolf 2005). Protein balance is indicative of the effi-ciency of nitrogen deposition, measured as the ratio betweenprotein assimilation and protein loss, and growing animals areexpected to be in positive protein balance (Martınez del Rioet al. 2009b). Large juveniles grow rapidly, and adult growth isminimal (Wood and Wood 1993). The pattern in nitrogen dis-crimination factors in our study supports the predictions byMartınez del Rio and Wolf (2005). Studies comparing life stagesor relative growth rates in other species have also reportedpatterns corroborating this prediction in red foxes Vulpes vulpes(Roth and Hobson 2000), Atlantic salmon Salmo salar (True-man et al. 2005), and blue crabs Callinectes sapidus (Fantle etal. 1999).
Unlike nitrogen discrimination factors, there is no empiricalprediction for the relationship between growth rate and carbondiscrimination factors. The differences between adults and largejuveniles were relatively small for epidermis, dermis, and redblood cells. The largest difference between D13C values for thesame tissue occurred in serum (0.93‰), probably as a resultof higher lipids in adults. Females mobilize lipids for egg pro-
duction, primarily vitellogenin (containing lipid triglycerides),which is synthesized in the liver and transported to the ovaryin plasma (Hamann et al. 2003). Plasma triglyceride levels mayincrease up to 6 mo before the breeding season and remainhigh throughout the nesting season (Hamann et al. 2002). Theadults in our study were all sexually mature females and weresampled just before the nesting season.
Intraspecific and Interspecific Comparisons. A negative trend be-tween diet isotope values and discrimination factors has beenobserved across a wide range of taxa, though the trend was notexamined in reptiles because of limited data (Caut et al. 2009).If this trend were sustained for reptiles, we would expect higherdiscrimination factors for juveniles in our study compared withthose previously reported for juvenile green turtles (Seminoffet al. 2006) because of the lower d13C and d15N values in ourdiet (table 2). The method proposed by Caut et al. (2008, 2009)to apply a diet-dependent discrimination factor may be ap-propriate for reconstructing sea turtle diets through isotopemixing models. At this time, however, insufficient reptile dataare available to calculate diet-dependent discrimination factors.
Nutritional content of the diet, particularly for nitrogen, mayalso affect the discrimination factor. A positive trend betweendiet C : N and D15N values has been observed in a variety ofspecies (Robbins et al. 2005). The feed used in our study hada higher C : N ratio than that used by Seminoff et al. (2006;7.5 vs. 6.6). Consistent with the pattern observed by Robbinset al. (2005), the higher diet C : N ratio corresponded to ahigher D15N value. Yet further investigation of this patternthrough varied diets in a single mammalian species yielded norelationship between C : N and D15N values (Robbins et al.2010). Rather, complementarity of amino acids and diets com-posed of a mixture of items may contribute to variation D15Nvalues (Robbins et al. 2010).
In comparison with other sea turtle species, the D15N valuesmeasured in large juveniles from our study are higher thanwhat has previously been reported (table 4). Besides possibledietary differences, growth rate differences are likely a majorcontributor to these discrimination value differences. The ju-veniles in our study were larger and likely had reduced growthrates, which would lead to larger D15N values (Martınez del Rioand Wolf 2005).
The carbon discrimination factors were more variable amongthe sea turtle species. The largest D13C value observed for ep-idermis was in leatherbacks (Seminoff et al. 2009), the largestD13C value observed for serum/plasma was in green turtles fromour study, and the largest D13C value observed for red bloodcells was in loggerheads (Reich et al. 2008; table 4). This maybe due to differences in lipid concentration for each of thespecies, yet we are unable to make comparisons between po-tential lipid content, as C : N ratios were not measured in allstudies.

440 H. B. Vander Zanden, K. A. Bjorndal, W. Mustin, J. M. Ponciano, and A. B. Bolten
Conclusions
In summary, we found that inherent variation is both tissueand life stage dependent, and these results can be useful formore accurately estimating the degree of specialization andisotopic niche width in wild populations. Inherent variationwas apparently only a small portion of the variance in the stableisotope composition of a wild population. In addition, diet-tissue discrimination factors in sea turtles may vary with spe-cies, tissue type, diet, and growth rate, thus underscoring theneed for appropriate discrimination values in mixing modelsand trophic-level estimations. We provide the first measure ofdiscrimination factors for adult sea turtles. In juveniles, webelieve the differences in discrimination factors compared withprevious studies in sea turtles may be attributable to differencesin diet and growth rate. Understanding the processes that in-fluence isotopic discrimination and variance is fundamental tostudies using stable isotope analysis to investigate foraging, be-havior, and ecological roles of wild populations.
Acknowledgments
We thank J. Curtis for stable isotope analysis and J. Seminoffand three anonymous reviewers for comments on the manu-script. H.B.V.Z. was supported by a National Science Foun-dation Graduate Research Fellowship and University of FloridaJohn Paul Olowo Memorial Research Grant. Funds for analyseswere provided by U.S. National Marine Fisheries Service, U.S.Fish and Wildlife Service, National Fish and Wildlife Foun-dation, Knight Vision Foundation, and Disney Worldwide Con-servation Fund.
Literature Cited
Araujo M.S., D.I. Bolnick, G. Machado, A.A. Giaretta, and S.F.dos Reis. 2007. Using d13C stable isotopes to quantify indi-vidual-level diet variation. Oecologia 152:643–654.
Arthur K.E., M.C. Boyle, and C.J. Limpus. 2008. Ontogeneticchanges in diet and habitat use in green sea turtle (Cheloniamydas) life history. Mar Ecol Prog Ser 362:303–311.
Barnes C., S. Jennings, N.V.C. Polunin, and J.E. Lancaster. 2008.The importance of quantifying inherent variability when in-terpreting stable isotope field data. Oecologia 155:227–235.
Barrow L.M., K.A. Bjorndal, and K.J. Reich. 2008. Effects ofpreservation method on stable carbon and nitrogen isotopevalues. Physiol Biochem Zool 81:688–693.
Bearhop S., C.E. Adams, S. Waldron, R.A. Fuller, and H. Macleod.2004. Determining trophic niche width: a novel approach us-ing stable isotope analysis. J Anim Ecol 73:1007–1012.
Bearhop S., S. Waldron, S.C. Votier, and R.W. Furness. 2002.Factors that influence assimilation rates and fractionation ofnitrogen and carbon stable isotopes in avian blood and feath-ers. Physiol Biochem Zool 75:451–458.
Ben-David M. and D.M. Schell. 2001. Mixing models in anal-yses of diet using multiple stable isotopes: a response. Oeco-logia 127:180–184.
Bjorndal K.A. and A.B. Bolten. 2010. Hawksbill sea turtles inseagrass pastures: success in a peripheral habitat. Mar Biol157:135–145.
Bjorndal K.A., A.B. Bolten, and M.Y. Chaloupka. 2000. Greenturtle somatic growth model: evidence for density depen-dence. Ecol Appl 10:269–282.
Caut S., E. Angulo, and F. Courchamp. 2008. Discriminationfactors (D15N and D13C) in an omnivorous consumer: effectof diet isotopic ratio. Funct Ecol 22:255–263.
———. 2009. Variation in discrimination factors (D15N andD13C): the effect of diet isotopic values and applications fordiet reconstruction. J Appl Ecol 46:443–453.
DeNiro M.J. and S. Epstein. 1977. Mechanism of carbon isotopefractionation associated with lipid synthesis. Science 197:261–263.
———. 1978. Influence of diet on the distribution of carbonisotopes in animals. Geochim Cosmochim Acta 42:495–506.
———. 1981. Influence of diet on the distribution of nitrogenisotopes in animals. Geochim Cosmochim Acta 45:341–351.
Fantle M.S., A.I. Dittel, S.M. Schwalm, C.E. Epifanio, and M.L.Fogel. 1999. A food web analysis of the juvenile blue crab,Callinectes sapidus, using stable isotopes in whole animalsand individual amino acids. Oecologia 120:416–426.
Gannes L.Z., C. Martınez del Rio, and P. Koch. 1998. Naturalabundance variations in stable isotopes and their potentialuses in animal physiological ecology. Comp Biochem Physiol119A:725–737.
Hamann M., C.J. Limpus, and D.W. Owens. 2003. Reproductivecycles of males and females. Pp. 135–161 in P.L. Lutz, J.A.Musick, and J. Wyneken, eds. The biology of sea turtles. CRC,Boca Raton, FL.
Hamann M., C.J. Limpus, and J.M. Whittier. 2002. Patterns oflipid storage and mobilisation in the female green sea turtle(Chelonia mydas). J Comp Physiol 172B:485–493.
Johnson R.A. and D.W. Wichern. 2002. Applied multivariatestatistical analysis. Prentice-Hall, Upper Saddle River, NJ.
Layman C.A., D.A. Arrington, C.G. Montana, and D.M. Post.2007a. Can stable isotope ratios provide for community-widemeasures of trophic structure? Ecology 88:42–48.
Layman C.A., J.P. Quattrochi, C.M. Peyer, and J.E. Allgeier.2007b. Niche width collapse in a resilient top predator fol-lowing ecosystem fragmentation. Ecol Lett 10:937–944.
Lemons G., R.L. Lewison, L. Komoroske, A. Gaos, C.T. Lai, P.Dutton, T. Eguchi, R. LeRoux, and J.A. Seminoff. 2011.Trophic ecology of green sea turtles in a highly urbanizedbay: insights from stable isotopes and mixing models. J ExpMar Biol Ecol 405:25–32.
Martınez del Rio C., P. Sabat, R. Anderson-Sprecher, and S.P.Gonzalez. 2009a. Dietary and isotopic specialization: the iso-topic niche of three Cinclodes ovenbirds. Oecologia 161:149–159.
Martınez del Rio C. and B.O. Wolf. 2005. Mass-balance modelsfor animal isotopic ecology. Pp. 141–174 in J.M. Starck andT. Wang, eds. Physiological and ecological adaptations tofeeding in vertebrates. Science, Enfield, NH.
Martınez del Rio C., N. Wolf, S.A. Carleton, and L.Z. Gannes.
Inherent Variation and Discrimination in Green Turtles 441
2009b. Isotopic ecology ten years after a call for more lab-oratory experiments. Biol Rev 84:91–111.
Matthews B. and A. Mazumder. 2004. A critical evaluation ofintrapopulation variation of d13C and isotopic evidence ofindividual specialization. Oecologia 140:361–371.
McClellan C.M., J. Braun-McNeill, L. Avens, B.P. Wallace, andA.J. Read. 2010. Stable isotopes confirm a foraging dichot-omy in juvenile loggerhead sea turtles. J Exp Mar Biol Ecol387:44–51.
McClelland J.W. and J.P. Montoya. 2002. Trophic relationshipsand the nitrogen isotopic composition of amino acids inplankton. Ecology 83:2173–2180.
McCutchan J.H., W.M. Lewis, C. Kendall, and C.C. McGrath.2003. Variation in trophic shift for stable isotope ratios ofcarbon, nitrogen, and sulfur. Oikos 102:378–390.
Minagawa M. and W. Wada. 1984. Stepwise enrichment of d15Nalong food chains: further evidence of the relation betweend15N and animal age. Geochim Cosmochim Acta 48:1135–1140.
Newsome S.D., C. Martınez del Rio, S. Bearhop, and D.L. Phil-lips. 2007. A niche for isotopic ecology. Front Ecol Environ5:429–436.
Newsome S.D., M.T. Tinker, D.H. Monson, O.T. Oftedal, K.Ralls, M.M. Staedler, M.L. Fogel, and J.A. Estes. 2009. Usingstable isotopes to investigate individual diet specialization inCalifornia sea otters (Enhydra lutris nereis). Ecology 90:961–974.
Phillips D.L. and P.M. Eldridge. 2006. Estimating the timing ofdiet shifts using stable isotopes. Oecologia 147:195–203.
Popp B.N., B.S. Graham, R.J. Olson, C.C.S. Hannides, M.J.Lott, G.A. Lopez-Ibarra, F. Galvan-Magana, and B. Fry. 2007.Insight into the trophic ecology of yellowfin tuna, Thunnusalbacares, from compound-specific nitrogen isotope analysisof proteinaceous amino acids. Pp. 173–190 in T.E. Dawsonand R.T.W. Siegwolf, eds. Stable isotopes as indicators ofecological change. Elsevier, San Diego, CA.
Post D.M. 2002. Using stable isotopes to estimate trophic po-sition: models, methods, and assumptions. Ecology 83:703–718.
Post D.M., C.A. Layman, D.A. Arrington, G. Takimoto, J. Quat-trochi, and C.G. Montana. 2007. Getting to the fat of thematter: models, methods and assumptions for dealing withlipids in stable isotope analyses. Oecologia 152:179–189.
Raftery A.E. 1995. Bayesian model selection in social research.Sociol Methodol 25:111–163.
R Development Core Team. 2011. R: a language and environ-ment for statistical computing. R Foundation for StatisticalComputing, Vienna. http://www.R-project.org.
Reich K.J., K.A. Bjorndal, and A.B. Bolten. 2007. The “lostyears” of green turtles: using stable isotopes to study crypticlifestages. Biol Lett 3:712–714.
Reich K.J., K.A. Bjorndal, and C. Martınez del Rio. 2008. Effectsof growth and tissue type on the kinetics of 13C and 15Nincorporation in a rapidly growing ectotherm. Oecologia 155:651–663.
Robbins C.T., L.A. Felicetti, and M. Sponheimer. 2005. Theeffect of dietary protein quality on nitrogen isotope discrim-ination in mammals and birds. Oecologia 144:534–540.
———. 2010. The impact of protein quality on stable nitrogenisotope ratio discrimination and assimilated diet estimation.Oecologia 162:571–579.
Roth J.D. and K.A. Hobson. 2000. Stable carbon and nitrogenisotopic fractionation between diet and tissue of captive redfox: implications for dietary reconstruction. Can J Zool 78:848–852.
Seminoff J.A., T.T. Jones, T. Eguchi, M. Hastings, and D.R.Jones. 2009. Stable carbon and nitrogen isotope discrimi-nation in soft tissues of the leatherback turtle (Dermochelyscoriacea): insights for trophic studies of marine turtles. J ExpMar Biol Ecol 381:33–41.
Seminoff J.A., T.T. Jones, T. Eguchi, D.R. Jones, and P.H. Dut-ton. 2006. Stable isotope discrimination (d13C and d15N) be-tween soft tissues of the green sea turtle Chelonia mydas andits diet. Mar Ecol Prog Ser 308:271–278.
Sweeting C.J., S. Jennings, and N.V.C. Polunin. 2005. Variancein isotopic signatures as a descriptor of tissue turnover anddegree of omnivory. Funct Ecol 19:777–784.
Trueman C.N., R.A.R. McGill, and P.H. Guyard. 2005. Theeffect of growth rate on tissue-diet isotopic spacing in rapidlygrowing animals: an experimental study with Atlantic salmon(Salmo salar). Rapid Commun Mass Spectrom 19:3239–3247.
Vanderklift M.A. and S. Ponsard. 2003. Sources of variation inconsumer-diet d15N enrichment: a meta-analysis. Oecologia136:169–182.
Vander Zanden H.B., K.A. Bjorndal, K.J. Reich, and A.B. Bolten.2010. Individual specialists in a generalist population: resultsfrom a long-term stable isotope series. Biol Lett 6:711–714.
Vander Zanden M.J. and J.B. Rasmussen. 2001. Variation ind15N and d13C trophic fractionation: implications for aquaticfood web studies. Limnol Oceanogr 46:2061–2066.
Vaudo J.J. and M.R. Heithaus. 2011. Dietary niche overlap ina nearshore elasmobranch mesopredator community. MarEcol Prog Ser 425:247–260.
Wallace B.P., L. Avens, J. Braun-McNeill, and C.M. McClellan.2009. The diet composition of immature loggerheads: in-sights on trophic niche, growth rates, and fisheries interac-tions. J Exp Mar Biol Ecol 373:50–57.
Wolf N., S.A. Carleton, and C. Martınez del Rio. 2009. Tenyears of experimental animal isotopic ecology. Funct Ecol23:17–26.
Wood J.R. and F.E. Wood. 1980. Reproductive biology of captivegreen sea turtles Chelonia mydas. Am Zool 20:499–505.
———. 1981. Growth and digestibility for the green turtle(Chelonia mydas) fed diets containing varying protein levels.Aquaculture 25:269–274.
———. 1993. Growth curve for captive-reared green sea tur-tles, Chelonia mydas. Herpetol J 3:49–54.
1
� 2012 by The University of Chicago. All rights reserved. DOI: 10.1086/666902
Appendix A from H. B. Vander Zanden, K. A. Bjorndal, W. Mustin, J.M. Ponciano, and A. B. Bolten, “Inherent Variation in Stable IsotopeValues and Discrimination Factors in Two Life Stages of GreenTurtles”(Physiol. Biochem. Zool., vol. 85, no. 5, p. 431)
Feed IngredientsGreen turtles in this study were fed an extruded floating pellet diet manufactured by Southfresh Feeds containing thefollowing ingredients: plant protein products, processed grain by-products, grain products, animal protein products, fishmeal, fish oil, dicalcium phosphate, calcium carbonate, vitamin A supplement, vitamin D supplement, vitamin Esupplement, calcium pantothenate, niacin supplement, ascorbic acid (vitamin C), menadione dimethylprimidinol disulfate,pyridoxine hydrochloride, riboflavin supplement, thiamine mononitrate, vitamin B12 supplement, folic acid, zinc sulfate,ferrous sulfate, sodium selenite, copper sulfate, manganese sulfate, and ethylenediamine dihydriodide.

### APPENDIX B: ANNOTATED R CODE ### Vander Zanden et al. Inherent variation in stable isotope values and discrimination factors in two life stages of green turtles ### Analysis of the variability of C & N isotopes x age x tissue-type #### Fitting Multivariate Normal models with parameterization 1 and 3: # This function will allow for parameterization 1 (mean and variance can differ) or # parameterization 3 (variance can differ with a centered mean), parameterization 2 is a separate function below # This function has input of the data of carbon and nitrogen for any number of cases (individual turtles) # belonging to the same group and outputs are the ML estimates for the mean vector and the variance-covariance matrix # Parameterization 1: centered=FALSE and the mean and variance can differ # Parameterization 3: centered=TRUE and only the variance can differ library(mvtnorm) MLmvn <- function(Xnp, centered=FALSE){ dimX <- dim(Xnp) n <- dimX[1] #number of cases p <- dimX[2] #number of variables (i.e. number of isotopes) S <- var(Xnp) #unbiased Sigma.hat <- ((n-1)/n)*S #to get ML estimate (biased) mu.hat <- apply(Xnp,2,mean) #mean of the matrix by column (if used 1, by row) if(centered==TRUE){ mus.mat <- matrix(rep(mu.hat,n),nrow=n,ncol=p,byrow=TRUE) Xcent <- Xnp-mus.mat mu.hat <- rep(0,p) # just to avoid numerical round-off errors, should be 0 # no need to calc Sigma.hat again, it's the same... } #lnLhat <- sum(dmvnorm(x=Xnp, mean=mu.hat,sigma=Sigma.hat,log=TRUE)) #a way to check calcs with library(mvtnorm) #to get maximum of log likelihoods: lnLhat <- -(0.5*n*p)*log(2*pi) -(0.5*n*p)-(0.5*n)*log(det(Sigma.hat)) return(list(mu.hat=mu.hat,Sigma.hat = Sigma.hat,lnLhat = lnLhat))
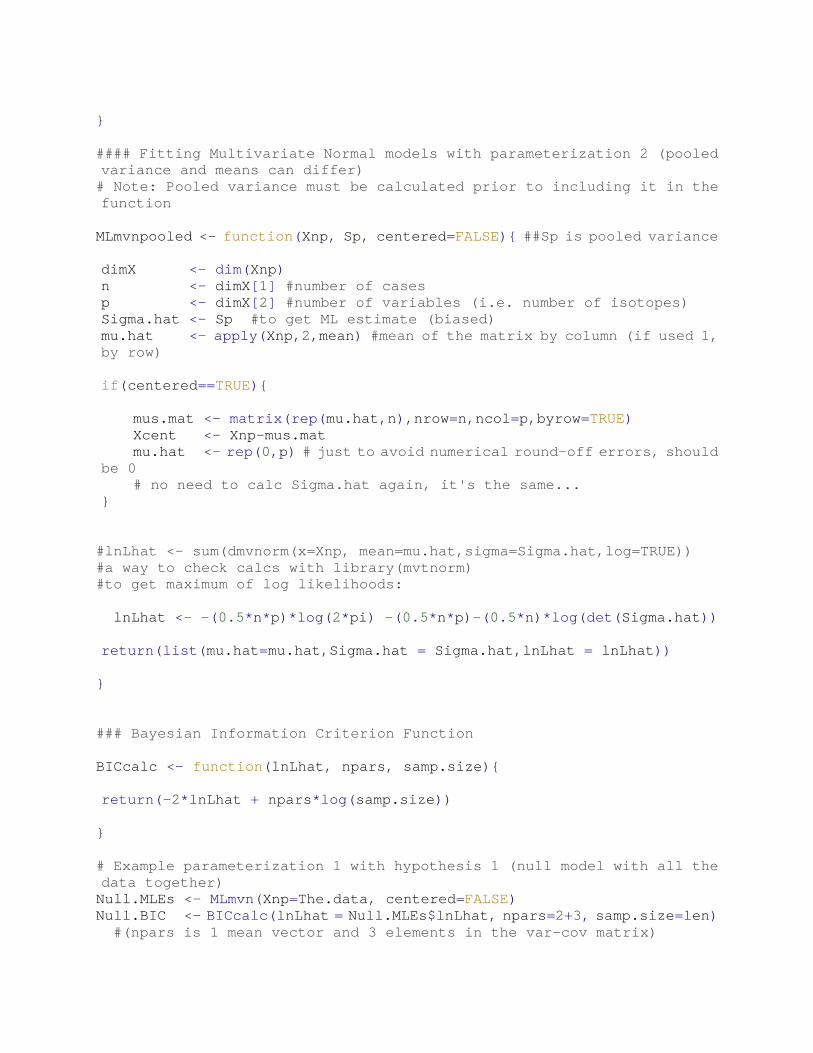
} #### Fitting Multivariate Normal models with parameterization 2 (pooled variance and means can differ) # Note: Pooled variance must be calculated prior to including it in the function MLmvnpooled <- function(Xnp, Sp, centered=FALSE){ ##Sp is pooled variance dimX <- dim(Xnp) n <- dimX[1] #number of cases p <- dimX[2] #number of variables (i.e. number of isotopes) Sigma.hat <- Sp #to get ML estimate (biased) mu.hat <- apply(Xnp,2,mean) #mean of the matrix by column (if used 1, by row) if(centered==TRUE){ mus.mat <- matrix(rep(mu.hat,n),nrow=n,ncol=p,byrow=TRUE) Xcent <- Xnp-mus.mat mu.hat <- rep(0,p) # just to avoid numerical round-off errors, should be 0 # no need to calc Sigma.hat again, it's the same... } #lnLhat <- sum(dmvnorm(x=Xnp, mean=mu.hat,sigma=Sigma.hat,log=TRUE)) #a way to check calcs with library(mvtnorm) #to get maximum of log likelihoods: lnLhat <- -(0.5*n*p)*log(2*pi) -(0.5*n*p)-(0.5*n)*log(det(Sigma.hat)) return(list(mu.hat=mu.hat,Sigma.hat = Sigma.hat,lnLhat = lnLhat)) } ### Bayesian Information Criterion Function BICcalc <- function(lnLhat, npars, samp.size){ return(-2*lnLhat + npars*log(samp.size)) } # Example parameterization 1 with hypothesis 1 (null model with all the data together) Null.MLEs <- MLmvn(Xnp=The.data, centered=FALSE) Null.BIC <- BICcalc(lnLhat = Null.MLEs$lnLhat, npars=2+3, samp.size=len) #(npars is 1 mean vector and 3 elements in the var-cov matrix)
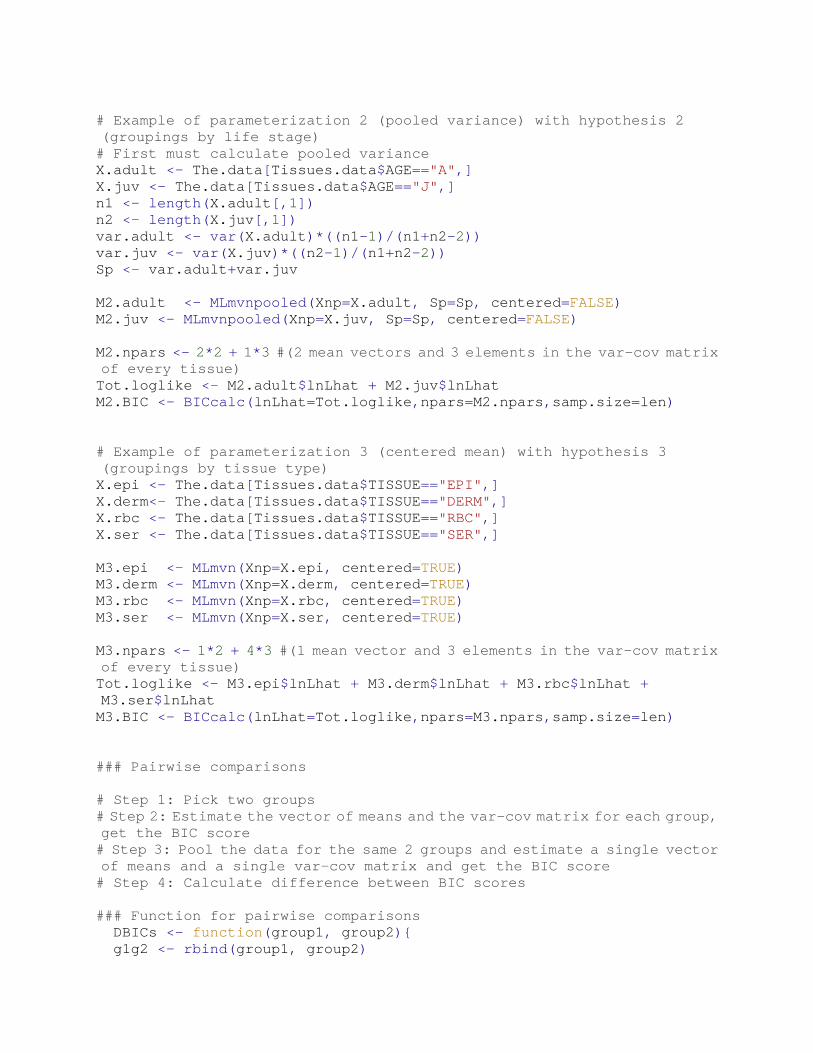
# Example of parameterization 2 (pooled variance) with hypothesis 2 (groupings by life stage) # First must calculate pooled variance X.adult <- The.data[Tissues.data$AGE=="A",] X.juv <- The.data[Tissues.data$AGE=="J",] n1 <- length(X.adult[,1]) n2 <- length(X.juv[,1]) var.adult <- var(X.adult)*((n1-1)/(n1+n2-2)) var.juv <- var(X.juv)*((n2-1)/(n1+n2-2)) Sp <- var.adult+var.juv M2.adult <- MLmvnpooled(Xnp=X.adult, Sp=Sp, centered=FALSE) M2.juv <- MLmvnpooled(Xnp=X.juv, Sp=Sp, centered=FALSE) M2.npars <- 2*2 + 1*3 #(2 mean vectors and 3 elements in the var-cov matrix of every tissue) Tot.loglike <- M2.adult$lnLhat + M2.juv$lnLhat M2.BIC <- BICcalc(lnLhat=Tot.loglike,npars=M2.npars,samp.size=len) # Example of parameterization 3 (centered mean) with hypothesis 3 (groupings by tissue type) X.epi <- The.data[Tissues.data$TISSUE=="EPI",] X.derm<- The.data[Tissues.data$TISSUE=="DERM",] X.rbc <- The.data[Tissues.data$TISSUE=="RBC",] X.ser <- The.data[Tissues.data$TISSUE=="SER",] M3.epi <- MLmvn(Xnp=X.epi, centered=TRUE) M3.derm <- MLmvn(Xnp=X.derm, centered=TRUE) M3.rbc <- MLmvn(Xnp=X.rbc, centered=TRUE) M3.ser <- MLmvn(Xnp=X.ser, centered=TRUE) M3.npars <- 1*2 + 4*3 #(1 mean vector and 3 elements in the var-cov matrix of every tissue) Tot.loglike <- M3.epi$lnLhat + M3.derm$lnLhat + M3.rbc$lnLhat + M3.ser$lnLhat M3.BIC <- BICcalc(lnLhat=Tot.loglike,npars=M3.npars,samp.size=len) ### Pairwise comparisons # Step 1: Pick two groups # Step 2: Estimate the vector of means and the var-cov matrix for each group, get the BIC score # Step 3: Pool the data for the same 2 groups and estimate a single vector of means and a single var-cov matrix and get the BIC score # Step 4: Calculate difference between BIC scores ### Function for pairwise comparisons DBICs <- function(group1, group2){ g1g2 <- rbind(group1, group2)

g1g2.joint.est <- MVNpool(Xnp1=group1, Xnp2=group2) g1g2.pool.est <- MLmvn(Xnp=g1g2) ng1 <- dim(group1)[1] ng2 <- dim(group2)[1] g1est <- MLmvn(Xnp=group1, centered=FALSE) g2est <- MLmvn(Xnp=group2, centered=FALSE) sep.BIC <- -2*(g1est$lnLhat + g2est$lnLhat) + 5*2*log(ng1+ng2) joint.BIC <- -2*g1g2.joint.est$lnLhat + 7*log(dim(g1g2)[1]) pool.BIC <- -2*g1g2.pool.est$lnLhat + 5*log(dim(g1g2)[1]) varDBIC <- joint.BIC-sep.BIC meanDBIC <- pool.BIC-sep.BIC return(list(DBIC.mean=meanDBIC, DBIC.var=varDBIC)) } # Example of pairwise comparison DBICs(group1=X.aepi, group2=X.aderm)
Top Related