


Languages
Pages
Legal


AAllmmaa MMaatteerr SSttuuddiioorruumm –– UUnniivveerrssiittàà ddii BBoollooggnnaa
DOTTORATO DI RICERCA IN
Ingegneria Elettrotecnica
Ciclo XXIX
Settore Concorsuale di afferenza: 09/E2 Settore Scientifico disciplinare: ING-IND 33
PHYSICS OF ELECTRICAL TREEING IN
SILICONE GEL
Presentata da: Paolo Mancinelli Coordinatore Dottorato: Relatore: prof. Domenico Casadei prof. Andrea Cavallini
Esame finale anno 2017

1
TABLE OF CONTENTS
I THE THESIS WORK .................................................... 3
II SILICONE GEL............................................................ 5
II-1 POLYSILOXANES ............................................................................ 5
II-1.1 GENERAL CHARACTERISTICS ................................................... 5
II-1.2 APPLICATIONS ........................................................................ 9
II-1.3 SILICONE GEL PECULIARITIES ............................................... 10
II-2 POWER MODULES ENCAPSULATION ............................................. 11
II-3 CABLE JOINTS .............................................................................. 15
III PARTIAL DISCHARGE AND ELECTRICAL TREEING 18
III-1 PARTIAL DISCHARGES ................................................................. 18
III-1.1 PARTIAL DISCHARGE PHYSICS ............................................... 19
III-1.2 PARTIAL DISCHARGES DETECTION AND IDENTIFICATION ....... 21
III-2 ELECTRICAL TREEING IN SOLIDS ................................................. 26
III-2.1 TREE SHAPE .......................................................................... 26
III-2.2 TREE GROWTH STAGES AND PD ............................................. 29
III-2.3 ELECTRICAL TREE ON SILICONE GEL: PREVIOUS RESEARCHES ...
............................................................................................. 35
IV SAMPLE PRODUCTION AND EXPERIMENTAL SETUP 38
IV-1 SAMPLE MANUFACTURING ......................................................... 38
IV-2 EXPERIMENTAL SETUP ................................................................ 42

2
IV-2.1 MEASUREMENT CELL AND INSTRUMENTS .......................... 42
IV-2.2 TEST PROCEDURE................................................................ 44
V TREE INCEPTION TESTS.............................................. 47
V-1 INCEPTION IN SILICONE GEL ...................................................... 47
V-1.1 SINUSOIDAL AND SQUARE COMPARISON............................... 52
V-1.2 HIGH SLEW RATE .................................................................. 56
V-1.3 UNIPOLAR SQUARE VOLTAGE ............................................... 57
V-2 INCEPTION IN ELASTOMER .......................................................... 60
VI TREE INITIATION MODEL ....................................... 63
VI-1 SPACE CHARGE INJECTION ......................................................... 63
VI-2 CHARGE INJECTION MODEL ....................................................... 65
VI-3 CHARGE INJECTION CALCULATION ............................................ 68
VI-4 TREE INCEPTION MODEL ............................................................ 73
VI-5 MODEL VALIDATION ................................................................... 77
VII ELECTRICAL TREE GROWTH ................................. 82
VII-1 TIME AND LENGTH OF TREES ................................................. 82
VII-1.1 TIME TO BREAKDOWN (TTB) ................................................ 83
VII-1.2 MAXIMUM LENGTH AND FRACTAL NUMBER .......................... 86
VII-2 GROWTH MECHANISM IN GEL ................................................ 90
VIII CONCLUSIONS ......................................................... 96
REFERENCES ...................................................................... 99

3
I THE THESIS WORK
The silicone gel use as electrical insulator is undoubtedly linked to the power
electronic modules encapsulation. The combination of good thermal stability,
electrical insulation, and mechanical characteristics is the reason of this link as it
will be better explained in the next pages. Today, power modules encapsulation is
still the major application of this material, even if other are growing of relevance,
such as the insulation in cable joints. However, the progress of the technology in
the power modules have been the triggering factor for several studies on the
properties of this material.
The increase of the operation voltage in power electronic modules brought a
consequent increase of the electrical stress on the silicone gel used. In particular,
the small size of the diodes and of the corners of the baseplate or the metallization
causes very high field in particular areas. This is the classical condition for partial
discharges and for a destructive degradation of the insulation such as the electrical
treeing. The electrical trees have been deeply investigated in solid dielectric since
the 70’s, but the behavior in the gel, that shows characteristics of both solid and
liquid materials, is strongly different, as it will be explained in this work.
This thesis divides the study on the electrical treeing into two main phases:
the inception and the growth. Both are carried out assessing the influence of the
waveform frequency and shape on the electrical treeing. The analysis of the tree
inception, which is the initial stage of the tree, have a primary importance since it
permits to evaluate the reasons and the conditions generating the tree. In this work,
it is proposed a physical model explaining the mechanism of the inception,

4
supported by a numerical calculation and verified through the experimental tests
carried out.
The study of the electrical tree growth furnishes a knowledge of the rapidity
and of the type of damage produced by the tree. In the particular case of the
silicone gel, the evaluation of the growth permits to understand several peculiar
features of this material, which make it highly different from solids.
Although the electrical treeing is a well-known degradation in solids, it is not
the same for gels. Therefore, this work wants to achieve the same level of
understanding of the electrical treeing mechanism reached in solids also in gels.

5
II SILICONE GEL
II-1 POLYSILOXANES
The term “silicone” was chosen before the IUPAC rules by analogy with
“ketone”. At that time, it was thought that the chemistry of silicone could have
important analogies to the chemistry of carbon. The reason is, indeed, the
similarity of the structural unit of the silicone base chain R2SiO with the ketone
R2CO. According to IUPAC rules, the scientifically correct name for silicones is
polyorganosiloxanes, from the siloxane chemical group Si-O-Si. Nevertheless, the
term “silicones” is today commonly used for compounds in which silicon atoms
are linked via oxygen atoms, where each silicon atom bearing one or several
organic groups [1].
II-1.1 General characteristics
Polysiloxanes present some peculiar features deriving from their general
structure:
1. They are polymeric and they have the typical structural form of organic
macromolecules.
2. They contain silicon-oxygen bonds, thus they have the same units of the
structure forming silicates and silicic acids.
3. They contain hydrocarbon radicals linked directly to silicon and,
therefore, they are correlated to organic chemistry.

6
For these features, silicones can be considered in an intermediate position between
the inorganic and the organic compounds, with similitudes with both silicates and
organic polymers. This dual nature causes the particular fascination of this class
of compounds.
A great variety of compounds is attainable in polyorganosiloxane chemistry.
Indeed, different siloxane units can be combined with one another in the same
molecule, leading to compounds with significant macroscopic differences. The
various siloxane units can be divided according to the number of oxygen atoms
bonded to the silicon one. Therefore, a single siloxane unit can be monofunctional
(M), difunctional (D), trifunctional (T), or even tetrafunctional (Q) [2] as shown
in Figure II-1.
Figure II-1: Origin compound, functionality, and fields of application of silicone
structural units from [2]
Different composition of siloxane units may produce significantly different
silicone products. Linear silicone fluids are composed mainly of D units, which
give closed rings in combination with one another. The base polymers for silicone

7
elastomers or silicone rubbers consist of D units that bear cross-linkable functional
groups. The main structural features of the highly branched silicone resins are T
units, often combined with D units to make the resins more flexible. Silicone
resins can also contain Q and M units. Actually, it is also possible to use
combinations of three or four different types to construct a molecule, thus
numerous silicone products can be synthesized and small ratio variations can
significantly influence the final result. Despite the difference between the
silicones, they have common properties:
A significant thermal stability and thermal resistance at high temperature,
e.g. silicone elastomers have the widest operating temperature range of
commercially important rubbers;
Low chemical reactivity with high oxidation resistance;
Anti-stick capability and good adhesion to surfaces with hydroxyl groups;
Low toxicity;
Low thermal conductivity, but it can be increased by a large amount of
inert fillers;
The ability to repel water and form watertight seals;
Good resistance to oxygen, ozone, and UV light;
Gas Permeability;
Transparency;
Good electrical properties: Siloxanes and their mixtures with pyrogenic
silica have a very good electrical insulating capacity. The electrical
properties are temperature dependent and are strongly affected by
exposure to water. In other application, the addition of carbon blacks can
decrease strongly the resistivity.
The most common silicon-based organic polymers, in particular for rubbers
and fluids, are the polydimethylsiloxanes (PDMS). PDMS are optically clear, and,
like the greater part of the silicones, inert, non-toxic, and non-flammable. The
chemical formula of PDMS is presented in Figure II-2.

8
Figure II-2: PDMS structure
Solid silicones can be divided depending on their reticulation temperature or their
composition before the cross-linking. Following the first, silicones are divided in
room temperature vulcanizing (RTV) or high temperature vulcanizing (HTV).
RTV are easier to be employed, especially as sealants, adhesives, or coatings,
since they cross-link without the need of a heating source, while HTV are mainly
used for industrial scale application in molded objects [2]. From the composition
point of view, silicones can be one-component or two-components systems. In the
two-components systems, the curing occurs after the mixing of the components,
with different ratios, depending on the curing mechanism of the material. In this
case, it is important to control the homogeneity of the solution and the correct ratio
used, while the process, depending on the environmental condition, should take
from few minutes to several hours to be completed. On the other hand, the one-
component curing mechanism takes place forming an elastic skin on the surface
of the material employed under the action of atmospheric moisture. Curing
proceeds from the surface to the inside and the rate of curing depends not only on
the ambient temperature and humidity but also on the type of material and the
object shape.

9
II-1.2 Applications
The broad set of properties of silicones leads to a wide range of applications
for these materials.
Because of silicone liquids high thermal stability and good low-temperature
performance, they are used as heat transfer media in heating circuits in chemical,
petrochemical, pharmaceutical, and food industries and in solar power plants, and
as refrigerants in cryostats, freeze dryers, and climate simulation plants. The low
surface tension of silicone leads to their use as release agents in the processing of
plastics and rubber articles and as a lubricant, especially in paste or grease form.
Because of their surface activity, polydimethylsiloxanes are employed as
antifoams in aqueous systems, in laundry detergents, and in petroleum processing.
Silicone oils are important dielectric coolants for transformers and rectifiers
because of their flame resistance, resistance to aging, material compatibility, and
physiological inertness.
The range of applications of silicone elastomers is even broader than the one
of liquids. In electrical insulating devices, silicones are used for cable sheaths,
wire insulation, power cable joints, and power cable endcaps. In electronics,
silicones are present in various types of coatings and encapsulations. Silicone gel,
which is the material studied in this thesis work, have in common several features
with elastomers. The main application of this material in the electronic and electric
field, such as power module encapsulation and cable joints, will be deeper
discussed in the next paragraphs.
Many household products are made by polysiloxanes, such as pot seals,
coffeemaker tubes and seals, baby bottle nipples, oven gaskets, and anti-stick
papers. Automotive and airplane industry are probably the fields were silicone
elastomers are employed within the higher number of components: air bags,
window seals, ignition cables, oil pan gaskets, headlight seals, cooling and turbo
hoses, vibrational damping, and O-ring are only some of the objects made by
silicones and widely employed in these fields. In general, the elastomers are the

10
form of silicones more often employed in different solutions. Other applications,
in fact, range from casting forms, membranes, impression molding compounds,
anti-stick bladders, protective masks, etc. Noteworthy are the devices employed
in medicine and dentistry, where tooth impression compounds, implants, pumps,
heart valve seals, catheters, and lenses are made by silicone elastomers.
Whereas silicone fluids and elastomers are based on linear polymers, silicone
resins are highly branched, containing significant quantities of T or Q units, thus,
they show a more reticulated solid structure than the other silicones. The main use
of these resins is as painting or coating were high thermal stability and good water
repellency.
II-1.3 Silicone gel peculiarities
Most potting, filling, or encapsulating materials employed in electrical or
electronic applications are either fluid or resinous in nature. A silicone gel is a
departure from these types of products. It merges the non-flowable permanence
of a solid polymer, with the protection from mechanical and thermal stresses
provided by a fluid. Silicone gel temperature range of application is between
-65°C and 200 °C [3]. The silicone gel tackiness provides mechanical adhesion to
almost all the surfaces, and its jelly-like nature provides it the self-healing
capability, making it able to recover after mechanical perforation or cut.
Typical silicone gel is a form of silicone rubber and mainly made by PDMS.
The gel is usually a RTV material and often consists of two components to be
mixed with a ratio close to 1:1. The most common curing reaction, indeed, is due
to catalysts consisting of platinum compounds which come together with one of
the components [4].
In silicone gels, the combination of the electrical properties, with the peculiar
thermo-mechanical behavior makes this dielectric perfect for embedding IGBT
modules or for cable joint insulation, where the gel high elasticity, thermal

11
stability and ability to compensate the mechanical stress caused by temperature
changes during device operation are of high importance [5].
II-2 POWER MODULES ENCAPSULATION
Power electronic modules are the equipment providing the physical
containment for several power components, mostly power semiconductor devices.
Different technologies are today used for power modules and their shape, while
the materials employed depend on the power semiconductor number, voltage, and
operating conditions [6].
The take-up of electronics in transport systems, which use semiconductor
technology to convert and control electrical power, has resulted in tremendous
growth in the use of power electronics devices. The number of systems employing
these devices is continuously increasing especially in electrical traction
applications such as locomotive, subway, elevator, and car [7]. The development
of these technologies requires an increase of power density, thus an increase in
the maximum operating voltage and current. For example, high voltage IGBT
(Insulated Gate Bipolar Transistor) power modules have been produced up to 6.5
kV leading to enhance the performance of dielectric materials used in these
modules [8].
Silicone gel is usually employed inside power modules in order to
encapsulate power electronic circuits and placed between the circuits and the case,
which is made by epoxy resin or plastic material. Indeed, because of the different
coefficients of thermal expansion of the involved materials, it is necessary to use
a dielectric which can compensate the mechanical stress in power cycling [9].
Moreover, the role of the gel is also to protect components and connections against
pollution, moisture, and also to avoid partial discharges (PD, see chapter III for
the introduction to partial discharges).

12
The circuit, in fact, has a complex interior structure. The components inside
the module can be at different potential and the voltage in them can vary quickly
with waveforms similar to fast square voltage, usually unipolar. Therefore, an
inhomogeneous field distribution is present inside the power module case.
Consequently, electrical stress degradation is one of the possible failure causes
[10]–[12] in power modules and probably the most dangerous in the lately
developed high voltage ones [13], [14].
The components which commonly form the power modules can be
schematized as in Figure II-3. The ceramic substrate is soldered to a baseplate
which ensures the mechanical stability of the assembly and the thermal transfer
towards the cold source. From the electrical point of view, the baseplate is
electrically connected to the ground, thus the lower face of the substrate is at zero
potential. The substrate is required to furnish a common plane for the dies, it
should be a dielectric but with good thermal conductivity. Therefore, it is made of
an electrically insulating material, such as alumina or aluminum nitride. The chips
are connected to the upper face of the substrate, through the metallization which
is typically realized by a thick copper layer, either connected to the substrate by a
eutectic bonding process or by an active metal brazing process. Finally, the dies
are connected externally trough copper wires and the whole power electronic
circuit is covered by silicone gel.
Figure II-3: Generic power module chip arrangement

13
A series of studies have investigated the electric field inside the power
modules, its inhomogeneity, and the possible development of discharges. The
finite element method (FEM) has been used to evaluate the electric field in the
system [15], [16]. The calculations highlighted the presence of strongly enhanced
field at the edge of the metallization, in correspondence of the triple point,
between the substrate, the copper, and the silicone gel. Depending on the shape of
the copper edge and the relative permittivity of the substrate employed, the electric
field can be one or more order of magnitude higher than the one present in the
central part of the substrate, where the field is constant.
This relevant inhomogeneity of the electric field inside the silicone gel at the
edge of the copper solder can lead to PD, which began the main cause of
deterioration of the dielectric gel. When the self-healing properties of the silicone
gel are not sufficient to recover this electrical stress, the dielectric can be
irreversibly damaged by an electrical tree and a fatal breakdown will follow. The
presence of PD have been confirmed experimentally [14], [17], [18] and their
location is at the edge of the metallization, as expected after FEM analyses. Figure
II-4 and Figure II-5 show the presence of partial discharged detected under
different test conditions [15], [18].

14
Figure II-4: Light emission during PD activity at the edge of the metallized substrate,
thanks to [18]
Figure II-5: PD location in a 5 kV test, thanks to [15]
The probability of PD inception in the silicone gel used to encapsulate the
power electronic devices grows with the voltage applied. Therefore, in the last
years, some researches have been carried out in order to substitute the silicone gel
or to enhance its properties [15], [19]–[22]. Despite these researches, a clear

15
treatise on the physics of phenomenon occurring during the electrical treeing and
its correlation with the electrical parameters has not been articulated so far.
II-3 CABLE JOINTS
Another important application of silicone gel as dielectric material is the
filling of power cable accessories. They are the most breakable points of power
cables since the continuity and homogeneity of the extruded cable are interrupted
and the electrical field is distorted. The cable accessories require an expert
operator to be correctly mounted and, especially for high voltage applications,
stress grading systems, in order to decrease possible electric field enhancements.
The development of silicone gel technology brought the possibility of in-line
jointing with high reliability, simple installation procedure, and low installation
costs [23], [24]. The alternative medium and low voltage taped joints, indeed,
require three layers of rubber tape half-lapped and two layers of plastic tape, with
longer installation time and more chances of human error. Common silicone gel
splices are usually made by a rigid hinged clamshell housing filled with silicone
gel or by a flexible elastomeric wraparound sleeve coated with silicone gel as
shown in Figure II-6 [25].

16
Figure II-6: Silicone gel splices: at the top a clamshell housing at the bottom a
wraparound sleeve, before and after installation [25]
The state-of-the-art in low voltage jointing systems has been advanced by
the integration of a mechanical connector into a gel closure as shown in Figure
II-7. This permits to the gel closure design to be optimized in size and function
for set screw mechanical connectors with advantages in ease of installation and
puncture resistance over existing closures.

17
Figure II-7: termination with rigid connector inside [25]
The design voltage of 5 kV has been already reached. The reliability and the
simple installation process of the silicone gel joints are leading the manufacturer
to use this dielectric in order to fabricate products for higher operating voltage,
where the material will be seriously electrically stressed. Therefore, an accurate
study on the consequence of PD and electrical treeing in silicone gel will be of
interest for the power cable manufacturer too.

18
III PARTIAL DISCHARGE AND
ELECTRICAL TREEING
The PD detection is not present in the main investigations of this thesis work,
as it will be clear in the next chapters. This choice has been made after the results
of preliminary measurements on solid materials and thanks to the strengthened
knowledge of the connection between electrical treeing and PD. Nevertheless, it
is not possible to discuss electrical treeing without a sufficient knowledge of PD,
which generate the treeing itself. Therefore, a brief explanation of the physic and
the detection of PD is made in this chapter, before introducing the electrical
treeing phenomenon.
III-1 PARTIAL DISCHARGES
“Partial discharges (PD) are localized electrical discharges that only partially
bridge the insulation between conductors and which can or cannot occur adjacent
to a conductor. Partial discharges are in general a consequence of local electrical
stress concentrations in the insulation or on the surface of the insulation.
Generally, such discharges appear as pulses having durations of much less than 1
µs” [26].
Since the beginning of the 20th century, when high voltages were
increasingly used for the long-distance transmission of electrical power, it became

19
clear that discharges in gas-filled inclusions and defects of solid dielectrics can be
the origin of the insulation degradation and of the consequent breakdown.
Therefore, the interest around the PD detection grew significantly, developing
various tools and employing optical, acoustical, chemical and electrical methods.
Since the 1960s, the electrical PD measurement is a widely accepted tool for the
quality assurance tests of HV apparatus during operation life [27].
III-1.1 Partial discharge physics
The flow of electric charges is the generation mechanism of discharges. An
electron situated near the cathode surface and generated by externally supplied
radiation can move toward the anode under the action of the applied field
producing more electrons by collisional ionization with gas molecules and, thus,
leading to an electron avalanche. Following the propagation mechanism, the
avalanches creating PD might be divided into two main processes: the Townsend-
like and the streamer-like discharges [28].
The avalanche in Townsend-like discharges is easily described by an
exponential law:
N(x) = N(0)eαx (1)
where N is the number of negative ions in the avalanche, x is the distance from
the avalanche starting point and α is the Townsend ionization coefficient,
expressing the number of ion pairs generated per unit length by an electron
moving from cathode to anode. A schematic representation of the avalanche is
presented in Figure III-1.

20
Figure III-1: Townsend discharge avalanche
Due to the avalanche shape, a great part of the electrons is produced close to
the anode, which they reach quickly, decreasing the actual electric field inside the
gap and consequently the α parameter thus ceasing the electron avalanche itself.
Since the electron mobility is much higher than that of the positive ions, the
current flowing during the initial buildup of avalanches is largely due to the
electron flow, leaving behind the slower positive ions. The positive ions reach the
cathode in a longer time window, generating a homogeneous current flow. The
overall result is a flat current with an initial peak, which can be significantly
pronounced or not, and a duration in the range of the hundreds of nanoseconds.
The magnitude of charge usually carried out by a Townsend discharge is low, the
rise and fall time of the current are quite long, thus this type of discharges is
usually more difficult to be detected, especially in online measurement [29].
Streamer discharges are faster and more energetic than Townsend ones and
they are the most common discharges detected in dielectrics. The initial source of
discharges is the same i.e. an avalanche of electrons, but, in this case, the space
charge due to the avalanche itself is large enough to reach the same order of
magnitude of the applied electric field. Consequently, secondary avalanches are
generated inside the gap which is quickly short-circuited by a plasma channel. The

21
current produced by the streamer discharges has very short rise times, in the order
of the nanoseconds, and fall time of few tens of nanoseconds. The magnitude of
the current is higher than in Townsend-like discharges and can exceed a hundred
of milliamps. The classical currents produced by Townsend and streamer
discharges are presented in Figure III-2.
The main parameters influencing the transition between Townsend-like and
streamer-like discharges are related to the electric field and the cavity size. The
PD physics and this transition mechanism have been widely discussed in the
literature and, for a complete discussion, the reader should refer to [30].
III-1.2 Partial discharges detection and identification
PD measurement methods can take advantage of different PD properties in
order to employ various system [26], [27]:
Electrical conducted signals;
Electromagnetic radiated fields (using antennas, electric or capacitive
couplers);
Audible sound;
Ultrasound pressure waves in air or fluids;
Ultrasound acoustic emission from waves propagating in solid structures
(e.g. transformer tanks);
Light;
Ultraviolet radiation;
Chemical byproducts (in air commonly O3).
Conventional systems detect electrical conducted signals. The measurements
reported in the preliminary part of this work were carried out through a PD-base
supplied by Techimp, which analyzes electrical conducted signals.

22
Figure III-2: comparison between Townsend (upper) and streamer (lower) discharges
[30]
PD are complex events. Every PD event can be considered as a pulse having
a large frequency content (from the MHz to the GHz range). The information
conveyed by PD in a single PD event is often synthesized in just three numbers:
the time length, the phase, and the magnitude.

23
Since PD are repetitive and stochastic phenomena, their analysis requires an
accurate model able to reveal the underlying physical processes. The data are
elaborated and collected in PD patterns, which provide the density of PD events
in the frequency-charge (f-q) plane. Additionally, signal processing tools are used
to separate PD from different sources.
The equipment under test is commonly schematized in the so-called abc
circuit, shown in Figure III-3. The model represents the insulating material, where
the capacitance c is the cavity or defect where the PD will occur, b is the part of
the material in series with c and a is the remaining part of the dielectric, which
can be considered in parallel with the other two capacitances.
Figure III-3: abc circuit for PD representation
The c capacitance is much higher than b. When c is short-circuited by the
PD, the charge in the b capacitance increases of Vcb, where Vc is the voltage
applied at the capacitance c. This charge is provided by the capacitance a and is
defined as apparent charge since is not the real charge involved in the PD but a
consequence of them. In this process, the current flow happens inside the dielectric
and no signal is detected outside. In order to make possible the PD measurement
at the terminals of the equipment under test (EUT), a coupling capacitance is
commonly employed. Indeed, placing a capacitance much larger than the EUT
one, the apparent charge is provided by this coupling capacitance and the current
is forced to flow out to the EUT.

24
The PD detectors, using the electrical conducted signals, can be either a
resistor in series with the current path, a coupling capacitance or a high-frequency
current transformer (HFCT) measuring the current flowing to ground. Depending
on the detector position, the measurement circuit can be direct or indirect,
changing the sensitivity of the system and the sign of the charge measured.
Moreover, a proper filter for the pulse current generated by the PD should be
employed, knowing the EUT characteristics. All these specifications can be found
in the already cited standard [26].
Each single PD event is recorded and elaborated by the device used for the
detection. The PD are, in fact, rearranged in patterns, highlighting the single pulse
properties. These patterns have either two or three axes and show different
combination of fundamental characteristics of the PD. Since the PD measurements
showed in this work were carried out through a PD-base, the magnitude-phase
(which shows also the frequency of repetition through different color in the
pattern) and the T-F map (equivalent timelength and frequency) are reported [31],
[32]. The possibility to rearrange the pulses into patterns is the only way to analyze
a stochastic phenomenon as the PD development. Indeed, PD can occur in various
locations inside an insulating system and cause different types of electrical
degradation. Analysis of positions and shapes of the PD pulse clusters into the
patterns is the only way to identify the defect type and its harmfulness.
The PD identification is mainly carried out following empirical and
comparative methods. The pattern analysis should be performed by an expert who
is able to interpret the results and classify them. PD sources can be internal, as
electrical treeing or due to defects in the insulating material, e.g. voids,
delamination, and protrusion or external, as corona or surface discharges. The PD
activity due to these processes produces patterns with peculiarities which make
them discernable as shown in Figure III-4.

25
Figure III-4: examples of PD patterns for different degradations
The analysis of PD pulse shape permits to evaluate the distance of the
damage from the measurement acquisition system or the dimension of the area
interested by the degradation process, which are important features in tests on
complex system or online machines. In laboratory tests, as in this work, these
became less important, since the test area is well-known, while the accuracy and
the sensitivity of the measurements became fundamental. In the next paragraphs,
the electrical treeing and its close bond with PD will be better explained.

26
III-2 ELECTRICAL TREEING IN SOLIDS
The electrical treeing has been known as an electrical breakdown cause for
HV insulating systems since the beginning of the last century [33], [34]. It is
known to occur in solid materials and it has been observed in both inorganic and
polymeric materials. Thus, it must be a process whose mechanism is independent
of the chemical nature of the insulation. It has been reported in DC voltage, but it
is much more common in AC applications.
It is important to note that water trees [35], [36] will not be treated here.
They, indeed, are a different type of dielectric degradation, with substantial
difference compared to electrical trees [37].
III-2.1 Tree shape
Electrical trees grow in regions of high electrical stress, such as structural
irregularities, metallic asperities or conducting contaminants. Electrical trees
which initiate at an electrode growing towards the other are called vented trees,
whilst electrical trees generated in the body of the insulation having a branched
channel structure roughly oriented along the field lines are defined bow-tie trees.
These last are usually originated from impurities or metallic contaminants and
should be easier to avoid. On the other hand, vented trees are composed of inter-
connected hollow tubules with the major channel at the base forming a vent for
the whole system which may allow access to the external environment.
Vented trees, which are often more common and dangerous than bow-tie
trees, can have different shapes. The terminology used in literature is slightly
different depending on the researchers, but the most accepted one divides vented
trees into three categories: branched, bush-like, and bush-branch [37]. As shown
in Figure III-5, branched trees exhibit a various number of branched structure,
made by a series of channels with diameters ranging from few tens of microns to
1 µm in the fine filamentary channels at the tip. In bush-like trees, the channels

27
are so densely packed that the structure appears like a solid bush-shaped mass
when projected in 2D. Finally, bush-branch trees are bush-like trees with branches
projecting outside the main bush-like structure.
Figure III-5: vented tree shapes: a) branched; b) bush-type; c) bush-branch. Images
taken from [37]
The three categories are not completely distinct. In order to better understand
the shape of vented trees, the notions of fractal number and fractal structures
should be introduced. Indeed, the damage generated by the tree and the tree shape
can be characterized by the dimension dt known as fractal number. To a first
approximation, a definition of this quantity can be given by considering the

28
volume or mass of tree damage S(L), contained within a cube of side L, which is
given by [38]:
S(L) ∝ Ldt (2)
Actually, the dimension of any object can be characterized by equation III-
1. A cube would have a dt equal to 3, thus the same of the Euclidean space in
which it exists. On the contrary, Fractals are a class of objects whose dimension
is less than that of the Euclidean space in which they are present and is usually
non-integer.
Electrical tree shape can be considered a statistical fractal [39]–[41].
Contrarily to geometrical fractals which are abstract structures exhibiting exact
scale invariance, statistical fractals do not present an exact geometrical scalability,
but they exhibit a property, such as their mass S(L), showing a scale invariance,
and obeying Equation III-1 with a non-integer value of dt. In this case, the value
dt assumes the name of fractal number and it can be used to define the tree shape.
Bush trees, in fact, have the higher fractal number with dt higher than 2, branched
trees have the smaller fractal number usually up to 1.8 while the bush-branch trees
show dt values in between [42], [43].
The electrical tree shape and its fractal number are determined by different
parameters. First of all, electrical trees have been found in many different
materials and the material and its characteristics (amorphous phase, glass
transition temperature, electrical and mechanical properties, etc.) are parameters
which may influence the tree shape. Moreover, the electric field, the frequency,
the temperature, and the electrode shape are the more significant variables capable
of modifying the fractal number and many empirical correlations are presented in
literature in order to connect the electrical stress with the tree shape [37], [38],
[43]–[47].
In general, branch trees grow at lower electric field than bush trees and
usually the time to create a new branch is almost independent of the field.
29
Therefore, since the bush trees will have many more branches than a branch tree
of the same length, if the time to grow a branch of a specified length is the same,
bush trees will grow in length much slower than branch trees. Nevertheless, the
damage per unit of volume created by bush trees is sensibly higher than branch
trees. In any case, branched trees are usually more dangerous than bush trees as
they develop quickly towards the opposite electrode. In many cases, increasing
the voltage frequency, the trees tend more to a bush-like shape and usually the
grow rate is proportional to frequency.
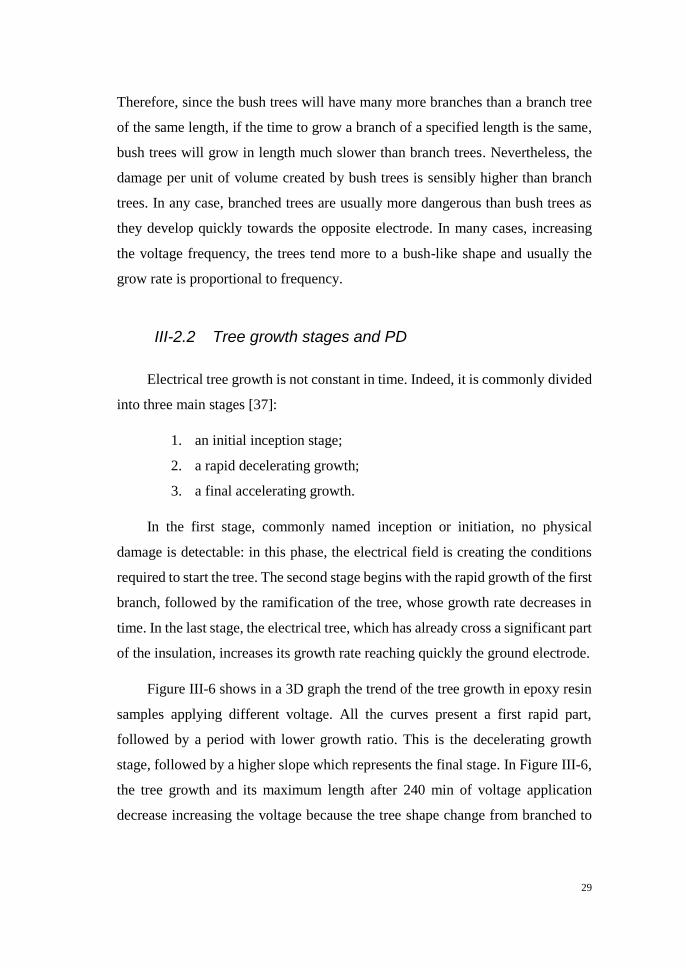
III-2.2 Tree growth stages and PD
Electrical tree growth is not constant in time. Indeed, it is commonly divided
into three main stages [37]:
1. an initial inception stage;
2. a rapid decelerating growth;
3. a final accelerating growth.
In the first stage, commonly named inception or initiation, no physical
damage is detectable: in this phase, the electrical field is creating the conditions
required to start the tree. The second stage begins with the rapid growth of the first
branch, followed by the ramification of the tree, whose growth rate decreases in
time. In the last stage, the electrical tree, which has already cross a significant part
of the insulation, increases its growth rate reaching quickly the ground electrode.
Figure III-6 shows in a 3D graph the trend of the tree growth in epoxy resin
samples applying different voltage. All the curves present a first rapid part,
followed by a period with lower growth ratio. This is the decelerating growth
stage, followed by a higher slope which represents the final stage. In Figure III-6,
the tree growth and its maximum length after 240 min of voltage application
decrease increasing the voltage because the tree shape change from branched to

30
bushy. Finally, for the higher voltage, the specimens suffered breakdown without
a proper electrical treeing formation.
Figure III-6: Tree growth at different voltage applied taken from [38]
Electrical treeing in solid material does not end when the first branch reaches
the ground. In order to have a total breakdown, in fact, the hollow channels should
increase their diameter. After that the tree crossed the insulation, the electrical
degradation, caused by PD, continues to develop, creating few new branches and
enlarging the ones already present, until the complete breakdown discharge can
find a sufficiently sized path.
While the electrical tree propagation in solids is broadly understood and
related to PD action in gas-filled channels or charge injection from conducting
channel walls, the inception stage is much less clear. Electrical tree inception is
commonly associated with the injection of charge into the polymer [42]. The
earliest theories connected the tree initiation to either dielectric heating which
would generate a void at the electrode, usually made by a needle in the

31
experiments, or Maxwell stressing which would cause cracking around the
electrode [48]–[51]. Actually, especially in AC voltage, the role of charge
injection in the inception stage has been confirmed by the observation of light
emission in this initial phase [52]–[54]. These observations have proven to follow
well-known charge injection models, such as the Fowler-Nordheim tunneling
injection or the Richardson-Schottky injection model, with a direct proportionality
between the injected charge and the light emission [55], [56]. Despite the
experimental validation, how charge injection supplies the energy to the polymer
that causes physical damage essential to the formation of a discharging tubule or
channel is not unequivocally ascertained. The impact excitation of molecular
species by electrons that have sufficient kinetic energy may initiate a route to
chemical degradation or the chemical bonds may be broken by ultraviolet
radiation emitted during charge recombination [57], [58].
From an empirical point of view, the tree inception stage has been related to
an accumulation of energy or repeated damage. A noteworthy theory by Tanaka
and Greenwood [59] states that the time to tree inception is given by the time
required for a given amount of energy Ct to be transferred to the polymer:
ftI(Gn − Gth) = Ct (3)
Here Gn is the energy available from the displacement of the injected charge
in the local field, and Gth is its threshold value for damage producing avalanches,
with ftI the number of cycles. The Ct value is dependent on the material properties.
Correlating this model to the charge injection and extraction that has been
confirmed to occur during the polarity reversal for AC tests, the time to tree
inception in solid materials should be inversely proportional to the frequency of
the voltage applied.
The decelerating growth stage represents the first stage where the tree is
clearly detectable. The gas tunnels development is due to a sequence of PD. This
tunnels, which form the electrical tree, can have or not conductive walls, mainly

32
depending on the dielectric material on which they are growing. The PD in this
phase usually present very low energy and they are quite difficult to be detected
outside a laboratory setup. Many pieces of work studied the electrical treeing
growth analyzing the PD [60]–[65]. The actual length of this second stage is quite
difficult to be predicted and it is sensibly influenced by the electrical field and the
specimen geometry.
Part of the preliminary analysis of this thesis was carried out on epoxy resin.
The aim was to validate a first measurement setup through well-known results.
The next figures present in this chapter have been obtained in this first
investigation. An example of electrical treeing during the decelerating growth
stage is proposed in Figure III-7. The PD-check measurement and the optical
images are referring contemporaneously to the same sample, during the tree
development. The high sensitivity of the system permitted to detect the very low
voltage signal due to PD. In this case, the tree has a branched shape with a very
low fractal number in its initial stages, where is barely optically visible.
Figure III-7: Decelerating growth stage in epoxy resin
33
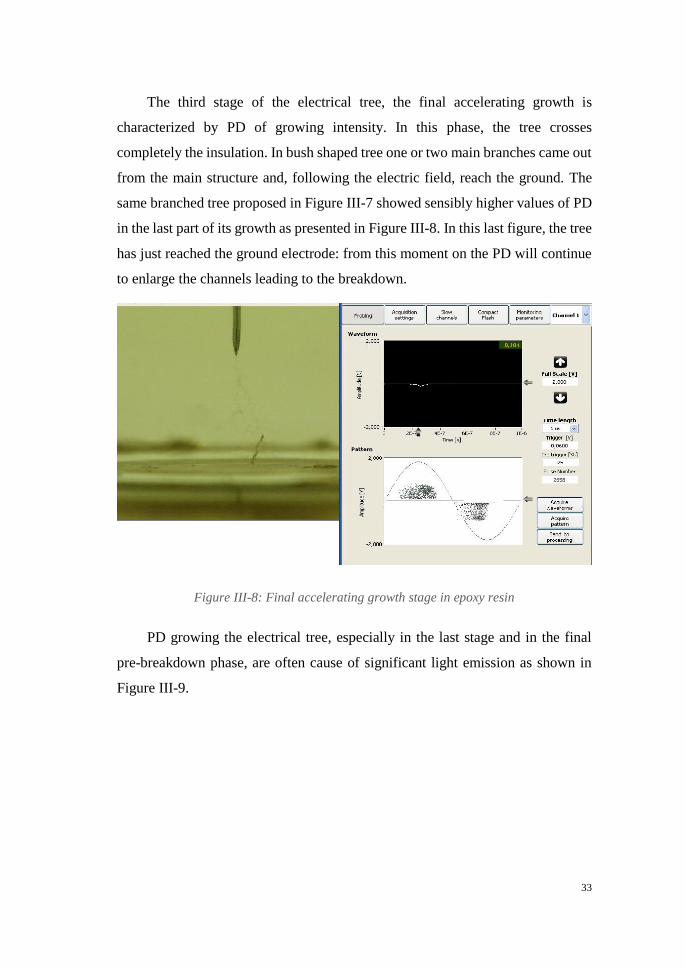
The third stage of the electrical tree, the final accelerating growth is
characterized by PD of growing intensity. In this phase, the tree crosses
completely the insulation. In bush shaped tree one or two main branches came out
from the main structure and, following the electric field, reach the ground. The
same branched tree proposed in Figure III-7 showed sensibly higher values of PD
in the last part of its growth as presented in Figure III-8. In this last figure, the tree
has just reached the ground electrode: from this moment on the PD will continue
to enlarge the channels leading to the breakdown.
Figure III-8: Final accelerating growth stage in epoxy resin
PD growing the electrical tree, especially in the last stage and in the final
pre-breakdown phase, are often cause of significant light emission as shown in
Figure III-9.

34
Figure III-9: examples of light emissions during PD in electrical treeing
In the last decade, the studies on electrical treeing focused mainly on
improvement of already existing materials, in order to make them able to avoid
tree inception or to stop the tree growth. Nanodielectrics are the most promising
material for this purpose and several types of research have been carried out in
this direction [66]–[68]. Nevertheless, nanodielectrics are often far to obtain the
exceptional results desired in industrial scale [69], where they present issues of
reliability, safety, and dispersion.

35
III-2.3 Electrical tree on silicone gel: previous researches
The main applications of silicone gel in HV are relatively recent (see chapter
II). For this reason, just few experiments of electrical tree inside this material can
be found in the literature. Moreover, the peculiar nature of silicone gel, with
reminiscences of both liquid and solid dielectrics, have created two different
approaches.
A first series of studies considered the silicone gel as a liquid dielectric [8],
[18], [70], [71]. In these pieces of work, the tests were conducted under short pulse
voltage, the same way used often to evaluate the performances of dielectric oils,
without any electrical tree growth study. Considering the gel as a liquid material,
the studies were not interested on the tree inception but rather to the development
of streamers, the same occurring, for example, in silicone oil. Nevertheless, these
streamers may have some feature in common with the tree inception development.
Under pulse voltage, the silicone gel showed two different streamer behaviors: the
fast and the slow streamers. These last present an oblong bubble shape and their
development time is in the range of some ms. Slow streamers are described as the
only streamers present at the lower voltages. Moreover, in negative pulse voltage,
only slow streamers have been recorded.
Fast streamers are called also filamentary streamers due to their shape. They
growth in less than 1 µs and reach a considerable length at a velocity higher than
3 km/s. These streamers are detected only with positive pulses and at voltages
higher than the one required to have the slow streamer inception as described in
Figure III-10.

36
Figure III-10: Streamer inception probability versus voltage with the positive point,
thanks to [71]
Another important evaluation from the researchers which considered silicone
gel as a liquid dielectric is the comparison with silicone oil. Indeed, the
filamentary streamer mechanism is reported also for silicone oil and many other
liquid media with a similar behavior [72], [73]. On the other hand, slow streamers
are common in very viscous liquids [71]. This last consideration is important to
realize that slow streamers are more related to the viscosity of the material and,
thus, can be a peculiar feature characterizing gels.
A second series of experiments [74]–[77] applied a highly divergent electric
field to silicone gel specimens through a needle, in an experimental configuration
similar to the one of the work already cited [8], [18], [70], [71]. However, in this
case, the authors studied the silicone gel as a solid dielectric, thus they applied
sinusoidal voltage and let it form the trees, analyzing the tree growth and shape.
The tree developed through bubbles and hollow channels growing its branches
both from the bubbles or from the channels with a different growing ratio [74].

37
Moreover, the growth rate reported was oscillating and showed a significant
correlation with the voltage frequency, which may connect the three growth with
the voltage phase.
The work of Salvatierra at al. [77] produces a complete analysis of the
electrical tree behavior in silicone gel varying the compounds ratio. The most
interesting conclusions to be highlighted regard the different state of the material
due to the different compounds ratio: the silicone polymer was manufactured as
liquid, gel or, elastomer. Their investigation reported two different self-healing
process. Even though their physical mechanisms were not explained, the authors
understood that these are characterized by two time constants. The first, having a
shorter time constant, is active during the electrical degradation and reduces the
tree growth closing the hollow channels. This first was detected only in gel and
liquid, while the second, requiring a longer time, was partially detected also in the
solid elastomer after the voltage was turned off. Moreover, some dimensional
features of the tree development, such as the tree vertical growth speed, the
streamer speed or the bubble characteristics were discussed in function of the
silicone gel composition.
Since in this thesis examinations were employed the same silicone gel
adopted in the work of Salvatierra et al., more relevant discussions and
conclusions about their results will be found in the next chapters (see chapter VII-
2).

38
IV SAMPLE PRODUCTION AND
EXPERIMENTAL SETUP
IV-1 SAMPLE MANUFACTURING
Electrical treeing requires an intense divergent electric field. Different
electrode configurations have been employed in literature to force the electrical
tree initiation and growth inside dielectric materials with the aim to analyze the
phenomenon [78]–[82].
The needle-plane configuration is the most common and the one able to
realize the higher field in a single point, making the tree initiation position
perfectly predictable. The theoretical maximum field at the needle tip is
approximated with the Mason’s equation [83]:
Et = V2
ln(4d
r+1)r
(1)
where d is the gap between the needle and the ground electrode, r is the tip radius
and V is the voltage applied. Therefore, the electric field can easily reach values
two or three order of magnitude greater than in the plane-plane configuration.
Each specimen employed in this work consists of silicone gel inside its
sample cell: a tungsten Ogura needle, used as high voltage electrode, is immersed
in silicone gel inside a manually manufactured container, made by polystyrene
walls and a copper plate on the bottom, which acts as ground electrode.

39
The sample production procedure requires an elevate accuracy in order to
minimize geometrical errors and impurity inclusions.
Each sample cell is used for a single silicone gel casting and it is composed
of two parts: the container, with the ground electrode, and the top, with the high
voltage electrode. The first operation consists in the containers preparation. A
commercially available spectrophotometer cuvette is cut and the lower part is
removed, obtaining a parallelepiped with four transparent rectangular sides while
the top and the bottom are opened. In order to form a close receptacle, the ground
electrode is fixed to one open side of the parallelepiped. It is made by conductive
copper tape, carefully glued and shaped with a cutter. The resulting container has
a square copper base of 1 cm2 and it is 2.5 cm high. After this operation, the
container is kept overturned in a clean shelf, until the silicone gel casting, avoiding
any possible dust deposition.
The needle tip must be placed at a constant distance in each sample, therefore, the
second preparatory operation interests the high voltage electrode setting in the top
part of the sample cell. In this work the gap between the needle tip and the ground
electrode employed, d, is 3 mm in all the samples. In order to hold the needle
hanging in the correct position into the silicone gel, it is glued to a piece of
veroboard of about 1 cm2 through a rapid adhesive epoxy. The needle is previously
cleaned with acetone. During the gluing operation, it is kept in vertical position,
with the tip upward in order to prevent any possible hit which may modify its
radius, ensuring the desired distance between the tip and the veroboard.
Eventually, the two parts of the sample cell are glued together through the rapid
adhesive epoxy, but this operation is carried out only after the silicone gel is
poured inside the container. In Figure IV-1, it is possible to see a complete sample
(on the left) and the different sample cell components separately.

40
Figure IV-1: complete specimen (left) and sample cell components (right)
The silicone gel employed in this work is a two compound transparent
silicone dielectric gel, supplied by RS Components Ltd, UK. The two liquids,
labeled as part A and part B, would require to be mixed with a 1:1 ratio in order
to obtain the correct degree of crosslinking. Actually, different ratios of the two
compounds produce different degree of crosslinking, obtaining liquid, gel or solid
products [76].
The mechanical characterization of the material for different percentage of part A
compound performed by Kovalevski et al. highlights this three possible state of
crosslinking. These tests were performed for different part A percentages, in
mixtures cured in-situ in a rheometer isothermally at 65 °C for 4 hours.
For the lower percentage of part A compound, the resulting mixture is in liquid
phase. The viscosity increases for mixtures having more than 20% part A. With
45% part A, the material reaches the first gel point. From this point up to 60% part
A, the elastic modulus is low enough for the material to behave as a sticky gel-
like compound. The commercially advised ratio 1:1 is almost in the middle of this
range and ensure a stable gel-like state. The mixtures in the range from 66% part
A to 75% part A behave like elastomeric rubber. The samples in these last A
percentage range show a decrease in the elastic shear modulus, which can be

41
associated with an excess of part A compared to part B, and therefore with a drop
of the curing efficiency. The resulting mixtures with part A ranging between 80%
and 90% show a similar behavior to the samples in the first gel region, and they
constitute a second gel region. Therefore, a new gel point should be expected at
about 90% part A. Above this percentage the mixture is in liquid state. Figure
IV-2 shows the described material behavior.
Figure IV-2: Final microstructure of samples, as the elastic shear modulus (G’)
against the percentage of part A (%A) [76]
In this work, two mixing ratios were used:
1:1 to obtain commercial silicone gel
7:3 to realize an elastomer
The aim of this choice is to compare the behavior of the electrical treeing in the
silicone gel, which shows semi-liquid features and self-healing properties, with a
solid material chemically similar, in order to assess the peculiarity of the gel state.
The following mixing and curing procedures were used for both the gel and
the elastomer samples. First, the two compound are separately weighted inside a

42
beaker and mixed together with a constant stirring for about 5 minutes. Second,
the mixture is degassed under vacuum while the continuous stirring is kept.
Subsequently, the product, completely free of bubbles, is poured into the sample
cells. The sample cells are quickly sealed with the rapid epoxy and set in oven at
65 °C for 4 hours to let the curing process take place and finally, the samples are
left to cool down slowly overnight.
After the manufacturing, all the samples were maintained in a dry and close
environment, in order to avoid, as much as possible, humidity and aging
phenomena.
IV-2 EXPERIMENTAL SETUP
The measurement setups and the type of tests performed in the work are
described in this chapter and are the results of several improvements. In particular,
the choice of some experimental parameters, such as the voltage values and the
voltage ramps, come from several preliminary tests.
IV-2.1 Measurement cell and Instruments
The measurement system was designed aiming to have a good online optical
detection of the electrical tree inception and evolution during the voltage
application. A scheme of the system is present in Figure IV-3. During the
measurements, the specimen is set into the test cell and surrounded by silicone oil,
in order to prevent discharges. The test cell is made by Polymethylmethacrylate
(PMMA) with a glass window. In fact, even if PMMA is transparent, the optical
quality of the images passing through the cell would not be high enough, as using
glass. The test cell has an aluminum bottom connected to ground and it is back
illuminated during the experiments.

43
Figure IV-3: Experimental setup scheme
The upper part of the cell ends with a brass bar, connected to the sample inside
the cell and to the HV generator outside.
Two HV generators were employed in the measurements:
A high voltage amplifier from TREK Inc. model 20-20C-HS
An experimental square voltage generator, HSR-SWG
The TREK amplifier was used to produce sinusoidal voltage and square
voltage with a maximum slew rate of 250 V/μs and it was controlled externally
by a digital waveform function generator. The High Slew Rate Square Wave
Generator (HSR-SWG) is an experimental square voltage generator manufactured
during this thesis work. It can be summarized as a two polarity DC voltage
generator connected to a MOSFET switcher supplied by Behlke, Germany. This
instrument is able to produce a square voltage with short rise and fall time, in the
range of hundreds of nanoseconds, up to a frequency of 2 kHz and a maximum
voltage of 15 kVpk. In this configuration, the digital waveform function generator
was used only to regulate the voltage rise during the tests. The HSR-SWG was
employed to produce square voltage with a 12.5 kV/μs slew rate.

44
The last element of the HV control of the setup is a digital oscilloscope, which
was employed in each test in order to double-check the voltage and the waveform
shape.
The optical images of the sample and the tree evolution are acquired by a
CMOS full high definition camera, Nikon 3100. In order to obtain a sufficient
magnification, an unusual configuration is adopted: the camera lens is removed
from its original location, leaving the camera with no objective, and placed at a
certain distance in inverse position. It is the same principle of the reverse lens
photography, commonly used to obtain cheap macro camera lens. In this way, the
focal length became the distance required between the sample and the camera lens,
in order to focus on the specimen, while the distance between the camera and the
lens make possible the regulation of the magnification.
IV-2.2 Test procedure
The experiments carried out and described in this work can be divided into
two main investigations:
Tree inception tests;
Tree growth evaluation and breakdown.
As already explained in the previous chapter, the tree initiation is extremely
relevant for the tree analysis itself. The aim of this first typology of experiments
was to evaluate the influence of different waveforms on the phenomenon.
Moreover, the results obtained by these tests have brought to a model which tries
to explain the physics leading the tree inception in silicone gel (see chapter VI-5).
Tree inception tests were carried out for different frequencies, ranging from 1 Hz
to 1 kHz and voltage waveforms:
Sinusoidal;
Square bipolar 250 V/μs slew rate;
Square bipolar 12.5 kV/μs slew rate;
Square unipolar 250 V/μs slew rate.

45
The experiments were carried out with the objective to evaluate the tree inception
voltage (TIV) for the selected combinations of waveform shape and frequency.
The TIV recorded is equal to the peak voltage of the waveform applied to the
sample when the tree begins and it was measured increasing step by step the
voltage applied up to tree initiation.
These tests took advantage of the self-healing property of the silicone gel to
achieve statistically accurate results. In this material, in fact, multiple TIV
measurements were carried out on the same sample when feasible. The tree
inception, indeed, creates a little bubble inside the gel, close to the needle tip,
which is a damage for the insulating material. Because of the silicone gel self-
healing feature, when the voltage is quickly turned off after the tree detection, the
bubble is usually completely closed. This behavior is likely due both to the natural
inclination of gel to recover is original shape and to the presence of a liquid phase,
which fill the void and merge the surfaces. Thanks to this, it was possible, not only
to obtain a significant volume of data with an acceptable number of samples, but
also to perform a more direct comparison between the different waveforms, using
the same sample. Multiple TIV measurements were obviously not possible in the
elastomer, since its solid nature does not permit self-healing.
The test procedure for the TIV was arranged after preliminary measurements and
strictly followed in all the results reported in the following. In the procedure, the
test starts applying the voltage from a minimum value, which depends on the
needle tip radius, and increasing the voltage value with 200 kVpk-pk step per second
until the inception is observed or until a maximum value of 14 kVpk for the bipolar
waveforms, 20 kVpk-pk for the unipolar waveforms. A maximum value has been
fixed to avoid a possible total breakdown of the sample or an inception with a
wide damage inside the gel. In fact, after each inception, the sample must rest to
recover the damage, but this is possible only if the damage is limited. Again, it is
crucial to turn off the voltage quickly when the tree starts.
The TIV multiple-tests start from the lower frequency to the higher and alternate
the waveforms under investigation during the frequency increment, when two of
them are tested within the same sample. This choice is mainly due because the

46
higher is the frequency, the faster and the greater is the damage in the sample after
the inception and the longer is the time required to recover it. Therefore, the
probability to influence the following TIV measurement is lower starting from the
lower frequency. Anyway, when the damage produced is accidentally too vast to
be recovered by the self-healing properties, the sample must be discarded and
therefore all the measurements previously performed are not taken into account in
the data analysis.
The second evaluation assess the role of frequency and voltage waveform in
the tree generation and growth. The waveforms employed in this analysis are the
same used in the TIV ones. The tree growth test consists in the application of a
fixed voltage to the sample and the acquisition of the optical imagines of the tree
during time. When this fixed voltage is above the TIV, which depends by
waveform and frequency, the tree starts immediately. Otherwise, the tree is
initiated first using a different voltage waveform or frequency with lower TIV.
After the tree is incepted, the waveform selected for investigation is applied to the
sample to measure tree growth. If this procedure is followed, as soon as the tree
is incepted, the waveform is switched to prevent excessive damage coming from
the tree initiation stage. This procedure permits to compare the time employed to
breakdown the sample for the different voltage configuration.
These tests are destructive, thus, each sample can be tested for a single couple
waveform-frequency. Therefore, less combination were investigated compared
with TIV tests.
The maximum duration of a tree growth test is two hours. If the complete
breakdown does not occur within two hours, the test is stopped and the maximum
length reached by the tree branches during the test is recorded.
From the images and the video acquired through these tests, several considerations
can be stated on the electrical treeing degradation and its riskiness under different
operating conditions.
47
V TREE INCEPTION TESTS
V-1 INCEPTION IN SILICONE GEL
The TIV tests (see Chapter IV-2.2) were carried out to assess the correlation
between the voltage waveform and the electrical tree inception. In silicone gel,
these tests were performed with multiple measurements on the same sample as
described in chapter IV-2.2. The data obtained in these tests were elaborated and
are presented in this chapter. The results shown are obtained with a statistical
analysis of measurement carried out on different samples and the 95% confidence
intervals presented in the graphs are based on the t-Student probability
distribution.
The chance to use the same specimen for several measurements permitted to
compare the behavior of two waveforms at different frequencies within the same
sample. In this way, possible errors due to geometrical tolerance in the sample cell
or the needle tip radius can be limited in the result analysis.
To minimize the differences due to the aforementioned geometrical tolerance
between the samples and to highlight the effective trend of the inception voltage
in function of the voltage applied, the data were normalized as follow. The TIV
values recorded for each couple frequency-waveform obtained in a single sample
and measured in kVpk were divided for the average of all the TIV values obtained
considering all the frequency-waveform couples measured within the sample. The

48
resulting values, called TIV normalized, TIVn, are dimensionless. Within each
sample, the TIV trend and TIVn trend are exactly the same, since:
TIVnf,w,s =TIVf,w,s
TIV s (1)
where TIVf,w,s represent a single TIV measurement carried out on sample s, at
frequency f and with the voltage waveform w, TIVnf,w,s the value of TIVn for the
same couple frequency-waveform on the same sample, and TIV s is the average of
the measurements on the sample s. Thus, TIVn and TIV simply differs by a
constant.
The benefit of using TIVn instead of TIV takes place when the values
obtained in different samples are related:
TIVnf,w =1
n∑ TIVnf,w,s
ns=1 (2)
where n is the number of samples. TIV s value is different in each sample but this
is mostly due to the intrinsic differences between the radiuses of the specimen
needles themselves. Indeed, even sub-micrometric differences in the needle tip
can lead to significant differences in the field as shown in Figure V-1. Therefore,
the TIVnf,w values is the most appropriate quantities to highlight the trend of the
tree inception due to frequency and voltage waveform avoiding to take into
account the bias due to the geometrical tolerance among the samples.

49
Figure V-1: Effect of needle tolerance on peak voltage at needle tip
This simple data analysis method is applicable since it does not distort the
nature of the results and their statistic value. In Figure V-2, it is possible to
compare the TIV and TIVn at 10 Hz for sinusoidal and square waveform (250
V/µs slew rate). Both the values can be displayed on Weibull chart with a good
correlation, meaning that the Weibull distribution is appropriate for the
phenomenon analysis. Moreover, the β shape parameters are quite high in the TIV
chart, 5.6 for the square and 9 for the sinusoidal waveform, and they are also
higher in the TIVn one, 9 for the square and 15.2 for the sinusoidal waveform.
This implies that data display a low statistical dispersion.

50
Figure V-2: Weibull chart of the results at 10 Hz of TIV (up) and TIVn (down) for
sinusoidal (black) and square waveform (red)

51
Some tests reached the maximum voltage value employed in the TIV
experiments, 14 kVpk for the double polarity, 20 kVpk for the single polarity,
without any inception. In these cases, the value reported for the data elaboration
was set equal to the maximum voltage applied and the data were censored to
estimate the Weibull scale and shape parameters as well as the confidence
intervals.
Part of the preliminary investigation focused on the evaluation of a possible
memory effect in a sequence of measurements on the same sample and on the rest
time required between two measurements. Indeed, using the same frequency-
waveform couple, inspecting the TIV values in a series of repeated measurements
did not provide evidence of a trend in the data. Thus, the sample did not degrade
appreciably after several measurements and the TIV value recorded was almost
equal to the one obtained in the first test in the fresh sample. Therefore, the
multiple TIV tests were considered reliable to evaluate the inception phenomenon.
A confirmation of this behavior can be found in Table 1, which shows an
average of the results obtained on five samples at 1 Hz. The first measurements,
carried out on fresh samples, had results similar to the ones obtained after the
whole series of TIV tests.
FIRST
MEASUREMENTS
[KVPK]
LAST
MEASUREMENTS
[KVPK]
SINUSOIDAL 13.7 ± 1.9 13.8 ± 1.6
SQUARE 8.2 ± 1.6 8.5 ± 1.4
Table 1: TIV measured on fresh samples (first measurements) or after a series of tests
(last measurements). Average on 5 samples

52
V-1.1 Sinusoidal and Square Comparison
Qualification and diagnostic evaluation in industrial application are often
performed employing sinusoidal waveforms, which are easy to obtain using
transformers and are characterized by low noise levels. However, in practical
applications, the insulating material can be subjected to different electrical stress,
such as in power modules application (see chapter II-2). Therefore, the first
evaluation of this work focused on possible difference between square and
sinusoidal waveform regarding tree inception.
Complete series of multiple TIV measurement testing on each sample the
sinusoidal and square voltage with frequencies ranging from 1 Hz to 1 kHz were
carried out on 5 silicone gel specimens. The tip radius of these first samples was
5 µm. The measurement elaboration is shown in Figure V-3.
Figure V-3: Average TIV for 5μm tip needle samples
The TIV s of each sample ranged from 9.8 kVpk to 12.7 kVpk and the global
average of all the measurements is 10.8 kVpk.
6
8
10
12
14
16
18
1 10 100 1000
TIV
[kV
pk]
Frequency [Hz]
Sine
Square

53
Considering the variability of the phenomenon and the possible sources of
geometrical errors, the variance is not really wide, thus the samples were properly
manufactured. A test issue should be highlighted: some measurements reached 14
kVpk, without the inception and this is the reason of the unbalanced confidence
intervals for the lower frequencies of the sinusoidal waveform.
Despite the reliability of the sample manufacturing process, for a more
accurate analysis of the tree inception, the TIVn trends were calculated and shown
in Figure V-4.
Figure V-4: Average TIVn for 5μm tip needle samples
The trend of the data presented in Figure V-4 does not differ significantly from
the ones in Figure V-3, confirming that TIVn can be used instead of TIV.
Nevertheless, the data in Figure V-4 better underline the inception behavior since
the distance between the two curves at the lower frequencies is wider and the
confidence intervals are significantly lower. This last means that the differences
between the measurements obtained in each sample are reduced considering the
0.5
0.7
0.9
1.1
1.3
1.5
1.7
1 10 100 1000
TIV
n
Frequency [Hz]
Sine
Square

54
TIVn instead of the TIV, thus, the general trend can be considered a good
approximation of the trend in each sample.
TIV behavior in function of the frequency is opposite between sinusoidal and
square voltage: higher frequencies reduce the TIV using sinusoidal waveforms
while using square voltages the TIV increases. In order to confirm this trend, the
comparison between sinusoidal and square voltage waveforms was replicated
employing specimens with 3 µm tip radius needle.
The results obtained are presented in Figure V-5.
Figure V-5: Average TIV for 3μm tip needle samples
In this case, the global average value of the TIV was 7.40 kVpk, while TIV s
ranged from 6.43 kVpk to 8.63 kVpk. In this case also, the TIVn values were
calculated and the resulting data are shown in Figure V-6.
4
6
8
10
12
14
16
1 10 100 1000
TIV
[kV
pk]
Frequency [Hz]
Sine
Square

55
Figure V-6: Average TIVn for 3μm tip needle samples
The results obtained with the smaller needle tips confirm the trend: the TIV
increment for the square voltage is comparable to the one previously reported,
while the decrease in the sinusoidal voltage is even wider. This is partially due to
the limit on the maximum voltage applied, which limited the values obtained in
Figure V-4 for the lower frequencies in sinusoidal voltage. Therefore, these last
results are more accurate, especially for the lower frequencies, in order to better
understand the inception phenomenon.
This peculiar trend with the frequency is quite unexpected. In fact, in solid
materials, the electrical tree inception is related to the number of polarity reversals,
and the TIV decreases significantly with the frequency. This is not true in the
results obtained here for the gel. Therefore, it is reasonable to believe that the
inception in gel should be modeled with some peculiarities, taking into account
its similarity with liquids.
0.6
0.8
1
1.2
1.4
1.6
1.8
2
1 10 100 1000
TIV
n
Frequency [Hz]
Sine
Square

56
V-1.2 High slew rate
In the results shown in the previous paragraph, a remarkable difference exists
between sinusoidal and square waveform TIV for the lower frequencies. Since the
time when the sample is subjected to the maximum voltage is longer for the square
wave, it could be concluded that this time is a key parameter for the phenomenon.
Indeed, testing the specimens with a “cosrect” waveform (see Figure V-7)
rejected this hypothesis. The applied “cosrect” waveform had the rise time similar
to the 1 Hz sinusoidal voltage and the width equal to that of the 1 Hz square
voltage. Under this waveform, tree inception was not observed up to 14 kVpk.
This result is comparable with that of the 1 Hz sinusoidal waveform. Therefore,
the most significant parameter for tree inception in silicone gel should be the
voltage slew rate.
Figure V-7: example of cosrect waveform
In order to assess the influence of a shorter rise time in the tree inception, the
HSR-SWG was employed. The tests were performed on samples with 5 µm needle
tip radius. The data shown in Figure V-8 are obtained averaging 5 samples and
compare the results obtained with the square voltage with 250 V/µs slew rate and
the one with 12.5 kV/µs slew rate produced through the HSR-SWG.
-1
-0.8
-0.6
-0.4
-0.2
0
0.2
0.4
0.6
0.8
1
0 0.5 1 1.5 2
Sine
Cosrect

57
The confidence intervals are not shown since they would overlap in several
points. Moreover, due to the limited amount of samples, the confidence intervals
are too large to appreciate completely the small differences. Nevertheless, the
average values reported with the higher slew rate tests are always lower than the
ones obtained with the 250 V/µs slew rate (except for the 100 Hz values, where
they are barely the same, probably due to an inaccurate value obtained at 250
V/µs, since this is also unaligned with the general trend of the other values).
Therefore, it is possible to conclude that this slew rate increase of about 50 times,
between 250 V/µs and 12.5 kV/µs, decreases the values of TIV of about 13% on
average and, thus, that the slew rate is an important parameter in the inception
phenomenon.
Figure V-8: TIV comparison between square voltage with 250 V/µs and 12.5 kV/µs slew
rate
V-1.3 Unipolar Square Voltage
In many of its electrical applications, silicone gel is subjected to unipolar
square waveforms, e.g. in a large part of the power module components. Thus, the
TIV has been investigated under these conditions. Moreover, the possibility to
6
7
8
9
10
11
12
1 10 100 1000
Ave
rage
TIV
[kV
pk]
Frequency [Hz]
250 kV/ms
12.5 kV/μs

58
analyze a single polarity permits to assess the influence of the polarity itself on
the tree initiation, improving the knowledge of physics behind the inception.
Multiple TIV tests were carried out on 5 samples alternating unipolar
positive and unipolar negative square waveform, with 250 V/µs slew rate. The
results obtained were normalized using the TIVn, following the same method
employed for the comparison between square and sinusoidal waveform and
explained at the beginning of this chapter in Equation V-2. Figure V-9 shows the
data obtained.
Figure V-9: TIV-r for unipolar square waveform
The measurements reached the 20 kVpk-pk in few tests at the higher
frequencies. Consequently, the upper confidence bounds of these frequency
values are larger in these tests. Nevertheless, the TIV seems to increase slowly
with frequency and a clear difference between positive and negative unipolar
waveforms is not recorded. This is an interesting and unexpected result. In fact,
the metal at the needle tip should have a much lower barrier for electron injection,
compared with hole injection (in [84] the barrier for injection in mineral oil of
electrons and holes from a stainless steel tip were estimated as 0.20 eV and 0.41
eV, respectively). Consequently, we expect that the time needed to build up a
0.8
0.85
0.9
0.95
1
1.05
1.1
1.15
1.2
1 10 100 1000
TIV
-r
Frequency [Hz]
Negative
Positive

59
space charge limiting field (SCLF) region is longer for positive polarities. Also, it
was reported that, using lightning impulse, streamer generation in silicone gel is
remarkably affected by the pulse polarity [71], being “fast streamers” incepted
only under high voltage positive pulse (positive and negative polarity both present
only “slow streamers” at lower voltages). Indeed, using lightning impulse, space
charge is not generated prior streamer inception, and the subsequent phenomena
are related to the mobility of positive and negative ions in the gel [28], therefore
the streamer mechanism under pulses should differ from the one in tree inception,
where the space charge injection happens. At any rate, it was reasonable to find a
difference in the tree initiation. Considering the square voltage comparable to
pulses, it is possible to observe that the TIV tests evaluate the lower voltages
capable of making the tree starts, which are interesting for real application, and
thus the initiation phenomena may be lead to the so-called “slow streamers”, since
tree inception and “slow streamer” have similar shapes. Actually, it is more
reasonable to distinguish pulse and square voltage inception. Therefore, in this
last case, the comparable results obtained by positive and negative polarities are
likely due to the very high electric field, which reaches the SCLF in both the
polarities, without remarkable differences at the macroscopic level.
A second significant evaluation can be made comparing the results of the
unipolar tests with the one obtained with the bipolar waveform as shown in Figure
V-10. In this case, it is employed the TIV and not the TIVn, since different
samples were used to obtained the data.

60
Figure V-10: TIV for unipolar and bipolar square voltage
The TIV values for the three waveforms are extremely close. In fact, not only
the global trend is the same, but also the actual values can be considered
equivalent (again, except for the 100 Hz square voltage value), taking into account
the use of different samples and the limit value of 20 kVpk-pk reached in some
measurements for the unipolar voltage at the higher frequencies.
In conclusion, the tree inception mechanism is the same for the unipolar
waveform and for the bipolar waveform, therefore, it is directly connected to the
peak to peak voltage.
V-2 INCEPTION IN ELASTOMER
Electrical treeing in gel has peculiar features, mainly due to the self-healing
property, which force to study the tree development from a new point of view. In
order to support this theory, TIV tests were carried out on elastomer. Since this
thesis focuses on the silicone gel study, the elastomer is used exclusively for
comparison. For this reason, the material employed was made by the same
16
17
18
19
20
21
22
1 10 100 1000
TIV
[kV
pk-
pk]
Frequency [Hz]
Bipolar
Negative
Positive

61
chemical compound employed for the gel, but with a different ratio A/B (as
described in chapter IV-1): in this way the difference reported must depend on
exclusively on the solid nature of the material.
The data shown in Figure V-11 were obtained averaging 3 samples for each
point. In this case, since the material was solid, each sample was employed for a
single measurement, thus it was not feasible to calculate the TIV-r and the
confidence bounds are quite wide.
Figure V-11: TIV in elastomer
The values obtained for the lower frequencies are slightly higher than the one
reached in the silicone gel for the same frequencies, the values at 100 Hz are
almost the same, while at 1 kHz the TIV is lower in solid than in gel. The general
trend is different to the one observed in the gel: the TIV in the solid decreases at
higher frequencies; in the sinusoidal waveform, the TIV decreases with the
frequency as in the gel, but it is sensibly higher in the elastomer than in the gel.
Following these considerations, it is possible to conclude that the higher
frequencies strongly decreases the TIV, in both square and sinusoidal voltage, thus
the inception is likely linked to a frequency related phenomenon. As presented in
7
9
11
13
15
17
1 10 100 1000
TIV
[kV
pk]
Frequency [Hz]
Sine
Square

62
chapter III-2, this assertion is commonly supported by the great part of the theories
and models related to the electrical tree. However, the theories cannot hold for
silicone gel, due to its peculiar dependence on frequency shown above.

63
VI TREE INITIATION MODEL
The results shown in chapter V highlight fundamental differences between
the tree inception in silicone gel and in solid materials. The trend with the
frequency is the most relevant peculiarity: the small increase of the inception
voltage with the frequency, in fact, invalidates the theory of a phenomenon of
energy accumulation, which is the most common assumption for solids (see
chapter III-2.2). Therefore, in this chapter, it will be proposed a model of tree
inception in silicone gel which can be related to a single event instead of a long
energy accumulation. A complete model of this phenomenon should include the
contribution of two features to be evaluated together: the charge injection and
extraction mechanism, and the way that this charge produce the damage resulting
in the formation of an electrical tree.
VI-1 SPACE CHARGE INJECTION
A brief introduction on the electrical tree inception and on the other tree
stages is proposed in chapter III-2.2. As previously explained, the inception is the
first stage of an electrical tree and, contrarily to the other stages, it is still unclear.
Complete studies on electrical treeing have been carried only on solid
material until now. A common opinion on electrical tree inception in AC voltage
is that the phenomenon is related to the charge carrier movement in the inception
area. In particular, the charge injection and the charge recombination are the two
phenomena, which are recognized to be the fundamental of the inception process
[85], [86]. Indeed, the charge recombination may be the cause of Joule heating

64
and thus it can provoke the damage which, following a series of chemical and
mechanical degradation, can create a void [87]. Other researchers concluded that
the space charge may lead to an enhancement of the local electric field, which
exceeds the breakdown threshold [88], [89]. In general, the stress due to the charge
carriers is recognized to be the inception trigger, even if the physics of the
degradation process is still under debate.
The charge injection has been measured both with direct method or by
detecting the light emission [90]–[92]. Baumann et al. have suggested the
existence of a field dependent electron mobility. A consequence of this hypothesis
is that charge injection and extraction occur in the part of the alternating stressing
cycle when the field in the dielectric close to the electrode exceeds the material
dependent threshold. Moreover, they have concluded that the electroluminescence
was not due to the charge recombination. Contrarily, many other authors [50],
[93], [94] have suggested that injection current is due both to electrons and holes,
injected alternately during each half cycle and that electroluminescence is due to
the recombination of electrons and holes inside the material.
The charge injection process must be, anyway, the fundamental process to
be analyzed in order to understand tree inception also in silicone gel. The charge
injection through a potential barrier has been studied for many years and there are
two main approximations for it [37]: Schottky-Richardson and the Fowler-
Nordheim. The first one is commonly the best fitting for a low field approximation
and in this injection model it is assumed that the barrier is due to the electrostatic
attraction between the electrons and the metal, the latter being positively charged
since the electrons have left it. Therefore, the model calculation starts from the
well-known Coulomb attraction law. The Fowler-Nordheim approximation, on
the contrary, is the most reliable for very high voltage application, where peculiar
high field effects, such as tunneling, must be taken into account, using quantum
mechanical model and wave functions. In the last decades, a third approximation
has been successfully proposed for material at room temperature [95], describing
the current density j as a function of the electric field, E:

65
j(E) = αeβE (1)
where the constants α and β depend on temperature and potential barrier
height and are the same for both electrons and holes. The model studied in this
thesis work takes advantage of the simplicity and effectiveness of this last
approximation in order to analyze the behavior of silicone gel.
VI-2 CHARGE INJECTION MODEL
The correlation between charge injection or recombination and
electroluminescence is a useful physical property, which permits to validate the
theories with the experimental results. The starting point of the model discussed
in this thesis is the Alison et al. model [96], which uses a dynamic bipolar charge
recombination model to explain the charge injection and the electroluminescence
behavior experimentally recorded in a pin-plane configuration, similar to the one
employed in the experimental setup used in this work. Since the electrical treeing
initiation must be correlate to the space charge injection, the space charge analysis
is the basis for an inception model.
The geometry of the sample is simplified as a concentric spheres electrodes
arrangement. The inner electrode radius, r0, is set equal to the needle tip radius,
while the ground electrode radius, r2, is equal to the distance between the needle
and the ground electrode. In the model, it is assumed that the space charge is
localized exclusively within a region between the inner electrode radius, r0 and a
length r1. The concentric sphere geometry is a totally acceptable simplification,
since the axial symmetry of the electric field at the needle tip is respected, well
simulating the central zone of the needle-plane electrode, which is the one of
interest. Indeed, even though the real electric field is slightly different to the one
obtained with this geometry (see equation IV-1), it does not influence comparative
and qualitative evaluations between different waveforms, which are the aim of the
model.

66
The calculation is carried out starting from the simplified geometry above
described following a series of assumptions on the physical model:
the space charge region is small compared with the sample,
therefore: r1 << r2;
space charge density, ρ, is constant between r0 and r1, zero outside
this region;
transport and diffusion outside this region are neglected;
the space charge density depends on time t through E0(t), the field at
the injecting electrode.
Considering V(t) the potential close to the injecting electrode, it is possible
to solve the Poisson’s equation obtaining:
Eo(t) =V(t)
L0−
ρ(t)
ε0εr K(r0, r1, r2) (2)
Where ε0 is the permittivity of the free space and εr is the relative permittivity
of silicone gel, which is equal to 2.8. The term L0 is a scale length which depends
on the electrode geometry and K is a function of the electrode geometry and the
space charge region thickness. Both these terms have dimensions of length and,
in the concentric sphere electrode arrangement, are equal to:
L0(r0, r2) = (r0)2(1
r2−
1
r0) (3)
K(r0, r1, r2) = (r1
3
3−
r12r2
2−
r03
3+
r02r2
2) (r0
2 − r0r2)⁄ (4)
The space charge density and the injection current can be easily related
through the continuity equation [97]. Indeed, the charge density flowing across
the surface area of the injecting electrode S into the space charge volume v
increases the space charge density inside this same volume:
∫ j(t)dsS
= ∫ ρv
(t)dv (5)

67
where j is the charge injection current. At this point, differentiating Equation VI-
2 with respect to time and using Equation VI-5 it is possible to obtain:
Eo(t) =V(t)
L0−
kj(t)
ε0εr (6)
where the term k is a dimensionless constant which depends, as K, on the model
geometry and the space charge region thickness. In the electrode arrangement
used:
k =3r0
2
r13−r0
3 (r1
3
3−
r12r2
2−
r03
3+
r02r2
2) (r0
2 − r0r2)⁄ (6)
In order to proceed with the calculation of the space charge injected inside
the material, it is required to choose a charge injection model. In this analysis, as
discussed in chapter VI-1, the injection current is considered to follow Equation
VI-1. The parameters α and β are set equal to the ones employed in [96], thus
1 10-5 Am-2 and 8 10-8 V-1m respectively. The values chosen have been
validated with epoxy resin, thus is likely that they are not the same for silicone
gel. Nevertheless, the influence of their variations is relatively low for the charge
injection and not significant at all for the global behavior.
Since the derivate of the potential at the high voltage electrode surface ��(𝑡)
is known, because it is only due to the voltage waveform applied, the electric field
is easy to be numerically evaluated. Moreover, the space charge injected in the
proximity of the needle tip in the volume v with space charge density ρ is
calculated through the integration over time of:
𝜌(𝑡) = 𝑗(𝑡)𝛥𝑡𝑆
𝑣 (6)
where 𝛥𝑡 is the time step length employed in the calculation.

68
VI-3 CHARGE INJECTION CALCULATION
The numerical calculation followed the model explained in these last pages
(chapter VI-2) and tried to simulate conditions as similar as possible to the ones
used in the TIV measurements. In the calculation carried out, in fact, the inner
electrode radius r0 have been set equal to 5 µm or 3 µm, following the dimensions
of the needle tips employed in the experimental part. The space charge region,
where the space charge density differs from zero, has been set arbitrary to 3 µm
thick, thus r1 was 8 µm or 6 µm depending on r0. The outer radius r2 has been set
to 3 mm, equal to the distance between ground and high voltage.
The results of a calculation with an inner radius of 3 µm under sinusoidal
voltage at 50 Hz are shown in Figure VI-1.
Figure VI-1: E0, j and ρ behavior for 50 Hz sine waveform at 6 kVpk (blue), 9 kVpk
(green) and 12 kVpk (red)

69
The colored curves show the values of the electric field close to the needle
tip, the injection current and the space charge for the different peak voltages
applied.
The results are similar to the ones obtained by Alison et al [96] with high
voltage applied and thus when the SCLF was easily reached. Since the results
obtained with the calculation by Alison were confirmed evaluating experimentally
the electroluminescence in their samples, it is reasonable to consider highly
realistic the behavior obtained also in this calculation.
Confirmed the validity of the calculations performed, the model has been
implemented employing a square voltage with 250 V/µs slew rate. The results are
shown in Figure VI-2. All the other parameters adopted in the calculation, apart
the voltage waveform, are the same than in the results presented in Figure VI-1.
Figure VI-2: E0, j and ρ behavior for 50 Hz square waveform at 6 kVpk (blue), 9 kVpk
(green) and 12 kVpk (red)

70
It is even cleare that, under square voltage, the SCLF is easily reached in this
geometrical configuration: the electric field, indeed, does not show any variation
increasing the peak voltage applied from 6 to 12 kV.
Therefore, it is possible to conclude that the electric field is almost
independent of the voltage applied in this range of operation. This is only partially
true: the only detectable variation of the electric field at the electrode consequent
to an increment of the applied voltage is a change of rise time in the sinusoidal
waveforms. Increasing the applied voltage indeed, these curves show a major
slope of electric field curve during polarity reversals and a maximum field slightly
higher.
The major parameter affecting the injection current is the derivate of the
voltage, ��. In the square waveform, for example, the injection current reaches an
extremely large maximum during rise and fall times, but falls to very low values
when the value of �� is zero. Contrarily in the sinusoidal waveform where �� is
never null (except for two instants in each period), an injection current is present
during all the time and changing even when E(t) saturates. This results in an
injection current that continues throughout most of the ac-cycle but is orders of
magnitude lower than that found in the square waveform.
Direct consequence of the injection current is the space charge stored into
the material. Since the injection current happens in an extremely restricted period
in the square waveform, the space charge is accumulated almost only during the
polarity reversal and it remains constant when the voltage is at the peak values. In
sinusoidal voltage, the space charge roughly lags the voltage by 90 but has a
similar waveform because the injection current continues throughout the whole
period. Despite the substantial difference in the space charge accumulation trend
between sinusoidal and square voltage calculation, the maximum amount of the
space charge accumulated is comparable.
The difference between sinusoidal and square voltage considering the three
physical quantity analyzed is relevant, therefore it could be possible to find a direct

71
connection of one of these to the tree inception. In order to evaluate this
possibility, the values of ρ, E0 and j have been calculated for the two waveforms
at different frequencies, the same of the experimental TIV tests. The trends are
not significantly influenced by the voltage frequency. On the other hand, the actual
values can vary deeply. Since no relevant variations have been observed in the
trends, it becomes essential to assess the maximum values reached. These are
presented in Figure VI-3, Figure VI-4 and Figure VI-5, where the values are
obtained taking into account a peak voltage of 9 kV. The behaviors are quite
interesting. The electric field on the surface of the silicone gel close to the needle
tip reaches the higher value in the square voltage and, under this waveform, it is
constant with the frequency. In sinusoidal voltage, the behavior is sensibly
different: the electric field has a logarithmic increase with the frequency (in Figure
VI-3 the frequency is represented in logarithmic scale), reaching a value close to
the one obtained under square voltage for the higher frequencies.
Figure VI-3: maximum values of E0 as a function of frequency, calculated at 9 kVpk
1.20E+08
1.60E+08
2.00E+08
2.40E+08
1 10 100 1000
Elec
tric
Fie
ld [
V/m
]
Frequency [Hz]
Sine
Square

72
Figure VI-4: maximum values of j as a function of frequency, calculated at 9 kVpk
Figure VI-5: maximum values of ρ as a function of frequency, calculated at 9 kVpk
0.1
1
10
100
1000
10000
1 10 100 1000
Inje
ctio
n c
urr
ent
[A/m
2 ]
Frequency [Hz]
Sine
Square
1.00E+04
1.05E+04
1.10E+04
1.15E+04
1 10 100 1000
Spac
e ch
arge
[C
/m3 ]
Frequency [Hz]
Sine
Square

73
The calculations performed simulating the square voltage show a second
physical quantity not varying: the maximum injection current is, in fact, constant
for each value of frequency. The sinusoidal voltage, instead, shows a growth of
this quantity. The injection current increases proportionally to the applied
frequency, therefore creating an extremely wide difference between lower and
higher frequencies.
Finally, the last physical quantity investigated, the maximum space charge
accumulated, shows a similar trend and similar values for both the waveforms
analyzed. Despite the significant difference between sinusoidal and square voltage
obtained in the other two quantities investigated, both the two space charge trends
show the same slight decrease with the frequencies and a difference between the
two waveforms of around the 3% of the actual value.
The analysis of the three quantities does not provide results able to connect
clearly one of them to the TIV experiments and, therefore, to the tree inception.
The first two, in fact, do not show any variation in function of the frequency
applying the square voltage, which is not compatible with the trend obtained in
the TIV for this waveform. Moreover, the linear increase of the injection current
with the frequency obtained under a sinusoidal voltage is far from the TIV result
trend. On the other hand, the space charge accumulated, showing the same trend
for both the waveforms, contrast with the TIV experimental results trend, where
the two waveforms behave in an opposite way.
VI-4 TREE INCEPTION MODEL
The electrical tree inception under AC voltage is commonly related to the
number of polarity reversals [98]. The Tanaka and Greenwood model [59] (see
equation III-3) theorizes the dependence of the tree initiation with the energy
accumulated in the material, which is proportional to the frequency. Therefore, in
solid dielectrics an increase of the applied voltage frequency leads to a decrease
of the inception voltage or of the time to inception. This energy accumulation is,

74
however, possible only in solids: liquid and gaseous dielectrics have a completely
different behavior in presence of charge injection. Their physical state implicates
a difference mechanism of charge transportation and accumulation.
As already deeply discussed in this work, the silicone gel has a behavior
intermediate between liquids and solids [75]. The experimental results carried out
on silicone gel and presented in chapter V-1 highlight as an increment of the
frequency of the applied voltage does not facilitate systematically the tree
initiation. The TIV, indeed, increases with the frequency under square voltage.
Even looking to the time to inception (that has been not considered a useful
parameter to evaluate the tree in gels), the time required to initiate the tree is longer
in the higher frequencies (if the time spent at each voltage step is constant, the
higher is the TIV recorded, the longer is the test). Moreover, considering the
number of polarity reversal required to initiate the electrical tree, the difference is
even wider between lower and higher frequencies. Therefore, the inception
mechanism in silicone gel must have some peculiarities compared to the
mechanism in solid dielectrics and it should have some relation with its partially
liquid nature.
Due to the last considerations, the inception model formulated in this work
do not take into account an accumulation of damage during the tree initiation in
silicone gel. Following this concept, the equation III-3 by Tanaka and Greenwood
change into a simple threshold equation:
(Gn − Gth) ≥ 0 (7)
thus it is required a single event Gn capable of exceeding the resistance of the
material, which is represented by the threshold value Gth. Therefore, the definition
of the inception mechanism corresponds to the identification of the parameter
influencing Gn and Gth.
In silicone gel, the first detectable appearance of the inception is a bubble with
dimensions in the order of few microns, as shown in Figure VI-6.

75
Figure VI-6: Initial bubble shape of electrical tree in gel
The presence of gas dissolved in a liquid is common and, despite an accurate
degassing process, unavoidable. Moreover, a small amount of dissolved gas may
be produced during the gel cross-linking or through the vaporization of a small
amount of the liquid component fraction of the gel by joule heating from the
injection/extraction currents.
The physics of a bubble inside a fluid and its equilibrium are described by
the Rayleigh-Plesset equation [99], [100], which is an ordinary differential
equation explaining the dynamics of a spherical bubble in a liquid, considering
this last as an infinite medium.
PB(t)−Pl(t)
ρl= R
d2R
dt2 +3
2(
dR
dt)2 +
4νl
R
dR
dt+
2S
ρlR (8)
In Equation V-8, R is the radius of the bubble, PB and Pl are the pressures
respectively within the bubble and in the external fluid, ρl and νl are the density
and the kinematic viscosity of the surrounding fluid and its and S is the surface
tension. In a static case, the last equation can be rewritten as follow:
∆P =2S
R (9)
which is a simplified form of the Young-Laplace equation. It is clear that bubble
formation, growth, and equilibrium are driven by pressure variations.
During inception, the electrical stress and, therefore, injection and extraction
must produce the pressure difference required for the formation of the bubble.

76
Considering again the calculation presented in chapter VI-3, the space charge ρ
produced by charge injection is assumed to be spatially uniform over the space
charge volume, v, hence, ρv is the total charge accumulated close to the high
voltage electrode. The space charge inside the material limits the actual electric
field in the region. From a mechanical point of view, considering the external
surface of the space charge layer as Ssc , it is possible to define a parameter u that
can be regarded as the pressure produced by the region of charged silicone gel
upon the surrounding material when acted on by the electrode field E:
u = Eρv Ssc⁄ (10)
This pressure can be seen as the force per unit of surface carried out by the
layer of material with space charge on the remaining surrounding part of the
dielectric. The u parameter, here defined as field pressure, is particularly relevant
during the polarity inversion, when the space charge, ρ, and the electric field, E,
have opposite sign. In this case, indeed, the force produced by the space charge
layer tends to detach the layer from the surrounding medium, creating a void. In
other words, during polarity reversal, u represents a depression generated by the
interaction between space charge and electric field. This rapid pressure change
occurring in a small area can bring to cavitation phenomena, which may be the
cause of the electrical tree inception.
The assumption of a limited zone of space charge accumulation, used for the
calculation shown in the previous paragraph, may produce unrealistic results in
the determination of the field pressure. The space charge distribution, indeed, is
likely inhomogeneous and transport and diffusion phenomena should occur
outside the space charge layer impeding the formation of a neat discontinuity.
Therefore, the actual values of u obtained from the model previously employed
may not correspond to a real physical value. Nevertheless, their trend is realistic,
since the inhomogeneous distribution inside the layer and the diffusion outside it
effect similarly under every voltage waveform. In a real case, in fact, the pressure
difference required to trigger the supposed cavitation is due to a significant

77
difference between the space charge in two consecutive layers of silicone gel.
Likely, in a pin-plane electrode configuration, it occurs along the pin axis direction
and extremely close to the pin electrode within the gel matrix.
The electrical tree inception mechanism in silicone gel should be connected
to a pressure variation. In order to continue with the term used until now, the
values of Gn and Gth have to be related to the pressure of the dissolved gasses and
to the pressure of the silicone gel. In this dissertation, the Gn is related to the
presence of gasses inside the gel and thus is the parameter not influenced by the
electrical field; furthermore, it can include the other terms, such as the surface
tension and it should be influenced by external pressure, temperature and
moisture. Gth, instead, depends by the pressure inside the silicone gel and thus it
is influenced by the space charge pressure wave.
Gth ∝ uF (11)
The field pressure depends on temperature, T, by the physical properties of
the material since is connected with the parameters controlling the injection
current (here α and β), the applied voltage, V, and its derivative with respect to
time. It is reasonable to envision that Gth should be dependent to the room pressure
of the gel, as well as to the moisture and other parameters that have not been
investigated into this work and may require further investigations. The term F in
equation VI-11 should include all these dependences.
Hence, the inception model proposed here is based on a single event, where
the space charge in the region close to the injecting electrode creates a pressure
wave sufficiently intense to exceed a material threshold value.
VI-5 MODEL VALIDATION
In order to compare the experimental results with the model proposed, some
simplification should be performed.

78
The field pressure is dependent by the applied voltage. Both E and,
particularly, ρ are, indeed dependent to V. Nevertheless, in first approximation, in
a neighborhood of a fixed value of Vpk, u can be normalized becoming proportional
to the applied voltage peak value Vn:
u𝑛V𝑛 = u (12)
and thus, when the voltage used to normalized the field pressure, is equal to the
inception voltage:
Gth ∝ u𝑛V𝑖F (13)
where Vi is the tree inception voltage. With this simplification, it is possible to
compare easily the experimental results obtained in the TIV tests and the inception
model. Following the model, indeed, Gn is equal to Gth in the tree initiation,
therefore:
V𝑖 ∝Gn
u𝑛F (14)
Equation VI-14 enunciates that the inception voltage is inversely
proportional to the field pressure. This is valid considering small variation of the
voltage with respect to the one used in the calculation. In the experimental
condition employed, F is considered a constant, thus, for the clarity of the
subsequent evaluation, it is possible to write the parameter φ:
φ ∝1
u𝑛F (15)
which is proportional to the TIV.
A first comparison between the experimental value of TIVn and the
calculation is proposed in Figure VI-7. In this case, φ is calculated for 9 kVpk
voltage and both the experimental tests and the calculation are performed with a
high-voltage electrode radius of 5 μm. The constant value of F is chosen to adjust

79
the φ values in order to be comparable with the TIVn, since the aim is to compare
the trends of φ and TIVn, but it has been used the same value of F for all the
figures which follow.
Figure VI-7: TIVn results for 5 µm radius tip and φ trends
The small increase with the frequency of φ calculated for the square voltage
waveform is comparable with the one measured in TIVn for the square voltage.
Moreover, comparing the sinusoidal and the square voltage results, the ratio
between the different TIV seems to be approximatively the same as the one
between φ calculated for the square and sinusoidal voltage. In order to confirm
this trends, Figure VI-8 shows the TIVn recorded with the 3 µm radius tip needle
and the values of φ calculated for a voltage applied of 6 kVpk.
0.5
0.7
0.9
1.1
1.3
1.5
1.7
1 10 100 1000
TIV
n
Frequency [Hz]
Sine
Square
ϕ sine
ϕ square

80
Figure VI-8: TIVn results for 3 µm radius tip and φ trends
The correlation between the calculated data and the experimental results is
confirmed and even more evident in this second graph. Both the figures highlight
a small discrepancy between φ and the TIVn at the lower frequency in the
sinusoidal voltage. This is due in part to the higher experimental error occurred
for these values and in part to the intrinsic limit of the model. Indeed, the
calculation is made with a series of approximation, e.g. the last one in the treatise
is to consider Vi proportional to u, which can be not completely true for these low
rise time waveforms or for this applied fields. Nevertheless, the correspondence
between the trends of the calculated field pressure and the TIVn is confirmed also
with different rise times. In Figure V-8, for example, the experimental results
obtained with the square voltage with 250 V/µs and 12.5 kV/µs slew rate are
compared, showing an average decrease of about the 13% of the TIVn increasing
the slew rate. From the comparison between the φ values obtained with the two
slew rates at 9 kVpk, it has been recorded a decrease of about the 18% between
250 V/µs and 12.5 kV/µs, showing that, also in this comparison, the field pressure
is well approximating the trend of the inception voltage. This good agreement
was found even though at the high slew rate the effective time where u is at its
0.6
0.8
1
1.2
1.4
1.6
1.8
2
1 10 100 1000
TIV
n
Frequency [Hz]
Sine
Square
ϕ sine
ϕ square

81
maximum value is extremely short and it may be possible for the direct
proportionality between TIV and φ to be lost. For shorter rise time, the model may
become weak, since the waveform tends to an impulsive shape and the inception
mechanism may be different. In any case, the model seems to be reliable down to
values of rise time considerably short for technical applications.
The mathematical model used for the calculation of the space charge and the
electric field in the region close to the high voltage electrode is not appropriate to
be used with unipolar waveforms. The behavior of the space charge during the
rise and fall time, since the actual voltage is never reversed, can be difficult to be
predicted. The SCLF is easily reached for the range of voltage employed in the
experiments carried out in this work and the measurement results presented in
chapter V-1.3 highlight a strong similitude with the results obtained with the
bipolar square voltage at the same applied peak voltage. Thus, even though further
analysis and a proper injection model should be done for the unipolar case, from
a practical point of view, the estimation of the tree inception voltage in silicone
gel under unipolar square waveform can be performed using the same model used
for the bipolar waveforms, possibly adopting a safety coefficient (close to the
unity, e.g. 0.9) for the application tests.

82
VII ELECTRICAL TREE GROWTH
The electrical tree inception in silicone gel has an unconventional and
unexpected origin if compared with solid dielectrics. Therefore, it is presumable,
that the growth process in the gel and solids are different. Indeed, the well-known
self-healing capability of silicone gel should be active in this phase of the
electrical treeing. Moreover, the propagation of the tree occurs following in part
a bubble-mechanism, unique in the dielectrics, as explained in this chapter.
VII-1 TIME AND LENGTH OF TREES
For solid dielectrics, the geometric parameters employed to analyze the
electrical trees are the length (alternatively, the minimum distance from the
ground electrode), and the fractal number. The time to cross the insulation and the
time to breakdown are also reported usually, noting that breakdown does not ensue
immediately at the time the tree bridges the electrodes: the tree channels should
be enlarged to a minimum diameter, which depends by the dielectric, often at least
5 µm, to allow a full discharge of the insulation [37].
Some peculiarities of silicone gel have emerged from experimental results.
First, due to the self-healing property of the silicone gel and its semi-liquid nature,
the tree shape in not stable. Therefore, an accurate calculation of the fractal
number is often very difficult and inaccurate. Owing to the above limitations, the
fractal number is not calculated here, but it exclusively assessed to compare the
effects associated with different voltage waveforms. Second, the time to cross the
insulation and the time to breakdown coincide in silicone gel: the tree, in fact,

83
instantly short-circuits the insulation when it reaches the ground electrode.
Finally, due to the self-healing property, the maximum length reached by the tree
often does not correspond with the last position reached by the tree, as it is
common in solid dielectrics.
Deterministic chaos was advocated in [101] to explain tree growth.
Consequently, the tree shape was modeled assuming it was a statistical fractal. To
characterize fully phenomena driven by deterministic chaos, an enormous number
of tests would be necessary and, even in that case, the prediction of the time to
breakdown would be largely erratic. Therefore, the experimental analyses
reported from now are aimed exclusively at describing the tree growth and its
underlying mechanisms.
VII-1.1 Time to breakdown (TTB)
The tree growth tests were performed following the procedure explained in
chapter IV-2.2, at a fixed voltage of 10 kVpk. The TTB reported here coincides
with the time to cross the insulation for both the silicone gel and the elastomer.
This choice is not common for the latter, as the TTB in solids is actually larger
than the time to cross the insulation.
The most striking observation comes from evaluating of the trend of the TTB
with the frequency. Table 2 shows the TTB of silicone gel sample under sinusoidal
and square voltage (250 V/µs), while the results obtained for the elastomer are
shown in Table 3. Each cell in the tables corresponds to a different sample tested.

84
1 Hz
SINE
1 Hz
SQUARE
50 Hz
SINE
50 Hz
SQUARE
1 kHz
SINE
1 kHz
SQUARE
- - - 14.25 0.83 0.58
- - - - 3.5 0.72
- - - - 60.5 3.25
Table 2: Time to breakdown in silicone gel samples [min]
50 Hz SINE 50 Hz SQUARE 1 kHz SINE 1kHz SQUARE
- 8 4.59 1.88
- - 5.75 5.25
Table 3: Time to breakdown in elastomer [min]
Even if the sample size is very limited, due to the large variance of TTB
values some comparisons are possible. At 1 kHz, TTB is shorter for the gel
samples compared with the elastomer ones. The inverse occurs for 50 Hz. This
dependence on frequency is ascribable to the gel self-healing property: the time
constant for self-healing is probably too high to prevent the tree growth at 1 kHz.
On the contrary, self-healing phenomena become important at 50 Hz and suppress
tree growth at 1 Hz. Using sinusoidal voltages, the gel strain due to the space
charge injection is too low to sustain the tree, which collapses few seconds after
the inception (the tree was incepted using square voltages owing to their lower
TIV). Under square voltages at 1 Hz, the tree can grow significantly, but the gel
is capable of contrasting its growth, leading to a continuous process of expansion
and contraction of the tree. Indeed, the tree did not reach the ground electrode
during the two hours tests.

85
For solid dielectrics (silicone elastomer can be regarded as a solid dielectric),
the time to breakdown is approximatively proportional to the frequency of the
applied voltage [37]. For silicone gel, the increase of frequency can lead to a
sudden growth of the tree when the amount of damage per unit time exceeds the
self-healing capability. Thus, the dependence on frequency is super-linear and
warns extreme caution.
Considering that power modules are subjected to unipolar voltages, tests
have also been carried out on silicone gel samples under unipolar square voltages
at 20 kVpk-pk. The results are reported in Table 4.
1 Hz
POSITIVE
1 Hz
NEGATIVE
50 Hz
POSITIVE
50 Hz
NEGATIVE
1 kHz
POSITIVE
1 kHz
NEGATIVE
10.1 85 8.1 5.75 0.5 1.1
98 - - 64 1.88 2.92
Table 4: Time to breakdown in silicone gel samples under unipolar waveforms [min]
The data lead to the conclusion that, regarding the velocity of growth,
unipolar voltages are more dangerous compared to the bipolar one. Indeed, one
should bear in mind that the peak voltage of unipolar voltage is twice that of
bipolar voltages (the peak-peak voltage is the same). Since the growth mechanism
is driven by the propagation of discharges inside bubbles or hollow channels, the
higher voltage reached in the unipolar voltage can incept PD of larger magnitudes
(that will create more damage and larger bubbles since they will release larger
amounts of gasses) and may inject larger space charge in the gel. This space
charge would help to (a) elongate the bubbles in the direction of the field, and (b)
create secondary bubbles through the space charge differential strain. This
justifies the higher growth velocity.
Finally, some tests have been performed on silicone gel with 10 kVpk bipolar
square voltages with a 12.5 kV/µs slew rate. The results are shown in Table 5. The

86
increase in the slew rate reduces slightly the TTB. Therefore, the gas ionization
process inside the bubbles and the channels should be stronger compared with the
250 V/µs tests. Contrary to what happens with the unipolar waveforms, the tree
growth is not accelerated appreciably at 1 Hz. The difference between the two
slew rates could be associated with stronger PD associated with larger slew rates.
This phenomenon has been observed in twisted pairs [102] and explained through
the effect of stochastic delay in PD inception.
1 Hz
HSR-SWG
50 Hz
HSR-SWG
1kHz
HSR-SWG
- 8.9 1.1
- 13 4.5
Table 5: Time to breakdown (in [min]) of gel samples under square voltages having slew
rate of 12.5 kV/µs
VII-1.2 Maximum length and fractal number
The analysis of the tree shape is a common a posteriori evaluation on the
damage caused by the electrical treeing. For the silicone gel, due to self-healing
property of the gel, the tree morphology undergoes continue fluctuations.
Therefore, the analysis should be carried out during the tree development, using
pictures obtained at regular times.
In the tests where the tree did not reach the ground electrode, the minimum
distance between the tip of the tree and the ground electrode has been detected
and reported. In Table 6 are shown the results for the silicone gel samples, while
the minimum distance reached by the elastomer are reported in Table 7.

87
1 Hz
SINE
1 Hz
SQUARE
50 Hz
SINE
50 Hz
SQUARE
1 kHz
SINE
1 kHz
SQUARE
2.8 0.6 2.3 0 0 0
2.8 1 2.4 0.45 0 0
2.9 2.4 2.6 0.6 0 0
Table 6: Minimum distance (in [mm]) of the tree from the ground electrode in silicone
gel
The evaluation of the minimum distance from the ground electrode reached
by the tree in silicone gel highlights a significant difference between sinusoidal
and square voltages. At 50 Hz, the square voltage always arrived close to the
ground and, thus, to the breakdown. On the contrary, the sinusoidal waveform
created just a small branch tree localized close to the needle tip. At 1 Hz, the
difference is even more evident: under sinusoidal voltages, the tree collapses after
few seconds, leaving the sample with no significant damage. The square voltage
creates a tree with, often, a single branch but often able to achieve a considerable
length.
For the elastomer, the tree length shows a similar dependence on sinusoidal
and square voltages. As before, tree growth is explained by the PD development.
PDs occur inside the gaseous channels forming the tree when it is initiated. The
intensity of PD is linked to the derivate of the voltage applied, with stronger
discharges when the �� is higher, at least within a certain range of �� values.
Therefore, since tree growth is due to PD activity, it is possible to conclude that
the square voltage should have a higher growth ratio than sinusoidal one.
Moreover, because in sinusoidal waveform the �� depends on the frequency, the
difference between square and sine voltage should be wider at the lower
frequencies and smaller at the higher. This speculation is confirmed by the data.

88
50 Hz SINE 50 Hz SQUARE 1 kHz SINE 1kHz SQUARE
2.1 0 0 0
2.3 1.4 0 0
Table 7: Minimum distance of the tree from the ground electrode in elastomer [mm]
The tree shape of a vented tree is defined by his fractal number and classified
according to the terminology explained in chapter III-2.1.
In this work, the shape of the trees was observed optically during their
growth and some important consideration can be outlined. First, the tree inside
silicone gel is formed through a series of bubbles produced at the tree branch ends,
which leave some channels. Both the channels or the bubbles may reclose due to
the self-healing properties of the material. This propagation through bubbles is a
peculiarity of the electrical tree inside the gel and will be discussed deeply in the
next paragraph.
A second important outcome of the shape evaluation process regards the
fractal number, which is dependent on the frequency. At 1 kHz, the number of
branches produced in the silicone gel is high. Thus, the tree can be classified as a
branched tree with a significant fractal number. The relevant amount of bubbles
produced simultaneously covers almost completely the tree on the 2D optical
plane. The fractal number decreases with the frequency, but at 50 Hz, the tree is
still branched. The aspect changes when the voltage is further decreased. At 1 Hz,
the tree is almost represented by a single main tree with very few branches. Thus
the fractal number is low. A similar trend is observable in the elastomer. The
fractal number at 1 kHz is slightly higher than the one at 50 Hz. However, in both
the cases, the tree appears with more branches than in the silicone gel. The tree
obtained in the tests on elastomer at 1 kHz is close to a bush tree.
Figure VII-1 shows some examples of trees. The images confirm the
discussion carried out just above on the fractal number in the different cases. It is

89
noteworthy the presence of bubbles in the first tree images, referring to the silicone
gel samples. In the case at 1 kHz (lower left), a number of bubbles is extremely
high, highlighting a fast growth phase.
The tree in the elastomer, since it is a solid dielectric, does not show any
bubble. Moreover, the channels appear thinner compared to the ones developed in
silicone gel.
Figure VII-1: Tree shape in gel at 1 Hz square (upper left), 50 Hz square (upper right),
1 kHz sine (lower left) and in elastomer at 1 kHz sine (lower right)

90
VII-2 GROWTH MECHANISM IN GEL
The inception of the electrical tree in silicone gel has been described in this
work through a mechanism that has been postulated also for solid dielectrics, but
less likely to occur on a short time scale due to the high yield strength of solids
[103]. The fluid-like features observed in the gel are the main reasons for this
choice. The clearest evidence of the semi-fluid nature of silicone gel is the
presence and the development of gas bubbles inside it. These bubbles, besides
being the first sign of the tree inception, are leading the tree growth mechanism
too. In silicone gel, indeed, the tree may appear as a filamentary branched
backbone such as occurs in solids but around its periphery there are bubble-shaped
cavities that may collapse and separate from the backbone just as in liquid
streamers, leaving free bubbles inside the gel.
Some investigations were carried out on the bubble motion by other authors
[104] in recent years. They tried to connect the bubble motion with the sinusoidal
voltage applied. In this thesis work, the investigation of the bubble motion and
generation was easier because of the possibility to use a wide range of frequencies
and two different waveforms.
Through the tree inception, a small bubble is placed in contact with the high
voltage electrode. At this point, the gas inside the bubble is directly in contact with
the electrode and the PD may easily start. In this configuration, the PD
development is not far from the one occurring in common electrical treeing inside
solid dielectrics. The discharges are, influenced by the electrical field variation
due to the high voltage source waveform. The molecules of ionized gas in the
bubbles are directed by the electric field and push on the bubble surface leading
to the growth and the movement of the bubbles in a direction almost parallel to
the field. Moreover, the PDs may create an accumulation of space charge on the
bubble surface, that concurs on influencing the bubble movement. The path of the

91
gas followed during this motion from the high voltage to the ground forms the tree
channels.
The channel formed by the gas movement can develop in three manners,
depending on the gas movement and the self-healing property of the gel. It can:
collapse immediately after the bubble passage, thus closing its connection
with the high voltage electrode;
maintain its shape for a certain period until the ionized gas flows
repeatedly inside it and move the bubbles further, collapsing as soon as
this flow is missing;
create a stable channel, similar to the one which may occur in solid
dielectrics.
The first development is similar to what usually occurs in liquids,
furthermore, it has been revealed common when the silicone gel is formed with
an inappropriate ratio between the two base compounds, leading to a more liquid
mixture [77]. In this last case, the bubbles produced during the inception can be
considered streamers. When the correct A:B ratio is employed in the
manufacturing process, the immediate collapsing of the channels may occur both
at the lower frequencies, when the plasma gas flow is not enough to sustain the
channel, or when the bubbles are pushed too far from the generation point, even
in the presence of significant electric stress. This rapid collapse of the channel
brings the gel to behave as a liquid and this can be considered the first very fast
self-healing. When this development occurs, some bubbles of charged gas are
formed and released inside the gel.
The channels can also collapse after several seconds, sometimes minutes,
after their creation. This second case is the most interesting self-healing
phenomenon in the silicone gel since it cannot be associated with a pseudo-liquid
behavior. The channels, in this case, appear well-formed, and the bubbles and the
tree are advancing inside the material. Nevertheless, due to the erratic trend of
PDs and consequently of gas ions, the flow in a channel can drop and cease, even

92
for a short time. In this case, the mechanical properties of the gel lead the material
to return to its original shape, thus decreasing the channel diameter, while the
liquid phase inside the gel may fill the rapidly the fracture left by the channel.
This is what is defined as stage 1 of the self-healing process by Salvatierra et al
[77].
Finally, when the self-healing is not occurring in the channel, this become a
stable branch of the tree. A second self-healing process may occur, accordingly to
[77], called Stage 2, which requires some hours and is possible only if the electric
stress on the silicone gel is completely shut down. This long process should be
carried out by the liquid phase of the gel, which completely fills mechanically
stable channels. This work did not evaluate this particular self-healing
mechanism, since it is relatively useless for real applications, which may run
continuously.
The observation of the tree growth mechanism has been possible only
evaluating the several videos recorded during the tree development inside the
samples. The measurements carried out at 1 Hz singled out some important
features that, with higher frequencies, would have required special acquisition
systems, such as a high-speed camera. An important evidence regards the charge
of the ions forming the gas bubbles, which can be indirectly evaluated thanks to
the bubble motion. In the videos, indeed, the bubbles are moving at the same
frequency of the electrical field, and bubble formation takes place at the needle
tip during polarity inversions, when stronger PDs take place. Firstly, it is clearly
detectable that the bubbles are formed at a frequency approximately twice that of
the applied voltage, thus both during positive than negative phase. Secondly, in
the growth process, some bubbles are attracted to the high voltage electrode, while
other ones are rejected. This is simply due to the charge of the gas ions trapped
inside the bubble since the charge does not change after the separation from the
electrode. Similar conclusion regarding the charge trapped in the bubbles were
obtained by [104], therefore confirming that both positive and negative charge

93
carried are involved in the tree growth. Figure VII-2 refers to two frames captured
on the same sample tested at 1 Hz.
Figure VII-2: Bubbles opposite movement under electric field due to their internal
charge
The two frames are taken at 0.5 seconds, showing the movement of the
bubbles under the electric field. While some bubbles get closer to the electrode,
others are leaving it.
The bubbles observed during the tree growth tests showed a wide range of
shapes. In general, the largest bubbles were reported at 1 Hz, where they are filled
with a major quantity of gas produced by PDs while the voltage is at its maximum
values.. Moreover, the bubble obtained and continuously filled during several PD
events may have not symmetrical shape.
At higher frequency, the bubbles tend to be more symmetric usually with an
ellipsoidal shape or sometimes even spherical. Some examples are shown in
Figure VII-3.

94
Figure VII-3: Bubble development examples.
Upper left: numerous spherical bubbles obtained at 1 kHz sine.
Upper right: numerous oblong bubbles obtained at 1 kHz square.
Lower left: huge bubbles with random shapes obtained at 1 Hz square.
Lower right: few oblong bubbles obtained at 50 Hz square

95
The four main cases are presented in the images:
the tree can growth creating a significant amount of (almost) spherical
bubbles, which partially cover the tree itself from the optical detection;
the PD can create a considerable number of oblong bubbles, and this is
the worst case, usually reaching the maximum tree growth rate;
few big asymmetrical bubbles, common at very low frequencies as
explained before;
few oblong bubbles, which lead the tree growth developing from its
extremities.
It has not been possible to relate clearly the shape or the creation rate of the
bubbles to the waveform and the frequency. In general, the trees with the higher
number of bubbles are the ones obtained at the higher frequencies. Sinusoidal and
square voltages can generate either oblong or spherical bubble.
Considering the charge injected, it appears that the polarity of the ionized
gas filling the bubbles does not influence the bubble shape. Moreover, during the
tree growth at the higher frequencies, the difference between the two possible ion
signs are less evident and influent in the tree development: the time constant of
the bubbles are too long. Thus the bubbles do not oscillate following the electric
field. Instead, they can only collapse thanks to the self-healing or be the starting
point of the successive tree branches.

96
VIII CONCLUSIONS
This work examined the key aspects of the electrical treeing inside silicone
gel. As expected, the gel-like nature of the material required to evaluate the
phenomenon from a new point of view compared to the classical studies on
electrical treeing, which were performed only on solid dielectrics.
The first and most important result of this work is a reliable model to predict
the tree inception under different voltage waveforms. The model relates the
inception to a cavitation process. This cavitation is caused by a depression inside
the silicone gel, in the zone of the material in contact with the high voltage
electrode. The depression ensues the voltage polarity reversal, when layers of
silicone gel, charged with opposite polarity with respect to the electric field, are
attracted to the high voltage electrode with different forces.
Due to the approximations employed, the results of the model should be
considered exclusively to compare different waveforms. Indeed, the model has
been envisaged to assess the dangerousness of different waveform and frequency
and for this purpose is entirely useful. The experimental data confirmed its
validity. The prediction of the inception voltage under determined geometrical
and electrical boundary conditions is extremely relevant: after the inception,
despite the self-healing process, the tree growth and the resulting breakdown are
very likely.
Although the model permits reliable prediction, sufficient for practical
applications, further implementations are necessary: the space charge should not
be considered homogeneous in the material, taking into account transport and

97
diffusion, thus creating a space charge gradient. Moreover, this kind of model
would calculate directly also the field in unipolar waveforms. All these
considerations may require a FEM model and they would increase the complexity
of the calculation drastically. A less complex improvement may take into account
a deeper investigation of other parameters influencing the model proposed in this
thesis. The most interesting one may be the correlation of the F parameter of
Equation VI-11 and thus a study regarding the pressure of silicone gel (or the
mechanical stress, depending if the gel is considered liquid or solid), therefore a
further research may carry out experimental tests with this purpose.
Following the model, the main risk factor can be considered the length of
rise and fall times of the voltage waveform: the shorter the rise time, the higher
the failure probability. A low frequency square voltage results to be the riskiest
condition for an electrical insulating system made by silicone gel, at least for the
electrical tree inception, following the calculations made. Nevertheless, square
voltage waveforms in general and high-frequency sinusoidal waveform should be
considered as a high risk too. Finally, considering the results of this work as
preliminary guidelines for establishing reliability tests, it may be wise to introduce
a safety factor which, taking into account the non-uniformity of the silicone gel
and the randomness of the phenomenon, would decrease the calculated inception
voltage.
The prediction of electrical tree growth is extremely complex in solid
dielectrics. In silicone gel, the complexity is even greater as behaviors typical of
liquid and solid materials are both observable. The PD occurring in the gas filled
bubble-shaped channels are the engine of the tree. The bubbles are an element
feasible only in a liquid and their movements have been characterized in this work.
Particularly, it has been noted that they can be produced and filled both by positive
or negative ions and their shapes has been related to the voltage waveform, at least
in part.

98
The tree develops through the continuous creation and movement of the
bubble-shaped cavities, which may leave behind, depending on the self-curing
capability of the silicone gel, a backbone of stable channels thinner than the
bubbles but almost irreversible. This behavior has analogies with electrical treeing
in solids.
The experimental evidence highlighted the dangerous of the higher
frequencies, where the self-healing process is not able to reduce the damage
produced by the PD in the gas channels. Moreover, it appears that the unipolar
waveforms are worse than bipolar ones at the same level of voltage peak-to-peak.
The aim of the analyses on electrical tree growth on silicone gel is to the
instruments to understand the physics behind this elaborate phenomenon, in order
to achieve a sufficient level of knowledge of the mechanism occurring in this
material in between solid and liquid dielectrics.

99
REFERENCES
[1] W. Noll, Chemistry and Technology of Silicones. Academic Press, 1968.
[2] H. H. Moretto, M. Schulze, and G. Wagner, “Silicones,” in Ullmann’s
Encyclopedia of Industrial Chemistry, 2007, pp. 1–40.
[3] D. D. Dickson, “An overview of silicone dielectric gels,” in
Electrical/Electronics Insulation Conference, EIC, 1975, no. Table 3, pp.
92–95.
[4] T. Ebke, A. Khaddour, and D. Peier, “DEGRADATION OF SILICONE
GEL BY PARTIAL DISCHARGES DUE TO DIFFERENT DEFECTS,”
in Dielectric Materials, Measurements and Applications, 2000. Eighth
International Conference on, 2000, pp. 202–207.
[5] J. Banaszczyk and B. Adamczyk, “Dielectric strength measurements of
silicone gel,” in Progress in Applied Electrical Engineering (PAEE), 2016.
[6] Y. Liu, Power Electronic Packaging. Springer, 2012.
[7] C. Durand, M. Klingler, D. Coutellier, and H. Naceur, “Power Cycling
Reliability of Power Module : A Survey,” IEEE Trans. DEVICE
ANDMATERIALS Reliab., vol. 16, no. 1, pp. 80–97, 2016.
[8] T. A. T. Vu, J. Augé, O. Lesaint, and A. Test, “Low Temperature Partial
Discharge Properties Of Silicone Gels Used To Encapsulate Power
Semiconductors,” in Annual Report - Conference on Electrical Insulation
and Dielectric Phenomena, CEIDP, 2009, pp. 421–424.

100
[9] C. P. Wong, “Thermal-Mechanical Enhanced High- Performance Silicone
Gels and Elastomeric Encapsulants in Microelectronic Packaging,” IEEE
Trans. Compon. Packaging. Manuf. Technol., vol. 18, no. 2, pp. 270–273,
1995.
[10] M. Ciappa, “Selected failure mechanisms of modern power modules,” vol.
42, pp. 653–667, 2002.
[11] M. Berth, “Partial Discharge Behaviour of Power Electronic Packaging
Insulation,” Int. Symp. Electr. Insul. Mater., pp. 565–568, 1998.
[12] T. Maeda, K. Haga, and T. Maeda, “Creepage Breakdown Characteristics
of Printed Wiring Board in Silicone Gel,” in Proceedings of Conference
on Electrical Insulation and Dielectric Phenomena - CEIDP, 1996, pp.
734–737.
[13] J. Fabian, S. Hartmann, and A. Hamidi, “Analysis of Insulation Failure
Modes in High Power IGBT Modules,” pp. 799–805, 2005.
[14] G. Mitic and G. Lefranc, “Localization of Electrical-Insulation- and
Partial-Discharge Failures of IGBT Modules,” IEEE Trans. Ind. Appl., vol.
38, no. 1, pp. 175–180, 2002.
[15] D. Frey, J. L. Schanen, J. L. Augé, and O. Lesaint, “Electric field
investigation in high voltage power modules using finite element
simulations and partial discharge measurements,” pp. 1000–1005, 2003.
[16] H. HOURDEQUIN, L. LAUDEBAT, M.-L. LOCATELLI, and P. Bidan,
“Design of Packaging Structures for High Voltage Power Electronics
Devices: Electric Field Stress on Insulation,” in IEEE International
Conference on Dielectrics, 2016.
[17] G. Lefranc, T. Licht, H. J. Schultz, R. Beinet, and G. Mitic, “Reliability
testing of high-power multi-chip IGBT modules,” vol. 40, pp. 1659–1663,
2000.

101
[18] J. L. Augé, O. Lesaint, and A. T. V. U. Thi, “Partial Discharges in Ceramic
Substrates Embedded in Liquids and Gels,” IEEE Trans. Dielectr. Electr.
Insul., vol. 20, no. 1, pp. 262–274, 2013.
[19] C. Duchesne, E. Dutarde, and P. Electronics, “PB25 Stress grading in
integrated power modules,” no. Li, pp. 347–351, 2008.
[20] M. Locatelli, R. Khazaka, S. Diaham, C. Pham, M. Bechara, S.
Dinculescu, and P. Bidan, “Evaluation of Encapsulation Materials for
High-Temperature Power Device Packaging,” IEEE Trans. power
Electron., vol. 29, no. 5, pp. 2281–2288, 2014.
[21] C. Neeb, L. Boettcher, M. Conrad, and R. I. K. W. D. E. Doncker,
“Innovative and Reliable Power Modules,” IEEE Ind. Electron. Mag., no.
September, pp. 6–16, 2014.
[22] T. Seldrum, E. Vanlathem, V. Delsuc, and H. Enami, “New silicone gel
enabling high temperature stability for next generation of power modules,”
in International Exhibition and Conference for Power Electronics,
Intelligent Motion, Renewable Energy and Energy Management, 2016, pp.
1017–1020.
[23] H. G. Yaworski, G. Craig, and D. Roberts, “The Use of Silicone Gels for
Jointing Power Cables,” in Transmission and Distribution Conference,
1996, pp. 396–401.
[24] H. G. Yaworski and R. Bukovnik, “Silicone Gel Technology For Power
Cable Accessories,” in Transmission and Distribution Conference and
Exposition, 2001 IEEE/PES, 2001, pp. 837–842.
[25] R. R. Bukovnik and P. R. Carey, “Advances in Silicone Gel Technology
for Cable Accessories,” in IEEE/PES Transmission and Distribution
Conference and Exhibition, 2006, pp. 1–4.
[26] “IEC 60270:2000, High-voltage test techniques - Partial discharge

102
measurements.” 2000.
[27] W. Hauschild and E. Lemke, High-Voltage Test and Measuring
Techniques. 2014.
[28] J. C. Devins, “THE PHYSICS OF PARTIAL DISCHARGES IN SOLID
DIELECTRICS,” IEEE Trans. Electr. Insul., vol. EI-19, no. 5, pp. 475–
495, 1984.
[29] A. Pedersen, “On the Electrical Breakdown of Gaseous Dielectrics An
Engineering Approach,” IEEE Trans. Electr. Insul., vol. 24, no. 5, pp.
721–738, 1989.
[30] P. H. F. Morshuis, “Partial Discharge Mechanisms. Mechanism Leading
to Breakdown, Analyzed by Fast Electrical and Optical Measurements,”
Delft, 1993.
[31] A. Cavallini, G. C. Montanari, F. Puletti, and A. Contin, “A New
Methodology for the Identification of PD in Electrical Apparatus :
Properties and Applications,” IEEE Trans. Dielectr. Electr. Insul., vol. 12,
no. 2, pp. 203–215, 2005.
[32] A. Contin, A. Cavallini, G. C. Montanari, G. Pasini, and F. Puletti, “Digital
Detection and Fuzzy Classification of Partial Discharge Signals,” IEEE
Trans. Electr. Insul., vol. 9, no. 3, pp. 335–348, 2002.
[33] E. H. Rayner, “HIGH-VOLTAGE TESTS AND ENERGY LOSSES IN
INSULATING MATERIALS,” J. Inst. Electr. Eng., vol. 49, no. 214, pp.
3–71, 1912.
[34] D. M. Robinson, “THE BREAKDOWN MECHANISM OF
IMPREGNATED PAPER CABLES,” J. Inst. Electr. Eng., vol. 77, no.
463, pp. 90–103, 1935.
[35] J. H. Lawson and W. J. Vahlstorm, “INVESTIGATION OF
INSULATION DETERIORATION IN 15 KV AND 22 KV

103
POLYETHYLENE CABLES REMOVED FROM SERVICE - PART II,”
IEEE Trans. Power Appar. Syst., vol. PAS-92, no. 2, pp. 824–835, 1972.
[36] G. Bahder, C. Katz, J. H. Lawson, and W. Vahlstrom, “ELECTRICAL
AND ELECTRO-CHEMICAL TREEING EFFECT IN
POLYETHYLENE AND CROSSLINKED POLYETHYLENE
CABLES,” IEEE Trans. Power Appar. Syst., vol. PAS-93, no. 3, pp. 977–
989, 1973.
[37] L. A. Dissado and C. Fothergill, Electrical Degradation and Breakdown
in Polymers Electrical Degradation and Breakdown in Polymers. The
Redwood Press, 1992.
[38] L. A. Dissado, S. J. Dodd, J. V Champion, P. I. Williams, and J. M. Alison,
“Propagation of electrical tree structures in solid polymeric insulation,”
IEEE Trans. Dielectr. Electr. Insul., vol. 4, no. 3, pp. 259–279, 1997.
[39] L. Niemeyer, L. Pietronero, and H. J. Wiesmann, “Fractal dimension of
dielectric breakdown,” Phys. Rev. Lett., vol. 52, pp. 1033–1036, 1984.
[40] H. J. Wiesmann and H. R. Zeller, “A fractal model of dielectric breakdown
and prebreakdown in solid dielectrics,” J. Appl. Phys., vol. 60, pp. 1770–
1773, 1986.
[41] S. Kobayashi, S. Maruyama, H. Kawai, H. Uehara, and K. Kudo, “Fractal
analysis of 3D reconstructed patterns of real electrical tree,” Conduct.
Break. Solid Dielectr. 1995. ICSD’95., Proc. 1995 IEEE 5th Int. Conf., pp.
299–303, 1995.
[42] L. A. Dissado, “Understanding electrical trees in solids: From experiment
to theory,” IEEE Trans. Dielectr. Electr. Insul., vol. 9, no. 4, pp. 483–497,
2002.
[43] X. Zheng and G. Chen, “Propagation Mechanism of Electrical Tree in
XLPE Cable Insulation by investigating a Double Electrical Tree

104
Structure,” IEEE Trans. Dielectr. Electr. Insul., vol. 15, no. 3, pp. 800–
807, 2008.
[44] S. Bahadoorsingh and S. M. Rowland, “The role of power quality in
electrical treeing of epoxy resin,” 2007 Annu. Rep. - Conf. Electr. Insul.
Dielectr. Phenom., pp. 221–224, 2007.
[45] P. I. Williams and L. A. Dissado, “Physical Origin for differences in
Electrical Tree Structures,” in Annual Report - Conference on Electrical
Insulation and Dielectric Phenomena, CEIDP, 1994, pp. 418–423.
[46] F. Guastavino, G. Coletti, A. Dardano, A. Ratto, and E. Torello, “Life
prediction of XLPE subjected to distorted voltages in presence of bush-
like electrical treeing,” in Electrical Insulation and Dielectric Phenomena,
2006 IEEE Conference on, 2006, pp. 724–727.
[47] R. Bozzo, G. Coletti, and F. Guastavino, “Studies About the Electrical
Treeing Growth Based on the Evolution of the PD Patterns,” in IEEE
International Symposium on Electrical Insulation, 1998, pp. 415–419.
[48] F. Noto and N. Yoshimura, “Voltage and Frequency Dependence of Tree
Growth in Polyethylene,” in Annual Report - Conference on Electrical
Insulation and Dielectric Phenomena, CEIDP, 1974, pp. 207–217.
[49] M. Ieda, “Dielectric breakdown process,” IEEE Trans. Electr. Insul., vol.
EI-15, no. 3, pp. 206–224, 1980.
[50] N. Shimizu, H. Katsukawa, M. Miyauchi, M. Kosaki, and K. Horii, “THE
SPACE CHARGE BEHAVIOR AND LUMINESCENCE PHENOMENA
IN POLYMERS AT 77 K,” IEEE Trans. Electr. Insul., vol. EI-14, no. 5,
pp. 256–263, 1979.
[51] K. Nakanishi, S. Hirabayashi, and Y. Inuishi, “Phenomena and
mechanisms of Tree Inception in Epoxy Resins,” IEEE Trans. Electr.
Insul., vol. EI-14, no. 6, pp. 306–314, 1979.

105
[52] J. V Champion, S. J. Dodd, and G. C. Stevens, “Quantitative Measurement
of Light Emission During the Early Stages of Electrical Breakdown in
Epoxy and Unsaturated Polyester Resins,” J. Appl. Phys., vol. 26, pp. 819–
828, 1993.
[53] C. Laurent, “OPTICAL PRE-BREAKDOWN WARNINGS IN
INSULATING POLYMERS,” in IEEE International Conference on
Conduction and Breakdwon in Solid Dielectrics, 1998, pp. 1–12.
[54] S. J. Dodd, J. V Champion, and G. C. Stevens, “QUANTITATIVE LIGHT
EMISSION AS A PROBE OF ELECTRICAL TREEING PROCESSES,”
in IEEE International Conference on Conduction and Breakdwon in Solid
Dielectrics, 1992, pp. 308–312.
[55] C. Laurent, C. Mayoux, and S. Noel, “SPACE CHARGE AND
ELECTROLUMINESCENCE IN POLYETHYLENE,” Electr. Insul.
1984 IEEE Int. Conf., pp. 13–16, 1984.
[56] S. S. Bamji, A. T. Bulinski, and R. J. Densley, “THE ROLE OF
POLYMER INTERFACE DURING TREE INITIATION IN LDPE,”
IEEE Trans. Dielectr. Electr. Insul., vol. EI-21, no. 4, pp. 639–644, 1986.
[57] N. Shimizu and C. Laurent, “Electrical Tree Initiation,” IEEE Trans.
Electr. Insul., vol. 5, no. 5, pp. 651–659, 1998.
[58] N. Shimizu, T. Takahashi, and S. Iemura, “INITIATION MECHANISM
OF ELECTRICAL TREE UNDER ALTERNATING STRESS -
ELECTRON IMPACT OR UV PHOTO-DEGRADATION?,” in
International Conference on Solid Dielectrics, 2001, pp. 423–426.
[59] T. Tanaka and A. Greenwood, “EFFECTS OF CHARGE INJECTION
AND EXTRACTION ON TREE INITIATION IN POLYETHYLENE,”
IEEE Trans. Power Appar. Syst., vol. PAS-97, no. 5, pp. 1749–1759, 1978.
[60] F. Guastavino and B. Cerutti, “Tree Growth Monitoring by Means of

106
Digital Partial Discharge Measurements,” IEEE Trans. Dielectr. Electr.
Insul., vol. 10, no. 1, pp. 65–72, 2003.
[61] R. Bozzo, C. Gemme, F. Guastavino, M. Cacciari, A. Contin, and G. C.
Montanari, “Aging Diagnosis of Insulation Systems by PD Measurements
Extraction of Partial Discharge Features in Electrical Treeing,” IEEE
Trans. Dielectr. Electr. Insul., vol. 5, no. 1, pp. 118–124, 1998.
[62] R. Bozzo, A. Contin, C. Gemme, F. Guastavino, and G. C. Montanari, “An
Analysis Of The Probability Distributions of Charge In Electrical Trees
Generated By Needle Tests,” in Annual Report - Conference on Electrical
Insulation and Dielectric Phenomena, CEIDP, 1996, pp. 770–774.
[63] J. V Champion and S. J. Dodd, “An approach to the modelling of partial
discharges in electrical trees,” J. Phys. D. Appl. Phys., vol. 31, no. 18, pp.
2305–2314, 1998.
[64] J. V Champion, S. J. Dodd, and J. M. Alison, “The correlation between the
partial discharge behaviour and the spatial and temporal development of
electrical trees grown in an epoxy resin,” J. Phys. D. Appl. Phys., vol. 29,
no. 10, pp. 2689–2695, 1996.
[65] R. Bozzo, A. Contin, F. Guastavino, C. Gemme, and G. C. Montanari,
“STOCHASTIC ANALYSIS OF PARTIAL DISCHARGE PATTERNS
DERIVING FROM ELECTRICAL TREE MEASUREMENTS,” in
International Conference on Conduction and Breakdown in Solid
Dielectrics, 1995, pp. 381–385.
[66] L. Hui, R. Smith, J. K. Nelson, and L. S. Schadler, “Electrochemical
treeing in XLPE/silica nanocomposites,” Electr. Insul. Dielectr.
Phenomena, 2009. CEIDP ’09. IEEE Conf., pp. 511–514, 2009.
[67] M. G. Danikas and T. Tanaka, “Nanocomposites - A review of electrical
treeing and breakdown,” IEEE Electr. Insul. Mag., vol. 25, no. 4, pp. 19–
25, 2009.

107
[68] F. Guastavino, A. Dardano, E. Torello, M. Hoyos, J. M. Gomez-Elvira,
and P. Tiemblo, “Electrical treeing inception and growth in LDPE
nanocomposites,” Annu. Rep. - Conf. Electr. Insul. Dielectr. Phenomena,
CEIDP, pp. 240–243, 2007.
[69] M. F. Fréchette, A. Vijh, M. L. Trudeau, D. Fabiani, L. Utracki, S.
Gubanski, C. Reed, A. Sami, E. David, J. Kindersberger, A. Krivda, P.
Morshuis, T. Andritsch, R. Kochetov, J. Fothergill, S. Dodd, A. S.
Vaughan, J. Castellon, and F. Guastavino, “A ‘Universal’ Panacea for
Solving All Electrical Insulation Problems ?,” in International Conference
on Solid Dielectrics, 2010, pp. 1–3.
[70] T. M. Do, J. L. Augé, and O. Lesaint, “A study of parameters influencing
streamer inception in silicone gel,” IEEE Trans. Dielectr. Electr. Insul.,
vol. 16, no. 3, pp. 893–899, 2009.
[71] T. M. Do, O. Lesaint, and J. L. Augé, “Streamers and partial discharge
mechanisms in silicone gel under impulse and AC voltages,” IEEE Trans.
Dielectr. Electr. Insul., vol. 15, no. 6, pp. 1526–1534, 2008.
[72] O. Lesaint and P. Gournay, “On the gaseous nature of positive filamentary
streamers in hydrocarbon liquids. I: Influence of the hydrostatic pressure
on the propagation,” J. Phys. D. Appl. Phys., vol. 27, no. 10, 1994.
[73] P. Gournay and O. Lesaint, “On the gaseous nature of positive filamentary
streamers in hydrocarbon liquids. II: Propagation, growth and collapse of
gaseous filaments in pentane,” J. Phys. D. Appl. Phys., vol. 27, no. 10,
1994.
[74] M. Fujii, R. Ueda, H.-G. Jeon, and H. Ihori, “Vibration and Development
of Pearl-chain-type Tree in Silicone Gel under AC Voltage *,” in
Conference proceedings of ISEIM, 2014, pp. 319–322.
[75] S. J. Dodd, L. M. Salvatierra, L. A. Dissado, and E. Mola, “Electrical Trees
in Silicone Gel : A Combination of Liquid and Solid Behaviour Patterns,”

108
2013 Annu. Rep. Conf. Electr. Insul. Dielectr. Phenom., no. 2, pp. 1018–
1021, 2013.
[76] L. I. Kovalevski and L. M. Salvatierra, “Effect of the field frequency
during treeing tests in silicone polymers with different degree of
crosslinking,” 2015 Annu. Rep. Conf. Electr. Insul. Dielectr. Phenom., pp.
613–616, 2015.
[77] L. M. Salvatierra, L. I. Kovalevski, P. L. D. Quiña, I. M. Irurzun, and E.
E. Mola, “Self-healing during Electrical Treeing : A Feature of the Two-
phase Liquid-solid Nature of Silicone Gels,” IEEE Trans. Dielectr. Electr.
Insul., vol. 23, no. 2, pp. 757–767, 2016.
[78] A. C. Ashcraft, R. M. Eichhorn, and R. G. Shaw, “Laboratory Studies of
Treeing in Solid Dielectrics and Voltage Stabilization in Polyethylene,” in
IEEE International Conference on Electrical Insulationon, 1976, pp. 213–
218.
[79] E. Details, J. P. Crine, G. C. Stone, M. Kurtz, R. G. van Heeswijk, S.
Bahadoorsingh, S. M. Rowland, L. Hui, R. Smith, J. K. Nelson, L. S.
Schadler, S. Sambeharry, C. Sharma, Xiangrong Chen, A. R. Mantsch,
Libin Hu, S. Gubanski, J. Blennow, C.-O. Olsson, N. H. Aziz, V. M.
Catterson, M. D. Judd, B. X. Du, T. Han, J. G. Su, L. I. Kovalevski, L. M.
Salvatierra, J. V Champion, S. J. Dodd, J. M. Alison, G. Chen, C. H. Tham,
W. Ningyan, I. Cotton, J. Robertson, S. Follmann, K. Evans, D.
Newcombe, N. Wang, M. G. Danikas, T. Tanaka, L. A. Dissado, P. I.
Williams, T. M. Do, O. Lesaint, J. L. Augé, E. Mola, A. S. Preparation, I.
Iddrissu, G. Mitic, G. Lefianc, G. Salge, and N. Chalashkanov,
“Investigating the impact of harmonics on the breakdown of epoxy resin
through electrical tree growth,” IEEE Trans. Dielectr. Electr. Insul., vol.
16, no. 4, pp. 511–514, 2009.
[80] E. Jarvid, A. Johansson, J. Blennow, M. Andersson, and S. Gubanski,
“Evaluation of the performance of several object types for electrical

109
treeing experiments,” IEEE Trans. Dielectr. Electr. Insul., vol. 20, no. 5,
pp. 1712–1719, 2013.
[81] R. Vogelsang, T. Weiers, and K. Fröhlich, “Electrical Breakdown in High-
Voltage Winding Insulations of Different,” vol. 22, no. 3, pp. 5–12, 2006.
[82] N. Hozumi, M. Ishida, and H. Fukagawa, “The Influence of Morphology
on Electrical Tree Initiation in Polyethylene under ac,” IEEE Trans. Electr.
Insul., vol. 25, no. 4, pp. 707–714, 1990.
[83] J. H. Mason, “Breakdown of solid dielectrics in divergent fields,” Proc.
IEE - Part C Monogr., vol. 102, no. 2, pp. 254–263, 1955.
[84] M. Butcher, A. A. Neuber, M. D. Cevallos, J. C. Dickens, and H.
Krompholz, “Conduction and Breakdown Mechanisms in Transformer
Oil,” IEEE Trans. Plasma Sci., vol. 34, no. 2, pp. 467–475, 2006.
[85] G. Krause, S. Gottlich, K. Moller, and D. Meurer, “Stress s.,” in
Proceedings of International conference on Conduction and Breakdown
in Solid Dielectrics, 1989, pp. 560–564.
[86] H. Sakamoto and K. Yahagi, “Electrical Capacitance of Polyethylene
under Application of High DC Electric Field,” Jpn. J. Appl. Phys., vol. 19,
no. 2, 1980.
[87] Y. Shibuya, S. Zoledziowski, and J. H. Calderwood, “Light emission and
deterioration in epoxy resin subjected to power frequency electric fields,”
Proc. Inst. Electr. Eng., vol. 125, no. 4, pp. 352–354, 1978.
[88] A. C. Ashcraft, “Water treeing in polymeric dielectrics,” in World
Electrotechnical Congress, 1977.
[89] A. C. Ashcraft, “Factors influencing treeing identified,” Electr. world,
1977.
[90] T. Baumann, P. Pfluger, F. Stucki, and H. R. Zeller, “CHARGE

110
INJECTION AND DISTRIBUTION IN POLYMERIC INSULATION
SYSTEMS,” in Annual Report - Conference on Electrical Insulation and
Dielectric Phenomena, CEIDP, 1986, pp. 358–364.
[91] T. Baumann, B. Fruth, F. Stucki, and H. R. Zeller, “Field-enhancing
Defects in Polymeric Insulators Causing Dielectric Aging,” IEEE Trans.
Electr. Insul., vol. 24, no. 6, pp. 1071–1076, 1989.
[92] T. Hibma and H. R. Zeller, “Direct measurement of space‐charge injection
from a needle electrode into dielectrics,” J. Appl. Phys., vol. 59, no. 5,
1986.
[93] C. Laurent, C. Mayoux, and S. Noel, “Mechanisms of electroluminescence
during aging of polyethylene,” J. Appl. Phys., vol. 52, no. 11, 1985.
[94] S. S. Bamji, A. T. Bulinski, and R. J. Densley, “Evidence of near‐
ultraviolet emission during electrical‐tree initiation in polyethylene,” J.
Appl. Phys., vol. 61, no. 2, 1986.
[95] R. W. Hare, “Modelling space charge in solid dielectrics,” University of
Bristol, 1993.
[96] J. M. Alison, J. V Champion, S. J. Dodd, and G. C. Stevens, “Dynamic
bipolar charge recombination model for electroluminescence in polymer
based insulation during electrical tree initiation,” J. Phys. D. Appl. Phys.,
vol. 28, pp. 1693–1701, 1995.
[97] J. Vanderlinede, Classical Electromagnetic Theory, 2nd ed. Kluwer
Academic Publishers, 2004.
[98] L. A. Dissado and R. M. Hill, “The Statistics of Electrical Tree Inception,”
IEEE Trans. Electr. Insul., vol. 25, no. 4, pp. 660–666, 1990.
[99] L. Rayleigh, “On the pressure developed in a liquid during the collapse of
a spherical cavity,” London, Edinburgh, Dublin Philos. Mag. J. Sci., pp.
94–98, 1917.

111
[100] M. S. Plesset, “The dynamics of cavitation bubbles,” J. Appl. Mech., vol.
16, pp. 277–282, 1949.
[101] S. J. Dodd, L. A. Dissado, J. V Champion, and J. M. Alison, “Evidence for
deterministic chaos as the origin of electrical tree breakdown structures in
polymeric insulation,” Phys. Rev. B, vol. 52, no. 24, pp. 985–988, 1995.
[102] P. Wang, A. Cavallini, G. C. Montanari, and G. Wu, “Effect of Rise Time
on PD Pulse Features under Repetitive Square Wave Voltages,” IEEE
Trans. Dielectr. Electr. Insul., vol. 20, no. 1, pp. 245–254, 2013.
[103] S. Boggs, “Very High Field Phenomena in Dielectrics,” IEEE Trans.
Dielectr. Electr. Insul., vol. 12, no. 5, pp. 929–938, 2005.
[104] M. Sato, A. Kumada, Y. Hayase, K. Yamashiro, Y. Hayase, and T. Takano,
“On the nature of surface discharges in silicone-gel : Prebreakdown
discharges in cavities,” in Annual Report - Conference on Electrical
Insulation and Dielectric Phenomena, CEIDP, 2014, no. 1, pp. 19–22.
Top Related