


Languages
Pages
Legal

Reprinted from Applied Optics, Vol. 19, page 1921, June 15, 1980 Copyright © 1980 by the Optical Society of America and reprinted by permission of the copyright owner.
Infrared reflectance spectroscopy and thermographic investigations of the Shroud of Turin
J . S. Accetta and J. Stephen Baumgart
In this paper we present the results of t he IR investigations of the controversial Turin Shroud. Reflectance spectroscopy in the 3- 5- and 8-14-µm bancls was attempted in situ using commercial equipment with mo<l· crate success. Spectral comparison~ are made between laboratory reflectance dul.u mid selected Shroud fea tures. Infrared therruographic imaging was accomplished with an enhauced contrast technique using external illumination. Due to the spectral similarities of most features observed, we show that the results are inconclusive. 'T'he TR imagery yielded results that are consistent with expectations with no anomalies observe<l .
I. Background
Rarely in the course of routine nondestructive testing does the opportunity arise to apply established techniques to archeological relics, especially one as controversial as the Tnrin Shroud. This ancient piece of linen (authenticated to ""1350 A.D.) bears the frontal and dorsal images of a man replete with the classical marks of crucifixion-1 The medium of presentation appears to be nearly singular with very few parallels in the history of renaissance art2 and has recently undergone a series of nondestructive tests to determine the physical characteristics of the image.
Although the Shroud has been examined on several occasions in the past, a comprehensive data base upon which to do hypothesis testing does not exist. That such a data base might be established became the objective of a number of interested scientis ts from the international community several years ago and came to fruition in 5 days of testing in Turin , Italy in October 1978- It was not clear a priori which specific tedmiques might be most useful in decoding the Shroud. Accordingly, the philosophy to employ as many nondestructive tests as possible was adopted early. Two of the suggested techniques involved the IR spectral re-
J. S. Accetta is with Lockheed Missiles & Space Company, Inc., Albuquerque, New Mexico 87111, and J. S. Raumgart is with EG&G Corporation, Los Alamos, ew Mexico 87545.
Received 31 March 1980. 0003-6935/80/121921-09$00.50/0. © 1980 Optical Society of America.
flectance of several selected features of cloth and In wide-field imagery. T he rationale was to attempt to glean some information on the chemistry of selected features from spectroscopic data. Jn addition the imagery might yield details not apparent in the visible region of the spectrum.
Regardless of the religious implications of the image, the physical characteristics of the cloth are subject to classical experimental techniques. The effort provided a rather challenging situation in the context of using readily available equipment, wi th 1imited buduets on a single opportunity basis.
0
'
This paper is divided into two parts_ The firs t (Sec. II) discusses the technique and results of the IR reflectance spectroscopy effort, and the other part (Sec. HI) is concerned with the results of the imaging attempts in the 8-14- and 3- 5-µm bands.
II. Infrared Reflectance Spectroscopy
A. Introduction
Consistent with the requirement of using readily available equipment, the IR bands most amenable to investigation are the 3- 5- and 8-14-µm regions where readily available detectors and a tmo1:1pheric windows conven iently coexist. Furthermore, simplicity demanded that the single-beam mode of spectroscopy be employed. This configuration consisted of alternately measuring the sample and a reflectance standard in identical geometries. In spite of the notorious difficul t ies associated with this mode due to short term v~riations in atmospheric absorption,3 circumstances dictated no other alternative.
15 June 1980 /Vol. 19, No. 12 / APPLIED OPTICS 1921

B. Theory of the Measurement
Consider a generalized radiometer with collecting optics and a wavelength selection device. An externally illuminated sample with spectral reflectance p(A) is within the FOV. The output voltage Vs from the radiometer as a function of wavelength can be described as a convolution integral:
V,(>.) = K fo ~ p,(A')L(A')S(>.' - >.)dA.1, (1)
where J( = constant of proportionality describing the geometry;
L(A) = spectral radiance of the source; Ps (>,) = spectra] reflectivity of the sample; and S(X) = spectral response of the rad iometer.
The voltage output at each X is an integral over the spectral response function S (A) of the filter element. If S(A) is sufficiently narrow, i.e., approaches a spectrally weighted o function, R(A.1)o(A.1
- ;\) , the integral vanishes yielding
\/,(>.)"' Kp,(A)L('>..)R(X). (2)
The procedure is justified if A/(6.;\) » 1, where 6.;\ is the approximate spectral bandpass of the device. For the instrument used in the experiment A/(6.>-.) ~ 60.
If a reference standard with spectral reflectance PR(X) is observed, by the approximation described above, the voltage V R output of the radiometer can also be written as
(3)
The ratio of the two approximations from Eqs. (2) and (3) yields
(4)
as the final expression relating the spectral reflectance of the unknown sample to the known output voltages and the known spectral reflectance of the standard.
The assumption implicit in the above derivations is that both the reference standard and sample have nearly identical geometrical reflectance distributions and that neither exhibits any dependence on temperature. A further requirement is that the self-emission component and reflected background radiation be eliminated from the measurement. The extent to which these requirements were satisfied is discussed in the following text.
C. Experimental Configuration
The experimental configuration is shown in Fig. 1. The radiometer was a Barnes model 12-550 with 11-cm collecting optics and 2.5-mrad FOV. This instrument is equipped with a HgCdTe detector and a two-segment circular variable filter operating in the 3- 5- and 8-14-µm bands with a spectral resolution of A/(!i;\) ~ 60. Nominal scanning time for each band was 15 sec. The blackbody source was operated at 980°C and focused
lenses was a source of some difficulty, both the transparency in the visible region and relative low cost rendered the choice most suitable for this application. The incident flux from the blackbody source resulted in an equilibrium cloth surface temperature of 59°C (138°F).
For the rejection of the background and self-emission components, the source was chopped at 500 Hz and processed with a synchronous amplifier. This procedure yielded a measured ac to de component rejection ratio of 50:1. A minicomputer was programmed to automate data recording. However, a failure early in the experiment necessitated strip chart recording, and as a consequence the advantage of real-time signal averaging was lost. This became a major source of difficulty because of the poor SNR encountered from inherent low reflectance (5- 10%) of the cloth and atmospheric fluctuations that on occasion exceeded ±20% of th~ average signal levels. Transmission of the cloth was estimated at 10% and was not considered a significant effect.
Ilecause cloth is quite d iffuse in reflectance, exhibiting a nearly Lambertian distribution, it was necessary by the approximation set forth above to use a reflect,ance standard with comparable distribution.
Gold-plated sandpaper of 240 grit is an excellent choice for this application.3 Howe'Y'er to preclude changing attenuator settings when alternating between sample and standard it was advantageous to choose a standard whose absolute reflectance is within a factor of 2 or so of the absolute value of the sample. Flat black enamel sprayed on 240-grit sandpaper was found to reasonably satisfy this requirement. Laboratory measurement of the standard revealed Lambertian behavior out to 30° of the surface normal. An advantage of this diffuse behavior is the relative insensitivity to geometry when the standard is inserted in the target plane.
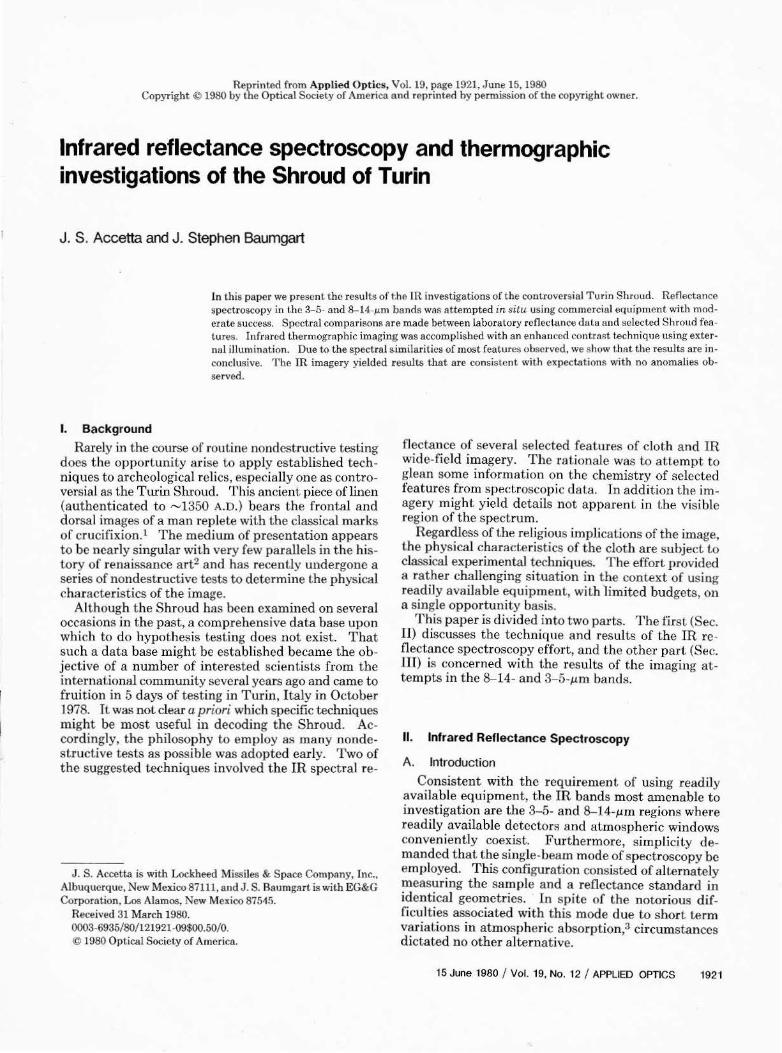
The spectral resolution available with this instrument was demonstrated by example. With the configuration shown in Fig. 1, using a gold standard as the target, a sample of polyethelene was interposed between the target and the radiometer. The absorption spectra obtained are shown in Fig. 2 and compared with the absorption spectra of the same sample of polyethelene
with a set off /I NaCl lenses to a spot diameter of "'-'2 cm F'ig. l. Experimental configuration of reflectance spectroscopy on the target. Although the hyd roscopic nature of these measurement.
1922 APPLIED OPTICS I Vol. 19, No. 12 / 15 June 1980
WAVELENGTH IN MICRONS
7 7.5 0 9 10 11 12 14 1G
100
90
80
~ "
70
60
50
4-0
30
20
10
0 1400 1200 1000 800 600
WAVENUMBER CM"'
Fig. 2. SpccLral resolution comparisons between a modernte resolution laboratory instrument and experimental setup (dotted curve)
using polyethylene as a sample (8-14 µm).
09
08 KDr SAOTLER COTTON
0 .7 ;;; N
~ 06
"' 0 z <t ....
0.5
~ 04 ... ... a: 0 .3
0.2
0.1
0 2.6 2 8 3 32 3 4 3& 38 4 4 2 44 46 48 s 52 5 4 ~6
Fig.3. band.
09
0 .8
07 ;;; N
)( 0.6 ;;; ~ OS ~ :;! 0.4 ..; ... "' a: 0.3
0.2
0 .1
WAVELENGTH <pm)
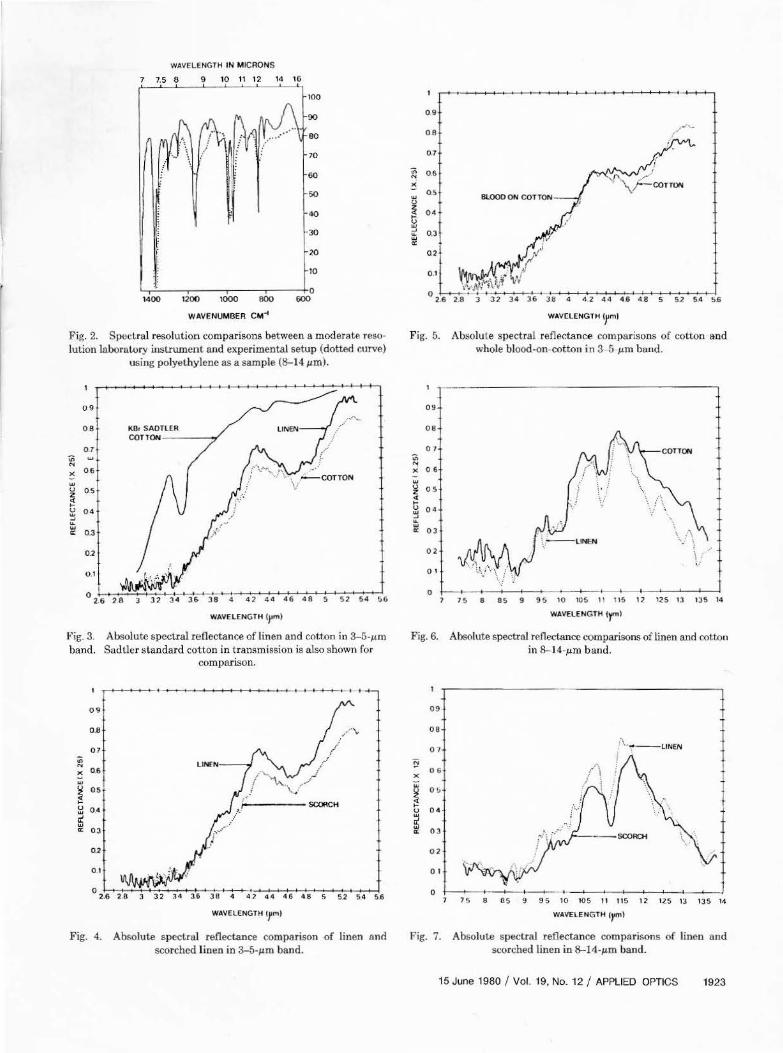
Absolute spectral reflectance of linen and cotton in 3-5-µrn Sadtlcr standard cotton in t ransmission is also shown for
comparison.
5CORCH
WAVELENGTH lfm>
Fig. 4. Absolute spectral reflectance comparison -of linen 11nd scorched linen in 3-5-µm band.
09
0 .8
0.7
;;; 0.6 N
)(
"' O.!>
0
~ 0 4
~ 0.3 ... w
0:
0.2
0.1
0 2.6 2.8 J 32 3 4 36 38 4 4 2 44 4.6 4.8 5 52 5 4 ~-6
WAVELENGTH lymt
Fig. 5. Absolute spectral reflectance com1>asi.!:ions of cotton and whole blood-on-cotton in 3 5 µm band.
09
08
07 ;;; N )( 06 w 0 OS z <t ... 0 04 ~ !:; a: OJ
02
0 1
0 7 !> 8 85 9 95 10 105 I I 115 12 125 13 135 14
WAVELENGTH ()"")
Fig. 6. Absolute spectral reflectance comparisons of line11 and C:<ltt.on in &- 14-µm ban<l.
09
08
07
~ x
06
;;; o~ ~
~ 04 (J
w ii w a: 03
02
0 I
0
.\ : ···~--LINEN
-i---<1---+-~-+-~+---+~·-t-~4-~ ..... -+~-+-~-'-~,____.__-7 5 8 OS 9 95 10 105 11 115 12 17.5 13 13 5 14
WAVELENGTH lyml
Fig. 7. Absolute spectral reflectance comparisons of linen ru1<l scorched linen in 8-14-µm band.
15 June 1980 I Vol. 19, No. 12 I APPLIED OPTICS 1923
as measured with a moderate resolution laboratory instrument. Solid body speclra of common materials are generally broad featured,4 and the spectral resolution so obtained was adjudged adeq1)ate for the expected spectral characteristics of the actual measurement.
D. Experimental Procedure T he focused blackbody source located rv40 cm from
the target was positioned upon a preselected area of interest. The radiometer located ~2 m from the cloth was focused on the area and adjusted for maximu111 signal return. T he narrow FOV of the instrument contributed to positioning sensitivity. However, once positioned, the signal levels were stable. A spectrum was recorded. The reforence surndard was then positioned directly over the area of interest, maintaining geometry, and another spectrum was recorded. Signal levels in the 3- 5-µm band were considerably greater than in the 8-14-µm band, and corresponding attenuator changes were required.
Of particular note during the course of the experiment was the relatively large fluctuations in atmospheric absorption, especially on those days when local precipitation caused high relative humidity. Although sufficient data were taken to enable approximate spectral recovery, t he atmospheric fluctuations from measurement to measurement accompanied by inherent system noise were of such amplitude that the determination of absolute values of reflectance was unreliable. A further difficulty with t he circular variable filter on the radiometer necessitated termination prior to completion, resulting in fewer measurements than anticipated.
E. Data Reduction and Presentation As previously d iscussed, data reduction was at
tempted in accordance with Eq. (4). In practice, diffi cu lties arise, especially with spectra containing relatively narrowbanded features. It is obvious that if a certain spectral feature appears in both the sample and reference measurement, the ratio of these spectra in the region of the feature yields a constant; however, if a small shift in wavelength occurs in either measurement, an artifact is produced. The effect is similar if, for example, Lhe atmospheric absorption changes between sample and standard measurements. These effects can be a source of considerable error in spectral measurements and adequately justify dual beam instrumental techniques.
Approximately fifty spectra we1·e taken in the course of the experiment. Areas of interest were categori~ed as image, blood, scorch, and linen.
'l'he image areas a re those parts of the cloth containing the anatomical attributes of the figure in Lhe cloth. Generally, spectra were taken in those areas where the image was visually dense.
The blood areas are those regions containing a light crimson stain resembling a common bloodstain to some degree but devoid of its characteristic reddish-brown coloring.
1924 APPLIED OPTICS I Vol. 19, No. 12 / 15 June 1980
09
.., 08 0
~ 07
~ 06 ll! 53 0 b
~ ~ 04
§ 03
02
01 -
0 ''-' s a.s 9 95 10 10!5 11 11s 12 1.:>s 13 1JS •4
WAVFLF NGTH (J•m)
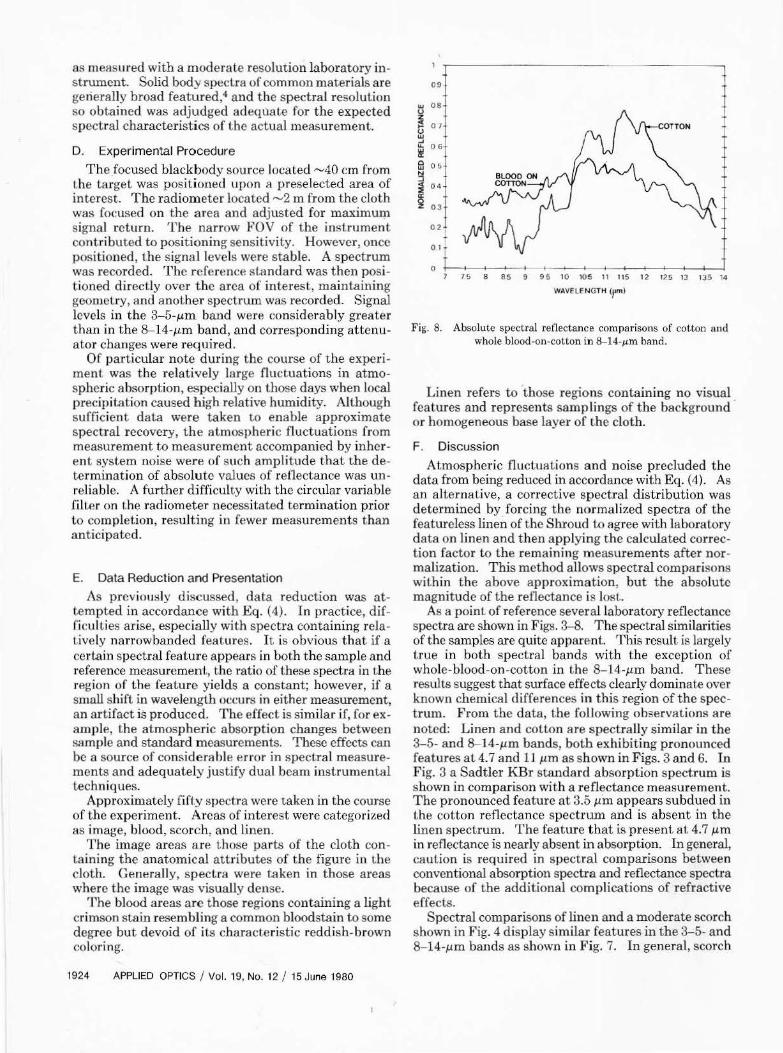
Fig. 8. Absolute spectral reflectance comparisons of cotton 1rnd whole blood-on-cotlon in 8-14-µm band.
Linen refers to those regions containing no visual features and represents samplings of the background · or homogeneous base layer of the cloth.
F. Discussion Atmospheric flucLwiLions and noise precluded the
data from being reduced in accordance with Eq. (4). As an alternative, a corrective spectral distribution was determined by forcing t he normalized spectra of the featureless linen of the Shroud to agree with laboratory data on linen and then applying the calculated conection factor to the remaining measurements after normalization. This method allows spectral comparisons wiLhin t he above approximation, but the absolute magnitude of the reflectance is lost.
As a point of reference several laboratory reflectance spectra are shown in Figs. 3-8. The spectral similarities of the samples are quite apparent. 'l'his result is largely true in both spectral bands with the exception of whole-blood-on-cotton in t,he 8- 14-µm band. These results suggest that surface effects clearly dominate over known chemical differences in this region of the spectrum. From the data, the fo llowing observations are noted: Linen and cotton are spectrally similar in the 3-5- and 8-14-µm bands, both exhibiting pronounced features at 4.7 and 1 J µmas shown in Figs. 3 and 6. In Fig. 3 a Sadtler KBr standard absorption spectrum is shown in comparison with a reflectance measurement. The pronounced feature at 3.0 µ·m appears subdued in Lh e cotton reflectance spectrum and is absent in the linen spectrum. The feature that is present at 4.7 µm in reflectance is nearly absent in absorption. In general, caut,ion is required in spectral comparisons between conventional absorption spectra and reflectance spectra because of the additional complications of refractive effects.
Spectral comparisons of linen and a moderate scorch shown in Fig. 4 display similar features in the 3- 5- and 8- 14-µm bands as shown in Fig. 7. In general, scorch

.;
0.9
._. t-+--r•~•~•-+-r..--.-+-+1~1-+-1.._._._..._..,_,,_.._,_.._.,_,_,~,~•~•~1~t
oa
:.:1 0 2.6'2~3 3.2 34 36 3 8 4 42 44 46 48 52 54 56
WAVELENGTH 1ym1
Fig. 9. Normalized spectral reflectance comparisons of scorched linen with averaged Shroud image and scorch areas in 3-5-µm band.
0.9
F/ ~ 0.6 a:
s 05 !::!
~ 0 ,4
~ 0 .3
O?
0.1
SHROUO BLOOO ;'Nv\ l
0 2.6·2~8 3 ·32 34 36 38 4 42 44 '16 J\ .8 5 5.2 511 56
WAVELENGTH 1ym)
Fig. 11. Normalized spectral reflectance comparisons of bloodon-colton with Shroud averaged blood areas in 3- 5-iim band.
spectra are invariant with respect to visual intensity, showing nearly identical absolute reflectances in both spectral bands. Furthermore, there exists almost negligible spectral variation between scorches and bare linen. I3lood-on-cotton in Fig. 5 has little effect on cotton spectral features in the 3-5-µm band but a pronounced effect in the 8-14-µm band as shoW!l in Fig. 8.
Intercomparison between laboratory data and measurements on the Shroud yielded the following observations: As shown in Figs. 9 and 10, laboratory observations of scorches on linen are similar to scorches on the Shroud. Also shown is a marked similarity between image and scorch areas in both spectral bands. Blood comparisons show marked differences in both bands, the disparity in the 8-14-µm band being quite pronounced as shown in Figs. 11and12. A whole-bloodon-linen laboratory measurement was 1not available.
0 9
01-
0 7 5 8 85 9 95 10 105 11 115 12 12.5 13 135 14
WAVELFNGTH {)"")
r 'ig. 10. Normalized spectral reflectance comparisons of scorched linen with averaged Shroud image artd scorch areas in 8- 14-µni
band.
09
w 08
~ ~ 0 I u ~ 06 ... w er 0 w N :J
0 .5
I 04
03
02
01
0
T
I
l!LOOD ON COTTON I + I
7 75 6 8~ 9 95 10 105 II 115 12 125 13 135 I~
WAVtLCN GTll ()"")
Fig. 12. Normalized spectral reflectance comparisons or whole blood-on-cotton with averaged Shroud blood in 8- 14-µm band.
However, since the base material spectra of cotton and linen were quite similar, it was reasoned that comparisons between blood-on cotton and blood~on-linen were valid. These results are mitigated somewhat by the presumed age of the blood and by the possibility of its having undergone a rather largo temperature excursion due to the fire. The effects of these factors on spectral features are unknown.
G. Conclusions Due to the uncertainties in the data it is not possible
to draw definitive conclusions. The spectral similarity of the image areas to known scorches is noted and is consistent with observation in terms of color in the visible region of the spectrum, however; this result is not wiLhout ambiguity since spectral similarities are characteristic of most areas examined as shown by the data in both spedral bands. Shroud blood comparisons with
15 June 1980 /Vol. 19, No. 12 I APPLIED OPTICS 1925
D FLOOOLAMPS
SCANNING HEAD
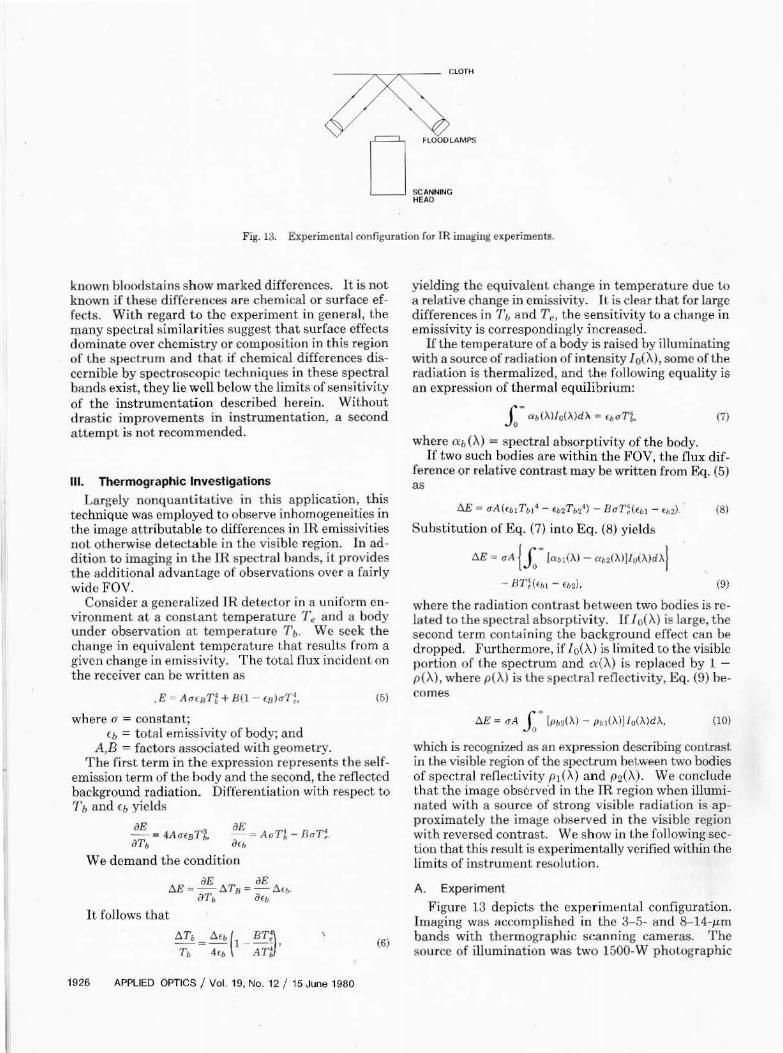
Fig. 13. Experimentlll r.onfiguration for IR imaging experiments.
known bloodstains show marked differences. lt is not known if these differences are chemical or surface effects. With regard to the experiment in general, the JPany spedral similarities suggest that surface effects dominate over chemistry or composition in this region of the spectrum and that if chemical differences discernible by spectroscopic Lechniques in these spectral bands exist, they lie well below the limits of sensitivity of the instrumentation described herein. Without drastic improvements in instrumentation, a second attempt is not recommended.
Ill. Thermographic Investigations
Largely nonquantitative in this application, this technique was employed to observe inhomogeneities in the image attributable to differences in lR emissivities not otherwise detectable in the visible region. In addition to imaging in t he lR spectral bands, it provides the add it ional advantage of observations over a fairly wide FOV.
Consider a generalized LR deteclor in a uniform envirnnment at a constant temperature T e and a body under observation at temperature Tb. 'vVe seek the change in equivalent temperature that results from a given change in emissivity. The total flux incident on the receiver can be written as
.E AucaTt + B(l - EnkTt
where <1 = constant; Cb = total ernis&ivity of body; and
A,B = factors associated with geometry.
(5)
The first term in th e expression represents the selfemission term of the body and the second, the reflected background radiation. Differentiation with respect to 'l'b and Cb yields
iJE iJ/£ 4 - = 4A<TEnTi, =A art - BuT,. arb olb
We demand the condition
iJE oE fiE = -6TB = -6<b·
arb ofb It follows that
(6)
1926 APPLIED OPTICS/ Vol. 19, No. 12 / 15 June 1980
yielding the equivalent change in temperature due to a relative change in emissivity. IL is clear that for large differences in 7'1, and Te, the sensitivity to a cha nge in emissivity is correspond ingly increased.
If the temperature of a body is raised by illuminating with a source of radiation of intensity IoCXJ, some of the radiation is thermalized, and the following equality is an expression of thermal equilibrium:
J:~ ab(A)lo(.A)d .>. = <ouTt. (7)
where ab (ft.) = spectral absorptivity of the body. If two such bodies are within the FOV, t he flux dif
ference or relative contrast may be written from Eq. (5) as
6E = uA(Eb1To14 - Eb2To2·1) - Bu7'~(Eo1 - Etz). · (8)
Substitution of Eq. (7} into Eq. (8) yields
6E = uA { J: • [c:rb1P.> - at2(X))Jo(X)d>.}
(9)
where the radiation contrast between two bodies is related to the spectral absorptivity. If I o(A.) is large, the second term containing the background effect can be dropped. Furthermore, if 10(A.) is limited to the visible portion of the spectrum and a(ft.} is replaced by 1 -p(ft.), where p(A) is the spectral reflectivity, Eq. (9) becomes
t:.E = <1A fo" [Pb2(:\) - Pb1(X))fo(.\)d.\, (10)
which is recognized as au expression describing contrast in I.he visible region of the spectrum bet.ween two bodies of spectral reflectivity 1>1(.A) and P2(ft.). We conclude that the image observe'd in the IR region when illuminated with a source of strong visible radiation is approximately the image observed in the visible region with reversed contrast. We sh ow in the following section that this result is experimentally verified within the limits of instrument resolution.
A. Experiment
Figure 13 depicts the experimental configuration. Imaging was accomplished in the 3-5- and 8-14-µm bands with thermographic scanning cameras. The source of illuminat ion was two 1500· W photographic

Fig. H. 'F'ace region in 8-14-µm band. Features ohserved correspond closely to those observed in the visible v.<ith reversed
contrast.
Fig. 16. As in Fig. 15 with image expansion.
Fig. 15. As in Fig. 14 with slighUy less contrast and scale lights turned off.
F'ig. 17. Back of head in ~14-11m band. Irregularly shaped bright.er areas in upper part of photo correspond to red crimson stains in
visible.
15 June 1980 / Vol. 19, No. 12 /APPLIED OPTICS 1927

Fig. 18. Hands in 8-14-µm band. Bright spot in upper left of photograph corresponds to red crimson stain on wrist in visible.
Fig. 19. Foot area in 8-14-µm band.
floodlamps, which when f'ocused provided approximately uniform levels of illumination across the observed region. No contrast was discernible without the floodlamp illumination indicating that the emissivity differences in various features on the Shroud were below the lirn it of sensitivity of the cameras at room temperature. Witli illumination considerable contrast was noted in the 8-14-µm band as shown in l<'igs. 14- 20. A
1928 APPLIED OPTICS/ Vol. 19, No. 12 I 15 June 1980
Fig. 20. Chest wound in 8-14-µm band. Bright patch corresponds to large crimson stain in visible. Irregular darker area corresponds
to cloth patch sewn over a burned region from 1532 fire.
no~inal temperature span from black to white levels was l.75°C. No features were observed in the 3-5-µ.m band regardless of illumination. 'l'his result is attributed to differences in instrument apertures and hence basic sensitivities rather than physical attributes of the surface. By observing the reflected arc lamp illumination from a gold-plated diffuse standard it was ascertained that no detectable radiation in the 8- 14-µm
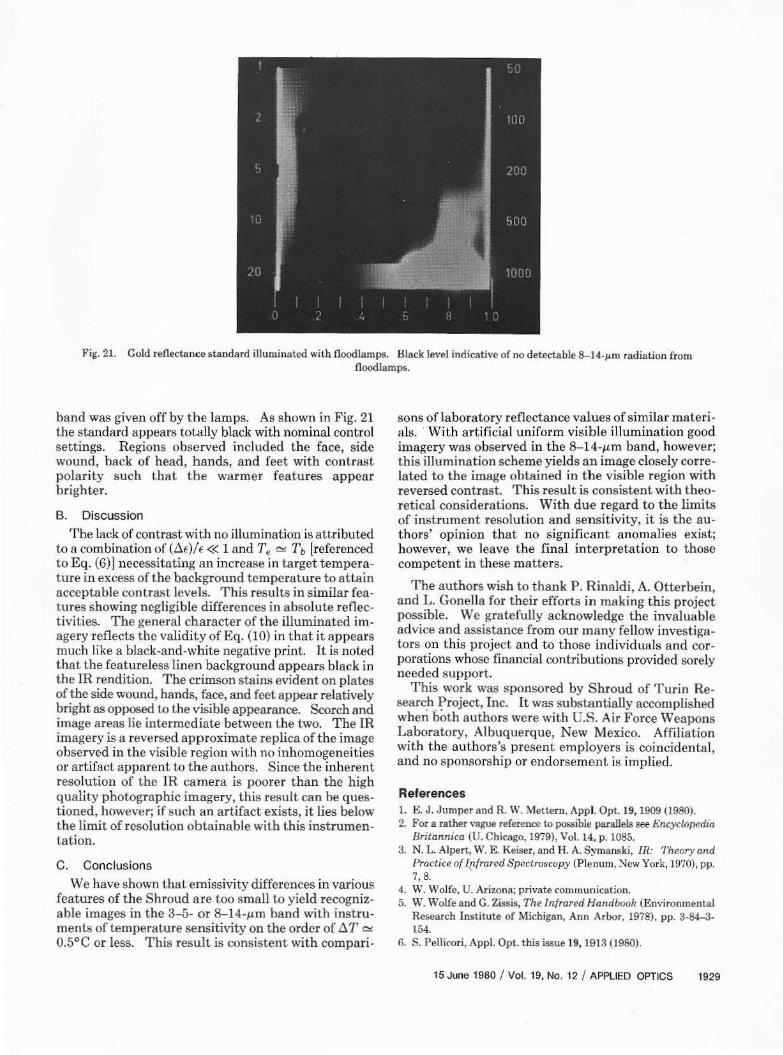
Fig. 21. Cold reflectance standard illuminated with floodlamps. Black level indicative of no detectable 8-14-µm radiation from floodlamps.
band was given off by the lamps. As shown in Fig. 21 the standard appears totally black with nominal control settings. Regions observed included the face, side wound, back of head, hands, and feet with contrast polarity such that the warmer features appear brighter.
B. Discussion The lack of contrast with no illumination is attribu ted
to a combination of (!::..E)/E « I and Te ~ Tb [referenced to Eq. (6)) necessitating an increase in target temperature in excess of the background temperature to attain acceptable contrast levels. This results in similar features showing negligible differences in absolute reflectivities. The general character of the illuminated imagery reflects the validity of Eq. (IO) in that it appears much like a black-and-white negative print. It is noted that the featureless linen background appears black in the IR rendition. The crimson stains evident on plates of the side wound, hands, face, and feet appear relatively bright as opposed to the visible appearance. Scorch and image areas lie intermediate between the two. The ffi imagery is a reversed approximate replica of the image observed in the visible region with no inhomogeneities or artifact apparent to the authors. Since the inherent resolution of the IR camera is poorer than the high quality photographic imagery, this result can be questioned, however; if such an artifact exists, it lies below the limit of resolution obtainable with this instrumentation.
C. Conclusions We have shown that emissivity differences in various
features of the Shroud are too small to yield recognizable images in t he 3-5- or 8-14-µm band with instruments of temperature sensitivity on the order of !::..T ~ 0.5°C or less. This result is consistent with compari-
sons of laboratory reflect ance values of similar materials. · With artificial uniform visible illumination good imagery was observed in the 8-14-µm band, however; this illumination scheme yields an image closely correlated to the image obtained in the visible region with reversed contrast. This result is consistent with theoretical considerations. With due regard to the limits of instrument resolution and sensitivity, it is the authors' opinion that no significant anomalies exist; however, we leave the final interpretation to those competent in these matters.
The authors wish to thank P. Rinaldi, A. Otterbein, and L. Gonella for their efforts in making this project possible. We gratefully acknowledge the invaluable advice and assistance from our many fellow investigators on this project and to those individuals and corporations whose financial contributions provided sorely needed support.
This work was sponsored by Shroud of Turin Researc.h.~roject, Inc. It was substantially accomplished when both authors were with C.S. Air Force Weapons Laboratory, Albuquerque, New Mexico. Affiliation with the authors's present employers is coincidental, and no sponsorship or endorsement is implied.
References 1. E. J. Jumper and R. \V. '.\1etlem, Appl Opt. 19, 1909 (1980). 2. For a rather vague reference to possible parallels see Encyclopedin
Britannica (U. Chicago, 1979), Vol. 14, p. 1085. 3. N. L. Alpert, W. E. Keiser, and H. A. Symanski, IR: Theory and
Practice of J.r.:frared Spectroscopy (Plenum, New York, 1970), pp. 7, 8.
4. W. Wolfe, U. Arizona; private communication. 5. W. Wolfe and C. Zissis, The Infrared Handbook (Environmental
Research Institute of Michigan, Ann Arbor, 1978), pp. 3-84-3-154.
6. S. Pellicori, Appl. Opt. this issue 19, 191~ (1980).
15 June 1980 /Vol. 19, No. 12 /APPLIED OPTICS 1929
Top Related