


Languages
Pages
Legal

INFLUENCE OF SCHOOL CHARACTERISTICS ON STUDENTS’ ACADEMIC PERFORMANCE IN SECONDARY SCHOOLS IN TIGANIA CENTRAL DIVISION, MERU KENYA
MURIUKI AMBROSE MWITI
KSKL'YU l ib r a r y P. C. Box 30i9*>
M A I » O P ‘
A RESEARCH PROJECT REPORT SUBMITTED IN FULFILMENT OF THE REQUIREMENTS FOR THE AWARD OF A MASTER OF ARTS DEGREE IN PROJECT PLANNING AND MANAGEMENT, UNIVERSITY OF NAIROBI.
2012
DECLARATION
This research report is my original work and has not been presented for the award of a degree in any other University.
Muriuki Ambrose Mwiti
Reg. No. L50/66282/2010
Signature— — date^
This research report has been submitted for examination with our approval as University supervisors.
Dr. Jane C. Gatumu.
Senior Lecturer
School of Education
Department of Educational communication and technology.
University of Nairobi
S i g n a t u r e date o s i i d i o I z.
Mr. John Chandi Rugendo
Senior Lecturer
School of Continuing and Distance Education
University of Nairobi.
date..izjiJ/'I*''7-
n

DEDICATION
This research project is dedicated to my dear wife Antonina Kanyua who was
understanding, supportive and encouraged me to carry on with the work up to the end
It is also dedicated to my dear children Victor Lee Mwandiki, Vincent Evans Murithi
and Virgil Joy Makena who were a source of inspiration to me every day. My prayer
is that they grow to be responsible citizens who are determined, hard working and
dedicated to their daily endeavor for their good and that of the entire society.
iii

ACKNOWLEDGEMENT
I am highly indebted to my supervisors Dr. Jane Ciumwari Gatumu and Mr.John
Chandi Rugendo for tirelessly guiding and providing professional advice to me which
I required especially during identification and developing of this topic to this level. I
want to appreciate all my lecturers for their great work of modeling me to what I am
today. They committed and sacrificed their precious time to offer me the best
academic service ever during my training in the college. I want to appreciate the
University of Nairobi administration especially Meru Extra- Mural team led by Mr
Amos Gitonga, Ms. Linda Kathure, Ms. Mercy Kagwiria, Nancy Karimi, Karen
Kaindigo and Carol Karimi. You were welcoming, hospitable and readily available.
You created the best climate for promoting academic excellence for us students. To
the University of Nairobi I want to appreciate the precious opportunity granted to me
to pursue Master degree in project planning and management within reach. I
appreciate and thank Tigania East District DEOs staff and Tigania central division
officer for being welcoming and availing the information that i required from the
office. My solemn gratitude goes to Mrs. Lucy Mujuri the Principal St. Massimo
secondary and the School community led by Miss Josphine Kaburu for being
supportive and understanding when I became a little bit committed to college work.
Thanks to Miss Jilvera Kendi for accepting to work at odd hours on typesetting and
printing this work for me. I thank my parents for encouraging me to press on which
gave me a renewed spirit to work even harder. Finally I thank my group members for
they proved to be so resourceful, supportive and played a great role in encouraging
me to be more persistence up to the end as we journeyed together during the course.
IV

TABLE OF CONTENTS
DECLARATION
DEDICATION.........................................
ACKNOWLEDGEMENT......................
LIST OF TABLES ...............................
LIST OF FIGURES................................
ABBREVIATIONS AND ACRONYMS
ABSTRACT..... ........................................
CHAPTER ONE: INTRODUCTION
1.1 Background to the Study............
1.2 Statement of the Problem..........
1.3 The purpose of the Study...........
1.4 The objective of the Study.........
1.5 Research Questions.....................
1.6 Significance of the Study...........
1.7 Limitation of the Study...............
1 8 Delimitation (scope) of the Study
1.9 Assumption of the Study.............
l.lODefmition of significant Terms...
1.11 Organization of the Study..........
V ~rf 'oi t y '•.... jvfifvtJ iu . . .v. • JwifcAR.V..........
f>. 0. Sox 3019*'...... WAftiTOBV.............
Pages
....... ii
.......iii
.......iv
.......ix
........ x
.......xi
......xii
........1
........1
........3
........5
........5
....... 5
.......5
......6
......6
......6
.......7
.......7
CHAPTER TWO: LITERATURE REVIEW....................................................... 9
2.1 Introduction..............................................................................................................9
2.2 Academic Performance............................................................................................ 9
2.3 School Leadership..................................................................................................12
2.4 School Social Climate............................................................................................ 14
2.5 Teacher Characteristics.......................................................................................... 16
2.6 School Population.... ............................................... 19
2.7 School Location...............................................................;.....................................22
2.8 Conceptual Framework..........................................................................................23
2.9 Summary.... .................................................................................. 25
CHAPTER THREE: RESEARCH METHODOLOGY 26

3.1 Introduction............................................................................... 26
3.2 Research Design...... ...................................................... 26
3.3 Target Population......................................................................................... 26
3.4 Sample and Sampling Technique............. ............................................................28
3.5 Research Instruments............................................................................................ 29
3.5.1 Instrument Validity............................................................................................ 30
3.5.2 Instrument Reliability.................................................................................. .....30
3.6 Data collection Procedure............................................................. 30
3.7 Data Analysis and Presentation.............................................................................. 31
3.8 Operational Definition of Variables..................................................... 31
CHAPTER FOUR: DATA ANALYSIS, PRESENTATION AND
INTERPRETATION................................. 36
4.1 Introduction............................................................................ 36
4.2 Questionnaire, Observation Chart and K.C.S.E Score sheet.............. .................36
4.3 Demographic Profile.......................................................................... 36
4.3.1 Gender................................................................................................................. 37
4.3.2 Age................................................................................................. ....................37
4 4 Findings of the Study as per Research Objectives................................................38
4.4.1 Assess the Influence of School Leadership on Students’ Academic Performance
in Secondary Schools................................................................... .............................. 38
4.4.1.1 Principals’ Innovativeness in Policy Making and Implementation................ 38
4.4.1.2 Principals’ Level of Motivating and Empowering Teachers by Offering
Support and Training....................................................................................................40
4.4.1.3 Principals’ Involvement of other Teachers in Decision Making.................... 41
4.4.1.4 Principals’ Level of Communication with Stakeholders.................................42
4.4.1.5 Principals’ Level of Supervising Classroom Attendance................................. 43
4.5.2 Examine the Influence of School Climate on Students’ Academic Performance
in Secondary Schools................................................................................................... 44
4.5.2.1 Relationship between Principals and Teachers................................................44
4.5.2.2 Students and Teachers Relationship..... .......................................................... 45
4.5.2.3 Students Level of Interaction with the other students..................................... 45
4.5.3 Establish the influence of Teacher Characteristics on Students Academic
Performance in Secondary School................................................................................47
4.5.3.1 Duration as a Teacher in the Current School................................................47
VI

4.5.3.2 Teachers’ Level of Class Work Preparation........................ .......................... 48
4.5.3.3 Teachers Rate of Accomplishing and Meeting Set Deadlines........................48
4.5.3.4 Teachers Academic/Professional Qualification............................................. 49
4.5.4 Investigation of the Influence of School Population on the Students’ Academic
Performance in Secondary Schools........................................................... 50
4 5.4.1 Number of Students in School........................................................................ 51
4 5.4.2 Average Number of Student’ Per Class..........................................................52
4.5.4.3 Shortfall of Teachers Service Commission Teachers..................................... 52
4.5.4.4 Strain on the Resources in the Institutions...................................................... 53
4.5.5 Assess the Influence of School Location on Students’ Academic Performance in
Secondary schools......................................................................... .............................54
CHAPTER FIVE: SUMMARY OF FINDINGS, DISCUSSION, CONCLUSION
AND RECOMMENDATIONS.................................................................................57
5.1 Introduction......................... 57
5.2 Summary of the Findings.......................................................................................57
5.3 Discussion of the Findings.....................................................................................59
5 3.1 Influence of school leadership on student academic performance..................... 59
5.3.2 School climate influence on student academic performance............................. 59
5.3.3 Teacher characteristics and students academic performance..............................59
5.3 .4 Influence of school population on students academic achievement................ 60
5.3.5 School location and influence of students academic performance.....................61
5,4Conclusions............................................................................................................. 62
5.5 Recommendations............................................................................................... 63
5.6 Suggestions for further Research.......................................................................... 64
REFERENCES...........................................................................................................65
APPENDICES.................................................................................................... 80
Appendix A: Letter of Introduction............................................................................. 80
Appendix B: A Questionnaire for Heads of Institution/ Principals and Teachers..... 81
Appendix C: Observation Chart...................................................................................86
Appendix D: School K.C.S.E Score Sheet....... .......................................................... 87
Appendix E: University Confirmation Letter..............................................................88
vii

LIST OF TABLES
Pages
Table 1.1: KCSE Results for the last three Years.........................................................4
Table 3.1: Population Size................................................................................. .........27
Table 3.2: Sample Frame.............................................................................................29
Table 3.3: Operationalization of Variables.................................................................. 32
Table 4.1: Response Rate........................................................................................... 36
Table 4. 2: Gender.................................................................................................... 37
Table 4. 3: Age............. 38
Table 4. 4: Principal's Innovativeness in Policy Making................... 39
Table 4 5: Principal's Level of Motivation and Support to Teachers......................... 40
Table 4. 6: Principal's Involvement of other Teachers on Decision Making..............41
Table 4 7: Principal's Communication with the Stakeholders.......................... 42
Table 4. 8: Principals' Level of Supervising Classroom Attendance.......................... 43
Table 4. 9: Relationship Between the Principal and the Teachers............................. 44
Table 4. 10: Student's Relationship with the Teachers................................................45
Table 4.11: Student's Level of Interaction with the other Students........................... 46
Table 4. 12: Duration as a Teacher in the Current Station..........................................47
Table 4. 13: Teachers Level of Class Preparation...................................................... 48
Table 4. 14: Teachers Level of Task Accomplishment and meeting deadlines.......... 49
Table 4. 15: Teachers Academic Qualification............................................................50
Table 4. 16: Number of Students in the School...........................................................51
Table 4.17: Average Number of Students Per Class........................... ..................... 52
Table 4.18: Short fall of Teachers Service Commission teachers in school..............53
Table 4. 19: Strain on Resources in the Institution..................................................... 54
Table 4. 20: Locality of the School........................................................... 55
Table 5.1: Summary of Objectives, Findings and Recommendations.......................57
viii

LIST OF FIGURES
Figure 1. Conceptual Framework 24

ABBREVIATIONS AND ACRONYMS
A.N.C.O.P.S.S Ail Nigerian Conference of principals of Secondary Schools.
C. B. E Curriculum Based Establishment
K.C. S.E: Kenya Certificate of Secondary Education.
K.C. P. E: Kenya Certificate of Primary Education.
S.P.S.S: Statistical package of social science.
T.S.C: Teachers Service Commission.
U.N.LC.E.F: United Nations Children’s Funds.
U.N.D.P: United Nations Development Programme.
UNESCO: United Nations Education Scientific and Cultural Organization.

ABSTRACT
Schools are not alike but the features of well performing schools tend to be similar for all of them. Schools exert their influence on the students’ attachment, commitment, involvement determination among others which are necessary virtues for high academic achievement. This study was carried out in order to find out the influence of school characteristics on students’ academic performance in secondary schools in Tigania central division. The study was guided by the following objectives. To: Assess the influence of School leadership on students’ academic performance in Secondary schools; Examine the influence of school climate on students’ academic performance in secondary schools; Establish the influence of teacher characteristics on students’ academic performance in secondary school; Find out the influence of school population on the students’ academic performance in secondary schools and assess the influence of school location on students’ academic performance in secondary schools in Tigania central division. A descriptive survey was used and the quantitative and qualitative data was obtained and analyzed using descriptive statistics and is presented in tables, frequencies and percentage form. The researcher concludes that there is a high influence of school characteristics on students’ academic performance. Based on the findings the researcher concludes that the academic performance of secondary schools in Tigania Central Division is influenced by the leadership, school climate, teachers’ characteristics, school population, and location of the school. The researcher recommends the following: The school administration especially the Principals ought be more committed and improve on their leadership skills such as being innovative in policy making and implementation, motivating, monitoring and influencing both teachers and student to perform to their best. A more healthy relationship in school guided by the principal of unity of purpose has to be established between the principal and teachers, student and teachers, and among students and students. The students’ be organized into subject clubs and discussion groups in order to improve on the level of interaction amongst them and help one another. The young inexperienced teachers require be properly guided and oriented in the profession, be given time to understand the syllabus and master the subjects gradually from lower classes while the old teachers are reminded to be more committed to their duty. Internal and external inspection ought to be encouraged to enhance effective implementation of the school curriculum. Schools ought to increase enrolment and a maintain school population at a level that is economical and productive and that does not cause strain on the resources The Ministry of education is advised to employ more teachers to reduce the shortage in order to improve the current situation in secondary schools. The Board of governors and the Government should look for alternative ways of reducing strain on the school resources. The researcher also recommends that schools be located far away from towns and those in urban areas be given closer surveillance to monitor what gets in and out of the schools to reduce their damages on the students. The schools should also promote guidance and counseling to keep the students in the right track and help them concentrate on improving their academic achievement. A school like any other business should adopt the principle of Six Sigma which is a smarter way of managing a business or department aimed at improving customer satisfaction, reducing recycle time and reducing defects. This calls for total management commitment to the process, improvement and operation guided by the philosophy of excellence focused on promoting the students’ academic achievement fr i t u r at . tw*
UrCUVU UBRARV 0. Box 3M97 MAIffOBJ
XI

CHAPTER ONE
INTRODUCTION
1.1 Background to the Study
During a conference held jointly by executive heads of United Nations Children
Funds (UNCEF), United Nations Development Programme (UNDP), the United
Nations Educational Scientific and Cultural Organization (UNESCO) and the World
Bank in Thailand in 1990. It was established that that there was widespread concern
over inadequacies of education systems around the world and the growing recognition
of vital importance of basic education for social progress. It was also noted that the
world declaration on education for all and the framework for action to meet the basic
needs provide useful guides for governments, international organizations, educators
and development professionals in designing and carrying out policies and strategies to
improve basic education services ( Jomtien, Thailand, march 1990).This is in line
with the UNICEF effort of defining and providing globally, quality basic education
for children, which is an obligation for the convention on rights of the child
(Florence, Italy, June 2000).
According to Karikai (2009), the development of any nation largely depends on the
quality of education of such a nation. According to the American students
achievement institute (2007) high level of family and community involvement is a
common feature of performing schools. Rammala (2009) researching on factors
contributing to poor performance of grade 12 learners at Monoshi and Mokwatedi
high schools established that home environment is not educationally supportive due to
poverty, low level of education, emotional problems and issues related to gender
roles. Tsuo (2006) researching on cultural influence on academic achievement in Fiji
found that ethnic Fijian parent spent a large amount of time and money on making
contribution to ceremonies and church somewhat at the expense of their children
education. Consequently Indo-Fijian student generally became better performers than their counterparts.
Asikhia (2010) contributed to this argument by stating that the role of education is to
lay a foundation for further education of which if they are of good quality are likely to1

be no problems at the consequent levels. It gives a person an opportunity to get into a
higher level of education thus gaining useful skills to the country. In the same year he
researched on student and teachers perception of the poor performance in Ogun state
in Nigeria, found that teachers qualification, student environment do not influence
students poor performance according to the teachers response. But to students,
teachers’ qualification and students’ environment influence students’ performance
while on the other hand teachers’ method of teaching and learning material do not.
Owoeye (2011) study on school location and academic performance in Ekiti state in
Nigeria found that students in urban areas had better academic achievement than their
rural counterparts.
Kenya Government under president Kibaki understands the importance of education
to its people. That is why as promised under NARC Party manifesto (2002), the
government embarked on providing free education as from 2003. The overall
objective is to reduce illiteracy and improve transition rate from primary to secondary
school and raise the quality and relevance of education Republic of Kenya (2007).
Ireri (2007) studied the effects of educational resources on students’ performance in
Kenya certificate of secondary education in public secondary schools and found that
there is a connection between teacher experience and student performance while
availability of instructional materials such as text books were found necessary to
improve academic performance of the students. Yator (2003) investigated on the
factors that contributed to poor performance in K.C.S.E in Kabartonjo division in
Baringo district which established that many schools had inadequate resources, poor
payment of fees, and low parent rate of school visit, poor parents’ academic
background and high level of indiscipline cases in schools.
Mutuaruchiu (2011) studied on influence of parental characteristics on student
academic performance in Abothuguchi central division, Central Imenti District
established that income level of the parents, their academic level, attitude, family set
up and parental involvement in academic activities influence students academic
performance It is against this background that school characteristics capture the
attention of the researcher for it seems not to have been adequately studied This study
will establish the influences of school characteristics on student academic
performance in secondary’ schools in Tigania central district which is in Tigania east2

district in Meru County, kenya.
1.2 Statement of the problem
According to Ibari (2009), participation of the stakeholders, based on the defined
roles and duties determine the level of academic performance of the students in
secondary schools. Desforges and Abourchaar, (2003), express their view that
students’ performance, achievement and adjustment are influenced by many people,
processes and institutions. They also point that parents the broader family, peer
groups, neighborhoods, churches among others are implicated in shaping children
progress towards their self fulfillment and citizenship. Aremu, (2000) expressed that
academic failure is not only frustrating to the student and parents, but its effects are
equally felt by the society as well in terms of dearth of manpower in all sectors of the
economy. According to Ashibi (2005), there is disparity in Performance of students
in Secondary Schools that have almost similar resources to an extent that some tend to
perform even better while others perform poorly which raise mixed reaction among
the people and the Government as to what contribute to that phenomenon.
When children are taken to school it is assumed that they will acquire good education
which will make them useful people in the society. It is in school that they learn new
knowledge, skills and technology. Different school aspects like the structure, staffing,
organization climate among others determine what students achieve in school With
some adjustments here there non performing school are known to do well
academically. As established from K.C.S.E. results analysis, secondary schools in
Tigania central division are not performing well in academic. For instant 2011
K.C.S.E results analysis according to Tigania East District DEOs office the division
managed a mean score of 4.803 which is grade C-. Out of number of students who sat
for exams in the year 2011 only 158 of them managed to score C+ and above which is
28.9%. An analysis of KCSE results for six schools that were under investigation for
the last three years revealed the same as indicated in Table 1.1
3

Table 1.1: KCSE results for the last three years.
Description 2009 2010 2011 Average
mean
Grade
Mikinduri 6.2 6.8 6.7 66 C
Girls
Akaiga Mixed 5.3 6.5 6.6 6.1 C
Rware Girls 3.4 4.9 5.4 4.6 D+
Kaliene Mixed 4.3 4.7 4.6 4.5 D+
St. Massimo 5.3 4.6 5.7 4.7 D+
Mixed
Miciimikuru 2.9 4.6 5.0 4.2 D+
Division 5.1 C-
There are only two schools attained an average score of 6 which is grade C
compared to the maximum score of 12 points which is grade A. The rest of the
schools managed a mean grade of D+ On average the Division has managed a C-
which is below average.This results in high wastage of young people who are joining
the labour market and would have been very useful to the society. There is no single
factor that would account for the students’ academic failure or success but a
combination of a number of them. A considerable number of researches have been
conducted on the factors that influence academic performance, like the one conducted
by Mutuaruchiu on influence of parental characteristics on students’ academic
performance in Abothuguchi central division Imenti central district in 2011. However
ihe influence of school characteristics has not been adequately studied and cannot be
generalized for Tigania central division. This study therefore seeks to investigate the
influence of school characteristic on students’ academic performance in Tigania central division in Tigania East District.
4
1.3 The Purpose of the Study
The purpose of the study was to establish the influence of school characteristics on
students’ academic performance in secondary schools in Tigania central division in
Tigania East District.
1.4 The Objectives of the Study
The study was guided by the following objectives. To:
i) Assess the influence of School leadership on students’ academic performance
in secondary schools.
ii) Examine the influence of school social climate on students’ academic
performance in secondary schools.
iii) Establish the influence of teacher characteristics on students’ academic
performance in secondary school.
iv) Find out the influence of school population on the students’ academic
performance in secondary schools.
v) Assess the influence of school location on students’ academic performance in
secondary schools.
1.5 Research questions
This study was attempting to answer the following questions
i) How does school leadership influence students academic performance in
secondary schools?
ii) What is the relationship between the school climate and the students’
academic performance in secondary schools?
iii) How do teacher characteristics influence students’ academic performance in secondary schools?
iv) What is the relationship between school population and the students’ academic
performance in secondary schools?
v) How does school location influence students academic performance in secondary schools9
1.6 Significance of the study
The findings of this study will be useful to the Government and ministry' of Education
in understanding the internal characteristics of the schools that contribute to
5

differences in academic performance and develops policies that will narrow variation
in academic ranking The school management team will find the research findings
useful in helping them understand the inherent characteristics that contribute to poor
performance in schools and adapt methods that will address the situation. The other
researchers will use this research as a baseline for future research on poor academic
performance in the country.
1.7 Limitation of the study
The study used descriptive survey design which tends to be unpopular for the studies
are too detailed through description. The researcher has to have a clear perception of
what the study is to cover failure to which results in inappropriate data collection. The
respondents in descriptive survey tend not to be truthful and give inappropriate
answers. The study is also affected by time limit and financial constraints which limit
its efficiency and effectiveness in handling all the variables under investigation. There
are other intervening variables like Government policies which influence students’
academic performance and therefore would affect the finding thus limiting the study.
The sample findings of this study cannot be used for generalization for the whole
country.
1.8 Delimitation (scope) of the study
The study focused on Secondary Schools in Tigania central Division. There were 12
secondary schools in the division with 12 principals and 126 teachers thus giving a
total of 138 who formed the main body from which the information was obtained. The
study concentrated on a few independent variables like school leadership, school
climate, teacher characteristics, school population and school location to establish
how they influence academic performance in the area. This means that there are other
variables which are influential to students’ academic performance. A questionnaire,
supportive observation chart and KCSE results analysis were used for the purpose of collecting the information.
1.9 Assumptions of the study
The basic assumptions of this study is that school characteristics influence academic
performance in Tigania central division and that the instruments used especially the
questionnaire, observation and KCSE results analysis are the most appropriate for it.
6

It is also assumed that the respondents were honest and truthful in their answers thus
making the finding true to the situation in the region
1.10 Definition of significant terms
School Characteristic:
Social Climate
School Leadership
School Location
Academic Performance:
School Population:
The qualities or features which make a person, a thing
and a place among others. These special and easily
recognized qualities differ from item to another.
Schools have their own features which differ from place
to place.
It’s the general situation or attitude of the people
involved in a school system as they interact with one
another which could be healthy or unhealthy.
The position of the person in charge whose skills and
qualities are put into test in running the affairs of the
school and organizing human resources which could
lead to the success or failure of the institution in its
performance.
It’s the place or position where the school is found or
situated in relation to whether it is rural or urban based.
Are standards at which the school or individuals in a
learning institution achieve in both local and national
exams.
The size or numbers of students that are found in a
certain school which determine the number of people
who are using various school resources which could be
strained or be used in a healthy manner.
1.11 Organization of the study
This study was organized in five chapters Chapter one: introduction gives the
background to the study, the statement of the problem and the purpose of the study.
The other details entailed in the chapter are the objectives of the study, the research
questions, significance of the study and the limitations of the study. It also highlights
the assumptions of the study and the definition of the significant terms in the context
of the study. Chapter two is based on literature review, with the introduction,
7

academic performance, school leadership, social climate, teacher characteristics,
school population and location literature based on secondary and primary sources It
also gives the conceptual or theoretical framework of the study. Chapter three dealt
with research methodology which was broken into research design, target population,
sampling procedure, and methods of data collection. It dealt with validity and
reliability of the methods of data collection, the method of data analysis, and
presentation and finally operational definition of variables. Chapter four dealt with
data analysis, presentation and interpretation while chapter five gives a summary of
the findings, discussion and recommendations for further study after the field research
was done.
After establishing the background, stating the problem and establishing the
background to the study the researcher embarked on literature review to establish
what other researchers have established about the area under investigation. The details
are found in chapter two. It is important for laying down the foundation of the study.
8

CHAPTER TWO
LITERATURE REVIEW
2.1 Introduction
This chapter gives detailed information on features of high academic performing
schools. It also deals with school characteristics like leadership, social climate,
teacher characteristics, school population and the school location influence on
students’ academic performance. This is based on researches that have been
conducted in different parts of the world by various researchers. The chapter helps the
researcher to establish the gaps that need to be addressed by this study.
2.2 Academic performance
An education institution success is measured by its academic performance or how
well students meet the standards set out by local government, higher institutions of
learning, job market requirement and the institution itself Bell (2012). Shannon and
Bylsma (2003) researching on characteristics of high performing schools established
that such schools take many years of hard work. According to Keefe, Valentine, clerk
and Irvin (1994) school structure and process go hand in hand with level of student
academic performance. The school good policy and effective leadership shape and
determine quite a number of the core elements which influence students’ academic
achievement. Effective leaders do more in building teacher excellence by influencing
uniformly able staff by sharing the dream of commitment to excellence with them.
They communicate the school mission and vision, persistently reinforce them and
create a shared sense of purpose with the entire school community. Such leaders
establish set of common values and pass them to instructional staff, students and
parents Teachers are given an opportunity to improve their knowledge and skills in
the profession by attending workshops, training and conferences that share teachers
practice Lezotte (1991). He adds that the leaders model commitment to learning and
create an environment that value collaboration and constructive sharing of best
practices. Teachers collaboratively scrutinize and review student performance and
deliberate over their implication. Therefore the staff accepts the responsibility for the
students learning of the school essential curricular goals. The conclusion is that a
combination of factors leads to school success but require years of sustained school
9

commitment which affect school values, beliefs and instructional practice.
As noted by Cary (2000) high performing schools have good teachers in adequate
number that meet the school’s academic mission Resources are effectively allocated
which maximize the teacher student ratio and good relationship. These schools
organize their curriculum effectively in line with their goal for student achievement
aligned to national curriculum, testing requirements and ensure that most demanding
courses are not scheduled. More time is created to teach complex materials, block
schedule, after normal teaching hours and extending to weekend are considered to
make time more available According to Kelly (2012) teachers are known to lead the
students learning using multiple forms of assessment that reveal performance and
demonstrate competence; student portfolio and test data for analysis and decision
making in cycle of continuous school improvement. Teachers spend more time in
planning, coordination and staff development by re-organizing the teaching schedule
which helps them to focus on school academic mission and engage the staff in fruitful
interaction. High effective schools have high set expectations for both teachers and
students. This is guided by the belief that all students can learn and meet high
standards, Rensulli and Reis (1985). They recognize that students must overcome
significant barriers that are seen as surmountable obstacles. Students are offered an
ambitious and rigorous course of study and the staffs believe that they have the
capability to help students. According to Bauer (1997) students are given challenging
curricular and demanding task and they are expected to succeed. Children are
regarded as an asset and posses a unique gift to offer to the society.
Anderson (1982) asserts that performing schools have high level of collaboration,
communication which promotes a strong teamwork among the members of the school
community. This makes it easy to identify the problem and work on them effectively.
It promotes a sense of internal community where they share a common goal for the
student achievement, work collaboratively to provide challenging instruction and
share collective responsibility for the success of each student It is expressed by
erkins (1995) that high performing schools follow a well planned and actual
curriculum which is aligned to essential academic requirements They stick to
research based teaching strategies and materials and a staff that understand the role of
classroom and national assessment requirement, assessment measure and how the10
work is evaluated. Shannon and Bylsma (2003) add that they limit access to most
demanding courses and stick to a sound curriculum that include both the content,
process, knowledge and align with world class standards. A curriculum that enables
students to succeed at the next educational level, become a responsible and a
productive member of the global economy. To the institution this must be properly
coordinated between classrooms, grade levels, building levels and disciplines for
effectiveness
High performing schools have frequent monitoring of learning and teaching which
help identify students who need help Lezote (2001). More time is created to instruct
and support students who need more help. Assessment results are used to focus and
improve instructional programmes. Along with this as stated by Baker, 01 zelndam,
Gratama and Arington (2005) more emphasis is put in training staff in areas of most
need. This is a product of feedback which focuses on an extensive and ongoing
professional development. Therefore teachers are given an opportunity to attend
workshops, training and conferences that share teachers’ practices.KlffUrtl LIBRARY p. 0 Box B0197
According to Freiberg (1999) high perfOrmhi^ifechools have supportive learning
environment with safe, civil, healthy and intellectually stimulating environment.
Students feel respected and connected to the staff and are engaged in learning
instructions that are more personalized and small learning environment that increase
student contact with teachers. They embark on firm, fair and timely discipline.
Shannon and Bylsma (2007) add that students are made to understand that good
behavior is valued, unacceptable conduct is not allowed and how it is punished. The
schools emphases their commitment to students’ achievement, public display of
excellent work product and ceremonies and rituals that celebrate excellent individual and collective performance, Cotton (2000).
According to American student achievement institute (2007) and as supported by
Shannon and Balsma (2003) high level of family and community involvement is a
common feature of high performing schools. The responsibilities of educating
students go beyond teachers and the school staff. Both parents, business people, social
S6rVI€e agencies, community, colleges and universities are involved These
stitutions understand and support the basic mission of the schools and are given11
opportunity to play in helping the schools achieve their mission. Johnson (1997) adds
that parents are involved in mentoring, tutoring, co-teaching and curriculum review.
They create partnership between school and community members, provide
community events in building the schools and encourage community members to
have high expectations for the students which act as the basis for promoting high
academic performance.
2.3 School leadership
As indicated by Mccormack, Adams and Gamage (2009) many scholars have
acknowledged that the role of school leadership is mostly significant in enhancing
school performance and students achievement Such leaders develop school climates
and culture that help motivate both student and teachers leading to better teaching and
an environment that is conducive for higher levels of student’s academic achievement.
A school leader is the person occupying various roles in school who work with others
to provide direction and exert influence on persons and things in order to achieve the
school goals Leith, wood and Rieht, (2003). Mulford (2003) agree that a principal
through systematic authorities is required to improve students’ learning and his held
accountable for it by building commitments in developing a shared vision for
motivating and energizing the teachers and students.
According to Cotton (2003) a principal is meant to establish a clear focus on student
learning by having a clear vision, learning goals and high expectation for learning for
all students’ interaction, emotional and interpersonal support, visibility and
accessibility and parent or community participation. He is meant to develop a school
culture conducive to teaching and learning through shared leadership and decision
making, collaboration, risk taking leading to continuous improvements. To him, a
principal should provide instructional leadership through discussion of instructional
issues, observing classroom teaching and giving feedback, supporting teacher
autonomy and protecting instructional time, and being accountable for affecting and
supporting continuous improvement through progress and using students’ data for
programme improvement. Studies conducted by Harris (2004) indicate that successful
leadership in schools has resulted in higher levels of both students’ attainment and
achievement, thus emphasizing importance of distributed leadership.
12

Gamage, Adams and Maclormack, (2011) cite Townsend conducted a study between
Australian and American schools 1997 and concluded that an effective school is
primarily characterized by good leadership and good staff, good policies and safe and
supportive common goal. They conclude by stating that effective schools
improvement require a strong and empowered school leaders who has power to hire,
fire, promote teachers and other school members of staff, time and financial
management, spiritual and human resources support and school improvement. They
also argue that effective principals place high emphasis on achieving high levels of
students learning and provide resources towards the effort to improve the achievement
and general wellbeing of the residents.
According to Musungu and Nasongo (2009) Head teachers as the school chief
executive are charged with the daunting task of managing teachers among other
resources. One has the responsibility to promote academic performance for he or she
is in charge of running the school in academic or administration matters. She further
says that good performance of a school is as a result of good teaching and overall
effective headship, by organizing, using quality improvement measures and
promoting teamwork. Such a principal should be involved in academic activities by
observing and checking the students and teachers work, monitoring students
discipline and helping in eradicating cheating in examination. Millete (1988) found
that the quality of leadership makes the difference between the success and failure of
schools. Musungu and Nasongo (2009) are categorical that head teacher is the leader
in a school, the pivot around which many aspects of the school revolve and the person
in charge of every detail of running of the school academic or administrative wise.
Mortimore (1998) study on purposeful leadership by the principal found out that out
comes were more favorable when there was a combination of firm leadership and
together teachers felt their views are presented Bergeson (2004) add that effective
leadership that is at the core of improved district Schools is committed, persistent,
proactive and distributed throughout the system. Ghaffer, Rizvi,Asdaque and Bilal
(2002) studying about the factors contributing to high academic performance at
secondary school level concluded that to have a high academic Performance, the
management must be efficient and quite cooperative. They also went further and said
that involvement of teachers and students in managerial matters produced high13

academic performance.
On the other hand Davis, Darling and Deyerson (2005), conclude that there is a
growing consensus on the attributes of effective school principals which shows that
effective school leadership influence students achievements through support and
development of effective teachers and the implementation of effective organizational
process. They further outlines three sets of core leadership practices. Developing
people which refers to enabling teachers and other staff members to do their job
effectively, offering intellectual support and stimulation to improve the work and
provide model of practice and support. They mention setting direction for the
organization performance and promoting effective communication and redesigning
the organization. This refers to creating a productive school culture, modifying
organizational structure that undermines the work and building collaborative process.
The research findings for other places as established in literature review cannot be
generalized for Tigania central division. This study therefore will seek to address
leadership commitment to setting policies and supervising teaching in classroom
which tend to be assumed roles by the leaders.
2.4 School Social Climate
School climate reflects subjective experiences in school, Cohen, (2006). According to
Stynon, (2008) a healthy school environment is created by supporting a healthy
relationship among the staff members. Healthy relationship produces a climate
conducive to honesty, open communication and risk taking. He further states that a
true learning community, cooperation and mutual respect is expected of faculty as
well as the students. Establishing a supportive environment increases self esteem and
achievement Cantwell (2003). Building a sense of community makes students more
apt to share perspectives of their teachers ultimately leading to increased academic
achievement, Parker, (2002). Lipsitz (1997) state that a warm adolescent centered
environment is friendly, relaxed, respectful, calm and energetic thus contributing to better academic performance.
Thomas and Bass (1992) hold to the view that, the overall School climate is enhanced
by positive behaviour and the attitude of students and teachers Samdal, Nutbeam,
Wold and Kannas (1999) agree that the students are contented with the schools where
14

they feel justly treated, safe and supported by the teachers. Makewa (2011) add that, a
School climate that is warm, welcoming, supportive and conducive to the learner exist
when all students feel comfortable, wanted, valued, accepted and secure in an
environment where they can interact with caring and trusting people Positive school
climate exist as an essential element in successful schools. Maine, (2004) as cited by
Makewa define school climate as the synthesis of policies, procedures, activities,
programmes and facilities both formal and informal within a school infrastructure that
affects the attitudes and behavior of all people in the school, staff, students, parents,
school personnel and the community. To Hoy and Miskel (1996) a school consists of
shared assumptions, values or norms while climate is defined as shared perceptions of
behavior.
According to Cohen,(2006), and Freiberg (1999) scholarly writing on school climate
suggests that there are ten essential dimensions that colour and shape our subjective
experience in schools; environmental; structural; safety; teaching and learning,
relationship; sense of school community; morale; peer norms; School-home
community partnerships; mutual support and ongoing community. Hoge, Smith,
Hanson, (1990), commitment to school and positive feedback from the teachers have
been shown to affect students self esteem and self concept. As cited in School climate
research summary, a series of research have shown a relationship between a school
climate and students absenteeism De Jung and Duckworth, (1986); Purkey and Smith
(1983) as well as predictive of rate of student suspension, Wu, Pink, Crain and Moles,
(1982). It further state that positive School climate is critical dimension linked to
effective risk prevention and health promotion efforts as well as teaching and
learning, Cohen, (2001). The conclusion is that safe, caring, participatory and
responsive school climate tends to foster great attachment to the school’s academic as
well as providing the optimal foundation for social, emotional and academic learning
One of the fundamental dimensions of school climate is relational and how connected
people feel to one another in school. Mcneely, Nonnemaker and Blum, (2002) and
Whitlock, (2006) Suggests that connectedness is a powerful predictor of adolescent
health and academic outcome. Karcher (2002) and prevention of violence, Catalano
Haggarty, Oesterie, Fleming and Hawkins (2004) a protective factor in risky, sexual
violence and drug abuse use behaviour. School climate promotes or complicates ■ . . 15

meaningful student learning. Activities like community sendee and debates enhance
the learning environment by providing student opportunities to effectively participate
in learning process and construct their knowledge of social and government system,
Purta (2002).
A positive School climate promotes students’ ability to learn in that they feel safe,
cared for, approximately supported and lovingly pushed to learn, therefore improving
academic achievement. It promotes cooperative learning, group cohesion, respect
mutual trust or climate for learning, (2003). According to Edgerson and Krtsonis,
(2006), it is important for the principals and various faculty groups to work together
for mutual support. Wheeland and Kessering (2005) add that the manner in which
faculty members worked together as a group, significantly influenced students’
outcome in school.
Disney the outstanding teacher of the year, 2000 in America is quoted by Clark
(2003), state that life is all about experiences, the ones you make for others. To
students he says, guide them in every way as they grow, show them in every way
possible that they are cared for, motivate and make special moments for them that will
add magic to their lives and that of the others and most important to make them love
life. Edgerson and Kristsonis (2006) also agree with such an environment and also
conclude that the most successful teacher may be the one inspired by the beautiful
relationship developed with their principals, thus motivating them to do their best.
With the above background more information need to be sought on the interaction or
relationship between teachers and students, teachers and the school principal and the
school with the neighbours. The findings for the other places cannot be generalized
for Tigania central division. Therefore this raises need to investigate school climate
influence on academic performance in the region.
2.5 Teacher characteristics
The quality of education depends on the teachers as it is reflected in their performance
of the duty Akiri, Nkechi and Ugborugbo (2009). Teachers have been shown to have
an important influence on students’ academic achievement. According to Afe, (2001)
as cited by Akiri and Ugborugbo, teachers play a crucial role in educational
attainment because they are ultimately responsible for translating policies into action16

and principles, based on practice during interaction with the students. Akinlenye
(2001) and Commeyras (2003) as cited by Oluwadare assert that experience improves
teachers, teaching skills while students learn better in the hands of teachers who have
taught them continuously over a period of time.
Overtime students’ academic performance in internal and external examinations had
been used to determine excellence in teachers and teaching Ajao (2001). Oluwadare
(2011) state that quality of teacher is related to the level of students’ academic
performance for the Schools to be efficient and effective. Zuzovsky (2003) assert that
quality teachers are often simply seen as good teachers and are considered to be those
who exhibit desirable traits and uphold standards and norms of the profession and
bring about students learning. As cited by Berliner (2005) Fenstermacher and
Richardson states that good teaching means the content taught accords with
disciplinary standards of adequacy, completeness and the method applied are age
appropriate, morally defensible and undertaken with an intention of enhancing the
learners competent with respect to the content. According to Uchefuna (2001) an
effective teacher has been conceptualized as the one who produces desired results in
the course of his duty as a teacher. That is to say that, successful teaching refers to
what the learner acquires which is reasonable and acceptable level of proficiency from
what the teacher is engaged in teaching.
Zuzovsky cites Goldhabar and Brewer (2000) who agree that there is a positive
relationship between teachers preparation in subject matter they teach and students
academic achievement. It is revealed from various studies that there is a relationship
between teachers’ effectiveness and their years of experience but the level is off after
a few years Rivkin, Hunushek and Kain (2000). Zuzovsky (2003) asserts that
participation in professional development activities help the teacher update their
content, knowledge and teaching skills, so that they can meet the requirement of
curricula, consider new research findings on teaching and learning and adapt to changes in need of the student population.
According to Ofeogbu (2004) poor academic performance of students in Nigeria has
linked to poor teacher s performance in terms of accomplishing the teaching
negative attitude to work and poor teaching habits which have been attributed to17

poor motivation. Pakistan Government (1998) is categorical in stating that academic
qualification, knowledge of the subject matter, competencies and skills and the
commitment of a teacher have an impact on the teaching process. This statement is
supported by Dahar (2011) who say that Academic qualification, professional
qualification, refresher course or training and teacher experience are the important
qualities of a teacher.
Olatunde (2009) is of the opinion that the teacher is the most indispensable factor in
effective administration of any education system. Ofofiiena (1999) support the same
idea by stating that no matter the amount of resources we might put into the nations
education system without properly prepared and motivated teachers we can never
expect from the system. Olatunde (2009) also argues that it is in the teacher’s
competence, ability, resourcefulness and ingenuity to efficiently utilize the
appropriate language, methodology and available instructional materials to bring out
the best from the learners in terms of academic achievement. Teachers are said to be
effective when their teaching can lead to student leaning Abimbada (1999). Teachers
are invariably role models whose behaviors are easily copied by students.
Eso (1998) conceptualizes teacher’s effectiveness as the managerial skills essential for
enhanced classroom control and discipline. The teaching - learning process revolves
around the teacher with him taking the lead in process Ashibi (2005). The teacher
influences the students by the way he handles them, by being autocratic, Democratic
or laissez faire which has a wide implication on classroom management and great deal
of influence on the students. The teacher wields authority over the students and
therefore has power to take decisions which influences the students’ action.
According to Gronund (1985) meaningful learning is achieved when teachers and
students interaction is in harmony, since instructional processes involve them. This
therefore means teacher’s behaviour is the central determinant of student’s outcome
The characteristics of a teacher determine his effectiveness in his work while effective
teaching is a predictor of students’ academic achievement Onyeachu (1996)
nclude that teaching effectiveness has been accepted as a multidimensional
ct since it measures a variety of different aspects of teaching such as subject
mattery, ective communication, lesson preparation and presentation. In the light of18

the above studies, it is true that the teacher plays a very important role in determining
students’ academic performance. The researcher was therefore out to investigate the
situation in Tigania central division by looking at teachers’ experience, work
preparation, task commitment as generalization from studies conducted in other areas
cannot for all the situations.
2.6 School Population.
School size increases with increase in enrolment which becomes a challenge to
provision of other facilities like classrooms, dormitories, books, space and low
classroom utilization rates. According to Owoeye (2011) school population increase
class size and therefore the performances of a student becomes an issue. Research
conducted by Fabumi (2000), point out the importance of teacher- pupil ratio to
cognitive learning in the school. The lower teacher pupil ratio allows for effective
communication between the learner and the pupil. Studies conducted by Idienumah
(1987) reported that there is a positive relationship between certain variables such as
class size, teacher pupils’ ratio to student’s performance in Examination. Large
classes pose problems like difficulty in providing opportunity for discussion or for
any other kind of oral input to written work. He also point out that the amount of
marking involved can dissuade even the non enthusiastic teacher from setting the
amount of written work that he feels would benefit the students.
In depth analysis of previous schools size research by cotton (2001) concluded that
smaller schools produce better academic results and provide better climate. This is
supported by Raywid (1999) who has further pointed out that the studies indicate
smaller schools allow more opportunities for students to be involved in co-curricular
activities and offer more personalization and individual attention than larger size.
Howley (1996) argue that, though it first appears that large schools are more cost
effective to operate if the drop out graduation rate is taken into consideration smaller
schools actually are more cost effective to operate According to Fabunmi, Abu and
denija (2007) the lower teacher pupil ratio allow for more effective communication
between the learner and the teacher, thus making it one of the most important factors
t determine good academic performance of the students. Smith and Glass as cited
y Oweoye (2011) state that compared to larger classes, small classes lead to higher
achievement, more favourable teacher effect (morale, attitude towards19

students) greater attempts individualized instruction, a better classroom climate and
more favorable student effects.
According to Owoeye (1991) study conducted in Ekiti state schools with a small
number of students recorded better results than schools with larger student’s
population. Slate and Johns cite monk (1987) having found that after a school
enrolment reached 400 students, no benefits were realized. Thus confirming the
statement that increasing size of a school initially brings positive relationship but the
trends are reversed as the size continues to increase. Abbott, Jolteman and Stroh
(2002) cites Bracy having noted that large schools especially high schools produce
their own set of problems which a growing number of researchers and policy makers
think can be solved by returning to small schools. In support of small schools
argument is raised that they raise students academic achievement especially for
minority and low - income students, they reduce incidences of violence and
disruptive behavior. Small schools combat anon mighty and isolation and conversely
increase the sense of belonging. They also argue that small schools increase
attendance and graduation rates, they elevate teacher satisfaction and improve school
climates. They operate most cost effectively, increase parents and community
involvement and reduce the amount of graffiti on school building. A combination of
the above factors contributes to high academic achievement Abbolt, Joireman and
stroh. (2002).
UNTC Secondary section (1990) has identified the following encouraging results
from reducing class size and improving instructional methods. They state that smaller
class result in increased teacher student contact, students show more appreciation for
one another and more desire to participate in classroom activities more learning takes
place, foster greater interaction among students helping them understand one another
and increase their desire to assist one another. They add that smaller classes allow for
potential disciplinary problems to be identified and resolved quickly, they result in
higher teacher morale, reduced stress less retention fewer referral to special education
and fewer drop out are the ultimate rewards of class size reduction.
esearch by lee and Loeb (2000) in Chicago found that school size influenced
CntS achievement both directly and indirectly. They reported that teachers in20

small schools (less than 400 students) take more responsibility for students’ academic
and social development and that in turn enhances students’ achievements. They noted
that small schools facilitate more intimate and personal relationship among teachers
and students, a relationship that impacts students learning. Waslsey, Tine, Gladden,
Holland, King Mosak and Powell (2000) research in Chicago public schools, revealed
that small schools increase attendance, Students persistence performance, graduation
rates, course completion and parents, teachers, students and community satisfaction.
Adeyela (2000) in her study found that large class size is not conducive for serious
academic work. The same is supported by Yala (2010) who found that the
performance of students in large classes in mathematics was very low compared to
those in smaller classes.
In contradiction to the above findings some other researches give a completely
different answer to the problem. Campbell (1990) conducting a study in united states
remarked that students from large schools were exposed to large number of school
activities and the best of them achieved standards that were unequalled by students in
small schools. Bolton (1988) confirms that there was no relationship between larger
classes and small classes which were found to be negatively related to school
academic performance. He also found that there is no significant difference in post
test achievement scores between large classes and small class control group in
developmental English.
A study conducted by Hoagland (1995) in California Oata suggested that in high
schools beyond a certain size, students may not do well in reading performance and
that students in poverty may perform better in smaller schools. But statistical analysis
led the researcher to conclude that no correlation existed between student’s
performance in mathematics and writing and school size. Advocates of school
consolidation have argued that the ideal high school should have between 1000 and
2000 students because schools with fewer than 1000 students are unable to purchase
in quantity and have high per pupil administrative cost Fox (1981). They argue that
large schools can offer a broader range of courses including more advanced courses
than small schools. A major assumption of the economies of scale argument is that
ced per pupil expenditure translates into greater student achievement because the
030 be invested in improving the school. From the researches as21

captured in literature review, there is need to assess the impact of the school
population on students academic performance in secondary schools in Tigania central
division. To get the situation of the area the study will consider the number of
students in class, their entry behaviour and the students book ratio as information
from other findings cannot be generalized for the area.
2.7 School location
Ojoawo (1989) found that location is one of the potent factors that influence the
distribution of educational resources. Lack of suitable school location has contributed
to the imbalances of western education from one part of the country to another in
Nigeria. Zike (1997) state that urban environment is conceptualized as those
environments which have high population density containing a high variety and
beauty and common place views On the other hand rural community is characterized
by low population, subsistence mode of life which is monotonous and burdensome.
As established by Owolabi (1990) highly qualified teachers prefer to serve urban
rather than rural areas because their conditions are not up to expected standards. He
points out that parents in the rural areas refuse to send their children to school,
because they depend on them for help at home. Some parents fail to entrust their
daughters to male teachers, and the fact that some areas are inaccessible which act as
a stumbling block to effective learning in rural areas. Mbakwe (1986) the teachers
who land in rural areas seek deployment in urban areas which tend to be more
concentrated with more facilities and better services.
Boylan (1998) found that rural schools were inferior and lacking the range of facilities
with high staff turnover and suffered from lack of continuity in their curriculum.
Omisude (1985) also observed a significant positive relationship between size and
location of schools and performances in examination in Ogo state He concludes that
large schools in urban areas tend to perform better in examinations than small schools
in rural areas. According to Owoeye (2011) some people enjoy minimum travelling
stances to acquire education while others in other places suffer by having to cover
*mum ^’stances to get to their schools which contribute to variation in academicTftfm umfice of the students. Therefore this study is based on how school location interms whether they are mr^i ~ ,
“~rai or urban based contribute to students’ academic22
performance in secondary schools in Tigania Central Division of Tigania East District
to establish the truth about the situation in the area for the findings in other places
cannot be generalized to apply in Tigania.
2.8 Conceptual framework
The framework Figure 1 highlights the relation between independent variables that
determine academic performance which is the dependent variable. The indentified
independent variables in the framework are school leadership which looks at the
aspect school policies, supervision of teaching and provision of school equipments.
School climate relationship is the second aspect of independent variable that is
considered under this study which explores on teacher-student relationships,
principal- teachers relationship, school interaction with the neighboring community
and student - student relationship. The third independent variable is the teachers
character which looks at the teacher’s period of service, work preparation,
commitment to task and qualification as they influence on the learners’ academic
performance. The framework also considers school population as the fourth
independent variable which looks at the number of students in class, their entry
behaviour, and their relationship with the available books as part of school resources.
The last independent variable is the school location which considers on whether the
school is rural or urban based. The researcher identifies Government and stakeholders
like the sponsors, parents or the student themselves as moderating variables that
influences the results but the researcher has no control over them.
23

Independent variables Moderating variable
Figure 1: Conceptual Framework
24

2.9 Summary
The literature review has established that high performing schools have well
established systems with committed principals, students and teachers. It is noted that
school leadership is essential in running an effective and high performing schools.
School climate that promote healthy interaction is associated with high academic
achievement. Teachers are established to be crucial in effective curriculum
implementation which plays essential roles that determine students’ academic
achievement. It is also noted that schools and classes with large population pose a big
challenge to high academic achievement. School location also plays a contributive
factor to determining academic performance. These are situations that cannot be
generalized to explain the situation of low academic achievement of secondary
schools in Tigania central division of Tigania East District in Meru County. The study
therefore seeks to fill the gap of giving an account of influence of school
characteristics by investigating school leaders innovativeness in setting policies and
implementing them in schools and supervising of classroom activities. The study
tends to provide information on school climate by investigating relationship between
principal and teachers, teachers and students and teachers and students and students.
The study investigates teacher characteristics concentrating on their period of service,
work preparation and academic qualifications which are essential elements for
effective performance but not effectively investigated for Tigania central division.
Other characteristics given more attention are school population giving more attention
to number of students per class and their impact on the resources and the school
location in terms of whether rural or urban based influence on students’ academic achievement in the division.
25

CHAPTER THREE
RESEARCH METHODOLOGY.
3.1 Introduction
The chapter deals with a simple description of the methodology that was used in order
to collect data to meet the research objectives of establishing the influence of school
characteristics on students’ academic performance in Tigania central division of
Tigania East district. It gave the details of the research design, target population,
sample size and sampling procedure. It also looked at the instruments or the tools and
the procedure that were to be employed in collecting data in the field and the
measurements of variables and techniques that were to be used in analyzing data and
the presentation method.
3.2 Research design
A descriptive survey was used during this research, which facilitated the description
of the state of affairs as they were and the causes of the situation in terms of school
characteristics which influence on students’ academic performance in Tigania central
division public secondary schools.
3.3 Target population
The target population for this study comprised principals and teachers of both public
boarding and day secondary schools in Tigania Central Division of Tigania East
District in Meru County. There are 12 public secondary schools in the division 3 of
which are boarding while 9 are day secondary schools. The total numbers of teachers
in the division who are engaged in teaching including the principals are 138 which
then give the total target population for this study. The principals and teachers were
the main target during this study for they play a major role in determining what
ppens in schools and interact with students, parents and the neighboring school
community. They were therefore better suited to give the necessary information that
was required during this study. The details are shown in table 3.1.
26
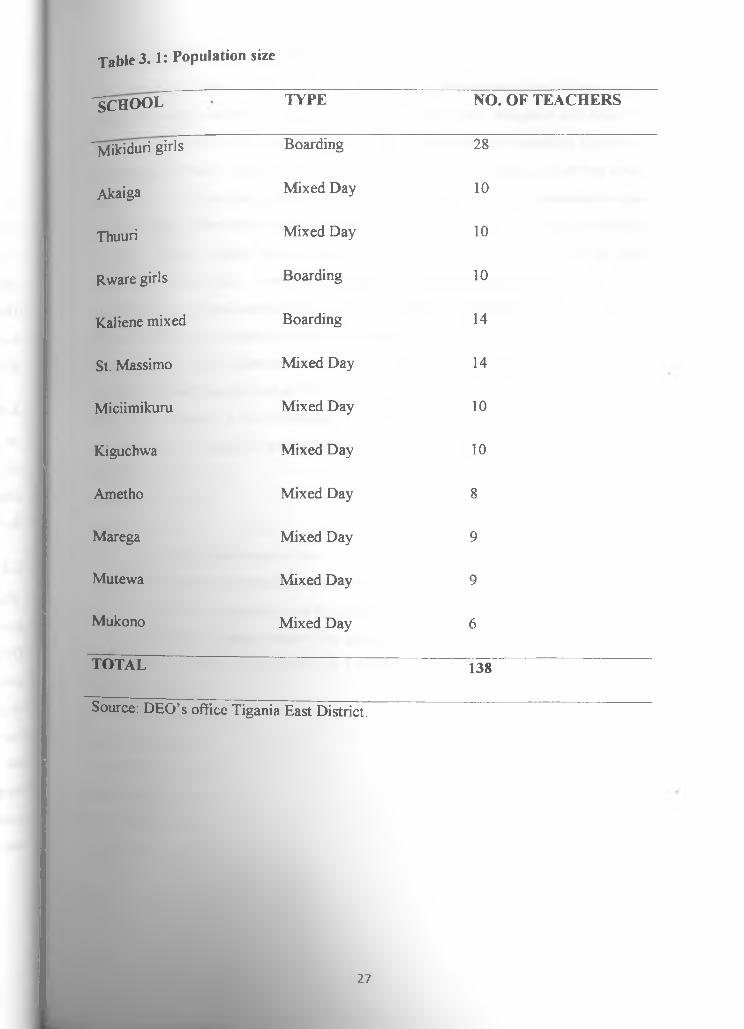
Table 3 .1: Population size
I^c h o o lT TYPE NO. OF TEACHERS
'Mikidurigir!s Boarding 28
Akaiga Mixed Day 10
Thuuri Mixed Day 10
Rware girls Boarding 10
Kaliene mixed Boarding 14
St. Massimo Mixed Day 14
Miciimikuru Mixed Day 10
Kiguchwa Mixed Day 10
Ametho Mixed Day 8
Marega Mixed Day 9
Mutewa Mixed Day 9
Mukono Mixed Day 6
TOTAL 138
Source: DEO’s office Tigania East District.
27
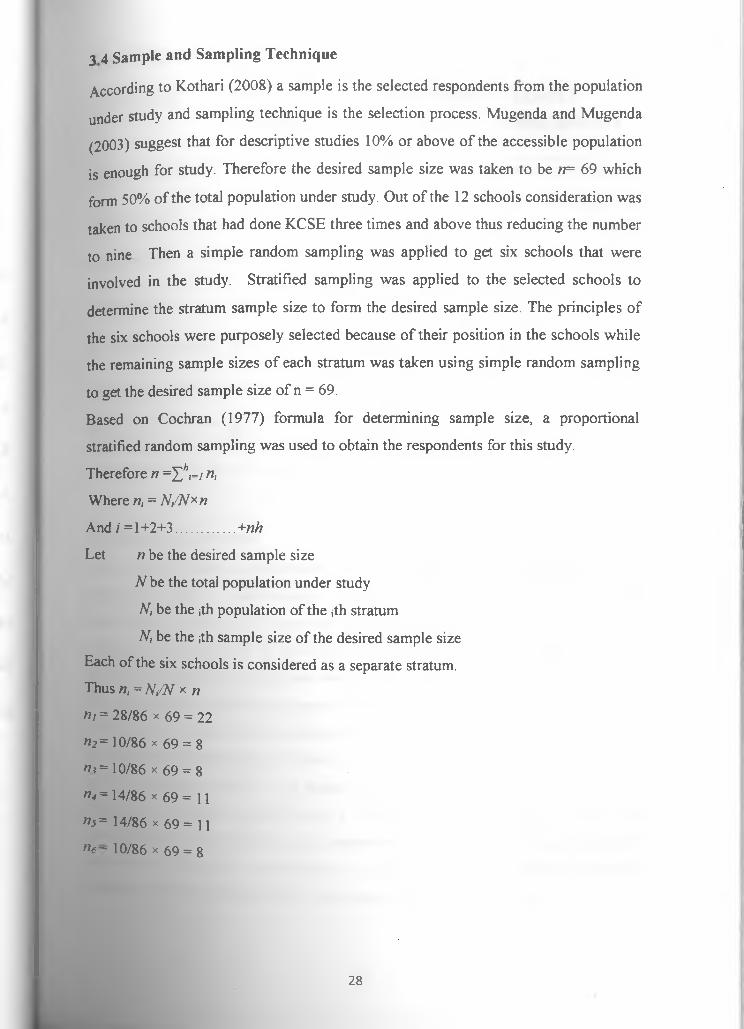
According to Kothari (2008) a sample is the selected respondents from the population
under study and sampling technique is the selection process. Mugenda and Mugenda
(2003) suggest that for descriptive studies 10% or above of the accessible population
is enough for study. Therefore the desired sample size was taken to be n= 69 which
form 50% of the total population under study. Out of the 12 schools consideration was
taken to schools that had done KCSE three times and above thus reducing the number
to nine Then a simple random sampling was applied to get six schools that were
involved in the study. Stratified sampling was applied to the selected schools to
determine the stratum sample size to form the desired sample size. The principles of
the six schools were purposely selected because of their position in the schools while
the remaining sample sizes of each stratum was taken using simple random sampling
to get the desired sample size of n = 69.
Based on Cochran (1977) formula for determining sample size, a proportional
stratified random sampling was used to obtain the respondents for this study.
Therefore n =Zhi=i n>Where «, = N,/N*n
And i =1+2+3.............. +nh
Let n be the desired sample size
N be the total population under study
N, be the jth population of the ith stratum
Nj be the jth sample size of the desired sample size
Each of the six schools is considered as a separate stratum.Thus n, = N/N * n
ni = 28/86 x 69 = 22
"2= 10/86 x 69 = 8
"<=10/86 X 69 = 8 n4= 14/86 x 69= 11 ns = 14/86 x 69 = 11
n6~ 10/86 x 69 = g
3 4 Sample and Sampling Technique
28

Table 3. 2: Sampling Frame
"CATEGORY TOTAL
NUMBER
SAMPLE SIZE SAMPLE
PERCENTAGE
"Mikinduri Girls 28 22 16
Akaiga Mixed 10 8 6
Rware Girls 10 8 6
Kaliene Mixed 14 11 8
St. Massimo Mixed 14 11 8
Miciimikuru Mixed 10 8 6
TOTAL 86 69 50
3.5 Research Instruments
The researcher used a questionnaire for both the principals and the teachers. The
researcher found a questionnaire more appropriate because it is free from
interviewer’s biasness and provides the respondent room to give well thought
answers. A questionnaire is quite popular particularly in case of big inquiries. It
allows large sample to be used thus making the results more dependable and reliable.
The instrument is useful for the people who seem to be busy for personal interview
method and to distribute to the respondents at their working and collect them back.
The questionnaire had section A which covered details of the respondent, section B on
school leadership, section C on school climate, Section D on nature of teachers,
Section C on school size and Section F on the school location. The researcher also
carried out an observation on school programmes, students’ conduct and the general
appearance of the school environment to supplement to the data obtained from the
Questionnaire He obtained KCSE results analysis for the last three years.
29

3.5.1 Instrument validity
According to Mbwesa (2006) validity of research instrument refers to the extent to
which a test or an instrument measures what it is intended to measure. It is the
accuracy and meaningfulness of inferences which are based on research results. It is
the degree to which results obtained from the analysis of the data actually represents
the phenomena under study. The researcher prepared a questionnaire for both the
principals and teachers, an observation chart and KCSE result analysis score sheet
that were used to obtain data from the field. The researcher sought guidance from the
supervisors who are experts in the field to help improve on the validity of the
instrument. The researcher conducted pre-test to help identify the weaknesses of the
instruments and improved them where necessary.
3.5.2 Instrument reliability
Reliability is the measure of the degree at which the research instrument yields
consistent results after repeated trials. To test the reliability of the instrument the
researcher conducted a test retest on a group of two teachers and two principals of the
schools that were not involved in the actual research work and filled the questionnaire
and carried the observation After two week the same exercise was repeated.
Inferences were made and similar responses were obtained for the two occasions
when the instruments were used thus terming them as reliable.
3.6 Data collection procedure
The researcher sought research clearance from the University of Nairobi a copy of
which was attached to each questionnaire in order to create confidence in case
respondents doubted the intent for the study. There after questionnaires and KCSE
score sheet were hand delivered by the researcher to schools from where particular
respondents were identified. The researcher was readily available to give guidance
and clarity for successful completion of data collection as planned. The researcher
collected back the questionnaires and KCSE score sheet after a period of one week.
The researcher also carried out an observation on various items in various institutions
and filled what was and was not observed during the field research. This was meant to
suPplement what was obtained through the use of questionnaires The data obtained
uoth qualitative and quantitative in nature
30

The researcher collected the filled up questionnaires, confirmed the number and
ensured that they were fully filled up. He edited questionnaires to ensure that they
were completely filled up and that all the answers were consistent, legible, uniform
and accurate. The gaps for missing data were filled up by consulting the respondent
for completeness or filling the obvious missing information. The researcher organized
the data in terms of the instruments used that is the questionnaire, observation and
K C S.E result analysis for the last three years. The researcher then conceptualized
the respondents’ information and classified it into meaningful and relevant categories
for the purpose of analyses. The categorization was based on the themes that were
developed as per the research questions based on relation between school
characteristics and students academic performance. The researcher then used
descriptive statistics to arrange order and manipulate the data. To allow easy
punching and computation and storage of information using a computer statistical
package of social sciences (SPSS) the researcher assigned a code number to each of
the research questions. Descriptive statistics was used which involved arranging,
ordering and manipulation of data to provide descriptive information. The data was
presented in form of tables showing frequency and percentage distribution.
3.8 Operational definitions of variables
These were variables that influence the Students performance in secondary schools
These included school leadership, school climate, nature of teachers, size o f the
school and school location which all determine the students’ academic performance in secondary school.
3 7 Data analysis and presentation
31

Table 3. 3: Operational definition of Variables
Objective Type of variable
Independent
variable
Indicators Measure
nient
Data
collection
Lev<
scab
To determine the
influence of school
leadership on
students academic
performance in
Secondary Schools.
Leadership skills. Implementation
of School rules
and policies.
Number
of
indisciplin
e cases
handled.
Questionnaire.
Observation
Ordi
Class attendance
register.
Classroom
register.
Number
of entries
in class
register
Questionnaire. Ordi
Communication
skills
Flow of
information
Number
of conflict
cases
reported
Questionnaire.
Observation
Ordi
1 ____________________
Principal-teachers 1 relationship
Studentperformance
Schoolmean
Questionnaire Ordir

score
To examine the
influence of schools Teacher-Student Minimal student Number Questionnaire. Ordiclimate on students relationship indiscipline of
academic cases. students
performance
In Secondary
punished
Schools Student-Student Level of The Questionnaire. Ord
relationship communication. number of
reported
student to
student
conflicts

To establish the
influence of teacher
characteristics on
students academic
performance in
Secondary Schools.
To find out the
influence of the
school population on
the students’
academic
performance secondary schools.
Teachers
experience
Teachers lesson
preparation
Teacher
academic/professio
n qualification
Students
distribution
classes
in
Resource
Period
service
of
Level of
preparedness.
Level of
education
attained
Class register
Number of
years in
teaching.
Class notes
and schemes
of work.
Academic
certificates
No of
students
recorded per
class
Deliveryrecords
Number of items per
Questionnaire.
Questionnaire
Questionnaire.
Questionnaire
1
Inten
Questionnaire.
Observation
Nomi
Ordii
Inter
Norn
Ratio

distribution student
To assess the Urban based Distance of Distance to Questionnaireinfluence of school Schools the school to school inlocation on students the Urban kilometers.academic center.performance in secondary schools. Rural based
Schools.Fao awayfrom urban-center ^
- „ o a■ ? “ s
d ~
Number of kilometers away from urban facilities
Questionnaire.
Observation
Norn
Nom
£1
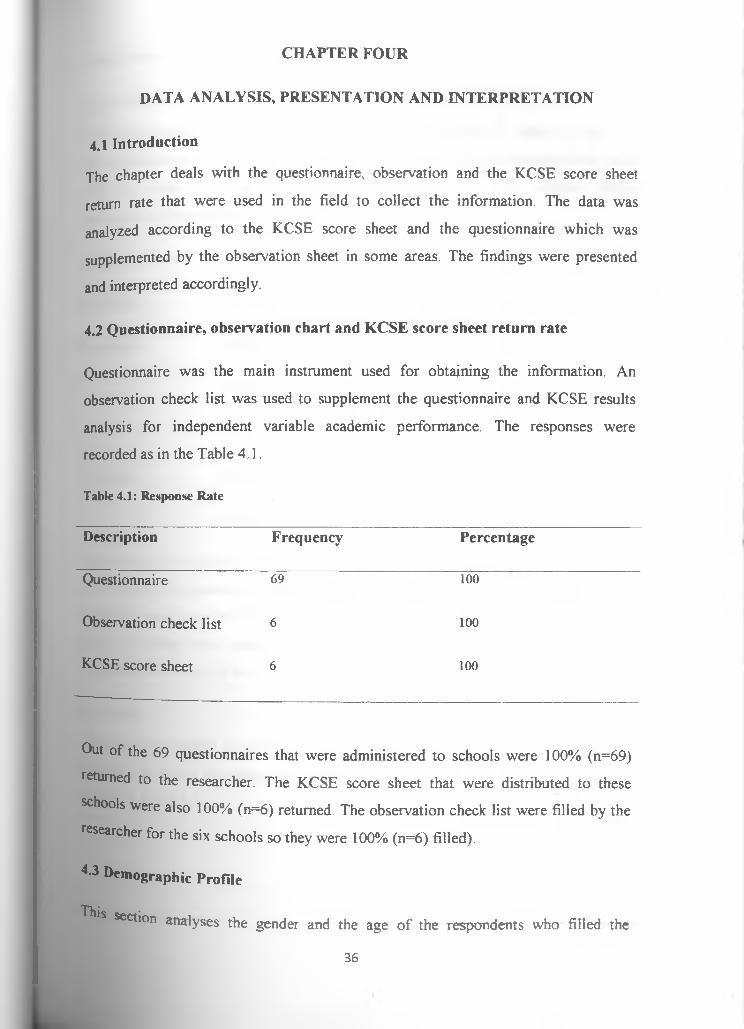
CHAPTER FOUR
DATA ANALYSIS, PRESENTATION AND INTERPRETATION
4.1 Introduction
The chapter deals with the questionnaire, observation and the KCSE score sheet
return rate that were used in the field to collect the information. The data was
analyzed according to the KCSE score sheet and the questionnaire which was
supplemented by the observation sheet in some areas. The findings were presented
and interpreted accordingly.
4.2 Questionnaire, observation chart and KCSE score sheet return rate
Questionnaire was the main instrument used for obtaining the information. An
observation check list was used to supplement the questionnaire and KCSE results
analysis for independent variable academic performance. The responses were
recorded as in the Table 4.1.
Table 4.1: Response Rate
Description Frequency Percentage
Questionnaire 69 100
Observation check list 6 100
KCSE score sheet 6 100
Out of the 69 questionnaires that were administered to schools were 100% (n=69)
returned to the researcher. The KCSE score sheet that were distributed to these
schools were also 100% (n=6) returned. The observation check list were filled by the
researcher for the six schools so they were 100% (n=6) filled).
4,3 demographic Profile
Thissection analyses the gender and the age of the respondents who filled the
36

questionnaire.
4.3.1 Gender
The respondents were required to indicate their gender in order to get the
representation of each of them This was also meant to provide a balanced view since
different sexes have different have different perception on various school
management issues. This is shown in Table 4.2.
Table 4.2: G ender
Category Gender Frequency Percentage
Principals Male 1 16.7
Female 5 83.3
Teachers Male 42 66.7
Female 21 33.3
Out of the six Principals who responded majority 83% (n=5) were females compared
to 16% (n=l) who were males. The opposite was established about the teachers where
majority were males 67.7% (n=42) double the number of females who were 33.3%
(n=21). Gender was meant to help the researcher to identify the category of
respondents in terms of sex.
4.3.2 Age
The researcher sought to establish the age bracket of the respondents. This was
supposed to enable the researcher to get age difference of the respondents. This is a shown in Table 4.3.
37
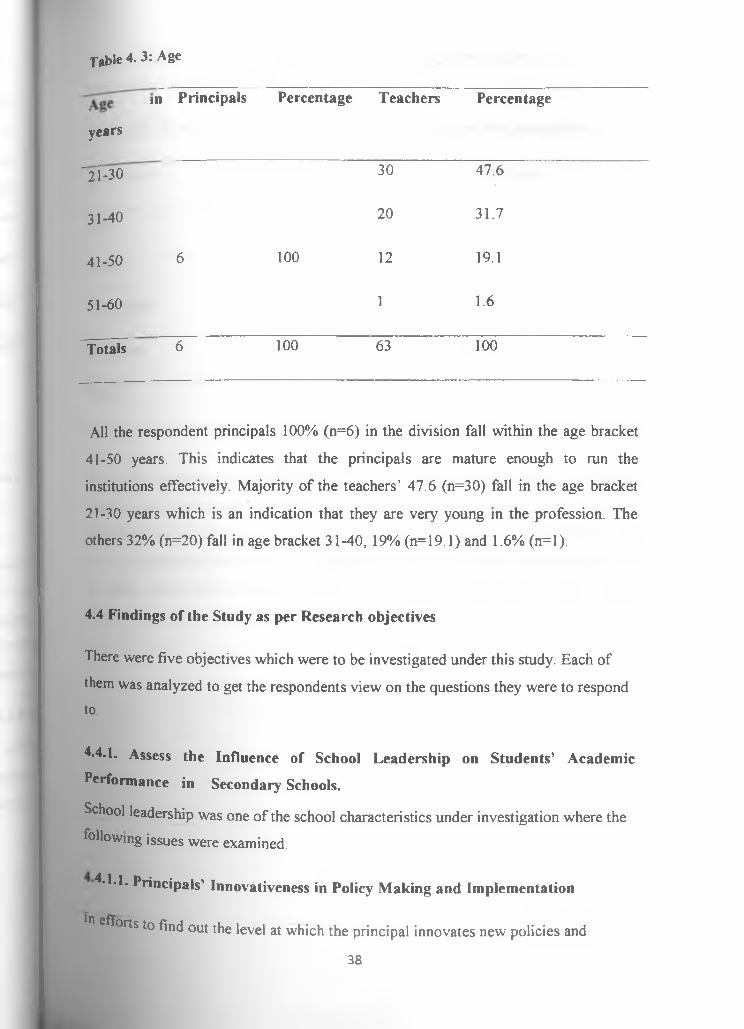
fable 4. 3: Age
,n
years
Principals Percentage Teachers Percentage
"21-30 30 47.6
31-40 20 31.7
41-50 6 100 12 19.1
51-60 1 1.6
Totals 6 100 63 100
All the respondent principals 100% (n=6) in the division fall within the age bracket
41-50 years. This indicates that the principals are mature enough to run the
institutions effectively. Majority of the teachers’ 47.6 (n=30) fall in the age bracket
21-30 years which is an indication that they are very young in the profession. The
others 32% (n=20) fall in age bracket 31-40, 19% (n=19.1) and 1.6% (n=l).
4.4 Findings of the Study as per Research objectives
There were five objectives which were to be investigated under this study. Each of
them was analyzed to get the respondents view on the questions they were to respond to.
4.4.1. Assess the Influence of School Leadership on Students’ Academic Performance in Secondary Schools.
School leadership was one of the school characteristics under investigation where the following issues were examined.
4.1.1. Principals’ Innovativeness in Policy Making and Implementation
JP®o*tsto find out the level at which the principal innovates new policies and
38

whether they are well implemented, the researcher sought the opinion of the staff
concerning the same. Details are shown in table 4.4.
Table 4.4: Principal’s innovativeness in policy making and implementation
^Description Frequency Percentage
Bad 1 1.6
Good 33 52.3
Very good 19 31.2
Excellent 10 15.9
Total 63 100
From the responses received 52% (n=33) of the staff thought that the principals
innovativeness in policy making and implementation was good (fair), 31.2% (n=19)
rated the principal very good while 15.9% (n=10) gave an excellent rating while 1.6%
(n=l) gave badly as their view. This suggests that Principals have to go an extra mile
in being innovative in policy making and implementing them to effect higher
academic performance in the division.
39

4 4.1.2 Principal’s level of motivating and empowering teachers by offering
support and training.
In pursuit to establish the extent to which the principal motivates and supports the
teaching staff, the researcher asked the respondents to rate the principal’s level of
empowering teachers by providing them with the necessary support and training to
help them grow professionally. Details are shown in Table 4.5.
Table 4.5: Principal’s level of motivating and empowering teachers by offering
support and training
Description Frequency Percentage
Very low 0 0
Low 0 0
Average 23 36.5
High 29 46
Very high 11 17.5
Total 63 100
Out of the 63 teachers who responded, 46% (n=29) rated the principal as highly
empowering, 36.5% (n=23) gave an average rate and 17.5% rated the principals very
highly. The principals’ motivation and support to teachers determined the
performance of the schools. The low rating of principals with very high only 17.5
/o(n-ll) indicate the principals need to do more in order to motivate and empower
teachers by offering good support and training to help them grow into effective teachers professionally.
4Q

It was also important for the researcher to find out the level at which the principal
involves and incorporates the opinions of the other teacher in decision making in the
school This was to know how much opinion diversity is considered, the flexibility of
the set policies and the possibilities of their acceptance by the teachers and the other
staff
4 4 1.3. Principal’s involvement of other teachers in decision making
Table 4.6: Principal’s involvement of other teachers in decision making
Description Frequency Percentage
Very low 2 3.2
Low 2 3.2
Average 24 38.1
High 27 42.9
Very high 8 12.8
Total 63 100
Out of the 63 responses received from teachers, 42.9% (n=24) of them confirmed that
the principals of the schools in question highly involved the teachers in decisions
making, 38.1% (n=24) of them thought the involvement was average, 12.8 %(n=8)
rated it as very high, and 3.2 % (n=2) thought it is low and very low. From the
information gathered, it can be concluded that the principals of the various secondary
schools seek the contributions of the teachers in making crucial decisions though there
^ concentration between average and above average but with a low' percentage
** very high as shown on Table 4.6. This indicates that there is no total involvement of
e teachers in decision making thus contributing to the low academic performance in the division.
41
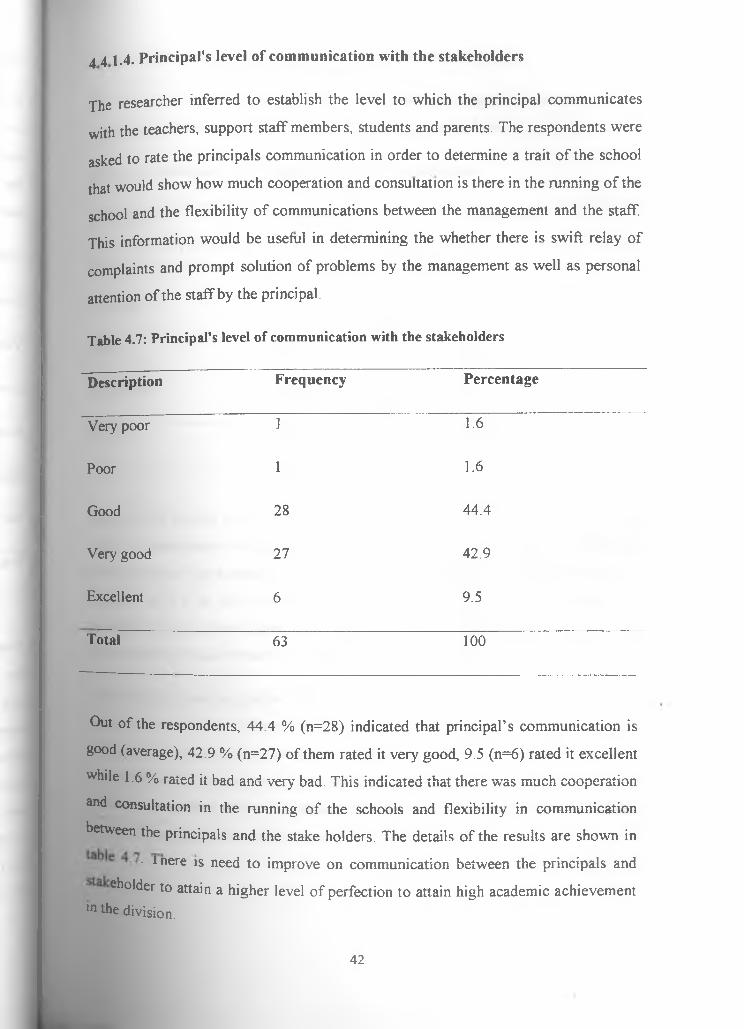
The researcher inferred to establish the level to which the principal communicates
with the teachers, support staff members, students and parents. The respondents were
asked to rate the principals communication in order to determine a trait of the school
that would show how much cooperation and consultation is there in the running of the
school and the flexibility of communications between the management and the staff.
This information would be useful in determining the whether there is swift relay of
complaints and prompt solution of problems by the management as well as personal
attention of the staff by the principal.
44 1.4. Principal's level of communication with the stakeholders
Table 4.7: Principal's level of communication with the stakeholders
Description Frequency Percentage
Very poor 1 1.6
Poor 1 1.6
Good 28 44.4
Very good 27 42.9
Excellent 6 9.5
Total 63 100
Out of the respondents, 44.4 % (n=28) indicated that principal’s communication is
good (average), 42.9 % (n=27) of them rated it very good, 9.5 (n=6) rated it excellent
while 1.6 % rated it bad and very bad. This indicated that there was much cooperation
and consultation in the running of the schools and flexibility in communication
between the principals and the stake holders. The details of the results are shown in
■ 1 uere is need to improve on communication between the principals and
bolder to attain a higher level of perfection to attain high academic achievement m ^ division.
42
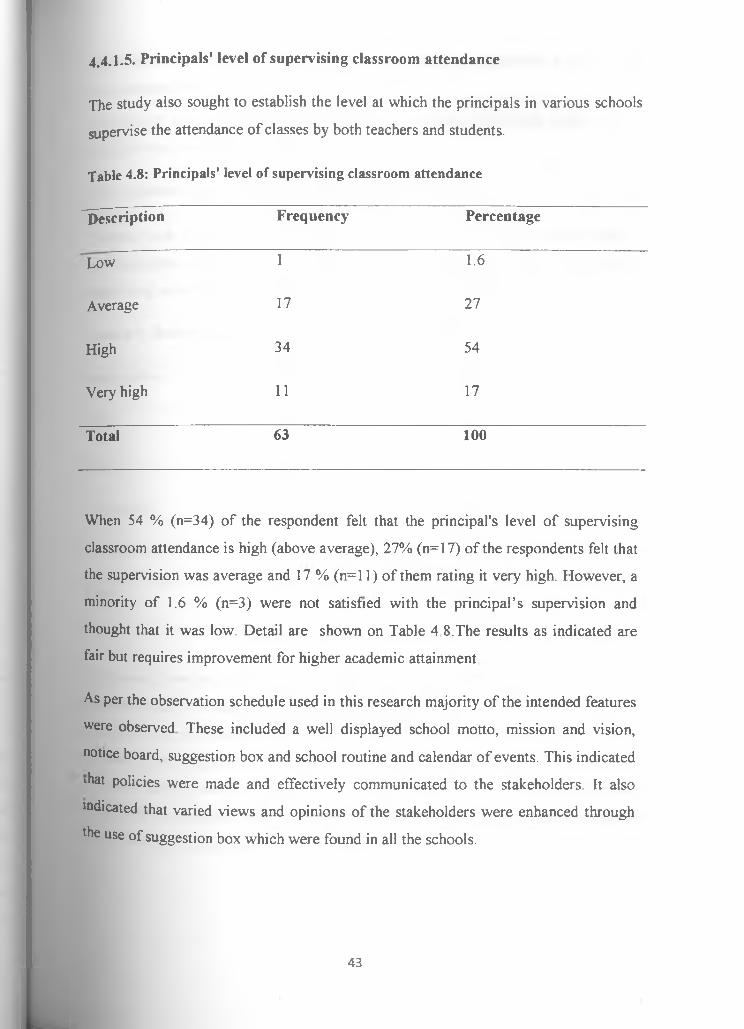
4.4.1.5. Principals' level of supervising classroom attendance
The study also sought to establish the level at which the principals in various schools
supervise the attendance of classes by both teachers and students.
Table 4.8: Principals' level of supervising classroom attendance
Description Frequency Percentage
Low 1 1.6
Average 17 27
High 34 54
Very high 11 17
Total 63 100
When 54 % (n=34) of the respondent felt that the principal's level of supervising
classroom attendance is high (above average), 27% (n=17) of the respondents felt that
the supervision was average and 17 % (n=l 1) of them rating it very high. However, a
minority of 1.6 % (n=3) were not satisfied with the principal’s supervision and
thought that it was low. Detail are shown on Table 4 8.The results as indicated are
fair but requires improvement for higher academic attainment
As per the observation schedule used in this research majority of the intended features
were observed These included a well displayed school motto, mission and vision,
notice board, suggestion box and school routine and calendar of events. This indicated
ihat policies were made and effectively communicated to the stakeholders. It also
indicated that varied views and opinions of the stakeholders were enhanced through
the use of suggestion box which were found in all the schools.
43

4 5.2 Examine the influence of school climate on students’ academic performance
in secondary schools
This was the second school characteristic that was included in the study under which
the following were investigated.
4 5 2.1. Relationship between the Principal and the teachers
The study also tried to establish the nature of the relationship between the principal
and the teachers and the level of the relationship. The respondents were asked to give
their rating on what they thought of their relationship with their principals.
Table 4.9: Relationship between the Principal and the teachers
Description Frequency Percentage
Bad 3 4.4
Good 32 46.4
Very good 25 36.2
Excellent 9 13
Total 69 100
The results show that 46.4% (n=32) of the respondents felt that the relationship was
good (average), 36.2% (n=19) believe that the principal relates very well (above
average) with the teachers, with 13 % (n=9) rating the relationship excellent.
However, there was a minority of 4.4% (n-2) that felt that the principal’s relationship
with the teachers was bad. Details are shown by Table 4.9. The results indicate that
any t ie respondents feel its average which means more efforts need to be done for promoting effective academic performance.
44

4.S.2.2 Students and teachers relationship
The researcher intended to get an indication of the nature of relationship that exists
between the teachers and the students. This was to help deduce the extent to which the
student body access personal attention for consultations from the teachers and the
willingness of the teachers to assist. The respondents were required to give an
indication of their opinions regarding what they thought the relationship was like. An
account of the feelings on the nature of relationship that exists between the teachers
and the students are shown in table 4.10
Table 4.10: Students and teachers relationship
Description Frequency Percentage
Bad 0 0
Good 31 49.9
Very good 31 49.9
Excellent 7 10.2
Total 69 100
The results indicate that 49.9% (n=31) of the participants thought the relationship was
good/average, 49.9% (n=31) of them believed that the relationship was very good
while 10.8% (n=7) felt that the relationship was excellence. More of the views ranged
between average and above average thus suggesting that more attention need to be
given to promoting a closer relationship to promote better performance.
4.5.2.3 Students’ level of interaction with the other students
Among the goals of the study was to establish the level of interaction that existed
among the students themselves. High levels of interaction would indicate the
Possibility of better performance since the students would be in a position to assist
^ch other through group discussions and person to person consultations. The45

respondents being the staff members, the researcher sought their opinions on the level
of interaction that they observed among the students. The results of the study are
shown in the table 4.11
Table 4.11: Students’ level of interaction with the other students
Description Frequency Percentage
Too low 0 0
Low 1 1.4
Average 30 43.5
High 26 37.7
Very high 12 17.4
Total 69 100
It was inferred from the respondents that the level of relationship that exists among
the students was 43.5% (n=30) average, 37.7 % (n=26) high and 17.4 % (n=12) very
high, and 1.4% (n=l) low. These results indicate that the level of interaction is
average. This suggest that there is need to promote the level of interaction among
students in the division which increase the possibility of better performance since the
students would be in a better position to assist each other through group discussions
and person to person consultations.
The researcher observed all the sampled schools had neat
hospitable which provided a good foundation of healthy
prerequisite of effective teaching and learning process
compounds and were
interaction that is a
46
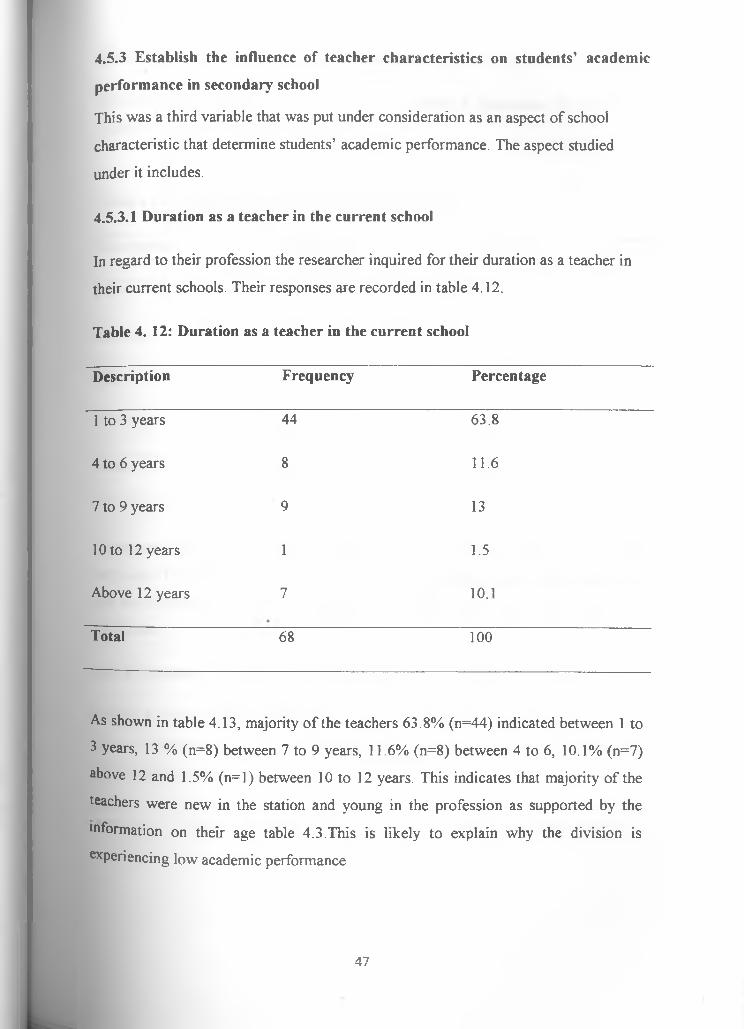
4.5.3 Establish the influence of teacher characteristics on students’ academic
performance in secondary school
This was a third variable that was put under consideration as an aspect of school
characteristic that determine students’ academic performance. The aspect studied
under it includes.
4.5.3.1 Duration as a teacher in the current school
In regard to their profession the researcher inquired for their duration as a teacher in
their current schools. Their responses are recorded in table 4.12.
Table 4. 12: Duration as a teacher in the current school
Description Frequency Percentage
1 to 3 years 44 63.8
4 to 6 years 8 11.6
7 to 9 years 9 13
10 to 12 years 1 1.5
Above 12 years 7 10.1
Total 68 100
As shown in table 4.13, majority of the teachers 63.8% (n=44) indicated between 1 to
3 years, 13 % (n=8) between 7 to 9 years, 11.6% (n=8) between 4 to 6, 10.1% (n=7)
above 12 and 1.5% (n=l) between 10 to 12 years. This indicates that majority of the
teachers were new in the station and young in the profession as supported by the
tnformation on their age table 4.3.This is lilcely to explain why the division is
experiencing low academic performance
47
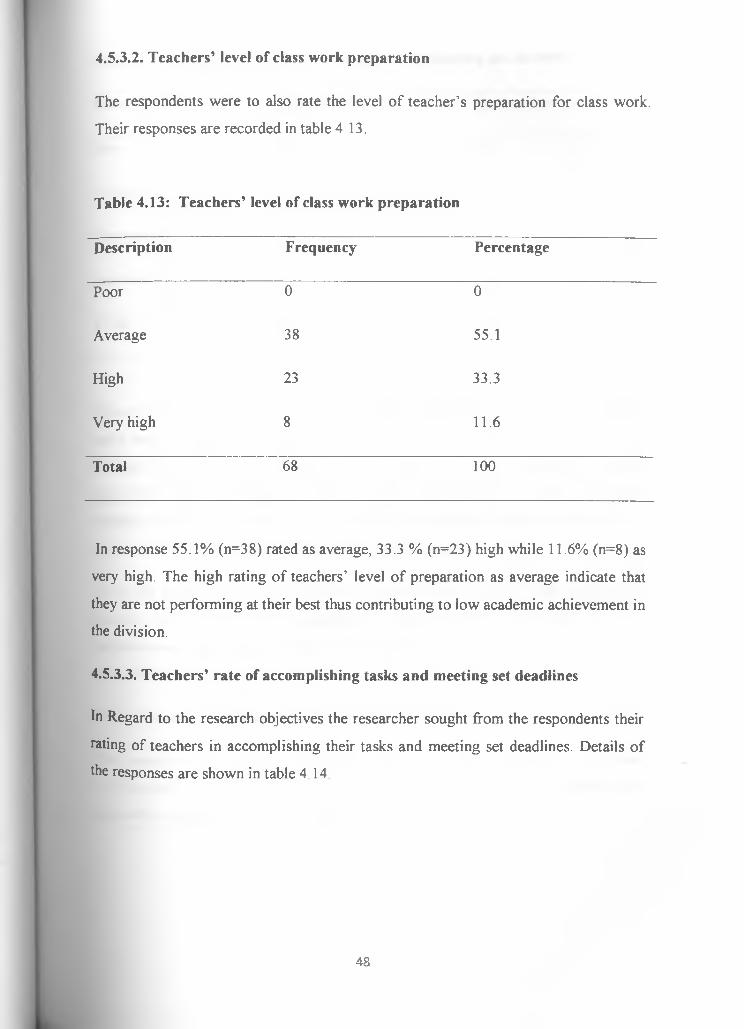
4.5.3.2. Teachers’ level of class work preparation
The respondents were to also rate the level of teacher’s preparation for class work.
Their responses are recorded in table 4.13.
Table 4.13: Teachers’ level of class work preparation
Description Frequency Percentage
Poor 0 0
Average 38 55.1
High 23 33.3
Very high 8 11.6
Total 68 100
In response 55.1% (n=38) rated as average, 33.3 % (n=23) high while 11.6% (n=8) as
very high. The high rating of teachers’ level of preparation as average indicate that
they are not performing at their best thus contributing to low academic achievement in
the division.
4.5.3.3. Teachers’ rate of accomplishing tasks and meeting set deadlines
In Regard to the research objectives the researcher sought from the respondents their
rating of teachers in accomplishing their tasks and meeting set deadlines. Details of
the responses are shown in table 4.14.
48

Table 4.14: Teachers’ tasks accomplishment and meeting set deadlines
Description Frequency Percentage
Poor 3 4.4
Average 39 56.5
Very good 22 31.9
Excellent 5 7.2
Total 69 100
Majority the respondents 56.5% (n=39) rated teachers level of accomplishing their
tasks and meeting set deadlines as average, 31.9% (n=22) very good or above
average, 7.2% (n=5) felt they are excellent while 4.4% (n=3) indicated that they are
poor. This clearly indicates that there is more that needs to be done to help the
teachers be more committed to accomplishing their task and meeting deadlines as set
as it would have negative impact on students performance.
From the observation table in majority of schools it w’as observed that teachers and
students were not swift in responding to the bells which indicated laxity in
implementing school programmes which affected schools academic performance as
established in the schools score sheet.
4.5.3.4 Teachers’ academic/professional Qualification
The researcher also inquired about the teachers’ level of academic/professional
qualification to establish how well they were suited to handling the curriculum in
schools for effective performance Table 4.15 has the details.
49

Table 4.15: Teachers’ academic/ professional Qualification.
Description Frequency Percentage Mean score
Diploma 9 13.1 5.3
Bachelor Degree 51 73.9 5.6
Masters degree 2 2.9 4.4
Others 7 10.1 4.7
Total 69 100
Out of the 69 responses received by the researcher, it was discovered that a majority
of the secondary school teaching staff 73.9 % (n=51) had a bachelor’s degree, 13.1%
(n=9) had a diploma, 2.9% (n=2) and 10.1 (n=7) fell in the category of others. This
indicate that majority of the teachers are qualified to teach in secondary schools as
required by TSC which hires teachers. Teachers with bachelor degree qualification
seem to perform better followed by teachers with a diploma qualification than any
other categories.
4.5.4 Investigate the influence of school population on the students' academic
performance in secondary schools.
School population was also included under investigation as a crucial aspect of school
characteristic that contribute to students academic performance
50

4.5.4.I. The number of student in the school
The research also sought to find out the number of students in the schools.
Table 4.16: The number of student in the school
Description Frequency Percentage Mean score
Below 100 0 0 0
101-200 1 16.7 4.6
201-300 3 50 5.o
301-400 1 16.7 4.6
401 and above 1 16.6 6.6
Totals 6 100
Out of the 6 schools that were sampled for the study, 50% (n=3) were noted to have a
population of between 201 to 300 students, 16.7% (n=l) for schools with a population
of between 101-200, 301-400 and 401 and above as shown in table 4.16. The table
also show's that schools with a big population perform better.
51

5.4.2. Average number of student per class
The respondents were further asked to give the average number of students in their
particular schools as per class. Responses are shown in Table 4.17
Table 4.17: Average number of student per class
Description Frequency Percentage Mean score
Less than 20 0 0 0
21-30 2 33.3 5.0
31-40 0 0 0
41-50 4 66.7 5.4
6 100
It was pointed in response by 66.7% (n=6) that they have an average of 41 - 50
students per class and by 33% (n=2) had within 21 - 30. The table indicates that
smaller classes tend to perform poorer than larger ones though the difference is not
much. The observation made by the researcher indicated that all the schools had neat
and uncongested classrooms which were conducive for effective teaching and
learning. «
4.5.4.3. Shortfall of Teachers Service Commission Teachers
The researcher inquired from the respondents the shortfall of Teachers Service
Commission teachers in the schools in order to get how well they were established in
terms of competent human resource that was serving in the school,
52
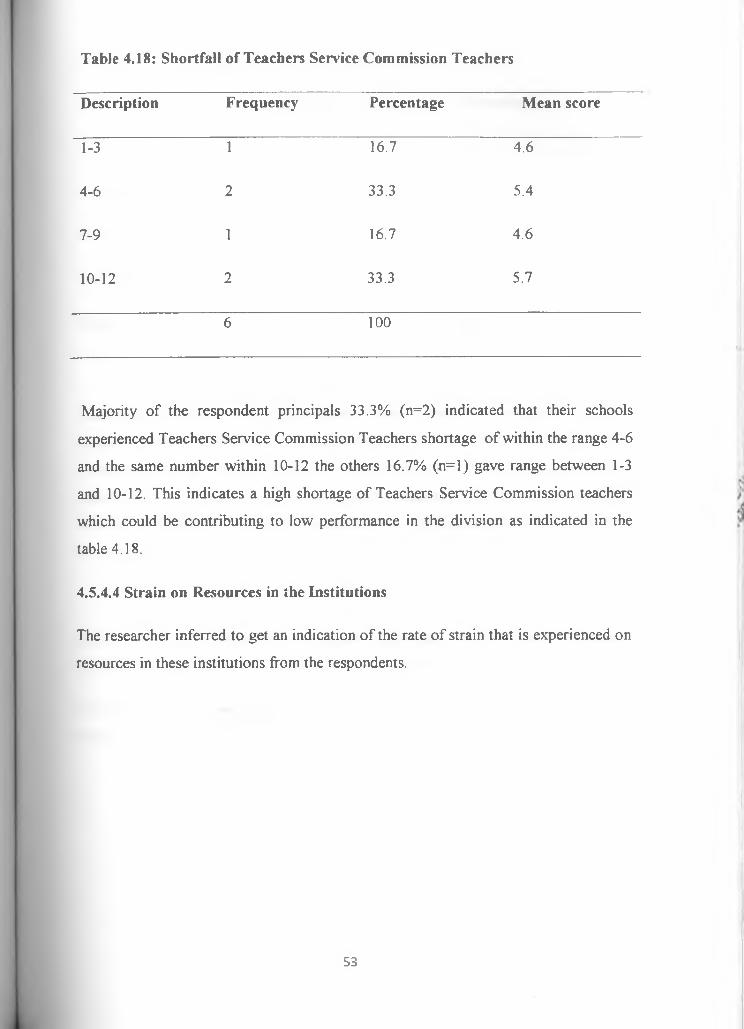
Table 4.18: Shortfall of Teachers Service Commission Teachers
Description Frequency Percentage Mean score
1-3 1 16.7 4.6
4-6 2 33.3 5.4
7-9 1 16.7 4.6
10-12 2 33.3 5.7
6 100
Majority of the respondent principals 33.3% (n=2) indicated that their schools
experienced Teachers Service Commission Teachers shortage of within the range 4-6
and the same number within 10-12 the others 16.7% (n=l) gave range between 1-3
and 10-12. This indicates a high shortage of Teachers Service Commission teachers
which could be contributing to low performance in the division as indicated in the
table 4.18.
4.5.4.4 Strain on Resources in the Institutions
The researcher inferred to get an indication of the rate of strain that is experienced on
resources in these institutions from the respondents.
53

Table 4.19: Strain on Resources in the Institutions
Description Frequency Percentage
Low 9 13
Average 38 55.1
High 20 29
Very high 2 2.9
Total 69 100
The result in table 4.19 show that the rate of strain caused on the resources is average
according to 55.1 % (n=38) of the respondents while 29.0% (n=20) rated it high. The
remaining 13 % (n=9) and 2.9 % (n=2) in turn rated level of strain as low and very
high respectively. This level of strain impacts on academic performance in the schools
in the division which are low as established from KCSE results analysis for the last
three years.
4.5.5 Assess the Influence of School Location on Students’ Academic
Performance in Secondary Schools in Tigania Central Division.
The research also sought to find out from the respondents the locality of the schools in
respect to whether it was urban or rural based.
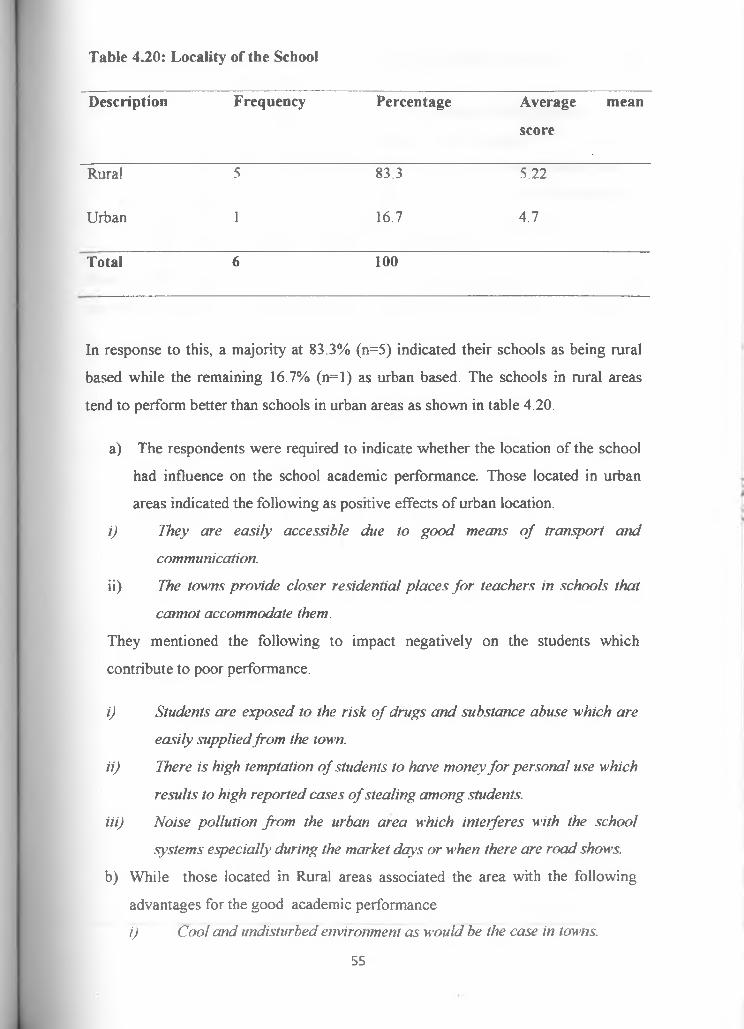
Table 4.20: Locality of the School
Description Frequency Percentage Average
score
mean
Rural 5 83.3 5.22
Urban 1 16.7 4.7
Total 6 100
In response to this, a majority at 83.3% (n=5) indicated their schools as being rural
based while the remaining 16.7% (n=l) as urban based. The schools in rural areas
tend to perform better than schools in urban areas as shown in table 4.20.
a) The respondents were required to indicate whether the location of the school
had influence on the school academic performance. Those located in urban
areas indicated the following as positive effects of urban location.
i) They are easily accessible due to good means o f transport and
communication.
ii) The towns provide closer residential places fo r teachers in schools that
cannot accommodate them.
They mentioned the following to impact negatively on the students which
contribute to poor performance.
i) Students are exposed to the risk o f drugs and substance abuse which are
easily supplied from the town.
ii) There is high temptation o f students to have money for personal use which
results to high reported cases o f stealing among students.
iii) Noise pollution from the urban area which interferes with the school
systems especially during the market days or when there are road shows.
b) While those located in Rural areas associated the area with the following
advantages for the good academic performance
i) Cool and undisturbed environment as would be the case in towns.
55

ii) Students lack a lot o f exposure as the highest percentage come from
the neighborhoods.
c) Though they mentioned the following as challenges that impact on them
negatively thus interfering with their academic performance.
i) Effect o f traditional practices and high level o f illiteracy in the area.
ii) High poverty level that increases on the students' rate o f absenteeism.
iii) Poor means o f transport that makes accessibility difficult.
iv) Strain on students who have to cover long distances.
From the observation majority of the schools could not be seen from the town or in
the neighborhoods of the town which indicated that most of them were rural based.
56

CHAPTER FIVE
SUMMARY OF FINDINGS, DISCUSSION, CONCLUSION AND
RECOMMENDATIONS
5.1 Introduction
This chapter gives the study’s summary of the findings, conclusions and appropriate
recommendations in line with the objectives and the elements of the study. It also
gives suggestions on the areas that the researcher considered required more attentions
for further investigation.
5.2 Summary of the findings
The study was intended to investigate the influence of school characteristics on
students’ academic performance in Tigania central division which was guided by five
objectives and a few identified elements of those characteristics whose summary is
presented below.
Table 5.1 Summary of objectives, findings
Objective Findings
1. Assess the influence of school
leadership on students academic
performance in students in
secondary schools
School leadership influences students’
academic performance through formulation
and implementation of school policies and
supervision of teaching/learning process
which were rated as average in the area under
study.
2.Examine the influence of school
climate on student academic
performance in secondary schools
The school climate influences the students’
academic performance as established through
principal-teacher, teacher-student and student-
student interaction which were rated at
average by the respondents.
3. Establish the influence of
teachers’ characteristics on
students’ academic performance in
secondary schools.
Teacher characteristics influence students’
academic performance as found through
teachers’ period of service, work preparation
and teachers academic/professional
57
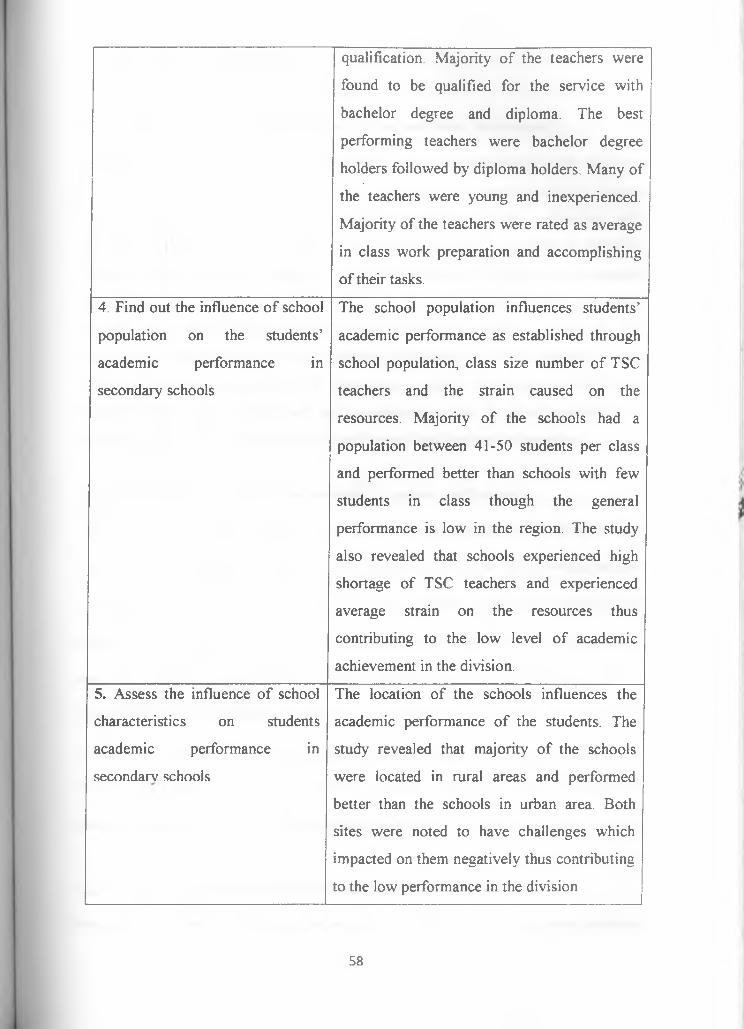
qualification. Majority of the teachers were
found to be qualified for the service with
bachelor degree and diploma. The best
performing teachers were bachelor degree
holders followed by diploma holders. Many of
the teachers were young and inexperienced.
Majority of the teachers were rated as average
in class work preparation and accomplishing
of their tasks.
4. Find out the influence of school
population on the students’
academic performance in
secondary schools
The school population influences students’
academic performance as established through
school population, class size number of TSC
teachers and the strain caused on the
resources. Majority of the schools had a
population between 41-50 students per class
and performed better than schools with few
students in class though the general
performance is low in the region. The study
also revealed that schools experienced high
shortage of TSC teachers and experienced
average strain on the resources thus
contributing to the low level of academic
achievement in the division.
5. Assess the influence of school
characteristics on students
academic performance in
secondary schools
The location of the schools influences the
academic performance of the students. The
study revealed that majority of the schools
were located in rural areas and performed
better than the schools in urban area. Both
sites were noted to have challenges which
impacted on them negatively thus contributing
to the low performance in the division
58

5.3 Discussion of the findings
The discussion of the findings is as follow.
5.3.1 Influence of school leadership on student academic performance
The study revealed that leadership influenced academic achievement in the division.
According to the study the principles were noted to be innovative in policy making
and implementation, motivating and empowered teachers by supporting and
facilitating their in-service training. The principals involve teachers in decision
making as a way of incorporating their opinion in decision making. The principals
also played the role of supervising classroom activities effectively. But the study
reveals that most of these activities are rated average or below average by the
respondents which explains why the academic performance is below average in the
division. This is in agreement with Mccormack, Adams and Gamage (2009) who
indicated that many scholars have acknowledged the role of school leadership is
mostly significant in enhancing school performance and students achievement.
5.3.2 School climate influence on students’ academic performance
According to the study, school social climate of the schools in the division was
established through the investigation of the relationship between the principal and the
teachers, students and teachers, students and students. The study revealed that
interaction was highly developed in these schools but were rated at average level
according to the respondents. This revealed that the school climate played a role in
contributing to the low level of academic achievement in the division. This is in line
with Stynon (2008) who state that a healthy school climate is created by a supportive
healthy relationship among staff members, student relate well with teachers and
among themselves which lead to good performance.
5.3.3 Teacher characteristics and students' academic performance
Teacher characteristics influence on students’ academic performance was studied
59
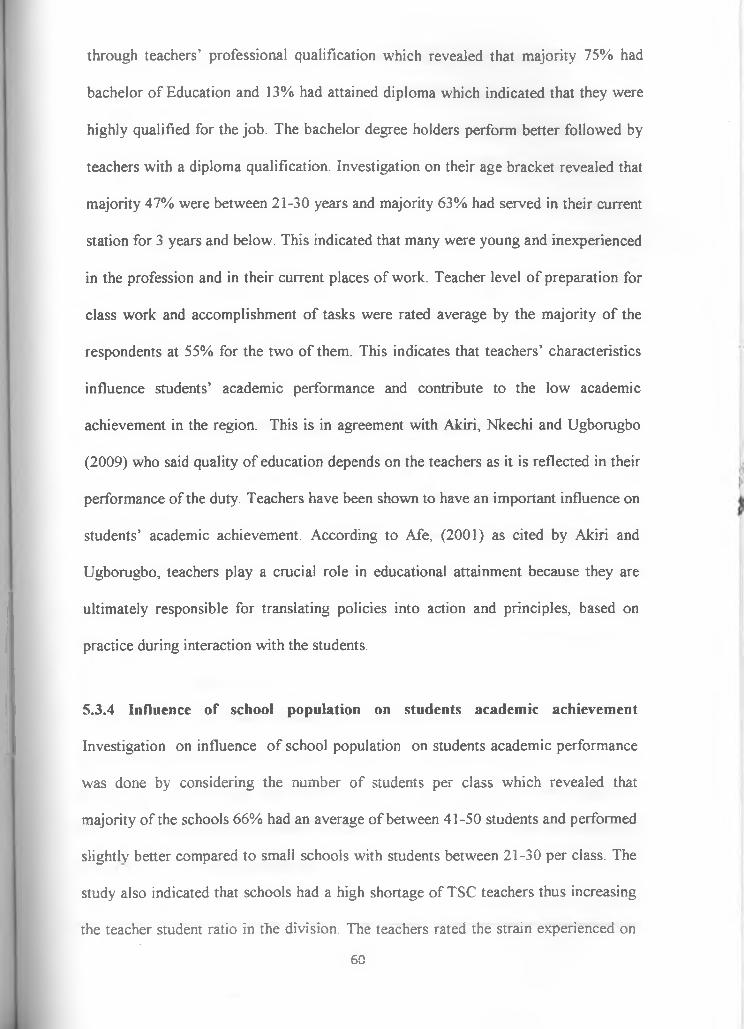
through teachers’ professional qualification which revealed that majority 75% had
bachelor of Education and 13% had attained diploma which indicated that they were
highly qualified for the job. The bachelor degree holders perform better followed by
teachers with a diploma qualification. Investigation on their age bracket revealed that
majority 47% were between 21-30 years and majority 63% had served in their current
station for 3 years and below. This indicated that many were young and inexperienced
in the profession and in their current places of work. Teacher level of preparation for
class work and accomplishment of tasks were rated average by the majority of the
respondents at 55% for the two of them. This indicates that teachers’ characteristics
influence students’ academic performance and contribute to the low academic
achievement in the region. This is in agreement with Akiri, Nkechi and Ugborugbo
(2009) who said quality of education depends on the teachers as it is reflected in their
performance of the duty. Teachers have been shown to have an important influence on
students’ academic achievement. According to Afe, (2001) as cited by Akiri and
Ugborugbo, teachers play a crucial role in educational attainment because they are
ultimately responsible for translating policies into action and principles, based on
practice during interaction with the students.
5.3.4 Influence of school population on students academic achievement
Investigation on influence of school population on students academic performance
was done by considering the number of students per class which revealed that
majority of the schools 66% had an average of between 41-50 students and performed
slightly better compared to small schools with students between 21-30 per class. The
study also indicated that schools had a high shortage of TSC teachers thus increasing
the teacher student ratio in the division. The teachers rated the strain experienced on
60
the resources in those schools as average but tending towards high. It is therefore
clear that the school population influenced academic performance as supported by
number of students in class, teacher- students’ ratio and the strain it causes on the
resources. The study is in line with Slate and Jones (2000) who confirmed that
increase in size of a school initially brings positive relationship but the trends are
reversed as the size continues to increase. Abbott, Jolteman and Stroh (2002) cites
Bracy (2001) having noted that large schools especially high schools produce their
own set of problems which a growing number of researchers and policy makers think
can be solved by returning to small schools.
5.3.5 School location influence on students' academic performance
The research also sought to find out from the respondents the location of the schools
in respect to whether they were urban or rural based. Most of the schools in the region
are rural based 83% compared to 16% which are urban based. The research revealed
that rural schools performed better than urban schools. The respondents cited that the
rural area provided cool and undisturbed environment for studies as opposed to the
urban environment. They also stated that the many of the students lacked destructive
exposure that would affect their learning as many of they came from the
neighborhoods. This negates Omisude (1985) contribution that large schools in urban
areas tend to perform better in examinations than small schools in rural areas. It is
also noted from the study that urban and rural schools had factors that negatively
impacted on them thus resulting to low academic performance because the difference
in academic achievement is minimal

5.4 Conclusions
Following the study analysis the researcher concludes that school leadership plays a
key role in determining students’ academic performance. The study revealed that
principles fared fairly in being innovative in policy making and implementation and in
motivating and empowering teachers by offering support and training that they
required in performing their duty effectively. They were average in involving other
teachers in decision making, communicating with stakeholders and in supervising
class attendance by both teachers and students. This meant that the principals have to
improve their leadership tactics for promoting better improved academic performance.
The study also revealed that school climate is critical in determining the students’
academic performance through principal-teachers interaction, teacher-student
relationship and student -student interaction which was rated average. This implies
that high interaction rate has to be promoted throughout to create a better school
climate for higher academic achievement.
It is also noted that teachers’ characteristics are essential for effective implementation
of school curriculum. The teachers have to be of high level of professional
qualification a bachelor degree holder or at least a diploma certificate for effective
handling of secondary school students. Teachers have to be more committed to
accomplishing their task and meeting the set deadlines on time for better academic
achievement in their schools thus improving on the division achievement.
It is clear from the study that schools with average population with an average of 45
students in a class or below are reasonable for effective management and better
academic performance. Very small or too high populations pose big challenges that
impact negatively on schools academic performance.
It’s also established that the location of the school is crucial to determining its
academic performance Schools in rural areas seem to perform better compared to
urban schools, though both locations have their own challenges that impacts
negatively on their academic performance that need to be handled separately.
According to the study’s findings the researcher concludes that the performance of
secondary schools in Tigania Central Division is influenced by the leadership, school62

climate, teachers’ characteristics, school population, and location of school.
5.5 Recommendations
From the above study the researcher recommends the following:
i. The school administration especially the Principals ought to be more
committed to their work, improve on their leadership skills, be more
innovative in formulation and implementation of school policies, motivate,
and promote team work and be more efficient and effective in supervising
teaching learning process which would influence both teachers and student to
perform to their best.
ii. Improve on promoting a healthy interaction between the principals and
teachers, teachers and students and students and students. Students should be
organized into subject clubs and discussion groups in order to improve their
level of interaction. These will create a good school climate which is essential
for improved academic achievement.
iii. Bachelor degree and diploma holders are best qualified for curriculum
implementation in secondary schools. The young and inexperienced teachers
should be given proper guidance and orientation in the profession and in
school policies. They need to get more time to understand the syllabus, master
the content and skills in their subject areas gradually from the lower classes
upward. Teachers need to be more committed to their work in preparing for
the classes and accomplishing their tasks on time More external supervision
through school inspection needs to be encouraged for better academic
performance.
iv. The schools with small population and few students in class should be
encouraged to increase the enrolment to a level that is economical and
productive for them. The Ministry of education should employ more teachers
to help reduce the high shortage and improve the curriculum establishment of
63

the schools in the division. The Board of management should look at the
alternative means of reducing the strain on school resources through strategic
plan to improve the situation for high academic achievement
v. Schools need to be located far away from towns for they are found to affect
their performance. Those located in towns require more surveillance to keep
away harmful substances from getting into schools. Whether urban or rural
schools have their own challenges most of which can be addressed to through
guidance and counseling in order to win the minds of students, teachers and
support staff for.
5.6 Suggestions for further Research
As a result of this study, the researcher suggests that further research need to be
carried out to determine the influence of students’ characteristics on their academic
performance. Similar study on school characteristics can be conducted at wider area
than a division level.
64

REFERENCES
Abbot, M L. Joiveman & Stroh, H. (2002). The Influence of School Size and Social- Economic Status on Student Achievement in Washington. A Republican Study Using Hierarchical Linear Modeling. Washington School Research Centre Report. No. 3.
Adesoji, F.& OlatunsBosum, S.M.(2008). Student, teacher and school environment as of achievement in senior secondary school chemistry. Journal o f international social research vol. 1/2.
Adeyela, J. (2000). Problems o f teaching sciences in large classes at the junior secondary school level. Implication for learning outcome. Unpublished M.Ed. Thesis. University of Ibadan.
Anderson,C.S (1982) The search for school climate; A review of the literature. Review o f Education Research, 52, 368 - 420
Afe, J O. (2001). Reflections on becoming a teacher and challenges o f teacher education. Inaugural Lecture Series 64. Benin City: University of Benin, Nigeria.
Agba, Ogaboh A.M. Ikoh, I.M. Ashibi, (2010). Teachers’ leadership style, classroom variables and Students’ academic performance in Calabar Metropolis. Education research Volume 16 pp. 178-189. Retrieved 28/1/2012. http://www.interesjoumals.org.
Ajao, W. (2001). Cadbury is Determined to Move Education Forward. Vanguard, December 27, 2001.
Akanle, O. B. (2007). "Socio-Economic Factors Influencing Students Academic Performance in Nigeria Some Explanation from a Local Sur\>ey,” Sociology and Social work community.
Akinleye G.A. (2001). Early Childhood Education; Guide for Parents and Teachers UN AD Journal ofEducation 2(1) October; 45.
Akiri, & Ugborubo. (2009). Teachers’ effectiveness and students’ Academic Performance in Public Secondary Schools in Delta State, Nigeria. Stud Home Comm. Sci 3(2): 107-113.
Akiri, Nkechi, & Ugborugbe. (2009). Teachers ’ effectiveness a id students ’ Academic Performance in Public Secondary Schools in Delta State, Nigeria; Department of Educational Administration and Policy Studies; Faculty of Education, Delta State University, Abraka, Nigeria
Ames, N.L & Miller, E. (1994). Changing middle school: How to make schools work fo r young adolescent. San Francisco. Jossy- Bass
65

American student achievement institute, (2007). Elements o f high achieving schools.Indiana student achievement institute. Retrieved on 24/4/2012. www. asainstitute org.
Anderson C. S (1982).77ie search for school climate: A review o f the research Vol.52 3pp 368-420. America Educational research association. Source; Retrieved on 28/1/2012.from hhtp://www. Jstor.org/stable/ll 70423 seq =10.
Ashibi, N.I. (2005). Assessment o f the application o f testing skills among Secondary School teachers in Northern Cross River States, Nigeria. An Unpublished Masters Education Thesis; University of Calabar, Nigeria.
Aremu, A.O. (2000). Academic performance, five factors inventory. Ibadan: Stirling - Horde Publishers.
Asikhia, O.A (2010). Student and teachers perception the causes of poor academic performance in Oguni state secondary school schools (Nigeria).Implication for counseling for national development. European journal o f social sciences vol.2 number2 (2010).
Ayot, H O. & Briggs, H. (1992). Economics o f Education. Nairobi: Educational Research Publication
Bankiston, C. L III & Caldas S.J. (2002). A troubled dream; the promise and failure of school desegregation in Louisiana, Nashville, and TN: Vanderbit University press.
Baker, D.B,01zendum, A M , Gratama CA.,&Arrington, SR.,(2005).The powerfulteaching and learning project .How teachers in Washington state developed essential components of powerful learning and teaching.The BERC Group http//www.bercgroup.com/document BERC-PTL Project-FINAL v3pdf
Berliner, DC. (2005). The near impossibility of testing for teacher quality. Journal o f Teacher Education, 56 (3), 205 - 213.
Bell, M.J. (2002) e - how education define academic performance. Demand media inc. e-how.com / about 4740720 define academic performancehtml. Retrieved on 2/2/2012.
Bliss, J.R, Firestone, W.A., & Richard, C.E (1991). Rethinking effective schools; Research & practice. Englewood cliffs, prentice - Hall.
Blum, R.W. McNeely, C. A &Rinehart D M. {2002).Improving the odds; the untapped power of schools to improve the health of teens Menepolis : University of Minnesota Centre for Adolescent Health and Development.
Bolton, J. K (1998). “Larger is sometimes better: Approaches to larger classes” a paper presented at convection of teachers of English language. Chicago Illinois.
56

Boylan, C. & Mcswan, (1998). Long- staying rural teacher. Who are to blame?
Brown, S. P. & Ligh, T.W. (1996). A new look at psychological climate and its relationship to job involvement effort and performance. Journal o f applied psychology 81, 353.
Business, R. (1992). The essential components o f a successful education system; putting policy in practice. Washington D.c Author.
Cantwell, J.G. jr. (2003). A study of relationship of principals, teacher interaction, and school climate on thereof Pennsylvania system of school assessment test data. Dissertation abstracts international, 65(05), 1601. (UmiNo 3330862).
Carbonaro, W. (2005). Tracking students' effort and academic achievement. Sociology of education 78.
Carey K. (2004) .The real value o f teachers; using new information about teachers' effectiveness to close achievements gap. Thinking K-16 Washington Dc: the education trust.
Casanova, M.J.,Garrcia-linares, C.,Torre, M. J.,Carpio, M. (2005). Influence of family and socio-demographic achievement. University of fa’en, Spain. Educ.psychology vol.25, No.4 Aug.pp.423-435.
Catalano, R.F,Haggerty K.P, Oesteries S,Fleming C. B,& Hawkins J.D (2004). The importance of bonding to schools for healthy development: Finding from the social development research group. The Journal o f school health, 74(7)252-262.
Catsambis.S. (2001). Neighbourhood and school influences on the family life and mathematics performance o f eight grade 5tMflfewt5.www.csosijhv.edu.USA; Queens College and graduate center of cuny.
Chitavi, M. J. (2003). Guidance and counseling series school administration; Nairobi.Pavement publishers.
Clark, R. (2003). The essential 55 .1st ed. Newyork: Hyperson.
Cohen, J. (2006).social, Emotiotial and ethical and academic education: core principles and practices. In J.cohen (educ ).caring classrooms/intelligent schools; the social emotional education of young children. Newyork teachers college press.28/1/2012.hht://www. c see.net/resources/selbook.
Coleman, J. S. (1990). Equality and achievement in education San Francisco: West view press.
Commeyras, M. (2003). “Promoting culture of reading” The comet p.32.57
Considine,G. (2002). The influence of social and economic disadvantage in the academic performance of school students in Australia. Journal o f sociology Vol.38 No 2 129-148.
Cotton K (2001). New small learning communities, findings from recent research Portland OR; North West Regional Educational laboratory.
Cotton, K. (2003/ Principals and Students Achievement. Melbourne: hawker brown low education. Melbourne: Hawker Brownlow Education.
Cotton, K. (1995).Research you can use to improve results. Alexandria, VA:ASCD and Portland or: Northwest regional educational theory.
Cotton, K. (2000). The schooling practices that matter most Alexandria, VA: ASCD and Portland or: Northwest regional educational theory.
Crain, R. L. & Mahard. RE (1983). The effect of research methodology on deasegregalion achievement studies. A meta analysis. American journal o f sociology 88, 839 - 854.
Daniel, H. Bizar, M & Zemelman, S. (2001). Rethinking high school, best practices in teaching, learning and leadership. Portsmouth NH: Heinemann.
Dahar, M. A. Dahar,R. A. Dahar R.T & Zaire F. A. (2011). Impact of teacher quality on academic achievement of students at secondary stage in Punjab (Pakistan) European journal o f social science-volume 19, number 1.
Dahar M. A. (2011). Impact of teacher quality on academic achievement of student at secondary stage in Punjab (Pakistan). European journal o f sciences- volume!9, number 1.
Davis, S., Hammond, L. D. Lapointe, M. & Meyerson. (2005). School Leadership Study Developing Successful Principals, Review of Research, school of Educational Leadership Institute; Stanford University. The Wallace foundation.
De jung, J & Duckworth, K. (1986) High school teachers and their students attendance: final report Eugene: university of Oregon center for policy and management, college of Education (Eric document reproduction service No. ED 266 - 557).
Desforges, C. & Abbouchaar, A.(2003). The impact o f parental involvement, parental support and family Education on pupils ’ achievement; a literature review. Research report No.433 Queen printers.
Dupper, O R. & Meyer - Adams N. (2002) low - level violence; neglected aspect of school culture. Urban Education 37, 350 - 364.
68

Considine,G. (2002). The influence of social and economic disadvantage in the academic performance of school students in Australia. Journal o f sociology1 Vol.38 No 2 129-148.
Cotton K. (2001). New small learning communities: findings from recent research Portland OR; North West Regional Educational laboratory.
Cotton, K. (2003/ Principals and Students Achievement. Melbourne: hawker brown low education. Melbourne: Hawker Brownlow Education.
Cotton, K. (1995).Research you can use to improve results. Alexandria, VA ASCD and Portland or: Northwest regional educational theory.
Cotton, K. (2000). The schooling practices that matter most. Alexandria, VA: ASCD and Portland or: Northwest regional educational theory.
Crain, R. L. & Mahard RE (1983). The effect of research methodology on deasegregalion achievement studies. A meta analysis. American journal o f sociology 88, 839 - 854.
Daniel, H. Bizar, M & Zemelman, S. (2001). Rethinking high school: best practices in teaching, learning and leadership. Portsmouth NH: Heinemann
Dahar, M. A. Dahar,R.A. Dahar R.T & Zaire F. A. (2011). Impact of teacher quality on academic achievement of students at secondary stage in Punjab (Pakistan). European journal o f social science-volume 19, number 1.
Dahar M. A. (2011). Impact of teacher quality on academic achievement of student at secondary stage in Punjab (Pakistan). European journal o f sciences- volume!9, number 1.
Davis, S., Hammond, L. D. Lapointe, M. & Meyerson. (2005). School Leadership Study Developing Successful Principals; Review of Research, school of Educational Leadership Institute; Stanford University. The Wallace foundation.
De jung, J & Duckworth, K. (1986) High school teachers and their students attendance: final report Eugene: university of Oregon center for policy and management, college of Education (Eric document reproduction service No ED 266 - 557).
Desforges, C. & Abbouchaar, A.(2003). The impact o f parental involvement, parental support and family Education on pupils' achievement; a literature review. Research report No.433.Queen printers.
Dupper, O R. & Meyer - Adams N. (2002) low - level violence; neglected aspect of school culture. Urban Education 37, 350 - 364.
68

Edgerson E D & Kritsonis W.A (2006). Analysis of the influence of principal - Teacher relationships on student Academic Achievement: A national focus. Doctoral forum national journal for publishing & mentoring doctoral student research Vol. I.
Eshiwani, G.S (1993). Education in Kenya sitice Independence. Nairobi. Government printer.
Ekanle, O.B. (2007). Socio-economic factors influencing students’ academic performance in Nigeria, some explanation from a local survey Sociology arid social work community.
Eso, O.T. (1998). Assessment Procedure and Student Locus o f Control as Determinants o f Achievement in Integrated Science. An Unpublished Phd Thesis; University of Ibadaan, Ibadan.
Ezike, B.U. (1997). The effect o f resource distribution and utilization on the performance o f students In chemistry. M. Ed Dissortation university of Ibadan.
Fabunmi, M., Abu, P.B & Adeniji, A. (2007). Class factors as determinant of secondary students academic performance in Oyo state in Nigeria.
Fabumi, M. and Okore, A. (2000). Analysis of the Relationship between Average Class size and secondary school Academic Performance. Africa Journal o f Educational Planning Policy Studies. 1(2): 107-115.
Fetler, M. (1989). School dropout rates, academic performance, size and poverty;correlates of Education al reform. Educational Evaluation and policy analysis, 11, 109-116.
Florence,Italy (June 2000).Defining quality education. A paper presented by UNICEF at the meeting of the international working group on education. Newyork USA. UNICEF
Finn, J (1989). Withdrawing from school. Review o f Educational Research, 59, 117 - 142.
Fullan, M. G. (1985). Change processes and strategies at the local level. The Elementary School Journal, 85(3), 391-421.
Fowler, W. J & Walberg H.J. (1991). school size characteristics and outcomes. Educational evaluation and policy analysis 13, 189 - 202.
Fox, W.F (1981). Reviewing economies of size in education in education. Journal of education finance, 6, 273 - 296.
Freeman, J.B &. Ambady, N. (20 H). A dynamic interactive theory of person69

construal. Psychological review Vol. 118 No 2 24 7-2 79. Tufts University.
Gamage,D.T. (1993). A review of community participation in school Governance, an emerging culture in Australian Education. British journal o f Educational studies 41(2).
Gamage, D., Adams, D., & Mccormack, A. (2009).How does a school ieader influence achievements? A review o f research findings and best practices. Retrieved from the connecxion website:http://cnx.org.content/ml9751/1.2/
Gamoran, A. (1992/ Social factors in Education. In R Datti (Ed.). The handbook o f social welfare. Thousands oaks C.A. saga.
Gitobu,B. K. (2007). The relationship between the head teachers characteristics and students in secondary school administration in Meru central Kenya. Unpublished masters project Nairobi University.
Glisson, C (2002), organizational climate and culture in R Patti (Ed). The handbook of social Welfare (pp 195 - 218, thousand oaks’ CA sage Lee, VE & Bryk, As (1989/ A Multilevel model o f the social distribution o f high school achievement sociology o f Education 62, 172-19
Good,T.L. &Brophy,J.E (2000). Looking in classrooms (8th Ed). New York: Longman
Goldsmith ,P. A (2004). Schools racial mix students optism and the Black while and Latino. White achievement gaps. Sociology o f Education 77, 121 - 147.
Gottfredson, D.C. & Gottfredson, G.D (1983). Nature and importance of attachment relationship to parents and peers during Adolescence. Journal o f youth and Adolescence 12, 373-386.
Government of Pakistan, (1998). National Education Policy (2009). Minisry of educ. Islamab
Gray, J. (1989). “Multilevel models: issues and problems emerging from their recent application In British studies of school effectiveness. ’ Multilevel analysis o f Education data. R.D Block(ed). San Diego, California, Academic Press, 127-142.
Griffins, G. (1994). School masterly. Straight talk about boarding school management in Kenya: Nairobi Kenya; Lectern publishers.
Guinn D M. (2003). The impact of principal’s leadership on behaviours and instructional practice and students’ engagement Journal o f Educational administration, 40 (5), 447-467.
Hale, E. 8i Rollins, K. (2006). Leading the way to increased student learning.70

Principal leadership 6(10); 6-7
Haller, E. J (1992). High school size and student indiscipline; another aspect of the school Consolidation issue^ Education Evaluation and policy Analysis 14, 145 - 156.
Harris, A. (2004). Distributed leadership and school improvement educational management administration and leadership 32(1) 11-24.
Harris, A. (2005). Distributed Leadership In Davies, B (EdJ. The Essentials o f School Leadership London: SAGE Pub lications Inc.
Heariside, S. Rowand, C., Williams, C. & Farris E. (1998). Violence and discipline problems in US. Public schools; 1996 - 1997 (NCES) pub. No. 98 - 030) Washington, DC; US. Department of Education, National Centre for Education statistics.
Hegel, D.R Smith, E.R & Hanson,S.L. (1990).School experiences predicting changes in self-esteem of sixth and seventh grade students. Journal o f Education Psychology. 82, 117-127.
Holland, A. & Andre T. (1987).Participation in extracurricular activities in secondary school; what is known, what needs to be known? Review o f Educational Research, 57, 437- 466.
Howley, C. (1996). Sizing up schooling. A West Virginia analysis and critique.Unpublished doctoral dissertation, West Virginia University, Morgantown.
Howley, C.(1996). An ongoing dilemma o f school size. A short story. Retrieved on 28/1/2012. From http; // w w w . Saga.org/issue and insight/districtorganisation/howley dilemas.htm.
Hoy, W. and Miskel, C (1982). Educational administrational: theory. Research and practice (2nd Ed) New York: Random House.
Ibari, J. M. (2009). An evaluation o f stakeholders ’ participation in the sustainability ofphysical facilities in day secondary schools in the lmenti north district- Kenya.Unpublished masters research project. Nairobi University.
Ireri, J. (2007). The effect o f educational resources on students in public secondary schools in KEbeere.Unpublished masters research project. Nairobi University.
Jamila, E. H.(2009). Parents’ socio economic status and childrens academic performance Norwargian social research NOVA notat 7 2009. Norske.
Jomtien, Thailand ("5-9 march 1990). World declaration on education for all and71
framework fo r action to meet basic learning needs. UNESCO publishers. Retreaved on 20/9/2012 http://www.unesco org/education/pdf/JOMTIE E. PDF.
Johnson, M. K crosnoe R, & Eder G. Jr (2001). Students attachment and academic engagement; the role of race and ethnicity. Sociology o f Education, 74, 318 - 40.
Larger, J.A. (2004). Getting to excellent: How to create better schools. Newyork teachers college press. Collumbia University.
Karcher, M.J. (2002) connectedness and school violence: A framework for developmental invention in E. Gerler (Ed). Handbook of school violence; Binghamton, N Y. Haworth.
Karikai, W. B. (2009). Determinant o f poor performance, article base;hht://w.w.w./parent influence/determinant of poor academic performance - 3659333hml.
Keefe, J.W., Valentine, J., Clark, D.C, & Irvin, J.L.(1994). Leadership in middle level education Leadership in successfully restructuring middle level schools. Columbus, O H: National association of secondary school principals.
Kelly, M. (2012). Secondary school guide; top ten characteristics o f a quality school.New York Times Company. http://712 educator about. Com/bio mellisa - Kelly-7615 htm.
Kimacia, P. (2007). Relationship between head teachers leadership styles and girl students' performance in Kenya Certificate o f Secondary Education in public secondary schools. Unpublished masters project University of Nairobi.
Kothari, C.R, (2008). Research methodology methods and techniques (2nd Rev Ed.);New Delhi. New age international (p) limited publishers.
Kusek, J.Z. & Rist.R.C.(2004).7e« steps to result based monitoring and evaluation systemWashington Dc. The world link.
Lee, V. & Loeb, S. (2000). School size in Chicago elementary schools. Effects on teachers attitudes and Students achievement American Educational research journal 37(1), 3 -3 1 .
Lee, V.E. & Burkan D.T. (2003) Dropping out of high school. The role of school organization and Structure. American Educational Research Journal, 40, 353 - 393.
Lee, V.E & Smith, J.B (1997), High school size; which works best for whole? EducationalEvaluation and Policy analysis 19, 205 - 227.
72

Loeb, S L, Valerie. (2000). School Size in Chicago Elementary Schools. Effects on Teacher Attitudes and Students’ Achievement. American Educational Research Journal 37,1 3-31.
Lezette,L.W. (1991 ).Correlates o f effective schools: The first and second generation.Effective schools products ltd. Okemos, Ml: http//www.effective schools.com/free stuffasp
Lezotte, L.(2001)Revolutionary and evolutionary: The effective schools movement. Effective schools product Ltd.
Lindsay, P,(1982). The effect of high school size on student participation, satisfaction and attendance. Educational Evaluation and policy Analysis 4, 57 - 65.
Lipsitz, J. (1997). Middle schools improvement improvement programme. Phi Delta kappan, 78 (7),554-555.
Makewa, L.N, Role, E. Role, J Yegoh, E. (201 l).School climate and academic Performance in high and low achieving schools: Nandi district Kenya. International journal o f scientific research in Education 4(2) 93-104. Retrieved 29/1/2012 from hhtp;//www. i j sre. com.
Maine, G. (2004). School climate guideline. Retrieved28/1/2012 hhtp://www maineship.com/school/guidelines html.
Marzano, R. J, Waters, T. & McNulty,B. A. (2005). School leadership that works: from research to results .Alexandria, VA:ASCD and Aurola, Co: MCREL.
Max, (2003). Sense of belonging to school; can schools make a difference? Journal o f Educational Research, 96(b), 340-349.
Mbakwe, F.E (1986). Location and resource factors in Development o f Nigerian Army schools 1980 - 1984. unpublished ph. D. thesis, university of Ibadan.
McCracken, J.D. & Barcinas, J. D. (1991). Differences between rural and urban schools, students characteristics and students aspirations in Ohio. Journal o f research in rural education winter, 1991 vol. 7 No22pp29-40.
MCmillen B.J.(2004) School size, achievement gaps. Education policy Analysis Archives, 12(58). Retrieved November 3, 2004 from http;//epra.asu.ed / epaa /v 12n 58
Mcneey, C.A. Nonnemaker, J.M. & Blum, R.W.(2012).Promoting students connectednes to schools: Evidence from national longitudinal study of adolescent heakhJournal o f research school health72, 138-1146
A. (1988). Tes 'Kelle Lectures on educational leadership in the73
Miltete,
millenmu Professionals, pedagogy and leadership'. A lecture given on 30th, June.
Monk, D.H. (1987). Secondary School Size and Curriculum Comprehensiveness. Economics o f Education Review 6, 137-150.
Monk, D.H. & King. J.A. (1990). Multi level teacher resources effect in secondary school mathematics and science: The case of teacher subject preparation. In R.G Ehrenberg (Ed.) Choices and consequences, temporary policy issues in education. Ilhaca. Ny.ILR press 28-58.
Mugambi, M. M. (2006). Factors influencing students’ performance in Kenya Certificate of Secondary Education in Meru south district. Unpublished masters project Nairobi University.
Mugenda, O M. and Mugenda, A.G. (2003).Research methods quantitative and qualitative approaches. Nairobi: African centre for technology studies
Mulford, B. (2003). School leaders: changing roles and impact on teach and school effectiveness. Leadership for learning group. University of Tasmania.
Musungu, L.L. & Nasongo J.W. (2008). The Head-teacher’s Instructional Role in Academic Achievement in Secondary Schools in Vihiga District, Kenya. Educatonal Research and Review vol. 3(10), pp. 316-323.
Musungu, L.L. & Nasongo, J.W. (2009). Role of the Head teacher in Academic Achievement in Secondary Schools in Vihiga District, Kenya. Current Research Journal o f Social Sciences 1(3): 84-92, 2009 ISSN: 2041-3246. Masinde Muliro University of Science and Technology, Kenya.
Mutai, B.K. (2000). How to write a quality research proposal. A complete and simplified recipe. New York; Thelley publications.
Mwika, B. (2010). Stakeholders influence on academic performance in public primary.’ schools, a case o f Akithi Division o f Tigania west distrct. Unpublished masters research project.Nairobi University.
NARC, (2002). Manifesto o f the national rainbow coalition Democracy and empowerment, Nairobi; Unpublished.
N.C.T.E Secondary' section (1990). Students Right should dictate class size. The English Journal, 88 (5), 18 - 20 http: // www. Jstor. Org/stable/821771.
Nungari, J.K. Factors influencing students’ performance in Kenya Certificate of Secondary Education Examination in Kajiado Unpublished masters project University of Nairobi.
Nyanga, Z.K. (2004). Organizational climate and performance in sciences at Kenya Certificate o f secondary Education in public secondary > schools in Nairobi
74

province. Unpublished master project University of Nairobi.
Ofeogbu F.I. (2004) Teacher Motivation: A Factor for Classroom Effectiveness and School Improvement in Nigeria. Gale Group. Retrieved Feb 12, 2012. From http:// wwvv findarticles.com.
Okofar, C. P. (2001). A case study: Factors contributing to the academic achievement of low socio-economic status students in Anambra south county, Anambra state Nigeria. St. Johns University. Portjefferson station.
Olatunde, Y.P. (2009). Relationship between teachers attitude and students academic achievement in mathematics in some selected senior secondary schools in Nigeria. Kampala international western college. European journal o f socials sciences vol. 11 number 3.
Oluwadare, A. (2011). Human Resource Availabiliy and Students' Academic Performance in Secondary Schools in North-West Geo-political Zone of Nigeria.Vol. 2 No. 6.
Omenge, N B and Nasongo, J.W. (2010). Effect of socialization with regard to gender roles on students academic achievement in secondary school in Kisii central district kenya current research journal o f social sciences 2 (6):327-333.
Omisade, Y.O. (1985). The impact o f schools management environment on students output. Quality in oyo state secondary school Unpublished ph d. thesis university of Ibadan.
Omoyemi, O. (1978). School map for rationalization o f secondary education in Ondo state; Unpulished dissertation,university of Ibadan
Onyeanchu, A. (1996).Relationship between working conditions and teacher effectiveness in secondary schools in Abia Education zone o f Abia state M.Ed. Dessertation, unpublished.Port Hatcourt:University of port Harcourt,Nigeria.
Owobabi, J. (1990). An introduction to mapping. Ibadan: university of Ibadan, p. 9
Owoeye, J.S. (1991). A study o f relationship between class size and Educational Quality in Ondo state. Unpublished M.E.d Thesis University of Lagos.
75

Owoeye J.S. (2011). School Location and Academic Achievement o f Secondary Schools in Ekiti State, Nigeria. Asian Social Science vol. 7 no. 5. Retrieved on on 28/1/2012 http://www.ccsenol.org Kampala University.
Pande, P & Holpp, L. (2002). What is Six Sigma? Newyork McGraw-Hill
Parcel, T.L. & Durfur, M. J. (2001). Capital at home and at school; Effects of studentachievement Socialforces 79 (3). Middle school.
Parker, R. (2000). A place to belong (Not merely attend) connectedness in the middle schools. Independent schools, 61(4) 50-60.
Peters, J. J and Waterman Jr. R.H. (1982).In search of excellent. San Francisco Jossey- Bass.
Pittman R.B & Haughwout P. (1987) Influence of high school size on dropout rate.
Educational Evaluation and policy Analysis 9, 337 - 343.
Pong, S. (1997). Family structure, school context, and eighth - grade math and reading Achievement. Journal o f marriage andfamily 59. 734 - 746.
Raywind, (1999). Current literature on small schools. Charleston,WV.£7?/C Reproduction Sennce No. ED42049.
Rammala, M. S. (2009). Factors contributing towards poor performance o f 12 learners at Manoshi and Mokwatedi high school, unpublished dissertation Tumloop graduate school of leadership.
Republic of Kenya, (1965). Sessional paper No I on African socialism and its application to planning in Kenya. Nairobi: Government printer
Reid K. (1982). Retrospection and persistent school absenteeism. Educational research, 25,110- 115.
Republic of Kenya, (2007). Gender policy in Education . Ministry of Education, Nairobi.
Republic of Kenya, (2007). Kenya vision 2030: A competitive and prosperous Kenya. Government printer.
Rumberger, R. W. & Palardy G.J. (2005). Test scores, dropout rates, and transfer rates as alternative indicators of high school performance. American Educational Research Journal 42.
Samdal, O.Nutbeam, P Wold, B. & Kaunas, L. (1999). Achieving health and educational goal through schools: A study of importance of school climate and Students^ satisfaction with school. Health Education research theory
76

Schmoker, M.(2006).Results now: how we can achieve unprecedented improvements in teaching And learning. alexandria,VA:ASCD.
Schoygen, P. & Schogygen M.(1988). Student voluntary participation and high school size. Journal o f Educational Research 81, 288 - 293.
Shannon, G. S & Bylsma (2003). Nine characteristics of high performing schools; A research -based resource for schools and districts to assist with student leaming.(lM Ed) Olympia,WAOSPI.
Shannon, G. S., & Bylsm, P. (2007). The nine characteristics o f high-performing schools; A research-based resource for schools and districts to assist with improving student Learning.(2nd Ed) Olympia,WA:OSPI.
Shilds, P.M (1991), school and community influences on effective academic instruction. In M S. knapp & P.M. shilds (Eds). Better scheeling for the children of poverty Alternatives to convenctional wisdom. Berkely CA; Mccuchon.
Slate, J.R. & Jones. C.H. (2005). Effect o f school size; A review of literature with Recommendation Essay in Education. Retrieved 28/01/2012; http: // www. Osca. Edu/essay/vol 1132005/slate. Pdf.
Stewart, E.B. (2007). School structural characteristics, student, peer association and parental involvement: the influence of school and individual-level factors on academic achievement Education and urbansociety.40:179. Retrieved on 28/1/2012 from hhtp: www saga publication. Com.
Strizek, G A Pittsonberger J.L Riordan Lyter D.M.& Oriofsky G.F. (2007. Districts, teachers, principals atid school libraries in united states of.2003-20 schools and staffing survey, national centre for education statistics.
Styron, R.A. (2008). Key characteristics of middle school performance. University of Mississippi. RMLE online research in middle level education vol.31 No.5.
Tanda, A.I. & Jaiyeoba, R. C. (2011).Effect of schools based quality factors on secondary achievement in English language in south-western and central Nigeria. Scholar link research institute journals 214l-6992.jeteraps scholar link research org.
Thomas, D. & Bass G.R. 1992. An analysis of the relationship between school climate, and Implementation of middle school practices. Research in middle level education, 16(1) 1 - 12.
and practice, 13,383-397.
77

Tschannon-Moran M. (2004). Trust matters, leadership for successful schools. San Francisco.Jossay- Bass.
Tsuo, O S. (2006). Cultural influence on academic achievement in Fiji. Australia; Sydney University
Uchefuna, M C. (2001/ A Study> o f Clinical Supervision and Teacher Effectiveness in Umuahia and Abia States. M.Educ. Dissertation, Unpublished,Port Harcourt: University of Port Harcourt, Nigeria.
Wekesa, G.W. (1993). The Impacts o f Head-teachers Instructional Leadership on Student Academic Achievement in Kenya. Unpublished PhD Dissertation, Teachers College, Columbia, Columbia University.
Walsey, P A, Fine M. Gladden, M Holland N.E. King, S.P. Mosak E, & powel L.C.(2000). Small schools: Great strides. A study o f new small schools in Chicago. Newyork: Bank street college of Education.
Welsh, W.N. (2000). The effect of school climate on school disorder. Annals o f American academy o f political and social science 567, 88-107.
Welsh, W. N. Jenkins, P.H & Greene. J.R (2006). Challenges for multi level models of school Disorder; Response to Hoffman and Johnsons Criminology 38 1289 - 1300.
Wheelan, S. & Kesselring J. (2005). Link between faculty group development and elementary Student performance on standardized test. Journal o f educational research 98 (6), 323-330.
Whitlock, J.L. (2006). Youth perception of life in school: contextual correlates of school Contextual correlates of school connectedness in adolescence. Applied Developmental Science. Vol. 10, 1, 13-29.
Wright, S.P.Horn S.P. & SanderW.L.(1997). Teacher and classroom context effect on student achievement; Implications for teacher evaluation. Journal o f personnel evaluation in education 11:57-67.
Wu, S. Pink w, Crain R & Moles, O (1982). Student suspension: A critical reappraisal. The Urban review. Vol. 14(4) 245 - 303.
Yara, P.O. (2010). Class size and students mathematics achievement of senior secondary schools in south western Nigeria. The social sciences Journal (TSS), 5(2), 108 - 112.
Yator, M. J (2003). Factors contributing to poor performance in Kenya Certificate o f Secondary Education in Kabartonjo division in Baringo district. Unpublished masters project Nairobi University.
78

Youniss J Bales S. Chrismas-best V. Diversi M , Mclaughlin Silbereisen R. (2002).Youth civic engagement in the twenty -first. Journal o f research on adolescence 12(1), 121-148.
Zuzovsky, R. (2003). Teachers’ Qualifications and Their Impact on Student achievement: Finding from T1MSS 2003 data for Israel. Centre for science and technology education, Tel Aviv University.
79

APPENDICES
Appendix A: Introductory Letter
Muriuki Ambrose
P.O. Box 58
Miidnduri.
Dear Sir/ Madam
RE: REQUEST TO CONDUCT A RES ARCH IN YOUR SCHOOL
I am a student at the University of Nairobi pursuing a master degree course in Project Planning and Management. In partial fulfillment of the requirements for this degree, I am supposed to carry out a research project and submit it to the university. The study is based on school characteristics influence on academic performance of the students. The findings of this research will be useful to the Government and the Ministry of Education, the school management and other researchers in a number of ways. The information provided will be treated with utmost confidence, especially the identity of the people involved. Please respond positively and most probably today so as to make it easy to collect the questionnaires without complications.
Tank you.
nriuki Ambrose Mwiti
0725 89 69 09
80

Appendix B
A Questionnaire for Heads of Institution/ Principals and Teachers.
Please respond to the items of this questionnaire by ticking next to the appropriate answer or writing a brief explanation in the spaces provided. This document is intended for the research work only. So please be truthful to the facts as much as possible for valid deductions.
SECTION A: BACKGROUND INFORMATION
1. Name of the institution
2. State your status in the
3. Gender
3. Age bracket:
a). Male EZJa). 2 1 -3 0 □
b) . 3 1 -4 0 □
c) . 4 1 -5 0 □
d) . 5 1 -6 0 □
b). Female □
e). others (please specify)
SECTION B: SCHOOL LEADERSHIP
school
4. How do you rate the principal’s openness and innovativeness in making and implementing school policies?
a) . Very bad
b) . Bad
c) . Good
□□□
d). Very good
e). Excellent EZ1
81

5. What is your rating of the principal’s level of empowering teachers by providing them with the necessary support and training to help them grow professionally?
a ). Very Low d ]
b) . Low cma) Average
c) . High
d) . Very high
□□□
11. How would you regard the principal’s policy of involving other teachers in decision making?
a). Very low□
b). Low □
c). Average □
d). High □
e). Very high □
7. How would you rate honesty and frequency of communication between the principal, the teachers, parents, non-teaching staff and students9
a) . Very bad I I
b) . Bad ^
c) . Good ^
d) .Very gooi~^
e) . Excellent
8. What is your rating on the principal’s level of supervising classroom attendance?
a) . Very Low
b) . Low
c) Average
□□□
82

d) . High □
e) . Very high I I
SECTION C: SCHOOL SOCIAL CLIMATE
9. How would you regard the relationship between the principal and the teachers9
a) . Very bad
b) . Bad
c) . Good
d) . Very good
e) . Excellent
10. How would you rate students’ relationship with the teachers in the school?
a) . Very bad [^ ]
b) . Bad
c) . Good
d) . Very good
e) . Excellent
12. How would you regard students’ level of interaction with other students9
a), too low □
b). low □
c). average □
d). high □
e). very high □
□□□
□□□□□
83

SECTION D TEACHER CHARACTERISTICS
13. Give the number of years you have served in the current station as a teacher._Years.
14. How would you rate the level of teachers’ preparation for the class work in your school?
a) . Very bad
b) . Bad
c) . Good
d) . Very good
e) . Excellent
15) How do you rate teachers in accomplishing their tasks and meeting set deadlines?
a) Very poor
b) Poor
c) Average
c) Very good
e) Excellent
□□□□
e). others (please specify) _________
SECTION E: SCHOOL POPULATION
17) Give the number of students in your school---------
18) What is the average number of students per class9
16. Academic qualifications:
a) . Diploma
b) . Bachelors Degree
c) . Masters Degree
d) . PhD
□□□□□
□□□□□
84
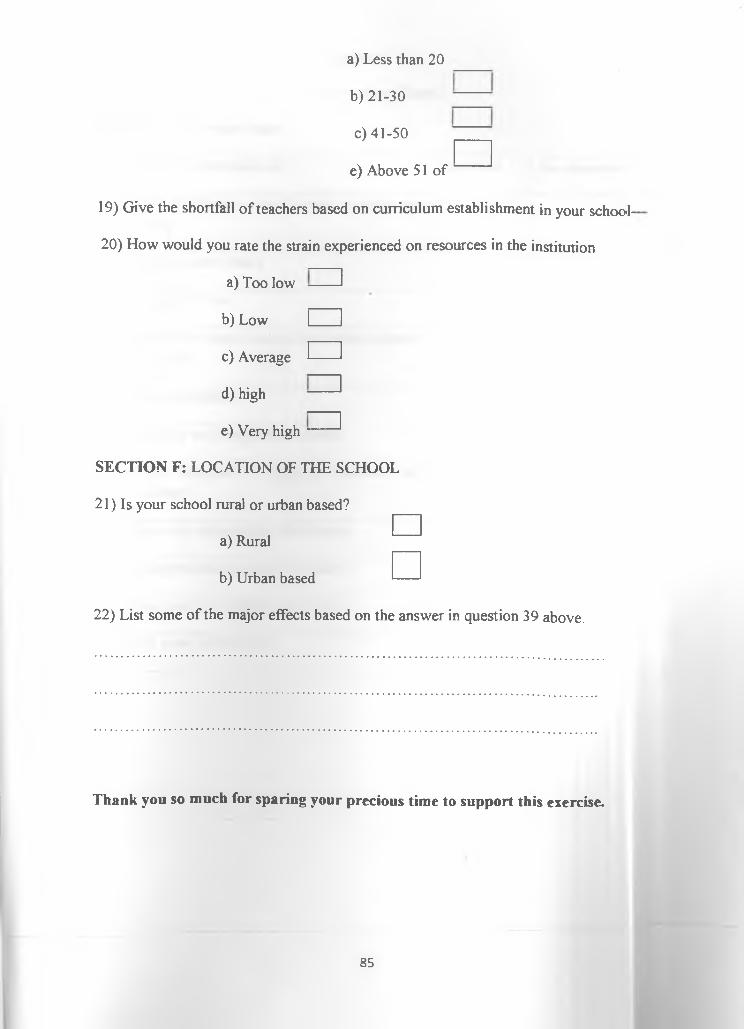
a) Less than 20
b) 21-30
c) 41-50
e) Above 51 of
19) Give the shortfall of teachers based on curriculum establishment in your school-
20) How would you rate the strain experienced on resources in the institution
a) Too low
b) Low L_
c) Average E—
d) high
e) Very high
SECTION F: LOCATION OF THE SCHOOL
21) Is your school rural or urban based?
a) Rural
b) Urban based
□
22) List some of the major effects based on the answer in question 39 above.
Thank you so much for sparing your precious time to support this exercise.
85

Appendix C
Observation Chart.
Table 1: Observation chart
Things to be observed observed Not observed
Well displayed school motto mission and vision
School notice board
Suggestion box
Displayed school routine and terms calendar of events
Neat compound
Friendly and hospitable students
Swift response to bells by teachers and students
Neat and uncongested classrooms
Equipped and spacious laboratory
Neat and uncongested classrooms
Full view of the town
86

Appendix D
KCSE score sheetName of the school
Number of candidate in the class- boys
Number of candidate in the class- girls
Students performance mean based on gender for the last three years
Genders mean 2009 mean 2010 mean 2o ll
Boys
Girls
School mean for the last three years
2009 2010 2011
87

APPENDIX E
UNIVERSITY OF NAIROBICOLLEGE OF EDUCATION AND EXTERNAL STUDIES
SCHOOL OF CONTINUING ANT) DISTANCE EDUCATION DEP ARTMENT OF EXTRA-MURAL STUDIES
TO WHOM IT MAY CONCERN
RE: MURIUKI AMBROSE MWITI - ADM NO - L50/66282/2010
This is to confirm that the above named person is a Masters student at the University of Nairobi, School of
Continuing and Distance Education, Department of Extra-Mural Studies.
He has been pursuing a M. A in P ro jec t P lan n in g a n d M an agem en t at the Meru Extra-Mural Centre since
S ep tem ber 2010. He has completed his course work units, did the exams and awaiting results.
He is currently working on his Research Project and would request your assistance to gather research
information from your organization.
orded to him will be highly appreciated.
2rju ly , 2012 R E F : U on /C ees/M em c/3 /2
C H A N D IJ . R U G E N D O R E S ID E N T L E C T U R E RM E R U E X T R A -M U R A L C E N T R E A N D IT S E N V IR O N S
88
Top Related