


Languages
Pages
Legal


volvofinans bank ab
inTERiM REPoRT1 JanUaRY - 30 JUnE 2010

The economic growth we saw during the first quarter has continued,
which is indicated by, among other things, the increase in car sales
in Sweden. The number of new registrations is expected to exceed
275 000 units for 2010, which is above the normal level.
Ford’s sale of Volvo Personvagnar AB to the Chinese company
Geely was completed at the beginning of August. The Volvo
dealerships are optimistic, and the order book situation is very positive.
The situation is the same for both Renault and Ford sales.
Other brands that are sold through the Swedish Volvo
dealerships are also moving well, as are trucks,
which are showing increased sales volumes in
all sectors. All in all, we are approaching the
autumn with an air of optimism.
Not least since sales volumes have been
increasing since March. The increase is
affected, not only by new but also used vehicle
sales as well as sales at workshops, which have
been very busy. This benefits Volvofinans Bank
through increased usage of the Volvo Card and Volvo
Truck Card. In addition, we have continued high volumes of fuel.
Sweden’s Riksbank, as expected, raised interest rates at the
beginning of July with the motivation that the Swedish economic
situation is improving. There is also a desire to indicate to Swedish
households that we are moving away from the low interest rate
levels we have had since the beginning of 2009. The indication also
given by a flatter interest curve is that future market interest rates will
remain at reasonable levels, which is positive for car sales.
In April we decided not to apply for a renewal of our affiliation
to the Swedish government’s bank guarantee scheme after the
expiry of our contract on 30th April. The general opinion is that the
Swedish financial market’s functionality have largely recovered from
the effects of the financial crisis. Volvofinans Bank has not taken
advantage of the programme since 3 July 2009, but has instead
financed itself on the market without this guarantee.
Volvofinans Bank reports a successful first half of the year with a profit
of SEK 109.6 million (86.1), an improvement of SEK 23.5 million or
27 %. The stronger profit is the result of somewhat higher margins
and an adaptation of costs. The adaptation of margins to the higher
interest rate levels will not, however, have a significant effect until the
third quarter.
Lending volumes fell slightly (1 %) compared to the previous year,
mainly due to lower vehicle sales in 2009 of both cars and
trucks. The increase in vehicle sales during 2010 will have
a significant effect, first during the second half of the
year. Furthermore the sale of used vehicles has been
historically low at Volvo dealerships, but is now
starting to return to normal. Credit card business
remains at about the same level as last year, but
has increased over recent months.
Credit losses are, as expected, remaining at a low
level and as previously only concern card portfolios.
The increase in losses that has occurred with card
transactions is mainly due to the recession.
As previously, the financing of vehicles shows no losses, which
proves that our business model with the Swedish Volvo dealerships
works well even in times of economic turmoil. Nor has there been
any significant increase in Volvo dealerships’ credit losses during the
period. The Swedish Volvo dealerships’ overall operating profit for the
whole of 2009 increased by just over SEK 400 million and has now
reverted to “normal” levels.
A strong core capital ratio, an historically stable business model
with the Volvo dealerships, the close cooperation with Volvo Cars and
Volvo Trucks, continued minimal credit loss with card transactions
and increased deposit volumes from the general public cause us to
see the future as bright.
MEssaGE fRoM THE PREsiDEnT
The information contained in this report is that which Volvofinans Bank AB (publ), corporate ID no. 556069-0967 is obliged to publish in
accordance with the Swedish Securities Market Act (SFS 2007:528). This report was submitted for publication at 4.30 p.m. on 20 August 2010.
In the event of conflict in interpretation or differences between this annual report and the Swedish version, the latter will prevail.
“The first half of the year has been positive for
Volvofinans Bank”
2
BUSINESS MISSIONThe primary task of Volvofinans Bank is to actively support sales
of products marketed by Volvo dealers on the Swedish market by
providing product and sales financing, while reporting favourable
earnings.
DURING THE YEARDuring the year Volvofinans Bank will continue to develop its
financial packages for simpler and more convenient car ownership
– for both private individuals and companies. Further developments
in leasing products, improved saving opportunities and vehicle loans
for private individuals buying vehicles on the private market have or
will be introduced during 2010.
The close co-operation between Volvofinans Bank and Volvo
dealerships creates a forum for a customer oriented and cost
effective product and service development with a long established
sales channel. Volvofinans Bank has arrangements with dealerships in
more than 200 locations throughout the country.
Also in the future, use of the CRM channel which the Volvo
Card enables will be of considerable importance. There are several
channels for tying customers closer to their dealers and thus
enabling better car ownership for all – irrespective of whether it
concerns a truck or car customer, company or private individual. The
positive trend for the Fleet Service business continues, showing an
increased interest in operational leases.
The greater awareness shown by larger company customers of
total costs for vehicle fleets is creating more business opportunities
for Volvofinans Bank.
WHAT WE OFFERThe aim of providing our custom-
ers with economical, convenient
vehicle ownership is reflected in
the products we offer:
• Loans and leases for new and used vehicles that are sold by Swedish Volvo dealerships
• Loans and leases for the truck market
• Volvo Card – car ownership card for both companies and private individuals
• Vehicle fleet administration and financing for large vehicle fleets
• Volvo Truck Card – simplifies costs management for hauliers
• Company car – a product for smaller vehicle fleets
• Personnel car – a simple way of offering employees a company car solution
• Private loan – a loan product for the purchase of used vehicles outside dealerships
• Savings account with attractive interest and free withdrawal.
For more information on our products and services visit www.volvofinans.se
“Simple, convenient vehicle ownership”
faCTs aboUT volvofinans bank
3

OWNERSHIp SITUATIONSince its establishment in 1959, Volvofinans Bank has been 50 %
owned by Swedish Volvo dealerships via their holding company AB
Volverkinvest. The Sixth Swedish National Pension Fund (AP-fonden)
owns 40 % and Volvo Car Corporation (Volvo Personvagnar AB) 10 %.
The primary task of Volvofinans Bank is to actively support sales of
products marketed by Volvo dealers on the Swedish market by provid-
ing product and sales financing, while reporting favourable earnings.
Volvofinans Bank AB is the parent company in a Group with a
dormant subsidiary. The subsidiary, Volvofinans Konto Bank AB, was
liquidated in June following withdrawal, by the Swedish Financial
Supervisory Authority on the company’s request, of permission to
conduct banking operations.
VOlUMES/lENDINGSales of new passenger cars in Sweden rose by 34 % compared with
the same period in the previous year. In total 138 079
passenger vehicles were registered (102 794). The
number of Volvo, Renault and Ford registrations
was 40 032 (29 759), and the combined market
share of Volvo and Renault was 29 % (29).
42 % (41) of all passenger car business, new
and used, within the Swedish Volvo dealerships
generates a financial contract with Volvofinans
Bank. New and used vehicle penetration is 45 %
and 38 % respectively. Volvofinans Bank finances the
Swedish Volvo dealers’ truck sales, apart from those that
take place through the AB Volvo-owned Volvo Truck Centre.
Penetration for new trucks was 48 % (50). The total contract portfolio
(loan and leasing contracts) amounted to 187 441 contracts (187 212).
The truck and bus element of the contract portfolio amounts to
8 333 contracts (8 492), which is just over 4 %.
The number of corporate customers for whom Svensk
Vagnparksfinans manages the car administration remains stable.
Administration with cost follow-up was being provided for 31 289
cars (32 491) at the end of the reporting period.
Goods and services purchased using the Volvo Card totalled
approximately SEK 5 billion, and the number of accounts actively
purchasing is half a million per month. Goods and services for SEK
261 million were bought with Volvo Truck Card via the 22 600 card.
The total lend volume for the Group amounted to SEK 22.3 billion
as opposed to SEK 22.6 billion for the previous year.
The truck and bus share of lending was SEK 3.6 billion (3.8), which
corresponds to 16 % of total lending for the previous year.
The Group’s primary segments are the business lines of the
passenger car market and truck market. The geographic distribution
reflects the Group as a whole. The passenger car market segment
includes financing for passenger cars through loans and leases,
vehicle administration and the Volvo Card. The truck market segment
includes financing for trucks and buses as well as Volvo Truck Card.
The operating income, operating profit, number of contracts and
lending volumes for Volvofinans Bank’s lines of business are presented
below. Operating income is defined as the net of interest income,
interest expenses, leasing net, dividends received, net result of
financial transactions, commission income and commission expenses.
Jan-June 2010 Cars Trucks Group
Assets, SEK million (average) 19 696 4 111 23 807
Lending volume, SEK million (average) 19 200 3 979 23 179
Operating revenue, SEK T 247 154 16 138 263 293*
Operating profit, SEK T 102 738 6 895 109 633
Expenses, SEK T 135 873 8 447 144 320*
Number of contracts (average) 209 511 8 298 217 809
Expenses are defined as general administration
expenses and other operating expenses.
Volvofinans Bank is of the opinion that it is not
relevant to divide up its liabilities among the vari-
ous segments. Borrowing is determined by the
total requirement and cannot be attributed to a
specific segment.
INcOMEVolvofinans Bank’s income before credit loss is
SEK 119.0 million (93.0). The primary reason for this improvement
is higher margins and greater interest rate stability. Income
before appropriations and taxes for the period rose by 27 % to
SEK 109.6 million (86.1).
cREDIT RISkS AND cREDIT lOSSESThe Group’s credit risk continues to be very low as most of the credit
risks and residual value risks are borne by the Volvo dealerships.
Problem credits are all receivables that are overdue by more than
90 days. Volvofinans Bank’s problem credits for credit card receivables
total SEK 129.9 million (112.2) and for loan and lease lending
SEK 154.1 million (157.8). The increase in problem credits is due to an
AB Volverk-invest
50 %
VolVofinAns BAnk AB
The swedish Volvo
dealers
sixth AP-fund
10 %40 %Volvo
Personvagnar AB
“Volvofinans Bank’s income
before credit loss expenses
is SEK 119.0 million (93.0)”
30/06/2010 number of contracts
Average contract, sEk T
Collateral value, sEk million
Drawn credit, sEk million
loan to value ratio
Market value, sEk million
surplus, sEk million
surplus,per cent
Loans 114 642 98 11 261 10 814 96 % 16 844 6 030 56 %
Leases 72 799 151 10 966 8 807 80 % 10 697 1 890 21 %
Total 187 441 119 22 227 19 621 88 % 27 541 7 920 40 %
* The amounts differ from the Group’s operating income and expenses because the follow-up of seg-ment performance occurs without any Group eliminations and reclassification
of operational lease assets as finance lease assets.
4

5
increase in the average liability for credit cards, partly as the result of
higher fuel prices and the economic depression. The dealers bear the
credit risk through recourse agreements for the greater part,
SEK 150.1 million, of the problem credits relating to loans and leases.
There are no loans for which interest concessions have been agreed,
and no property has been received to provide security for receivables.
The confirmed customer losses mainly concern credit card-
transactions. Anticipated credit loss impairment for the household
segment is determined using statistical risk models and for the
corporate segment by means of a manual review.
Amounts in sEk T Group Parent Company
Jan-June 2010
Jan-June 2009
Jan-June 2010
Jan-June 2009
Confirmed credit losses
Confirmed credit losses - 8 674 - 5 327 - 8 674 - 5 327
Recovered losses 43 57 43 57
Total - 8 631 - 5 270 - 8 631 - 5 270
Provisions for credit risk
Reserve for anticipatedcredit losses - 710 - 1 542 - 710 - 1 542
Credit losses, net - 9 341 - 6 812 - 9 341 - 6 812
cApITAl pROcUREMENTFinancial instability has occurred periodically during the first half of the
year causing borrowing margins to increase and later fall back. Liquid-
ity on the market has remained good however, and Volvofinans Bank
has successfully borrowed funds in both the short and long term on
the market via the bank’s commercial paper and MTN programmes re-
spectively. Total outstanding financing on the Swedish and European
capital markets amounted to SEK 11.6 billion at the end of the first half
year.
Volvofinans Bank decided not to apply for a renewal of its
affiliation to the Swedish government’s bank guarantee scheme after
the expiry of its contract on 30th April, 2010.
In addition to market borrowing, operations were financed by
the amount of SEK 4.3 billion in the form of bank loans, as well as
customer deposits of SEK 2.3 billion at the end of the first half year. At
the end of the period, 61 % of long-term financing had a remaining
term of more than one year.
RATINGVolvofinans Bank has international credit ratings from Moody’s
Investors Service as follows:
• Short-term financing: P-2
• Long-term financing: Baa2
On 10th May, Moody’s announced that Volvofinans Bank’s rating
for long-term borrowing had been lowered by one level from Baa1 to
Baa2. The rating for short-term borrowing, P-2, was confirmed at the
same time. Moody´s analysis is available for viewing on our website,
www.volvofinans.se.
FINANcIAl RISkSAs the Group operates within the financial sector, the company is
continuously exposed to a number of financial risks.
Liquidity risk is the risk that Volvofinans Bank’s payment obligations
cannot be met on maturity without significant costs in terms of the
means of payment or – in a worst-case scenario – cannot be met by
any means. For shorter periods of liquidity instability, Volvofinans Bank
has a daily surplus liquidity of SEK 500 – 1 500 million. In order to secure
its ability to pay, Volvofinans Bank has entered into agreements with
banks concerning credit facilities that can be utilised at short notice.
Borrowing with a remaining period of less than one year must be
covered at all times by undrawn credit facilities. The total volume of
available facilities at the end of the first half year was SEK 9.6 billion.
Interest rate risk is the current and future risk that net interest
income declines as a result of unfavourable changes in the interest
rate. The vast majority of Volvofinans Bank’s lending and all borrowing
follow the short-term market interest rate, which involves a limited
interest rate risk.
Currency risk is the risk of unfavourable changes in exchange
rates. All of Volvofinans Bank’s lending is in Swedish kronor and any
borrowing in foreign currency is hedged, thus Volvofinans Bank is not
exposed to fluctuations in exchange rates.
cApITAl ADEQUAcYCapital adequacy means that capital requirements are connected to
the total risk profile of the institute, which in the case of Volvofinans
Bank entails a lower minimum capital requirement.
Volvofinans Bank calculates the capital requirement for credit risk
using the standardised method, which means that all exposures are
allocated to one of fifteen exposure categories with a different risk
weighting for each category.
The capital requirement for operational risk is calculated using the
base indicator method, which means that the capital requirement is
15 % of the average operating income for the last three financial years.
EVENTS AFTER THE BAlANcE SHEET DATENo other significant events have occurred since the end of the
reporting period.

INTERIM REpORTThe interim report provides a true and fair overview of the business, financial position and results of the Parent Company and the
Group and describes significant risks and uncertainty factors with which the Parent Company and the companies forming part of
the Group are faced.
Gothenburg, August 2010
Bert Björn
President
Volvofinans Bank AB
Urmas K ruusval
Chairman of the board
Head of Direct Investments,
Sixth Swedish National Pension Fund,
Gothenburg
Tommy Andersson
Chairman of The Volvo Dealer
Association,
Gothenburg
Thomas Andersson
President, Volvo Personbilar Sverige AB,
Gothenburg
Bob Persson
President, AB Persson Invest,
Östersund
Jan Pettersson
President and CEO, Bilia AB,
Gothenburg
Per Rinder
Senior Adviser, Sixth Swedish National
Pension Fund,
Stockholm
The report for 30 September will be published on 17 November 2010 and will be available on our website www.volvofinans.se
If you have any questions, please contact our President, Bert Björn, on +46 (0)31 83 88 00.
This report has not been the subject of special examination by the company’s auditors.
6

Amounts in sEk million
Parent Company 30/06/2010 Parent Company 30/06/2009
Capital base
Capital base 3 066 2 971
Core capital 2 859 2 761
Supplementary capital 207 210
Capital requirement
Capital requirement for credit risk using the standardised method 1 544 1 582
Capital requirement for operational risk using the base indicator method 87 89
Total minimum capital requirement pursuant to Basel II 1 631 1 671
Total minimum capital requirement pursuant to Basel I 1 829 1 886
Measurement of capital adequacy
Capital adequacy ratio 1.88 1.77
Capital adequacy level 15.04 14.16
Core capital ratio 14.02 13.15
Information concerning capital adequacy disclosed by the Parent Company Volvofinans Bank AB is set out above since the Group is not part of a financial corporate group. The capital adequacy amount is translated from 2009 because of changes in the calculation of risk-weighed amount (adjustment with respect to operational risk).
Amounts in sEk T
Group Parent Company
Jan-Jun 2010 Apr-Jun 2010 Jan-Jun 2009 Apr-Jun 2009 Jan-Jun 2010 Apr-Jun 2010 Jan-Jun 2009 Apr-Jun 2009
Interest income 250 206 124 649 355 270 146 631 196 906 99 737 266 035 114 782
Lease income 350 536 202 808 125 497 62 361 1 220 810 613 501 1 169 840 569 534
Interest expense - 137 192 - 71 659 - 263 489 - 95 522 - 137 192 - 71 659 - 263 489 - 95 522
Dividends received - - - - - - - -
Net result of financial transactions* - 866 204 2 841 3 088 - 866 204 2 841 3 088
Commission income 150 410 78 718 144 351 74 914 150 410 78 718 144 351 74 914
Commission expenses - 20 739 - 9 971 - 15 659 - 8 095 - 20 739 - 9 971 - 15 659 - 8 095
Total operating income 592 355 324 749 348 811 183 377 1 409 329 710 530 1 303 919 658 701
General administration expenses - 115 978 - 57 392 - 114 639 - 57 904 - 115 978 - 57 392 - 114 639 - 57 904
Depreciation of property, plant and equipment - 338 945 - 195 309 - 125 267 - 63 479 - 1 155 919 - 581 090 - 1 080 375 - 538 803
Other operating expenses - 18 458 - 14 031 - 15 984 - 10 611 - 18 458 - 14 031 - 15 980 - 10 606
Total operating expenses - 473 381 - 266 732 - 255 890 - 131 994 - 1 290 355 - 652 513 - 1 210 994 - 607 313
income before credit losses 118 974 58 017 92 921 51 383 118 974 58 017 92 925 51 388
Credit losses, net - 9 341 - 3 993 - 6 812 - 853 - 9 341 - 3 993 - 6 812 - 853
income before appropriations and taxes 109 633 54 024 86 109 50 530 109 633 54 024 86 113 50 535
Appropriations - - - - - - - -
Taxes - 28 833 - 14 208 - 22 647 - 13 290 - 28 833 - 14 208 - 22 648 - 13 291
income 80 800 39 816 63 462 37 240 80 800 39 816 63 465 37 244
* Net income from financial transactions
Currency related - - 74 - - - 74 -
Interest-bearing securities and related derivatives - 866 204 2 767 3 088 - 866 204 2 767 3 088
Total - 866 204 2 841 3 088 - 866 204 2 841 3 088
CaPiTal aDEQUaCY
sTaTEMEnT of inCoME
7
8
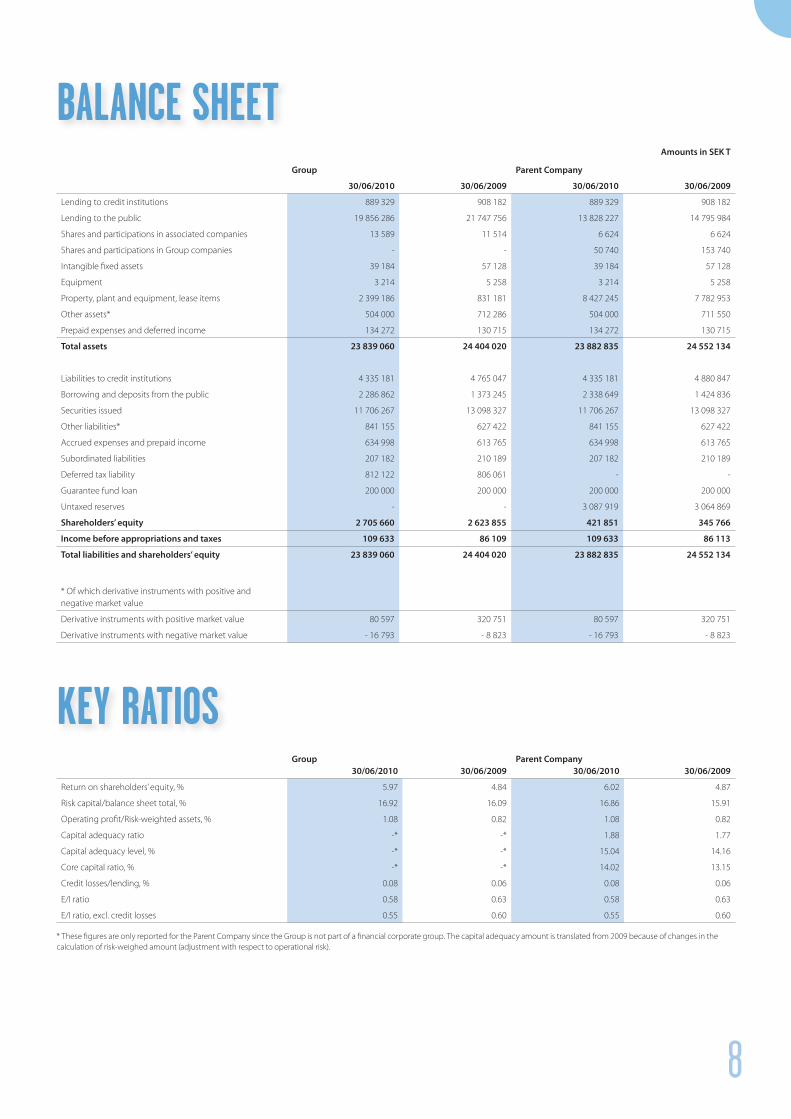
Amounts in sEk T
Group Parent Company
30/06/2010 30/06/2009 30/06/2010 30/06/2009
Lending to credit institutions 889 329 908 182 889 329 908 182
Lending to the public 19 856 286 21 747 756 13 828 227 14 795 984
Shares and participations in associated companies 13 589 11 514 6 624 6 624
Shares and participations in Group companies - - 50 740 153 740
Intangible fixed assets 39 184 57 128 39 184 57 128
Equipment 3 214 5 258 3 214 5 258
Property, plant and equipment, lease items 2 399 186 831 181 8 427 245 7 782 953
Other assets* 504 000 712 286 504 000 711 550
Prepaid expenses and deferred income 134 272 130 715 134 272 130 715
Total assets 23 839 060 24 404 020 23 882 835 24 552 134
Liabilities to credit institutions 4 335 181 4 765 047 4 335 181 4 880 847
Borrowing and deposits from the public 2 286 862 1 373 245 2 338 649 1 424 836
Securities issued 11 706 267 13 098 327 11 706 267 13 098 327
Other liabilities* 841 155 627 422 841 155 627 422
Accrued expenses and prepaid income 634 998 613 765 634 998 613 765
Subordinated liabilities 207 182 210 189 207 182 210 189
Deferred tax liability 812 122 806 061 - -
Guarantee fund loan 200 000 200 000 200 000 200 000
Untaxed reserves - - 3 087 919 3 064 869
shareholders’ equity 2 705 660 2 623 855 421 851 345 766
income before appropriations and taxes 109 633 86 109 109 633 86 113
Total liabilities and shareholders’ equity 23 839 060 24 404 020 23 882 835 24 552 134
* Of which derivative instruments with positive and negative market value
Derivative instruments with positive market value 80 597 320 751 80 597 320 751
Derivative instruments with negative market value - 16 793 - 8 823 - 16 793 - 8 823
Group 30/06/2010 30/06/2009
Parent Company 30/06/2010 30/06/2009
Return on shareholders’ equity, % 5.97 4.84 6.02 4.87
Risk capital/balance sheet total, % 16.92 16.09 16.86 15.91
Operating profit/Risk-weighted assets, % 1.08 0.82 1.08 0.82
Capital adequacy ratio -* -* 1.88 1.77
Capital adequacy level, % -* -* 15.04 14.16
Core capital ratio, % -* -* 14.02 13.15
Credit losses/lending, % 0.08 0.06 0.08 0.06
E/I ratio 0.58 0.63 0.58 0.63
E/I ratio, excl. credit losses 0.55 0.60 0.55 0.60
* These figures are only reported for the Parent Company since the Group is not part of a financial corporate group. The capital adequacy amount is translated from 2009 because of changes in the calculation of risk-weighed amount (adjustment with respect to operational risk).
balanCE sHEET
kEY RaTios

9
Amounts in sEk T
Jan - June 2010 Jan - June 2009
Ongoing operations
Operating profit 109 633 86 109
Amortisation 338 945 125 267
Changes in operating assets and liabilities
Lending to credit institutions 574 211 - 310 868
Lending to the public - 341 295 1 075 100
Other assets 207 154 135 020
Liabilities to credit institutions 219 241 - 2 501 884
Borrowing from the public 434 364 652 173
Securities issued - 1 138 923 855 695
Other liabilities 229 543 - 34 949
Cash flows from operating activities 632 873 81 663
Investing activities
Change in intangible fixed assets - 8 666
Change in shares and participations 1 222 -
Change in property plant and equipment - 551 976 - 55 055
Cash flows from investing activities - 550 754 - 46 389
Financing activities
Debenture loans - 2 119 626
Dividend paid - 80 000 - 35 900
Cash flows from financing activities - 82 119 - 35 274
Cash flow for the period
Cash and cash equivalents at start of year - -
Cash flows from operating activities 632 873 81 663
Cash flows from investing activities - 550 754 - 46 389
Cash flows from financing activities - 82 119 - 35 274
Cash and cash equivalents at the end of the period - -
Amounts in sEk T
Group Parent Company
Jan-Jun 2010 Apr-Jun 2010 Jan-Jun 2009 Apr-Jun 2009 Jan-Jun 2010 Apr-Jun 2010 Jan-Jun 2009 Apr-Jun 2009
Income from operational and finance leases 350 536 202 808 125 497 62 361 1 220 810 613 501 1 169 840 569 534
Scheduled amortisation - 329 062 - 190 459 - 114 630 - 58 235 - 1 146 036 - 576 240 - 1 069 738 - 533 559
Interest income 250 206 124 649 355 270 146 631 196 906 99 737 266 035 114 782
Interest expense - 137 192 - 71 659 - 263 489 - 95 522 - 137 192 - 71 659 - 263 489 - 95 522
Accumulated net interest 134 488 65 339 102 648 55 235 134 488 65 339 102 648 55 235
In the Parent Company, all lease agreements are reported as operating leases, while in the Group some of them are reported as finance leases. This means that the net finance leases are reclassified as interest income in the consolidated accounts.
lEasE inCoME anD aCCUMUlaTED nET inTEREsT
ConsoliDaTED CasH floW sTaTEMEnT
10
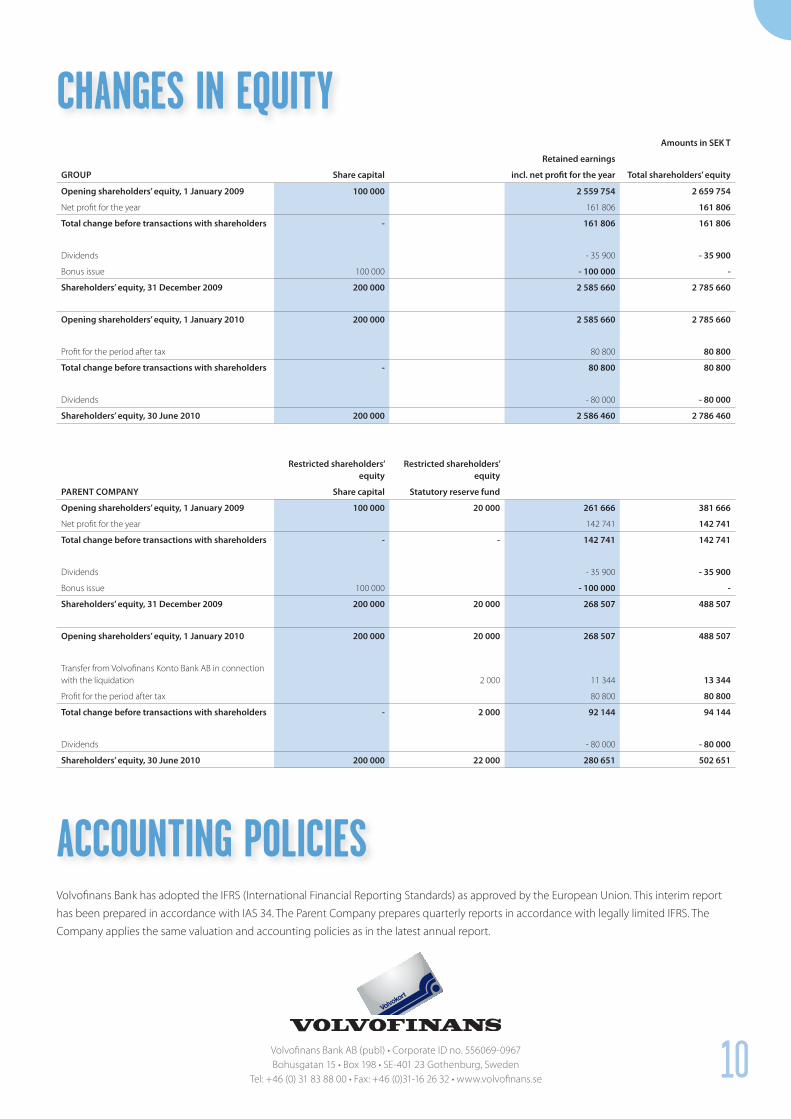
Amounts in sEk T
Retained earnings
GRouP share capital incl. net profit for the year Total shareholders’ equity
opening shareholders’ equity, 1 January 2009 100 000 2 559 754 2 659 754
Net profit for the year 161 806 161 806
Total change before transactions with shareholders - 161 806 161 806
Dividends - 35 900 - 35 900
Bonus issue 100 000 - 100 000 -
shareholders’ equity, 31 December 2009 200 000 2 585 660 2 785 660
opening shareholders’ equity, 1 January 2010 200 000 2 585 660 2 785 660
Profit for the period after tax 80 800 80 800
Total change before transactions with shareholders - 80 800 80 800
Dividends - 80 000 - 80 000
shareholders’ equity, 30 June 2010 200 000 2 586 460 2 786 460
Restricted shareholders’ equity
Restricted shareholders’ equity
PAREnT CoMPAny share capital statutory reserve fund
opening shareholders’ equity, 1 January 2009 100 000 20 000 261 666 381 666
Net profit for the year 142 741 142 741
Total change before transactions with shareholders - - 142 741 142 741
Dividends - 35 900 - 35 900
Bonus issue 100 000 - 100 000 -
shareholders’ equity, 31 December 2009 200 000 20 000 268 507 488 507
opening shareholders’ equity, 1 January 2010 200 000 20 000 268 507 488 507
Transfer from Volvofinans Konto Bank AB in connection with the liquidation 2 000 11 344 13 344
Profit for the period after tax 80 800 80 800
Total change before transactions with shareholders - 2 000 92 144 94 144
Dividends - 80 000 - 80 000
shareholders’ equity, 30 June 2010 200 000 22 000 280 651 502 651
Volvofinans Bank has adopted the IFRS (International Financial Reporting Standards) as approved by the European Union. This interim report
has been prepared in accordance with IAS 34. The Parent Company prepares quarterly reports in accordance with legally limited IFRS. The
Company applies the same valuation and accounting policies as in the latest annual report.
Volvofinans Bank AB (publ) • Corporate ID no. 556069-0967Bohusgatan 15 • Box 198 • SE-401 23 Gothenburg, Sweden
Tel: +46 (0) 31 83 88 00 • Fax: +46 (0)31-16 26 32 • www.volvofinans.se
CHanGEs in EQUiTY
aCCoUnTinG PoliCiEs
Top Related