


Languages
Pages
Legal


Industry Overview and RFP Results
October 12, 2017
Table of Contents
Slide
• Current ABLE Market Information 3
• Third Party Service Providers 7
• Plan Features 10
• Fees 13
2
3
Section 1.
Current ABLE Market Information
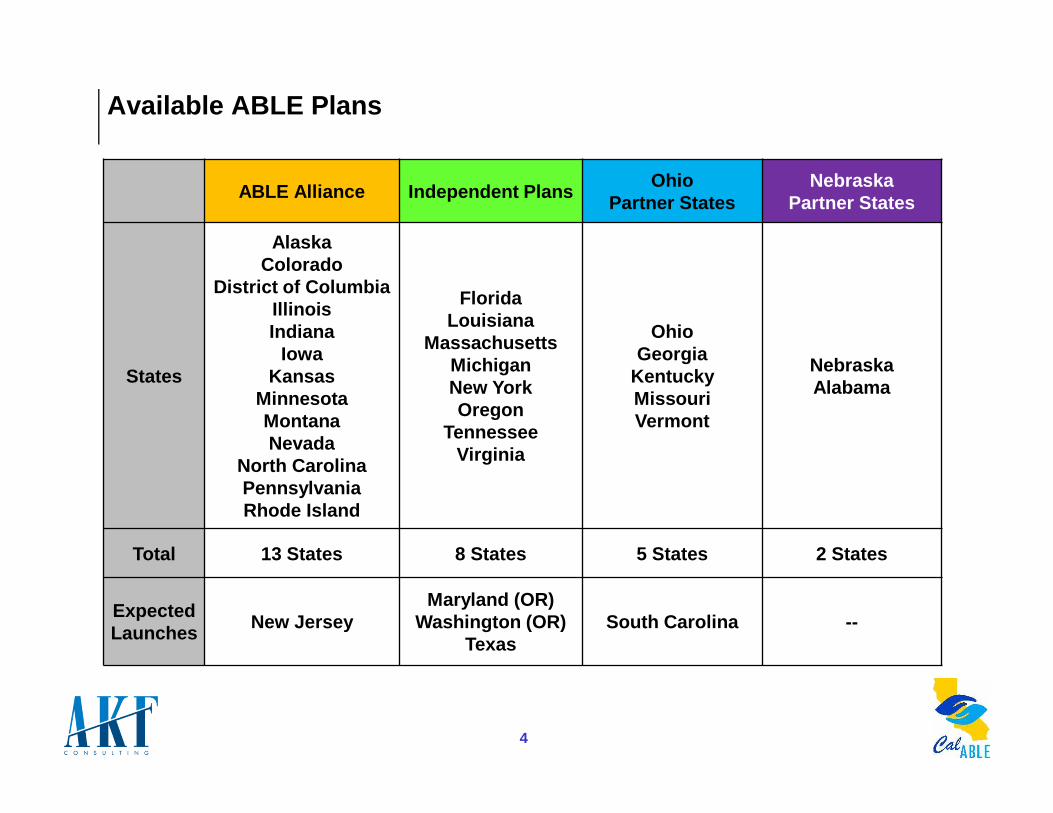
Available ABLE Plans
ABLE Alliance Independent PlansOhio
Partner StatesNebraska
Partner States
States
AlaskaColorado
District of ColumbiaIllinoisIndiana
IowaKansas
Minnesota MontanaNevada
North CarolinaPennsylvaniaRhode Island
FloridaLouisiana
MassachusettsMichiganNew YorkOregon
TennesseeVirginia
OhioGeorgia
KentuckyMissouriVermont
NebraskaAlabama
Total 13 States 8 States 5 States 2 States
Expected Launches
New JerseyMaryland (OR)
Washington (OR)Texas
South Carolina --
4

Overall ABLE Market
Source: Assets and accounts data from Strategic Insight as of June 30, 2017
Assets Accounts Average Account Size
ABLE Alliance $2,972,154 984 $3,020
Ohio Partner States $13,741,513 3,226 $4,260
Nebraska Partner States $4,053,590 1,079 $3,757
Independent Plans $16,177,528 5,069 $3,191
Industry Total $36,944,785 10,358 $3,567
8%
37%
11%
44%
Assets
9%
31%
10%
49%
Accounts
5

Status of Independent Plans
Launch Date Assets Accounts Average Account Size
Tennessee 6/10/16 $5,250,309 1,113 $4,717
Florida 7/1/16 $3,676,241 1,038 $3,542
Virginia 12/19/16 $2,780,851 1,517 $1,833
Oregon 12/6/16 $1,972,472 563 $3,504
Michigan 11/1/16 $1,957,054 528 $3,707
Massachusetts 5/10/17 $540,601 310 $1,744
Total $16,177,528 5,069 $3,191
32%
23%
17%
12%
12%3%
Assets
30%
22%20%
11%
10%
6%
Accounts
6
Source: Assets and accounts data from Strategic Insight as of June 30, 2017
Notes: Plans are listed by asset size. Louisiana and New York launched after June 30, 2017

7
Section 2.
Third Party Service Providers
8
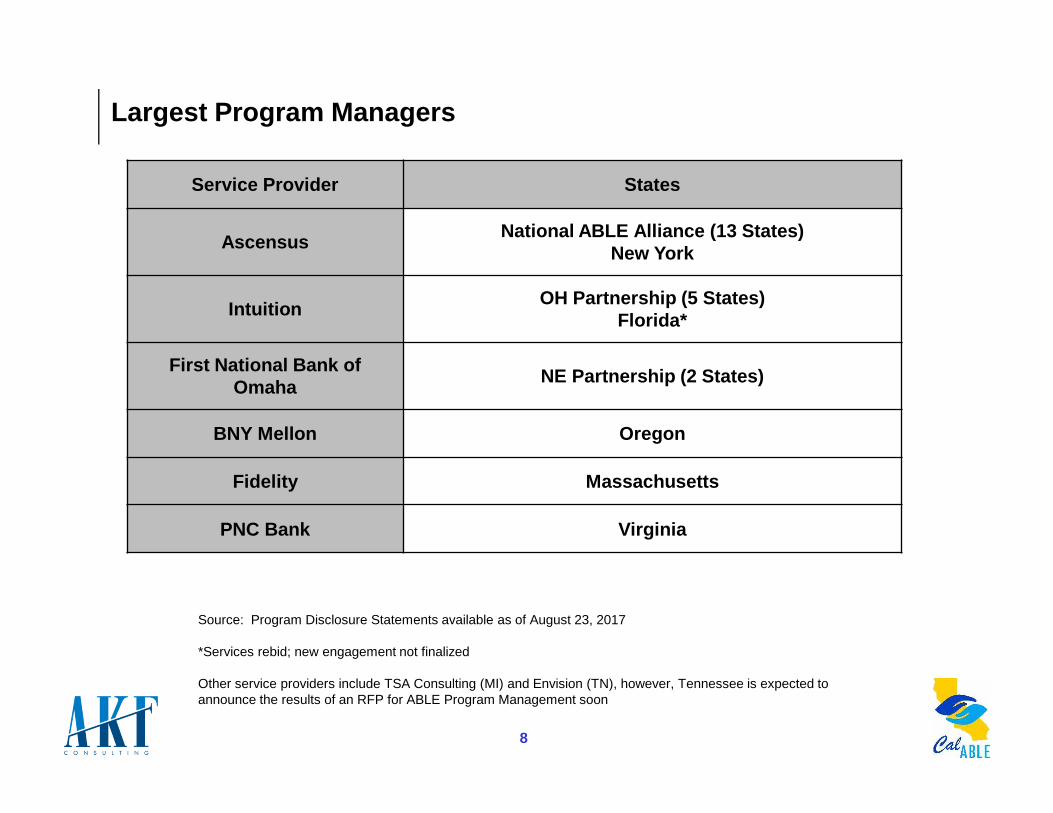
Largest Program Managers
Service Provider States
AscensusNational ABLE Alliance (13 States)
New York
IntuitionOH Partnership (5 States)
Florida*
First National Bank of Omaha
NE Partnership (2 States)
BNY Mellon Oregon
Fidelity Massachusetts
PNC Bank Virginia
Source: Program Disclosure Statements available as of August 23, 2017
*Services rebid; new engagement not finalized
Other service providers include TSA Consulting (MI) and Envision (TN), however, Tennessee is expected to announce the results of an RFP for ABLE Program Management soon

9
Presence of Investment Managers
Investment Manager States
Vanguard
National ABLE Alliance (13 Plans)NE Partnership (2 Plans)OH Partnership (5 Plans)
FL LA MI NY OR TN VA
BlackRockNational ABLE Alliance
FL
Schwab National ABLE Alliance
DFA MI OR TN
Fidelity MA VA
Source: Program Disclosure Statements available as of August 23, 2017

10
Section 3.
Plan Features
11
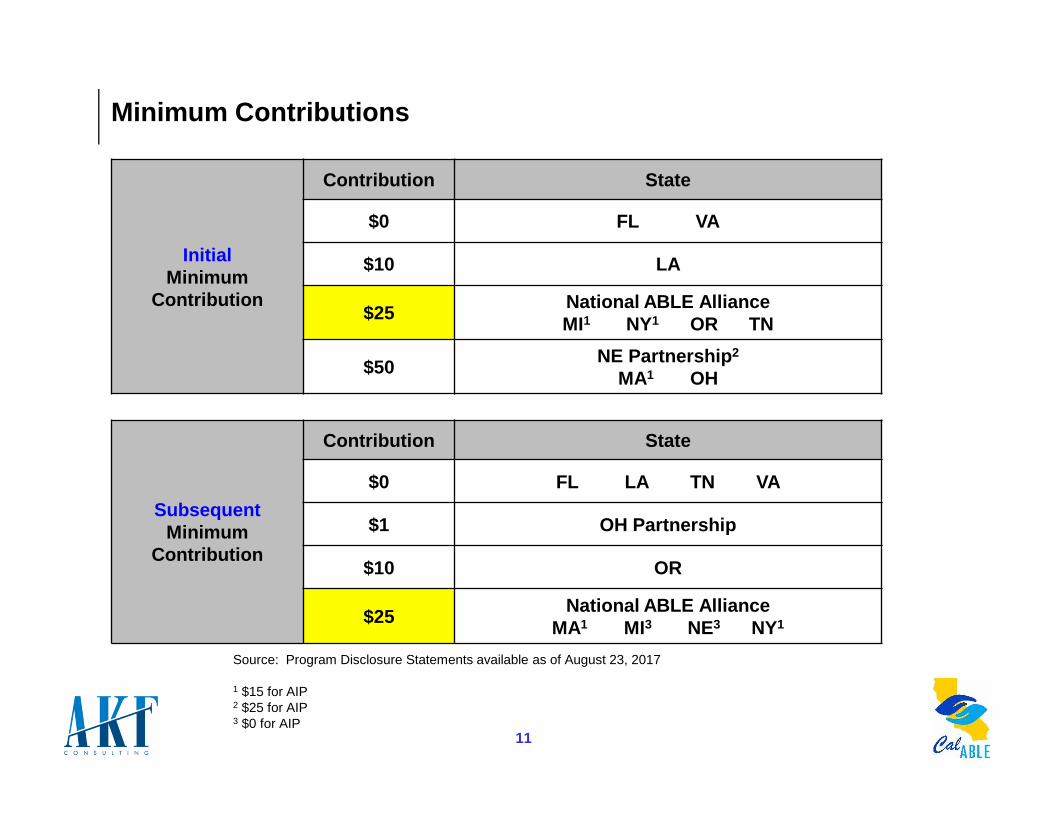
Minimum Contributions
InitialMinimum
Contribution
Contribution State
$0 FL VA
$10 LA
$25National ABLE AllianceMI1 NY1 OR TN
$50NE Partnership 2
MA1 OH
Source: Program Disclosure Statements available as of August 23, 2017
1 $15 for AIP2 $25 for AIP3 $0 for AIP
SubsequentMinimum
Contribution
Contribution State
$0 FL LA TN VA
$1 OH Partnership
$10 OR
$25National ABLE Alliance
MA1 MI3 NE3 NY1
12
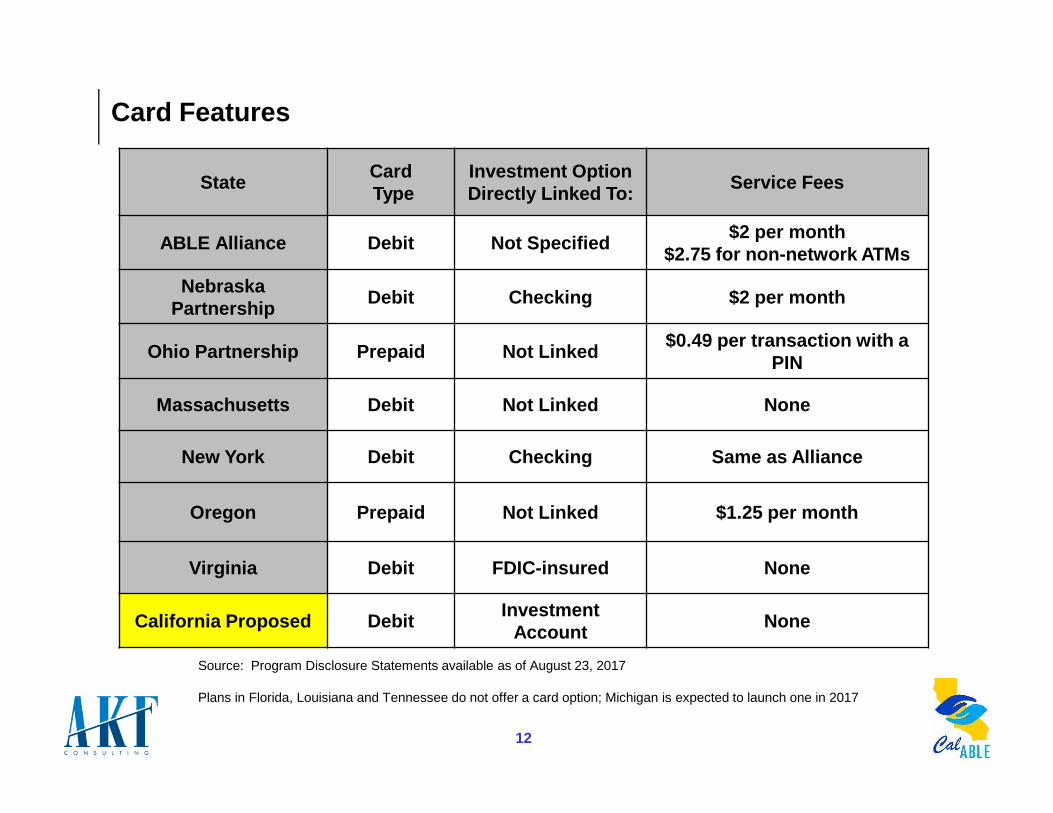
Card Features
StateCardType
Investment Option Directly Linked To:
Service Fees
ABLE Alliance Debit Not Specified$2 per month
$2.75 for non-network ATMs
Nebraska Partnership
Debit Checking $2 per month
Ohio Partnership Prepaid Not Linked$0.49 per transaction with a
PIN
Massachusetts Debit Not Linked None
New York Debit Checking Same as Alliance
Oregon Prepaid Not Linked $1.25 per month
Virginia Debit FDIC-insured None
California Proposed DebitInvestment
AccountNone
Source: Program Disclosure Statements available as of August 23, 2017
Plans in Florida, Louisiana and Tennessee do not offer a card option; Michigan is expected to launch one in 2017

13
Section 4.
Fees

14
Asset-Based Management Fees
Plan Program Management Fee State Admin Fee
Michigan 0.50% --
NE Partnership 0.50% --
New York 0.36 - 0.38% Included, if any
National ABLE Alliance 0.32% --
California Proposed0.25% for all except:
0.05% for Ultrashort Prime 0.10% for ANOVA
0.05% - 0.10%
Oregon 0.20% 0.10%
Virginia 0.15% 0.10%
Massachusetts 0.15% 0.05%
Tennessee -- 0 - 0.31%
OH Partner States -- 0.19%
OH Non-Partner States -- 0.45%
Florida Not specified Not specified
Source: Program Disclosure Statements available as of August 23, 2017. Does not include Louisiana
15
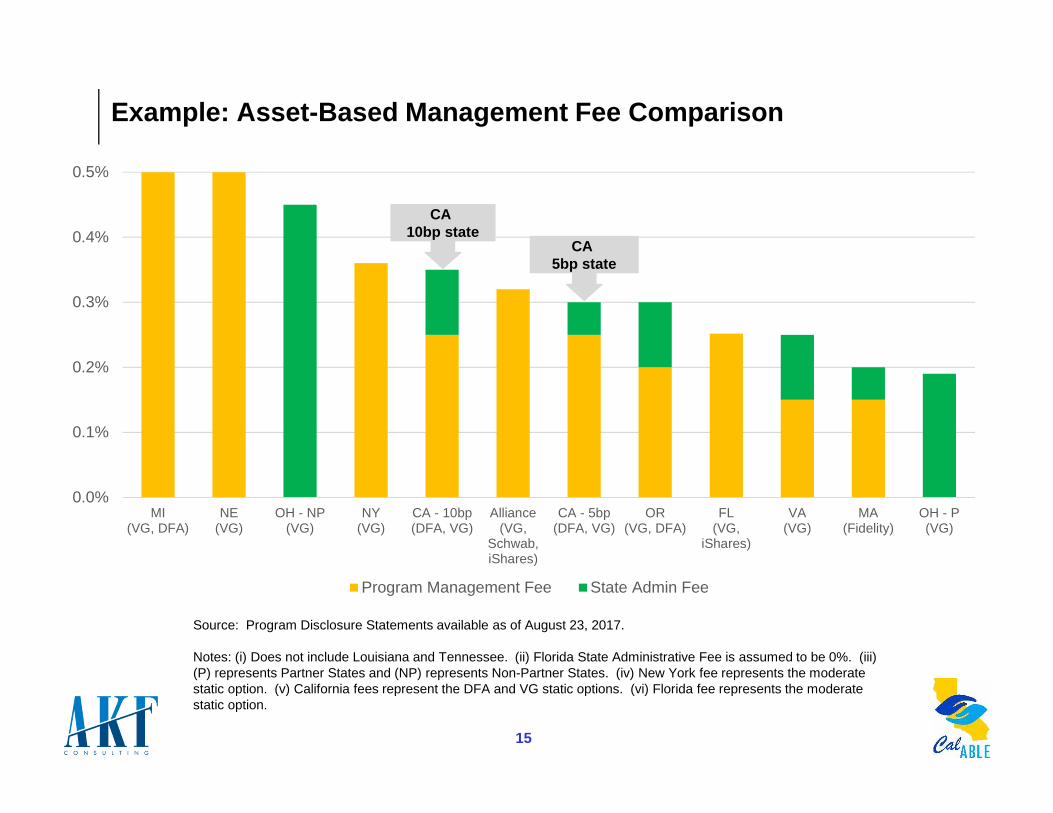
Example: Asset-Based Management Fee Comparison
0.0%
0.1%
0.2%
0.3%
0.4%
0.5%
MI(VG, DFA)
NE(VG)
OH - NP(VG)
NY(VG)
CA - 10bp(DFA, VG)
Alliance(VG,
Schwab,iShares)
CA - 5bp(DFA, VG)
OR(VG, DFA)
FL(VG,
iShares)
VA(VG)
MA(Fidelity)
OH - P(VG)
Program Management Fee State Admin Fee
Source: Program Disclosure Statements available as of August 23, 2017.
Notes: (i) Does not include Louisiana and Tennessee. (ii) Florida State Administrative Fee is assumed to be 0%. (iii) (P) represents Partner States and (NP) represents Non-Partner States. (iv) New York fee represents the moderate static option. (v) California fees represent the DFA and VG static options. (vi) Florida fee represents the moderate static option.
CA 10bp state
CA 5bp state

16
Example: Asset-Based Total Fee Comparison
0.0%
0.1%
0.2%
0.3%
0.4%
0.5%
0.6%
0.7%
0.8%
0.9%
1.0%
MA(Fidelity)
MI(VG,DFA)
CA - 10bp(DFA)
OH - NP(VG)
CA - 5bp(DFA)
NE(VG)
NY(VG)
VA(VG)
CA - 10bp(VG)
Alliance(VG,
Schwab,iShares)
OR(VG,DFA)
CA - 5bp(VG)
OH - P(VG)
FL(VG,
iShares)
60/40 Static Allocation Portfolio
Underlying Fund Fee Program Management Fee State Admin Fee
Source: Program Disclosure Statements available as of August 23, 2017.
Notes: (i) Does not include Louisiana and Tennessee. (ii) Used 50/50 static allocation portfolio for Oregon because 60/40 is not offered. (iii) Florida State Administrative Fee is assumed to be 0%. (iv) (P) represents Partner States and (NP) represents Non-Partner States. (v) CA (VG) portfolios are domestic 60%/40% static allocation portfolios created from the VG Total Stock Market Index and VG Total Bond Market Index individual options proposed by Nottingham.
CA (DFA) 10bp
CA (VG)5bp
CA (VG) 10bp
CA (DFA)5bp

17
Dollar-Based Annual Account Maintenance Fees
Plan Residents Non-Residents Fee Recipient
National ABLE Alliance $55-60 $60 State
PartnershipsNE $45 same Unclear
OH $30 $421 Intuition
Independent
CA $362 $362 Nottingham3
FL $30 -- --
LA -- -- --
MA $30 $30 Fidelity
MI $45 $45 Unclear
NY $55 Same --
OR $22.50 - through 2017$45 - beyond 2017
$35 Unclear
TN -- -- --
VA $39 $39 Appears to go to State
Source: Program Disclosure Statements available as of August 23, 2017
1 Non-Ohio residents pay $3.50 monthly regardless of whether their State of residency is a Partner State2 Assumes 10,000 accounts, which equates to $3 monthly based on Nottingham’s response 3 $10 p/account onboarding fee also proposed

18
Hypothetical Fee Comparisons: Year 1
State Plan
Investment Option (60/40 static)
California
Dimensional 2030
California
Vanguard Domestic 1
Illinois
Growth
Ohio
Moderate Growth
Oregon
Moderate 2
Assumed Assets 3 $3,000 $3,000 $3,000 $3,000 $3,000
Asset-based Fee (bp) 0.61%4 0.39%4 0.37% 0.33% 0.37%
Asset-based Fee ($) $18.30 $11.70 $11.10 $9.90 $11.10
Year 1 Onboarding Fee ($) $10.00 $10.00 -- -- --
Account Maintenance Fee ($) $36.005 $36.005 $60.006 $42.006 $35.006
Total Annual Fees $64.30 $57.70 $71.10 $51.90 $46.10
Basis Point Equivalent 2.14% 1.92% 2.37% 1.73% 1.54%
Source: Program Disclosure Statements available as of August 23, 2017
Notes: (1) CA Vanguard Domestic portfolio is a domestic 60%/40% static allocation portfolio created from the VG Total Stock Market Index and VG Total Bond Market Index individual options proposed by Nottingham. (2) Used 50/50 static allocation portfolio because 60/40 is not offered. (3) Assumes assets remain constant over time. (4) Includes 10bp state admin fee. (5) Annual maintenance fee assumes up to 10,000 accounts. (6) Nonresident account maintenance fees.

19
Hypothetical Fee Comparisons: Year 2 and Beyond
State Plan
Investment Option (60/40 static)
California
Dimensional 2030
California
Vanguard Domestic 1
Illinois
Growth
Ohio
Moderate Growth
Oregon
Moderate 2
Assumed Assets 3 $3,000 $3,000 $3,000 $3,000 $3,000
Asset-based Fee (bp) 0.61%4 0.39%4 0.37% 0.33% 0.37%
Asset-based Fee ($) $18.30 $11.70 $11.10 $9.90 $11.10
Year 1 Onboarding Fee ($) -- -- -- -- --
Account Maintenance Fee ($) $36.005 $36.005 $60.006 $42.006 $35.006
Total Annual Fees $54.30 $47.70 $71.10 $51.90 $46.10
Basis Point Equivalent 1.81% 1.59% 2.37% 1.73% 1.54%
Source: Program Disclosure Statements available as of August 23, 2017
Notes: See page 18
20
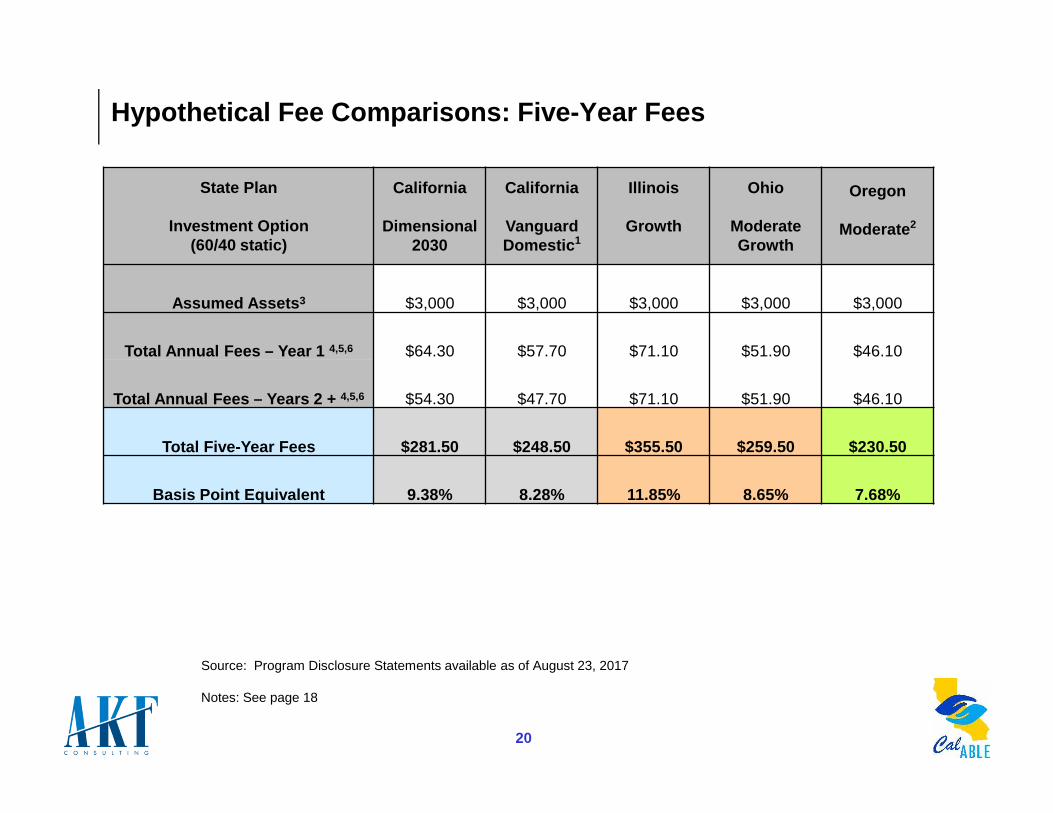
Hypothetical Fee Comparisons: Five-Year Fees
State Plan
Investment Option (60/40 static)
California
Dimensional 2030
California
Vanguard Domestic 1
Illinois
Growth
Ohio
Moderate Growth
Oregon
Moderate 2
Assumed Assets 3 $3,000 $3,000 $3,000 $3,000 $3,000
Total Annual Fees – Year 1 4,5,6 $64.30 $57.70 $71.10 $51.90 $46.10
Total Annual Fees – Years 2 + 4,5,6 $54.30 $47.70 $71.10 $51.90 $46.10
Total Five-Year Fees $281.50 $248.50 $355.50 $259.50 $23 0.50
Basis Point Equivalent 9.38% 8.28% 11.85% 8.65% 7.68%
Source: Program Disclosure Statements available as of August 23, 2017
Notes: See page 18

Appendix
21
22
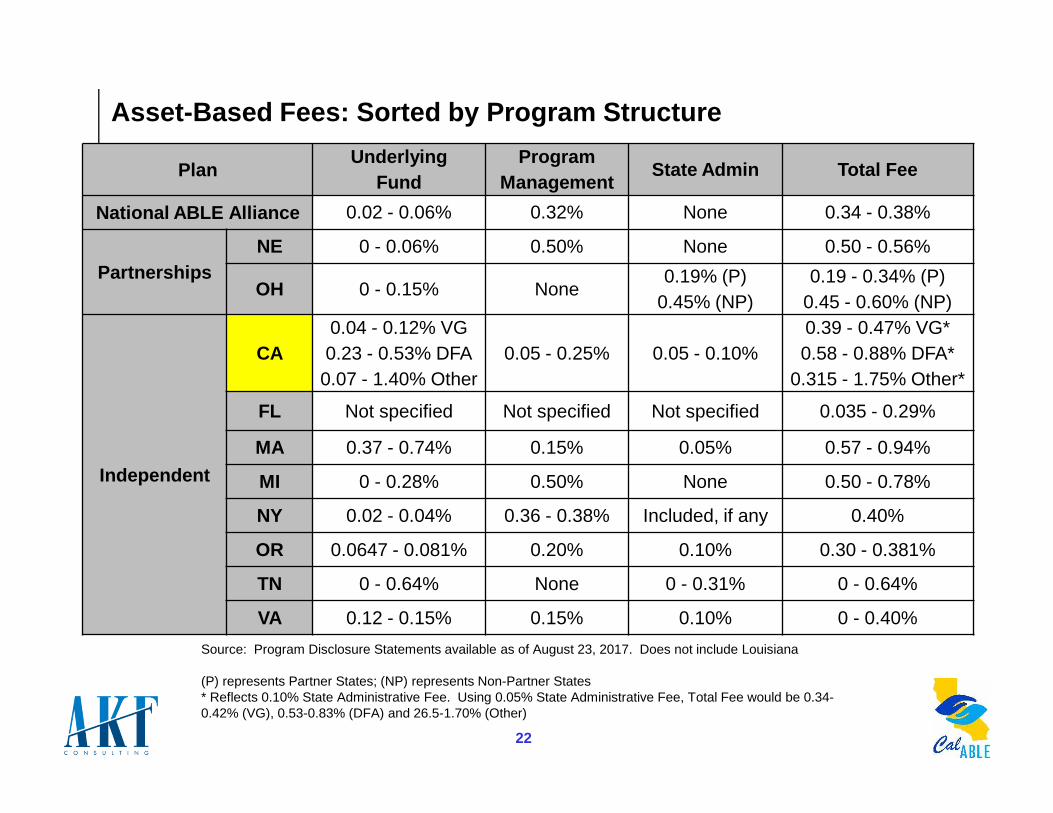
Asset-Based Fees: Sorted by Program Structure
PlanUnderlying
FundProgram
ManagementState Admin Total Fee
National ABLE Alliance 0.02 - 0.06% 0.32% None 0.34 - 0.38%
PartnershipsNE 0 - 0.06% 0.50% None 0.50 - 0.56%
OH 0 - 0.15% None0.19% (P)
0.45% (NP)0.19 - 0.34% (P)
0.45 - 0.60% (NP)
Independent
CA0.04 - 0.12% VG0.23 - 0.53% DFA
0.07 - 1.40% Other0.05 - 0.25% 0.05 - 0.10%
0.39 - 0.47% VG*0.58 - 0.88% DFA*
0.315 - 1.75% Other*
FL Not specified Not specified Not specified 0.035 - 0.29%
MA 0.37 - 0.74% 0.15% 0.05% 0.57 - 0.94%
MI 0 - 0.28% 0.50% None 0.50 - 0.78%
NY 0.02 - 0.04% 0.36 - 0.38% Included, if any 0.40%
OR 0.0647 - 0.081% 0.20% 0.10% 0.30 - 0.381%
TN 0 - 0.64% None 0 - 0.31% 0 - 0.64%
VA 0.12 - 0.15% 0.15% 0.10% 0 - 0.40%
Source: Program Disclosure Statements available as of August 23, 2017. Does not include Louisiana
(P) represents Partner States; (NP) represents Non-Partner States* Reflects 0.10% State Administrative Fee. Using 0.05% State Administrative Fee, Total Fee would be 0.34-0.42% (VG), 0.53-0.83% (DFA) and 26.5-1.70% (Other)

23
Asset-Based Total Fees
Plan Total Fee
California - Other 0.315 - 1.75%*
Massachusetts 0.57 - 0.94%
California - DFA 0.58 - 0.88%*
Michigan 0.50 - 0.78%
Tennessee 0 - 0.64%
OH Non-Partnership States 0.45 - 0.60%
NE Partnership 0.50 - 0.56%
California - VG 0.39 - 0.47%*
New York 0.40%
Virginia 0 - 0.40%
Oregon 0.30 - 0.381%
National ABLE Alliance 0.34 - 0.38%
OH Partnership States 0.19 - 0.34%
Florida 0.035 - 0.29%
Source: Program Disclosure Statements available as of August 23, 2017. Does not include Louisiana
* Reflects 0.10% State Administrative Fee. Using 0.05% State Administrative Fee, Total Fee would be 0.34-0.42% (VG), 0.53-0.83% (DFA) and 26.5-1.70% (Other)
Top Related