


Languages
Pages
Legal


1
Issue paper no.126Revised November 2017
Bureau BriefNSW Bureau of CrimeStatistics and Research
Indigenous imprisonment in NSW:A closer look at the trend
Don Weatherburn and Jessie Holmes
Aim: To explain the upward trend in Indigenous imprisonment in NSW between 2012 and 2016.
Method: Separate analyses were conducted of trends in the factors influencing the number of remand and sentenced prisoners received into custody and the length of time spent in custody by remandees and sentenced prisoners. Trends were tested for significance using Kendall’s rank order correlation test.
Results: The growth in Indigenous imprisonment in NSW since 2012 is a result of four main factors: (1) an increase in the proportion of Indigenous defendants refused bail; (2) an increase in the number of Indigenous defendants convicted of criminal offences, especially those in the categories of Stalking/intimidation, Breaching an AVO, Breaching a s.9 Bond and Breaching a s.12 Bond; (3) an increase in the proportion of convicted Indigenous offenders receiving a prison sentence for the offence of Stalking/Intimidation; and (4) an increase in the length of time being spent on remand by Indigenous defendants refused bail, in large part because of a growth in court delay in the NSW District Criminal Court. The growth in imprisonment for Stalking/Intimidation offences has been particularly noteworthy. The number of Indigenous Australians imprisoned for Stalking/Intimidation offences increased by 119 per cent between 2011 and 2016.
Conclusion: The number of Indigenous offenders receiving a prison sentence could be reduced by more than 700 a year if half of those currently given short prison sentences for Assault occasioning Actual Bodily Harm (ABH), Common Assault, Stalking/Intimidation, Breaching an AVO, Breaching a s.9 Bond or Breaching a s.12 Bond were placed on Intensive Correction Orders (ICOs) or Home Detention.
Keywords: Indigenous, offenders, imprisonment, assault, apprehended violence order, stalking, intimidation, breach section 9 bonds, breach section 12 bonds, intensive correction order, home detention, suspended sentence.
Suggested citation: Weatherburn, D. & Holmes, J. (2017). Indigenous imprisonment in NSW: A closer look at the trend (Bureau Brief No. 126). Sydney: NSW Bureau of Crime Statistics and Research.
IntroductionThe Royal Commission into Aboriginal Deaths in Custody (Commonwealth of Australia 1991) drew national attention to the acute disparity between Indigenous and non-Indigenous rates of imprisonment. Efforts to reduce the rate of Indigenous imprisonment in Australia, however, have so far failed. Between 1993 (when the Royal Commission handed down its report) and 2016, the Indigenous imprisonment rate in Australia rose by 63 per cent (Australian Institute of Criminology 1995; Australian Bureau of Statistics 2016). The highest rate of growth since 1993 has been in the Northern Territory, where the Indigenous imprisonment rate has more than doubled. The lowest over this time period has been in South Australia, where the Indigenous imprisonment rate rose by 26 per cent (Australian Institute of Criminology 1995; Australian Bureau of Statistics 2016).
The growth in Indigenous imprisonment in NSW has in recent times been particularly rapid. Between 2013 and 2016 the NSW Indigenous imprisonment rate grew by 25 per cent (Australian Bureau of Statistics 2016). The Indigenous imprisonment rate in this State is now 13.5 times higher than the non-Indigenous imprisonment rate (Australian Bureau of Statistics 2016). By way of comparison, the African-American imprisonment rate in the United States is only 5.6 times higher than the white imprisonment rate (Carson & Anderson 2016). Viewed from a longitudinal perspective, the prospects for Indigenous youth in NSW appear particularly grim. One recent study found that by the time they reached the age of 23, 24.5 per cent of the NSW Indigenous population born in 1984 had already been remanded in custody, placed in a youth detention centre or given a prison sentence, compared with just 1.3 per cent of the non-Indigenous population (see Figure 1).
Revisions have been made to original version of this Brief to broaden the law parts included in the analysis of stalking and intimidation offences.

2
In an earlier report released by the NSW Bureau of Crime Statistics, Weatherburn and Ramsey (2016) examined the factors behind the growth in Indigenous imprisonment in NSW between 2001 and 2015. This report focuses closer attention on the rapid growth in Indigenous imprisonment between January 2012 and September 2016. The first section analyses trends in the number of Indigenous defendants/offenders entering prison. The second section analyses trends in the length of stay in custody by those refused bail or given a prison sentence. The third section takes a closer look at two categories of offence (Acts Intended to Cause Injury and Justice Procedure Offences) which account for much of the growth in Indigenous imprisonment in NSW over the last four years. The final section summarizes the results and outlines their policy implications.
In what follows we examine the trends in various factors related to Indigenous imprisonment in NSW. Although (to avoid clutter) the specific results of each test are not shown, the trends have all been tested for significance using a Kendall’s rank order correlation test (Siegel 1956). Except where otherwise indicated, all tests for trend are significant at p < 0.05.
Prison receptionsLittle’s law (Little 1961) tells us that the average number of people in any form of queue (N) is given by the product of the number arriving (A) and the average service time (L) of those arriving. In the context of prison, if N is the number in custody at any given time, A is the number arriving (receptions) and L is the average time spent in custody by those arriving, then:
N = A x L
This equation provides a convenient framework for examining the factors underpinning the growth in Indigenous imprisonment. We begin by focussing on the trend in A and the factors affecting it and then move to a discussion of L and the factors affecting it.
Figure 2 shows the trend in the number of Indigenous receptions in NSW since January 2012. Although the series is quite volatile, the number of Indigenous prisoner receptions clearly rose between January 2012 and December 2016. In 2012, an average of 359 Indigenous defendants/offenders per month were received into custody. Between January 2016
and December 2016, that number rose to 438 per month (an increase of 79 additional receptions per month).
Trends in the number imprisonedHow much of the growth in prisoner receptions was due to an increase in offenders given a prison sentence? Figure 3 shows the trend in the number of convicted Indigenous offenders receiving a prison sentence. The number has significantly increased, rising from an average of 278 per month in the first 12 months of the series to an average of 386 in the last 12 months.
Figure 2. Number of Indigenous prisoner receptions (Jan 2012-Dec 2016)
250
300
350
400
450
500
Jan
12M
ar 1
2M
ay 1
2Ju
l 12
Sep
12N
ov 1
2Ja
n 13
Mar
13
May
13
Jul 1
3Se
p 13
Nov
13
Jan
14M
ar 1
4M
ay 1
4Ju
l 14
Sep
14N
ov 1
4Ja
n 15
Mar
15
May
15
Jul 1
5Se
p 15
Nov
15
Jan
16M
ar 1
6M
ay 1
6Ju
l 16
Sep
16N
ov 1
6
Num
ber
Jan
12M
ar 1
2M
ay 1
2Ju
l 12
Sep
12N
ov 1
2Ja
n 13
Mar
13
May
13
Jul 1
3Se
p 13
Nov
13
Jan
14M
ar 1
4M
ay 1
4Ju
l 14
Sep
14N
ov 1
4Ja
n 15
Mar
15
May
15
Jul 1
5Se
p 15
Nov
15
Jan
16M
ar 1
6M
ay 1
6Ju
l 16
Sep
16
Num
ber
150
200
250
300
350
400
450
500
Figure 3. Number of Indigenous o�enders receiving a prison sentence (Jan 2012-Sept 2016)
02468
101214161820
10 11 12 13 14 15 16 17 18 19 20 21 22 23
Cum
ulat
ive
%
Age
Figure 1. Cumulative per cent of NSW residents placed in custody by Indigenous status and age (1984 birth cohort)
IndigenousNon-Indigenous
Reproduced from Weatherburn (2014)
Trends in the percentage imprisoned and the number convicted A growth in the number receiving prison sentences can arise because the percentage of convicted offenders receiving prison sentences has increased or because the number convicted has increased (or both).
Figure 4 shows the percentage of convicted Indigenous defendants receiving a prison sentence between January 2012 and September 2016. There is considerable volatility in the series but the percentage of Indigenous offenders given a prison sentence has increased. In the first 12 months of the series, on average, 17.1 per cent of Indigenous offenders were given a prison sentence. In the last 12 months of the series, 19.4 per cent of Indigenous defendants were given a prison

3
Jan
12M
ar 1
2M
ay 1
2Ju
l 12
Sep
12N
ov 1
2Ja
n 13
Mar
13
May
13
Jul 1
3Se
p 13
Nov
13
Jan
14M
ar 1
4M
ay 1
4Ju
l 14
Sep
14N
ov 1
4Ja
n 15
Mar
15
May
15
Jul 1
5Se
p 15
Nov
15
Jan
16M
ar 1
6M
ay 1
6Ju
l 16
Sep
16
Perc
ent
14
15
16
17
18
19
20
21
22
23
Figure 4. Percentage of Indigenous o�enders imprisoned (Jan 2012-Sept 2016)
Figure 5. Number of Indigenous defendants convicted of a criminal o�ence (Jan 2012-Sept 2016)
Jan
12M
ar 1
2M
ay 1
2Ju
l 12
Sep
12N
ov 1
2Ja
n 13
Mar
13
May
13
Jul 1
3Se
p 13
Nov
13
Jan
14M
ar 1
4M
ay 1
4Ju
l 14
Sep
14N
ov 1
4Ja
n 15
Mar
15
May
15
Jul 1
5Se
p 15
Nov
15
Jan
16M
ar 1
6M
ay 1
6Ju
l 16
Sep
16
13001400150016001700180019002000210022002300
Num
ber
Figure 7. Percentage of Indigenous defendants refused bail at �rst court appearance (Jan 2012-Dec 2016)
Perc
ent
Jan
12M
ar 1
2M
ay 1
2Ju
l 12
Sep
12N
ov 1
2Ja
n 13
Mar
13
May
13
Jul 1
3Se
p 13
Nov
13
Jan
14M
ar 1
4M
ay 1
4Ju
l 14
Sep
14N
ov 1
4Ja
n 15
Mar
15
May
15
Jul 1
5Se
p 15
Nov
15
Jan
16M
ar 1
6M
ay 1
6Ju
l 16
Sep
16N
ov 1
6
12
14
16
18
20
22
24
26
28
30
sentence; an increase of 2.3 percentage points. The difference in the percentage imprisoned in the first and last 12 months of the series accounts for around half of the growth in prisoner numbers.
Figure 5 shows the number of Indigenous defendants convicted of a criminal offence over the same time period. That number has risen from an average of 1,628 a month in the first 12 months of the series to an average of 1,993 a month in the last 12 months of the series (i.e. an increase in the number convicted by 365 a month between 2012 and 2016).
An increase in the number of Indigenous defendants convicted of a criminal offence can occur in one of two ways — an increase
Figure 8. Number of Indigenous defendants refused bail(Jan 2012-Dec 2016)
Num
ber
Jan
12M
ar 1
2M
ay 1
2Ju
l 12
Sep
12N
ov 1
2Ja
n 13
Mar
13
May
13
Jul 1
3Se
p 13
Nov
13
Jan
14M
ar 1
4M
ay 1
4Ju
l 14
Sep
14N
ov 1
4Ja
n 15
Mar
15
May
15
Jul 1
5Se
p 15
Nov
15
Jan
16M
ar 1
6M
ay 1
6Ju
l 16
Sep
16N
ov 1
6200
230
260
290
320
350
380
410
440
in the number of persons charged with a criminal offence or an increase in the proportion charged who are convicted.
Figure 6 shows the trend in the number of Indigenous defendants appearing in court charged with a criminal offence. The upward trend is significant. The difference between the average number of Indigenous court appearances in the first 12 months of the series and the last 12 months is 348; only marginally less than the increase in the number convicted. Most of the increase in Indigenous convictions, then, is attributable to an increase in the number of Indigenous persons charged with criminal offences and brought before a court.
Trends in the proportion and number refused bailEarlier we noted that an increase in prison receptions could also come about as a result of an increase in the percentage or number refused bail. Figure 7 shows the percentage of (all) Indigenous defendants refused bail at first court appearance between January 2012 and December 2016. Although there is considerable variation in the percentage refused bail from month to month, there is a marked spike in the percentage refused bail in December 2016 which resulted in a significant upward trend.
Figure 8 shows the trend in the number of Indigenous defendants refused bail over the same time period. As with the percentage refused bail, despite there being considerable fluctuation in the number refused bail, overall there is a significant upward trend.
Figure 6. Number of Indigenous court appearances (Jan 2012-Sept 2016)
Jan
12M
ar 1
2M
ay 1
2Ju
l 12
Sep
12N
ov 1
2Ja
n 13
Mar
13
May
13
Jul 1
3Se
p 13
Nov
13
Jan
14M
ar 1
4M
ay 1
4Ju
l 14
Sep
14N
ov 1
4Ja
n 15
Mar
15
May
15
Jul 1
5Se
p 15
Nov
15
Jan
16M
ar 1
6M
ay 1
6Ju
l 16
Sep
16
Num
ber
15001600170018001900200021002200
230024002500

4
Length of stay in prisonWe turn now to look at changes in the length of time spent in custody. Figure 9 shows the mean time in custody spent by Indigenous defendants/offenders between January 2011 and December 2016. The average is calculated from the time received into custody (whether on remand or as a sentenced prisoner) until the time of release (regardless of whether the release occurs by way of release on remand or release as a sentenced prisoner). The average time spent in custody is significantly up. The change is comparatively small (from 201 days in 2011 to 213 days in 2016) but when multiplied by the number of Indigenous remand prisoners flowing into custody (approximately 438 a month during 2016) the effect on demand for prison beds would not be insignificant.
A growth in the length of time spent in custody can come from one of two sources: an increase in the length of time spent in custody by remand prisoners, or an increase in the length of time spent in custody by sentenced prisoners. Figure 10 shows the trend in the average time spent in custody by Indigenous remand prisoners released from custody between January 2011 and December 2016.
The average time spent on remand by these Indigenous prisoners increased significantly over the period; rising from an average of 37 days in the first 12 months of the series to 49 days in the period last 12 months. Figure 11 shows the trend in the average time spent in custody by Indigenous sentenced prisoners over the same time period. There is no significant increase in the time spent in custody by sentenced prisoners over this period.
A closer look at Indigenous offending and imprisonmentFigure 12 provides a breakdown of Indigenous prisoners by principal offence type in NSW.
There are two important points to note from the graph. The first is that by far the biggest contribution to
150
170
190
210
230
250
270
Day
s
Jan
12M
ar 1
2M
ay 1
2Ju
l 12
Sep
12N
ov 1
2Ja
n 13
Mar
13
May
13
Jul 1
3Se
p 13
Nov
13
Jan
14M
ar 1
4M
ay 1
4Ju
l 14
Sep
14N
ov 1
4Ja
n 15
Mar
15
May
15
Jul 1
5Se
p 15
Nov
15
Jan
16M
ar 1
6M
ay 1
6Ju
l 16
Sep
16N
ov 1
6
Jan
11M
ar 1
1M
ay 1
1Ju
l 11
Sep
11N
ov 1
1
Figure 9. Average time (days) in custody (Indigenous defendants/o�enders: (Jan 2011-Dec 2016)
Jan
12M
ar 1
2M
ay 1
2Ju
l 12
Sep
12N
ov 1
2Ja
n 13
Mar
13
May
13
Jul 1
3Se
p 13
Nov
13
Jan
14M
ar 1
4M
ay 1
4Ju
l 14
Sep
14N
ov 1
4Ja
n 15
Mar
15
May
15
Jul 1
5Se
p 15
Nov
15
Jan
16M
ar 1
6M
ay 1
6Ju
l 16
Sep
16N
ov 1
6
Jan
11M
ar 1
1M
ay 1
1Ju
l 11
Sep
11N
ov 1
1
Figure 10. Average time (days) spent in custody on remand (Indigenous defendants: (Jan 2011-Dec 2016)
20
25
30
35
40
45
50
55
60
65
70
Day
s
Jan
12M
ar 1
2M
ay 1
2Ju
l 12
Sep
12N
ov 1
2Ja
n 13
Mar
13
May
13
Jul 1
3Se
p 13
Nov
13
Jan
14M
ar 1
4M
ay 1
4Ju
l 14
Sep
14N
ov 1
4Ja
n 15
Mar
15
May
15
Jul 1
5Se
p 15
Nov
15
Jan
16M
ar 1
6M
ay 1
6Ju
l 16
Sep
16N
ov 1
6
Jan
11M
ar 1
1M
ay 1
1Ju
l 11
Sep
11N
ov 1
1
Figure 11. Average time (days) spent in custody by sentenced Indigenous prisoners (Jan 2011-Dec 2016)
200
250
300
350
400
450
Day
s

5
Figure 12. Indigenous prisoners by o�ence type (%) - (NSW 2016)
29
1512
108
5 5 4 3 3 2 2 1 1 1 00
5
10
15
20
25
30
35
A
cts i
nten
ded
to c
ause
inju
ry
Just
ice
proc
edur
e o�
ence
s
Unl
awfu
l ent
ry w
ith in
tent
/br
eak
and
ente
r
Rob
bery
, ext
ortio
n an
d re
late
d o�
ence
s
Sex
ual a
ssau
lt an
d re
late
d o�
ence
s
H
omic
ide
and
rela
ted
o�en
ces
Il
licit
drug
o�e
nces
T
heft
and
rela
ted
o�en
ces
R
oad
tra�
c an
d m
otor
vehi
cle
regu
lato
ry o
�enc
es
Dan
gero
us o
r neg
ligen
t
acts
end
ange
ring
pers
ons
A
bduc
tion
and
rela
ted
o�en
ces
F
raud
dec
eptio
n an
d re
late
d o�
ence
s
Wea
pons
and
ex
plos
ives
o�e
nces
P
rope
rty
dam
age
and
envi
ronm
enta
l pol
lutio
n
Pub
lic o
rder
o�e
nces
M
isce
llane
ous o
�enc
es
Perc
enta
ge
Table 1. Relative contribution to Indigenous imprisonment of offences in the category of ‘Acts Intended to Cause Injury’, NSW, Jan to Sept 2016
Offence subcategory N% of Indigenous
imprisonments for AICI% of all Indigenous
imprisonment
Assault occasioning actual bodily harm 304 36.7 8.6
Stalk/intimidate 211 25.5 6.0
Common assault 147 17.7 4.1
Assault officer in execution of duty 41 4.9 1.2
Assault occasioning abh in company of other(s) 33 4.0 0.9
Reckless wounding 32 3.9 0.9
Assault police officer in execution of duty w/o abh 20 2.4 0.6
Assault law officer (not police officer) 16 1.9 0.5
Use etc offensive weapon w/i to commit indictable offence-T1 14 1.7 0.4
Assault police officer in execution of duty cause ABH 11 1.3 0.3
Indigenous imprisonment comes from ‘Acts Intended to Cause Injury’. There are almost twice as many Indigenous prisoners in custody for an offence in this category than in the next most common category (Justice Procedure Offences). The second point to note is that, between them, offences in the categories of Acts Intended to Cause Injury and Justice Procedure Offences account for almost half (44%) of all Indigenous prisoners.
A distinctive feature of offences in the categories of Acts Intended to Cause Injury and Justice Procedure Offences is that, unlike most of the other offence categories shown in Figure 12, they include offences varying widely in seriousness. The category Acts Intended to Cause Injury for example, includes Common Assault, which carries a maximum penalty of two years. It also includes malicious wounding, which carries a maximum penalty of 25 years. Similarly, the category Justice Procedure Offences includes resisting or hindering a police officer in the execution of his or her duty, which carries a maximum penalty of 12 months imprisonment. It also includes perverting the course of justice, which carries a maximum penalty of 14 years imprisonment.
In the next section we take a closer look at the offences within in each of these two categories. Our interest lies in finding out, in each of these two broad categories, which specific offences account for the highest proportion of Indigenous offenders receiving prison sentences and which account for most of the growth in Indigenous offenders receiving prison sentences in each category1.
Acts Intended to Cause InjuryThe first column of Table 1 shows the offences within the category Acts Intended to Cause Injury (labelled ‘AICI’ in the table) that resulted in at least one sentence of imprisonment during
the first nine months of 2016. The second column shows the number of Indigenous offences who received a prison sentence for each offence. The third column shows the percentage each offence makes up of the total of those who were imprisoned for an act intended to cause injury. The final column shows the percentage of all Indigenous imprisonments from January to September 2016 where each offence listed in column one was the principal offence.
The principal contributors to the number of Indigenous offenders given a sentence of imprisonment for an Act Intended to Cause Injury are Assault Occasioning Actual Bodily Harm (36.7%), Stalking/Intimidation (25.5%) and Common Assault (17.7%). Between them, these three categories account for 80 per cent of all the Indigenous imprisonments from January to September 2016 in the category of Acts Intended to Cause Injury. The final column shows they also (collectively) account for a sizable proportion (18.7%) of all Indigenous imprisonments in New South Wales.
Figure 13 shows the trend in the number of Indigenous convictions for these three offences. A moving average has been used to smooth out the monthly fluctuations.
6
Jan
12M
ar 1
2M
ay 1
2Ju
l 12
Sep
12N
ov 1
2Ja
n 13
Mar
13
May
13
Jul 1
3Se
p 13
Nov
13
Jan
14M
ar 1
4M
ay 1
4Ju
l 14
Sep
14N
ov 1
4Ja
n 15
Mar
15
May
15
Jul 1
5Se
p 15
Nov
15
Jan
16M
ar 1
6M
ay 1
6Ju
l 16
Sep
16
Jan
11M
ar 1
1M
ay 1
1Ju
l 11
Sep
11N
ov 1
1
Figure 13. Number of Indigenous persons convicted by month/year (Selected 'Acts Intended to Cause Injury': 5 month moving average), Jan 2011 - Sept 2016
0
20
40
60
80
100
120
140
160
Num
ber
5 per. Mov. Avg. (Assault ABH)5 per. Mov. Avg. (Common assault)5 per. Mov. Avg. (Stalk/intimidate)
Looking at Figure 13, the number of Indigenous convictions for Common Assault and Assault Occasioning Actual Bodily Harm (Assault ABH) have remained comparatively stable. The most striking change is the steady increase in the number of Indigenous convictions for Stalking/Intimidation since 2011. In 2011 there were on average 56 Indigenous offenders convicted of stalking per month. By 2016, that number had risen to over 97 a month—almost a 75 per cent increase.
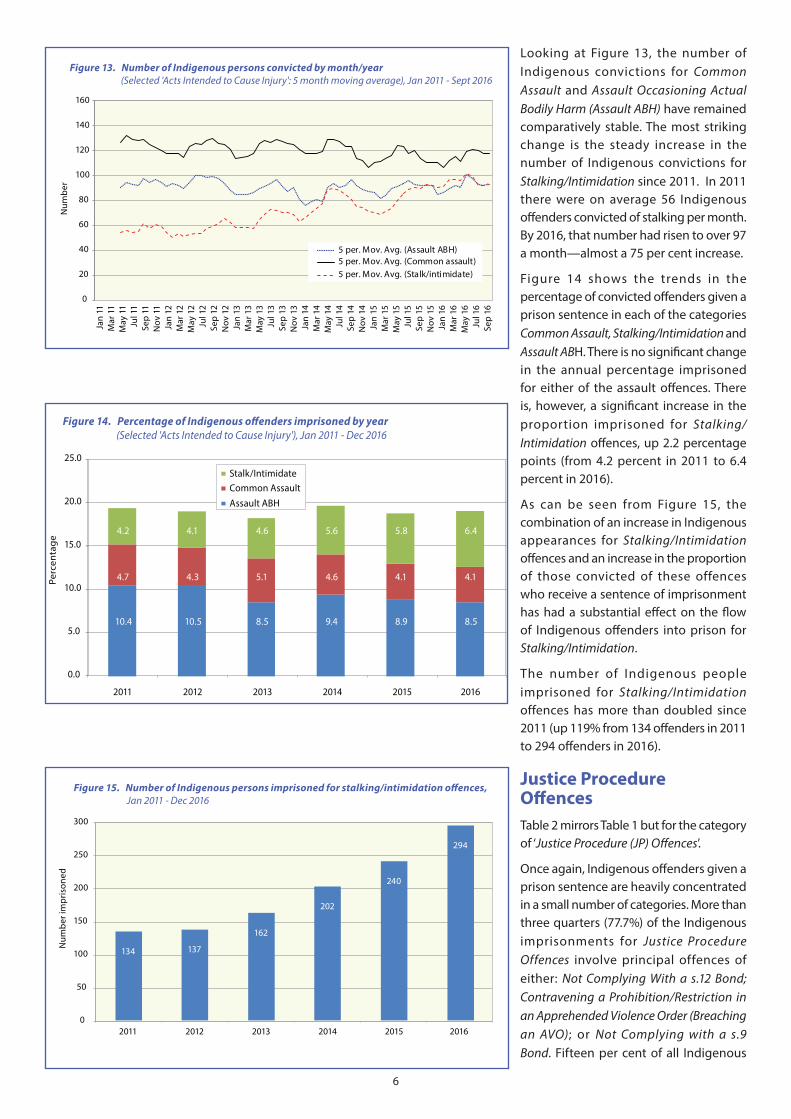
Figure 14 shows the trends in the percentage of convicted offenders given a prison sentence in each of the categories Common Assault, Stalking/Intimidation and Assault ABH. There is no significant change in the annual percentage imprisoned for either of the assault offences. There is, however, a significant increase in the proportion imprisoned for Stalking/Intimidation offences, up 2.2 percentage points (from 4.2 percent in 2011 to 6.4 percent in 2016).
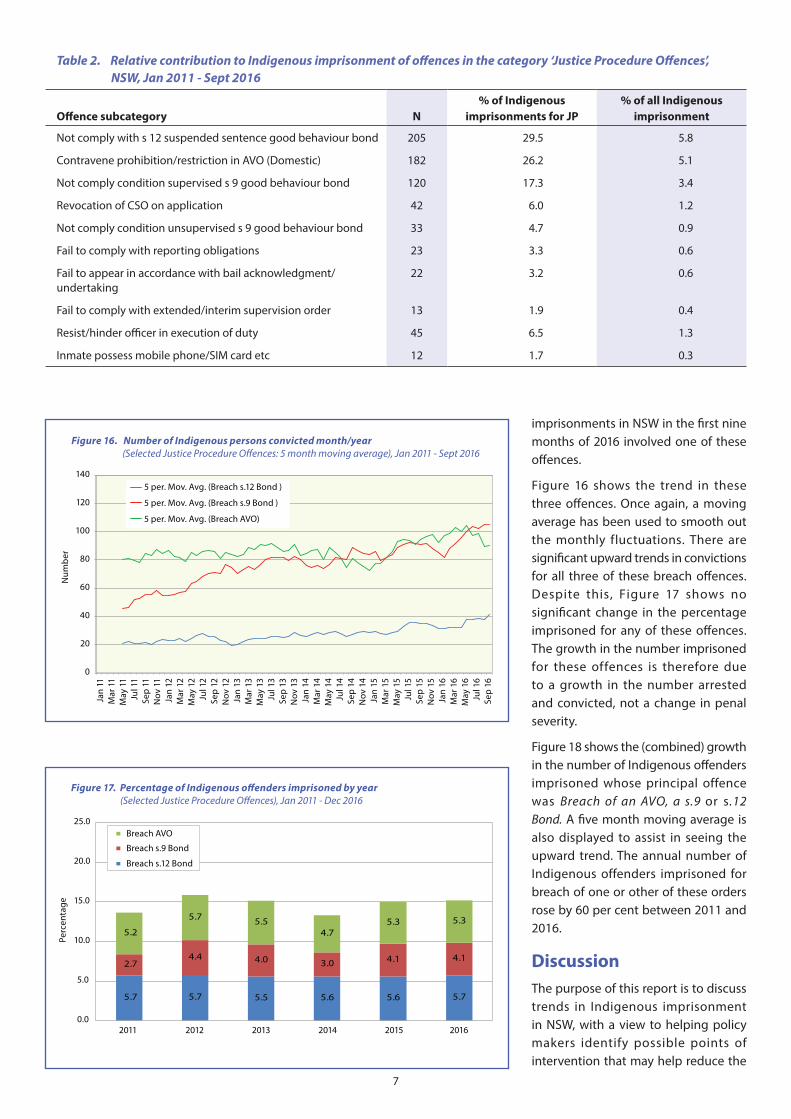
As can be seen from Figure 15, the combination of an increase in Indigenous appearances for Stalking/Intimidation offences and an increase in the proportion of those convicted of these offences who receive a sentence of imprisonment has had a substantial effect on the flow of Indigenous offenders into prison for Stalking/Intimidation.
The number of Indigenous people imprisoned for Stalking/Intimidation offences has more than doubled since 2011 (up 119% from 134 offenders in 2011 to 294 offenders in 2016).
Justice Procedure OffencesTable 2 mirrors Table 1 but for the category of ‘Justice Procedure (JP) Offences’.
Once again, Indigenous offenders given a prison sentence are heavily concentrated in a small number of categories. More than three quarters (77.7%) of the Indigenous imprisonments for Justice Procedure Offences involve principal offences of either: Not Complying With a s.12 Bond; Contravening a Prohibition/Restriction in an Apprehended Violence Order (Breaching an AVO); or Not Complying with a s.9 Bond. Fifteen per cent of all Indigenous
Figure 15. Number of Indigenous persons imprisoned for stalking/intimidation offences, Jan 2011 - Dec 2016
2011 2012 2013 2014 2015 20160
50
100
150
200
250
300
Num
ber i
mpr
ison
ed
134 137
162
202
240
294
2011 2012 2013 2014 2015
Figure 14. Percentage of Indigenous offenders imprisoned by year (Selected 'Acts Intended to Cause Injury'), Jan 2011 - Dec 2016
2016
0.0
5.0
10.0
15.0
20.0
25.0
Perc
enta
ge
Assault ABHCommon AssaultStalk/Intimidate
10.4 10.5 8.5 9.4 8.9 8.5
4.7 4.3 5.1 4.6 4.1 4.1
4.2 4.1 4.6 5.6 5.8 6.4
7
Table 2. Relative contribution to Indigenous imprisonment of offences in the category ‘Justice Procedure Offences’, NSW, Jan 2011 - Sept 2016
Offence subcategory N% of Indigenous
imprisonments for JP% of all Indigenous
imprisonment
Not comply with s 12 suspended sentence good behaviour bond 205 29.5 5.8
Contravene prohibition/restriction in AVO (Domestic) 182 26.2 5.1
Not comply condition supervised s 9 good behaviour bond 120 17.3 3.4
Revocation of CSO on application 42 6.0 1.2
Not comply condition unsupervised s 9 good behaviour bond 33 4.7 0.9
Fail to comply with reporting obligations 23 3.3 0.6
Fail to appear in accordance with bail acknowledgment/undertaking
22 3.2 0.6
Fail to comply with extended/interim supervision order 13 1.9 0.4
Resist/hinder officer in execution of duty 45 6.5 1.3
Inmate possess mobile phone/SIM card etc 12 1.7 0.3
imprisonments in NSW in the first nine months of 2016 involved one of these offences.
Figure 16 shows the trend in these three offences. Once again, a moving average has been used to smooth out the monthly fluctuations. There are significant upward trends in convictions for all three of these breach offences. Despite this, Figure 17 shows no significant change in the percentage imprisoned for any of these offences. The growth in the number imprisoned for these offences is therefore due to a growth in the number arrested and convicted, not a change in penal severity.
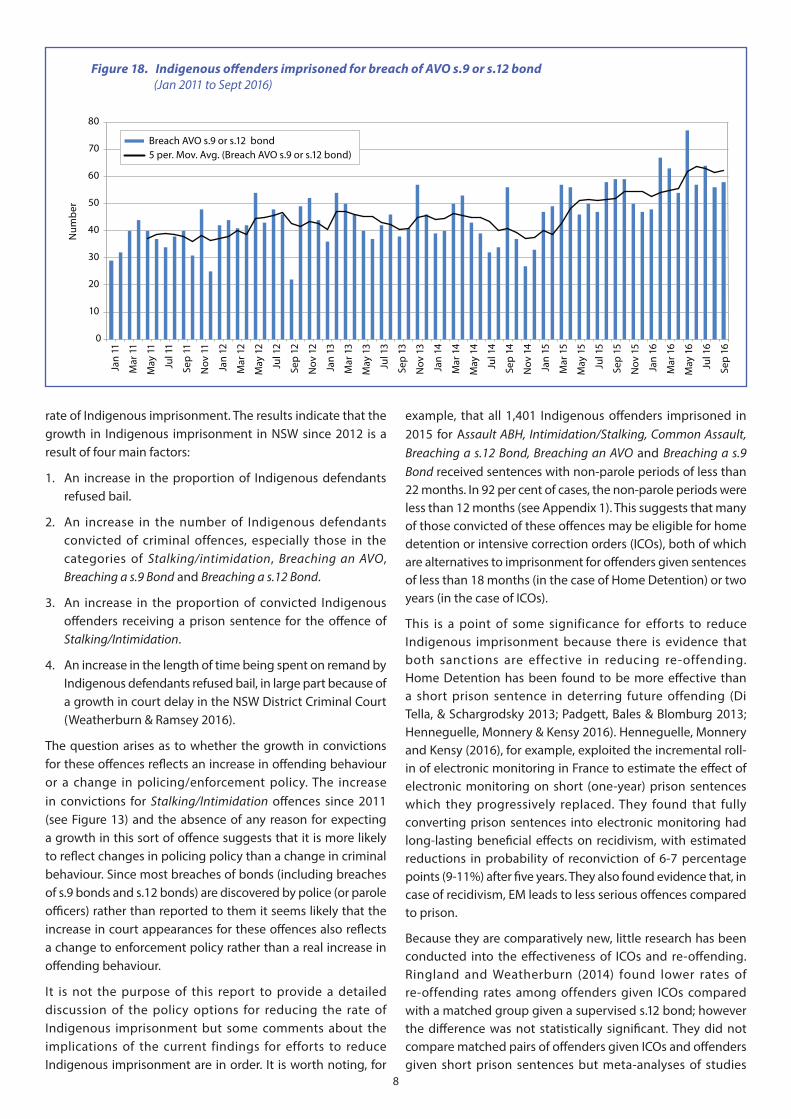
Figure 18 shows the (combined) growth in the number of Indigenous offenders imprisoned whose principal offence was Breach of an AVO, a s.9 or s.12 Bond. A five month moving average is also displayed to assist in seeing the upward trend. The annual number of Indigenous offenders imprisoned for breach of one or other of these orders rose by 60 per cent between 2011 and 2016.
DiscussionThe purpose of this report is to discuss trends in Indigenous imprisonment in NSW, with a view to helping policy makers identify possible points of intervention that may help reduce the
Jan
12M
ar 1
2M
ay 1
2Ju
l 12
Sep
12N
ov 1
2Ja
n 13
Mar
13
May
13
Jul 1
3Se
p 13
Nov
13
Jan
14M
ar 1
4M
ay 1
4Ju
l 14
Sep
14N
ov 1
4Ja
n 15
Mar
15
May
15
Jul 1
5Se
p 15
Nov
15
Jan
16M
ar 1
6M
ay 1
6Ju
l 16
Sep
16
Jan
11M
ar 1
1M
ay 1
1Ju
l 11
Sep
11N
ov 1
1
Figure 16. Number of Indigenous persons convicted month/year (Selected Justice Procedure O�ences: 5 month moving average), Jan 2011 - Sept 2016
0
20
40
60
80
100
120
140
Num
ber
5 per. Mov. Avg. (Breach s.12 Bond )
5 per. Mov. Avg. (Breach s.9 Bond )
5 per. Mov. Avg. (Breach AVO)
Figure 17. Percentage of Indigenous offenders imprisoned by year (Selected Justice Procedure O�ences), Jan 2011 - Dec 2016
2011 2012 2013 2014 2015 20160.0
5.0
10.0
15.0
20.0
25.0
Perc
enta
ge
Breach AVO
Breach s.9 Bond
Breach s.12 Bond
5.7 5.7 5.5 5.6 5.6 5.7
2.74.4 4.0 3.0 4.1 4.1
5.2
5.7 5.54.7
5.3 5.3
8
rate of Indigenous imprisonment. The results indicate that the growth in Indigenous imprisonment in NSW since 2012 is a result of four main factors:
1. An increase in the proportion of Indigenous defendants refused bail.
2. An increase in the number of Indigenous defendants convicted of criminal offences, especially those in the categories of Stalking/intimidation, Breaching an AVO, Breaching a s.9 Bond and Breaching a s.12 Bond.
3. An increase in the proportion of convicted Indigenous offenders receiving a prison sentence for the offence of Stalking/Intimidation.
4. An increase in the length of time being spent on remand by Indigenous defendants refused bail, in large part because of a growth in court delay in the NSW District Criminal Court (Weatherburn & Ramsey 2016).
The question arises as to whether the growth in convictions for these offences reflects an increase in offending behaviour or a change in policing/enforcement policy. The increase in convictions for Stalking/Intimidation offences since 2011 (see Figure 13) and the absence of any reason for expecting a growth in this sort of offence suggests that it is more likely to reflect changes in policing policy than a change in criminal behaviour. Since most breaches of bonds (including breaches of s.9 bonds and s.12 bonds) are discovered by police (or parole officers) rather than reported to them it seems likely that the increase in court appearances for these offences also reflects a change to enforcement policy rather than a real increase in offending behaviour.
It is not the purpose of this report to provide a detailed discussion of the policy options for reducing the rate of Indigenous imprisonment but some comments about the implications of the current findings for efforts to reduce Indigenous imprisonment are in order. It is worth noting, for
example, that all 1,401 Indigenous offenders imprisoned in 2015 for Assault ABH, Intimidation/Stalking, Common Assault, Breaching a s.12 Bond, Breaching an AVO and Breaching a s.9 Bond received sentences with non-parole periods of less than 22 months. In 92 per cent of cases, the non-parole periods were less than 12 months (see Appendix 1). This suggests that many of those convicted of these offences may be eligible for home detention or intensive correction orders (ICOs), both of which are alternatives to imprisonment for offenders given sentences of less than 18 months (in the case of Home Detention) or two years (in the case of ICOs).
This is a point of some significance for efforts to reduce Indigenous imprisonment because there is evidence that both sanctions are effective in reducing re-offending. Home Detention has been found to be more effective than a short prison sentence in deterring future offending (Di Tella, & Schargrodsky 2013; Padgett, Bales & Blomburg 2013; Henneguelle, Monnery & Kensy 2016). Henneguelle, Monnery and Kensy (2016), for example, exploited the incremental roll-in of electronic monitoring in France to estimate the effect of electronic monitoring on short (one-year) prison sentences which they progressively replaced. They found that fully converting prison sentences into electronic monitoring had long-lasting beneficial effects on recidivism, with estimated reductions in probability of reconviction of 6-7 percentage points (9-11%) after five years. They also found evidence that, in case of recidivism, EM leads to less serious offences compared to prison.
Because they are comparatively new, little research has been conducted into the effectiveness of ICOs and re-offending. Ringland and Weatherburn (2014) found lower rates of re-offending rates among offenders given ICOs compared with a matched group given a supervised s.12 bond; however the difference was not statistically significant. They did not compare matched pairs of offenders given ICOs and offenders given short prison sentences but meta-analyses of studies
Jan
12
Mar
12
May
12
Jul 1
2
Sep
12
Nov
12
Jan
13
Mar
13
May
13
Jul 1
3
Sep
13
Nov
13
Jan
14
Mar
14
May
14
Jul 1
4
Sep
14
Nov
14
Jan
15
Mar
15
May
15
Jul 1
5
Sep
15
Nov
15
Jan
16
Mar
16
May
16
Jul 1
6
Sep
16
Jan
11
Mar
11
May
11
Jul 1
1
Sep
11
Nov
11
Figure 18. Indigenous offenders imprisoned for breach of AVO s.9 or s.12 bond(Jan 2011 to Sept 2016)
Num
ber
0
10
20
30
40
50
60
70
80
Breach AVO s.9 or s.12 bond5 per. Mov. Avg. (Breach AVO s.9 or s.12 bond)

9
comparing prison with sanctions that (like the ICO) combine close supervision and rehabilitative support have generally reported results favouring such sanctions. Aos et al. (2006), for example, found an average 16.7 per cent reduction in re-offending for offenders given sanctions of this sort.
Despite the promise of Home Detention and Intensive Correction Orders, they are not often used for the offences we have been discussing. In 2015 only six Indigenous offenders convicted of Assault ABH, Intimidation/Stalking, Common Assault, Breaching a s.12 Bond, Breaching an AVO and Breaching a s.9 Bond received a home detention order. With one exception, less than three per cent received an ICO; the exception being Breaching a s. 12 Bond where 14.8 per cent received an ICO. The NSW Law Reform Commission in its report on Sentencing (NSW Law Reform Commission 2013) identified a number of barriers and impediments to wider use of Home Detention and ICOs by the courts, including complex arrangements for assessing suitability and the difficulties involved in electronic monitoring in remote rural areas.
Removal of these barriers would assist in expanding the use of home detention and ICOs and reducing—or at least slowing the growth rate—of Indigenous imprisonment. If just half of the Indigenous offenders given a prison sentence in 2015 for one of the offences: Assault ABH, Common Assault, Stalking/Intimidation, Breaching an AVO, Breaching a s.9 Bond or Breaching a s.12 Bond had instead been given an ICO or Home Detention, 700 fewer Indigenous offenders would have received a prison sentence.
AcknowledgementsOur thanks to the anonymous reviewers who provided helpful constructive feedback on an earlier draft of this report.
Notes1. A full list of the offences in this category can be found in the
report titled Australian and New Zealand Standard Offence Classification (Australian Bureau of Statistics 2011).
ReferencesAos, S., Miller, M., & Drake, E. (2006). Evidence-Based Public Policy Options to Reduce Future Prison Construction, Criminal Justice Costs, and Crime Rates. Olympia: Washington, State Institute for Public Policy.
Australian Institute of Criminology (1995). Australian Prisoners 1993. Canberra: Australian Institute of Criminology.
Australian Bureau of Statistics (2011). Australian and New Zealand Standard Offence Classification (ANZSOC). Canberra: Australian Bureau of Statistics.
Australian Bureau of Statistics (2016). Prisoners in Australia 2016. Canberra: Australian Bureau of Statistics.
Carson, E.A. & Anderson, E. (2016). Prisoners in 2015. US Bureau of Justice Statistics. Washington: US Department of Justice. Retrieved from: https://www.bjs.gov/content/pub/pdf/p15.
pdf. 15/3/2017.
Commonwealth of Australia (1991). Royal Commission into Aboriginal Deaths in Custody (Vols. 1-4). Canberra, Australia: Commonwealth of Australia.
Di Tella, R. & Schargrodsky, E. (2013). Criminal Recidivism after Prison and Electronic Monitoring. Journal of Political Economy, 121(1), 28-73.
Henneguelle, A., Monnery, B. & Kensy, A. (2016). Better at Home than in Prison? The Effects of Electronic Monitoring on Recidivism in France (September 2016). Available at SSRN: https://ssrn.com/abstract=2711649 or http://dx.doi.org/10.2139/ssrn.2711649
Little, J. D. C. (1961) A Proof of the Queuing Formula: L = AW, Operations Research, 9(3) 383-387.
NSW Law Reform Commission (2013). Sentencing. Report 139. Sydney: NSW Law Reform Commission.
Padgett, K.G., Bales, W.D. & Blomberg, T.G. (2006). Under Surveillance: An Empirical Test of the Effectiveness and Consequences of Electronic Monitoring. Criminology and Public Policy, 5(1) 61-92.
Ringland, C. & Weatherburn, D. (2014). The impact of Intensive Correction Orders on Re-offending. Crime and Justice Bulletin 176. Sydney: NSW Bureau of Crime Statistics and Research.
Siegel, S. (1956). Non-parametric Statistics for the Behavioural Sciences. Tokyo: McGraw-Hill.
Weatherburn, D. (2014). Arresting Incarceration: Pathways out of Indigenous Imprisonment. Sydney: Federation Press.
Weatherburn, D. & Ramsey, S. (2016). What’s causing the growth in Indigenous Imprisonment in NSW? Bureau Brief 118. Sydney: NSW Bureau of Crime Statistics and Research.

10
NSW Bureau of Crime Statistics and Research - Level 1, Henry Deane Building, 20 Lee Street, Sydney 2000 [email protected] • www.bocsar.nsw.gov.au • Ph: (02) 8346 1100 • Fax: (02) 8346 1298 • ISBN 978-1-925343-45-8 © State of New South Wales through the Department of Justice 2017. You may copy, distribute, display, download and otherwise freely deal with this work for any purpose, provided that you attribute the Department of Justice as the owner. However, you must obtain permission if you wish to
(a) charge others for access to the work (other than at cost), (b) include the work in advertising or a product for sale, or (c) modify the work.
Appendix 1
Table A1. Number of Indigenous people sentenced to prison for selected principal offences, by average imprisonment duration (Non Parole Period – months)
Length (months) A
ssau
lt o
ccas
ion
ing
actu
al b
odily
ha
rm D
V
Ass
ault
occ
asio
nin
g ac
tual
bod
ily
harm
Com
mon
Ass
ault
DV
Com
mon
Ass
ault
Stal
k/In
tim
idat
e in
tend
fear
phy
sica
l et
c ha
rm d
omes
tic
Stal
k/In
tim
idat
e in
tend
fear
phy
sica
l et
c ha
rm (p
erso
nal)
Cont
rave
ne P
rohi
biti
on/R
estr
icti
on
in A
VO
Dom
esti
c
Cont
rave
ne P
rohi
biti
on/R
estr
icti
on in
AV
O (P
erso
nal)
Not
com
ply
Cond
itio
n su
perv
ised
s.9
good
beh
avio
ur b
ond
Not
com
ply
Cond
itio
n un
supe
rvis
ed
s.9
goo
d be
havi
our b
ond
Not
com
ply
wit
h s
.12
su
spen
ded
se
nten
ce g
ood
beha
viou
r bon
d
Tota
l
Cum
ulat
ive
no.
% Cum
ulat
ive
%
<1 0 0 2 1 2 2 9 0 6 4 7 33 33 2.4 2.4
1 <2 2 2 2 5 7 1 22 0 23 9 10 83 116 5.9 8.3
2 <3 10 2 6 4 14 8 30 1 17 7 17 116 232 8.3 16.6
3 <4 25 12 24 20 17 9 35 0 26 9 38 215 447 15.3 31.9
4 <5 32 14 22 12 41 9 33 0 16 6 34 219 666 15.6 47.5
5 <6 15 5 11 6 14 10 12 0 2 0 14 89 755 6.4 53.9
6 <7 49 29 21 20 39 7 40 0 22 11 68 306 1061 21.8 75.7
7 <8 9 9 1 1 2 7 8 0 2 0 5 44 1105 3.1 78.9
8 <9 16 2 5 0 4 4 8 0 2 0 9 50 1155 3.6 82.4
9 <10 28 17 4 0 13 10 12 0 6 3 21 114 1269 8.1 90.6
10 <11 5 7 1 0 1 2 2 0 1 0 1 20 1289 1.4 92.0
11 <12 1 2 1 0 0 1 1 0 0 0 0 6 1295 0.4 92.4
12 <13 29 18 1 0 6 3 5 0 0 0 7 69 1364 4.9 97.4
13 <14 5 1 0 0 1 0 0 0 0 0 1 8 1372 0.6 97.9
14 <15 2 1 0 0 0 1 1 0 0 0 0 5 1377 0.4 98.3
15 <16 2 0 0 0 0 0 0 0 0 0 0 2 1379 0.1 98.4
16 <17 1 0 0 0 0 0 1 0 0 0 0 2 1381 0.1 98.6
17 <18 1 0 0 0 0 0 0 0 0 0 1 2 1383 0.1 98.7
18 <19 12 2 0 0 2 0 0 0 0 0 0 16 1399 1.1 99.9
19 <20 0 1 0 0 0 0 0 0 0 0 0 1 1400 0.1 99.9
20 <21 0 0 0 0 0 0 0 0 0 0 0 0 1400 0.0 99.9
21 <22 0 1 0 0 0 0 0 0 0 0 0 1 1401 0.1 100.0
22 <23 0 0 0 0 0 0 0 0 0 0 0 0 1401 0.0 100.0
23 <24 0 0 0 0 0 0 0 0 0 0 0 0 1401 0.0 100.0
Top Related