


Languages
Pages
Legal

COVID-19India Economic MonitorMarch 2021 Update
1 Copy
righ
t © 2
020
by B
osto
n Co
nsul
ting
Gro
up. A
ll ri
ghts
rese
rved
.
COVID-19 Executive Summary
Source: MoHFW, POSOCO, MOSPI, Ministry of Commerce & Industry, RBI, GST Network, NPCI, NETC, Ministry of Railways, AAI, JNPT, AIOCD, mFMS, Joint Plant Committee, Ministry of Steel, Ministry of Commerce & Industry, SIAM, CMIE, IRDAI, Ministry of Finance, GST Council, Ministry of Rural Development, Analyst reports, BCG analysis
Trends across key economic indicators• Industrial Activity: Daily avg. power consumption continued to witness a 3% YoY growth in Feb'21; fuel consumption YoY gap widened to -5% in Feb'21
compared to -4% YoY in Jan'21; Index of Industrial Production dipped to -2% YoY after witnessing YoY growth in Dec'20• Trade: In Feb'21, Merchandize exports & imports continued to witness YoY growth (1% & 7%); Services export & import YoY gap widened in Jan'21• Logistics: FASTag transactions increased by 7% again in Feb'21 vs. Jan'21; E-way bills grew at 12% YoY in Feb'21 vs. 10% YoY growth in Jan'21; JNPT traffic
continued to grow YoY in Feb'21 (at 11% YoY vs. 9% YoY in Jan'21); Air & rail passenger traffic improved in Jan-Feb'21 vs. previous months, however still significantly far from pre-COVID levels
• Financial Services: Aggregate deposits & bank credit improved vs. previous months; YoY growth rate improved in the last week of Feb'21 vs. previous weeks; Value of UPI transactions witnessed 90%+ YoY growth, reaching INR 4.25 Tn in Feb'21
• Sector-wise Impact: PVs, 2W & tractor sales continued to grow YoY in Feb'21 (PV sales grew 3%, 2W sales grew 12%, tractor sales grew 30% YoY), 3W sales YoY gap improved to 18% de-growth (vs. 36% de-growth in Jan'21); Fertilizer sales continued to see a contraction vs. last year levels, though YoY gap improved in Feb'21 (to 1% de-growth); Both Life and Non-life insurance premium observed a favorable uptick vs. last year levels in Feb'21
• Macroeconomic Indicators: GST collections continued to grow vs. last year for the 6th month in Feb'21, remaining above the INR 1 Tn mark; MGNREGA work demand & employment trended at ~20%+YoY levels, lower than YoY growth of previous months
• Sentiment: Urban consumer sentiment remained the same while rural marginally improved in Feb'21 vs. Jan'21, rural sentiment remained better than urban sentiment; Both Manufacturing & Services PMI remained beyond the 50-point mark in Feb'21 (57.5 & 55.3 respectively), Services PMI witnessed an appreciable growth vs. previous months; Improvement in value of stock market transactions in Feb'21 vs. previous months & last year; Mutual funds AUM continued to grow vs. last year levels in Feb'21
India's GDP witnessed a 0.4% YoY growth in Oct-Dec'20 quarter vs. ~7% & ~24% contraction respectively in the previous two quarters. Both private & government consumption improved vs. previous quarter. Gross capital formation saw positive YoY growth after 4 quarters & industrial sector saw positive YoY growth after 5 quarters. In Feb'21- Merchandize trade continued to witness positive YoY growth; Auto sales, insurance premium grew vs. last year levels; Logistics (except passenger traffic), GST collections continued to witness an uptick vs. last year levels; GDP projections saw an upward revision at 6-10% YoY contraction for this financial year.
2 Copy
righ
t © 2
020
by B
osto
n Co
nsul
ting
Gro
up. A
ll ri
ghts
rese
rved
.
0
2,000,000
4,000,000
6,000,000
8,000,000
10,000,000
12,000,000
20-0ct-20
20-Sep
20-Aug
20-Ma
r
20-Jul
20-Feb
Total cases
20-Dec
20-Nov
20-Jan
1.8x
1.4.x1.2x
1.1x 1.0x 1.0x 1.1x
Deaths Active casesRecovered
Total cases 5.4M 10M
Active cases 1M 302k
Days Doubling Rate 34 282
Recovery Rate 80.1% 95.5%
Test Positivity Rate 8.5% 6.2%
Fatality Rate 1.6% 1.5%
Source: Ministry of Health & Family Welfare (MoHFW); covid19india.org; BCG analysis
7.6M
739k
88
88.8%
7.9%
1.5%
COVID-19 cases in India on a continuous rise in Feb-Mar’21 with an increase in active case count in Mar'21Data as of 20 Mar
2.9M
690k
29
74.3%
8.7%
1.9%
9M
442k
186
93.6%
6.9%
1.5%
10.6M
189k
518
96.7%
5.6%
1.4%
142k
10.9M
626
97.2%
5.2%
1.4%
306k
11.5M
232
95.9%
5.0%
1.4%
3 Copy
righ
t © 2
020
by B
osto
n Co
nsul
ting
Gro
up. A
ll ri
ghts
rese
rved
.
Sector-wise ImpactCement Production MT -25% -4% 3% -7% -7% -6% NASteel Sales MT -23% -1% 1% 23% 18% 13% NAPassenger Vehicle Sales k -50% 13% 9% -3% 7% 2% 3%Tractor Sales k -50% 27% 9% 48% 41% 48% 30%Two-wheeler Sales k -36% 11% 18% 13% 11% 10% 12%Fertilizer Sales MT 18% -11% 9% -10% -14% -5% -1%Gross Premium (Life) INR -32% 26% 32% -27% -3% 4% 21%Gross Premium (Non-Life) INR -11% -4% -0.4% 3% 12% 7% 14%Pharma. Sales INR 9% 5% 10% 1% 9% 5% 12%Chemical Production Index Index -2% 0% 3% 5% 5% NA NAMacroeconomic IndicatorsTotal GST Collection INR -8% 4% 10% 1% 12% 8% 8%Central Govt. Expenditure INR Tn 2.2 2.3 1.8 2.4 3.7 2.4 NAMGNREGA Jobs Demand HHs 2% 71% 89% 50% 56% 39% 29%MGNREGA Jobs Provided HHs -1% 65% 83% 47% 47% 32% 19%No. of Tenders Announced k -4% 110% 201% 127% 253% 68% 54%FDI Inflow USD Bn 4.9 4.1 5.1 6.8 7.3 NA NAFII USD Bn -15.0 1.4 3.0 9.8 8.6 NA NASentimentIndia VIX Index 64.4 19.5 24.8 19.8 21.1 25.3 28.1PMI (Manufacturing) Index 51.8 56.8 58.9 56.3 56.4 57.7 57.5PMI (Services) Index 49.3 49.8 54.1 53.7 52.3 52.8 55.3
Data for 2020; YoY growth represented for all indicators (except for India VIX, PMI, Central govt. expenditure, FDI, and FII where absolute values are represented)Source: POSOCO, PPAC, MoSPI, RBI, Ministry of Comm. and Industry, GST Network, Ministry of Railways, JNPT, AAI, NPCI, JPC, Ministry of Steel, SIAM, CMIE, mFMS, IRDAI, AIOCD, American Chemistry Council, GST Council, Ministry of Finance, Controller General of Accounts, Ministry of Rural Development, Projects Today, Bloomberg, NSE, BSE, IHS Markit, BCG analysis
Summary: Feb'21 trends continued to show improvement across select indicators, with most indicators exceeding last year levels
Industrial Activity
Power Consumption MU -10% 3% 10% 4% 5% 5% 3%
Petroleum Consumption MT -18% -4% 2% -3% -2% -4% -5%
Index of Industrial Prod. Index -19% 1% 5% -2% 2% -2% NA
Trade
Services Export USD 1% -1% -6% -5% -6% -10% NA
Services Import USD -2% -9% -12% -12% -8% -16% NA
Merchandize Export USD -35% 6% -5% -9% -1% 6% 1%
Merchandize Import USD -29% -20% -12% -13% 8% 2% 7%
Logistics
E-Way Bills Generated Mn -26% 9% 21% 8% 16% 10% 12%
Railway Freight Originated MT -14% 16% 15% 9% 9% 9% NA
JNPT Container Traffic TEUs -13% -5% 5% 8% 10% 9% 11%
Air Freight kT -32% -16% -14% -13% -9% -11% NA
Air Passenger Traffic Mn -38% -70% -62% -57% -50% -47% NA
Rail Passengers Booked Mn -39% -94% -91% -83% -73% -67% -57%
Financial Services
UPI Transactions Mn 24% 104% 102% 107% 105% 99% 91%
Total Bank Credit INR 6.1% 5.2% 5.4% 5.8% 5.9% 6.3% 6.6%
Total Bank Deposits INR 8.5% 11.3% 10.3% 10.8% 11.3% 11.3% 11.9%
1
2
3
4
5
6
7
Indicator Unit Mar Sep Oct Nov Dec Indicator Unit Mar Sep Oct Nov DecJan Jan
2020 2020 2021
FebFeb
2021
4 Copy
righ
t © 2
020
by B
osto
n Co
nsul
ting
Gro
up. A
ll ri
ghts
rese
rved
.
GDP Deep-Dive2
Economic Indicators1
5 Copy
righ
t © 2
020
by B
osto
n Co
nsul
ting
Gro
up. A
ll ri
ghts
rese
rved
.
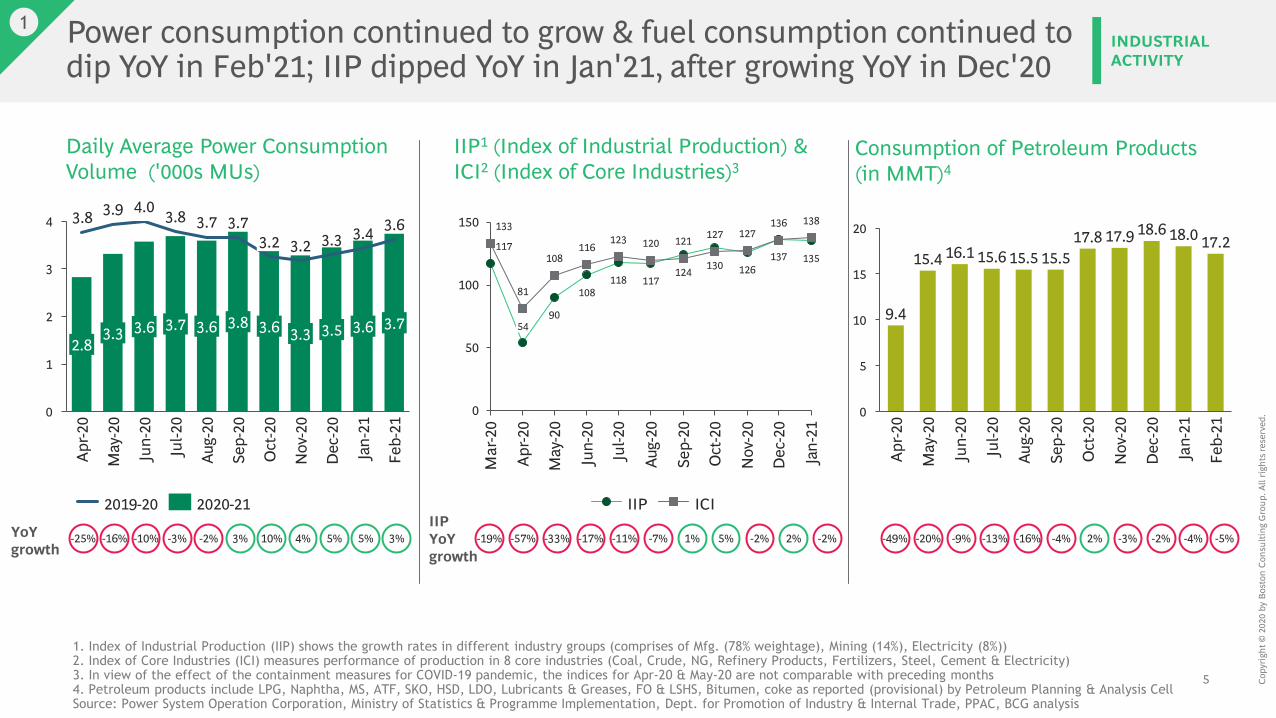
Daily Average Power Consumption Volume ('000s MUs)
IIP1 (Index of Industrial Production) & ICI2 (Index of Core Industries)3
4
0
2
3
1
Apr-2
0
May
-20
4.03.8
3.3
3.9
2.83.6
Jun-
20
3.8
3.7
Jul-2
0
3.7 3.6
3.6
Jan-
21
3.4
Aug-
203.7
3.8
Sep-
203.2
3.6 3.5
Oct
-203.2
3.73.3
Nov
-20
3.3
Dec
-20
3.6
Feb-
21
2019-20 2020-21
10
0
15
5
20
Nov
-20
Sep-
20
May
-20
Apr-2
0
Jun-
20
Jul-2
0
Aug-
20
Oct
-20
Dec
-20
Jan-
21
Feb-
21
9.4
15.417.8
16.1 15.6 15.5 15.517.9 18.6 18.0 17.2
Consumption of Petroleum Products (in MMT)4
Power consumption continued to grow & fuel consumption continued to dip YoY in Feb'21; IIP dipped YoY in Jan'21, after growing YoY in Dec'20
INDUSTRIAL ACTIVITY
1
1. Index of Industrial Production (IIP) shows the growth rates in different industry groups (comprises of Mfg. (78% weightage), Mining (14%), Electricity (8%))2. Index of Core Industries (ICI) measures performance of production in 8 core industries (Coal, Crude, NG, Refinery Products, Fertilizers, Steel, Cement & Electricity)3. In view of the effect of the containment measures for COVID-19 pandemic, the indices for Apr-20 & May-20 are not comparable with preceding months4. Petroleum products include LPG, Naphtha, MS, ATF, SKO, HSD, LDO, Lubricants & Greases, FO & LSHS, Bitumen, coke as reported (provisional) by Petroleum Planning & Analysis CellSource: Power System Operation Corporation, Ministry of Statistics & Programme Implementation, Dept. for Promotion of Industry & Internal Trade, PPAC, BCG analysis
YoYgrowth
117
90
108118 117
124 130 126137 135
133
81
108116
123 120 121 127 127136 138
0
50
100
150
Mar
-20
May
-20
Jul-2
0
Sep-
20
Nov
-20
Jan-
21
Apr-2
0
Jun-
20
Aug-
20
Oct
-20
Dec
-20
54
-11%-57% -17%-33% -7%
IIP ICIIIPYoY growth
1% 5% -4%-20% -9%-49% -13% -16% -3%2% -2% -4%2%-2%-16% -10% -2%-3% 3% 10% 4% 5% 5%-25% -19%3% -5%-2%
6 Copy
righ
t © 2
020
by B
osto
n Co
nsul
ting
Gro
up. A
ll ri
ghts
rese
rved
.
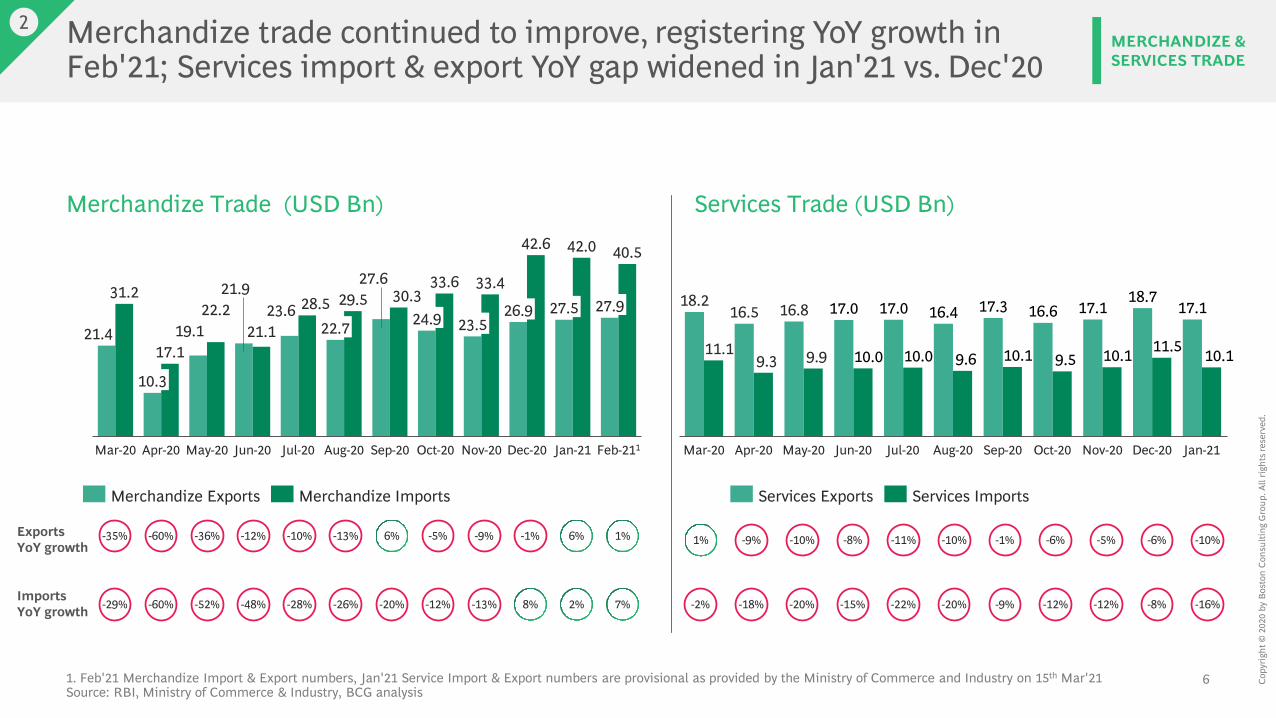
Merchandize trade continued to improve, registering YoY growth in Feb'21; Services import & export YoY gap widened in Jan'21 vs. Dec'20
MERCHANDIZE & SERVICES TRADE
2
26.9
Dec-20Apr-20 May-20 Jun-20 Oct-20
30.3
Sep-20Jul-20 Aug-20 Nov-20
27.9
Jan-21
21.427.5
10.3
17.119.1
22.221.9
21.123.6
Feb-211
28.522.7
29.527.6
24.9
33.6
23.5
33.4
42.6 42.0
31.2
Mar-20
40.5
Merchandize Exports Merchandize Imports
1. Feb'21 Merchandize Import & Export numbers, Jan'21 Service Import & Export numbers are provisional as provided by the Ministry of Commerce and Industry on 15th Mar'21Source: RBI, Ministry of Commerce & Industry, BCG analysis
Merchandize Trade (USD Bn) Services Trade (USD Bn)
-60% -36% -12%ExportsYoY growth
-10%
-60% -52% -48%ImportsYoY growth -28%
-13%
-26%
Apr-20 May-20 Jun-20 Jan-21Jul-20 Sep-20Aug-20 Oct-20
18.717.1
Nov-20 Dec-20
18.2
9.311.1
16.6
Mar-20
16.8
9.9
17.0
10.0
17.0 16.4
10.0 9.6
17.3
10.1 9.5 10.1 11.5
17.1
10.1
16.5
Services Exports Services Imports
-9% -8%-10%
-18% -15%-20%
-11%
-22%-20%
6% -10%
-20%
-1%
-9%
-5%
-12%
-6%
-12%
-9%
-13% 8%
-1% -5%
-12%
6%
2%
-6%
-8%
-35%
-29%
1%
-2%
1%
7%
-10%
-16%
7 Copy
righ
t © 2
020
by B
osto
n Co
nsul
ting
Gro
up. A
ll ri
ghts
rese
rved
.
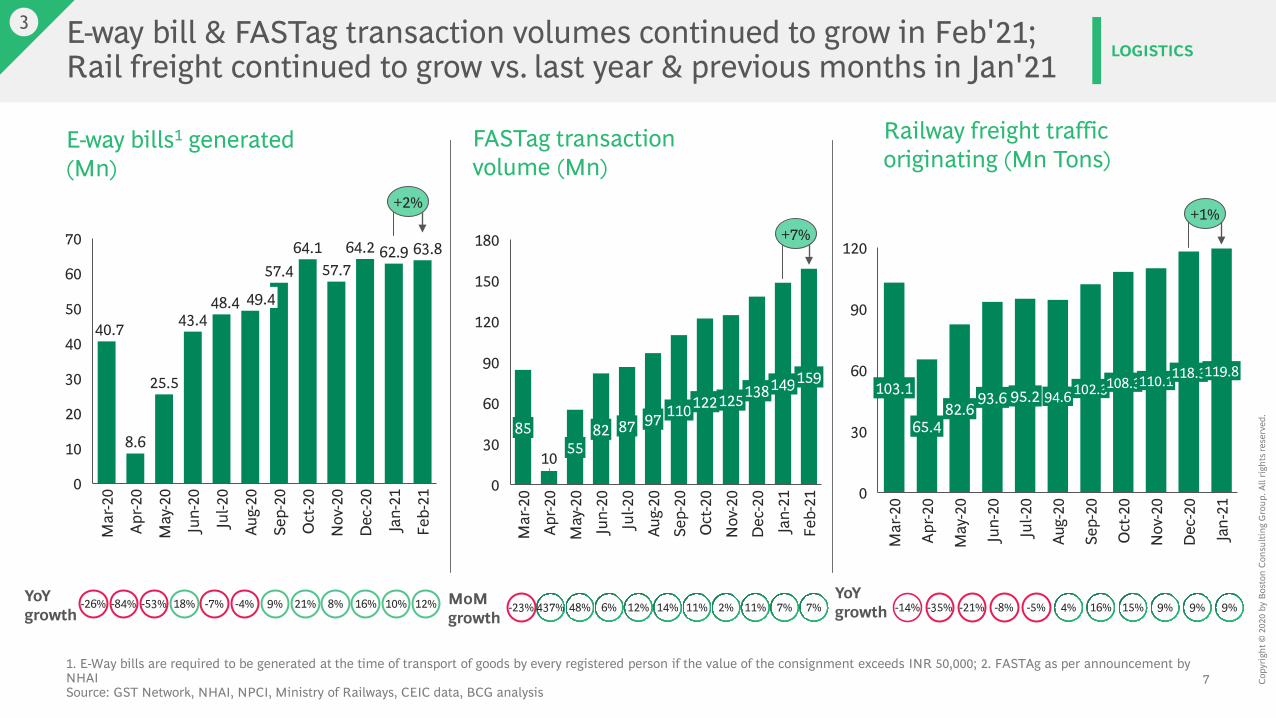
10
120
60
0
150
30
90
180
85
Jun-
20
Mar
-20
Apr-2
0
55
May
-20
82
138
Jul-2
0
11097
Aug-
20Se
p-20
122
Oct
-20
125
Feb-
21
Nov
-20
Dec
-20
149
Jan-
21
159
87
+7%
20
70
10
30
0
60
50
40
May
-20
57.7
Mar
-20
Jun-
20
Jul-2
064.2
Sep-
20
25.5
Nov
-20
57.4
Dec
-20
Jan-
21
8.6Fe
b-21
Apr-2
0
Aug-
20
Oct
-20
40.7
64.1
43.448.4 49.4
62.9 63.8
+2%
-84% 18% 437% 48%MoMgrowth
YoYgrowth
-53% 6%-7%
E-way bill & FASTag transaction volumes continued to grow in Feb'21;Rail freight continued to grow vs. last year & previous months in Jan'21
3
1. E-Way bills are required to be generated at the time of transport of goods by every registered person if the value of the consignment exceeds INR 50,000; 2. FASTAg as per announcement by NHAISource: GST Network, NHAI, NPCI, Ministry of Railways, CEIC data, BCG analysis
E-way bills1 generated(Mn)
FASTag transaction volume (Mn)
Railway freight traffic originating (Mn Tons)
12%-4% 9% 14%
30
0
60
90
120
65.4
Jul-2
0
Jan-
21
Mar
-20
103.1
Apr-2
0
Oct
-20
82.6
May
-20
93.6
Jun-
20
95.2 94.6
Aug-
20
Dec
-20
102.3
Sep-
20
108.3110.1
Nov
-20
118.3119.8
+1%
-35% -21% -8%YoYgrowth -5% 4%21% 11% 16%
LOGISTICS
8% 15%2% 11%16% 9%10% 7% 9%-14%-23%-26% 12% 9%7%
8 Copy
righ
t © 2
020
by B
osto
n Co
nsul
ting
Gro
up. A
ll ri
ghts
rese
rved
.
300
500
050
250
100
450
350
150
400
200
Aug-
20
380410465
Mar
-20
284
Jul-2
0
Apr-2
0
344275
May
-20
289
Jun-
20
353
Sep-
20423
Oct
-20
414
Jan-
21
460
Dec
-20
Feb-
21
462
Nov
-20
133
4076
107 123 128 144 148 142 150 144
77
7
5669 76
95 111 101 107 102210
270
60
0
240
150
30
180
90120
47
Jul-2
0
19
Sep-
20
Mar
-20
Aug-
20
May
-20
Jun-
20
244
Oct
-20
Nov
-20
Dec
-20
210
95
163192 204
239259 258
Jan-
21
245
Apr-2
0
-37% -39% -29% -83% -68%YoYgrowth
YoYgrowth
Domestic International
-13% -20% -40% -34%
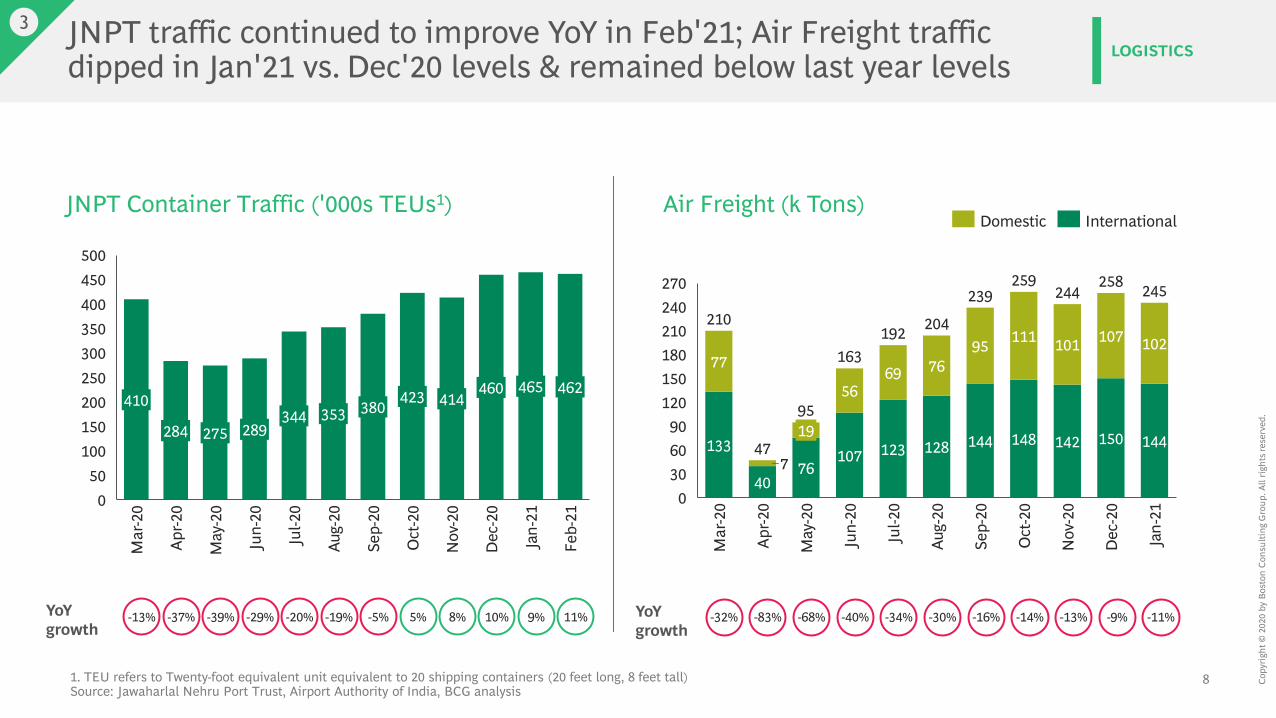
JNPT traffic continued to improve YoY in Feb'21; Air Freight traffic dipped in Jan'21 vs. Dec'20 levels & remained below last year levels
LOGISTICS
3
JNPT Container Traffic ('000s TEUs1) Air Freight (k Tons)
1. TEU refers to Twenty-foot equivalent unit equivalent to 20 shipping containers (20 feet long, 8 feet tall)Source: Jawaharlal Nehru Port Trust, Airport Authority of India, BCG analysis
-19% -5% -30%5% -16% -14%8% -13%10% -9%9% -32%11% -11%
9 Copy
righ
t © 2
020
by B
osto
n Co
nsul
ting
Gro
up. A
ll ri
ghts
rese
rved
.
YoYgrowth
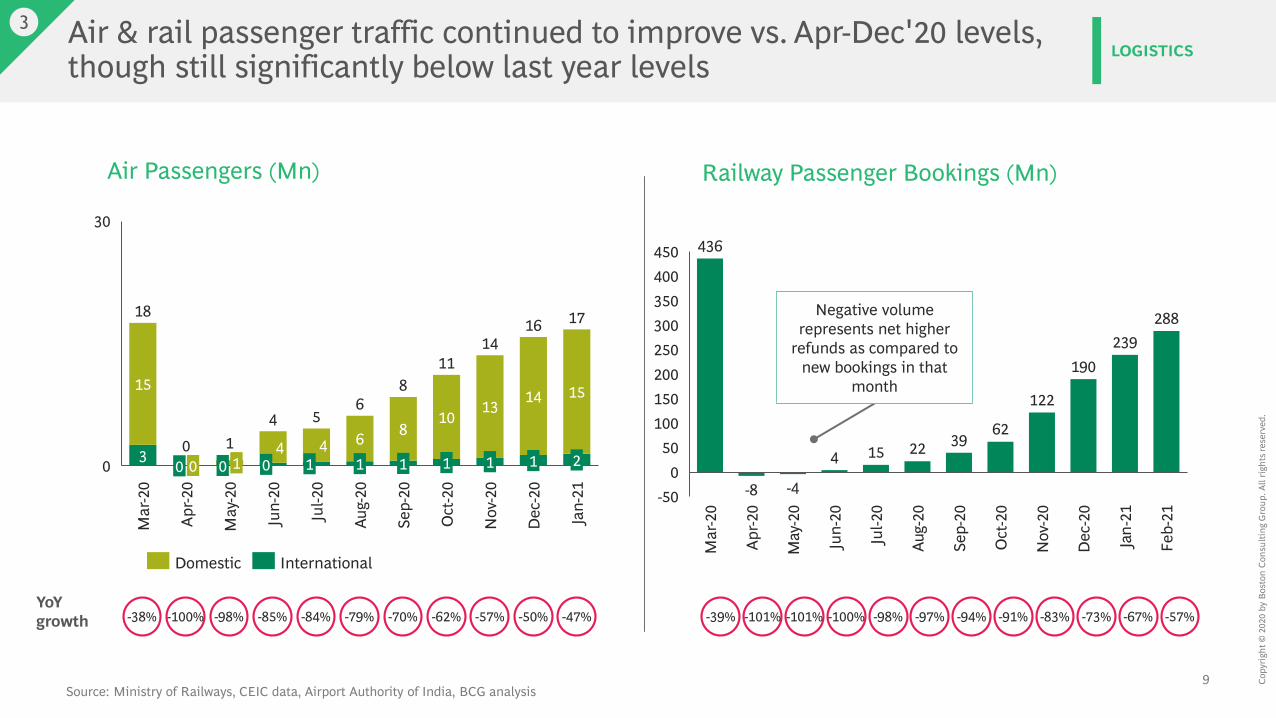
Air & rail passenger traffic continued to improve vs. Apr-Dec'20 levels, though still significantly below last year levels
LOGISTICS
3
Source: Ministry of Railways, CEIC data, Airport Authority of India, BCG analysis
3
15
4 4 6 810
13 14 15
30
0 0 1
11
1
16
0
Apr-2
0
Jul-2
0
Mar
-20
0 1
May
-20
0
Jun-
20
8
1
Aug-
20
0
Sep-
20
Dec
-20
1O
ct-2
01
Nov
-20
18
12
4 56
14
Jan-
21
17
1
InternationalDomestic
Air Passengers (Mn)
-100% -98% -85% -84% -79%
436
-8 -4
4 15 22 3962
122
190239
288
50
-50
200
0
300
100150
250
350400450
May
-20
Mar
-20
Sep-
20
Apr-2
0
Jun-
20
Jul-2
0
Aug-
20
Oct
-20
Nov
-20
Dec
-20
Jan-
21
Feb-
21
Railway Passenger Bookings (Mn)
-101% -101% -100% -98% -97% -94%
Negative volume represents net higher
refunds as compared to new bookings in that
month
-70% -91%-62% -57% -83% -73% -67%-50%-38% -39%-47% -57%
10 Copy
righ
t © 2
020
by B
osto
n Co
nsul
ting
Gro
up. A
ll ri
ghts
rese
rved
.
12.0
10.5 10.5 10.110.8 10.9 11.3 11.3 11.4 11.4
10
150
0
15
140
0
5
145
23-O
ct
143.
02
04-D
ec
15-Ja
n
06-N
ov
29-Ja
n14
7.98
18-D
ec
142.
4811
-Sep
142.
62
144.
03
25-S
ep
09-O
ct
142.
92
144.
83
01-Ja
n
146.
25
12-F
eb14
7.81
26-F
eb14
9.34
11.1
20-N
ov
145.
83
147.
18
12.111.814
3.70
YoY growth Aggregate bank deposits
5.3 5.2 5.75.1
5.8 5.8 5.7 6.1 6.6 6.4 5.96.6 6.6
0
3
102
10
15
0
105
5
01-Ja
n
106.
43
25-S
ep
103.
4309
-Oct
107.
75
102.
28
104.
19
23-O
ct
104.
35
12-F
eb10
7.04
15-Ja
n
102.
72
105.
0504
-Dec
06-N
ov
105.
5018
-Dec
20-N
ov
103.
39
107.
05
26-F
eb
29-Ja
n
11-S
ep
106.
96
YoY growth Aggregate bank credit
Bank credit (INR Tn)
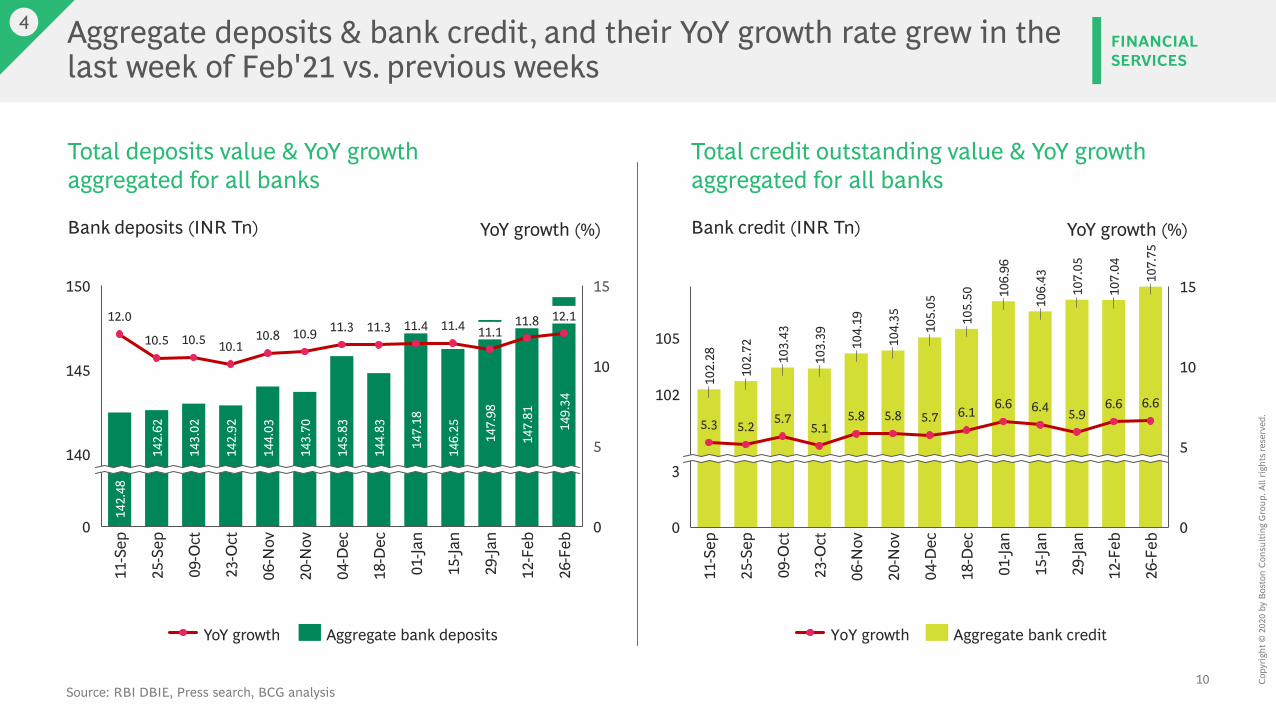
Aggregate deposits & bank credit, and their YoY growth rate grew in the last week of Feb'21 vs. previous weeks
FINANCIAL SERVICES
4
Total deposits value & YoY growth aggregated for all banks
Total credit outstanding value & YoY growth aggregated for all banks
Source: RBI DBIE, Press search, BCG analysis
YoY growth (%)Bank deposits (INR Tn) YoY growth (%)
11 Copy
righ
t © 2
020
by B
osto
n Co
nsul
ting
Gro
up. A
ll ri
ghts
rese
rved
.
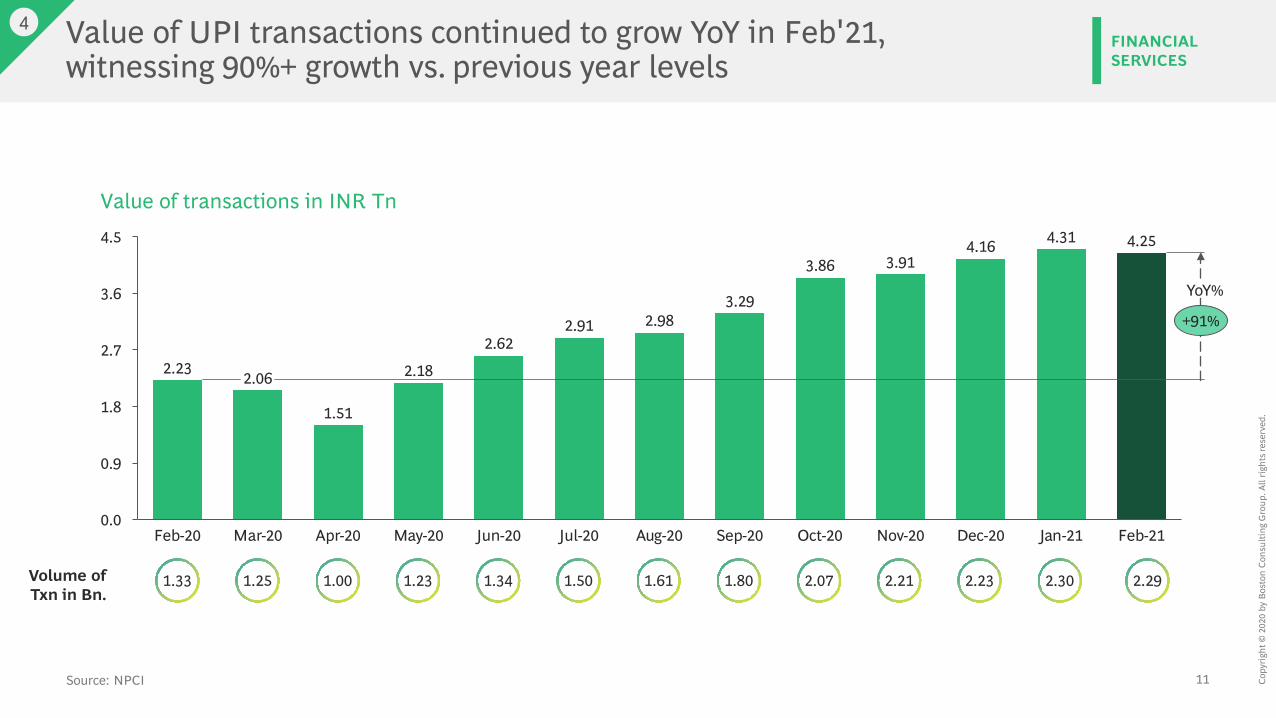
Value of UPI transactions continued to grow YoY in Feb'21, witnessing 90%+ growth vs. previous year levels
4
Source: NPCI
2.7
3.6
1.8
0.0
0.9
4.5
2.06
Mar-20
Value of transactions in INR Tn
Apr-20 May-20 Nov-20Jun-20 Jul-20
2.98
Sep-20 Oct-20
2.18
Dec-20 Jan-21 Feb-21Feb-20
1.51
Aug-20
2.232.62
2.913.29
3.86 3.914.16 4.31 4.25
+91%
1.251.33 1.00 1.501.23 1.34
YoY%
Volume of Txn in Bn.
1.61
FINANCIAL SERVICES
1.80 2.07 2.21 2.23 2.30 2.29
12 Copy
righ
t © 2
020
by B
osto
n Co
nsul
ting
Gro
up. A
ll ri
ghts
rese
rved
.
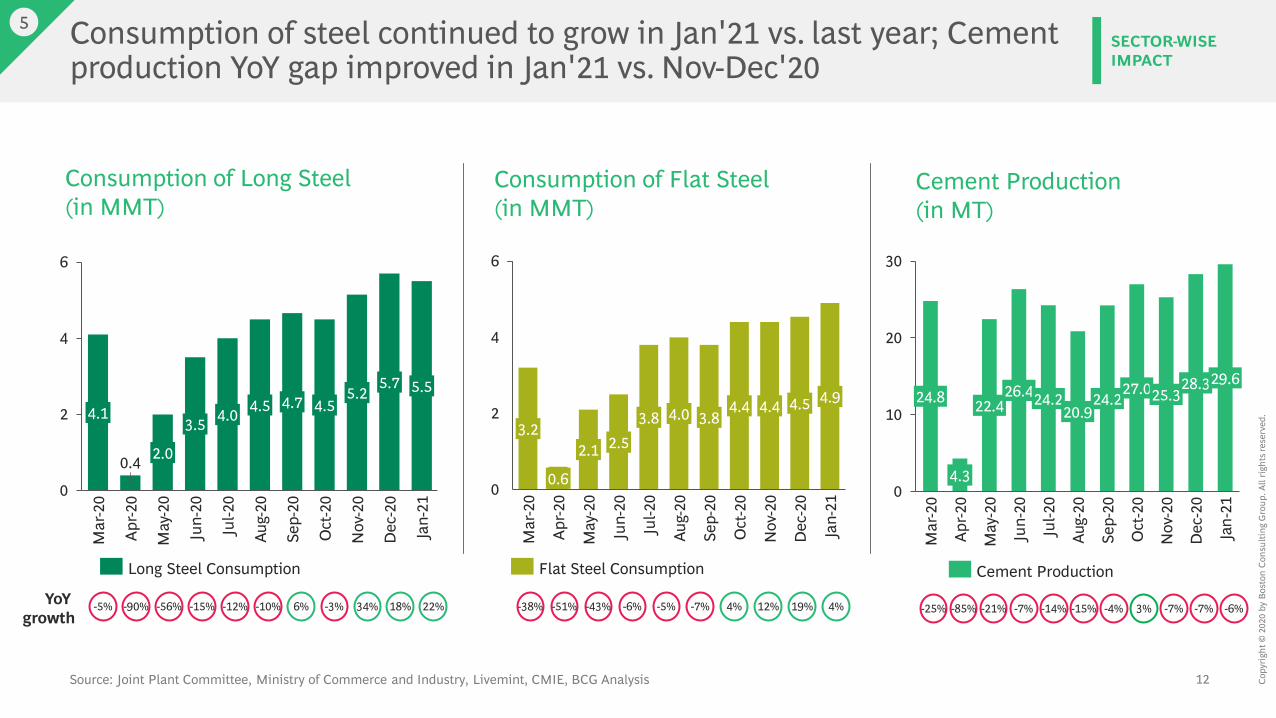
Consumption of steel continued to grow in Jan'21 vs. last year; Cement production YoY gap improved in Jan'21 vs. Nov-Dec'20
5SECTOR-WISE IMPACT
YoY growth
-15%
0.4
0
2
4
6
3.54.1
Mar
-20
Apr-2
0
May
-20
2.0
Jun-
20
Dec
-204.0 4.5
Jul-2
0
Aug-
20
4.7
Sep-
20
4.5
Oct
-20
5.2
Nov
-20
5.7 5.5
Jan-
21
Long Steel Consumption
Consumption of Long Steel (in MMT)
-43%
0
2
4
6
May
-20
3.2
Nov
-20
4.4
Mar
-20
Aug-
20
0.6
Apr-2
0
2.1 2.5
Jun-
20
3.8
Jul-2
0
4.0 3.84.5
Sep-
20
Oct
-20
4.4
Dec
-20
4.9
Jan-
21
Flat Steel Consumption
Consumption of Flat Steel (in MMT)
-56% -51%-12% -6%
Source: Joint Plant Committee, Ministry of Commerce and Industry, Livemint, CMIE, BCG Analysis
-5%-10% -7%6%
Cement Production (in MT)
0
10
20
30
4.3
Aug-
20
Sep-
20
May
-20
24.8
Mar
-20
Apr-2
0
22.4
Jun-
20
26.424.2
Jul-2
0
20.924.2
27.0
Oct
-20
25.3
Nov
-20
28.3
Dec
-20
Jan-
21
29.6
Cement Production
-7%-21% -14% -15% -4%4%-3% 3%12%34% -7%19%18% -7%22% 4%-5% -90% -85%-25%-38% -6%

13 Copy
righ
t © 2
020
by B
osto
n Co
nsul
ting
Gro
up. A
ll ri
ghts
rese
rved
.
Passenger vehicle, 2W & tractor sales continued to grow vs. last year levels while 3W sales continued to dip in Feb'21 vs. last year
5SECTOR-WISE IMPACT
Figures represent wholesale numbers (including exports).1. Tata Motors data is available for Apr-June only, BMW, Mercedes and Volvo Auto data is not available Source: SIAM, CMIE, Press search, BCG analysis
Passenger vehicles sales ('000 units) Two-wheeler sales ('0000 units)
Tractor sales ('000 units) Three-wheeler sales ('000 units)
-48% -45%
-2% 13% 9% 0.2% 11% 18%
-39%
-3% 13%
-41%YoY growth
27% 9% 48%
7% 11%
-35%41%
Oct
51
Mar
35
AugApr SepMay
72
FebJun Jul Nov Dec
71
Jan5762 54
12
65 65
82 99
52
88
6071 73
9211
6
114 124
90 59 65 85
44
-80% 1% 20% 36% 65%
360
305
286
266
251
259 31
1
289 32
7
323
217 25
4 311 35
1
303
310
306
307
314
317
AugMar FebApr May JulJun Sep Oct Nov Dec Jan
181
4 49
130
276 32
2
Mar
165
Apr May
181
182
Jun Aug JanJul Nov Dec Feb
146169
109
161
Oct
5
202
38
195
121 18
2
188
196 218
205
18224
2
171 193
135
150 17
9
184
Sep
240
115
92 91 92 96 105
111
112
104
95 98 106
104
84
JulMayApr DecMar Jun Sep
61
Aug Oct FebNov Jan
54
7 20
36 33
54 6961 61 67 69
-66%-61%-78%-92%
-20%-38%-81%-98%-14%-51%YoY growth -99% -83%
2019 20212020
-36%48%
10%2%-50% -36%
-53%-50% -18%
3% 12%
30%
14 Copy
righ
t © 2
020
by B
osto
n Co
nsul
ting
Gro
up. A
ll ri
ghts
rese
rved
.
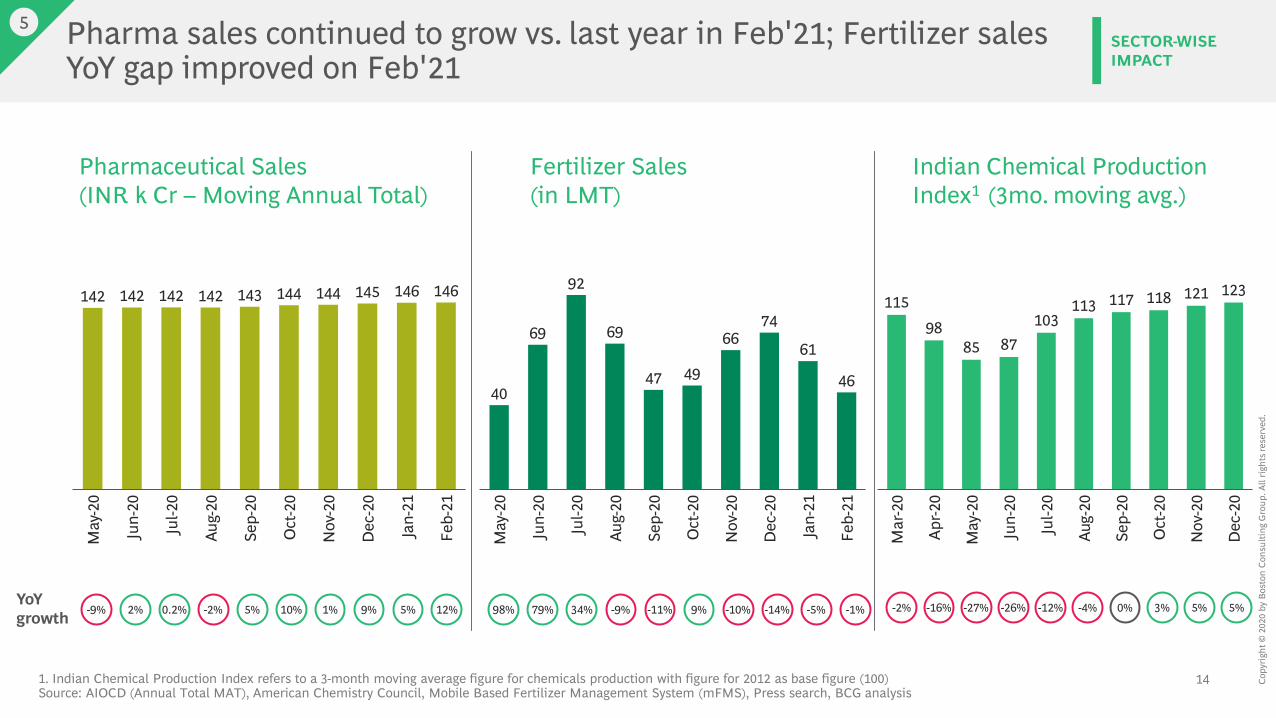
Pharma sales continued to grow vs. last year in Feb'21; Fertilizer sales YoY gap improved on Feb'21
5SECTOR-WISE IMPACT
1. Indian Chemical Production Index refers to a 3-month moving average figure for chemicals production with figure for 2012 as base figure (100)Source: AIOCD (Annual Total MAT), American Chemistry Council, Mobile Based Fertilizer Management System (mFMS), Press search, BCG analysis
Pharmaceutical Sales (INR k Cr – Moving Annual Total)
Fertilizer Sales (in LMT)
Indian Chemical Production Index1 (3mo. moving avg.)
YoY growth
Jul-2
0
Oct
-20
Feb-
21
Jun-
20
May
-20
142
Aug-
20
Sep-
20
Nov
-20
Dec
-20
Jan-
21
146142 142 143142 144 144 145 146
10%-9% 2% 0.2% -2% 5% 1% 9%
92
Dec
-20
Jun-
20
66
May
-20
Jul-2
0
Aug-
20
Sep-
20
Oct
-20
Nov
-20
Jan-
21
Feb-
21
74
40
69 69
47 4961
46
98% 79% 34% -9% -11% 9% -10% -14%
11598
85 87103
113 117 118 121 123
Mar
-20
Jun-
20
Apr-2
0
May
-20
Sep-
20
Jul-2
0
Aug-
20
Oct
-20
Nov
-20
Dec
-20
-16% -27% -26% -12% -4% 0% 3% 5% 5%-5% -2%-1%5% 12%
15 Copy
righ
t © 2
020
by B
osto
n Co
nsul
ting
Gro
up. A
ll ri
ghts
rese
rved
.
19%
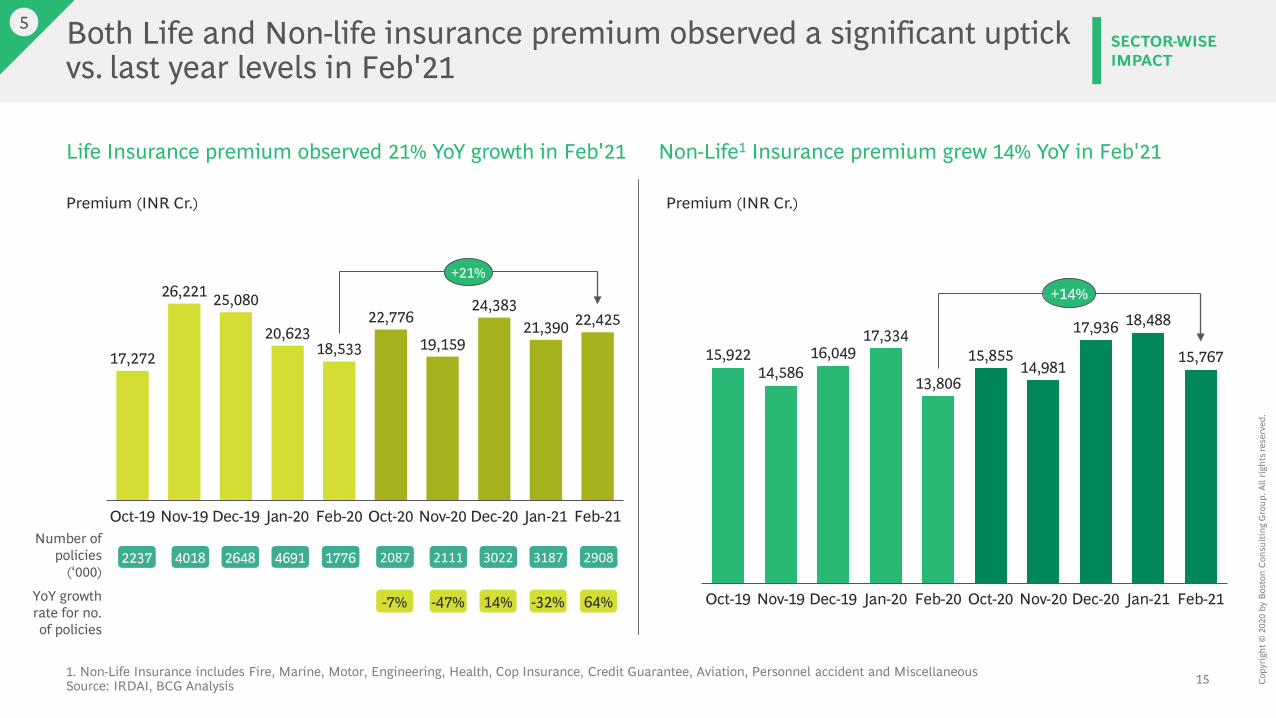
Both Life and Non-life insurance premium observed a significant uptick vs. last year levels in Feb'21
5
Life Insurance premium observed 21% YoY growth in Feb'21 Non-Life1 Insurance premium grew 14% YoY in Feb'21
15,92214,586
16,04917,334
13,806
15,85514,981
17,936 18,488
15,767
Oct-19 Nov-19 Dec-19 Dec-20Nov-20Jan-20 Oct-20Feb-20 Jan-21 Feb-21
+14%
1. Non-Life Insurance includes Fire, Marine, Motor, Engineering, Health, Cop Insurance, Credit Guarantee, Aviation, Personnel accident and Miscellaneous Source: IRDAI, BCG Analysis
17,272
26,221 25,080
20,62318,533
22,776
19,159
24,38321,390 22,425
Nov-19Oct-19 Dec-20Nov-20Dec-19 Oct-20Jan-20 Feb-20 Jan-21 Feb-21
+21%
Number of policies
(‘000)
YoY growth rate for no. of policies
Premium (INR Cr.)
2648 3022
14%
SECTOR-WISE IMPACT
Premium (INR Cr.)
2237 2087
-7%
4018 2111
-47%
4691 3187
-32%
1776 2908
64%
16 Copy
righ
t © 2
020
by B
osto
n Co
nsul
ting
Gro
up. A
ll ri
ghts
rese
rved
.
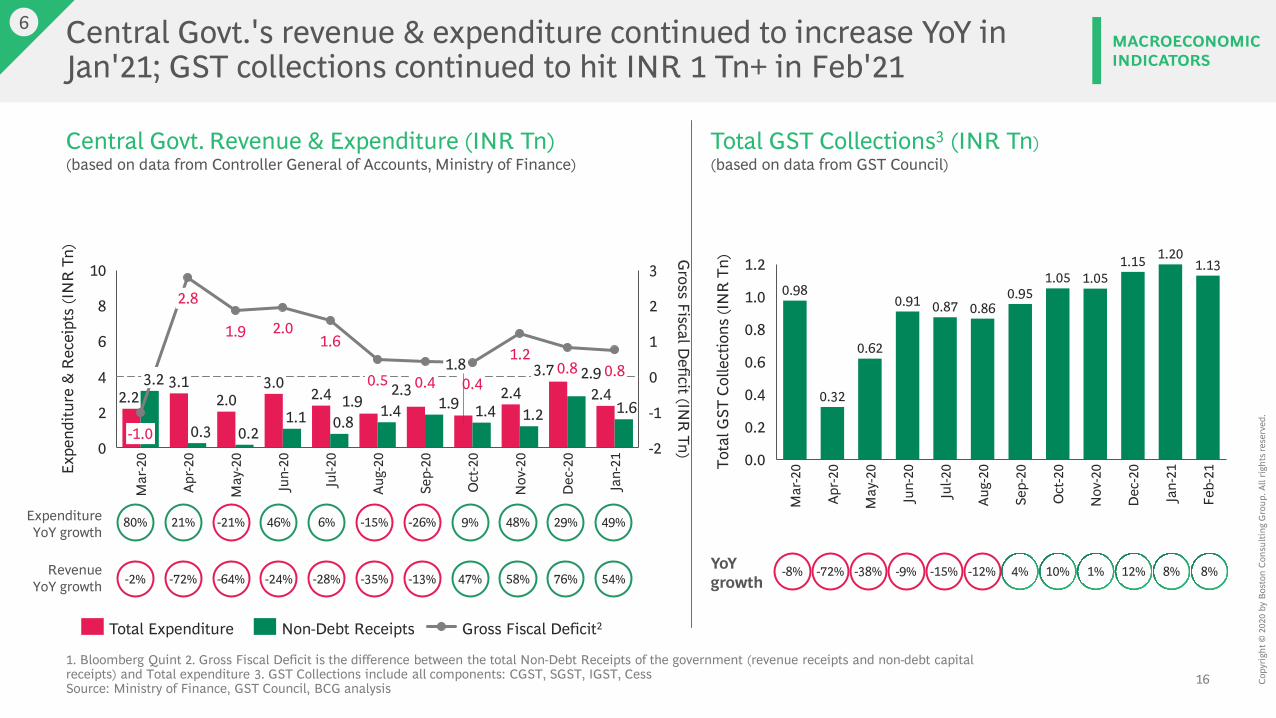
Central Govt.'s revenue & expenditure continued to increase YoY in Jan'21; GST collections continued to hit INR 1 Tn+ in Feb'21
Central Govt. Revenue & Expenditure (INR Tn)(based on data from Controller General of Accounts, Ministry of Finance)
Total GST Collections3 (INR Tn)(based on data from GST Council)
-38% -9%
ExpenditureYoY growth
1. Bloomberg Quint 2. Gross Fiscal Deficit is the difference between the total Non-Debt Receipts of the government (revenue receipts and non-debt capital receipts) and Total expenditure 3. GST Collections include all components: CGST, SGST, IGST, CessSource: Ministry of Finance, GST Council, BCG analysis
1
3
4
-2
2 -1
2
0
6
0
8
10
1.9
-1.0
1.2
Nov
-20
Mar
-20
Jul-2
0
2.8
Apr-2
0
1.9
May
-20
3.1
2.0
2.4
1.6
Sep-
20
0.5
0.8
Aug-
200.4
0.3
0.4
1.4
Oct
-20
0.8
Dec
-20
0.8
Jan-
21
1.92.0
Expe
nditu
re &
Rec
eipt
s (IN
R T
n) Gross Fiscal D
eficit (INR
Tn)
1.12.2
3.2
0.2
3.02.4
Jun-
20
2.32.91.8
1.2
3.72.4
1.61.4
Total Expenditure Non-Debt Receipts Gross Fiscal Deficit2
0.4
0.0
1.2
0.8
0.2
1.0
0.6
0.91
Jan-
21
Aug-
20
Tota
l GST
Col
lect
ions
(IN
R T
n)
0.32
Mar
-20
Apr-2
0
May
-20
Jun-
20
Jul-2
0
Sep-
20
Oct
-20
Nov
-20
Dec
-20
Feb-
21
1.20
0.98
0.62
0.87 0.860.95
1.05 1.051.15 1.13
RevenueYoY growth
-15%
21% -21%
-72% -64%
46%
-24%
6%
-28%
6MACROECONOMIC INDICATORS
-12%YoY growth
4%-35%
-15%
10%-13%
-26%
1%47%
9%
12%
48%
58% 8%
29%
76% -72%-8%
80%
-2% 8%54%
49%
17 Copy
righ
t © 2
020
by B
osto
n Co
nsul
ting
Gro
up. A
ll ri
ghts
rese
rved
.
Jan-
20
Mar
-20
Feb-
20
1.7
Apr-2
0
May
-20
Jun-
20
Jul-2
0
Aug-
20
Sep-
20
Nov
-20
Oct
-20
3.6
2.7
Dec
-20
Jan-
21
Feb-
21
2.83.6
2.52.11.8
0.8
3.32.9
4.24.6
3.8
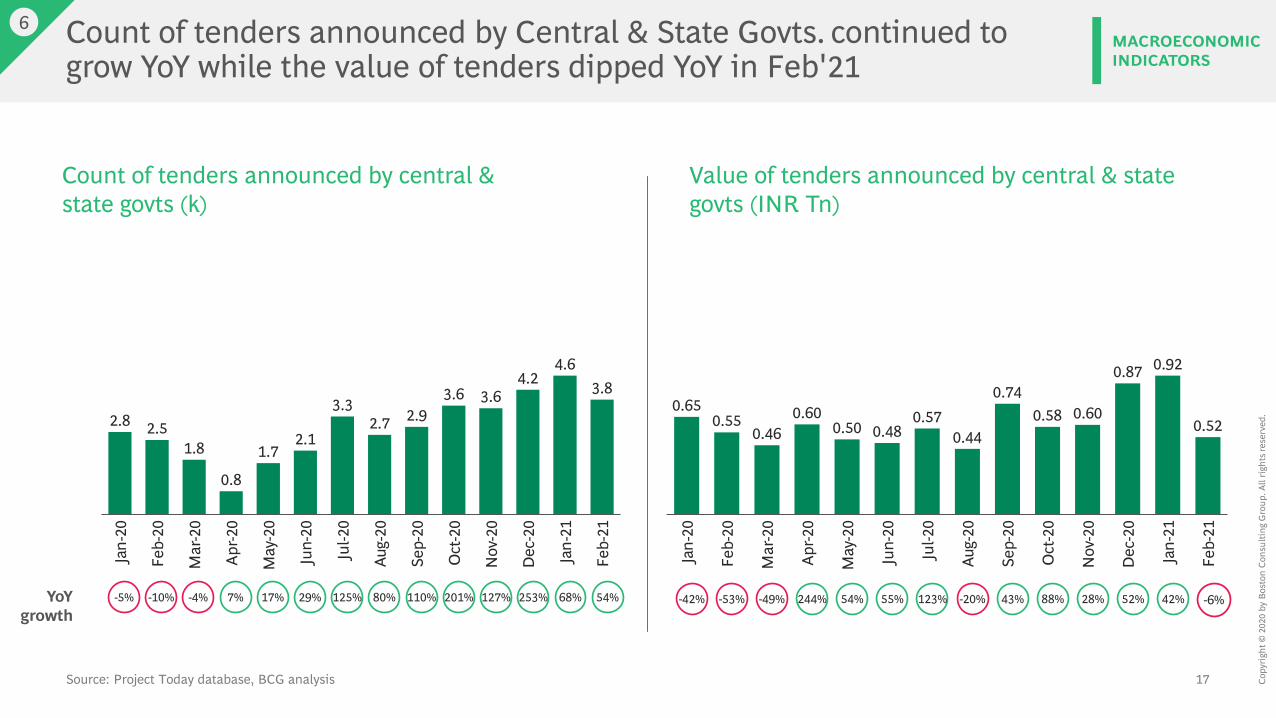
Source: Project Today database, BCG analysis
Count of tenders announced by central &state govts (k)
Value of tenders announced by central & state govts (INR Tn)
YoYgrowth
17%-10% 7%-4%-5% 29% 54%-53% 244%-42% 123%125% 55%-49% -20%80% 110% 43%201% 88%127% 28%253% 52%68% 42%
Jul-2
0
Nov
-20
Feb-
20
Jan-
20
Mar
-20
May
-20
Apr-2
0
Feb-
21
Aug-
20
Jun-
20
0.87
0.60
Sep-
20
Oct
-20
Dec
-20
0.46
Jan-
21
0.650.55 0.60
0.50 0.480.57
0.44
0.740.58
0.92
0.52
54% -6%
Count of tenders announced by Central & State Govts. continued to grow YoY while the value of tenders dipped YoY in Feb'21
6MACROECONOMIC INDICATORS
18 Copy
righ
t © 2
020
by B
osto
n Co
nsul
ting
Gro
up. A
ll ri
ghts
rese
rved
.
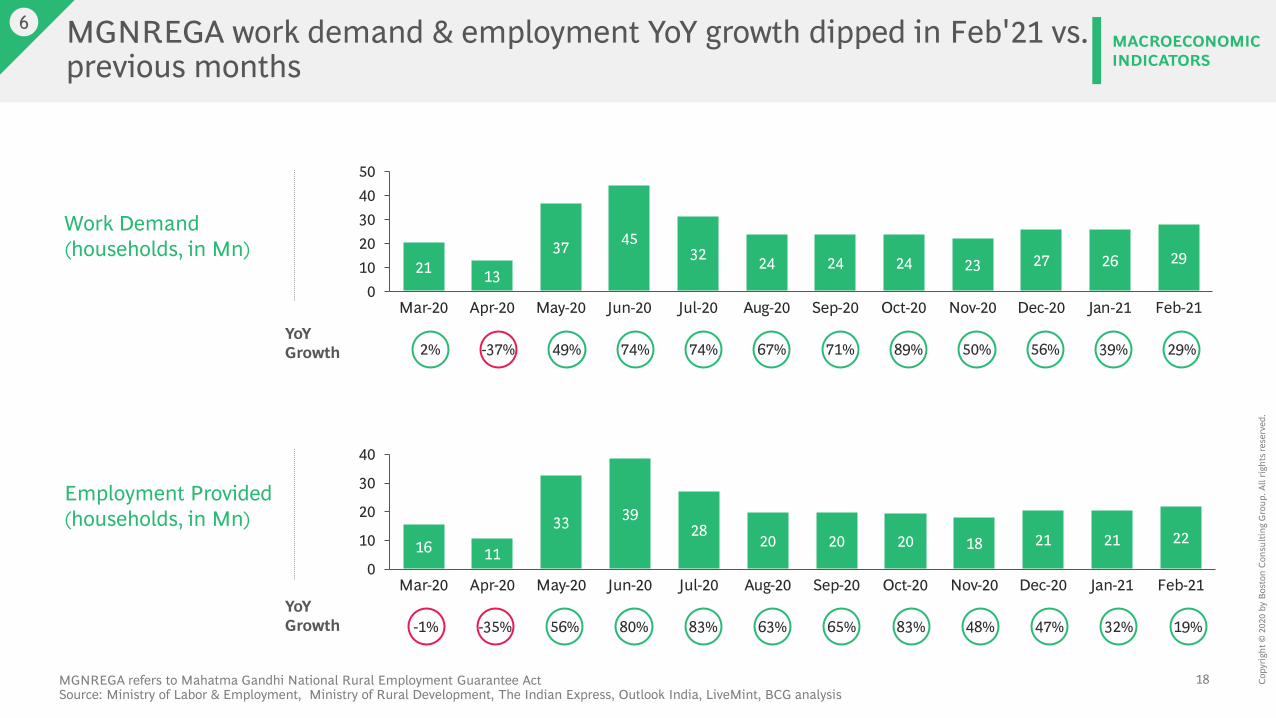
MGNREGA work demand & employment YoY growth dipped in Feb'21 vs. previous months
6
16 11
33 3928
20 20 20 18 21 21 22
0
10
20
30
40
May-20 Jul-20Mar-20 Jun-20Apr-20 Aug-20 Sep-20 Oct-20 Nov-20 Dec-20 Jan-21 Feb-21
80%YoYGrowth 56%-35%
Work Demand (households, in Mn)
Employment Provided (households, in Mn)
21 13
37 4532 24 24 24 23 27 26 29
01020304050
Sep-20 Jan-21Apr-20 Aug-20 Dec-20Jul-20Mar-20 May-20 Jun-20 Oct-20 Nov-20 Feb-21
74%YoYGrowth 49%-37% 74%
83%
MGNREGA refers to Mahatma Gandhi National Rural Employment Guarantee ActSource: Ministry of Labor & Employment, Ministry of Rural Development, The Indian Express, Outlook India, LiveMint, BCG analysis
63%
67%
MACROECONOMIC INDICATORS
65%
71% 89%
83%
50%
48%
56%
47%
39%
32%
2%
-1%
29%
19%
19 Copy
righ
t © 2
020
by B
osto
n Co
nsul
ting
Gro
up. A
ll ri
ghts
rese
rved
.
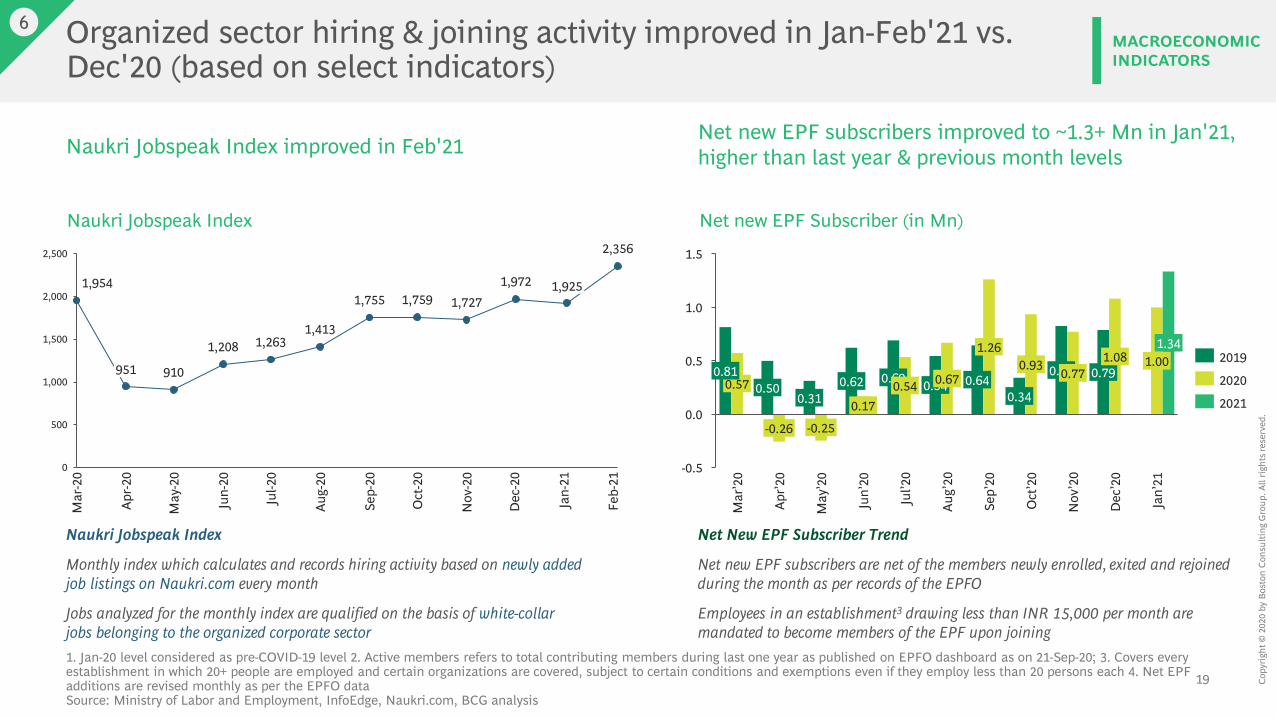
Organized sector hiring & joining activity improved in Jan-Feb'21 vs. Dec'20 (based on select indicators)
6
1. Jan-20 level considered as pre-COVID-19 level 2. Active members refers to total contributing members during last one year as published on EPFO dashboard as on 21-Sep-20; 3. Covers every establishment in which 20+ people are employed and certain organizations are covered, subject to certain conditions and exemptions even if they employ less than 20 persons each 4. Net EPF additions are revised monthly as per the EPFO dataSource: Ministry of Labor and Employment, InfoEdge, Naukri.com, BCG analysis
Naukri Jobspeak Index improved in Feb'21
Net New EPF Subscriber Trend
Net new EPF subscribers are net of the members newly enrolled, exited and rejoined during the month as per records of the EPFO
Employees in an establishment3 drawing less than INR 15,000 per month are mandated to become members of the EPF upon joining
Net new EPF subscribers improved to ~1.3+ Mn in Jan'21, higher than last year & previous month levels
Naukri Jobspeak Index
Monthly index which calculates and records hiring activity based on newly added job listings on Naukri.com every month
Jobs analyzed for the monthly index are qualified on the basis of white-collar jobs belonging to the organized corporate sector
1,954
910
1,208 1,2631,413
1,755 1,759 1,7271,972
2,356
0
500
1,000
1,500
2,000
2,500
Mar
-20
Apr-2
0
May
-20
Jul-2
0
Jun-
20
Aug-
20
Jan-
21
Sep-
20
Oct
-20
Nov
-20
Dec
-20
Feb-
21
951
1,925
Naukri Jobspeak Index Net new EPF Subscriber (in Mn)
1.5
0.0
1.0
-0.5
0.5
Oct
’20
Sep’
20
0.570.31
Mar
’20
0.640.50
Jun’
20
-0.26
Apr’2
0
-0.25
0.93
May
’20
0.810.62
0.17
1.34
0.690.54
Jul’2
0
0.54
1.00
Aug’
20
0.34
1.26
0.830.77
Nov
’20
0.791.08
Dec
’20
Jan’
21
0.67 2020
2019
2021
MACROECONOMIC INDICATORS
20 Copy
righ
t © 2
020
by B
osto
n Co
nsul
ting
Gro
up. A
ll ri
ghts
rese
rved
.
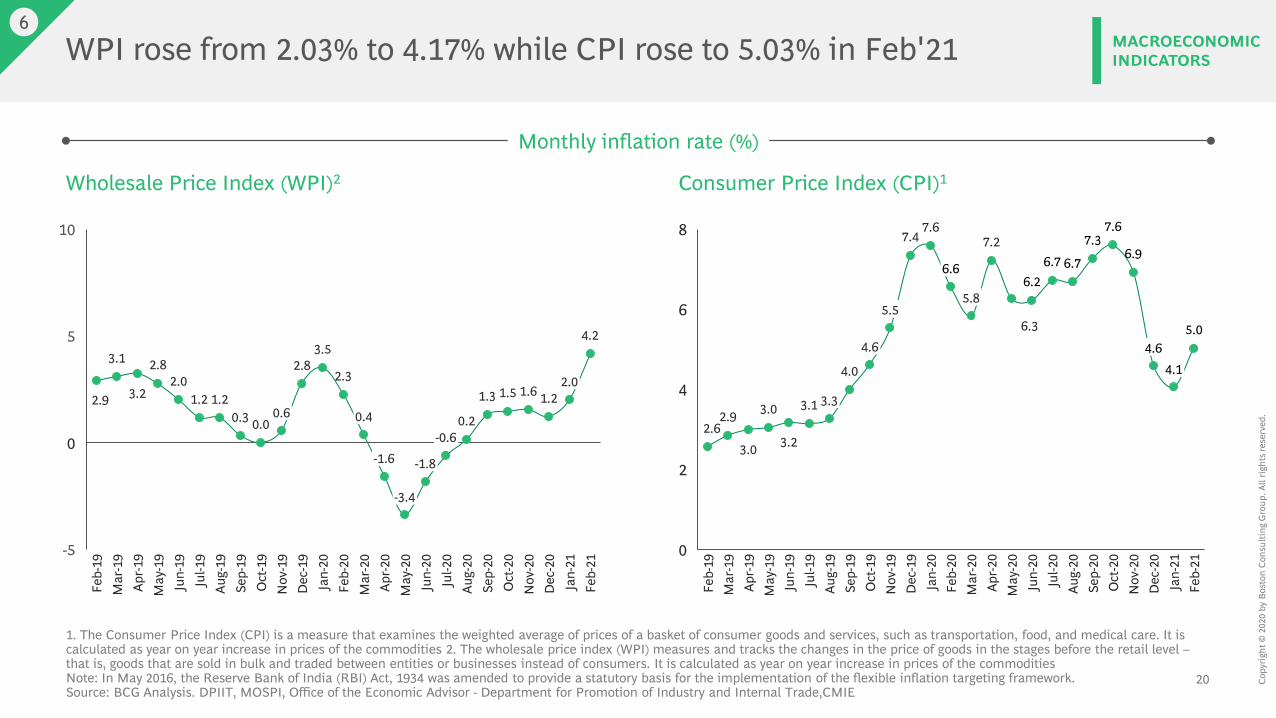
WPI rose from 2.03% to 4.17% while CPI rose to 5.03% in Feb'216
1. The Consumer Price Index (CPI) is a measure that examines the weighted average of prices of a basket of consumer goods and services, such as transportation, food, and medical care. It is calculated as year on year increase in prices of the commodities 2. The wholesale price index (WPI) measures and tracks the changes in the price of goods in the stages before the retail level –that is, goods that are sold in bulk and traded between entities or businesses instead of consumers. It is calculated as year on year increase in prices of the commoditiesNote: In May 2016, the Reserve Bank of India (RBI) Act, 1934 was amended to provide a statutory basis for the implementation of the flexible inflation targeting framework. Source: BCG Analysis. DPIIT, MOSPI, Office of the Economic Advisor - Department for Promotion of Industry and Internal Trade,CMIE
Monthly inflation rate (%)
2.9
3.1
3.2
2.82.0
1.2 1.20.3 0.0
2.83.5
2.3
0.2
1.3 1.5 1.6 1.2
4.25
0
-5
10
Jun-
19
Apr-2
0
Feb-
19
Apr-1
9
Dec
-20
May
-19
Jul-1
9Au
g-19
Jan-
20
0.6
Sep-
19O
ct-1
9N
ov-1
9
Mar
-19
2.0
-0.6
Mar
-20
Feb-
20
0.4
-1.6
-3.4
May
-20
-1.8
Jun-
20Ju
l-20
Aug-
20Se
p-20
Oct
-20
Nov
-20
Jan-
21Fe
b-21
Dec
-19
Wholesale Price Index (WPI)2 Consumer Price Index (CPI)1
2.62.9
3.0
3.0
3.2
3.1
4.0
7.47.6
7.2
6.3
6.26.7 6.7
7.37.6
6.9
5.0
8
0
2
4
6
Apr-1
9
Jun-
19
Mar
-19
May
-19
4.1
Feb-
19
May
-20
Jul-1
9
3.3
Aug-
20
Aug-
19Se
p-19
4.6
Nov
-20
Oct
-19
5.5
Nov
-19
Dec
-19
Feb-
21
Oct
-20
Jan-
20
4.6
6.6
Feb-
20
5.8
Mar
-20
Apr-2
0
Jun-
20Ju
l-20
Sep-
20
Dec
-20
Jan-
21
MACROECONOMIC INDICATORS
21 Copy
righ
t © 2
020
by B
osto
n Co
nsul
ting
Gro
up. A
ll ri
ghts
rese
rved
.
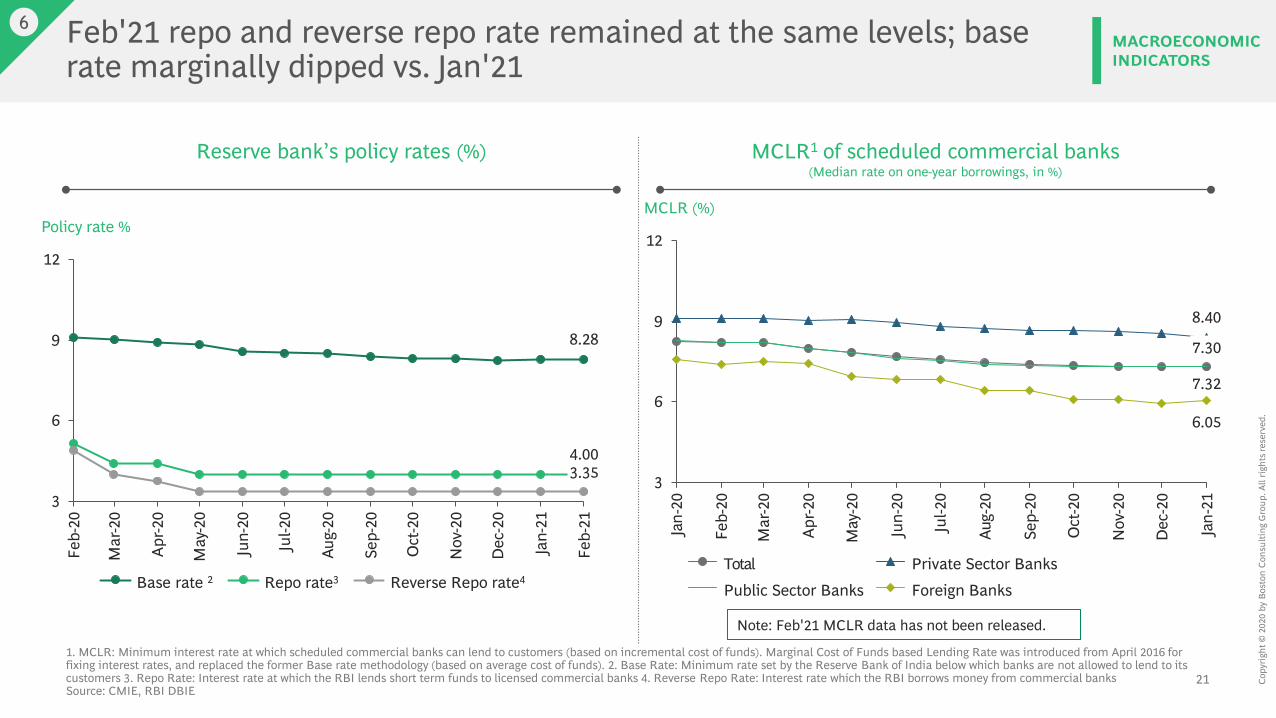
Feb'21 repo and reverse repo rate remained at the same levels; base rate marginally dipped vs. Jan'21
1. MCLR: Minimum interest rate at which scheduled commercial banks can lend to customers (based on incremental cost of funds). Marginal Cost of Funds based Lending Rate was introduced from April 2016 for fixing interest rates, and replaced the former Base rate methodology (based on average cost of funds). 2. Base Rate: Minimum rate set by the Reserve Bank of India below which banks are not allowed to lend to its customers 3. Repo Rate: Interest rate at which the RBI lends short term funds to licensed commercial banks 4. Reverse Repo Rate: Interest rate which the RBI borrows money from commercial banksSource: CMIE, RBI DBIE
Reserve bank’s policy rates (%) MCLR1 of scheduled commercial banks (Median rate on one-year borrowings, in %)
8.28
4.00
3
6
9
12
Feb-
20
Jul-2
0
Mar
-20
Apr-2
0
May
-20
Jun-
20
Aug-
20
Sep-
20
Oct
-20
Nov
-20
Dec
-20
Jan-
21
Feb-
21
3.35
Policy rate %
Base rate 2 Reverse Repo rate4Repo rate3
7.32
8.40
6.05
3
6
9
12
Jan-
20
Apr-2
0
Jan-
21
Feb-
20
Mar
-20
Aug-
20
Sep-
20
May
-20
Jun-
20
Jul-2
0
Oct
-20
Nov
-20
Dec
-20
MCLR (%)
7.30
Private Sector BanksTotal
Public Sector Banks Foreign Banks
6MACROECONOMIC INDICATORS
Note: Feb'21 MCLR data has not been released.
22 Copy
righ
t © 2
020
by B
osto
n Co
nsul
ting
Gro
up. A
ll ri
ghts
rese
rved
.
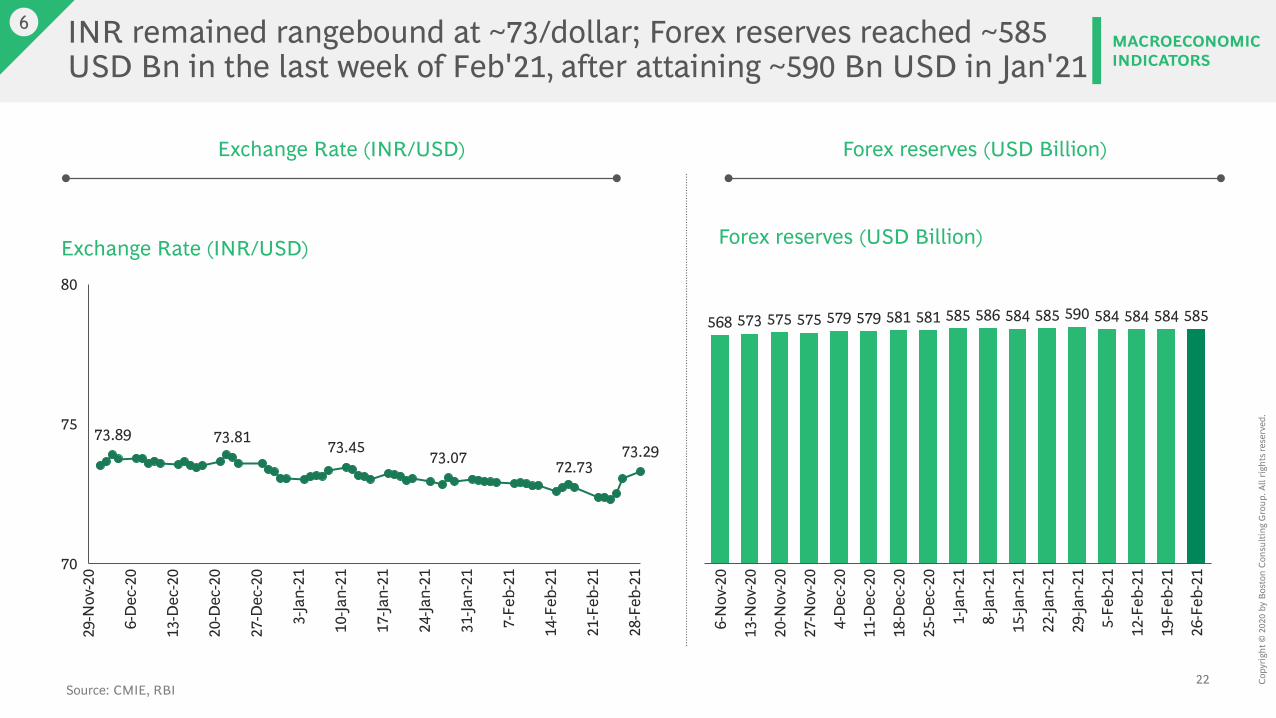
INR remained rangebound at ~73/dollar; Forex reserves reached ~585 USD Bn in the last week of Feb'21, after attaining ~590 Bn USD in Jan'21
Source: CMIE, RBI
Exchange Rate (INR/USD) Forex reserves (USD Billion)
6MACROECONOMIC INDICATORS
73.89 73.81 73.4573.07 72.73
73.29
13-D
ec-2
0
6-D
ec-2
0
20-D
ec-2
0
29-N
ov-2
0
27-D
ec-2
0
3-Ja
n-21
10-Ja
n-21
17-Ja
n-21
24-Ja
n-21
31-Ja
n-21
75
70
80
21-F
eb-2
1
7-Fe
b-21
14-F
eb-2
1
28-F
eb-2
1
Exchange Rate (INR/USD)
568 573 575 575 579 579 581 581 585 586 584 585 590 584 584 584 585
13-N
ov-2
0
12-F
eb-2
1
6-N
ov-2
0
20-N
ov-2
0
27-N
ov-2
0
4-D
ec-2
0
29-Ja
n-21
11-D
ec-2
0
18-D
ec-2
0
25-D
ec-2
0
1-Ja
n-21
8-Ja
n-21
15-Ja
n-21
22-Ja
n-21
19-F
eb-2
1
5-Fe
b-21
26-F
eb-2
1
Forex reserves (USD Billion)
23 Copy
righ
t © 2
020
by B
osto
n Co
nsul
ting
Gro
up. A
ll ri
ghts
rese
rved
.
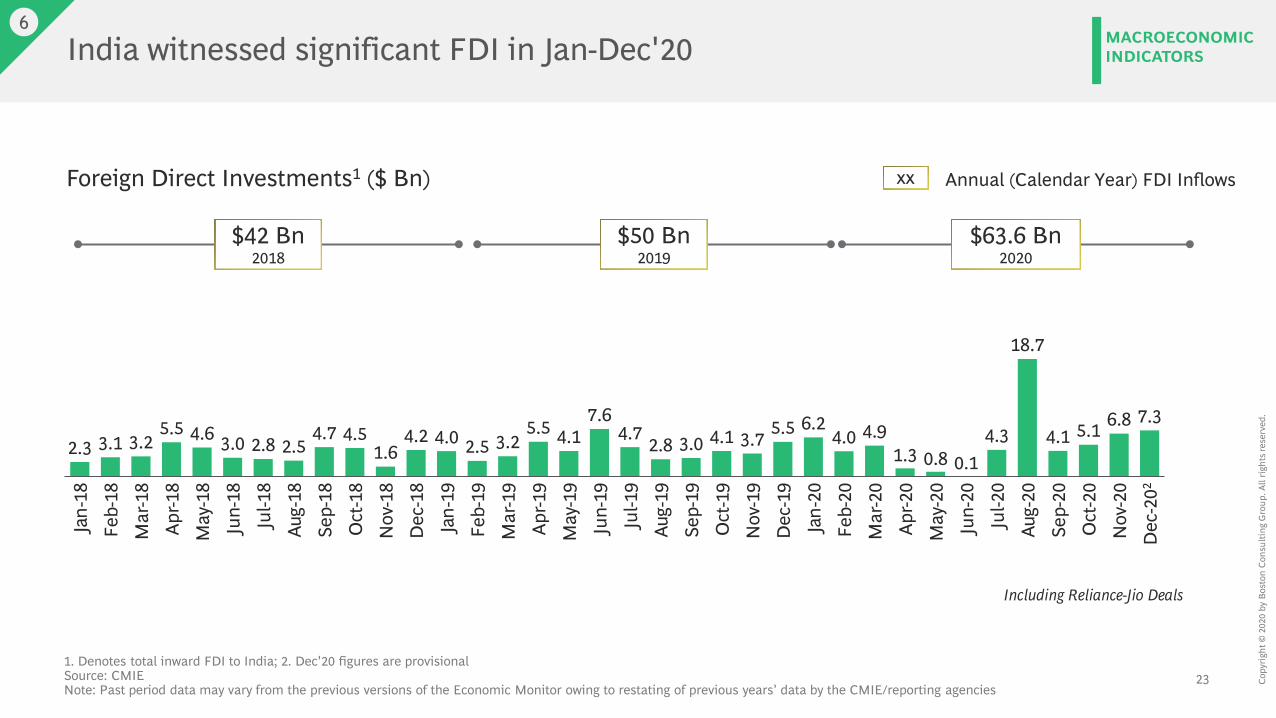
India witnessed significant FDI in Jan-Dec'20
1. Denotes total inward FDI to India; 2. Dec'20 figures are provisionalSource: CMIENote: Past period data may vary from the previous versions of the Economic Monitor owing to restating of previous years’ data by the CMIE/reporting agencies
Foreign Direct Investments1 ($ Bn) xx Annual (Calendar Year) FDI Inflows
Including Reliance-Jio Deals
2.3 3.1 3.25.5 4.6 3.0 2.8 2.5
4.7 4.51.6
4.2 4.0 2.5 3.25.5 4.1
7.64.7 2.8 3.0 4.1 3.7 5.5 6.2
4.0 4.91.3 0.8 0.1
4.3
18.7
4.1 5.1 6.8 7.3
Aug-
18
Feb-
20
Apr-1
8
Feb-
18
Jan-
19
Jan-
18
Oct
-20
Mar
-18
May
-18
Jun-
18
Sep-
20
Jul-1
8
Sep-
19
Sep-
18
Oct
-18
Nov
-18
Nov
-20
Dec
-19
Feb-
19
Mar
-19
May
-19
Apr-1
9
Jun-
19
Jul-1
9
Jun-
20
Aug-
19
Jul-2
0
Apr-2
0
Oct
-19
Nov
-19
Jan-
20
May
-20
Mar
-20
Aug-
20
Dec
-202
Dec
-18
$42 Bn2018
$50 Bn2019
$63.6 Bn2020
6MACROECONOMIC INDICATORS
24 Copy
righ
t © 2
020
by B
osto
n Co
nsul
ting
Gro
up. A
ll ri
ghts
rese
rved
.
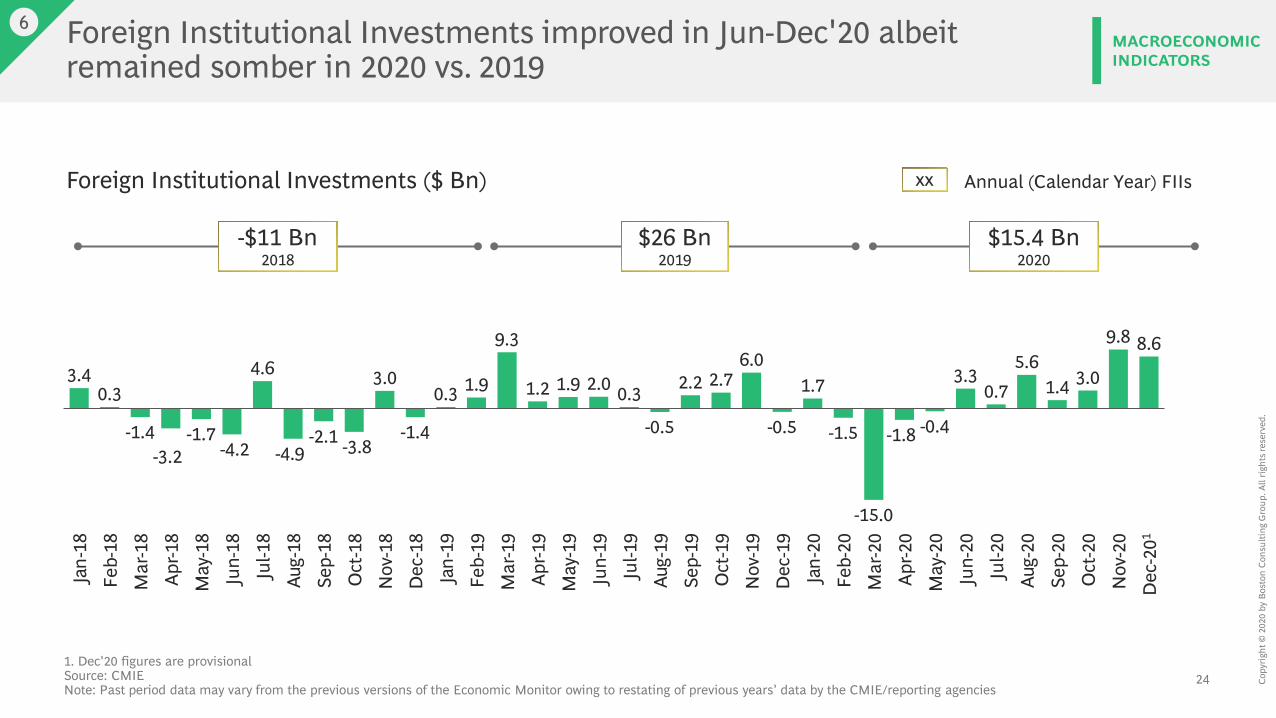
Foreign Institutional Investments improved in Jun-Dec'20 albeit remained somber in 2020 vs. 2019
Jun-
18
Jan-
18
Feb-
18
1.7
May
-20
Mar
-19
Mar
-18
3.4
Apr-1
8
4.6
May
-18
Sep-
18
Aug-
18
9.8
-0.5
Jul-1
8
Apr-2
0
-1.4
Oct
-18
Nov
-18
Dec
-18
Jan-
19
Aug-
20
Feb-
19
Apr-1
9
May
-19
-0.4
Dec
-19
Jun-
19
Jul-1
9
9.3
Aug-
19
Nov
-20
Sep-
19
Oct
-19
6.0
Nov
-19
Feb-
20
Jan-
20
Mar
-20
1.9
Jul-2
0
Jun-
20
-3.8
Sep-
20
-4.2
Oct
-20
0.3
-3.2
0.3
-1.7-4.9
-2.1 -1.5
3.0
-1.4
1.9 1.2 2.0 2.70.3
-0.5
2.2
-1.8
3.30.7
5.61.4 3.0
Dec
-201
8.6
-15.0
Foreign Institutional Investments ($ Bn)
-$11 Bn2018
$26 Bn2019
$15.4 Bn2020
xx Annual (Calendar Year) FIIs
1. Dec'20 figures are provisionalSource: CMIENote: Past period data may vary from the previous versions of the Economic Monitor owing to restating of previous years’ data by the CMIE/reporting agencies
6MACROECONOMIC INDICATORS
25 Copy
righ
t © 2
020
by B
osto
n Co
nsul
ting
Gro
up. A
ll ri
ghts
rese
rved
.
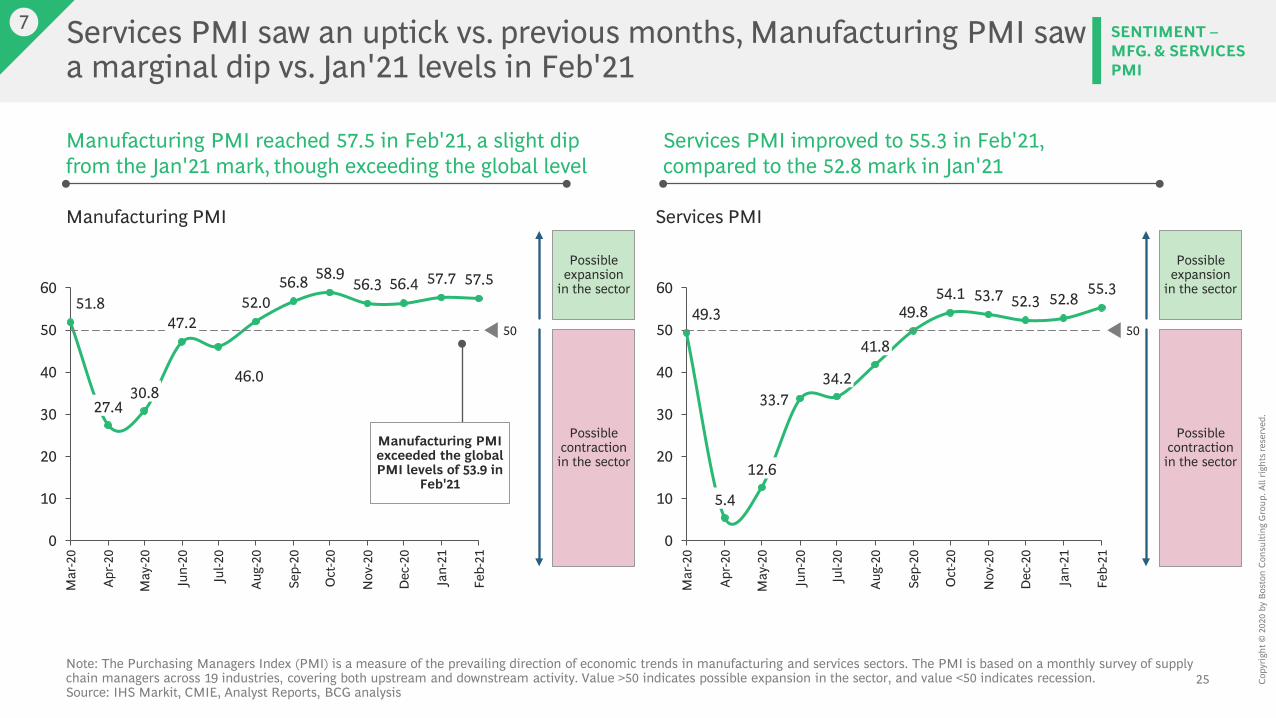
Services PMI saw an uptick vs. previous months, Manufacturing PMI saw a marginal dip vs. Jan'21 levels in Feb'21
SENTIMENT –MFG. & SERVICES PMI
7
Note: The Purchasing Managers Index (PMI) is a measure of the prevailing direction of economic trends in manufacturing and services sectors. The PMI is based on a monthly survey of supply chain managers across 19 industries, covering both upstream and downstream activity. Value >50 indicates possible expansion in the sector, and value <50 indicates recession.Source: IHS Markit, CMIE, Analyst Reports, BCG analysis
Manufacturing PMI reached 57.5 in Feb'21, a slight dip from the Jan'21 mark, though exceeding the global level
Services PMI improved to 55.3 in Feb'21, compared to the 52.8 mark in Jan'21
Manufacturing PMI Services PMI
Possible expansion
in the sector
Possible contraction in the sector
49.3
33.7
49.854.1 53.7 52.3 52.8
55.3
0
10
20
30
40
50
60
May
-20
Mar
-20
Jul-2
0
Sep-
20
Nov
-20
Jan-
21
Jun-
20
Apr-2
0
Aug-
20
Oct
-20
Dec
-20
Feb-
21
5.4
12.6
34.2
41.850
51.847.2
46.0
52.056.8 58.9
56.3 56.4 57.7 57.5
0
10
20
30
40
50
60
Dec
-20
Jul-2
0
Mar
-20
May
-20
Sep-
20
Nov
-20
Jan-
21
Apr-2
0
Oct
-20
Jun-
20
Aug-
20
Feb-
21
27.4
50
30.8
Possible expansion
in the sector
Possible contraction in the sector
Manufacturing PMI exceeded the global PMI levels of 53.9 in
Feb'21
26 Copy
righ
t © 2
020
by B
osto
n Co
nsul
ting
Gro
up. A
ll ri
ghts
rese
rved
.
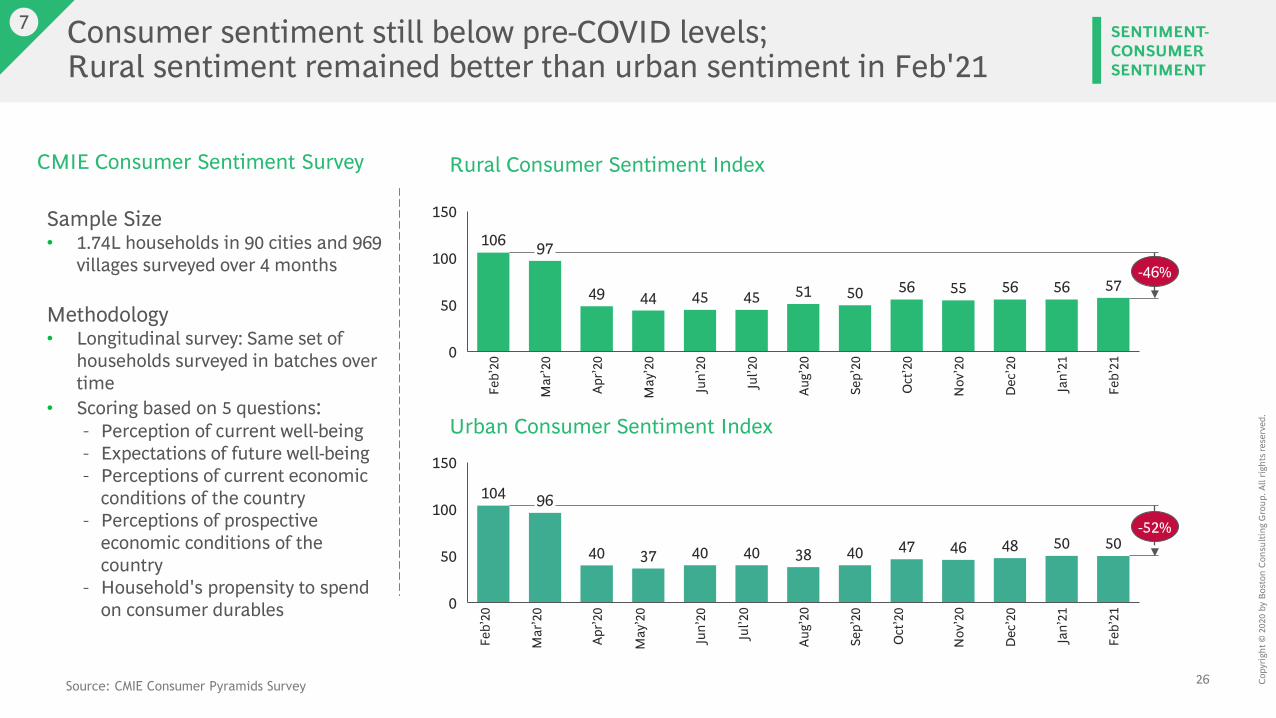
Consumer sentiment still below pre-COVID levels;Rural sentiment remained better than urban sentiment in Feb'21
SENTIMENT-CONSUMER SENTIMENT
7
Source: CMIE Consumer Pyramids Survey
CMIE Consumer Sentiment Survey Rural Consumer Sentiment Index
106 97
49 44 45 45 51 50 56 55 56 56 57
0
150
50
100
Jan’
21
Feb’
20
Mar
’20
Nov
’20
May
’20
Apr’2
0
Jun’
20
Jul’2
0
Aug’
20
Sep’
20
Oct
’20
Dec
’20
Feb’
21
-46%
104 96
40 37 40 40 38 40 47 46 48 50 50
0
50
100
150
May
’20
Apr’2
0
Feb’
20
Sep’
20
Mar
’20
Nov
’20
Jun’
20
Jul’2
0
Aug’
20
Feb’
21
Oct
’20
Dec
’20
Jan’
21
-52%
Sample Size• 1.74L households in 90 cities and 969
villages surveyed over 4 months
Methodology• Longitudinal survey: Same set of
households surveyed in batches over time
• Scoring based on 5 questions:– Perception of current well-being– Expectations of future well-being– Perceptions of current economic
conditions of the country – Perceptions of prospective
economic conditions of the country
– Household's propensity to spend on consumer durables
Urban Consumer Sentiment Index
27 Copy
righ
t © 2
020
by B
osto
n Co
nsul
ting
Gro
up. A
ll ri
ghts
rese
rved
.
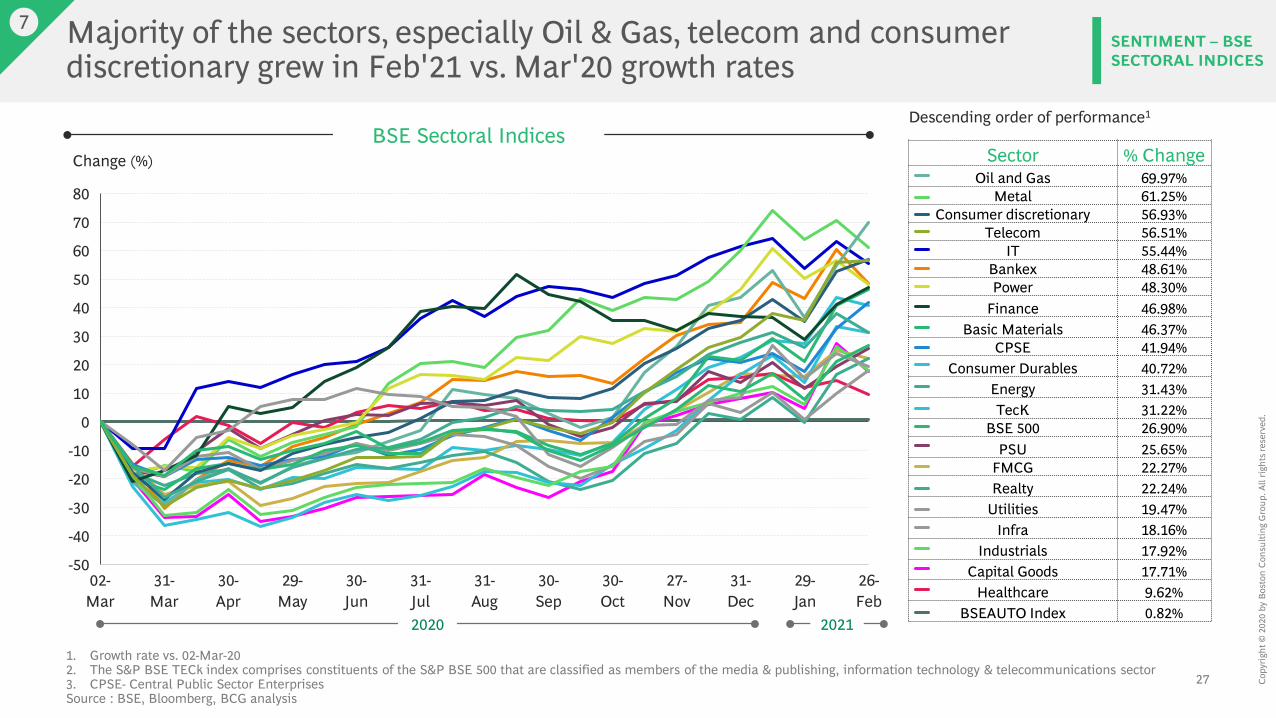
Majority of the sectors, especially Oil & Gas, telecom and consumer discretionary grew in Feb'21 vs. Mar'20 growth rates
SENTIMENT – BSE SECTORAL INDICES
7
1. Growth rate vs. 02-Mar-202. The S&P BSE TECk index comprises constituents of the S&P BSE 500 that are classified as members of the media & publishing, information technology & telecommunications sector3. CPSE- Central Public Sector EnterprisesSource : BSE, Bloomberg, BCG analysis
BSE Sectoral Indices Descending order of performance1
-10
-30
-50
-40
-20
60
20
30
40
10
50
70
80
0
Change (%)
30-Sep
29-Jan
27-Nov
31-Dec
30-Jun
02-Mar
31-Mar
30-Apr
29-May
31-Jul
31-Aug
30-Oct
26-Feb
Sector % ChangeOil and Gas 69.97%
Metal 61.25%Consumer discretionary 56.93%
Telecom 56.51%IT 55.44%
Bankex 48.61%Power 48.30%
Finance 46.98%Basic Materials 46.37%
CPSE 41.94%Consumer Durables 40.72%
Energy 31.43%TecK 31.22%
BSE 500 26.90%PSU 25.65%
FMCG 22.27%Realty 22.24%
Utilities 19.47%Infra 18.16%
Industrials 17.92%Capital Goods 17.71%
Healthcare 9.62%BSEAUTO Index 0.82%
2020 2021
28 Copy
righ
t © 2
020
by B
osto
n Co
nsul
ting
Gro
up. A
ll ri
ghts
rese
rved
.
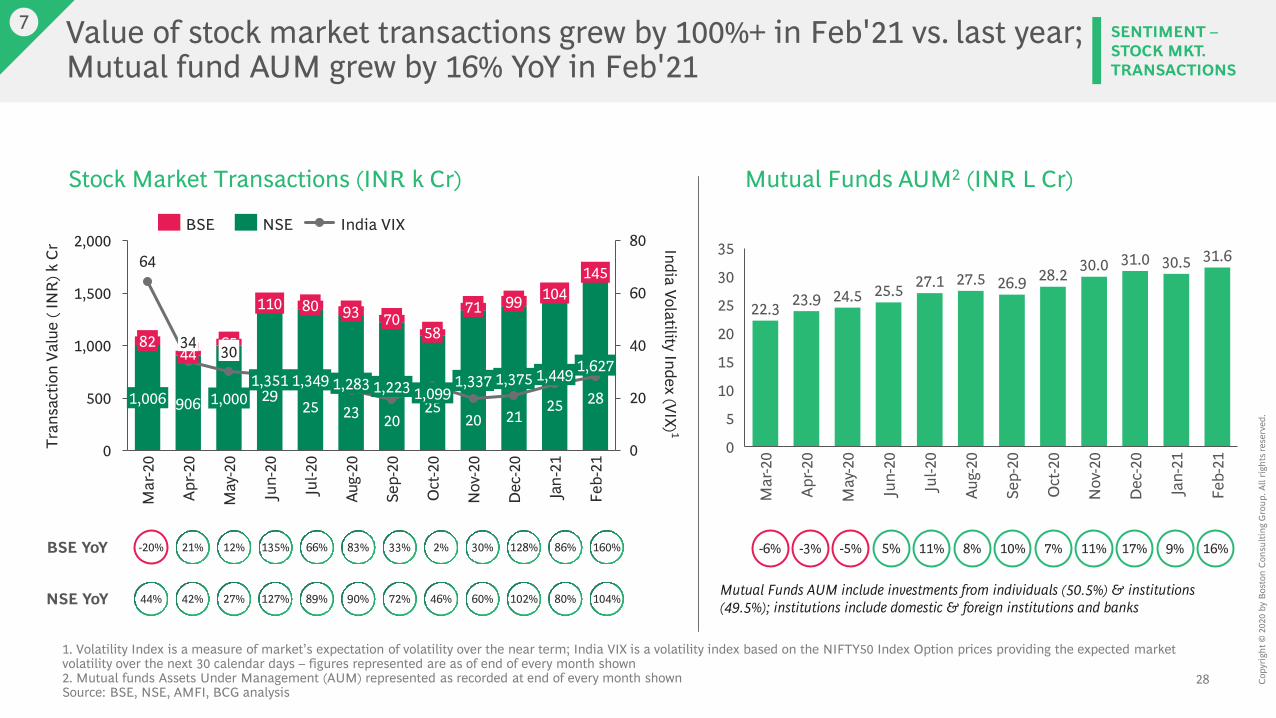
Value of stock market transactions grew by 100%+ in Feb'21 vs. last year; Mutual fund AUM grew by 16% YoY in Feb'21
SENTIMENT –STOCK MKT. TRANSACTIONS
7
1. Volatility Index is a measure of market’s expectation of volatility over the near term; India VIX is a volatility index based on the NIFTY50 Index Option prices providing the expected market volatility over the next 30 calendar days – figures represented are as of end of every month shown2. Mutual funds Assets Under Management (AUM) represented as recorded at end of every month shownSource: BSE, NSE, AMFI, BCG analysis
Stock Market Transactions (INR k Cr)
-3% -5% 5%
35
10
0
25
20
5
30
15
27.130.5
25.5
Mar
-20
Apr-2
0
May
-20
Jun-
20
Jul-2
0
27.5
Aug-
20
31.6
Sep-
20
Oct
-20
Nov
-20
Dec
-20
Jan-
21
22.3 23.9 24.526.9 28.2 30.0 31.0
Feb-
21
Mutual Funds AUM include investments from individuals (50.5%) & institutions (49.5%); institutions include domestic & foreign institutions and banks
11%
Mutual Funds AUM2 (INR L Cr)
64
2925 23 20
2520 21
25 28
0
20
40
60
80
1,500
500
1,000
0
2,000
145
India Volatility Index (VIX) 1
May
-20
Tran
sact
ion
Valu
e ( I
NR
) k C
r
82
1,006
Mar
-20
44
1,099906
34
Apr-2
0
1,337
93
65
1,000
30
110
1,351
Feb-
21
Jun-
20
80
1,349
Oct
-20
Jul-2
0
1,283
Aug-
20
70
1,223
104
Sep-
20
5871
Nov
-20
1,6271,375
Dec
-20
1,449
Jan-
21
99
BSE India VIXNSE
21% 12% 135%BSE YoY
42% 27% 127%NSE YoY
66%
89%
8%83%
90%
10%33%
72%
7%2%
46%
11%30%
60%
17%
102%
128% 9%86%
80%
-20%
44%
-6% 16%
104%
160%
29 Copy
righ
t © 2
020
by B
osto
n Co
nsul
ting
Gro
up. A
ll ri
ghts
rese
rved
.
GDP Deep-Dive2
Economic Indicators1
30 Copy
righ
t © 2
020
by B
osto
n Co
nsul
ting
Gro
up. A
ll ri
ghts
rese
rved
.
COVID-19
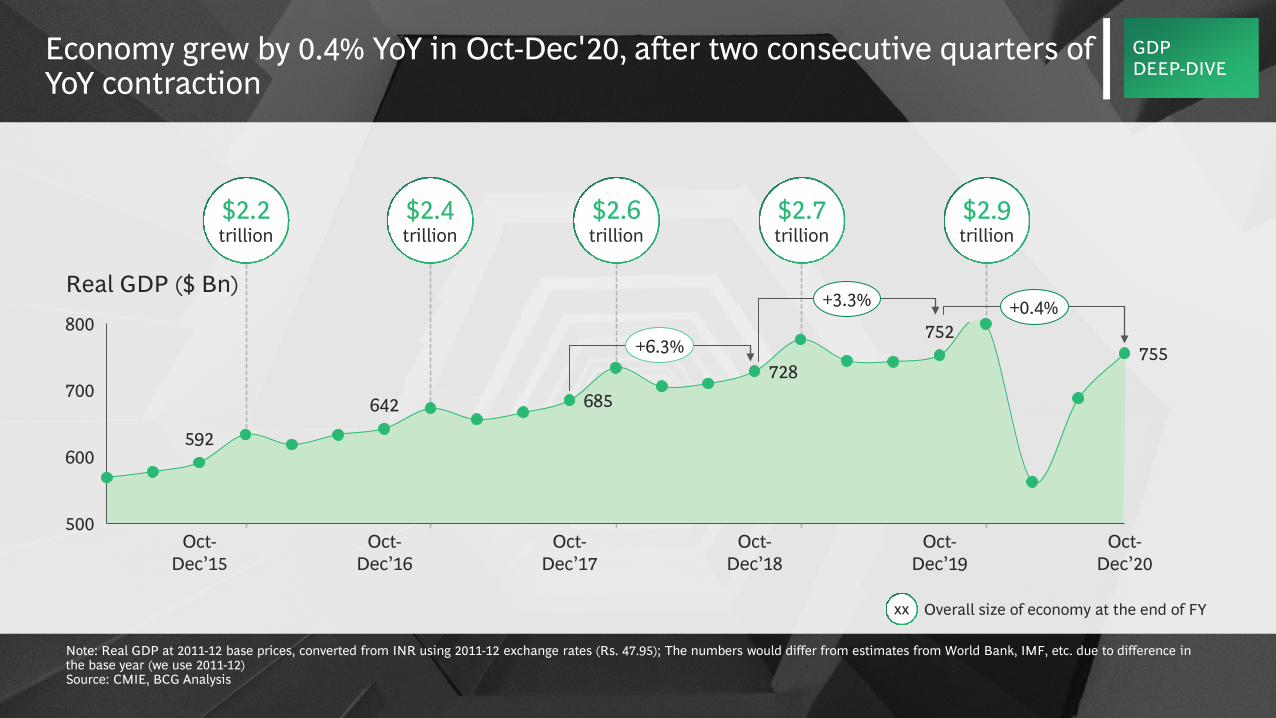
$2.2trillion
$2.4trillion
$2.6trillion
$2.7trillion
Note: Real GDP at 2011-12 base prices, converted from INR using 2011-12 exchange rates (Rs. 47.95); The numbers would differ from estimates from World Bank, IMF, etc. due to difference in the base year (we use 2011-12)Source: CMIE, BCG Analysis
Economy grew by 0.4% YoY in Oct-Dec'20, after two consecutive quarters of YoY contraction
xx Overall size of economy at the end of FY
GDPDEEP-DIVE
$2.9trillion
592
642 685728
752755
600
500
700
800
Real GDP ($ Bn)
Oct-Dec’16
Oct-Dec’17
Oct-Dec’15
Oct-Dec’18
Oct-Dec’19
Oct-Dec’20
+6.3%
+3.3% +0.4%
31 Copy
righ
t © 2
020
by B
osto
n Co
nsul
ting
Gro
up. A
ll ri
ghts
rese
rved
.
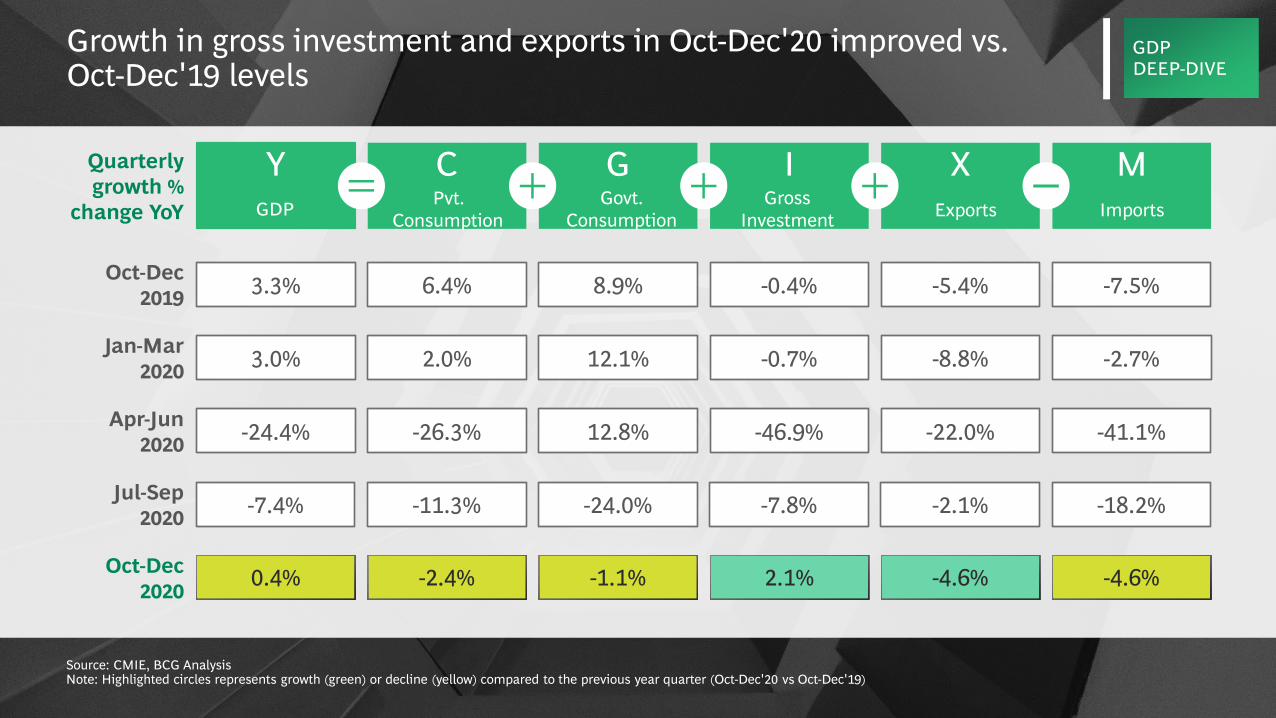
COVID-19 Growth in gross investment and exports in Oct-Dec'20 improved vs.Oct-Dec'19 levels
Source: CMIE, BCG AnalysisNote: Highlighted circles represents growth (green) or decline (yellow) compared to the previous year quarter (Oct-Dec'20 vs Oct-Dec'19)
I XC G MY
-0.4% -5.4%6.4% 8.9% -7.5%3.3%Oct-Dec 2019
-46.9% -22.0%-26.3% 12.8% -41.1%-24.4%Apr-Jun2020
2.1% -4.6%-2.4% -1.1% -4.6%0.4%Oct-Dec 2020
-0.7% -8.8%2.0% 12.1% -2.7%3.0%Jan-Mar2020
Quarterly growth %
change YoY GDP Pvt. Consumption
Govt.Consumption
GrossInvestment Exports Imports
GDPDEEP-DIVE
-7.8% -2.1%-11.3% -24.0% -18.2%-7.4%Jul-Sep 2020
32 Copy
righ
t © 2
020
by B
osto
n Co
nsul
ting
Gro
up. A
ll ri
ghts
rese
rved
.
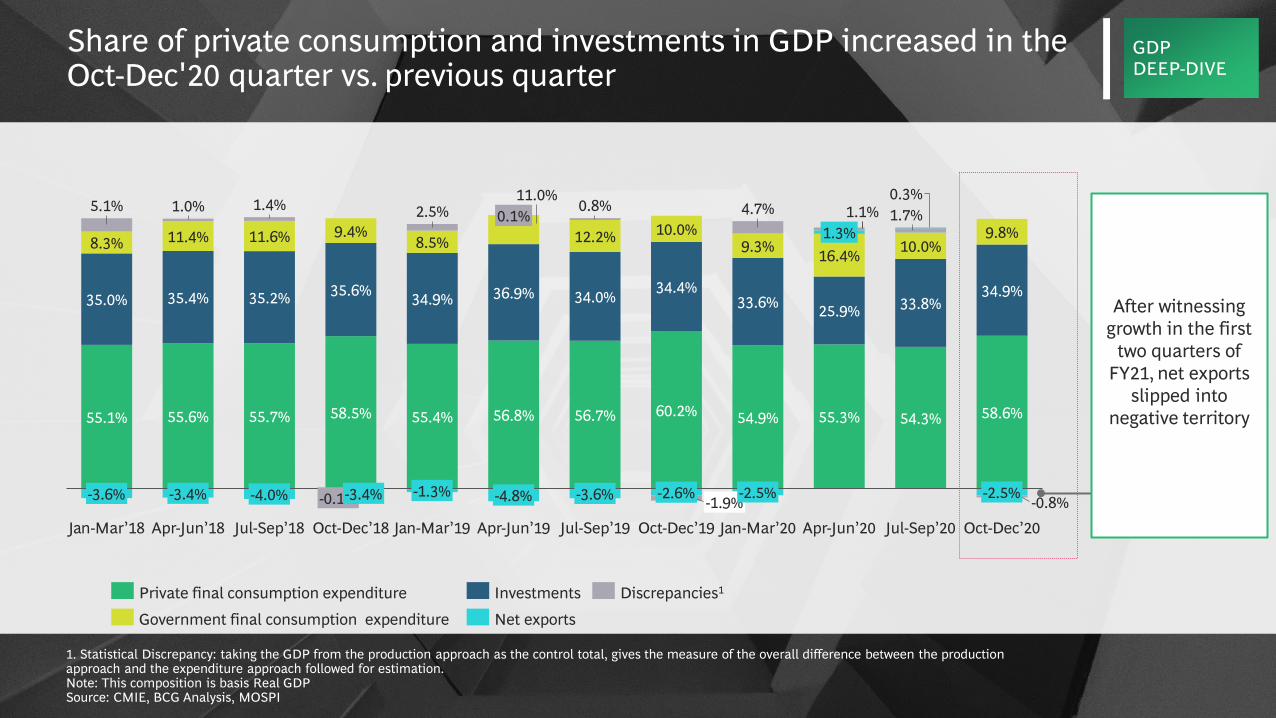
COVID-19 Share of private consumption and investments in GDP increased in the Oct-Dec'20 quarter vs. previous quarter
55.1% 55.6% 55.7% 58.5% 55.4% 56.8% 56.7% 60.2% 54.9% 55.3% 54.3% 58.6%
35.0% 35.4% 35.2% 35.6% 34.9% 36.9% 34.0% 34.4%33.6% 25.9% 33.8%
34.9%
8.3% 11.4% 11.6% 9.4%8.5%
11.0%
12.2% 10.0%9.3% 16.4% 10.0%
9.8%
5.1% 1.0% 1.4% 2.5% 0.8% 4.7% 1.7%1.1%0.3%
-0.8%Apr-Jun’18
-3.4%
0.1%
Oct-Dec’18Jul-Sep’18
-0.1% -2.5%-1.3%-4.0% -3.4%
Jan-Mar’19Jan-Mar’18 Oct-Dec’20Jan-Mar’20
-4.8% -3.6%
Jul-Sep’19
-2.6% -1.9%Oct-Dec’19
-2.5%
Apr-Jun’19
1.3%
Apr-Jun’20
-3.6%
Jul-Sep’20
1. Statistical Discrepancy: taking the GDP from the production approach as the control total, gives the measure of the overall difference between the production approach and the expenditure approach followed for estimation.Note: This composition is basis Real GDPSource: CMIE, BCG Analysis, MOSPI
Government final consumption expenditure
Private final consumption expenditure Investments
Net exports
Discrepancies1
After witnessing growth in the first
two quarters of FY21, net exports
slipped into negative territory
GDPDEEP-DIVE
33 Copy
righ
t © 2
020
by B
osto
n Co
nsul
ting
Gro
up. A
ll ri
ghts
rese
rved
.
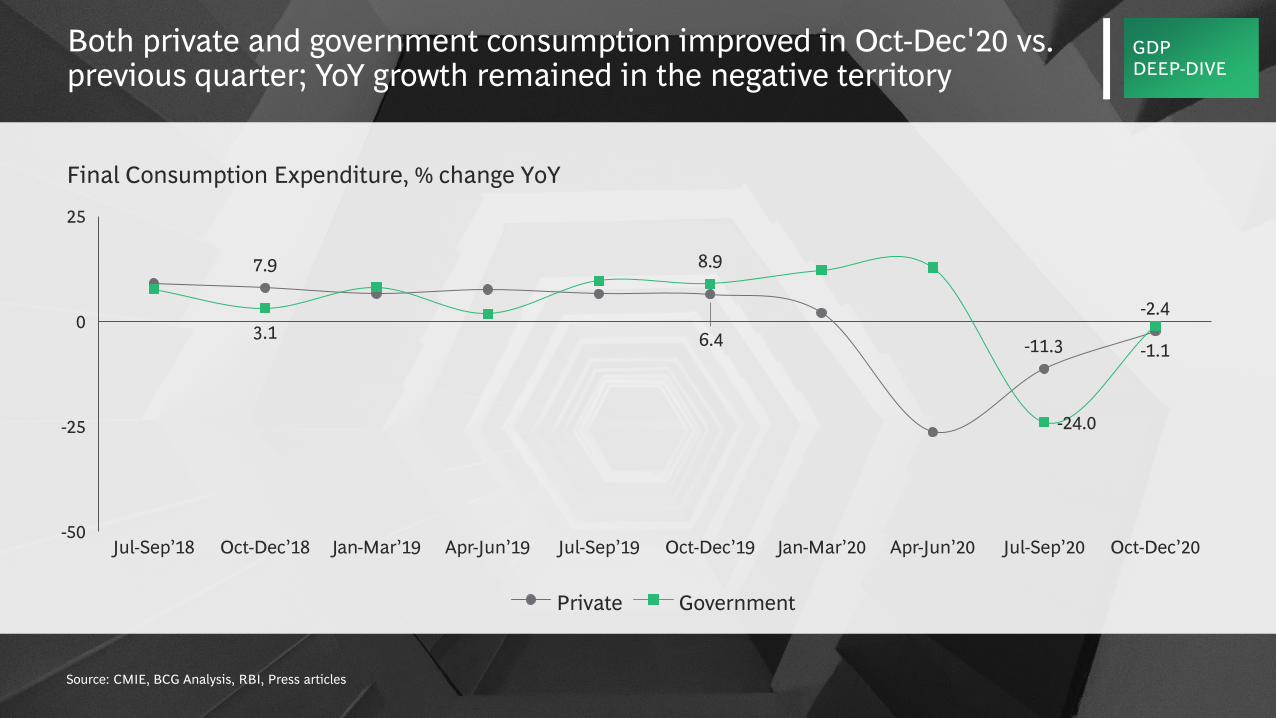
COVID-19 Both private and government consumption improved in Oct-Dec'20 vs. previous quarter; YoY growth remained in the negative territory
Source: CMIE, BCG Analysis, RBI, Press articles
7.9
6.4 -11.3
-2.43.1
8.9
-24.0
-1.1
-50
25
-25
0
Final Consumption Expenditure, % change YoY
Jul-Sep’18 Jan-Mar’19 Jul-Sep’20Oct-Dec’18 Apr-Jun’19 Jul-Sep’19 Oct-Dec’19 Jan-Mar’20 Apr-Jun’20 Oct-Dec’20
Private Government
GDPDEEP-DIVE
34 Copy
righ
t © 2
020
by B
osto
n Co
nsul
ting
Gro
up. A
ll ri
ghts
rese
rved
.
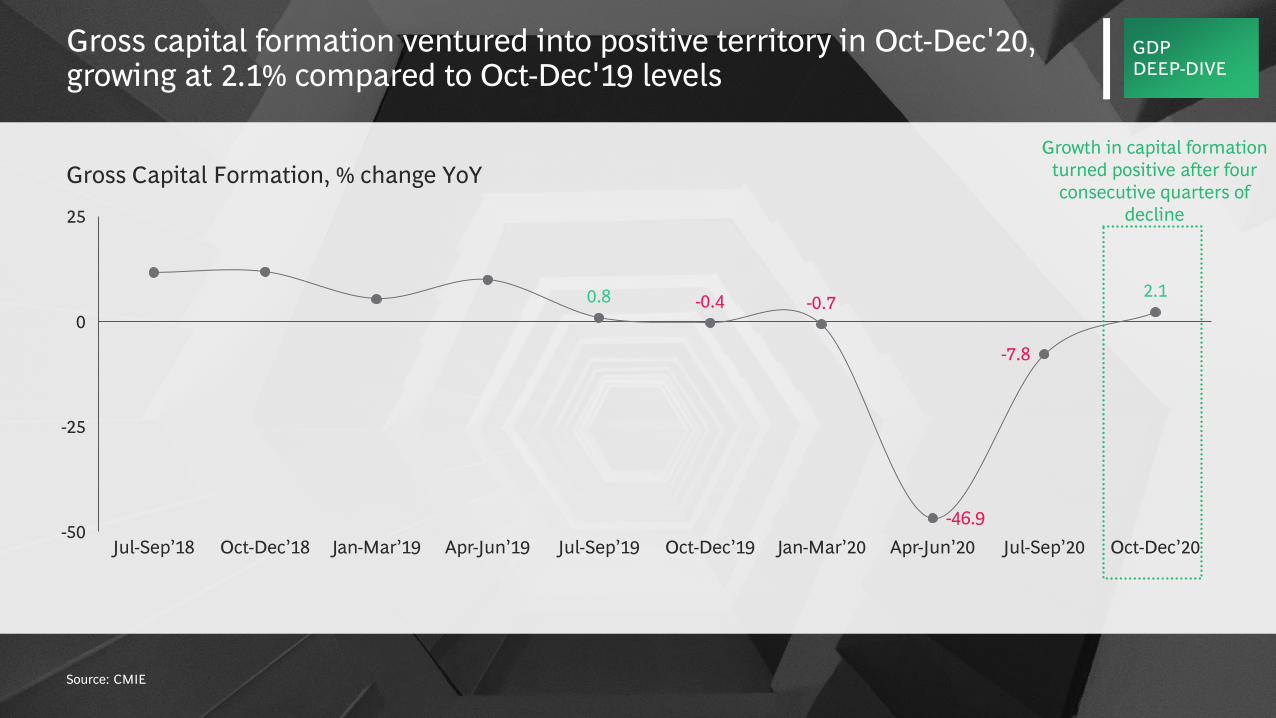
COVID-19 Gross capital formation ventured into positive territory in Oct-Dec'20, growing at 2.1% compared to Oct-Dec'19 levels
Source: CMIE
0.8 -0.4 -0.7
-46.9
-7.8
2.1
-50
-25
0
25
Gross Capital Formation, % change YoY
Jan-Mar’19Oct-Dec’18Jul-Sep’18 Apr-Jun’19 Jul-Sep’19 Oct-Dec’19 Jan-Mar’20 Apr-Jun’20 Jul-Sep’20 Oct-Dec’20
Growth in capital formation turned positive after four consecutive quarters of
decline
GDPDEEP-DIVE
35 Copy
righ
t © 2
020
by B
osto
n Co
nsul
ting
Gro
up. A
ll ri
ghts
rese
rved
.
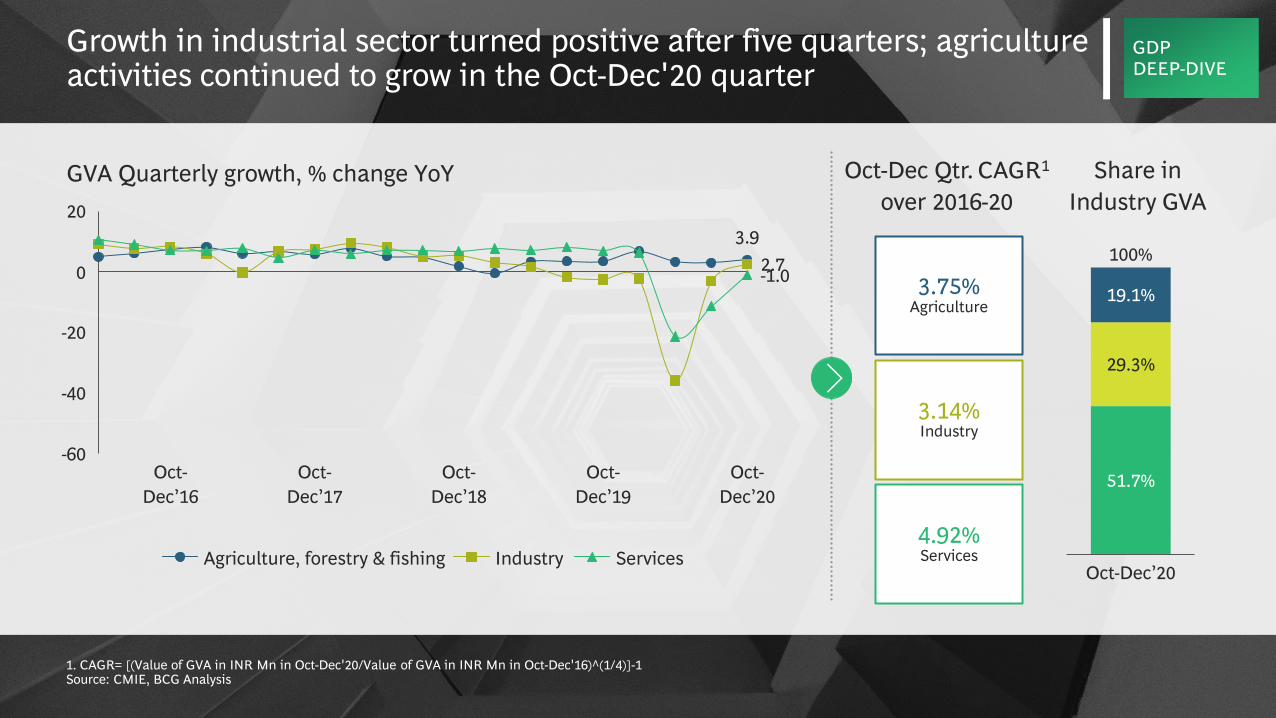
COVID-19 Growth in industrial sector turned positive after five quarters; agriculture activities continued to grow in the Oct-Dec'20 quarter
51.7%
29.3%
19.1%
Oct-Dec’20
100%
Share inIndustry GVA
3.75%Agriculture
3.14%Industry
4.92%Services
Oct-Dec Qtr. CAGR1
over 2016-20
GDPDEEP-DIVE
3.92.7-1.0
20
-60
-40
-20
0
Oct-Dec’17
Oct-Dec’16
GVA Quarterly growth, % change YoY
Oct-Dec’18
Oct-Dec’19
Oct-Dec’20
ServicesAgriculture, forestry & fishing Industry
1. CAGR= [(Value of GVA in INR Mn in Oct-Dec'20/Value of GVA in INR Mn in Oct-Dec'16)^(1/4)]-1 Source: CMIE, BCG Analysis
36 Copy
righ
t © 2
020
by B
osto
n Co
nsul
ting
Gro
up. A
ll ri
ghts
rese
rved
.
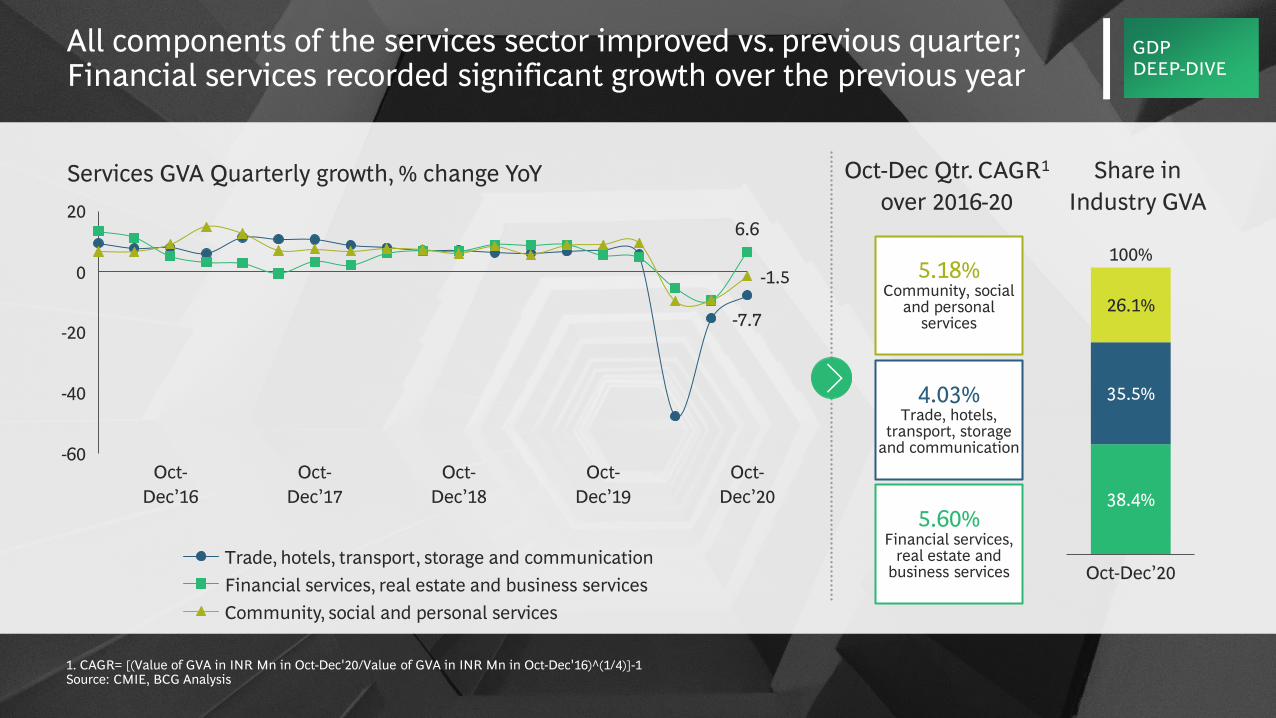
COVID-19 All components of the services sector improved vs. previous quarter; Financial services recorded significant growth over the previous year
-7.7
6.6
-1.5
-40
-20
-60
0
20
Oct-Dec’16
Oct-Dec’17
Services GVA Quarterly growth, % change YoY
Oct-Dec’18
Oct-Dec’20
Oct-Dec’19
Community, social and personal services
Trade, hotels, transport, storage and communicationFinancial services, real estate and business services
38.4%
35.5%
26.1%
Oct-Dec’20
100%
Share inIndustry GVA
5.18%Community, social
and personal services
4.03%Trade, hotels,
transport, storage and communication
5.60%Financial services,
real estate andbusiness services
Oct-Dec Qtr. CAGR1
over 2016-20
GDPDEEP-DIVE
1. CAGR= [(Value of GVA in INR Mn in Oct-Dec'20/Value of GVA in INR Mn in Oct-Dec'16)^(1/4)]-1 Source: CMIE, BCG Analysis
37 Copy
righ
t © 2
020
by B
osto
n Co
nsul
ting
Gro
up. A
ll ri
ghts
rese
rved
.
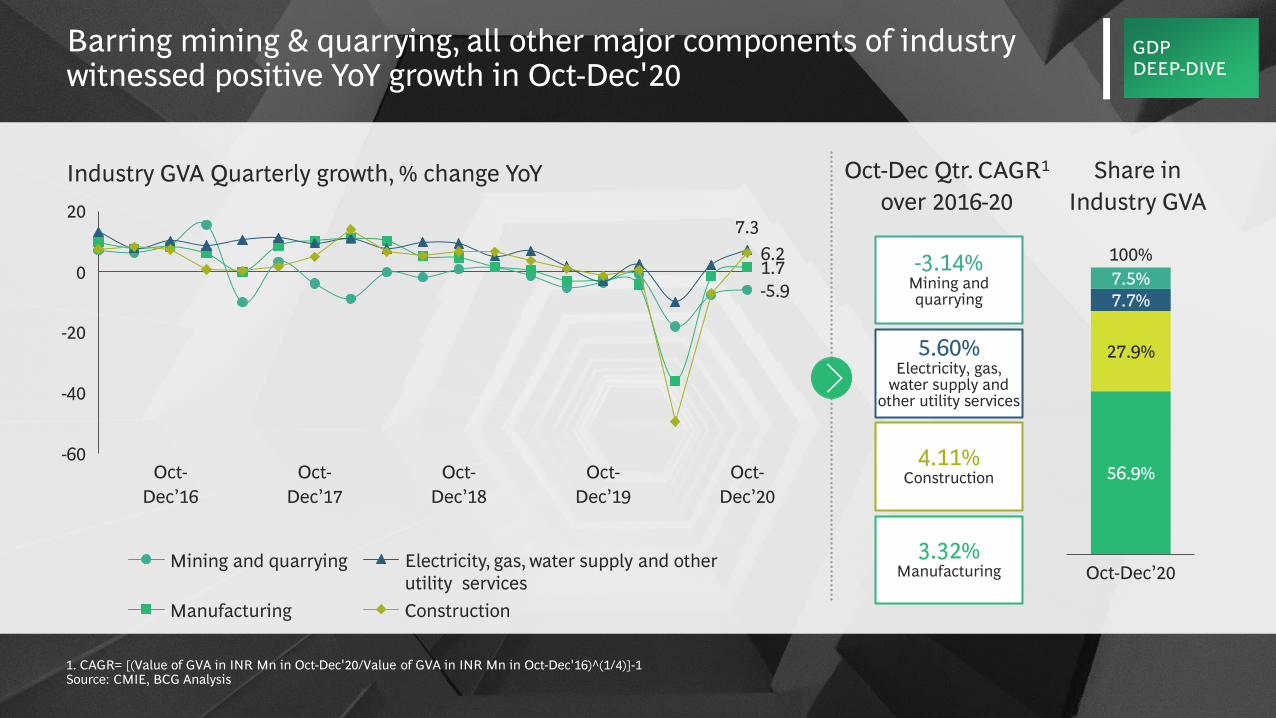
COVID-19 Barring mining & quarrying, all other major components of industry witnessed positive YoY growth in Oct-Dec'20
-5.91.7
7.36.2
-60
-40
0
-20
20
Oct-Dec’17
Oct-Dec’16
Industry GVA Quarterly growth, % change YoY
Oct-Dec’18
Oct-Dec’19
Oct-Dec’20
Mining and quarrying Electricity, gas, water supply and otherutility services
Manufacturing Construction
56.9%
27.9%
7.7%7.5%
Oct-Dec’20
100%
Share inIndustry GVA
-3.14%Mining and quarrying
5.60%Electricity, gas,
water supply and other utility services
3.32%Manufacturing
Oct-Dec Qtr. CAGR1
over 2016-20
GDPDEEP-DIVE
4.11%Construction
1. CAGR= [(Value of GVA in INR Mn in Oct-Dec'20/Value of GVA in INR Mn in Oct-Dec'16)^(1/4)]-1 Source: CMIE, BCG Analysis
38 Copy
righ
t © 2
020
by B
osto
n Co
nsul
ting
Gro
up. A
ll ri
ghts
rese
rved
.
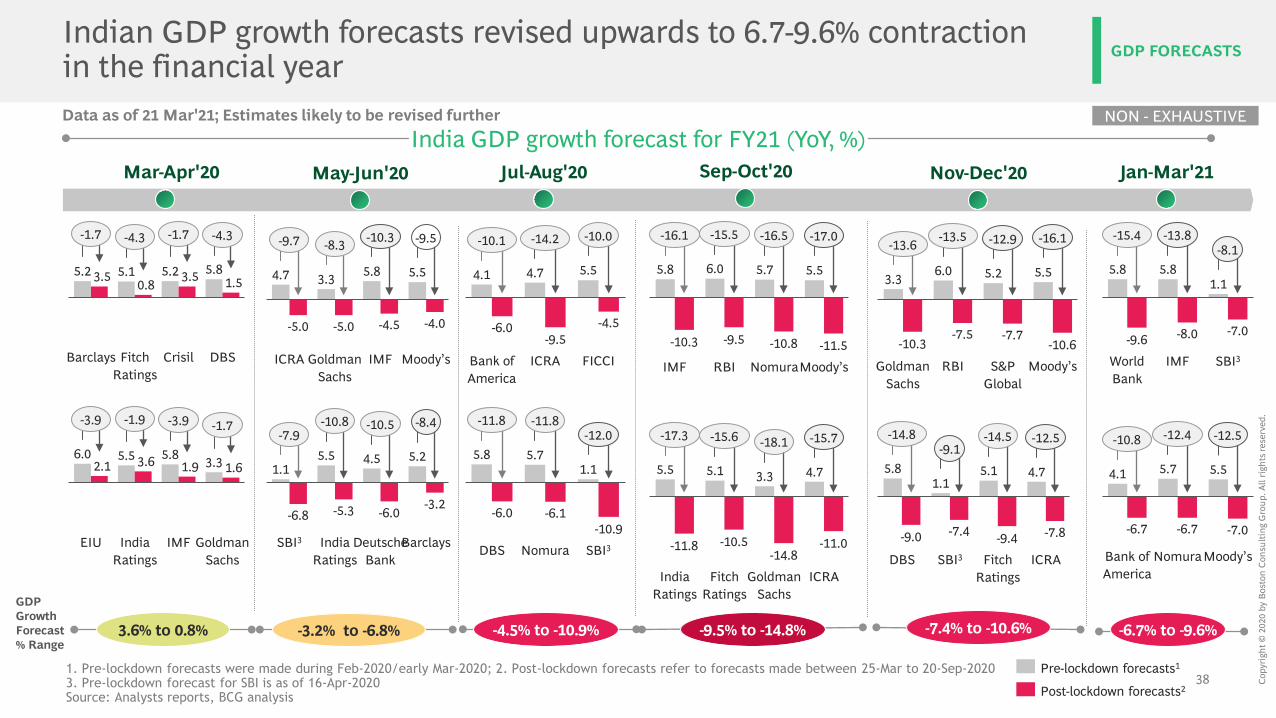
Indian GDP growth forecasts revised upwards to 6.7-9.6% contractionin the financial year
5.2 5.1 5.2 5.83.5 0.8 3.5 1.5
Barclays Fitch Ratings
Crisil DBS
-1.7 -4.3 -1.7 -4.3
6.0 5.5 5.8 3.32.1 3.6 1.9 1.6
IMFEIU India Ratings
Goldman Sachs
-3.9 -1.9 -3.9 -1.7
May-Jun'20 Sep-Oct'20
1. Pre-lockdown forecasts were made during Feb-2020/early Mar-2020; 2. Post-lockdown forecasts refer to forecasts made between 25-Mar to 20-Sep-20203. Pre-lockdown forecast for SBI is as of 16-Apr-2020Source: Analysts reports, BCG analysis
India GDP growth forecast for FY21 (YoY, %)Mar-Apr'20
4.7 3.3 5.8 5.5
-5.0 -5.0 -4.5 -4.0
ICRA Goldman Sachs
IMF Moody’s
-9.7 -8.3 -10.3 -9.5
1.15.5 4.5 5.2
-6.8 -5.3 -6.0-3.2
SBI3 India Ratings
BarclaysDeutsche Bank
-7.9-10.8 -10.5 -8.4
Pre-lockdown forecasts1
Post-lockdown forecasts2
3.6% to 0.8% -3.2% to -6.8%
Jul-Aug'20
-4.5% to -10.9%
Data as of 21 Mar'21; Estimates likely to be revised further
4.1 4.7 5.5
-6.0-9.5
-4.5
Bank of America
FICCIICRA
-10.1 -14.2 -10.0
5.8 5.71.1
-6.0 -6.1-10.9
DBS Nomura SBI3
-11.8 -11.8-12.0
NON - EXHAUSTIVE
5.8 6.0 5.7 5.5
-10.3 -9.5 -10.8 -11.5IMF NomuraRBI Moody’s
-16.1 -15.5 -16.5 -17.0
-9.5% to -14.8%
GDP FORECASTS
5.5 5.1 3.3 4.7
-11.8 -10.5-14.8
-11.0
India Ratings
Fitch Ratings
Goldman Sachs
ICRA
-17.3 -15.6 -18.1 -15.7
GDP Growth Forecast % Range
3.3 6.0 5.2 5.5
-10.3-7.5 -7.7
-10.6S&P
GlobalGoldman
SachsRBI Moody’s
-13.6 -13.5 -12.9 -16.1
5.81.1
5.1 4.7
-9.0 -7.4 -9.4 -7.8
DBS SBI3 Fitch Ratings
ICRA
-14.8-9.1
-14.5 -12.5
-7.4% to -10.6%
Nov-Dec'20 Jan-Mar'21
4.1 5.7 5.5
-6.7 -6.7 -7.0
Bank of America
NomuraMoody’s
-10.8 -12.4 -12.5
5.8 5.81.1
-9.6 -8.0 -7.0
World Bank
IMF SBI3
-15.4 -13.8-8.1
-6.7% to -9.6%
39 Copy
righ
t © 2
020
by B
osto
n Co
nsul
ting
Gro
up. A
ll ri
ghts
rese
rved
.
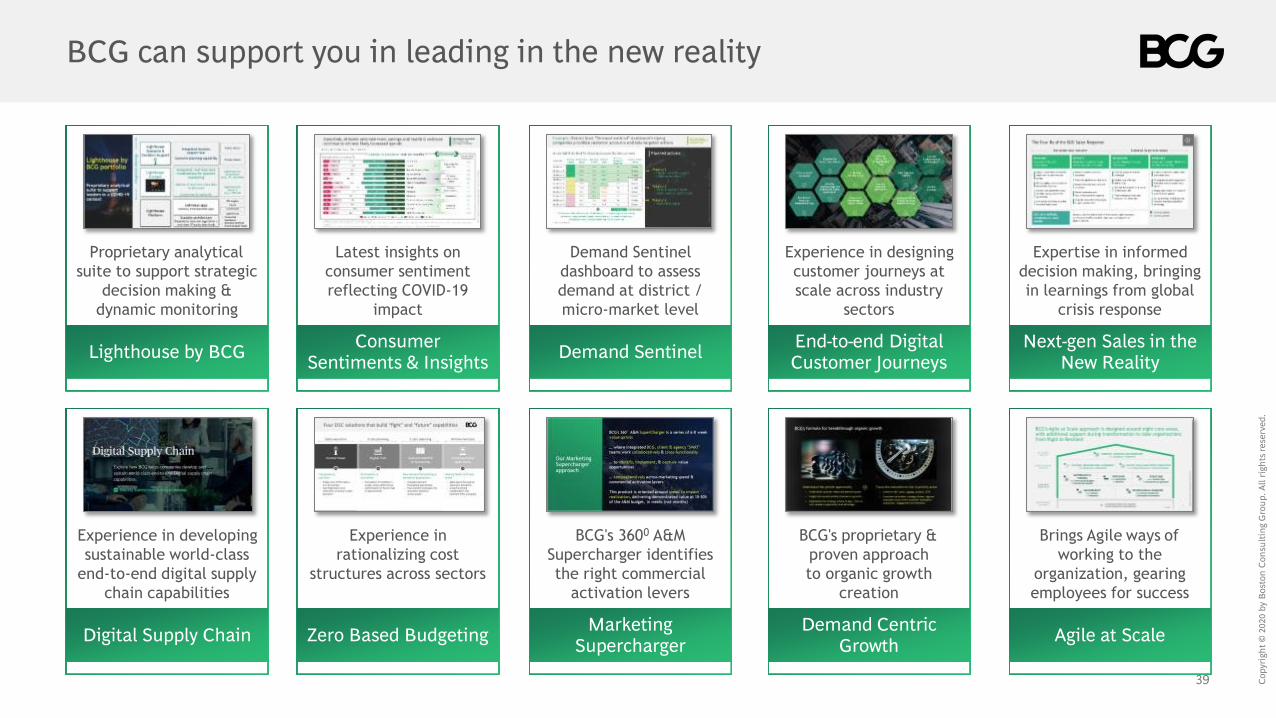
Proprietary analytical suite to support strategic
decision making & dynamic monitoring
Latest insights on consumer sentiment reflecting COVID-19
impact
Expertise in informed decision making, bringing in learnings from global
crisis response
BCG can support you in leading in the new reality
Demand Sentinel dashboard to assess demand at district / micro-market level
Experience in designing customer journeys at scale across industry
sectors
Lighthouse by BCG Consumer Sentiments & Insights Demand Sentinel End-to-end Digital
Customer JourneysNext-gen Sales in the
New Reality
Experience in developing sustainable world-class
end-to-end digital supply chain capabilities
Experience in rationalizing cost
structures across sectors
Brings Agile ways of working to the
organization, gearing employees for success
BCG's 3600 A&MSupercharger identifies the right commercial
activation levers
BCG's proprietary & proven approach to organic growth
creation
Digital Supply Chain Zero Based Budgeting Marketing Supercharger
Demand Centric Growth Agile at Scale

THANK YOU
Top Related