


Languages
Pages
Legal


IMPROVING RESERCH OF MECHANICAL PROPERTIES ON Ti ALLOY AND Ti-BASED MMCs
By
Sunyoung SON
A thesis submitted in partial fulfillment of the requirements for the degree of
Doctor of Engineering
Saga University
March 2002

ACKNOWLEDGMENTS
I wish to express my thanks to Professor Shin-ich Nishida, Associate
Professor Nobusuke Hattori department of mechanical engineering
Saga university and Saga prefecture for their support in scientific advice
and help, assistance, supplies, finances that have helped in making this
manuscript a success.
I would like to add thanks the committee member who helped me make
this a better manuscript. They are; Professor Nobuyoshi Ohno and
Associate Professor Tomio Satoh.
In additions, thanks to members in advanced materials laboratory for
their help and friendship, especially Dr. Kazuhisa Hayashi.
My personal thanks to my parents and family members and friends
that have helped inputting this manuscript with continuous
encouragement, kindness love and for the uplifting spiritual help I
received in the spiritual supports.

CONTENTS
CHAPTER 1 INTRODUCTION 1 1.1 BASIC PROBLEMS AND CONCEPT OF
FRACTURE 1
1.1.1 Why structures fail 1 1.1.2 A cracks in a structure 2 1.1.3 Fracture mechanics approach to design 5
The energy criterion 6 The stress intensity approach 6 Time-dependent crack growth and damage tolerance 7
1.2 DEFINITION OF FAILURE 8 1.2.1 Fatigue and fatigue failure 9
Fatigue limit 10 Fatigue process 10
1.2.2 Safe-life and fail-safe design 12 Safe-life design 13 Fail-safe design 13
1.3 HISTORICAL BACKGROUND OF FRACTURE AND FATIGUE RESEARCH 13
1.3.1 Fatigue of metallic materials 14 1.3.2 Historical perspective 15
1.4 PURPOSE OF THE PRESENT STUDY 17 Overview of titanium and its alloy 18 Common Applications 18
BIBLIOGRAPHY 20 CHAPTER 2 ROLLER-WORKING TREATMENT
ON Ti-6Al-4V ALLOY 24
2.1 INTRODUCTION 24 2.2. EXPERIMENTAL PROCEDURE 26 2.3 RESULTS AND DISCUSSION 32
2.3.1 Fatigue strength and Hardness values 32 2.3.2 Residual stress due to the plastic deformations 38
2.3.3 SEM Observations 42 2.4 CONCLUSIONS 45

REFERANCES 46 CHAPTER 3 EVALUTION OF SURFACE
TREATMENTS ON Ti-6Al-4V ALLOY 48
3.1 INTRODUCTION 48 Over view of surface treatment engineering 50
3. 2. EXPERIMENTAL PROCEDURE 54 3.3 RESULTS AND DISCUSSIONS 58
3.3.1 Result of hardness test 58 3.3.2 Estimation of fatigue limit 62
Influence of surface modifications 62 3.3.3. SEM observations of longitudinal section layer
and fracture surface 66
3.4 CONCLUSIONS 76 REFERANCES 78
CHAPTER 4 MECHANICAL PROPERTIES OF
TUNGSTEN SHORT FIBER REINFORCED Ti-6Al-4V ALLOY BY HIP FABRICATIONS
81
4.1 INTRODUCTION 81 4.1.1 Overview of MMC 83 4.1.2 Titanium Metal Matrix Composites 84 4.1.3 Applications of Ti based MMCs 84
4.2 EXPERIMENTAL PROCEDURE 85 4.2.1 Materials and specimen 85 4.2.2 Test procedure 92
4.3. RESULTS AND DISCUSSIONS 93 4.3.1 Estimation of static properties 93
Observation of microstructure 93 Result of hardness test 95 Effect of fiber orientation 96 Result of tensile strength 97
4.3.2. Estimation of fatigue limit 104 Effect of fiber content rations and surface treating in HIPa-RS MMCs
104
Deterioration of fatigue strength in MMCs 104 Property of crack propagation by replica method 107

4.4 CONCLUSIONS 112 REFERENCES 114
CHAPTER 5 SUMMARY AND FURTHER STUDY 117
5.1 SUMMARY 117 5.2 Further study 121

1
CHAPTER 1 INTRODUCTION This introductory chapter provided an overview of fracture
mechanics.
1. 1 BASIC PROBLEMS AND CONCEPT OF FRACTURE
Fracture is a problem that society has faced for as long as there have
been man-made structures. The problem may actually be worse today
than in previous centuries, because more can go wrong in our complex
technological society. Advances in the field of fracture mechanics have
helped to offset some of dangers posed by increasing technological
complexity. Through the ages, the application of materials in skill of
metal-working and applications of metals in structure increased
progressively. Then it was experienced of metals in built of these
materials didn't always satisfy, and unexpected failures often occurred.
Much remains to be learned, however, and existing knowledge of
fracture mechanics is not always applied when appropriate. When
judging with present day knowledge, these production methods must
have been liable to build important technical deficiencies into the
structure [1,2].
1.1.1 Why structures fail
The cause of most structure failures generally fails into of the
following categories:
(1) Negligence during design, construction or operation of the

2
structure.
(2) Application of a new design or material, which produced an
unexpected (undesirable) result.
In the first instance, existing procedure are sufficient to avoid failure,
but are not followed by one or more of the parties involved, due to
human error, ignorance, or willful misconduct. Poor workmanship,
inappropriate or substandard materials, error in stress analysis, and
operator error are examples of the appropriate technology and
experiences are available, but not applied.
The second type of failure is much more difficult to prevent. When
an “improved” design is introduced, there are invariably factors that the
designer does not anticipate. New materials can offer tremendous
advantages. Consequently, a new design or material should be placed
into service only after extensive testing and analysis. Such an approach
will reduce the frequency of failures, but not eliminate them entirely;
there may be important factors that are overlooked during testing and
analysis.
1. 1. 2 A cracks in a structure
Consider a structure in which a crack develops. Due to the
application of repeated loads or due to a combination of loads and
environmental attack this crack will grow with time. The longer the
crack, the higher the stress concentration induced by it. This implies
that the rate of crack propagation will increase with time. The crack

3
propagation as a function of time can be represented by a rising curve
as in Fig.1.1(a). Due to the presence of the crack the strength of the
structure is decreased: it is lower than the original strength it was
designed for. The residual strength of the structure decreases
progressively with increasing crack size, as is shown diagrammatically in
Fig.1.1(b).
An understanding of fracture process can be also provide the
material parameters of important to crack resistance; these have to be
know if materials with better crack resistance are to be developed.
In order to make a successful use of fracture mechanics in
engineering application it is essential to have some knowledge of the
total field of figure Fig 1.2 [3].
Crack size
CyclesTime
Fig.1.1 Illustration of engineering problem
Crack size Time
Residual
Design strength
Expectedhighest
Normal service
(a) Crack growth curve, (b) Residual strength curve

Engineering
Fracture Fracture processes and criteria Plasticity Testing Applications
10-10 10-9 10-8 10-7 10-6 10-5 10-4 10-3 10-2 10-1 100 101 102
Materials science
Applied mechanics
Fracture mechanics
Fig.1.2 Broad field of fracture mechanics Several disciplines are involved in the development of fracture mechanics design procedure. At
the right end of the scale is the engineering load–and-stress analysis. Applied mechanics provide the crack tip stress field as well as the elastic and (to a certain extent ) plastic deformation of the material in the vicinity the crack. The prediction made about fracture strength can be checked experimentally.
4

5
1. 1. 3 Fracture mechanics approach to design
The anticipated design stress is compared to the flow properties of
candidate materials; a material is assumed to be adequate if its strength
is greater than the expected applied stress. Such an approach may
attempt to guard against brittle fracture by imposing a safety factor on
stress, combined with minimum tensile elongation requirements on the
material [4]. Fig 1.3 introduces the facture mechanics approach.
There are two alternative approaches to fracture analysis: the energy
criterion and the stress intensity approach. These two approaches are
equivalent in certain circumstance. Both are discussed briefly follow.
APPLIED STRESS
FLAW SIZE
FRACTURE TOUGHNESS
Fig.1.3 Approach to design by fracture mechanics
Comparison of the fracture mechanics approach to design with the traditional strength of materials approach

6
The energy criterion
The energy approach states that fracture occurs when the energy
available for crack growth is sufficient to overcome the resistance of the
material. The material resistance may include the surface energy, plastic
work, or other type of energy dissipation associated with a propagating
crack.
Griffith and Irwin [5,6] were to propose the energy criterion for
fracture.
Note that for constant Gc value, failure stress σf. The energy release
rate, G is the driving force for fracture, while Gc is the material’s
resistance to fracture.
The stress intensity approach
Note that each stress component is proportional to single constant,
KI. If this constant is known, the entire stress distribution at the crack
tip can be computed. This constant, stress intensity factor (KIc),
completely characterizes the crack tip conditions in a linear elastic
material [7].
Failure occurs when KI =KIc. In this case, KI is the driving force for
fracture and KIc is a measure of material resistance.
√ πa σ KI =
E πσ2fac Gc = (1.1)
(1.2)

7
Time-dependent crack growth and damage tolerance
The rate of cracking can be correlated with fracture mechanics
parameters such as the stress intensity factor, and the critical crack size
for failure can be computed if the fracture toughness is known [8,9].
Where, da/dn is the crack growth per cycle, ∆K is the stress intensity
range, and C and m are material contents. Fig.1.4 illustrates the damage
tolerance approach to design.
= C(ΔK)m da dn
Effective service life
Time
Failure
Fig.1.4 Damage tolerance approach to design The initial crack size is inferred from nondestructive examination (NDE), and the critical crack size is computed from the applied stress and fracture toughness. The predicted service life of the structure can then be inferred by calculating the time require for the flaw to grow from its initial size to the allowable size.
Flaw
size
(1.3)

8
1. 2 DEFINITION OF FAILURE
Failures can be classified into the following four categories [10]:
1. Damage
2. Fracture
3. Break, and
4. Rupture
Failure
Failure of equipment can cause great losses
Fatigue More than 85 to 90% of failures are directly or indirectly caused by fatigue
Total loss
Direct loss
Indirect loss
Damage to products Repair cost Cost of preventive measure Compensation cost (Accident resulting in injury or death)
Morale decline Production decrease Damage to image
Safety

9
1.2.1 Fatigue and fatigue failure
Fatigue is defined as a applies to changes in properties which can
occur in a metallic materials due to the repeated application of stress or
strains, although usually this definition applies specially to those
changes which lead to cracking or failure. This description is also
generally valid for the fatigue of nonmetallic materials. With the
increasing emphasis on advanced materials, the scope of fatigue
research continues to broaden at a rapid pace.
Failures are classified by causes more than 80% of failures are caused
by fatigue and other causes are static fracture (Fig.1.5 for details), stress
corrosion cracks and so on [11, 12]. Fatigue is very important on failure
investigation.
Corrosion burst, etc. 3%
Simple fatigue 58%
Indirect fatigue 10%
Thermal fatigue, contact rolling fatigue, corrosion fatigue 11%
Static fracture 13%
SCC delayed fracture 5%
Low cycle fatigue 8%
Fig.1.5 Classification of failures in an industrial investigation on a wide variety of steel components and structures, Total 242cases (After Nishida [2], Rearrangement).

10
Fatigue limit
Fatigue limit or endurance limit are usually understood as stress limits,
at which the material can be cycled either for an infinite or sufficiently
high number of cycles without fracture. Thus the phenomenon of
fatigue limit is rather complicated and its purely stress-based definition
would not be sufficient (Fig.1.6 for illustrating).
Fatigue process (Fig.1.7 for illustrating)
(a) Fatigue hardening and/or softening, depending mainly on the
original state of the material and stress or strain amplitude. This stage is
characterized by the change of substructure within the whole volume
of the loaded metal.
Fatigue limit
Number of cycles to failure Nf
Time
Fig.1.6 Schematic drawing of S-N curve (Wohler’s curve) The stress amplitude at which fracture does not occur even after a very
high number of loading cycles (of the order of 107), has-since Wöhler’s time-been called the fatigue limit.
Stre
ss a
mpl
itude
σa
Stre
ss

11
(b) Micro-crack nucleation, taking place in a small part of the total
volume, namely the surface layer. A small denominator of all types of
nucleation is the stress concentration in the surface layer.
(c) Crack propagation ending in final failure. The controlling factor of
crack propagation is the highly concentrated cyclic plastic deformation
within the plastic zone at the crack tip.
Number of cycles to failure
Fatigue life curve
(c)Propagation
(b)Nucleation (a)Hardening and/or softening
Fig.1.7 Stage of fatigue process On the basis of the type of irreversible changes caused by the cyclic plastic deformation, it is possible to drive the whole fatigue process into three consecutive and partly overlapping stages
Stre
ss o
r stra
in a
mpl
itude

12
1.2.2 Safe-life and fail-safe design
The safe-life (in total-life) and fail-safe (damage-tolerances) design
concepts developed by aerospace engineers to prevent fatigue failure will
be described generally [1, 13]. The aircraft industry has leaded the effort
to understand and predict fatigue crack growth. They have developed the
safe-life or fail-safe design approach. In this method, a component is
designed in a way that if a crack forms, it will not grow to a critical size
between specified inspection intervals. Thus, by knowing the material
growth rate characteristics and with regular inspections, a cracked
component may be kept in service for an extended useful life. Fig.1.8
illustrates the extended service life of a cracked component.
Specified final crack size
Number of cycles to failure
Extended service life of cracked
component First detectable
crack size
Fig.1.8 Extended service life of a cracked component
The major share of the fatigue life of the component may be taken up in the propagation of crack. By applying fracture mechanics principles it is possible to predict the number of cycles spent in growing a crack to some specified length or to final failure
a (c
rack
size
)
13
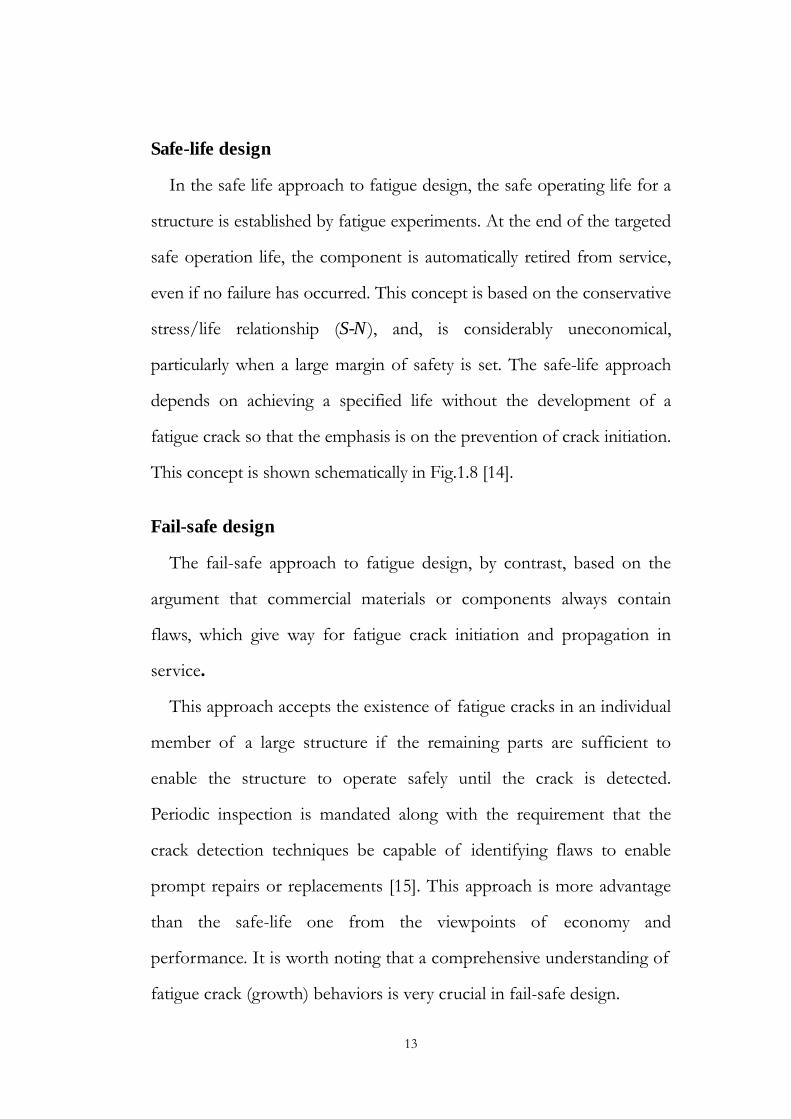
Safe-life design
In the safe life approach to fatigue design, the safe operating life for a
structure is established by fatigue experiments. At the end of the targeted
safe operation life, the component is automatically retired from service,
even if no failure has occurred. This concept is based on the conservative
stress/life relationship (S-N), and, is considerably uneconomical,
particularly when a large margin of safety is set. The safe-life approach
depends on achieving a specified life without the development of a
fatigue crack so that the emphasis is on the prevention of crack initiation.
This concept is shown schematically in Fig.1.8 [14].
Fail-safe design
The fail-safe approach to fatigue design, by contrast, based on the
argument that commercial materials or components always contain
flaws, which give way for fatigue crack initiation and propagation in
service.
This approach accepts the existence of fatigue cracks in an individual
member of a large structure if the remaining parts are sufficient to
enable the structure to operate safely until the crack is detected.
Periodic inspection is mandated along with the requirement that the
crack detection techniques be capable of identifying flaws to enable
prompt repairs or replacements [15]. This approach is more advantage
than the safe-life one from the viewpoints of economy and
performance. It is worth noting that a comprehensive understanding of
fatigue crack (growth) behaviors is very crucial in fail-safe design.

14
1.3 HISTORICAL BACKGROUND OF FRACTURE AND FATIGUE RESEARCH
1.3.1 Fatigue of metallic materials
Historically, the first occurrence of fatigue is connected with the
development of structure containing structure elements subjected to
cyclic external forces. The service failures around the middle of the last
century precipitated laboratory experiments aimed at determining
suitable mechanical properties for the safe design of cyclically loaded
elements. A. Wöhler performed the first systematic experiments in the
years 1852-1870. Up till today, one of the basic metal-fatigue properties
has been the Wöhler’s curves, also called the S/N curves, which
represents the dependence of the stress amplitude σa (for a given
value of mean stress) on the number of loading cycles to complete
fracture Nf. The stress amplitude at which fracture does not occur even
after a very high number of loading cycles (of the order of 107),
has-since Wöhler’s time-been called the fatigue limit [16]. The first half
of this century is characterized by an empirical research resulting in a
great deal of useful data on the influence of mean stress, notches,
environment, surface finish etc. on the S/N curve. All these data helped
very much in practical designing against fatigue [17].
The majority of fatigue research reported in the open literature
pertains to metallic materials. In recent year, however, there has been a
surge in interest aimed at nonmetallic materials and composite, which
offer the potential for mechanical thermal and environmental

15
performance hitherto, unobtainable in conventional materials.
1.3.2 Historical perspective
Griffith applied a stress analysis of an elliptical hole to the unstable
propagation of a crack. According to this theory, a flaw becomes
unstable, and thus fracture occurs, when the strain energy change that
results from an increment of crack growth is sufficient to overcome the
surface energy of the material (published in 1920 [18]).
After studying the early work of Griffith, and others, Irwin
concluded that the basic tools needed to analyze fracture were already
available. Irwin used the Westergaard approach to show that the stresses
and displacement near the crack tip could be described by single
constant that was related to the energy release rate. This crack tip
characterizing parameter knows as the stress intensity factor. During
this same period of time, Williams applied a somewhat different
technique to derive crack tip solution that were essentially identical
Irwin’s results.
In 1960s, Paris and his co-workers [19, 20] failed to find a receptive
audience for their ideas on applying fracture mechanics principles to
fatigue crack growth. Although Paris et. al provided convincing
experimental and theoretical arguments for their approach, it seems that
design engineers were not yet ready to abandon their S-N curves in
favor of a more rigorous approach to fatigue design.
Linear elastic fracture mechanics (LEFM) ceases to be valid when

16
significant plastic deformation precedes failure. During a relatively short
time period (1960-61) several researches developed analysis to correct
for yielding at the crack tip, including Irwin [21], Dugdale [22],
Barenblatt [23], and Well [24].
In 1968, Rice [25] developed another parameter to characterize
nonlinear material behavior ahead of a crack. By idealizing plastic
deformation as nonlinear elastic, Rice was able to generalize the energy
release rate to nonlinear materials. He showed that this nonlinear energy
release rate could be expressed as a line integral, which he called the j
integral, evaluated along an arbitrary contour around the crack.
After that, Shin [26] demonstrated a relationship between the j integral
and CTOD, implying the both parameters are equally valid for
characterizing fracture. Much of the theoretical foundation of dynamic
fracture mechanics was developed in the period between 1960 and
1980.

17
1.4 PURPOSE OF THE PRESENT STUDY
Ti-6Al-4V alloy is a comparatively new engineering material and it is
currently being considered for structural applications due to its superior
mechanical properties. In modern engineering design, fracture occupies
a special place among the multitude of problems dealing with strength.
Mechanical failure has caused many injuries and financial loss. Safety
considerations and design reliability have stimulated an increased
interest in understanding and predicting failure mechanisms. They are
becoming ever more important the ever-increasing complexity of
engineering structural elements.
Therefore, Ti-6Al-4V alloy have been increasingly employed in
industry where specialized properties of materials with extremely high
fatigue limits, high specific tensile strength, high-anti-corrosive
properties, stiffness and low coefficient of thermal expansion etc. are
demanded.
The aim of the present study is to improve the mechanical properties
into various arrangements on Ti-6Al-4V alloy. More manufacturing
engineers are learning that machining these alloys can be a tricky job
due to their unique stable and unstable mechanical properties.
This study attempts to collect the results and data relating to the
titanium metal matrix composite materials (chapter 2) and surface
treatment by roller-working (chapter 3), thin film caotings (chapter 4) in
order to provide fundamental information on the current understanding
of mechanical properties (importance on fatigue) of Ti-6Al-4V. Finally,

18
chapter 5 is the summary of results.
Overview of titanium and its alloy
Titanium was discovered in 1910 and got its name from "Titan", a
giant Greek mythology. Titanium is the world's fourth most abundant
structural metal. It is found in North America, South America, Europe,
Africa, Russia, China and Australia in the forms of rutile, ilmenite and
other ores. The most widely used means of winning the metal from the
ore is the Kroll process that uses magnesium as a reducing agent.
Titanium is absolutely immune to environmental attack, regardless of
pollutants. Where other architectural metals exhibit limited lifespan. It
withstands urban pollution, marine environments; the sulfur
compounds of industrial areas and is failure-proof in even more
aggressive environments. Because it is the most noble metal, the
coupling of titanium with dissimilar metals does not accelerate galvanic
corrosion of the titanium.
Common Applications
Chemical plants: Titanium is highly corrosion resistant. It is used in
many types of chemical equipment. About 30% of titanium used
domestically is for chemical plants.
Seawater usage: Titanium is greatly used in nuclear and fossil power
stations. It is used for the big heat exchanger, condenser, which cools

19
the steam form the turbine with seawater, which does not corrode so
the wall thickness of the tube is as thin as 0.5 mm. condenser tubes
consume about 20% of domestic titanium consumption.
Titanium in daily life: Recently, titanium is being used in many goods
we use such as in sports, building material, medical applications and
accessories. This amounts to about 30% of domestic consumption.
Architecture and Building Materials: The Naya Temple in Fukui is
famous in Matsuo Basho's 'Oku no Hosomichi. The roof of the Naya
Temple, the Fukuoka Dome, the Miyazaki-Ocean-Dome and the
International Conference building at Tokyo Big Site are some of the
buildings made from titanium [27].
Aerospace: In the USA, about 70% of titanium produced is used for
aerospace parts. In Japan 2-3% of the titanium is consumed for
aerospace usage.
In the majority of these and other engineering applications Titanium
has replaced heavier, less serviceable or less cost effective materials.
Designing with Titanium taking all factors into account has resulted in
reliable, economic, and more durable systems and components, which
in many situations have substantially exceeded performance and service
life expectations.

20
BIBLIOGRAPHY
[1] B.F. Brown, The application of fracture mechanics to scc, Metals
and materials, 2 (1968); Met. Reviews, 13 (1968), pp.171-183
[2] Meals handbook 8th edition, 10, Failure analysis and prevention,
ASM, (1975), p.1
[3] B. David, Elementary engineering fracture mechanics, Martinus
nijhoff Pub. (1986), pp.3-19
[4] T.L. Anderson, Fracture mechanics 2nd edition, Fundamentals and
applications, CRC press, (1995) pp.1-25
[5] G.R. Irwin, Fracture dynamics, fracturing of metals, ASM, (1948), pp.
147-166
[6] G.R. Irwin, Onset of fatigue crack propagation in high strength steel
and aluminum alloys, Sagamore research conf., Vol.2, (1956), pp.
289-305
[7] G.R. Irwin, Fracture handbuck der physik, Springer, (1958), p. 551
[8] P.C. Paris, M.P. Gonmez, W.P, Anderson, A rational analysis theory

21
of fatigue, The trend in engineering, (1961), 13, pp. 9-14
[9] P.C. Paris, F. Erdogan, A critical analysis of crack propagation low,
Journal of basic engineering, (1963), 85, pp. 528-534
[10] S. Nishida, Failure analysis in engineering applications, Thomson
litho ltd., (1991), pp.1-5
[11] S. Nishida, Maintenance, No. 30,33, (1982)
[12] S. Nishida, Maintenance, No. 31,40, (1982)
[13] KJ. Miller, A historical perspective of the important parameters of
metal fatigue; and problems for the next century, in proc. fatigue’99,
(1999), pp.15-39
[14] T.R. Gurney, Fatigue of welded structure, Cambridge university
press, (1968)
[15] S. Suresh, Fatigue of materials, Cambridge solid state science series,
(1996), pp.2-9
[16] A. Wӧhler, Abstracted in English, in engineering, (1871), Vol.11,
pp.199

22
[17] M.K. Lesnil, P.Lukáš, Fatigue of metallic materials, Elesvier
scientific pub., (1980), pp. 9-11
[18] A.A. Griffith, The phenomena of rupture and flow in solids,
Philosophical transactions (A), Vol. 221, (1921), pp.163-197
[19] P.C. Paris, M.P. Gomez, and W.P. Anderson, A rational analytic
theory of fatigue, The trend in engineering, Vol.12, (1961), pp.9-14
[20] P.C. Paris, and G.C. Sih, Stress analysis of cracks, ASTM STP, 381
(1965), pp.30-81
[21] G.R. Irwin, Plastic zone near a crack and fracture toughness,
Sagamore research con. Vol.4, (1961)
[22] D.S. Dugdal, Yielding in steel sheets containing slits, Journal of the
mechanics and physics of solids, Vol.8, pp.100-104
[23] G.I. Barenblatt, The mechanical theory of equilibrium cracks in
brittle fracture, Advances in applied mechanics, Vol.VII, Academic
press, (1962), pp.55-129
[24] A.A. Wells, Unstable crack propagation in metals: cleavage and fast

23
fracture, proc. of the crack propagation symposium, Vol.1, Paper84,
Cranfield, UK, (1961)
[25] J.R. Rice, A path independent integral and the approximate analysis
of strain concentration by notches and cracks, Journal of the applied
mechanics, Vol.35, (1968), pp.379-386
[26] C.F. Shin, Relationship between the J-integral and the crack
opening displacement for stationary and extending cracks, Journal of
the mechanics and physics of solids, Vol.29, (1981), pp.305-326
[27] H. Kusami et al., Titanium alloy and its applications, The nikkan
kogyo shinbun, ltd., pp.76-115

24
CHAPTER 2 ROLLER-WORKING TREATMENT ON Ti-6Al-4V ALLOY
Many years of experience in the field of surface modification and
versatile equipment enable us to solve complex R&D tasks in this area.
Different techniques of surface modification from wet chemical to
physical vapour deposition (PVD) of thin films in vacuum to
plasmochemical methods can be used and if necessary combined for
specific purposes, the main focus being on surface modification by
roller-working and coating through plasma chemistry and DLC changes
in surface properties.
This chapter introduces an investigation of fatigue properties in
Ti-6Al-4V alloy, as a result of processing by roller-working.
2.1 INTRODUCTION
Ti-6Al-4V alloy is a comparatively new engineering material and it is
currently being considered for structural applications due to it’s superior
mechanical properties [1-3]. For these reasons Ti and Ti alloys meet the
requirement of good biocompatibility. Ti-6Al-4V has been investigated
as mechanical properties under conditions of various surface
modifications.
In modern engineering design, fracture occupies a special place
among the multitude of problems dealing with strength. Mechanical
failure has caused many injuries and financial loss. Safety considerations
and design reliability have stimulated an increased interest in

25
understanding and predicting failure mechanisms. They are becoming
ever more important the ever-increasing complexity of engineering
structural elements. In many failure types, fatigue is the prevailing
failure mechanism. A researcher has reported that more than 90% of
failures are caused by “fatigue”and that more than 90% of fatigue
cracks had been initiated from “stress concentrated parts”[4-9].
Though it is very important to investigate the methods to improve the
fatigue strength of notched specimens, the reporting of the
improvement of fatigue strength for notched specimens is hardly
observed. There are many various methods that can be used to improve
the fatigue strength by surface treatment.
The authors have concluded that the plastic deformation by
roller-working is a very useful and practical method for improving the
fatigue strength of notched specimens. The plastic deformed layer
created by roller-working, and their surface should be expected to
improve surface structure. Therefore, they have performed this
procedure to evaluate the fatigue behavior of roller-worked metal
materials to improve their fatigue strength of structural steels (S25C).
The purpose of this study is to evaluate the fatigue strength of
notched specimens on Ti-6Al-4V alloy by roller-working.

26
2.2 EXPERIMENTAL PROCEDURE
Fig.2.1 shows the shape and the dimensions of the specimen with a
circumferential notch. Table 2.1 indicates the chemical compositions of
Ti-6Al-4V alloy.
The non-roller-worked specimens were polished with emery paper
(#400~3000), after that with diamond paste polish (#6~1), then they
were annealed at 600℃ for 0.5hr in a vacuum furnace to relieve stress
next they were polished with electro-polishing (0.5A/2min) to remove
the work-hardened layer. Finally to observe the specimens surface
during fatigue test they were etched in a solution of 10%HF +
20%HNO3.
In similar procedure, the roller-worked specimens were polished with
emery paper and diamond paste then etched but not annealed and
electro polished, because of prevented to loose the plastic deformation
effect.
Ono type of rotating and bending fatigue-testing machine (14.7N·m,
3000rpm) was used for the fatigue tests (Fig.2.2 for illustrating).
Fracture surfaces were observed by an optical microscope and a
Scanning Electron Microscope (SEM). A Vickers hardness tester was
used with a load of 0.49N.
Specimens are non-roller-worked and roller-worked ones. The plastic
deformation values (∆t) are employed 0.05, 0.1, 0.25 and 0.4 mm

27
respectively and specially used D (7) specimen for check up the fracture
pattern. They are compared with result of unrolled Ti-6Al-4V fatigue
test. Table 2.2 represents the specimens’ symbols, and dimensions of
notched part before and after roller-working. Where, Δt and t are
plastically deformed value and notch depth, respectively. Fig.2.3 shows
the roller-working machine and roller-working process. The residual
stress measured with x-ray diffraction method.
Fig.2.4 describes the experimental process in this chapter by flow
chart. .

28
Table 2.1 Chemical compositions mass% Al V Fe O C N H
6.14 3.93 0.17 0.19 0.011 0.014 0.009
20 20 20
60
φ8
φ6
R12
φ5
ρ
60°
0.5
C0.5
ρ=1mm
mm
Fig.2.1 Specimen geometry

29

30
Static roller
Specimen Movable roller
Table 2.2 Conditions of roller working and marks unit: mm specimens D ∆t tbe taf dbe daf Non rol. 6 - - - 5 5
R0.05 6 0.05 0.45 0.5 5.1 5 R0.1 7 0.1 0.9 1.0 5.2 5 R0.25 6 0.25 0.25 0.5 5.5 5 R0.4 6 0.4 0.1 0.5 5.8 5
D=dafter+2tafter taf=tbe+Δt be : before roller working, af : after roller working
Fig.2.3 Roller-working process (5ton, 4sec.)

31
Non-roller Specimen
Polishing (Emery paper #400~3000 / Diamond
paste #6~1)
Annealing (600℃/ 30min)
Electron Polishing (0.5A, 20V, 2min)
Fatigue test (Small type Ono rotating bending
fatigue machine)
Result
Observation of Fracture Surface with SEM
Roller worked Specimen
Etching (10%HF+20%HNO3 )
Vickers Hardness Test
Fig 2.4 Flowchart introducing the experimental process in the present study

32
2.3 RESULTS AND DISCUSSION
2.3.1 Fatigue strength and Hardness values
The microstructure of Ti-6Al-4V alloy is restructured by
roller-working. Fig.2.5 shows the microstructures at the notch bottom
surface layer after each roller-working. These figures show Parallel
laminatedαgranular structure in plastic deformation layer and the
depth of plastically deformed layer increased with increase of Δt
value.
On the other hand, the roller-worked specimens indicated
disagreement between Δt value and the actual plastic deformed layer
and that the plastic deformed depth was very thin comparing withΔt
value.
Fig.2.6 (a) and (b) illustrate the relationship between the hardness
number and the distance from surface. The hardness value of
roller-worked specimens was not higher value than that of
non-roller-worked specimens at the notch bottom and the overall
hardness values of the roller-worked and non-roller-worked specimens
were almost the same value at the near core of notch bottom and
non-deformed part.
Considering to a simple empirical relation between fatigue limit and
Vickers hardness number, the fatigue limit of the roller-worked
specimens was expected to improve according to the increase of

33
hardness number. However the fatigue limit of the roller-worked
specimens in present work was actually deteriorated.
Fig.2.7 shows the S-N curves of Ti-6Al-4V alloy and roller-worked
specimens with various plastic deformation values. The S-N curves
exhibit the results of fatigue roller-worked specimens and
non-roller-worked specimens.
The fatigue limits of the roller-worked specimens; R0.05, R0.1, R0.25
and R0.4 decreased 17%, 3%, 25% and 30% respectively than that of
the non-roller-worked specimen. Fig.2.8 shows the relation of
roller-working value with the fatigue strength. This figure shows the
plastic deformed layer depth increased with a decrease of the fatigue
limit.
Due to the effect of work-hardening, by roller-working the fatigue
limit of S25C material was improved by about 220% over than that of
conventional materials. In addition their hardness was also increased.
On the other hand, TI-6Al-4V alloy displays a low work-hardening ratio
(σB≑900MPa,σB0.2≑830MPa). This property may not contribute to the
improved hardness and residual stress.
Table 2.3 shows the relationship of experimented fatigue notch
factor Kfexp and calculated fatigue value Kfcal. The Kfcal value is calculated
from the relation between hardness number and fatigue strength [10].
The relationship between fatigue strength and fatigue notch factor is as
follows [11];

34
Kfexp=σw0/σw (2.1)
Kfcal =1+ξ1·ξ2·ξ3·ξ4·ξ5 (2.2)
where, σw0,σwandξi are fatigue strength of smooth specimen,
fatigue strength of notched specimen and parameter of notch factor ,
respectively. These results show agreement with the results of fatigue
test.

35
(c) Δt =0.25 (d) Δt =0.4
(a) Δt =0.05 (b) Δt =0.1
20µm 20µm
20µm 20µm
Plas
ticall
y de
form
ed la
yer
Fig.2.5 Observation of transverse section The depth of plastically deformed layer increased with increase of Δt value.
In addition, the roller-worked specimens indicated disagreement betweenΔt value and the depth of actual plastic deformed layer and that the plastic deformed depth was very thin comparing withΔt value.
Table. 2.3. Fatigue notch factor Kf and stress concentration factor Kt Specimens Kfexp Kfcal Kt Non. roller 1.20 1.19 1.54
R0.05 1.40 1.20 1.54 R0.1 1.27 1.23 1.54 R0.25 1.50 1.22 1.54 R0.4 1.56 1.21 1.54

36
270
290
310
330
350
370
390
410
0 0.5 1 1.5 2 2.5Distance from surface mm
Non rol.
R0.25
R0.05
R0.4
R0.1
(a) Notch bottom
270
290
310
330
350
370
390
410
0 0.5 1 1.5 2 2.5Distance from surface mm
Non rol
R0.25
R0.05
R0.4
R0.1
(b) Non-deformed part Fig.2.6 Distribution of Vickers Hardness number
Distance from specimen’s surface mm
Distance from specimen’s surface mm

37
150
200
250
300
350
400
0 0.1 0.2 0.3 0.4Plasticcally deformed value mm
Fig.2.8 Relation of roller working value with the fatigue strength *: diameter d=7mm, the others are φ6mm in diameter
105 106 107200
250
300
350
400
450
500
550
Stre
ss a
mpl
itude
σa
MPa
Number of cycles to failure Nf
non roller R 0.05 R 0.1R 0.25R 0.4
Fig.2.7 S-N curves of non-roller and various roller worked specimens
*
Fatig
ue st
reng
th
MPa
∆t mm
38
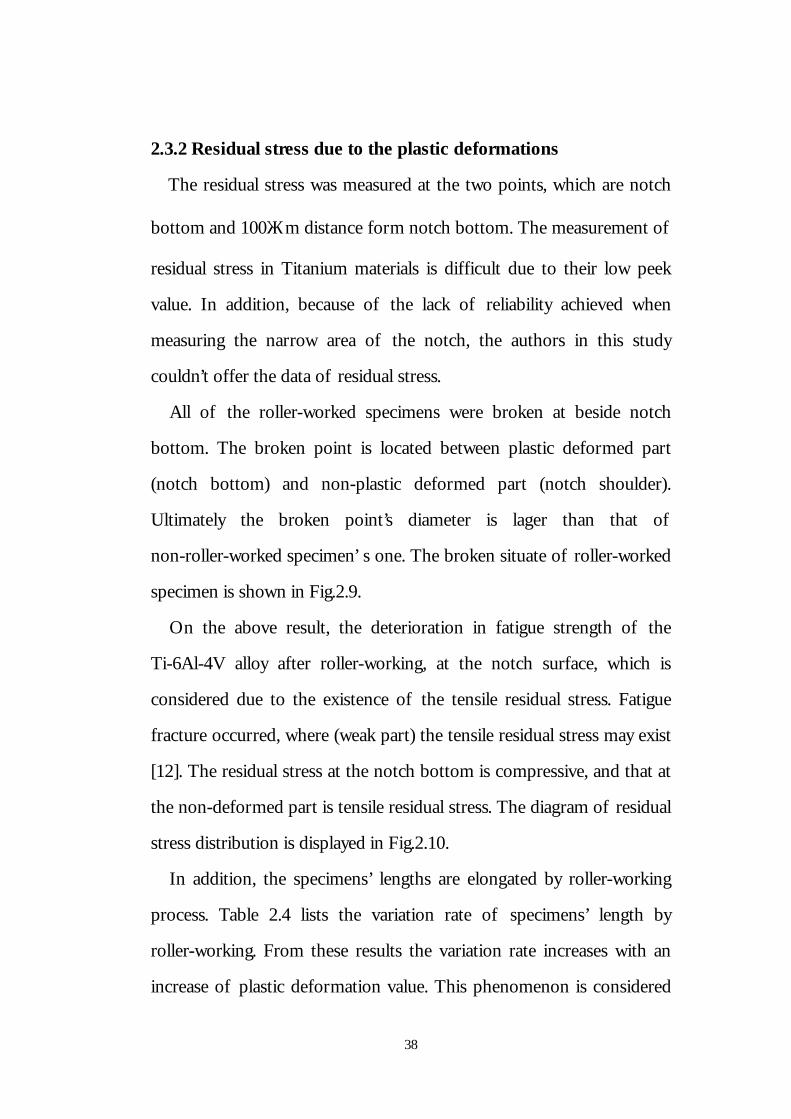
2.3.2 Residual stress due to the plastic deformations
The residual stress was measured at the two points, which are notch
bottom and 100μm distance form notch bottom. The measurement of
residual stress in Titanium materials is difficult due to their low peek
value. In addition, because of the lack of reliability achieved when
measuring the narrow area of the notch, the authors in this study
couldn’t offer the data of residual stress.
All of the roller-worked specimens were broken at beside notch
bottom. The broken point is located between plastic deformed part
(notch bottom) and non-plastic deformed part (notch shoulder).
Ultimately the broken point’s diameter is lager than that of
non-roller-worked specimen’ s one. The broken situate of roller-worked
specimen is shown in Fig.2.9.
On the above result, the deterioration in fatigue strength of the
Ti-6Al-4V alloy after roller-working, at the notch surface, which is
considered due to the existence of the tensile residual stress. Fatigue
fracture occurred, where (weak part) the tensile residual stress may exist
[12]. The residual stress at the notch bottom is compressive, and that at
the non-deformed part is tensile residual stress. The diagram of residual
stress distribution is displayed in Fig.2.10.
In addition, the specimens’ lengths are elongated by roller-working
process. Table 2.4 lists the variation rate of specimens’ length by
roller-working. From these results the variation rate increases with an
increase of plastic deformation value. This phenomenon is considered

39
the reason of compressive residual stress exists at the surface of notch.
On the other hand, roller-worked specimens indicated disagreement
betweenΔt value and the depth of plastic deformation layer and that
the plastic deformed depth was very thin comparing withΔt value. This
result should be considered that the tensile residual stress exists at near
of surface.

(b) Roller worked specimenΔt= 0.4
(a) Non-roller worked specimen
Broken area
Broken area Deformed part (notch bottom)Non-deformed part (shoulder)
Fig. 2.9 Broken pattern of roller worked specimenThe roller-worked specimens were broken at beside notch bottom. The broken point is located between plastic deformed part (notch bottom) and non-plastic deformed part (notch shoulder).
40

41
Notch bottom
Compressive (-)
Boundary between plastic deformed part and non-deformed part
Tensile (+)
Fig. 2.10 Residual stress distribution The residual stress at the notch bottom is compressive, and that at the non-deformed part is tensile residual stress.
Table. 2.4. Length variation rate by roller-working Specimens Non. roll R0.05 R0.1 R0.25 R0.4
L/L0 1 1.0010 1.0025 1.0048 1.0051 L; length of roller-worked specimen, L0; length of conventional TI-6al-4V specimen

42
2.3.3 SEM observations
Fig.2.11 shows the fracture surfaces of a non-roller-worked specimen
and a roller-worked one. The non-roller-worked specimens
distinguished from the roller-worked specimens on their fracture
surface patterns. That is, in the case of the fracture surface of
non-roller-worked specimens shows multi-initiation cracks [Fig.2.11 (a)]
and its magnified fracture surface shows [Fig. 2.11 (b)] where typical
fatigue crack appears.
Fig.2.11 (d) and (e) show magnified crack initiation point and its
fracture mode. The roller-worked specimen showed crack initiating
from the one point on the surface. It shows two step fracture modes,
the first step is ductile fracture mode and the second step shows brittle
fracture mode. This ductile fracture mode could be made from
roller-working process. Fig.2.11 (f) shows crack propagating from the
boundary between notch bottom and non-deformed part.
There are two reasons, which can be considered for reducing the
fatigue strength of roller-worked Ti-6Al-4Valloy specimens. The first
one should be tensile residual stress, which appears on the boundary
between plastic deformed part and non-deformed part. In addition the
other one, surface defect (between roller-working and non
roller-working) should be notch effect due to roller-working process.
According to this study, processing of plastic deformation by
roller-working is not necessarily effective for improving the fatigue
strength, but judging from the fracture occurrence the fatigue limit of

43
the just plastic deformed area seemed to be improved. The
improvement of fatigue property of Ti-6Al-4V could be expected
through a more adequate roller-working process. In addition, it is
necessary to further study the qualitative analysis of residual stress at
the plastic deformed part.

44
1mm
30μm
1mm
250μm
(a) Fatigue fracture surface for non-roller worked specimen
σa=400MPa, Nf=7.9×10⁴ cycles
(b) Magnified (a)
(c) Fatigue fracture surface for roller worked specimen Δt=0.4 σa=330MPa, Nf=5.1×10⁶ cycles
(d) Crack initiation point
(e) Magnified (d) (f) Cracks propagation from the boundary between notch bottom and non-deformed part.
25μm
Non deformed part Deformed part
Notch
50μm
Fig.2.11 SEM observations of fracture surfaces

45
2.4 CONCLUSIONS
Testing results of roller-worked Ti-6Al-4V alloy with 4 kinds of
plastic deformed values have been reported and discussed. The main
results in this test are as follows:
1. The hardness numbers of roller-worked specimens are higher than
those of non-deformed Ti-6Al-4V alloy; the fatigue limit of
roller-worked specimens becomes deteriorated in spite of
roller-working. Low work-hardening ratio of Ti-6Al-4V alloy may
not contribute to the improved hardness and residual stress.
2. Fatigue fracture had occurred in the boundary (week part) between
plastic deformed area and non- deformed area where tensile
residual stress exists.
3. The results of the SEM observation, the roller-worked specimen
showed crack initiating from the one point on the surface. It
shows two-step fracture modes, which are ductile fracture mode
and brittle one.
4. The fatigue limit of the plastic deformed area seemed to be
improved. It is necessary to further study the qualitative analysis
of residual stress at the plastic deformed area.

46
REFERANCES
[1] W.F. Smith, Structure and Properties of Engineering Alloys,
McGraw-Hill Book Co., (1994).
[2] M.J. Donachie, Jr., Titanium a technical guide, ASM international,
(1988).
[3] Titanium material researchers, Present aspect of Titanium materials
research in Japan, (1989), p.81
[4] S. Nishida, Failure analysis in engineering applications (in Japanese)
Nikkan kogyo newspaper Co. Ltd. p.4, (1986)
[5] S.Nishida, Failure analysis in engineering applications, Bather worth
Heinemann Co. Ltd. P.4, (1992)
[6] S.W. Wang et al. J. Soc. Mat. Sci., 64-628, (1998), pp.3038-3043
[7] S. Nishida et al. J. Proc. of fatigue design `98, Vol. 1, (1998),
pp.107-116
[8] S. Nishida et al. J. Soc. Mat. Sci., 42, (1993), p.1179

47
[9] S.Nishida, et al. Surface treatment V (2001), pp.161-169
[10] JSMS, Fatigue Design Manual on Material, (1981), p.8
[11] Y. Murakami, Effect of Small Defects and Nonmetallic Inclusion,
Yokendo Ltd., (1993), p.7
[12] J.O. Almen, P.H. Black, Residual stresses and fatigue in metals,
McGraw-Hill book Co., (1963)

48
CHAPTER 3 EVALUTION OF SURFACE TREATMENTS ON Ti-6Al-4V ALLOY
3.1 INTRODUCTION
Titanium and its alloys have been widely used because they are light,
high specific tensile strength, corrosion-resistance and have good
fatigue properties. As a result, more manufacturing engineers are
learning to machine these alloys. But even with their many good
mechanical properties, they are not being used due to their high
processing cost. Titanium alloy, with its long-term cost is now seen to
be more economical than other less expensive alloys [1]. A
cost-effective use is to utilize its unique properties and characteristics in
the design rather than to substitute titanium for another metal.
Many trials have been carried out in trying to improve the mechanical
properties of Ti-6Al-4V alloy including Ti based MMCs and some
surface modifications which as, the competitive processes include
through hardening, case hardening, plating, selective hardening, and
some of the newer surface technologies, such as ion implantation,
thin-film coatings, and high-energy surface modifications with laser and
electron beam [2-6].
The easy fabrication process and low-cost treatments, which are can
be considered to improve mechanical properties. The fatigue behavior
of Ti-6Al-4V alloy can be improved by surface modifications such as,

49
plasma flame, electroless and plasma immersion DLC. Few studies had
been reported about this subject [7-9].
The purpose of this chapter is the estimation of mechanical
properties in 5 kinds surface modified Ti-6Al-4V alloy. Surface
treatments by 2 kinds plasma flame, 3 kinds DLC (Diamond Like
Carbon) coating and electroless plating methods have been studied in
Ti-6Al-4V alloy.
This study presents an analysis of fatigue behavior in comparison
with chemical composition, microhardness and adhesion work for a
new technique in Ti-6Al-4V alloy.

50
Over view of surface treatment engineering
The free surface of a component is a common site for the nucleation
of a fatigue crack. Therefore, the manner in which the surface is
prepared during manufacturing of the component has a decisive role in
dictating the initiation life for fatigue cracks [10,11].
There exists a variety of surface treatment, such as carburizing,
nittriding, flame hardening, induction hardening and shot-peening,
which are designed to impart high strength. Those processes give the
materials higher hardness and higher corrosion resistance locally in the
near-surface region. Furthermore, common machine operations such as
grinding, polishing and milling cause different degrees of surface
roughness to develop [12-14]. The valleys on the rough surface serve as
stress concentration, which, in turn induce different levels of resistance
to fatigue crack nucleation.
In addition to the roughness of the surface, the residual stresses that are
induced by the surface treatments have an important effect on the
fatigue life. Residual stress are generated in a component as a
consequence of thermal, chemical or mechanical treatment:
(1) Mechanical working, which causes non-uniform plastic
deformation, may be used to provide a favorable residual
stress distribution. Shot-peening of surface, surface rolling
of fillets, and auto-frettage of gun tube or pressure vessels
are some examples. Deleterious residual stress patterns may
also arise from mechanical working, as, for example, in the

51
undesirable development of tensile stress due to cold
straightening.
(2) Local volume changes associated with precipitation, chemical
reactions, or phase transformations induce residual stress in a
component. Case hardening of a surface by nitriding
produces compressive stresses in the diffusion region.
(3) Each fabrication technique, such as grinding, milling,
polishing, rolling and welding, produces its own characteristic
residual stress patterns.
(4) Even in the absence of phase change, non-uniform thermal
expansion or contraction produces residual stress. An
example of the development of thermal residual stress can
be founding in process involving rapid quenching and in
thermal fatigue.

52
Thin-film coatings are usually applied by the process shown Fig. 3.1.
They fall into two main categories; (1) coating applied by physical vapor
deposition process (PVD), and (2) coating applied by chemical vapor
deposition process (CVD). Physical vapor deposition processes, as the
name implies, involve the formation of a coating on a substrate by
THIN-FILM COATINGS
Physical vapor deposition (PVD)
Sputtering Thermal
evaporation Ion plating
RF
dc
Cathodic arc plasma
Magnetron
Reaction
Filament
Resistance boat
Electron beam
Arc source
Reaction ion plating
Chemical vapor deposition (CVD)
Pack Plasma assisted Ion plating
Fig 3.1 Spectrum of process for thin-film coatings

53
physically depositing atoms, ions, or molecules of a coating species.
Chemical vapor deposition involves the formation of a coating by the
reaction of the coating substance with substrate [15-17].

54
3. 2 EXPERIMENTAL PROCEDURE
Table 3. 1 represents the chemical compositions of Ti-6Al-4V alloy.
Fig.3.2 shows the shape and the dimensions of the specimen with a
partial notch.
The all specimens were polished with emery paper (#400~3000),
after that with diamond paste polish (#6~1), then they were annealed at
600℃ for 0.5hr in a vacuum furnace to relieve stress. After annealing,
the specimens were electrolytic polished (0.5~0.6A/20V) to remove the
residual work hardened layer to a depth of about 50μm on their
thickness. And then they were surface modified such as, 2 kinds plasma
flam, 3 kinds DLC (Like Diamond Carbon) coating and electroless
Table 3.1 Chemical compositions of Ti-6Al-4V alloy mass%
Al V Fe O C N H 6.14 3.93 0.17 0.19 0.011 0.014 0.009
20 20 20
60
φ8
φ6
0.3
C 0.5
R 5
R 12
Fig. 3.2 Specimen geometry

55
(Ni-P coating) plating methods. Their fabrication processes were shown
in Fig 3.3.
The specimens were buff polished lightly with diamond past and the
notch was slightly wiped with tissue paper for cleaning the diamond
past was changed. Finally to observe clear microstructure, the
specimens surface were etched in a solution of 10%HF + 20%HNO3.
For the fatigue tests, Ono type of rotating and bending fatigue-testing
machine (14.7N·m/ 3000rpm) was used. The fracture surfaces were
observed by an optical microscope and a Scanning Electron Microscope
(SEM). In addition, the cross section of each modified surface was
observed with SEM. The micro Vickers Hardness was used under a
load of 0.49N and 0.098N.

56
Fig 3.3 (a) Schematic representation of the plasma deposition (C3H8) process Plasma A (780℃/120min./vac.) Plasma B (800℃/120min./vac.)
c
Optical emission spectroscopy
Electron
Ionization
Dissociation
Surface reaction
Molecule
Pressure gauge
Probe
Mass spectrometry
Drift
Ion·molecule reaction etc.
Radical·moleculereaction etc.
Radical reaction etc.
Substrate
Products
Optical emission
Exhaust Heater
Gas
RF power
Diffusion

57
Motor
Reflector
Plasma
Pulsed DC power(f=50-250kHz)
Sputtering target
Substrate
Pumping
PIG-Plasma gun
Ar
C2H2,TMS
Solenoid coil
Fig. 3.3 (b) Schematic representation of the DLC-C process DLC-A ; CH4, C2H2 coating (3~4μm /6hr. /1.2~1.3Pa) DLC-B ; CH4, C2H2 coating (3~4μm /60min/1.2~1.3Pa) DLC-C; Si coating (3μm /60min/0.5~0.7MPa)

58
3.3 RESULTS AND DISCUSSIONS
3.3.1 Result of hardness test
The results of hardness test shown in Fig.3.4. The hardness values of
all surface treated specimens showed a value by about 200% higher than
that of conventional Ti-6Al-4V alloy. The hardness value increased
especially in the neighborhood of the surface. Hardness measuring
carried out on the notch and longitudinal section of specimens. The
loads of this present study were employed 0.098N-0.98N.
From the hardness results, the plasma B treated specimen showed
highest value than conventional Ti-6Al-4V alloy by about 250 %. From
these results the existence of the surface film improved the surface
hardness value, resulting in a good hardening effect on surface by
plasma surface treatment.
In the other hand, the hardness values of DLC-B, DLC-C and
electroless plating treated specimens exhibited some low value despite
their hardness values were expected higher value. The hardness value of
electroness plated specimen showed lowest value in the present results.
It was higher than that of conventional Ti-6Al-4V alloy by about 70%.
The hardness number of each surface-treated specimen increased in
the order of electroless plating, DLC-C, DLC-A, DLC-B, plasma A,
plasma B and their strengthened surface hardness values were
approximately 511Hv, 570 Hv, 585 Hv, 670 Hv, 776 Hv, and 813 Hv,
respectively.
The hardening effect by surface treatment didn’t influence on over

59
than 50μm from the surface. The hardness values in the core show
almost the same value of conventional Ti-6Al-4V alloy.
Each surface-treated specimens showed some difference surface
conditions. The surface of electroless plating exhibited embossing
surface and plasma B indicated very roughen surface condition. They
are shown in Fig. 3.5.

60
0.0 0.2 0.4 0.6 0.8 1.0
300
400
500
600
700
800
900
Har
dnes
s num
ber
Hv
Distance from surface mm
Plasma A Plasma B DLC-A DLC-B DLC-C Electroless
Fig. 3.4 Hardness values according to distance from the specimen’s surface

61
100μm
100μm
(a) Plasma A (b) Plasma B
100μm
100μm
(c) DLC-A (d) DLC-B
100μm
100μm
(e) DLC-C (f) Electoless plating
Fig. 3.5 Surface conditions by various surface modifications Axial direction

62
3.3.2 Estimation of fatigue limit
Influence of surface modifications
Fig.3.6 shows S-N curves of surface modified specimens followed by
2 kinds plasma flam, 3 kinds DLC (Like Diamond Carbon) coating and
electroless plating. The fatigue strength of Ti-6Al-4V alloy is developed
especially for DLC-A application. DLC-A and DLC-B treated
specimens showed higher values than that of conventional Ti-6Al-4V
by about 13% and 10%. The other hand, the fatigue strength of DLC-C
treated specimen shows almost the same value than that of
conventional Ti-6Al-4V alloy.
Considering to empirical relationship between the hardness number
and their fatigue limits were expected to increase with an increase of
hardness number. However, the fatigue limit of the plasma A and B
treatment, electroless plated specimens were by about 20%, 50%, 30%
lower than that of the conventional one. Though all of hardness value
was improved, the fatigue limit wasn’t improved. From these results
surface modification by DLC coating is more effective method to
improve fatigue strength on Ti-6Al-4V alloy.
On the above result, the deterioration in fatigue strength of the
plasma B which is considered due to the micro-cracks that should be
made bending process during fatigue test. Fig.3.7 exhibits the
micro-cracks on the surface of plasma flame treated specimen after
fatigue test. The strain ratio of modified surface should be lower than
that of the inner’ one due to strengthen surface by surface

63
modifications.
The hardness value of plasma B specimen especially showed high
value comparing with the other surface modified specimens. The range
of strain ratio of plasma B specimen should be larger than other’s one.
This result could be considered the reason of plasma B specimen
showed lowest fatigue strength in comparison with other surface
modified specimens. DLC-A and DLC-B treated specimens, which
showed improving fatigue strength, they couldn’t be observed the
micro-cracks on the surface.
The fatigue fracture occurred from surface where from the
micro-cracks. The balance of strain ratio between modified surface and
inner part is important for improving fatigue strength.
The electroless plating treated specimens indicated roughen surface
conditions [refer Fig.3.5 (f)]. It showed more low fatigue limit compare
with conventional Ti-6Al-4V alloy. The reducing of fatigue limits on
plasma B specimen could be considered due to the roughness of
surface. The rough surface condition also plays a major role a notch
effect during fatigue test and it is on of the reason in deteriorating their
fatigue limits.
In addition, difference strengthen film depth on a specimen can be
considered the one of the reasons in reducing fatigue limit by DLC-C
surface treatment [refer Fig. 3.11 (b)]. This difference film depth should
be made by unsatisfied treatment process.
The considerations, which are the surface roughness and balance of

64
strain ratio between strengthen surface and inner part require for
improving fatigue strength on surface modified Ti-6Al-4V alloy.

65
104 105 106 107150
200
250
300
350
400
450
500
550
600
650
700
Stre
ss a
mpl
itude
σa
M
Pa
Number of cycles to failure Nf
Con. Plasma A Plasma B DLC A DLC B DLC C Electroless
Fig.3.6 S-N curves for various surface treatment specimens

66
3.3.3 SEM observations of longitudinal section layer and fracture
surface
Fig.3.7 shows the depth of surface film on longitudinal section of
specimens by plasma A treatment. The film depth of plasma B treated
specimen is shown in Fig.3.8 (a). The micro-cracks propagate from
specimen’s surface that is one of reasons in deterioration of fatigue
limit. These micro-cracks are made during fatigue test and play a roll of
stress concentration. The observed micro-cracks on the surface
exhibited in Fig.3.8 (b).
Fig.3.9 shows the depth of surface film by DLC-A treatment. The
film depth of DLC-A is thicker than that of plasma treated ones. The
film depth was about 15µm. The surface film by electroless plating is
shown in Fig.3.10. This film distinguished from each three layers and,
the depth is totally 20µm.
The surface film by DLC-C exhibited scattering of film depth on the
surface. The film depth showed different thickness according to the
part [Fig.3.11]. The scattering of film depth should be made during
surface treatment process. This phenomenon also considered one of
reasons for reducing of fatigue strength.
The fatigue fracture surfaces are shown in Fig.3.12. All fracture
surfaces and its magnified fracture surface shows brittle fracture mode
where typical fatigue crack appears. From the figure, the crack initiated
from the surface of specimen.
The surface condition can be considered for reducing of fatigue

67
strength on the surface modified Ti-6Al-4Valloy specimens. Rough
surface condition would generate notch effect due to processing of
surface strengthen treatment.
According to this study, the surface strengthen treatments by various
surface modification is not necessarily effective in improving the fatigue
strength. Though all hardness value of present work increased, the
fatigue limit improved only two specimens that are DLC-A, DLC-B
coating.
The improvement of fatigue property of surface modified Ti-6Al-4V
alloy could be expected through a more quantitative process on surface
treatment.

68
10μm
specimen
Fig.3.8 (a) Depth of surface film by plasma flame B (10µm)
Before fatigue test
10μm
Fig.3.7 Depth of surface film by plasma flame A (10µm)

200
200μm specimen
Fig.3.8 (b) SEM obsevation of micro-cracks (after fatigue test, 390MPa, 6.6х104 cycles) Non-propagated cracked observed on plasma flame B treated specimen Micro-cracks propagate from surface that is one of reasons in deteriorating of fatigue limit. These micro-cracks are made during fatigue test and play a roll of stress concentration.
69

70
10μm
specimen
Fig.3.9 Depth of surface film by plasma DLC-A (15µm)
10μm
specimen
Fig.3.10 Depth of surface film by electroless plating
Electroless plating depth is consist of three layers (20µm)

71
①
② ③ ④
10μm
specimen
Fig. 3.11 (b) Depth of surface film by DLC-C
Magnified area ① (30µm)
Fig. 3.11 (a) The surface film exhivited diffence depth by DLC-C treatment. Depth of surface film is largely divided 4 areas. This reason can be considered deterioration of fatigue limit.

72
100μm
specimen
Fig. 3.11 (c) Depth of surface film on area ② (20µm)
10μm
specimen
Fig. 3.11 (d) Depth of surface film on ③ Surface film didn’t observed on area ③

73
③ and ④
20μm
specimen
③ ②
Fig. 3.11 (e) Depth of surface film between area ② and ③
20μm
specimen
Fig. 3.11 (f) Depth of surface film on area ④ (15µm)
Fig.3.11 SEM observation of surface depth on longitudinal section by DLC-C treatment

74
1mm
100μm
(a) Fracture surface Plasma A (b) Magnified crack initiation point 400MPa, 7.5х104 cycles
1mm
200μm
(c) Fracture surface Plasma B (d) Magnified crack initiation point 280MPa, 7.0х104 cycles
1mm
100μm
(e) Fracture surface DLC-A (f) Magnified crack initiation point 500MPa, 6.3х105 cycles
Fig.3.12. SEM observation of fatigue fracture, (a)-(f)

75
1mm
100μm
(g) Fracture surface DLC-B (h) Magnified crack initiation point 450MPa, 9.8х104 cycles
1mm
50μm
(i) Fracture surface DLC-C (j) Magnified crack initiation point 500MPa, 1.2х105 cycles
1mm
50μm
(k) Fracture surface EElleeccttrroolleessss plating (l) Magnified crack initiation point 500MPa, 4.6х104 cycles
Fig.3.12. SEM observation of fatigue fracture, (g)-(l)

76
3.4 CONCLUSIONS
The effect of surface modified Ti-6Al-4V alloy has been investigated
and according to the results obtained in the present study. The main
results obtained in this test are as follows;
1. From the hardness results, the plasma B treated specimen
showed highest value than other specimens by about 250 %.
The existence of the surface film improved the surface hardness
value, resulting in a good surface modification effect.
2. DLC-A and DLC-B treated specimens showed higher values
than that of conventional Ti-6Al-4V by about 13% and 10%.
Though all hardness value of present work increased, the
fatigue limit improved only two specimens that are DLC-A,
DLC-B coating.
3. The surface roughness condition and balance of strain ratio
between modified surface and the inner can be considered for
reducing the fatigue strength of surface modified
Ti-6Al-4Valloy specimens. Roughened surface condition and
micro crack which be maid by low strain ratio on modified
surface should be notch effect due to processing of surface
strengthen treatment.

77
4. The considerations, which are strain ratio and surface roughness,
require for improving fatigue strength on surface modified
Ti-6Al-4V alloy. The improvement of fatigue property of
surface modified Ti-6Al-4V alloy could be expected through a
more quantitative process on surface treatment.

78
REFERANCES [1] M.J.Donachie Jr., Titanium a technical guide, ASM international, 1988, pp. 9-19
[2] J. M. Williams and R. A. Buchanan, "Ion implantation of surgical
Ti-6Al-4V alloy," Materials Science and Engineering vol. 69, (1985), pp.
237-246
[3] E.J.Lee, R.G.Bayer, Tribological characteristics of titanium nitride
thin coatings, Metal finishing, (1985), pp. 39-42
[4] T.I.Wu and J.K.Wu, Surface Hardening of Ti-6Al-4V Alloy by
Electrochemical Hydrogenation, Metallurgical Trans., Vol. 24A, pp.
1181-1185
[5] J.A.Mock, Ceramic and refractory coating, Materials engineering,
Vol.80(6), (1974), pp. 101-108
[6] H.J. Gossmann, D. J. Eaglesham et al., Boron-enhanced diffusion of
boron from ultra-low energy ion implantation, Applied Physics Letters
vol. 74, (1999), pp. 2435-2437
[7] Metal handbook, Vol.5, Surface cleaning finishing and coating,
(1982), American society for metal

79
[8] J. mort, F. jansen, CRC press, Plasma deposition thin films
[9] E. Chason, et al, "Ion beams in silicon processing and
characterization," Journal of Applied Physics, vol. 81, no. 10, (1997), pp.
6513-6561
[10] T.T.Shin, R.P.Wei, Influence of chemical and thermal environment
on delay in a Ti-6Al-4V alloy, Fatigue crack growth under spectrum,
ASTM, (1976), pp.113-124
[11] J.Black et al., The effect of cold deformation fatigue threshold,
Fatigue threshold, pp. 629-639
[12] K.N. Birmingham, Institution of corrosion science and technology,
(1984)
[13] H. Kurokawa et al., Thin solid films, Vol.212, 1(2), (1992),
pp.240-244
[14] K.Saijo, M.Yagi, et al., Surface and coating technology, 43(44),
(1990), p.30
[15] R.F.Bunshah, et al., Deposition technologies for films and coating,
Noyes publications, (1982)

80
[16] S. Schiller et al., Advanced in high rate sputtering with magnetron
processing, Metallugical coating, Vol.2, (1979), pp. 455-467
[17] J.N.Zemel et al., Metallugical coating. Lausanne, Elsevier sequoia,
(1979)

81
CHAPTER 4 MECHANICAL PROPERTIES OF
TUNGSTEN SHORT FIBER REINFORCED Ti-6Al-4V
ALLOY BY HIP FABRICATIONS
This chapter presents the investigation for improvement of
mechanical properties on Ti-6Al-4V alloy into composite materials. 4.1 INTRODUCTION
To provide a solution for reducing cost and the weight of machine
parts, lightweight metallic materials have been continuously developed.
Metal-matrix composites, comprising of strong particles, and whiskers
or fibers in a ductile metal matrix, are becoming widely accepted for
specialized applications where properties such as a high
strength-to-weight ratio, high stiffness or a low coefficient of thermal
expansion, are needed. Besides that, the availability of metal matrix
composites (MMCs) with attractive physical and mechanical properties
at reasonable cost would become a significant part of competition [1-5]
In addition, conventional Ti-6Al-4V alloy is widely employed in
several engineering applications and the MMCs using this alloy for the
matrix have been studied and expected to be one of the most currently
advanced materials [6-9]. Most research on Ti-based MMCs has
concentrated on ceramic reinforcement composites whose fabrication is
expensive and complicated [10-14]. Recently, tungsten (W) fiber, which
possesses higher melting point and more excellent mechanical strength
has been attempted to be used as an alternative metallic reinforcement

82
in developing a new type of W/Ti-6Al-4V MMCs [15].
Tungsten (W) possesses good machinability, high melting point
(about 3,900℃ )and excellent mechanical properties. It can be
produced in form of fibers therefore tungsten fibers have been
attempted to use for the reinforcement in a Ti-6Al-4V matrix for
developing a new type of MMC.
The aim of this study is to investigate the mechanical properties
(stable and unstable) of a W fiber reinforced Ti-6Al-4V alloy processed
by a powder metallurgy method employing HIP prostheses due to its
mechanical properties and low density [16-18], following by a secondly
treatment using die forging and rotary swaging.

83
4.1.1 Overview of MMC
A metal matrix composite (MMC) is materials, which consist of
particle or fibers embedded in a metallic matrix. The basic assumption
behind the use of a composite material is the extent to which the
qualities of two or more distinct constituents can be combined, without
seriously accentuating their shortcomings. In the context of MMC, the
objective might be to combine the excellent ductility and load-bearing
capacity of the reinforcement.
Fiber
Crack
Matrix
(a) (b)
(c) (d)
Fig. 4.1 Fracture mechanism of fiber reinforcement MMC [19,20]
(a) Fiber fracture, (b) fiber pull-out, (c) fiber/matrix separation and (d) plastic deformation

84
4.1.2 Titanium Metal Matrix Composites
There are very few titanium-based MMCs in current production, with
only two basic types of matrices. One; intermetallic-matrix composite
(IMC), uses continuous fiber. The other is formed from titanium
carbide particulates. Both have been developed primarily for
high-temperature applications, as in engine components and skins for
military aircraft [4,6].
IMCs are formed from a series of titanium-aluminide foils
consolidated with boron-coated silicon carbide continuous fibers.
Titanium-aluminides are another newly publicized group of aerospace
alloys. Strictly speaking, these are not MMCs, but they do boast very
high strength and good resistance to loss of mechanical properties at
high temperatures. However, they suffer from ductility at room
temperature and exorbitant cost. The ductility issue may soon be
resolved; cost, however is unlikely to drop within the foreseeable future.
4.1.3 Applications of Ti based MMCs
Ti MMCs will be used primarily for the fabrication of various gas
turbine engine components, including fan blades, fan frames, actuators,
rotors, vanes, cases, ducting, shafts, and liners. A major objective of the
project is to demonstrate a “production ready” industry in time to
incorporate this material in the Joint Strike Fighter (JSF). Other
candidates for use of this material include the F-22 and new
commercial engines [7,8].

85
4.2 EXPERIMENTAL PROCEDURE
4.2.1 Materials and specimen
Atomized Ti-6Al-4V powder (Fig.4.2 (a) for illustrating), with grains
of an average size of 100µm, and tungsten short fibers (Fig.4.2 (b,c) for
illustrating) were mixed (using a V milling machine, operating at 60 rpm
for 0.5hr, Fig.4.3 for details ) and then the composites were processed
by HIP [6,7].
Tables 4.1 and 4.2 list the chemical composition of Ti-6Al-4V alloy
and the tensile strength, density and aspect ratio of W short fiber,
respectively.
Two conditions of HIP were used as depicted in Fig.4.4. The
condition of HIP treatment (Fig.4.4 (b) for illustrating) was 100MPa
pressure at 950℃ for 1 hour in immersion of Argon gas. This
temperature was controlled to be under the transformation temperature
Table. 4.1 Chemical compositions of Ti-6Al-4V alloy
Al V Fe O C N H 6.14 3.93 0.17 0.19 0.011 0.014 0.009
mass%
Table 4.2. Tensile strength and aspect ratio of W fiber
Aspect ratio l*/d Fiber diameter
d μm Tensile strength σB MPa
Max. Min. Ave. 20 3430 135 7.0 47.9
*l; Fiber length, d; Fiber diameter

86
of titanium matrix and hence, the mechanical property or
microstructure of titanium matrix would be neither greatly affected nor
damage.
In order to improve the homogeneity of fiber-distribution in the
matrix, a secondary process (Fig.4.5 illustrating) employing rotary
swaging (RS) and Die forging (DF) was performed after the each HIP
processes.
Rotary-swaging processing was conducted in order to improve the
arrangement off W short fiber in the matrix and furthermore to
improve the strength in the specified orientation. Rotary-swaging
processing was carried out by hot rolling, after specimen was heated at
950℃ in an electric furnace. Fig.4.6 illustrates the rotary swaging
machine. In the other hand, die-forging processing was carried out by
hot working at 990℃~1100℃. Table 4.3 lists the specification of the
specimens.
Configurations of tensile and fatigue test specimens are shown in
Fig.4.7 (a), (b) respectively.

87
100µm
500µm
(a) Ti-6Al-4V powder (b) W short fibers
A
B
20μm
(c) Magnified part A (d) Aspect of tungsten short fiber (e) Magnified part B
Fig. 4.2 Materials of W short fiber reinforced Ti-6Al-4V alloy MMC
20μm 20μm

V Mill blendingTi-6Al-4V alloy powder (Matrix)
Tungsten short fiber reinforcement
Fig.4.3 Manufacturing of W/Ti-6Al-4V MMC
Tungsten short fibers were mixed (using a V milling machine, operating at 60 rpm for 0.5hr)
88

89
Press
M
Pa
Tem.
℃
Ar gas
Capsul
(a)HIP treatment
100MPa1hr.
100MPa/hr. 600MPa/hr.
40MPa
950℃
200-300℃/hr. 730℃/hr. 400℃/hr.
1hr.
630℃/hr.
(b) HIP conditionsHIPa (‥), HIPb (―)
Fig. 4.4 HIP treatment conditions (HOT ISOSTETIC PRESSING)
Ti-alloy powder and W short fiber at a specified volume with a V mil mixer, then HIP process was carried out. Condition of HIP treatment showed (a). This temperature was controlled to be under the transformation temperature of Ti-alloy matrix and hence the mechanical property or microstructure of Ti-alloy matrix would be neither greatly affected nor damaged.

90
d 0
Fig. 4.5 Secondly process by RS and DF Tungsten short fibers rearranged by secondly process: RS and DF processing were conducted in order to improve the arrangement of W short fiber in the Ti-alloy matrix and furthermore to improve the strength in the specified orientation.
Hammer
Die
Roller
Guide Material
Hammer
Die
Roller
Guide Material
Fig.4.6 Schematic drawing of Rotary swaging
d

91
20 20 20
60
φ8
φ5
0.3
C 0.5
R 5
R 12
(a) Fatigue specimen
M6×0.8
6 6 30
φ
3
mm (b) Tensile specimen
Fig. 4.7 Shape and dimensions of specimens
Table 4.3 Specimens and fiber contents by HIP conditions and secondly process Materials Secondly process Volume fraction of W fiber (vol.%)
Con. - 0 HIPa-RS-0 0 HIPa-RS-6 6 HIPa-RS-9 9 HIPa-RS-12
RS 12
HIPb-DF-0 0 HIPb-DF-9 DF 9
RS: rotary swaging, DF: Die forging

92
4.2.2 Test procedure
All of specimens were annealed at 600°C for 0.5hr in a vacuum
furnace. After annealing, the specimens were mechanically polished
with emery paper (#400~3000) then with polishing powder
(Al2O3/0.1 ㎛), and then etched with a solution of 10%HF +
20%HNO3. To assess the effects of the polishing method on the testing
results, one additional group of HIPA treated specimens was prepared
by extensive electro-polishing after mechanically polishing.
The Vickers Hardness number was measured in accordance to
JIS-Z2244 at the loads of 1.96N and 0.245N, respectively.
Tensile tests were carried out using a hydraulic universal testing
machine(with a capacity of 98kN)and the fatigue tests were conducted
by an ono-type rotating bending machine operating at 3000rpm at room
temperature. The surface of the fatigue specimens was monitored by
plastic-replica method and the successively taken replicas were observed
with an optical microscope. The fracture surface of the tensile and
fatigue specimens was investigated using scanning electro microscope
(SEM).

93
4.3 RESULTS AND DISCUSSIONS 4.3.1 Estimation of static properties
Observation of microstructure
W-fibers/matrix diffusion layers and improvement; Fig.4.8 shows the
microstructure of HIP-Ti-6Al-4V alloy and HIPB-W/Ti-6Al-4V and
HIPA-W/Ti-6Al-4V, respectively. An interface structure was observed
between the fibers and the matrix. By EPMA analysis, it is suggested
that the interface could be a diffusion phase in which the W atom
diffused into the Ti-6Al-4V matrix.
The microstructure of various materials is shown Fig.4.9. These
specimens exhibited difference size of α phase. The difference phase
size can be considered due to the each HIP process condition.
A
B
C
10µm
Fig.4.8 Constitution of W/Ti-6Al-4V MMC A: W fiber, B: Diffusion phase, C: W/Ti-6Al-4V matrix

50µm
20µm
20µm
(a) Con. Ti-6Al-4V alloy (b) HIP-DF-0 (c) HIP-RS-0
Fig. 4.9 Microstructure of HIP treated specimen comparing with conventional Ti-6Al-4V alloy
94

95
Result of hardness test
The results of hardness test shown in Table 4.4 also suggested that
the average hardness number increases proportionally to the area of the
diffusion phase in the matrix. Most of the hardness number of
HIPb-DF showed higher value than HIPa-RS by about 12%. The
hardness numbers of the diffusion phase in MMCs showed a value by
about 20-30% more than that of conventional Ti-6Al-4V alloy. It
increased with an increase in volume fraction of W fiber.
The HIPb-DF MMC exhibited relatively larger areas of diffusion
phase than those of the HIPa-RS MMCs one. The difference may be
caused by the difference of heating and cooling rate in each HIP
process, where the slower rate in the HIPb process might result in a
larger amount of diffusing of W atoms into the matrix.
The existence of the diffusion phase improved the local strength of
Table 4.4 Results of Vickers hardness test
Materials Average Surface* Core* Matrix** Interface** Con. 317 321 313 - -
HIPa-RS-0 - 345 334 - - HIPa-RS-6 381 410 373 360 425 HIPa-RS-9 406 421 380 382 454 HIPa-RS-12 418 431 396 406 438 HIPb-DF-0 - 423 336 - - HIPb-DF-9 446 457 435 394 464 *;HV(1.96N) **;HV(0.049N)

96
the interfaces between the reinforcing fibers and surrounding matrix
materials, resulting in a good reinforcing effect of the W fibers on the
overall static strength of the MMCs.
Effect of fiber orientation
Though it is not covered in the figure, some difference orientation
of W short fiber is obtained in the two types specimens. It can be
considered that the rotary swaging and die forging conducted as a
secondly working after HIP treatments are effective for difference
orientation of W short fiber in the MMC. It was found that the degree
of co-orientation of W short fibers to the extruded direction increases
with the volume fraction of W short fibers.
As given the properties of the fiber and matrix, which comprise a
composite material, it would be convenient to be able to estimate the
properties of the composite. The strength of the fiber reinforced
composite is dependent to the orientation of the fiber [21]. In addition,
fiber orientability also affects the concentration of fibers. At higher
fiber concentrations, fibers encounter more interference from other
fibers. This concentration effect is not well understood.
Therefore, it is necessary to evaluate quantitatively the orientation
of W short fiber in the MMCs. This evaluation was reformed with the
Hellman’s orientation coefficient and their results are listed in Table 4.5.
The axially facing fiber orientation angle was measured for the
fibers near the center of the longitudinal section of each specimen.

97
Hellman’s orientation coefficient F is expressed in the following
equation.
F={3(cos2θ)-1}/2 (4.1)
Where, θis fiber orientation angle for the extruding direction. F=1,
F=0 and F=-1/2 indicate the state of a complete parallel orientation, a
random orientation, and a complete vertical orientation, respectively
(Fig.4.10 for illustrating).
Different processing conditions should be fixed on fiber orientation
in composites. The results in the circumstance of present work show a
tendency of improvement with the increase in W short fiber volume
fraction and with the decrease of the cross section of W short fiber.
According to the results of measurement, the fiber orientation of
HIPa-RS process is better than that of HIPb-DF possesses. In addition,
HIPa-RS-9 shows the best result among all kinds of the specimens.
Result of tensile strength
Fig.4.11 shows the results of the tensile test of MMCs and Ti-6Al-4V
alloy. According to the test results, tensile strength of MMCs showed a
remarkable improvement with the addition of the tungsten fibers. The
tensile strength of the MMCs showed a higher value in comparison
with the tensile strength of the conventional Ti- 6Al-4V alloy.

98
Therefore, the condition for HIP applied in this work is suitable.
Fig.4.12 illustrates the relation between tensile strength to the volume
fraction of W short fiber. The curve in the figure shows simple rule of
mixtures calculated from the volume ratio of reinforcement and matrix.
A linear rule o mixture is shown in the following equation [22].
σc=σfVf+σm(1-Vf) (4.2)
Where, σf andσm are tensile strength of W fiber and matrix,
respectively. And Vf is volume fraction of W fiber. From this figure, the
tensile strength of rotary swaging specimen and die forging specimen
tends to improve with the increase in volume fraction of W short fiber.
Tensile strength of rotary swaging specimen is higher than that of die
forging one, and it is interesting to know that this value is even higher
than the tensile strength calculated by equation (4.2).
From the tensile results, they are concluded that the W short fiber is
effective for improving the tensile strength of the Ti matrix composite
and there is a correlation between the improvement of tensile strength
and the W fiber volume fraction. Mechanism of the improvement in
tensile strength of these MMCs will be discussed. The maximum value
of the tensile strength in this work was 1520 MPa, which was achieved
for the MMC reinforced with 9 vol.% W fibers.
Generally, the sintering of high deformation resistance Ti matrix has

99
been often carried out at high temperature (about 1100-1200℃). The
strength of the reinforcement may decrease by the recrystallization in
this circumstance. In the meantime, the recrystallization temperature for
the W fiber is definitely high enough to prevent recrystallization even at
the maximum temperature required for HIP process of Ti matrix. It is
considered that the use of W fiber for Ti matrix provides no specified
restriction of HIP treatment temperature due to its superior thermal
properties.
The observations of a fracture surface of a tensile specimen shown
in Fig.4.13 exhibits the vast majority of broken fibers, where as pull-out
were hardly found. That suggested a strong interface was achieved in
the present MMC.

100
Table 4.5. Hellman’ s orientation coefficient Materials Coefficient
HIPa-RS-6 0.8995 HIPa-RS-9 0.9121 HIPa-RS-12 0.8717 HIPb-DF-9 0.8304
Flow direction
Flow alignment
a11=1.0
Random alignment
Transverse alignment
a11=0.5 a11=0.0
Fig.4.10 Fiber orientation characterization Hellman’s orientation coefficient F={3(cos2θ)-1}/2
θis fiber orientation angle for the extruding direction. F=1:Complete parallel orientation, F=0:Random orientation, F=-1/2:Complete vertical orientation
Angle θ
W short fiber
Angle θ
W short fiber
Angle θ
W short fiber

101
0.00 0.02 0.04 0.060
200
400
600
800
1000
1200
1400
1600
Stre
ss σ
M
Pa
Strain ε %
HIPa-RS-0 HIPa-RS-9 Con.
(a) HIPa-RS
0.00 0.02 0.04 0.060
200
400
600
800
1000
1200
1400
1600
Stre
ss σ
M
Pa
Strain ε %
HIPb-DF-0 HIPb-DF-9 Con.
(b) HIPb-DF Fig.4.11 S-εcurves of MMCs and Ti-6Al-4V

102
0 2 4 6 8 10 12 141000
1100
1200
1300
1400
1500
1600
Tens
ile st
reng
th
σ B
MPa
Volume fraction of W fiber Vol.%
HIPa-RS-0 HIPa-RS HIPa-DF HIPb-DF
Fig.4.12 Relation between tensile strength and volume fraction of W fiber
Rule of mixtures

103
(a) Fracture surface after tensile test
50µm (b) Magnified A
Fig.4.13 SEM observation of tensile fracture surface in HIPa-RS-9
500µm

104
4.3.2 Estimation of fatigue limit
Effect of fiber content rations and surface treating in HIPa-RS
MMCs
Fig.4.14 shows some typical S-N curves of HIPa-RS treated
specimens followed by mechanical [Fig.4.14 (a)] and electro-polishing
[Fig.4.14 (b)]. The fatigue limit of the MMCs was about 40% lower than
that of the conventional Ti-6Al-4V specimens. Considering the volume
fraction of W-fibers, the fatigue limit decreased in the order of 12, 9, 6
vol.% for the electro-polished specimens, but it decreased in the order
of 9, 6, 2 vol.% for the mechanically polished ones. Generally, the
overall fatigue limits of the mechanically polished specimens were
higher.
Relating to the effect of polishing method, mechanically polished
specimens show a higher fatigue limit than the electro-polished ones.
The electro-polished specimens surface contain the W-fibers extrusion
[Fig.4.15] resulted from the fact that W-fibers were relatively cathodic
with respect to the Ti-6Al-4V matrix during electro-polishing process.
Since the extrusion of W fibers may cause stress concentration at their
interfaces with the matrix, it is attributed as one of the reasons that this
extrusion by W fibers deteriorate the fatigue limit in this circumstance.
Deterioration of fatigue strength in MMCs
Fig.4.16 representatively illustrates the S-N curves of HIPa-0, HIPa-9,
HIPb-0, HIPb-0 and conventional Ti-6Al-4V specimens. The fatigue

105
limit of HIPa-9 and HIPb-9 were lower than that of the conventional
Ti-6Al-4V by approximately 10% and 25% respectively. On the
contrary, HIPa-0 and HIPb-0 exhibited the same or higher value fatigue
limit in comparing with that of the conventional Ti alloy by about 40%.
From a simple empirical relation between fatigue limitσW and
Vickers hardness number HV, expressed as σW≒1.6HV, the fatigue
limit of the composite was expected to be improved according to the
increase of hardness number. However, the fatigue limit of the MMCs
in this work actually deteriorated: The reasons for this might be
attributed to the low ductility of the matrix associated by defects, such
as, clustering of fibers, micro-cracks and porosity. Particularly,
fiber-clusters seemed to reduce the crack initiation resistance of this
MMC.
The fracture surface of HIPa-RS-9 specimen showed multi initiation
cracks [view Fig.4.17 (a)]. Several cracks initiating from the surface of
the fatigue specimen and then coalescing to propagate were observed.
Fig.4.17 (b) shows the observation of crack initiation in a HIPb-DF-9
specimen started from a cluster of fibers [see Fig.4.17 (c) for details]
In addition, the deterioration of the fatigue limit could be attributed
to the defects in the microstructure of the composites such as porosity
[see Fig.4.17 (d)], clustering of fibers [see Fig.4.17 (e)], and micro-cracks.
Secondary micro-cracks (mostly inter-granular) were frequently
observed on the fatigue fracture zone [see Fig.4.17 (f)].

106
The results of quantitative analysis of the density of porosity in the
HIPa-specimens are shown in Fig.4.18. The density of porosity
represented by the percentage of area where exposed on a specified
area. The porosity density seems to increase with an increase in the
fibers volume fraction.
The fatigue limit of the HIPb-DF-0 specimens without fibers
reinforcement an excellent result; even better than that of the
conventional Ti-6Al-4V specimen. Consequently, the existence of
defects caused by the addition of fibers into the Ti-6Al-4V matrix
seems to be the major problem in order to improve the fatigue
properties of the MMCs. To assess the influence of the effects of the
distribution of fibers on the fatigue properties of W/Ti-6Al-4V, much
more rigorous studies on this subject are required. Within the limitation
of the present work, it was found that rotary swaging (RS) treatment
gave a better result to the fatigue limit than the die forging (DF) one.
The improvement of fatigue property might be expected when an
adequate HIP process associated with a secondly process such as RS is
developed to overcome with the problems understood by the present
study.
In addition, the polishing process of the fatigue specimen may also
have an affect on the fatigue limit of the MMCs specimen. As shown in
Fig.4.15, the electro-polished specimens’ surface exhibits
W-fiber-extrusion (resulted from the fact that W-fibers were relatively
cathodic with respect to the Ti-6Al-4V matrix in electro-polishing

107
process) and the difference of stress concentration at the interfaces of
W-fibers/matrix may be attributed to the reason why the fatigue limit
of the electro-polished specimens was lower than that of the
mechanically polished ones.
Property of crack propagation by replica method
Based on the results of successive observation of replicas, crack
initiation in HIPa-RS occurs in less than 30% of the fatigue life.
Multi-cracks initiate from micro-voids or porosities and cracks
coalescence were speculated for fatigue crack process according to the
obtained surface observation and SEM fractographs but so far it
unfortunately has been a lack of strongly evident experimental results
for this current discussion due to the limitation of surface observation
method. Successive micrographs in Fig.4.19 illustrate representatively
this discussion.

108
104 105 106 107250
300
350
400
450
500
Stre
ss a
mpl
itude
σa
MPa
Number of cycles to failure Nf
Con.HIPa-RS-0HIPa-RS-6HIPa-RS-9HIPa-RS-12
(a) Mechanically polished materials
105 106 107200
250
300
350
400
450
500
550
Stre
ss a
mpl
itude
σa
MPa
Number of cycles to failure Nf
Con. HIPa-RS-6 HIPa-RS-9 HIPa-RS-12
(b) Electro-polished materials
Fig.4.14 S -N curves according to polishing methods

109
105 106 107200
250
300
350
400
450
500
550
600
650
700
750
Stre
ss a
mpl
itude
σa
MPa
Number of cuycles to failure Nf
ConHIPa-RS-0HIPb-DF-0HIPa-RS-9HIPb-DF-9
Fig.4.16 S -N curves of HIPa-RS HIPb-DF and conditions
50µm
Fig.4.15 Fiber extrusion of electro-polished specimen (HIPa-RS-9 MMC) The extrusion of W fibers may cause stress concentration at their interfaces, it can be considered to the reason of low fatigue limits of electro-polished MMC.

110
?
200µm
A
200µm
(a) Multi initiation crack in HIPa-RS-9 (b) Crack initiates from A point, HIPb-DF-9 200μm
100µm
A B

111
1.5
2
2.5
3
3.5
4
4.5
3 6 9 12 15Volume fraction of W fiber vol%
Fig.4.18 Porosity density for various fiber volume fraction on HIP-RS MMCs

112
4.4 CONCLUSIONS
The testing results on HIP fabricated W/Ti-6Al-4V MMCs have
been reported and discussed. The main results obtained in this test are
follows;
1. W fibers reinforced Ti-6Al-4V matrix composite could be produced
by the HIP process used in this work.
2. The average hardness of diffusion phase between fibers and
Ti-6Al-4V matrix shows a value of about 20-30% higher than that of
the conventional Ti-6Al-4V and also the hardness value increased
with an increase in the volume fraction of tungsten fibers. The
tensile strength of the composite material was about 15% higher
than that of the conventional Ti-6Al-4V. In addition, the highest
value of tensile strength achieved among the MMC is 1520MPa
under the condition of W fiber volume fraction of Vf=9% (secondly
treatment; rotary swaging). 3. The average fatigue strength of HIPb-DF-0 specimen showed
higher values in comparison with those of conventional Ti-6Al-4V
by about 40%.

113
4. Though the static tensile properties and hardness value of MMCs
are superior to those of conventional Ti-6Al-4V alloy, the fatigue
limit of MMCs becomes deteriorated in spite of containing the
W-fiber reinforcement . In addition, fatigue limit of the MMCs
unexpectedly deteriorated. The defects such as clustering of fiber,
micro-cracks and porosity, etc. were considered to be the major
fatigue crack initiation.
5. In the present investigations, the employment of high heating and
cooling rates in the HIP process led to the better property of the
composite. HIPa process is found to be comparatively better than
HIPb for producing W fiber reinforced Ti-6Al-4V alloy MMCs.

114
REFERENCES
[1] Titanium material researchers, Present aspect of Titanium materials
research in Japan, (1989), p.81
[2] H. Kusamichi et al., Titanium and its applications, (1983), p.90
[3] T. Hayashi, The composite material engineering, (1980), pp.1173-1181
[4] M.J. Donachie. Jr., Titanium a Technical Guide, ASM International,
(1988)
[5] P.B. Yoseph, T.H.H. Pian, Journal of composite of materials, 15,
(9181), pp.225-239
[6] M.J. Donachie, Jr., Titanium a technical guide, ASM international,
(1988).
[7] W.F. Smith, Structure and Properties of Engineering Alloys,
McGraw-Hill Book Co., (1994).
[8] R.O. Ritchie, R.H. Dauskardt, B.N. Cox., Fatigue of Advanced
materials, MEPE Ltd, (1991), pp.315-319

115
[9] ASM Databook, Metal Progress, Vol.114, No.1 (1978).
[10] H, Ochiai et al.: Journal of the Japan Society for Composite
Materials, 21(2), (1995), pp.37-46.
[11] T. Yamamura et al., Journal of the Japan society for composite
materials, 17(1), (1991), pp.24-31
[12] A. Vassel et al., Proc. Sixth Word Conf. On Titanium, (1988)
[13] Y. Minoda, Journal of the iron and steel institute of Japan, 775(9),
(1989), pp.363-368
[14] K. Honda et al., Journal of the Japan institute metals, 58(1), (1994),
pp.91-97
[15] S. Nishida et al., Fracture and Strength of Solids, Vol.183(187),
(2000), pp.1243-1248
[16] T. Kimura et al.: Journal of the Japan Society of Mechanical
Engineers, 28(11), (1998), pp.897-901.
[17] Delo et al., Acta mater, Vol 47(11), (1999), pp.3159-3167.

116
[18] R. Watanabe et al., Journal of the Japan institute metals, 28(11),
(1989), pp.893-896
[19] K. Fredrich, Composite materials series 6, Elsevier science pub.,
(1989), pp.492-542
[20] N.J. Pagaro, R.B. Pipes, Journal of composite materials, 5, (1971),
pp.50-57
[21] Y. Imai et al., Journal of the Japan society for composite materials,
18(3), (1993), pp.129-133
[22] Y. Minoda, Journal of the iron and steel institute of Japan, 75-9,
(1989), pp.363-368

117
CHAPTER 5 SUMMARY AND FURTHER STUDY
5.1 SUMMARY
The aim of the present study is to improve the mechanical properties
into various arrangements on Ti-6Al-4V alloy. More manufacturing
engineers are learning that machining these alloys can be a tricky job
due to their unique stable and unstable mechanical properties.
This study attempts to collect the results and data relating to the
titanium metal matrix composite materials and some surface
modifications in order to provide fundamental information on the
current understanding of mechanical properties of Ti-6Al-4V.
Many trials have been carried out in trying to improve the mechanical
properties of Ti-6Al-4V alloy including Ti based MMCs (W/Ti-6Al-4V)
and surface modifications such as plastic deformations by roller
working. In addition, the easy fabrication process and low-cost
treatments, which are plasma flame, DLC (Diamond Like Carbon)
coating and electroless plating can be considered to improve mechanics
properties.
The main results in present investigations are as follows:
Effect of Roller Working on Fatigue Strength of Ti-6Al-4V Alloy
(in chapter 2)
1. The hardness numbers of roller-worked specimens are higher than
those of non-deformed Ti-6Al-4V alloy; the fatigue limit of

118
roller-worked specimens becomes deteriorated in spite of
roller-working. Low work-hardening ratio of Ti-6Al-4V alloy may not
contribute to the improved hardness and residual stress.
2. Fatigue fracture had occurred in the boundary (week part) between
plastic deformed area and non- deformed area where tensile residual
stress exists.
3. The results of the SEM observation, the roller-worked specimen
showed crack initiating from the one point on the surface. It shows
two-step fracture modes, which are ductile fracture mode and brittle
one.
4. The fatigue limit of at the plastic deformed area seemed to be
improved. It is necessary to further study the qualitative analysis of
residual stress at the plastic deformed area.
Fatigue Properties of Surface Treated Ti-6Al-4V Alloy chapter 3)
1. From the hardness results, the plasma B treated specimen showed
highest value than other specimens by about 250 %. The existence of
the surface film improved the surface hardness value, resulting in a
good surface modification effect.
2. DLC-A and DLC-B treated specimens showed higher values than
that of conventional Ti-6Al-4V by about 13% and 10%. Though all
hardness value of present work increased, the fatigue limit improved
only two specimens that are DLC-A, DLC-B coating.
3. The surface roughness condition and balance of strain ratio between

119
modified surface and the inner can be considered for reducing the
fatigue strength of surface modified Ti-6Al-4Valloy specimens.
Roughened surface condition and micro crack which be maid by low
strain ratio on modified surface should be notch effect due to
processing of surface strengthen treatment.
4. The considerations, which are strain ratio and surface roughness,
require for improving fatigue strength on surface modified Ti-6Al-4V
alloy. The improvement of fatigue property of surface modified
Ti-6Al-4V alloy could be expected through a more quantitative process
on surface treatment.
Mechanical Properties of Tungsten Fiber Reinforced Ti-6A1-4V
Alloy by HIP Fabrication (in chapter 4)
1. W fibers reinforced Ti-6Al-4V matrix composite could be produced
by the HIP process used in this work.
2. The average hardness of diffusion phase between fibers and
Ti-6Al-4V matrix shows a value of about 20-30% higher than that of
the conventional Ti-6Al-4V and also the hardness value increased with
an increase in the volume fraction of tungsten fibers. The tensile
strength of the composite material was about 15% higher than that of
the conventional Ti-6Al-4V. In addition, the highest value of tensile
strength achieved among the MMC is 1520MPa under the condition of
W fiber volume fraction of Vf=9% (secondly treatment; rotary
swaging).

120
3. The average fatigue strength of HIPb-DF-0 specimen showed higher
values in comparison with those of conventional Ti-6Al-4V by about
40%.
4. Though the static tensile properties and hardness value of MMCs are
superior to those of conventional Ti-6Al-4V alloy, the fatigue limit of
MMCs becomes deteriorated in spite of containing the W-fiber
reinforcement . In addition, fatigue limit of the MMCs unexpectedly
deteriorated. The defects such as clustering of fiber, micro-cracks and
porosity, etc. were considered to be the major fatigue crack initiation.
5. In the present investigations, the employment of high heating and
cooling rates in the HIP process led to the better property of the
composite. HIPa process is found to be comparatively better than
HIPb for producing W fiber reinforced Ti-6Al-4V alloy MMCs.

121
5.2 Further study
In modern engineering design, fracture occupies a special place
among the multitude of problems dealing with strength. Mechanical
failure has caused many injuries and financial loss. Safety considerations
and design reliability have stimulated an increased interest in
understanding and predicting failure mechanisms. They are becoming
ever more important the ever-increasing complexity of engineering
structural elements.
Ti-6Al-4V alloy is a comparatively new engineering material and it is
currently being considered for structural applications and a
combination of good mechanical performance with low weight and
good resistance to corrosion caused by the aggressive attack of body
fluids. Ti-6Al-4V alloy have been increasingly employed in industry
where specialized properties of materials with extremely high fatigue
limits, tensile strength, stiffness and low coefficient of thermal
expansion, etc. have been demanded.
A study for improving mechanical properties on Ti-6Al-4V has been
beginning; using various fabrication conditions for Ti-based MMCs and
surface modification methods.
The most expectedly next research would be concentrate into
following studies. The improvement of fatigue property of
W/Ti-6Al-4V MMCs might be expected when an adequate HIP process
associated with a secondly process such as RS in this study can be
attained to deal with the problems understood by the present study and

122
also a study about the HIP fabricated Ti-6Al-4V alloy are required. In
addition, the qualitative analysis of residual stress and surface
conditions on strengthen surface are need to be challenged.