


Languages
Pages
Legal

Improved disaster management with
use of Statistics Netherlands data
Master thesis J.T.M. Kuilboer
[email protected] [email protected] The Hague, 28-07-2009

ii
iii
Improved disaster management
with use of demographic data of
Statistics Netherlands
Master thesis
J.T.M. Kuilboer
The Hague, 28-07-2009
Graduation committee:
Prof. dr. ir. Nick van de Giesen, Delft University of Technology;
Dr. ir. Olivier Hoes, Delft University of Technology and Nelen&Schuurmans;
Ir. Rolf Hut, Delft University of Technology and Statistics Netherlands;
Dr. ir. Bas Jonkman, Delft University of Technology and Royal Haskoning;
Drs. Niek van Leeuwen, Statistics Netherlands.

iv
v
Acknowledgements
In order to accomplish this study I have been supported by many persons who I would like
to thank for their support. First I would like to thank Olivier Hoes en Rolf Hut for coming up
with a draft outline for this thesis work and moreover for their guidance during my research.
Also I would like to thank my direct supervisor of Statistics Netherlands Niek van Leeuwen
for his contribution to the content of this thesis as well as his inspiration. Furthermore I
would like to express my graditude to Nick van de Giesen en Bas Jonkman for their
guidance through the gradution committee. Also I would like to thank the following people
each contributing on their own way from model to grammatical input and the many
stakeholder interviews: Marijn Zuurmond, Pieter Breskens, Basjo Poelman, Gelske van
Daelen, Sonny de Wit, Marcel van der Doef, Roeland Hillen, Harry Katstra, Nathalie
Asselman, Matthijs Kok, Arjan Wijdeveld, Erik Mostert, Maarten Alders, Mechiel van
Appeldoorn, Jaap Zeekant, Edward Melger, Anne Leskens, Hilde van Duijn, Eveline Plomp,
Leo Bakker, Marleen Galema, Bas Kolen, Elsbeth Beeke van der Graaf and Arjan Nauta.
Moreover I would express many thanks to Rosa, Eddy and the boys of the Schinkelkade:
Arne, Remco and Rens for their support and advice along the way.

vi
vii
Summary
The Netherlands are formed by a delta area; more than 50% of the country is located below
sea level and in this flood prone area 70% of the gross national income is earned. Since the
big storm in 1953 the Netherlands have been relatively safe against flooding. However
recent international flood disasters, like the Katrina floods in New Orleans 2005, point out
society’s vulnerability to floods and the importance of descent preparedness. A strong
emphasis on flood protection and preparedness has always been present in the Netherlands
throughout history, and it involves a wide range of different stakeholders. Each of these
stakeholders requires specific information depending on the moment in time. However the
information supply to the stakeholders is scattered and differs in form and accuracy. Some
stakeholders make use of flood damage models. This research points out flood disaster
management in the Netherlands shows shortcomings on qualitative and quantitative aspects
regarding the information and models used by its stakeholders. This results in a relatively
poor and inaccurate scenario planning. In order to enhance these shortcomings, the
additional value of the application of Statistics Netherlands (SN) object data within the field
of flood risk management is explored. The additional value of SN object data is pointed out
in a qualitative and a quantitative way through literature study, interviews, data analysis
and a newly developed flood damage model.
Qualitatively the data demands per stakeholder in time regarding their specific tasks
are mapped. The data governed by SN points out to offer great additional value, especially
regarding cultural and environmental damages, public services and demographic data
required for evacuation and emergency aid. Furthermore the newly developed model
enables a dynamic interpretation of data during a flood in time. This model automatically
maps the SN data on a satellite map.
Quantitatively SN offers data coupled to their geographical locations (object data).
This type of data enables a higher level of accuracy than aggregated data, which is
currently used in the Netherlands. The newly developed model points out object data is
40% more accurate for densely populated areas (7 000 residents per km2) up to 360%
more accurate for sparsely populated areas (20 residents per km2). These results are based
on a secondary dike breach in the Bijlmermeerpolder lasting 24 hours.
viii
Index 1 Introduction ............................................................................................. - 3 -
1.1 Motivation.................................................................................................. - 3 - 1.2 Research question ...................................................................................... - 4 - 1.3 Objective ................................................................................................... - 4 - 1.4 Approach ................................................................................................... - 5 - 1.5 Principles ................................................................................................... - 5 - 1.6 Report structure ......................................................................................... - 6 -
2 Flood Damage Processes ......................................................................... - 9 - 3 Flood Damage Characteristics ............................................................... - 13 -
3.1 Type of flood damage ............................................................................... - 13 - 3.2 Spatial level ............................................................................................. - 15 - 3.3 Hydraulic characteristics ............................................................................ - 15 - 3.4 Socio-Economics ...................................................................................... - 15 - 3.5 Damage functions .................................................................................... - 16 - 3.6 Data characteristics .................................................................................. - 17 -
4 Models .................................................................................................... - 21 - 4.1 Selection of models .................................................................................. - 21 - 4.2 Standard Method ...................................................................................... - 24 - 4.3 Improvements.......................................................................................... - 28 -
5 Tasks and information demands of stakeholders ................................. - 33 - 5.1 Safety chain ............................................................................................. - 33 - 5.2 Stakeholder selection ................................................................................ - 34 - 5.3 Concluding Remarks ................................................................................. - 38 -
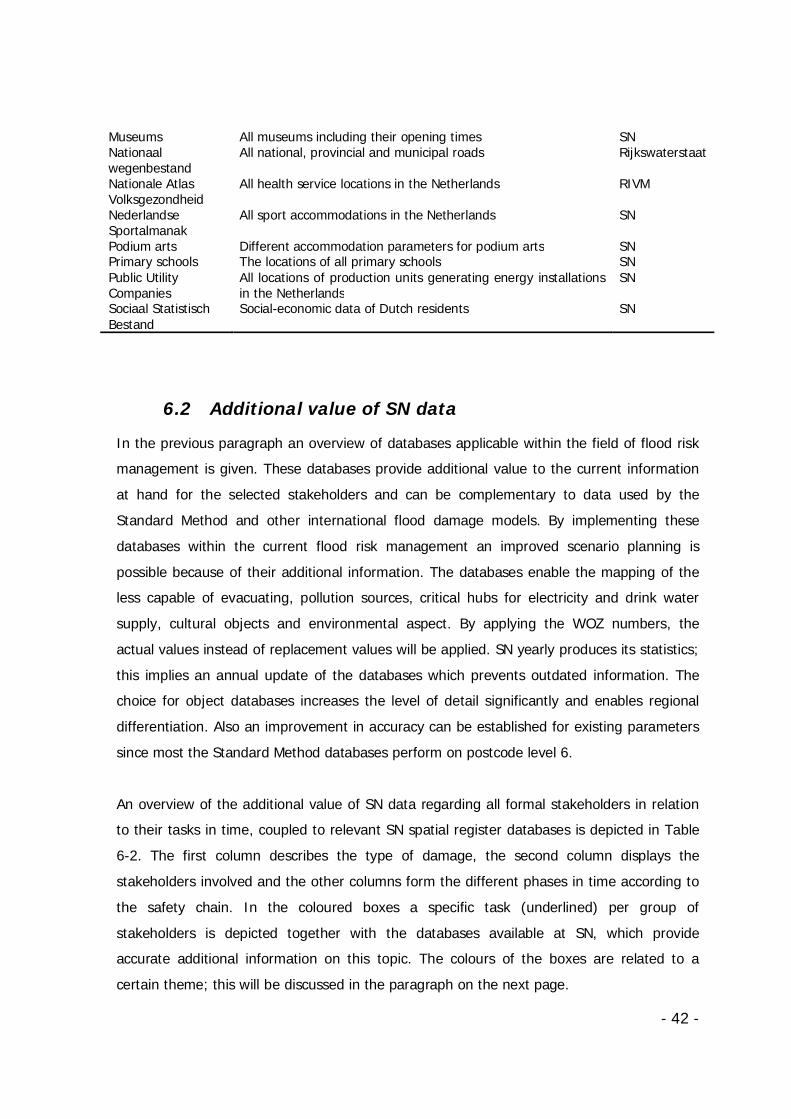
6 Statistics Netherlands Data Overview .................................................. - 41 - 6.1 Databases................................................................................................ - 41 - 6.2 Additional value of SN data ....................................................................... - 42 - 6.3 Thematic maps ........................................................................................ - 44 -
7 Case Study ............................................................................................. - 47 - 7.1. Test-case ................................................................................................. - 47 - 7.2. Model ...................................................................................................... - 51 - 7.3 Results .................................................................................................... - 53 -
8 Reflection ............................................................................................... - 63 - 8.1 Discussion ............................................................................................... - 63 - 8.2 Conclusions.............................................................................................. - 65 - 8.3 Recommendations .................................................................................... - 67 -
9 References ............................................................................................. - 71 - Appendix A Water Damage Processes in detail .................................. - 77 -
Water surplus ..................................................................................................... - 77 - Appendix B Model overview flood damage models ............................ - 79 - Appendix C Stakeholders ..................................................................... - 81 -
Fire brigade ........................................................................................................ - 81 - GHOR ................................................................................................................ - 82 - Government ....................................................................................................... - 83 - Municipality ........................................................................................................ - 86 - Police ................................................................................................................. - 87 -
ix
Regional Operational Team (safety regions) .......................................................... - 88 - Rijkswaterstaat ................................................................................................... - 89 - Water Board ....................................................................................................... - 90 -
Appendix D Databases ......................................................................... - 91 - Adrescoördinaten Nederland ................................................................................ - 91 - Bodembestand 2006 ............................................................................................ - 92 - Dutch Emission Registration ................................................................................. - 93 - Gemeentelijke Basis Administratie ........................................................................ - 94 - Landbouwtelling .................................................................................................. - 94 - Locatus .............................................................................................................. - 95 - Mobility database ................................................................................................ - 96 - Museums ............................................................................................................ - 96 - Nationaal wegenbestand ...................................................................................... - 97 - Nationale Atlas Volksgezondheid........................................................................... - 97 - Nederlandse Sportalmanak .................................................................................. - 97 - Podium arts ........................................................................................................ - 98 - Primary schools ................................................................................................... - 99 - Public Utility Companies ....................................................................................... - 99 - Sociaal Statistisch Bestand ................................................................................... - 99 -
Appendix E Model overview .............................................................. - 101 - SOBEK ............................................................................................................. - 101 - ArcGIS ............................................................................................................. - 103 - Python scripts ................................................................................................... - 111 -
List of figures Figure 2-2: Damage sub-processes for lower parts in the Netherlands (Kok, 2005) ....... - 10 - Figure 2-3: impact failure or overtopping of primary water defence ............................. - 11 - Figure 2-4: impact failure or overtopping of secondary water defence ......................... - 11 - Figure 3-3: Damage calculations based on aggregated data sources ........................... - 18 - Figure 3-4: Damage calculations based on object data sources ................................... - 18 - Figure 4-1: Schematization of Standard Method (Rijkswaterstaat, 2005) ...................... - 25 - Figure 4-2: Mortality function for rapidly rising flood water zone (Jonkman, 2008) ....... - 28 - Figure 4-3: Hazard zoning for loss of life estimation (Jonkman, 2008) ......................... - 28 - Figure 6-1: Themes coupled to specific colors ........................................................... - 44 - Figure 6-2: (Part of) thematic map on evacuation and evacuation aid ......................... - 45 - Figure 7-1: Situation sketch of test case ................................................................... - 50 - Figure 7-2: Model lay-out ........................................................................................ - 52 - Figure 7-3: Potentially affected people in time in a densely populated area .................. - 55 - Figure 7-4: Potentially affected people in time in a sparsely populated area ................. - 55 - Figure 7-5: Data performance after 24 hours, densely populated ................................ - 56 - Figure 7-6: Data performance after 24 hours, sparsely populated ............................... - 56 - Figure 7-7: Contours of flooding depth in time for eastern breach ............................... - 58 - Figure 7-8: Affected household contours cumulative in time for eastern breach............ - 58 - Figure 7-9: Affected elderly contours cumulative in time for eastern breach ................. - 59 - Figure 7-10: Affected non-western immigrant contours in time for eastern breach ....... - 59 - Figure 7-11: Cumulative affected schools in time for eastern breach ........................... - 60 - Figure 7-12: Mapped cumulative affected schools in time for eastern breach ............... - 60 -
x
Figure C-1: Governmental involvement incase of flooding........................................... - 84 - Figure D-1: Coupling addresses to geographical coordinates....................................... - 91 - Figure E-1: overview of SOBEK model of test-area ................................................... - 102 - Figure E-2: Combined flooding extend in time, each colour is a different time step ..... - 104 - Figure E-3: Intersection of flood area with object data ............................................. - 104 - Figure E-4: Address coordinates within test-area ..................................................... - 106 - Figure E-5: P6 polygons; their area depends on the density of the population ............ - 106 - Figure E-6: Intersection of flooded area with P6 polygons ........................................ - 107 - Figure E-7: Overview ArcGIS operations for the qualitative part of the model ............. - 108 - Figure E-8: Overview ArcGIS operations for the quantitative part of the model .......... - 109 - List of tables Table 3-1: Categorization of flood damages with examples (Meyer, 2005) ................... - 14 - Table 4-1: cumulative overview of different damage categories by all models .............. - 30 - Table 4-2: Overview of current and suggested (underlined) damage categories ........... - 31 - Table 5-1: Safety chain with successive links defined (BZ, 1993) ................................ - 34 - Table 6-1: Overview of complementary databases at hand within SN .......................... - 41 - Table 6-2: Overview of available SN data in time, per stakeholders and per theme ....... - 43 - Table B-1: Model overview; blue indicates the presence of a certain criteria ................ - 79 - Table B-2: Parameter overview (in blue if present) .................................................... - 80 - Table C-1: Scenarios determining ministerial actions .................................................. - 85 - Table C-2: Ministerial responsibilities coupled to scenario planning .............................. - 85 -

- 1 -

- 2 -
1 Introduction
- 3 -
1 Introduction Throughout history the Netherlands have fought their battle against the water. The pressure
on the Dutch Delta is increasing due to rising sea levels, an increased discharge from the
rivers, subsidence of the delta and an increasing population density. The struggle to protect
the country against flooding forced engineers throughout the years to come up with
innovative solutions. Internationally known examples within the field of hydraulic
engineering and water management are the dikes, mills, Maesland barrier, Afsluitdijk and
Delta Works. More recent examples are measures taken by “Space for the Rivers”,
“Watertoets” and most recently the advice of the Deltacommission in 2008, each
contributing to better protection against flooding of the Dutch Delta.
The last significant flooding disaster in the Netherlands dates back to 1953 when large parts
of the provinces of Zeeland, South-Holland and Brabant were flooded. But recent
international flood events such as Katrina floods in New Orleans 2005 stress society’s
vulnerability to flooding and the importance of sufficient preparedness disasters. For a large
part this preparedness is dependant on a reliable and complete data overview, which
consists of economic data required for risk assessments but also more “hands-on data” used
by help services. For example, demographic data as schools, hospitals and homes for elderly
to ensure a smooth evacuation management. This master thesis will study the data
management regarding flood risk management in the Netherlands in detail using
geographically based data of Statistics Netherlands (SN). SN is a governmental organisation
responsible for collecting and processing data in the Netherlands in order to publish
statistics to be used in practice, by policymakers and for scientific research.
1.1 Motivation
In order to estimate the impact of a flood disaster, different models are used. Recent
disaster models within the field of water management mainly focuses on direct, tangible
economic flood damages based on a limited amount of parameters. These models are
generally used by a wide range of different stakeholders. Indirect and intangible damages,
required for preparedness, for example demographic data, are under lighted as well as an
overview of the data need per stakeholder at a certain moment in time during a flood.
- 4 -
Furthermore only the final result of a flood disaster is presented by flood damage models,
thus taken into account by its different stakeholders. The characteristics of damage
processes in time are neglected at the moment. Finally flood damage modelling in the
Netherlands is based on geographically aggregated datasets which form a relatively
inaccurate estimation of the actual flood damages. Recapitalising, flood disaster
management in the Netherlands shows shortcomings on qualitative and quantitative aspects
resulting in a poor and inaccurate scenario planning. SN governs a wide range of applicable
datasets with geographically based data points (object data) which are not used within the
Dutch flood risk management at the moment, but offer great potential to form an addition
to its shortcomings.
1.2 Research question
This master thesis will focus on the research question below, which can be divided into four
sub-questions. The research question is stated as follows:
How can SN object data1 form an additional value2 in the field of flood risk
management3, and in what way can this be modeled4?
Four elements are described above: (1) SN object data, (2) additional value, (3) flood risk
management and (4) model. Each of these elements is related to its own sub-question:
1. What relevant SN object data is at hand?
2. Which stakeholder requires what information at what moment in time?
3. What is the present knowledge on flood damage modeling and what are the
opportunities?
4. How to design a sound coupling between SN data and flood damage data?
1.3 Objective
The objective of this master thesis is to enhance and elaborate the current flood risk
management in the Netherlands in a qualitative and quantitative manner. This will be
- 5 -
achieved by establishing a more elaborate, tailor-made scenario planning per stakeholder,
providing insight in flood damage characteristics in time and improving the current accuracy
of the current flood damage modelling in the Netherlands by using SN data. Within this
study special attention will be paid to demographic object databases of SN.
1.4 Approach
Through literature study, modelling, data analysis and stakeholder interviews this thesis will
present an overview of the data required in time by different stakeholders and explore the
additional value of SN data with respect to present knowledge lacunas. The qualitative and
quantitative performance of current datasets in relation to SN data will be presented
together with a newly developed flood damage model which enables a geographical
interpretation of demographic SN data in time. Based on a test-case this model will be
evaluated.
1.5 Principles
SN object data can be applied to different sorts of planning; this research is limited to flood
disasters only. Since SN is bounded to the Netherlands, the focus will be on the Dutch flood
risk management and the application of the model is bounded to the Netherlands. This
study tries to improve the accuracy of the current situation, therefore only SN object data
will be used. Aggregated databases of SN are not in the scope of this study. Furthermore an
elaboration on the data use within the current flood risk management in the Netherlands
will be studied; this study will not focus on economic models into detail but tries to address
a wider scope of different applications. Aspects as flood damage curves are not included
within the model. Moreover the model will study the direct damage impact in time for a time
span of 24 hours, indirect damages will not be included in the model. The highest possible
level of detail will be used to achieve the highest possible level of accuracy.
- 6 -
1.6 Report structure
This report will first provide an outline of the field of flood risk management by pointing out
the processes of flood damages in the Netherlands (2). Then the characteristics of flood
damages will be discussed in detail (3). In order to map the international field of flood
damage models, subsequently the international field of flood damage models is studied (4)
with special attention for the method used in the Netherlands. At the end the characteristics
of the different models will be reflected on the flood damage characteristics of chapter 3 in
order to point out challenges for additional research and elaboration in 4.3. Thereafter the
formal stakeholders involved in the field of flood risk management are studied (5). This
chapter will provide insight in respectively their role and the data they require in time and
point out improvements for future data use (5.3). Then the object data offer of SN and its
additional value within the field of flood risk management will be discussed (6). This will
result in a new overview pointing out which stakeholder requires what information at a
certain moment in time. At the end of this chapter also the spatial advantages of SN data
will be discussed by a thematic map on evacuations (6.3). Furthermore a case study will be
conducted to point out the qualitative and quantitative advantages of SN data through a
newly developed model (7). In this test case the Bijlmermeer polder will be flooded for two
different scenarios to point out the quantitative advantages of SN data. Regarding the
qualitative advantages this model enables the interpretation of SN in time through real-time
scenarios which are also included in the CD-ROM enclosed with this report. This report ends
with a reflection addressing the conclusions and recommendations (8).

- 7 -
- 8 -
2 Flood Damage Processes
- 9 -
2 Flood Damage Processes
A tragic but striking example of flood damages are the Katrina floods in New Orleans 2005,
which caused enormous damages to the city and its surroundings. Several events ranging
from flooding due to constructional failure of flood protection, overtopping, heavy rainfall,
defect pumps and pollution due to broken pipelines of the oil industry culminated into one
big disaster. The total damage was calculated at 81,2 billion dollars in 2005, making Katrina
the costliest hurricane in the U.S. history (Knabb, 2005). Other well-known examples are
the Tsunami disaster in 2004 and the big storm in the Netherlands in 1953. Both also
caused tremendous amounts of damages and fatalities. But water surplus damages are also
present on smaller scale levels for example in case of overloaded sewer systems or high
ground water levels. This chapter will discuss water surplus processes with a special focus
on its sub-processes of flood damages. Below the conception of water surplus will be
unraveled into different sub-processes.
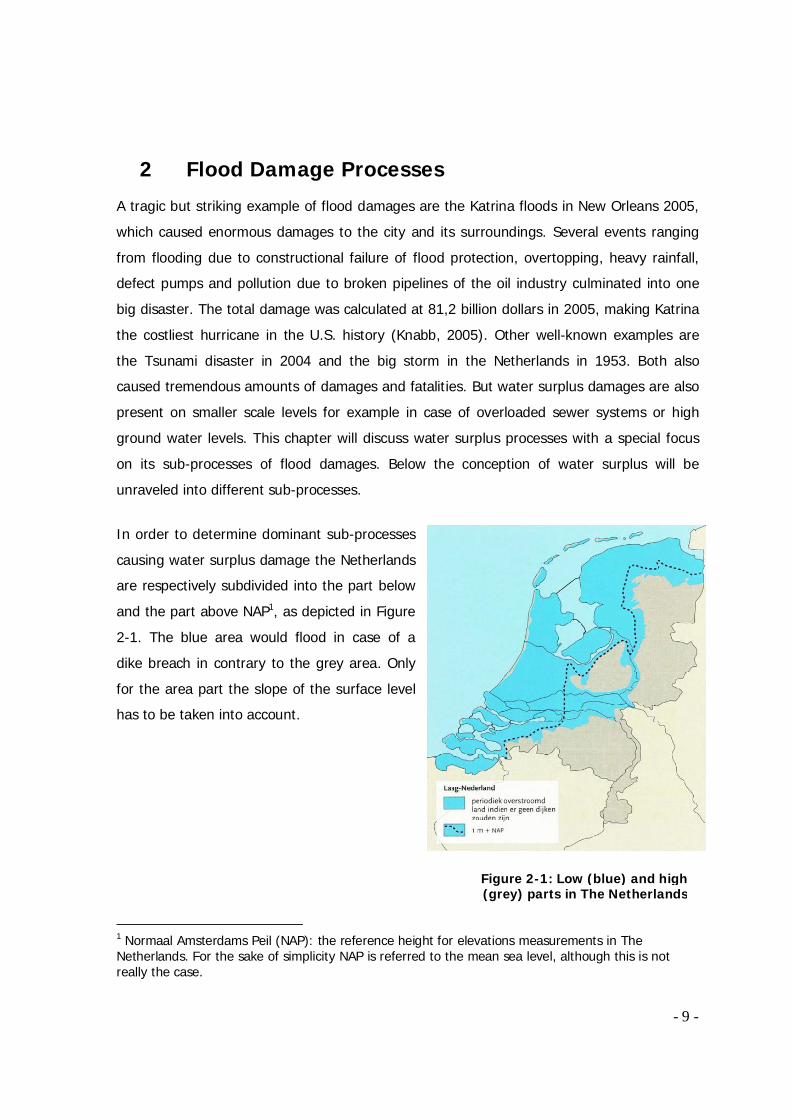
In order to determine dominant sub-processes
causing water surplus damage the Netherlands
are respectively subdivided into the part below
and the part above NAP1, as depicted in Figure
2-1. The blue area would flood in case of a
dike breach in contrary to the grey area. Only
for the area part the slope of the surface level
has to be taken into account.
1 Normaal Amsterdams Peil (NAP): the reference height for elevations measurements in The Netherlands. For the sake of simplicity NAP is referred to the mean sea level, although this is not really the case.
Figure 2-1: Low (blue) and high (grey) parts in The Netherlands
- 10 -
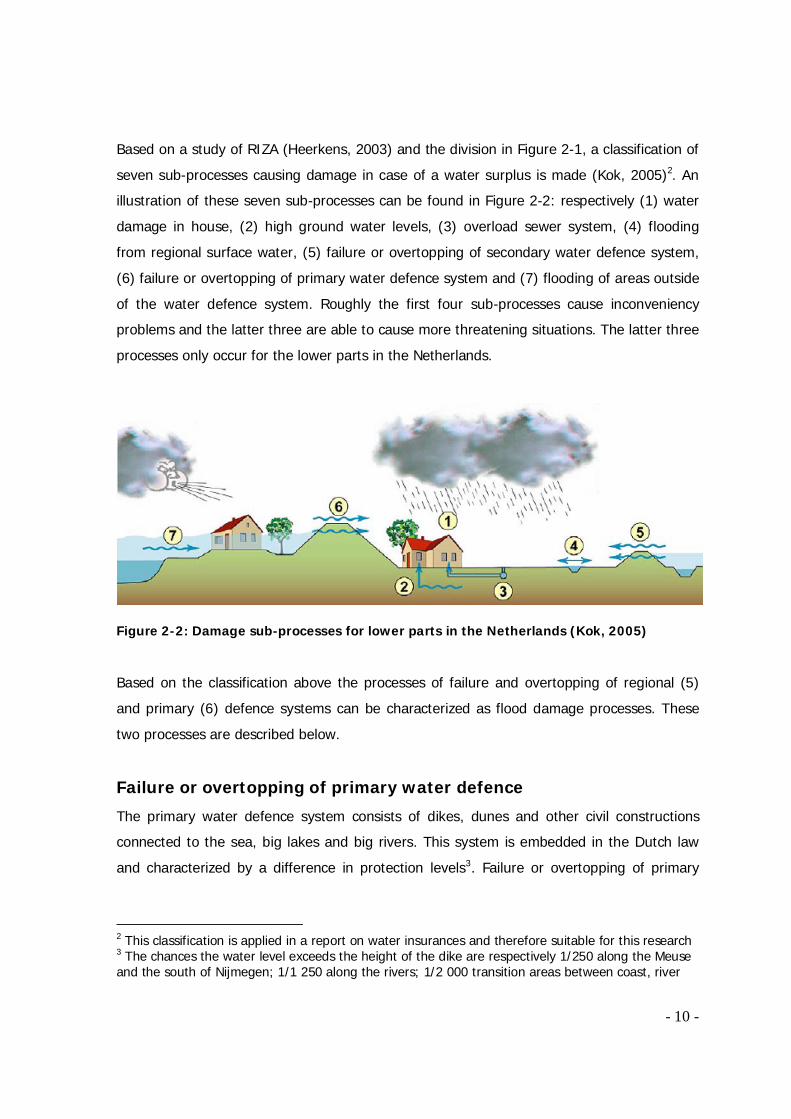
Based on a study of RIZA (Heerkens, 2003) and the division in Figure 2-1, a classification of
seven sub-processes causing damage in case of a water surplus is made (Kok, 2005)2. An
illustration of these seven sub-processes can be found in Figure 2-2: respectively (1) water
damage in house, (2) high ground water levels, (3) overload sewer system, (4) flooding
from regional surface water, (5) failure or overtopping of secondary water defence system,
(6) failure or overtopping of primary water defence system and (7) flooding of areas outside
of the water defence system. Roughly the first four sub-processes cause inconveniency
problems and the latter three are able to cause more threatening situations. The latter three
processes only occur for the lower parts in the Netherlands.
Figure 2-2: Damage sub-processes for lower parts in the Netherlands (Kok, 2005)
Based on the classification above the processes of failure and overtopping of regional (5)
and primary (6) defence systems can be characterized as flood damage processes. These
two processes are described below.
Failure or overtopping of primary water defence
The primary water defence system consists of dikes, dunes and other civil constructions
connected to the sea, big lakes and big rivers. This system is embedded in the Dutch law
and characterized by a difference in protection levels3. Failure or overtopping of primary
2 This classification is applied in a report on water insurances and therefore suitable for this research 3 The chances the water level exceeds the height of the dike are respectively 1/250 along the Meuse and the south of Nijmegen; 1/1 250 along the rivers; 1/2 000 transition areas between coast, river
- 11 -
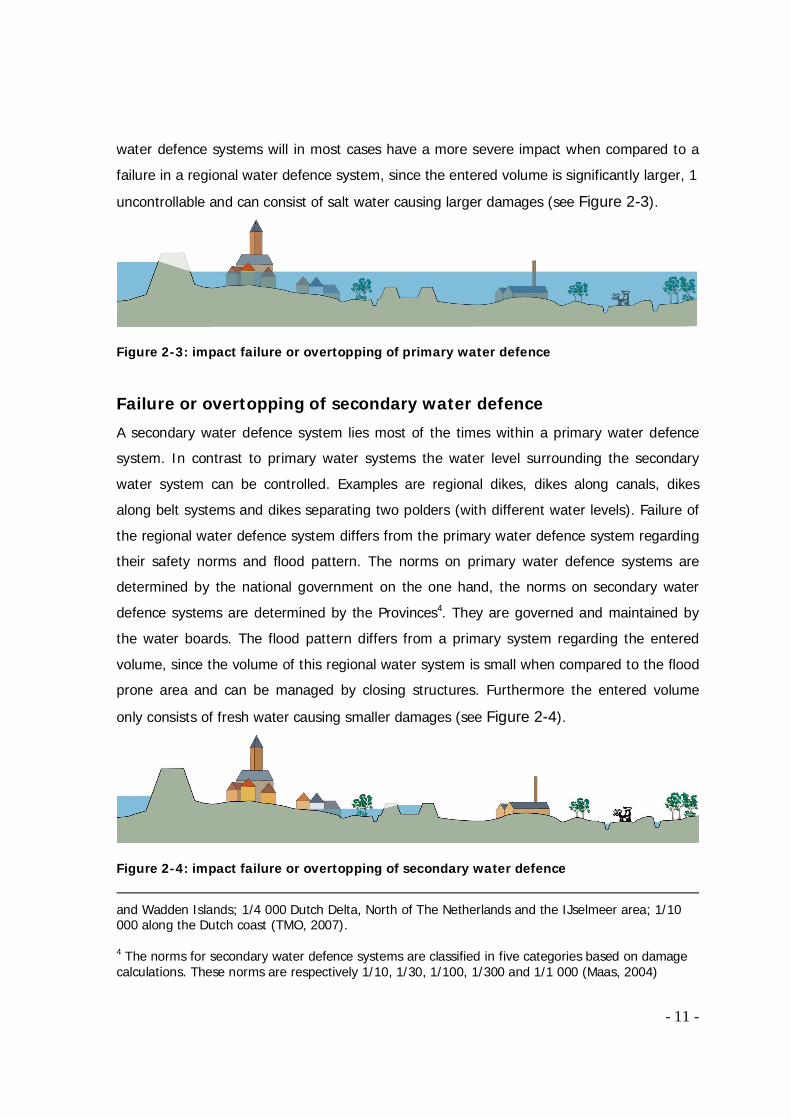
water defence systems will in most cases have a more severe impact when compared to a
failure in a regional water defence system, since the entered volume is significantly larger, 1
uncontrollable and can consist of salt water causing larger damages (see Figure 2-3).
Figure 2-3: impact failure or overtopping of primary water defence
Failure or overtopping of secondary water defence
A secondary water defence system lies most of the times within a primary water defence
system. In contrast to primary water systems the water level surrounding the secondary
water system can be controlled. Examples are regional dikes, dikes along canals, dikes
along belt systems and dikes separating two polders (with different water levels). Failure of
the regional water defence system differs from the primary water defence system regarding
their safety norms and flood pattern. The norms on primary water defence systems are
determined by the national government on the one hand, the norms on secondary water
defence systems are determined by the Provinces4. They are governed and maintained by
the water boards. The flood pattern differs from a primary system regarding the entered
volume, since the volume of this regional water system is small when compared to the flood
prone area and can be managed by closing structures. Furthermore the entered volume
only consists of fresh water causing smaller damages (see Figure 2-4).
Figure 2-4: impact failure or overtopping of secondary water defence
and Wadden Islands; 1/4 000 Dutch Delta, North of The Netherlands and the IJselmeer area; 1/10 000 along the Dutch coast (TMO, 2007). 4 The norms for secondary water defence systems are classified in five categories based on damage calculations. These norms are respectively 1/10, 1/30, 1/100, 1/300 and 1/1 000 (Maas, 2004)
- 12 -
3 Flood Damage Characteristics
- 13 -
3 Flood Damage Characteristics
In the field of water damages flood damages have the most severe impacts on their
surroundings. Floods relate to many societal aspects and can be discriminated in different
forms and their impacts can be modeled with different methods (Meyer, 2005). This chapter
will address (1) type of damage, (2) spatial level, (3) hydraulic characteristics, (4) socio-
economics, (5) flood determination approaches and (6) land-use data. It will serve as an
overview of the most important flood characteristics and approaches of modeling regarding
the scope of this study. In the next chapter these characteristics will function as a set of
criteria in order to compare different flood damage models.
3.1 Type of flood damage
Flood damage has a broad meaning and encompasses a wide range of harmful effects on
humans, their belongings, their health, economics, industries, ecological systems, cultural
heritage, recreation, livestock and more. Floods are mostly categorized by (in)direct and
(in)tangible damages (Smith, 1998; Parker, 2000; Penning-Rowsell, 2005; Messner, 2007).
(In) direct damages
Direct flood damage covers all varieties of harm, which relate to the immediate physical
contact of flood water with humans, property and the environment. Examples are loss of
human life, crops and livestock and damage to economic assets, ecological goods and
buildings. All extra damages which are not caused by immediate physical contact of water
are called indirect damages. It contains damages caused by the disruption of physical and
economic linkages of the economy, extra costs for emergency and actions taken to prevent
flood damages. Examples are loss of production by companies, induced production losses to
their suppliers and customers, costs of traffic disruption or the costs of emergency services.
Most economic processes are interlinked and four broad types of flows are distinguished
(Ranis, 1990), generating a higher-order impacts called multiplier effects (Parker, 2000).
Depending on the size of the flood extend in relation to the area of interest these effects
can increase the total amount of damage significantly.
- 14 -
Direct damages are usually measured as damage to stock values and indirect damages as
loss of flow values. Stock values refer to a value of an asset at a certain point in time, while
flow values refer to a total amount of transactions during a certain period (Jensen, 1994).
(In) tangible damages
Tangible damages are those damages which can be specified in monetary terms. Examples
are damage to assets and loss of production. Intangible damages are those damages which
cannot or hardly be specified in monetary terms. Examples are loss of human life, health
effects and damage to ecology.
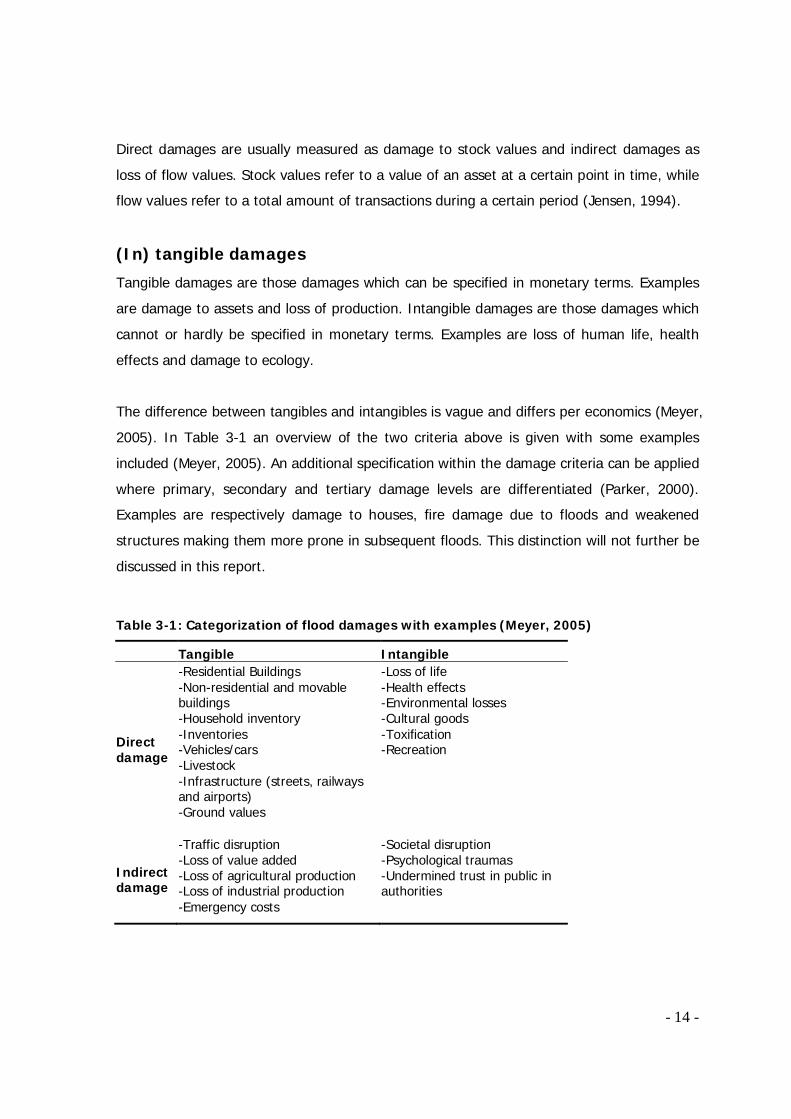
The difference between tangibles and intangibles is vague and differs per economics (Meyer,
2005). In Table 3-1 an overview of the two criteria above is given with some examples
included (Meyer, 2005). An additional specification within the damage criteria can be applied
where primary, secondary and tertiary damage levels are differentiated (Parker, 2000).
Examples are respectively damage to houses, fire damage due to floods and weakened
structures making them more prone in subsequent floods. This distinction will not further be
discussed in this report.
Table 3-1: Categorization of flood damages with examples (Meyer, 2005)
Tangible Intangible
Direct damage
-Residential Buildings -Non-residential and movable buildings -Household inventory -Inventories -Vehicles/cars -Livestock -Infrastructure (streets, railways and airports) -Ground values
-Loss of life -Health effects -Environmental losses -Cultural goods -Toxification -Recreation
Indirect damage
-Traffic disruption -Loss of value added -Loss of agricultural production -Loss of industrial production -Emergency costs
-Societal disruption -Psychological traumas -Undermined trust in public in authorities
- 15 -
3.2 Spatial level
Flood damage assessments display an important difference in spatial level. The choice of an
appropriate spatial level depends on the unit size of the area under investigation and its
spatial homogeneity, the demands on precision (amount of damage classifications) and the
required amount of resources. In practice three different scale levels are used: macro, meso
and micro-scale determining the level of detail.
3.3 Hydraulic characteristics
In order to make a flood damage assessment, hydraulic parameters are required. The
parameters are: area, depth, flow velocity, rise velocity and duration (Messner, 2007).
Lower detailed models, like the Rhine Atlas, only use a combination of area and depth.
There are also models which use a more elaborate set of parameters.
Hydraulic parameters are mainly used for damage functions (see 3.5), where depth-damage
is the most commonly used ratio. Combinations of different hydraulic characteristics are also
possible. For example a combination of depth, flow velocity and rise velocity can be
integrated in a depth-mortality function (Jonkman, 2008). Or a combination of depth and
duration can integrated in a depth-damage function on agriculture (Dutta, 2003)
3.4 Socio-Economics
Socio-economics cover the social and economic aspects per household and their
interrelation. Examples are nationality, income and composition per household. Social
aspects are often under lighted these but are important to take into account. Since
expressing flood damages in only monetary terms can, for example, lead to the
disadvantage of preferential treatment of rich people. Because according to a strict cost-
benefit approach the poorer people are the less valuable their property has, and therefore
the benefit to protect them is comparably low (Richardson, 2005). Furthermore the
composition of households is of relevance for help services, for example the police, in case
of evacuation.
- 16 -
Relative damage function
0
20
40
60
80
100
1 2 3 4 5
Inundation depth [m]
Rela
tive
dam
age
[%]
Absolute damage function
0
500000
1000000
1500000
2000000
1 2 3 4 5
Inundation depth [m]
Abso
lute
dam
age
[$]
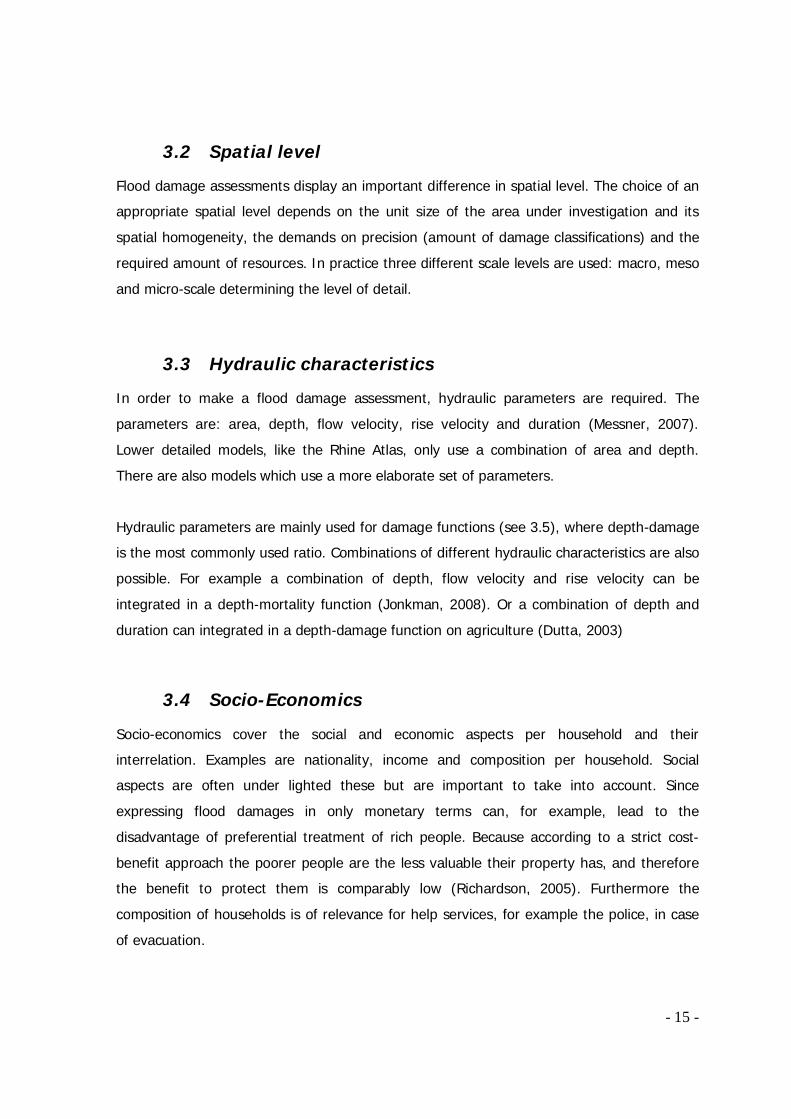
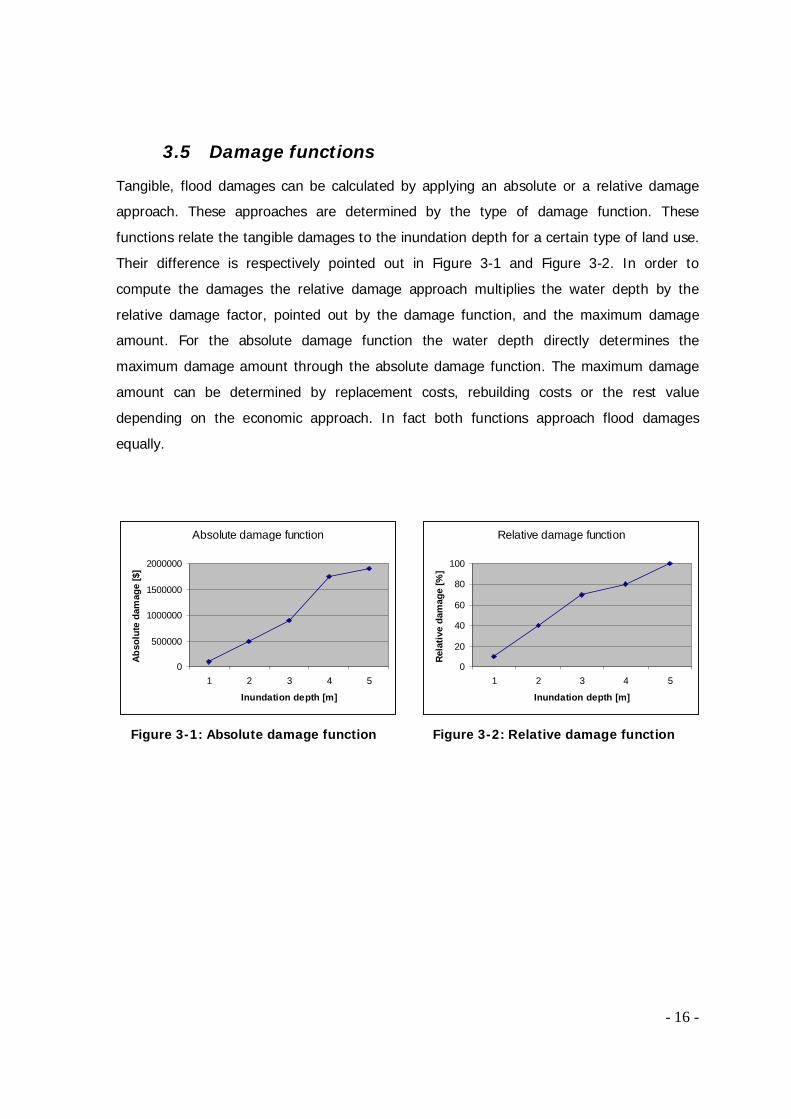
3.5 Damage functions
Tangible, flood damages can be calculated by applying an absolute or a relative damage
approach. These approaches are determined by the type of damage function. These
functions relate the tangible damages to the inundation depth for a certain type of land use.
Their difference is respectively pointed out in Figure 3-1 and Figure 3-2. In order to
compute the damages the relative damage approach multiplies the water depth by the
relative damage factor, pointed out by the damage function, and the maximum damage
amount. For the absolute damage function the water depth directly determines the
maximum damage amount through the absolute damage function. The maximum damage
amount can be determined by replacement costs, rebuilding costs or the rest value
depending on the economic approach. In fact both functions approach flood damages
equally.
Figure 3-2: Relative damage function Figure 3-1: Absolute damage function
- 17 -
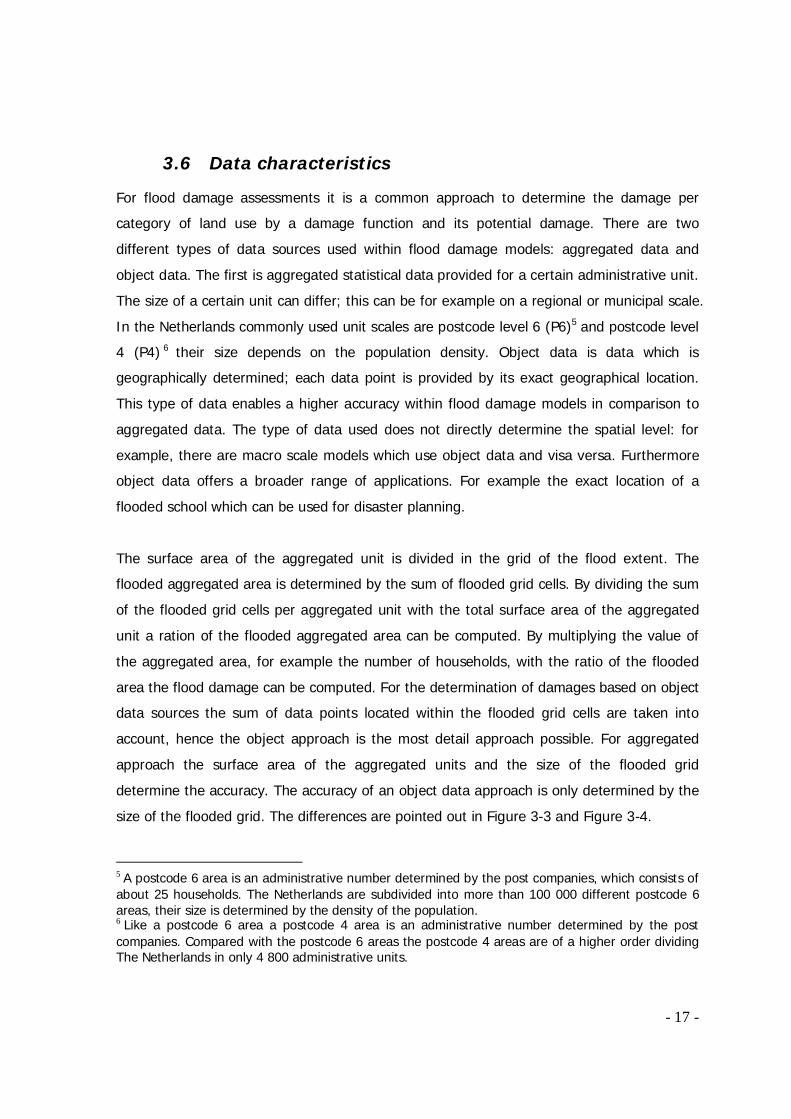
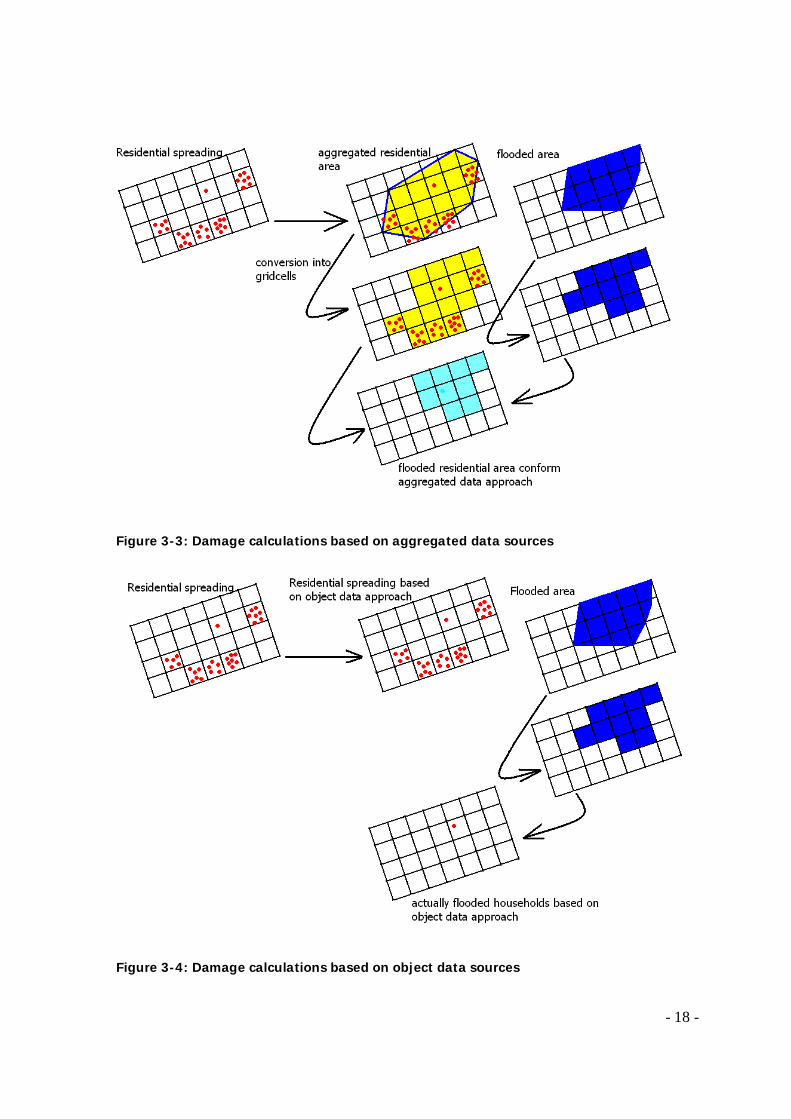
3.6 Data characteristics
For flood damage assessments it is a common approach to determine the damage per
category of land use by a damage function and its potential damage. There are two
different types of data sources used within flood damage models: aggregated data and
object data. The first is aggregated statistical data provided for a certain administrative unit.
The size of a certain unit can differ; this can be for example on a regional or municipal scale.
In the Netherlands commonly used unit scales are postcode level 6 (P6)5 and postcode level
4 (P4) 6 their size depends on the population density. Object data is data which is
geographically determined; each data point is provided by its exact geographical location.
This type of data enables a higher accuracy within flood damage models in comparison to
aggregated data. The type of data used does not directly determine the spatial level: for
example, there are macro scale models which use object data and visa versa. Furthermore
object data offers a broader range of applications. For example the exact location of a
flooded school which can be used for disaster planning.
The surface area of the aggregated unit is divided in the grid of the flood extent. The
flooded aggregated area is determined by the sum of flooded grid cells. By dividing the sum
of the flooded grid cells per aggregated unit with the total surface area of the aggregated
unit a ration of the flooded aggregated area can be computed. By multiplying the value of
the aggregated area, for example the number of households, with the ratio of the flooded
area the flood damage can be computed. For the determination of damages based on object
data sources the sum of data points located within the flooded grid cells are taken into
account, hence the object approach is the most detail approach possible. For aggregated
approach the surface area of the aggregated units and the size of the flooded grid
determine the accuracy. The accuracy of an object data approach is only determined by the
size of the flooded grid. The differences are pointed out in Figure 3-3 and Figure 3-4.
5 A postcode 6 area is an administrative number determined by the post companies, which consists of about 25 households. The Netherlands are subdivided into more than 100 000 different postcode 6 areas, their size is determined by the density of the population. 6 Like a postcode 6 area a postcode 4 area is an administrative number determined by the post companies. Compared with the postcode 6 areas the postcode 4 areas are of a higher order dividing The Netherlands in only 4 800 administrative units.
- 18 -
Figure 3-3: Damage calculations based on aggregated data sources
Figure 3-4: Damage calculations based on object data sources

- 19 -

- 20 -
4 Flood damage models
- 21 -
4 Models
This chapter will provide an overview of the international field of flood damage models
providing insight in the characteristics of different models, the incorporated knowledge and
the challenges they face. In the first paragraph the different internationally used models will
be briefly discussed. To point out the mechanism of flood damage models the method
currently used in the Netherlands will be studied more into detail (4.2). The last paragraph
will discuss the limitations of different models in order to come up with a focus for additional
research on which will be elaborated in this study.
4.1 Selection of models
For this analysis 14 different operational models are selected. This selection aims to cover
the full international spectrum of flood damage models and to touch up on the variety of the
different flood damage characteristics as discussed in the previous chapter. The models are
applied in respectively The Czech Republic (1), Germany (2, 3, 4, 5, 6), the Netherlands (7,
8, 9), The United Kingdom (10, 11, 12, 13) and The United States (14). Below a brief
description of the models in time per country is given, in Appendix B a graphical overview is
given of the knowledge covered by these models. The insight in these models will function
as a starting point for the positioning of SN data within the field of flood risk management.
1. Czech Method 3
This method (Čihek F, 2005) forms part of 3 identical methods for the determination of
flood damage: Czech Method 1,2 and 3. The difference lies in their different scale levels.
The third method is the most detailed approach; it is suitable for damage assessments on a
local scale. Site surveys are therefore required.
2. Rhine Atlas
The Rhine Atlas is part of the action plan “High water for the Rhine” and forms and
elaboration on the Rhine Atlas published in 1998. It gives a cartographic overview of
important areas vulnerable to flooding and important ecological areas in the Rhine
catchments area.
- 22 -
3. German Meso Scale Approaches
There are different meso scale approaches in Germany (Colijn, 2000) the one used for this
report is developed by Ministeriums für Umwelt, Raumordnung und Landwirtschaft des
Landes Nordrhein-Westfalen (MURL, 2000). This method is developed to inform the public
and other politicians about the risks of flooding of the River Rhine in Nordrhein-Westfalen in
order to justify expenses and funding for flood protection (Meyer, 2005).
4. Danube model
This model focuses on the flood prone area of the River Donau (ProAqua, 2001) in Baden-
Wuerttemberg and computes the impacts of flooding on this area. It is also developed to
get insight on the impact of a retention basin on the surrounding municipalities. It
elaborates on the older German Meso scale approaches and contains a higher level of detail
in comparison with the previous German flood damage models.
5. MERK
The German Federal Department of Coastal Defence had assigned for the project "micro-
scale risk evaluation of the flood prone areas" (MERK) (Reese, 2003). Goal of the project is
to obtain a detailed acquisition of all elements at risk along the German coast. For the
project an intensive data acquisition on buildings in the test area has been conducted, more
than 50 buildings have been differentiated.
6. DWA approach
This is a detailed approach to determine flood damage, developed by the German
Department of Water Affairs (DWA) (Buck, 2006). It uses flood-damage functions based on
on-site investigations of residential and non-residential properties, creating a regional
specific character.
7. BOREAS
This water quality model is developed by Dutch Ministry of Transportation and Water
Management (Higler, 2002). With this model it is possible to model the regional dispersion
- 23 -
and advection of toxic materials in case of flooding; it ranges from the use up to the
ecological effects. These effects can eventually be determined in costs.
8. Standard Method
This method is developed for Rijkswaterstaat, part of the Dutch Ministry of Transportation
and Water Management (Kok, 2004). This method is the standard in the Netherlands for
calculating flooding damage and the affected people. The Standard Method will be
elaborated more into detail in the next paragraph.
9. OMEGA
OMEGA (Wijdeveld, 2007) is a model framework in which ecotoxicological stress levels, due
to flooding, in the water phase can be predicted. The model includes insights in the
combination between toxic risks of different toxicants. OMEGA is an operational model, as
all models already described, but needs to be updated thoroughly. This process will start at
the end of 2009 where the focus will be on the integration with hydraulic models (Wijdeveld,
2009).
10. NAAR
National Appraisal of Assets at Risk (NAAR) (DEFRA, 2001) from Flooding and Coastal
Erosion is commissioned by The Department of Environment in the United Kingdom, Food
and Rural Affairs. It gives a global overview of assets at risk in the United Kingdom. It also
includes the potential impact of climate change.
11. RASP
The Risk Assessment of Flood and Coastal Defence Systems (Sayers P., 2002) is an
improvement of the NAAR. It is a probabilistic model for the functioning of a flood defence
system. Damage calculations form a part of this assessment but it is not the main goal of
this model.
- 24 -
12. MDSF
The Modeling and Decision Support Framework (DEFRA, 2004) is developed to facilitate the
production of Catchment Flood Management Plans in the United Kingdom. It mainly focuses
on the social and economical impacts of flooding.
13. MCM
The Multi Colored Manual (Penning-Rowsell, 2005) is used as flood damage mapping tool in
the United Kingdom based on data of the Flood Hazard Research Centre (FHRC, 2004). Up
to 100 residential and up to about 50 non-residential properties types can be distinguished
with the MCM. It contains 120 damage functions and a broad range of hydraulic
characteristics making it a very detailed tool.
14. HAZUS-MH
The Federal Emergency Management Agency (FEMA, 2006) in the USA has developed the
U.S. Multi-Hazard Flood Model. One of the modules computes damages this is called HAZUS.
This component contains a large set of damage functions and computes flood damages on
different scale levels.
4.2 Standard Method
The previous paragraph presents an outline of the different flood damage models and their
characteristics. This paragraph will provide a better insight in the mechanism of flood
damage models. Therefore the Standard Method (Kok, 2004) will be studied more into detail.
Since the Standard method applies to the Dutch situation, and this study tries to enhance
and elaborate the current flood risk management in the Netherlands. It is one of the most
comprehensive models within the field of flood damage models.
The Standard Method calculates flood damage for a flooded area or even a larger affected
area like a province. Within these areas respectively direct and indirect tangible damages
and direct intangible damages are computed, with a strong focus on the direct tangible
damages. These three elements will be discussed in the sub-paragraphs below providing
insight in the construction of this specific model and determine elements of additional study

- 25 -
for the Dutch flood damage assessments methods as discussed in 4.3. Starting point for any
flood damage calculation is geographical information covering the identified area affected by
a hazard, and the asset categories in each unit of this area (Jonkman, 2007). Within the
Standard Method the different datasets are related through spatial components.
Direct, tangible damages
The focus of the Standard Method lies within direct damages, these cover 99% of the total
damage calculations (Morselt, 2006). Three elements are required in the process of
computing flood damages: flood characteristics, land use information and stage-damage
functions which are related through their geographical component. The procedure for the
calculations on direct damages is visualized in Figure 4-1.
Figure 4-1: Schematization of Standard Method (Rijkswaterstaat, 2005)
Floods are simulated with the hydrodynamic model SOBEK 1D-2D (Deltares, 2006). This
model computes hydraulic characteristics such as: flow velocity, rise velocity, inundation
depth and the extent of the flood area. Most important parameter for the direct damage is
the inundation depth as stressed in 3.3. Regarding the land use a distinction of five main
categories of assets at risk is made: general land use, infrastructure, households, companies
and others (i.e. public facilities). These damage categories are divided into different sub
categories. The maximum direct damage amount is computed with the help of 7 different
databases, based on different land use categories (Kok, 2004). In contrary to other
European countries as Germany, the United Kingdom and Czech the Standard Method is not
- 26 -
familiar with an object orientated approach. The Standard Method focuses on a meso scale
approach, which uses aggregated data for the determination of damages to properties and
companies; the most accurate database is based on a P6 scale level. A relative stage
damage function couples the land use data and inundation depth in order to compute the
flood damage. Each land use category has its own specific stage damage function coupled
to a maximum damage amount. These damage functions are derived based on empirical
flood damages from the past, as the flooding of the Netherlands in 1953. The example in
Figure 4-1 shows that at an inundation depth of 4 meters the direct damage is maximal.
Combining land use data, inundations depths and relative damage functions the direct,
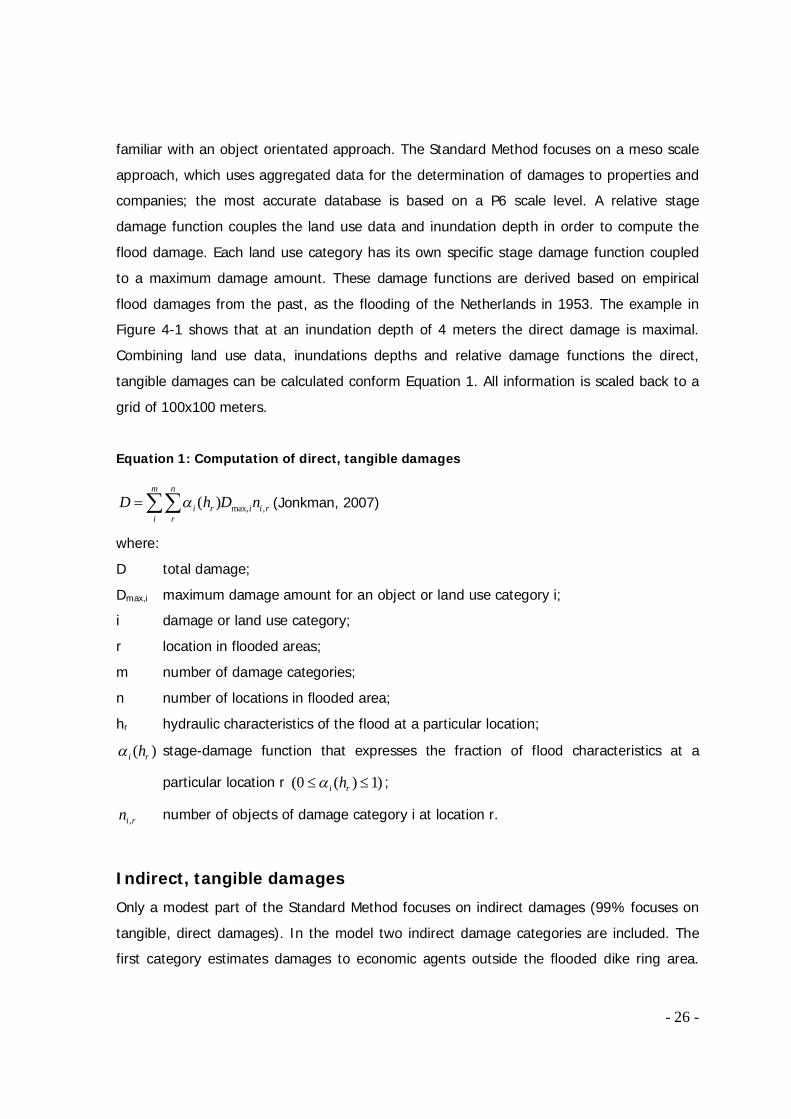
tangible damages can be calculated conform Equation 1. All information is scaled back to a
grid of 100x100 meters.
Equation 1: Computation of direct, tangible damages
max, ,( )m n
i r i i ri r
D h D n (Jonkman, 2007)
where:
D total damage;
Dmax,i maximum damage amount for an object or land use category i;
i damage or land use category;
r location in flooded areas;
m number of damage categories;
n number of locations in flooded area;
hr hydraulic characteristics of the flood at a particular location;
( )i rh stage-damage function that expresses the fraction of flood characteristics at a
particular location r (0 ( ) 1)i rh ;
,i rn number of objects of damage category i at location r.
Indirect, tangible damages
Only a modest part of the Standard Method focuses on indirect damages (99% focuses on
tangible, direct damages). In the model two indirect damage categories are included. The
first category estimates damages to economic agents outside the flooded dike ring area.
- 27 -
These agents are linked on a supplying or consuming basis with affected agents within the
flooded dike ring area. Secondly indirect damages for companies within the dike ring area
are computed by estimating the additional value per employee or by multiplying a certain
land use area with a specific multiplier. This multiplier is computed with an input/output
model (Jonkman, 2007). These input/output models are complex economic models and the
multiplier can easily be overestimated, as rule of thumb a reduction factor of 0,25 for
indirect damages is included in the model (Kok, 2004).
Direct, intangible damages
Within the Standard Method only loss of life is included as an direct, intangible damage
parameter. Modeling of loss of life obeys to the same procedure as modeling of direct,
tangible damages. With the difference that loss of life is expressed in numbers of casualties
instead of monetary terms. Three elements are required for the estimation of loss of life:
information regarding the flood characteristic, analysis of the exposed population and
evacuation possibilities and an estimate of mortality among the exposed population
(Jonkman, 2008). Information regarding floods is obtained by the results of hydrodynamic
modeling. The exposed population is formed by the difference of the number of inhabitants
of a certain area minus the number of inhabitants able to flee (evacuate or find shelter)
before the flood. The mortality rate is the result of the division of the number of inhabitants
killed divided by the total number of inhabitants. This rate is described by a mortality
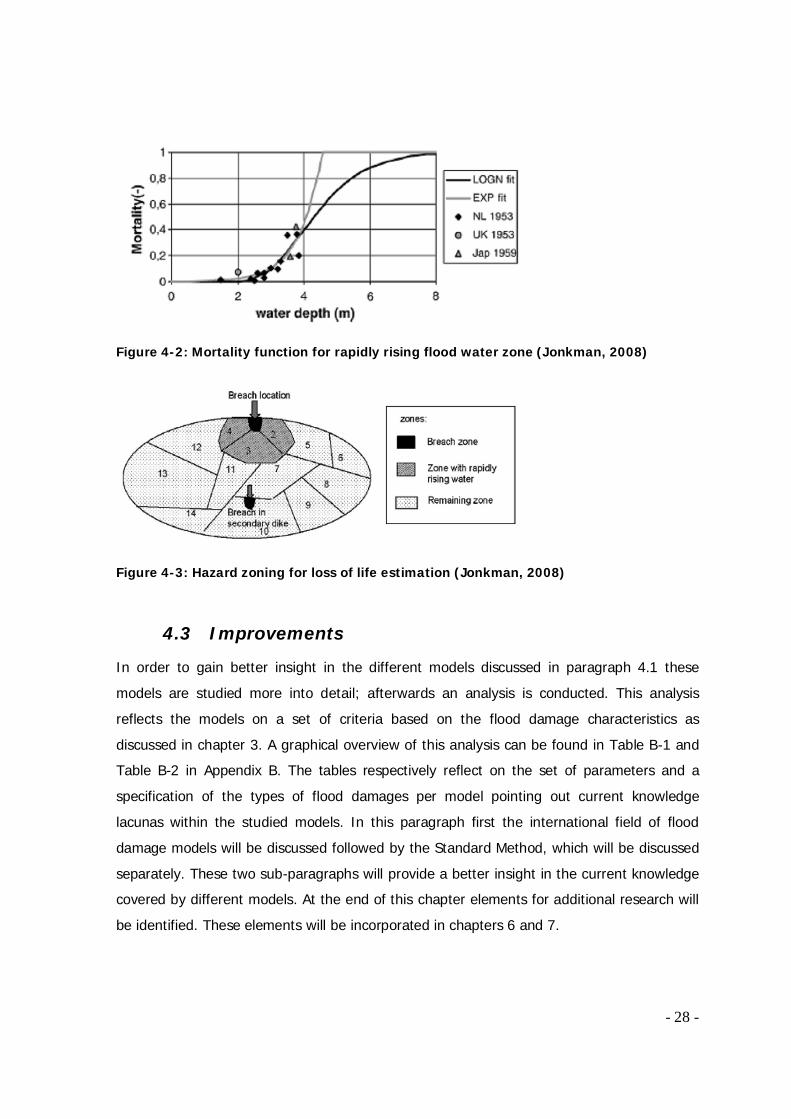
function based on real events, shown in Figure 4-2.
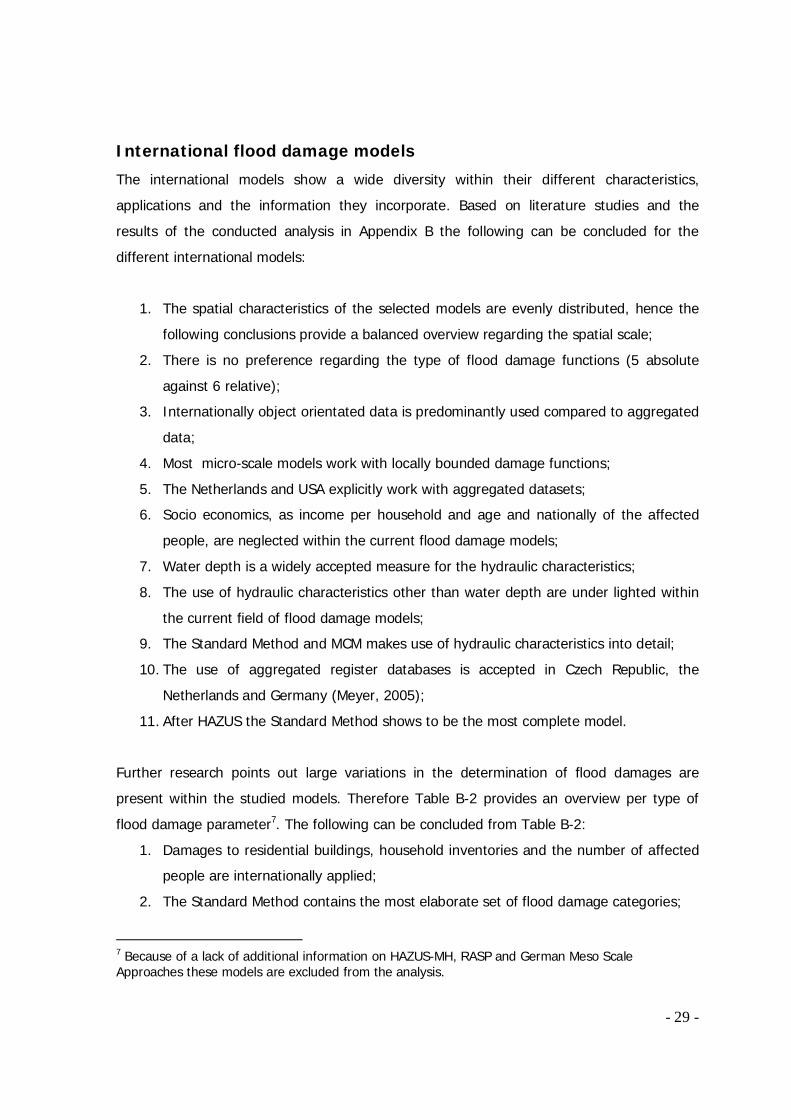
The flood prone area is subdivided into three different areas, each having its own hydraulic
and mortality characteristics. These areas consist of a breach zone where the flood defence
breaks, a zone with rapidly rising water and a rest zones (as shown in Figure 4-3). The
mortality function only applies for the breach zone and the zone with rapidly rising water.
- 28 -
Figure 4-2: Mortality function for rapidly rising flood water zone (Jonkman, 2008)
Figure 4-3: Hazard zoning for loss of life estimation (Jonkman, 2008)
4.3 Improvements
In order to gain better insight in the different models discussed in paragraph 4.1 these
models are studied more into detail; afterwards an analysis is conducted. This analysis
reflects the models on a set of criteria based on the flood damage characteristics as
discussed in chapter 3. A graphical overview of this analysis can be found in Table B-1 and
Table B-2 in Appendix B. The tables respectively reflect on the set of parameters and a
specification of the types of flood damages per model pointing out current knowledge
lacunas within the studied models. In this paragraph first the international field of flood
damage models will be discussed followed by the Standard Method, which will be discussed
separately. These two sub-paragraphs will provide a better insight in the current knowledge
covered by different models. At the end of this chapter elements for additional research will
be identified. These elements will be incorporated in chapters 6 and 7.
- 29 -
International flood damage models
The international models show a wide diversity within their different characteristics,
applications and the information they incorporate. Based on literature studies and the
results of the conducted analysis in Appendix B the following can be concluded for the
different international models:
1. The spatial characteristics of the selected models are evenly distributed, hence the
following conclusions provide a balanced overview regarding the spatial scale;
2. There is no preference regarding the type of flood damage functions (5 absolute
against 6 relative);
3. Internationally object orientated data is predominantly used compared to aggregated
data;
4. Most micro-scale models work with locally bounded damage functions;
5. The Netherlands and USA explicitly work with aggregated datasets;
6. Socio economics, as income per household and age and nationally of the affected
people, are neglected within the current flood damage models;
7. Water depth is a widely accepted measure for the hydraulic characteristics;
8. The use of hydraulic characteristics other than water depth are under lighted within
the current field of flood damage models;
9. The Standard Method and MCM makes use of hydraulic characteristics into detail;
10. The use of aggregated register databases is accepted in Czech Republic, the
Netherlands and Germany (Meyer, 2005);
11. After HAZUS the Standard Method shows to be the most complete model.
Further research points out large variations in the determination of flood damages are
present within the studied models. Therefore Table B-2 provides an overview per type of
flood damage parameter7. The following can be concluded from Table B-2:
1. Damages to residential buildings, household inventories and the number of affected
people are internationally applied;
2. The Standard Method contains the most elaborate set of flood damage categories;
7 Because of a lack of additional information on HAZUS-MH, RASP and German Meso Scale Approaches these models are excluded from the analysis.
- 30 -
3. In order for an complete model parameters as vehicles, livestock, infrastructure,
ground values, traffic disruption, toxification, heath, infrastructure, recreation,
emergency costs, environmental losses, recreational losses and cultural goods are
essential parameters but are hardly incorporated within the studied models;
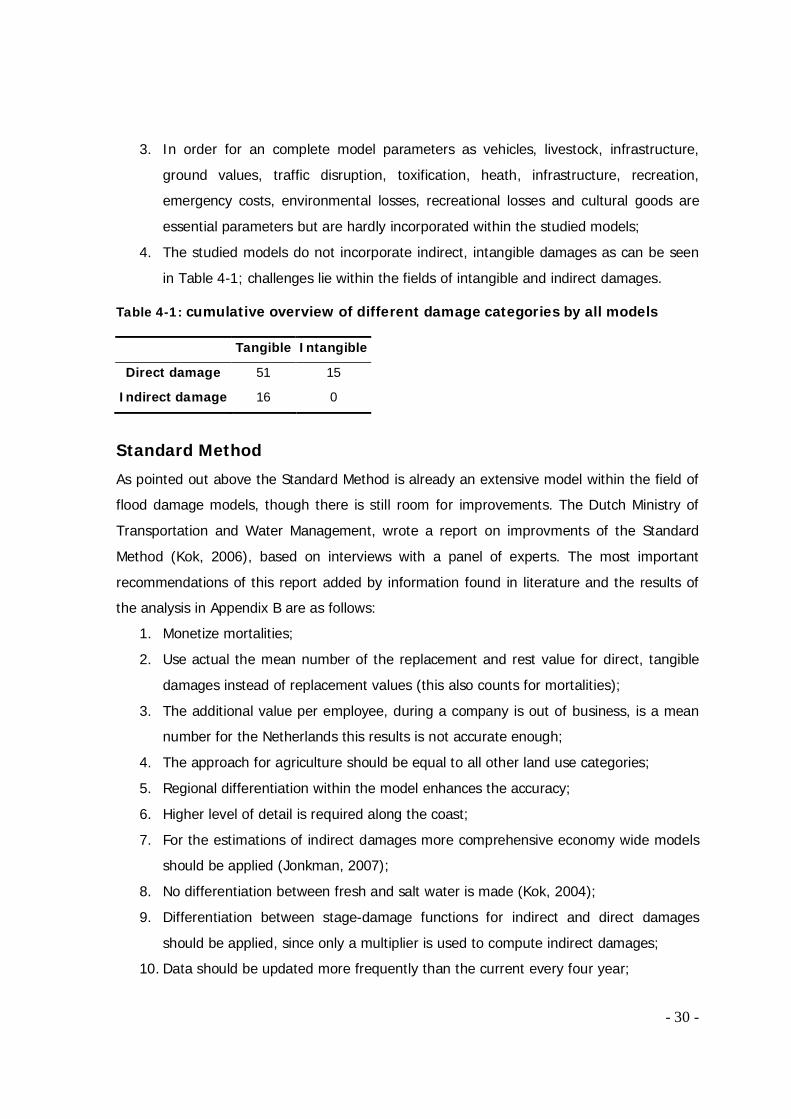
4. The studied models do not incorporate indirect, intangible damages as can be seen
in Table 4-1; challenges lie within the fields of intangible and indirect damages.
Table 4-1: cumulative overview of different damage categories by all models
Tangible Intangible
Direct damage 51 15
Indirect damage 16 0
Standard Method
As pointed out above the Standard Method is already an extensive model within the field of
flood damage models, though there is still room for improvements. The Dutch Ministry of
Transportation and Water Management, wrote a report on improvments of the Standard
Method (Kok, 2006), based on interviews with a panel of experts. The most important
recommendations of this report added by information found in literature and the results of
the analysis in Appendix B are as follows:
1. Monetize mortalities;
2. Use actual the mean number of the replacement and rest value for direct, tangible
damages instead of replacement values (this also counts for mortalities);
3. The additional value per employee, during a company is out of business, is a mean
number for the Netherlands this results is not accurate enough;
4. The approach for agriculture should be equal to all other land use categories;
5. Regional differentiation within the model enhances the accuracy;
6. Higher level of detail is required along the coast;
7. For the estimations of indirect damages more comprehensive economy wide models
should be applied (Jonkman, 2007);
8. No differentiation between fresh and salt water is made (Kok, 2004);
9. Differentiation between stage-damage functions for indirect and direct damages
should be applied, since only a multiplier is used to compute indirect damages;
10. Data should be updated more frequently than the current every four year;
- 31 -
11. Therefore an online application is suggested;
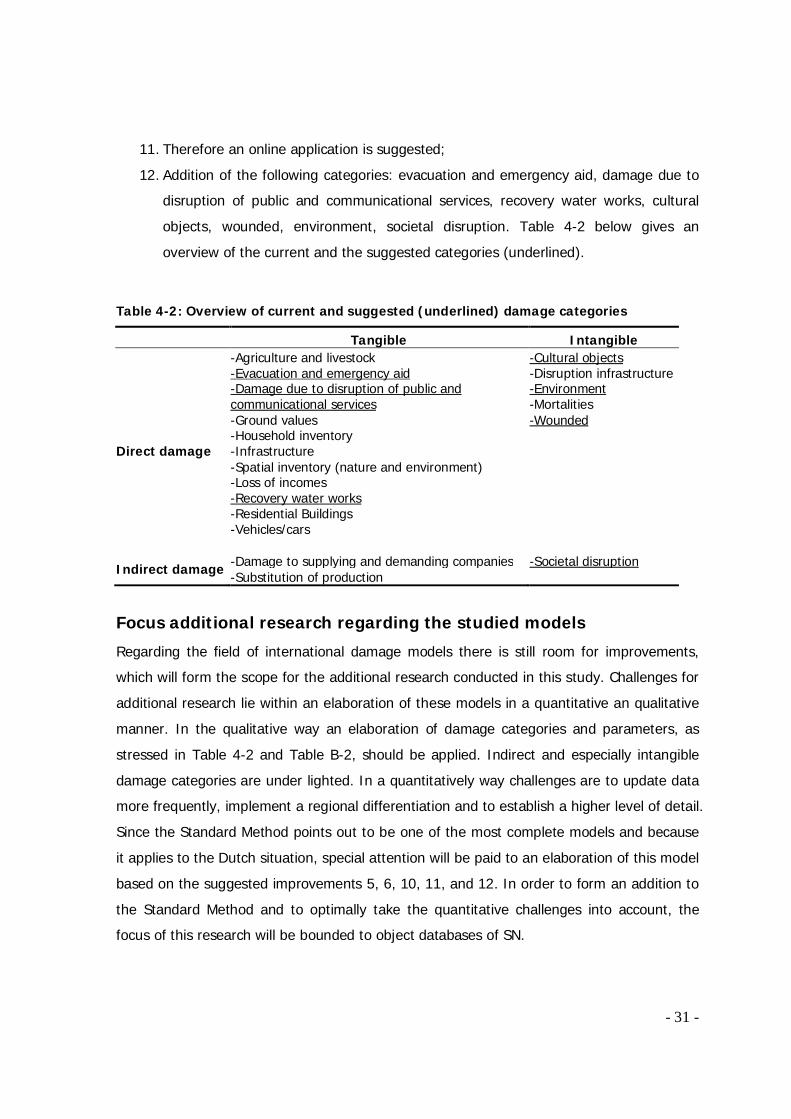
12. Addition of the following categories: evacuation and emergency aid, damage due to
disruption of public and communicational services, recovery water works, cultural
objects, wounded, environment, societal disruption. Table 4-2 below gives an
overview of the current and the suggested categories (underlined).
Table 4-2: Overview of current and suggested (underlined) damage categories
Tangible Intangible
Direct damage
-Agriculture and livestock -Evacuation and emergency aid -Damage due to disruption of public and communicational services -Ground values -Household inventory -Infrastructure -Spatial inventory (nature and environment) -Loss of incomes -Recovery water works -Residential Buildings -Vehicles/cars
-Cultural objects -Disruption infrastructure -Environment -Mortalities -Wounded
Indirect damage -Damage to supplying and demanding companies -Substitution of production
-Societal disruption
Focus additional research regarding the studied models
Regarding the field of international damage models there is still room for improvements,
which will form the scope for the additional research conducted in this study. Challenges for
additional research lie within an elaboration of these models in a quantitative an qualitative
manner. In the qualitative way an elaboration of damage categories and parameters, as
stressed in Table 4-2 and Table B-2, should be applied. Indirect and especially intangible
damage categories are under lighted. In a quantitatively way challenges are to update data
more frequently, implement a regional differentiation and to establish a higher level of detail.
Since the Standard Method points out to be one of the most complete models and because
it applies to the Dutch situation, special attention will be paid to an elaboration of this model
based on the suggested improvements 5, 6, 10, 11, and 12. In order to form an addition to
the Standard Method and to optimally take the quantitative challenges into account, the
focus of this research will be bounded to object databases of SN.
- 32 -
5 Tasks and information demands
of stakeholders
- 33 -
5 Tasks and information demands of stakeholders
More than 50% of the Dutch community and its stakes are located below sea level and 70%
of the gross national income is earned below sea level (ten Brinke, 2008). Therefore
throughout history always a strong emphasis in politics has been on flood defence. This is
reflected in high safety standards for our dikering system and a broad range of different
stakeholders involved in the process of flood risk management. Each stakeholder requires
different information in time in order to optimally participate in the debate on flood
protection and crisis management. Goal of this chapter is to map the most important
stakeholders and their needs, and to identify opportunities for improvement. Therefore first
a framework for stakeholder determination in time will be discussed (5.1) and afterwards a
set of stakeholders will be selected (5.2). At the end an overview of their data requirements
and possible improvements will be discussed. The last paragraph functions as input for the
following chapter where the additional value of SN data will be discussed (5.3).
5.1 Safety chain The process of coping with floods involves many stakeholders, each on different period in
time. A structured overview of all stakeholders involved can be achieved by adapting the
safety chain approach for flood risk management (BZK, 1993). This concept uses successive
links, which designates different stakeholders in time and type of management. This method
consists of two important phases in time respectively the risk management and the crisis
management phase. The first phase concerns the prevention of flooding and the reduction
of possible consequences. The second phase in time, crisis management, concerns the
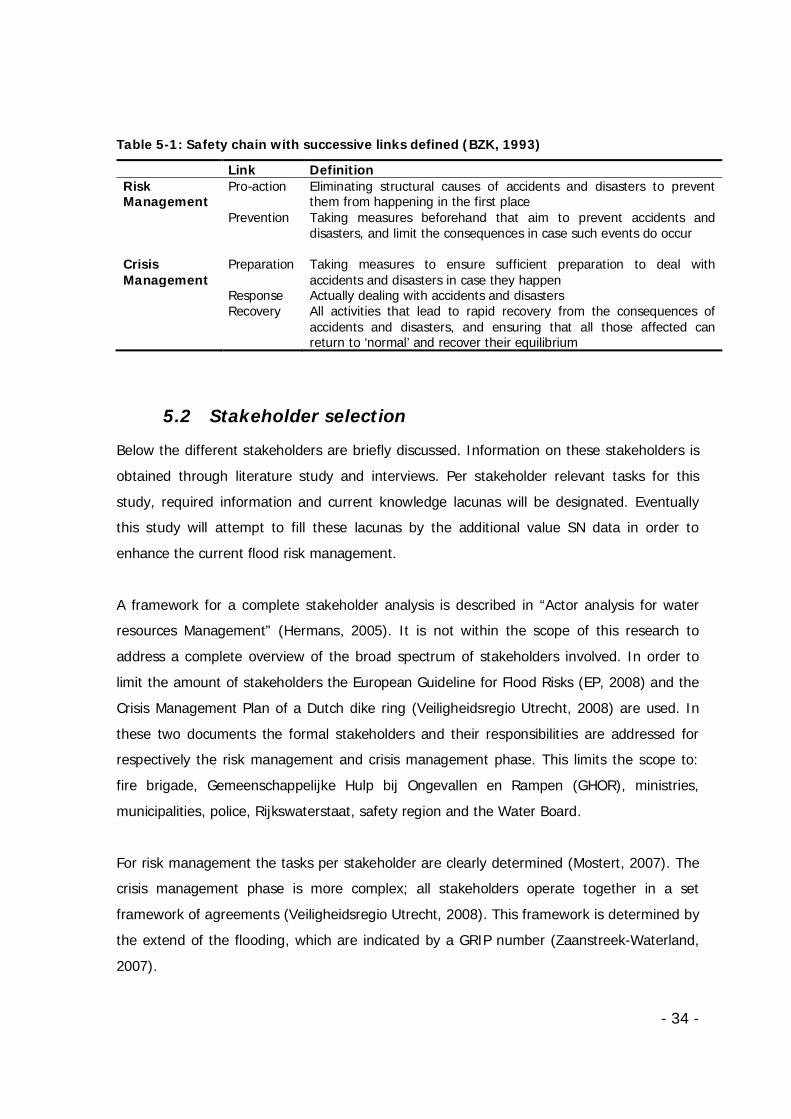
actions to be taken in case of flooding. Table 5-1 provides an overview of the safety chain
approach with its successive links in time provided with a short description.
- 34 -
Table 5-1: Safety chain with successive links defined (BZK, 1993)
Link Definition Risk Management
Pro-action Eliminating structural causes of accidents and disasters to prevent them from happening in the first place
Prevention Taking measures beforehand that aim to prevent accidents and disasters, and limit the consequences in case such events do occur
Crisis Management
Preparation Taking measures to ensure sufficient preparation to deal with accidents and disasters in case they happen
Response Actually dealing with accidents and disasters Recovery All activities that lead to rapid recovery from the consequences of
accidents and disasters, and ensuring that all those affected can return to ‘normal’ and recover their equilibrium
5.2 Stakeholder selection
Below the different stakeholders are briefly discussed. Information on these stakeholders is
obtained through literature study and interviews. Per stakeholder relevant tasks for this
study, required information and current knowledge lacunas will be designated. Eventually
this study will attempt to fill these lacunas by the additional value SN data in order to
enhance the current flood risk management.
A framework for a complete stakeholder analysis is described in “Actor analysis for water
resources Management” (Hermans, 2005). It is not within the scope of this research to
address a complete overview of the broad spectrum of stakeholders involved. In order to
limit the amount of stakeholders the European Guideline for Flood Risks (EP, 2008) and the
Crisis Management Plan of a Dutch dike ring (Veiligheidsregio Utrecht, 2008) are used. In
these two documents the formal stakeholders and their responsibilities are addressed for
respectively the risk management and crisis management phase. This limits the scope to:
fire brigade, Gemeenschappelijke Hulp bij Ongevallen en Rampen (GHOR), ministries,
municipalities, police, Rijkswaterstaat, safety region and the Water Board.
For risk management the tasks per stakeholder are clearly determined (Mostert, 2007). The
crisis management phase is more complex; all stakeholders operate together in a set
framework of agreements (Veiligheidsregio Utrecht, 2008). This framework is determined by
the extend of the flooding, which are indicated by a GRIP number (Zaanstreek-Waterland,
2007).
- 35 -
All different stakeholders stated below are separately interviewed. Appendix C provides an
overview per stakeholder describing its responsibilities, which information is used at the
moment and what can be improved in the future. In case of crisis management the
ministries are only involved in case of a “national prioritization”, additional information on
this process is also included in Appendix C.
Fire brigade The fire brigade has an operational role and is only active in the phase of crisis
management. Relevant tasks for this study are the suppression of toxics and the securing of
affected people. Therefore the fire brigade uses detailed maps of “special objects” (schools,
libraries, etc.) and an overview of locations where evacuees can be sheltered. These maps
are self-constructed by the fire brigade in cooperation with the municipality. Opportunities
for improvement can be found in the level of detail, the frequency of updating the data and
automation of this process. At the moment an overview of pollution sources is lacking as
well as vulnerable objects such as hospitals. There is also a lack of (real time) scenarios
preventing a strategic crisis management in time.
GHOR
Tasks of the GHOR are the evacuation of casualties and the less capable of evacuating and
the protection of public healthcare. At the moment the sole information at hand is an
overview of ambulance posts. Future opportunities lie within the information management.
Examples are (real time) scenario planning in order to manage the ambulance posts in time
during a flood, overview of pollution sources to ensure effective prevention of public
healthcare and a detailed overview of locations with the less capable of evacuating to
establish an effective evacuation management. The importance of information on
evacuations is pointed out by the Katrina flood in New Orleans 2005 where some nursing
homes were not evacuated causing 65 fatalities (Jonkman, 2009).
Municipality
The municipality has an important role during a flood, hence an extensive list of tasks. In
short the municipality has to provide internal and external parties of information, provide
shelter to affected people and register the damage after a flood. In most municipalities the
information at hand does not reflect the important role of the municipality. This only
consists of flooding maps and movies depicting flooding depths in time based on “worst
- 36 -
credible flood” scenarios I (Kolen, 2007), provided by the Water Board. Improvement can be
achieved by a detailed forecasting of different scenarios in order to enhance the
preparedness of the municipality. Opportunities can also be found within the elaboration of
the used Standard Method in order to improve economic damage calculations.
Police
As well as the GHOR and the fire brigade the police has an operational role during the
phase of crisis management. Its main responsibilities cover logistics such as disconnecting
the flooded area, guiding help services, management of traffic streams and vacating and
evacuating livestock and people. For evacuations the police possess an overview of the
number of potential evacuees on a P4 level. In order to manage traffic streams circulation
plans for different scenarios are at hand. Improvements can be made in the construction of
different scenarios, at the moment these are fixed maps based on the final results of a
flooding. By applying real-time scenarios a more effective traffic management can be
established, since roads keep accessible up to 0,2 m water depth (Jonkman, 2008). In case
of evacuations the level of detail of the current information can be increased significantly by
using object data instead of data based on postcode level 4. Furthermore more detailed
information on the evacuees (age, nationality, composition of households, physical
limitations etc.) enhances the evacuation management.
Rijkswaterstaat
Rijkswaterstaat (RWS) is the operational department of the Ministry of Transport, Public
Works and Water Management8. Within the field of flood risk management its task is to
maintain the primary water defence system and to supply information, to all stakeholders,
at every moment within the safety chain. Within the risk management phase RWS maintains
the primary water defence system (pro-action) together with The Water Boards and works
on a descent information supply framework in case of crisis (prevention). Within the crisis
management RWS supplies information to its stakeholders on flooding risk (preparations),
flood characteristics (response) and the primary defence system (recovery). Based on this
information decisions can be made within, for example, the ministry of the Interior9 (BZK)
and the safety regions. Challenges lie within its information supply framework: enhanced
8 In Dutch: Ministerie van Verkeer en Waterstaat 9 In Dutch: Ministerie van Binnenlandse zaken
- 37 -
detail of information in combination with an integral interpretation by all stakeholders
involved.
Safety region
Within the Safety Region the Regional Operational Team (ROT) is responsible for the
operational coordination during crisis management in order to ensure the coordination
between its stakeholders (municipality, fire brigade, GHOR, alarm central, Water Board and
RWS. The ROT obtains its information through its stakeholders, this information consist of:
water depth in time, number of residents in flooded area, less capable of evacuating,
livestock, economic value and service drop outs. This information is presented in the form of
geographic maps for water depths and tables per postcode level 4. As for the police the
level of detail is an important factor for improvement (“the higher the level of detail the
better”). Information on the less capable of evacuating is scarce and requires attention. This
also counts for information on critical hubs for electricity and drink water supply. In the end
information on water depths can be enhanced by constructing movies of flooding scenarios
in stead of using static maps.
Water Board
The Water Board has an important task in the risk management phase by the management
of regional and primary water systems and the maintenance of waterworks. Moreover it has
the task of providing information to municipalities in the preparation phase. By using the
Standard Method and SOBEK the Water Board supplies information to the municipalities on
possible scenarios, this information only contains flooding depths and damage calculations.
Improvements lay within the scenarios themselves and the communication of those.
Suggestions are to publish scenarios online and to include secondary dike breaches within
the scenarios. Also improvement of the Standard Method implies an improvement of the
communicated data (see 4.3).
- 38 -
5.3 Concluding Remarks Altogether there is room for improvement in the field of flood risk management. Below a
summary on improvement of the current preparedness of the different stakeholders is given.
It is based on literature studies and interviews with all formal stakeholders, which can be
found back in Appendix C. This summary offers opportunities for the application of SN data
within the field of water management and will be discussed in the following chapters.
1. Automation of production of risk maps;
2. Change static information like maps into dynamic information in time for example
real-time flooding scenarios, in the form of movies, pointing out the (cumulative)
effects in time;
3. Elaborate scenario planning;
4. Improve damage calculations of the Standard Method by elaborating the number
of damage categories, for example toxic damages;
5. Improve information on the less capable of evacuating;
6. Include critical hubs for electricity and drink water supply;
7. Include information on pollution sources;
8. Increase level of detail (object data in stead of postcode level 4);
9. Publish flooding scenarios online for relevant stakeholders only;
10. Update information more frequent through online application.

- 39 -

- 40 -
6 Data analysis
- 41 -
6 Statistics Netherlands Data Overview
Statistics Netherlands (SN) is responsible for collecting and processing data in order to
publish statistics to be used in practice, by policymakers and for scientific research. This
chapter will provide an overview of all applicable databases which form an addition to the
knowledge lacunas regarding flood damage models and the stakeholders as pointed out in
4.3 and 5.3. This information is obtained through data research and several interviews
within different departments of SN. At first an overview of the complementary SN databases
will be given (6.1). Thereafter this overview will be coupled to the stakeholders of chapter 5
and their tasks in time (6.2). This overview will point out the additional value of SN data. In
case of flooding it will be integrated in a new framework on stakeholder needs in time.
Furthermore a geographical visualization of demographic in the form of a thematic map will
be provided.
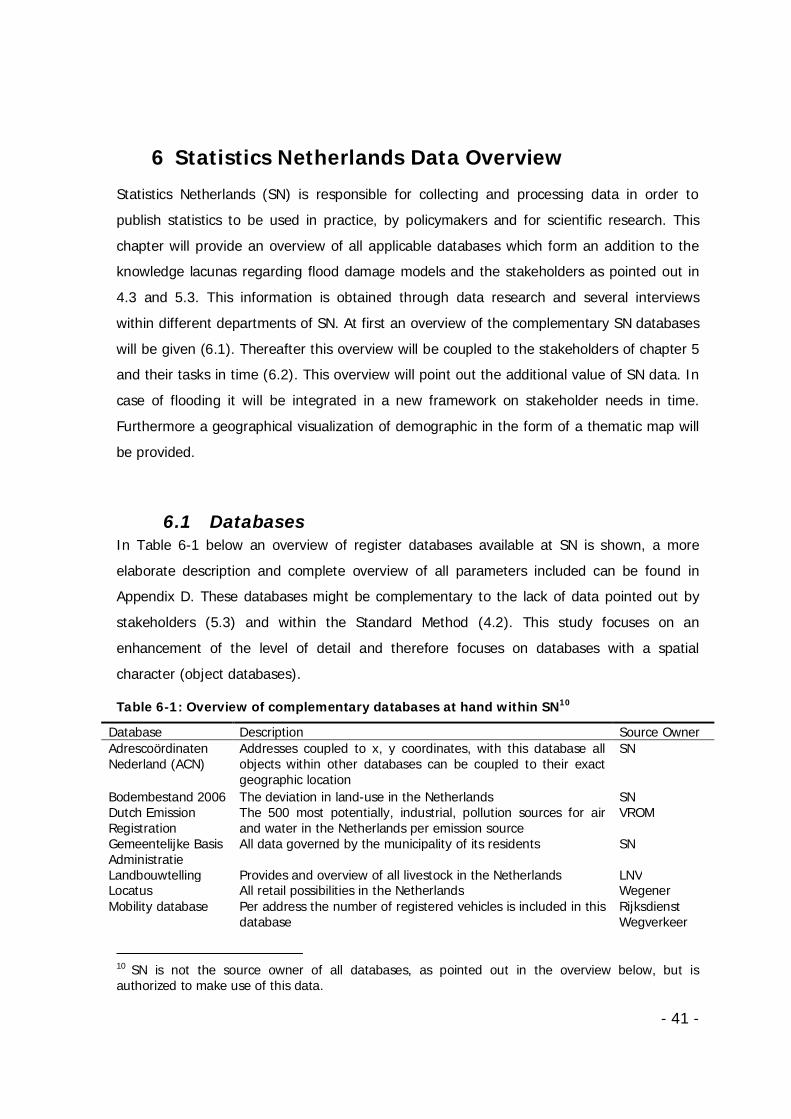
6.1 Databases In Table 6-1 below an overview of register databases available at SN is shown, a more
elaborate description and complete overview of all parameters included can be found in
Appendix D. These databases might be complementary to the lack of data pointed out by
stakeholders (5.3) and within the Standard Method (4.2). This study focuses on an
enhancement of the level of detail and therefore focuses on databases with a spatial
character (object databases).
Table 6-1: Overview of complementary databases at hand within SN10
Database Description Source Owner Adrescoördinaten Nederland (ACN)
Addresses coupled to x, y coordinates, with this database all objects within other databases can be coupled to their exact geographic location
SN
Bodembestand 2006 The deviation in land-use in the Netherlands SN Dutch Emission Registration
The 500 most potentially, industrial, pollution sources for air and water in the Netherlands per emission source
VROM
Gemeentelijke Basis Administratie
All data governed by the municipality of its residents
SN
Landbouwtelling Provides and overview of all livestock in the Netherlands LNV Locatus All retail possibilities in the Netherlands Wegener Mobility database Per address the number of registered vehicles is included in this
database Rijksdienst Wegverkeer
10 SN is not the source owner of all databases, as pointed out in the overview below, but is authorized to make use of this data.
- 42 -
Museums All museums including their opening times SN Nationaal wegenbestand
All national, provincial and municipal roads Rijkswaterstaat
Nationale Atlas Volksgezondheid
All health service locations in the Netherlands RIVM
Nederlandse Sportalmanak
All sport accommodations in the Netherlands SN
Podium arts Different accommodation parameters for podium arts SN Primary schools The locations of all primary schools SN Public Utility Companies
All locations of production units generating energy installations in the Netherlands
SN
Sociaal Statistisch Bestand
Social-economic data of Dutch residents SN
6.2 Additional value of SN data
In the previous paragraph an overview of databases applicable within the field of flood risk
management is given. These databases provide additional value to the current information
at hand for the selected stakeholders and can be complementary to data used by the
Standard Method and other international flood damage models. By implementing these
databases within the current flood risk management an improved scenario planning is
possible because of their additional information. The databases enable the mapping of the
less capable of evacuating, pollution sources, critical hubs for electricity and drink water
supply, cultural objects and environmental aspect. By applying the WOZ numbers, the
actual values instead of replacement values will be applied. SN yearly produces its statistics;
this implies an annual update of the databases which prevents outdated information. The
choice for object databases increases the level of detail significantly and enables regional
differentiation. Also an improvement in accuracy can be established for existing parameters
since most the Standard Method databases perform on postcode level 6.
An overview of the additional value of SN data regarding all formal stakeholders in relation
to their tasks in time, coupled to relevant SN spatial register databases is depicted in Table
6-2. The first column describes the type of damage, the second column displays the
stakeholders involved and the other columns form the different phases in time according to
the safety chain. In the coloured boxes a specific task (underlined) per group of
stakeholders is depicted together with the databases available at SN, which provide
accurate additional information on this topic. The colours of the boxes are related to a
certain theme; this will be discussed in the paragraph on the next page.
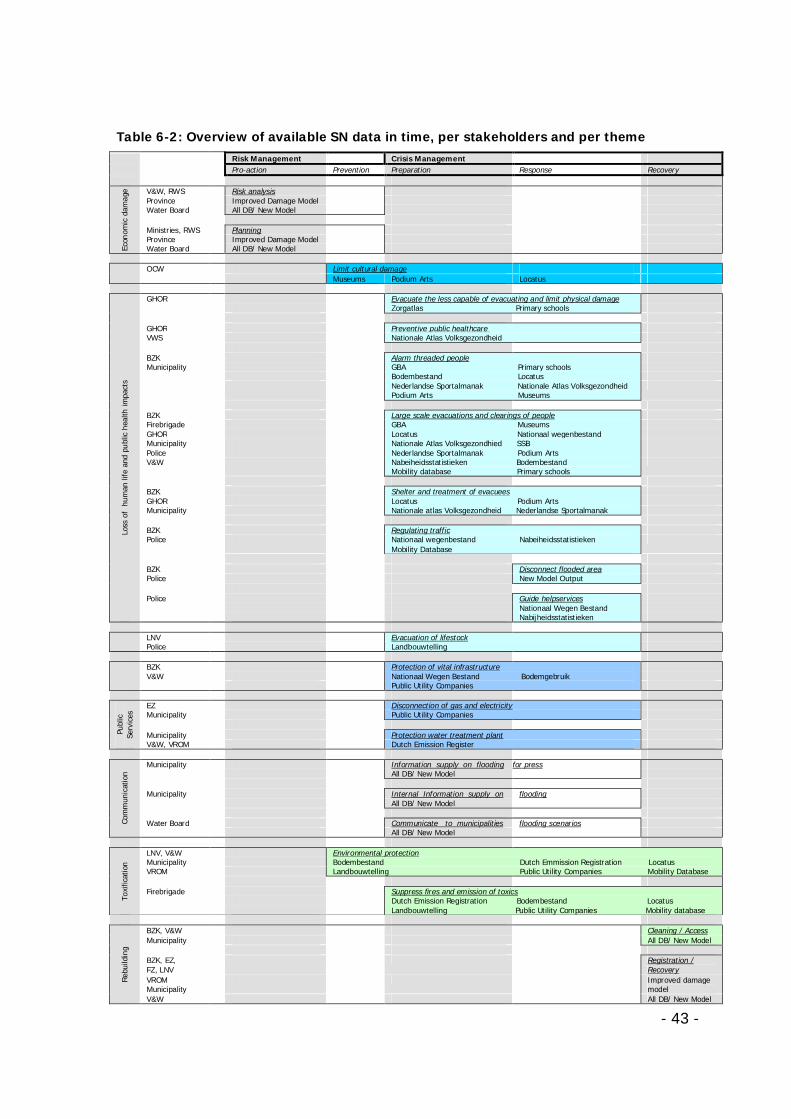
- 43 -
Table 6-2: Overview of available SN data in time, per stakeholders and per theme Risk Management Crisis Management
Pro-action Prevention Preparation Response Recovery
Econ
omic
dam
age V&W, RWS Risk analysis
Province Improved Damage Model Water Board All DB/ New Model Ministries, RWS Planning Province Improved Damage Model Water Board All DB/ New Model
OCW Limit cultural damage Museums Podium Arts Locatus
Loss
of
hum
an li
fe a
nd p
ublic
hea
lth im
pact
s
GHOR Evacuate the less capable of evacuating and limit physical damage Zorgatlas Primary schools
GHOR Preventive public healthcare VWS Nationale Atlas Volksgezondheid BZK Alarm threaded people
GBA Primary schools Bodembestand Locatus Nederlandse Sportalmanak Nationale Atlas Volksgezondheid Podium Arts Museums
Municipality
BZK Large scale evacuations and clearings of people
GBA Museums Locatus Nationaal wegenbestand Nationale Atlas Volksgezondhied SSB Nederlandse Sportalmanak Podium Arts Nabeiheidsstatistieken Bodembestand Mobility database Primary schools
Firebrigade GHOR Municipality Police V&W
BZK Shelter and treatment of evacuees
Locatus Podium Arts Nationale atlas Volksgezondheid Nederlandse Sportalmanak
GHOR Municipality BZK Regulating traffic
Nationaal wegenbestand Nabeiheidsstatistieken Mobility Database
Police
BZK Disconnect flooded area Police New Model Output Police Guide helpservices Nationaal Wegen Bestand Nabijheidsstatistieken
LNV Evacuation of lifestock Landbouwtelling
Police
BZK Protection of vital infrastructure Nationaal Wegen Bestand Bodemgebruik Public Utility Companies
V&W
Publ
ic
Serv
ices
EZ Disconnection of gas and electricity Municipality Public Utility Companies Municipality Protection water treatment plant V&W, VROM Dutch Emission Register
Com
mun
icat
ion
Municipality Information supply on flooding for press All DB/ New Model Municipality Internal Information supply on flooding All DB/ New Model Water Board Communicate to municipalities flooding scenarios All DB/ New Model
Toxi
ficat
ion
LNV, V&W Environmental protection Bodembestand Dutch Emmission Registration Locatus Landbouwtelling Public Utility Companies Mobility Database
Municipality VROM Firebrigade Suppress fires and emission of toxics
Dutch Emission Registration Bodembestand Locatus Landbouwtelling Public Utility Companies Mobility database
Rebu
ildin
g
BZK, V&W Cleaning / Access Municipality All DB/ New Model BZK, EZ, FZ, LNV
Registration / Recovery
VROM Municipality
Improved damage model
V&W All DB/ New Model
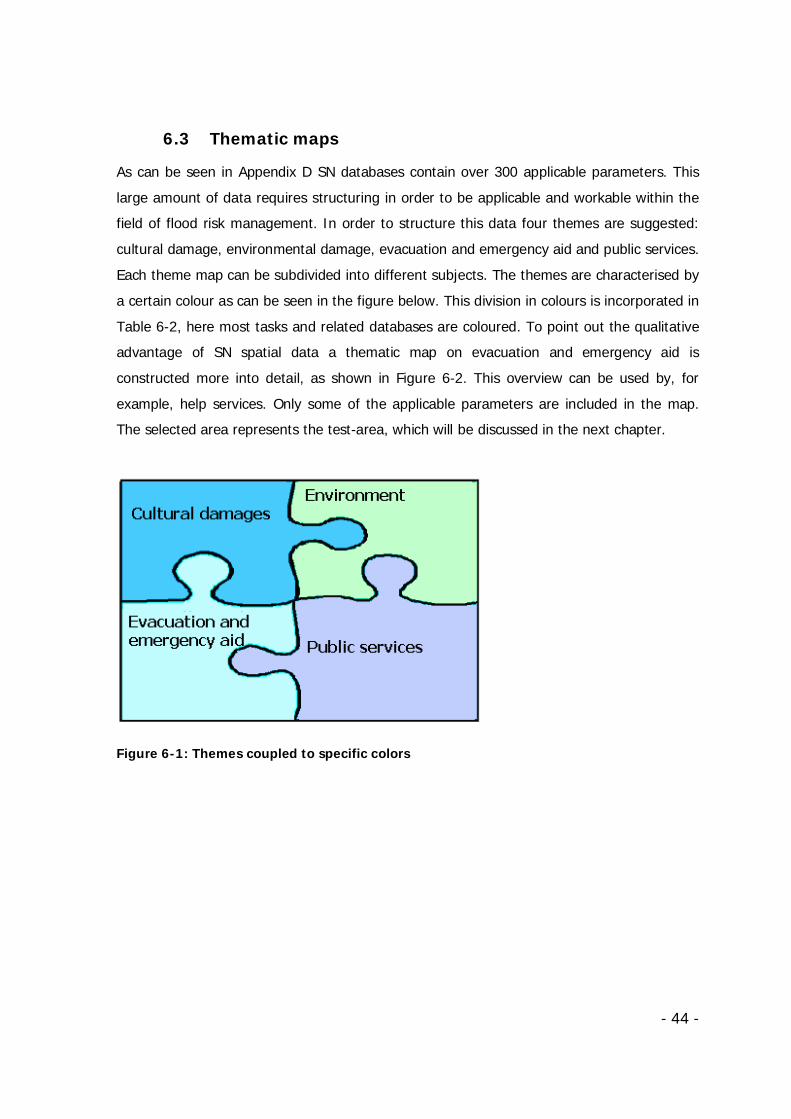
- 44 -
6.3 Thematic maps
As can be seen in Appendix D SN databases contain over 300 applicable parameters. This
large amount of data requires structuring in order to be applicable and workable within the
field of flood risk management. In order to structure this data four themes are suggested:
cultural damage, environmental damage, evacuation and emergency aid and public services.
Each theme map can be subdivided into different subjects. The themes are characterised by
a certain colour as can be seen in the figure below. This division in colours is incorporated in
Table 6-2, here most tasks and related databases are coloured. To point out the qualitative
advantage of SN spatial data a thematic map on evacuation and emergency aid is
constructed more into detail, as shown in Figure 6-2. This overview can be used by, for
example, help services. Only some of the applicable parameters are included in the map.
The selected area represents the test-area, which will be discussed in the next chapter.
Figure 6-1: Themes coupled to specific colors
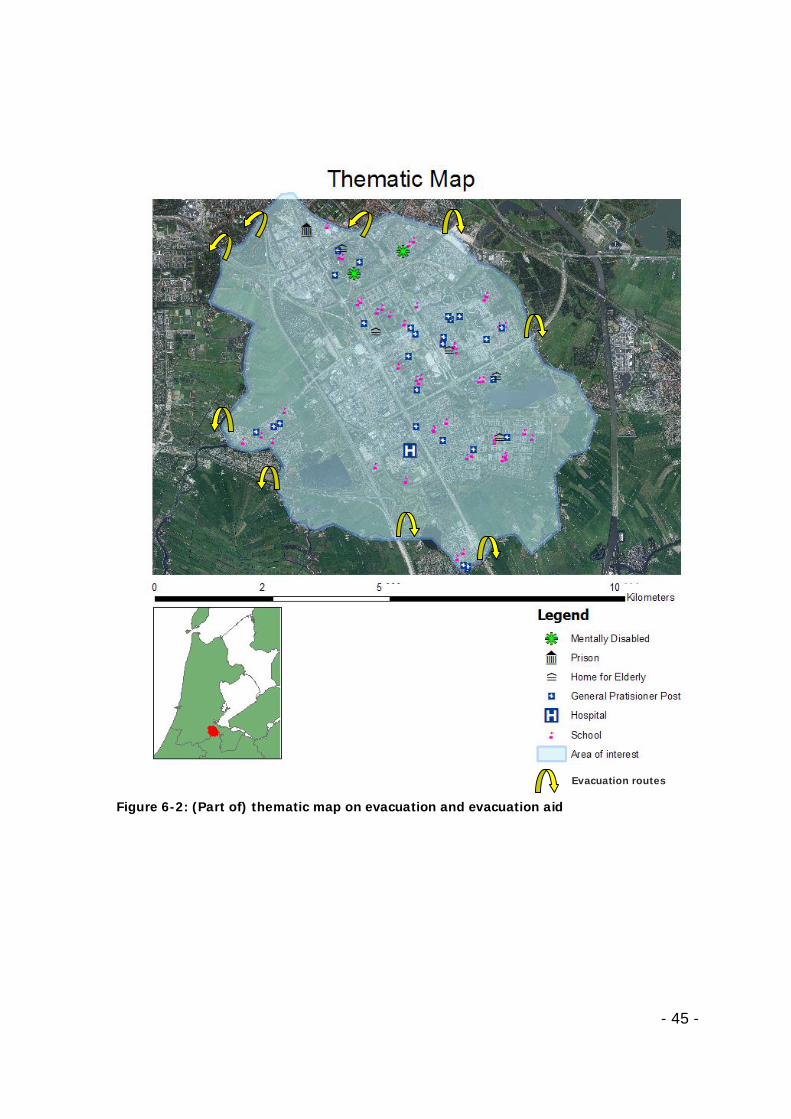
- 45 -
Figure 6-2: (Part of) thematic map on evacuation and evacuation aid
Evacuation routes
- 46 -
7 Case Study
- 47 -
7. Case Study
In the previous chapters the additional value of SN data is pointed out by analyzing the
current flood damage models and the needs of stakeholders. This resulted in Table 6-2,
which points out the potentially additional value of SN data within the field of flood risk
management. This chapter will discuss a case study, which focuses on the spatial character
of the available SN spatial register data. The case study will analyse flood impacts on
affected households, vulnerable objects and groups and potentially affected people in time.
In the first paragraph the test case and the selected test area will be described. For this test
case a model is developed which is discussed in 7.2. At the end of this chapter the results of
the model, reflected on the intention of the case study are presented.
7.1. Test-case In this paragraph the framework for the test-case is described. The intention of this test
case is to establish a micro-scale model using object data which stresses the enhanced
accuracy and possibilities of SN data in time in a quantitatively and qualitatively manner.
These benefits and the selected test area will respectively be discussed below.
Quantitative benefits
One of the two components to be studied in this test case is the quantitative benefit of
using SN object data. The accuracy of this data will be compared with aggregated P6
datasets, currently used in the Netherlands through the Standard Method. In elaboration on
the dynamic information supply in time as described for the qualitative results, the
cumulative number of the potentially affected people in time is studied for both datasets. As
shown in Figure 3-3 and Figure 3-4, two parameters influence the accuracy of the results:
the computed flooding grid and the size of the P6 areas. Because this study is bounded to a
micro scale approach the size of the flooding grid is fixed. The size of the P6 areas varies:
since every P6 area contains about 25 different addresses these are determined by the
population density. When fixating the flooding grid and varying the size of the P6 areas two
different scenarios can be computed: the potential of affected people in time for a dike
breach in a densely populated and a sparsely populated area. For both scenarios the
performance of both datasets in time has been compared.
- 48 -
Qualitative benefits
Evaluation of the Katrina floods in New Orleans 2005 emphasizes the knowledge on the
exact locations of vulnerable objects, especially those housing the less capable of
evacuating, to reduce the number of casualties (Jonkman, 2009). Since the locations of the
used SN data points are geographically determined it is possible to point out the exact
locations of the vulnerable objects or groups. In the previous chapter this is presented in
the form of a thematic map. More interesting would be to exactly determine the moment in
time when an object of interest is affected during a flood. With this dynamic information
operational services are able to establish a strategic flood risk management in time. This
test case will study how the use of these data can be enriched for the different stakeholders
by changing the static data into dynamic information in time by coupling flood damage
patterns in time with the affected data of interest in order.
Test Area
The test case is formed by the Bijlmerring. The test area consists of 8 polders covering 3
municipalities: Amsterdam, Ouderamstel and Abcoude and is bounded by the water bodies:
Amstel, the Bullewijk, the Holendrecht, the Gein and the Gaasp. It covers an area of 3 000
hectares and houses over 40 000 residents. This area meets the quantitative and qualitative
characteristics required to optimally point out the additional value of SN data since it is
characterized by a densely and a sparsely populated part and displays a wide range of
vulnerable objects and groups. Figure 7-1 provides an overview of the complete test area.
The test area is surrounded by a belt system of -0,4 m. below NAP (AGV, 2007). Within
some locations the depth within the polders of the test area exceeds -6,0 m below NAP. The
surrounding water bodies are interconnected and The Gaasp is interconnected, via a sluice,
with the Amsterdam Rijnkanaal at Driemond. The density of closing structure in the
surrounding water bodies is scarce.
The north-eastern part of the test area belongs to the municipality of Amsterdam. Since
1963 this part is used for the expansion of Amsterdam with neighbourhoods as the
Bijlmermeer, Gein and Holendrecht. With about 7 000 residents per square kilometre (SN,
2007) this is the most densely populated part of the test area. It is characterized by a wide

- 49 -
range of different objects for example schools, hospitals, residential areas, soccer stadium
and pop podia. The south-western part, in contrary, is the most sparsely populated area
within the test area with respectively a density of 17 and 19 residents per square kilometre
(SN, 2007). It consists of the Duivendrechtse polder and Bullewijk polder. In this test area
the P6 area of a sparsely populated location can be 1 000 times larger than a P6 area in a
densely populated location.
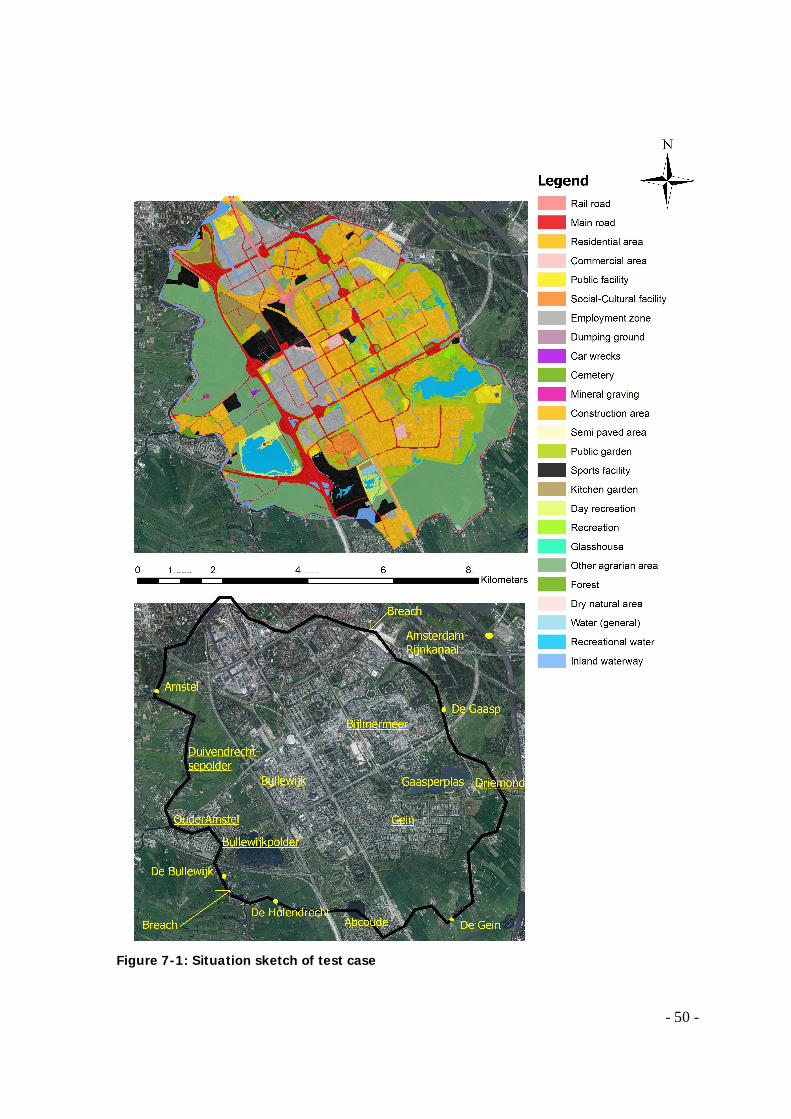
- 50 -
Figure 7-1: Situation sketch of test case
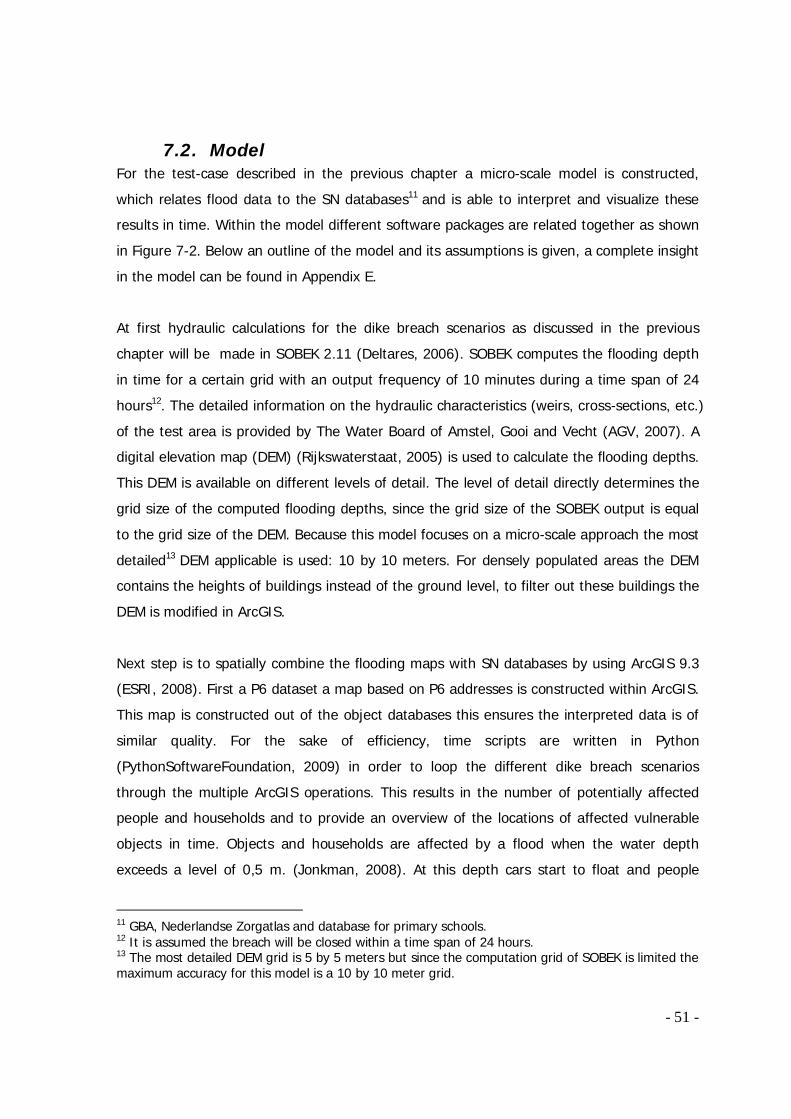
- 51 -
7.2. Model For the test-case described in the previous chapter a micro-scale model is constructed,
which relates flood data to the SN databases11 and is able to interpret and visualize these
results in time. Within the model different software packages are related together as shown
in Figure 7-2. Below an outline of the model and its assumptions is given, a complete insight
in the model can be found in Appendix E.
At first hydraulic calculations for the dike breach scenarios as discussed in the previous
chapter will be made in SOBEK 2.11 (Deltares, 2006). SOBEK computes the flooding depth
in time for a certain grid with an output frequency of 10 minutes during a time span of 24
hours12. The detailed information on the hydraulic characteristics (weirs, cross-sections, etc.)
of the test area is provided by The Water Board of Amstel, Gooi and Vecht (AGV, 2007). A
digital elevation map (DEM) (Rijkswaterstaat, 2005) is used to calculate the flooding depths.
This DEM is available on different levels of detail. The level of detail directly determines the
grid size of the computed flooding depths, since the grid size of the SOBEK output is equal
to the grid size of the DEM. Because this model focuses on a micro-scale approach the most
detailed13 DEM applicable is used: 10 by 10 meters. For densely populated areas the DEM
contains the heights of buildings instead of the ground level, to filter out these buildings the
DEM is modified in ArcGIS.
Next step is to spatially combine the flooding maps with SN databases by using ArcGIS 9.3
(ESRI, 2008). First a P6 dataset a map based on P6 addresses is constructed within ArcGIS.
This map is constructed out of the object databases this ensures the interpreted data is of
similar quality. For the sake of efficiency, time scripts are written in Python
(PythonSoftwareFoundation, 2009) in order to loop the different dike breach scenarios
through the multiple ArcGIS operations. This results in the number of potentially affected
people and households and to provide an overview of the locations of affected vulnerable
objects in time. Objects and households are affected by a flood when the water depth
exceeds a level of 0,5 m. (Jonkman, 2008). At this depth cars start to float and people
11 GBA, Nederlandse Zorgatlas and database for primary schools. 12 It is assumed the breach will be closed within a time span of 24 hours. 13 The most detailed DEM grid is 5 by 5 meters but since the computation grid of SOBEK is limited the maximum accuracy for this model is a 10 by 10 meter grid.
- 52 -
encompass great difficulties to leave the flooded area. Vulnerable objects are described as
locations where people which are less capable of evacuating are located, for example
hospitals and homes for elderly. Vulnerable groups are determined by demographic
characteristics, for example elderly less capable of evacuating. When an object or group is
flooded ArcGIS encircles the vulnerable objects and groups to point out their location and
the moment in time they are affected. These circles are converted into grid files with spatial
reference.
To point out the encircled affected vulnerable objects and groups in time and place a tool is
used which displays the ArcGIS output in time on Google Maps (Google, 2009). This tool is
part of the software package Lizard (Nelen&Schuurmans, 2008). It converts grid files of
ArcGIS into spatially referenced PNG file, which will then be displayed in order of time on
Google Maps.
Regarding the quantitative analysis ArcGIS computes tables with numbers on the affected
households and potentially affected people per period in time for the P6 and object
databases. These tables can be merged per scenario and edited with Excel to interpret the
cumulative data in time.
Figure 7-2: Model lay-out
- 53 -
7.3 Results
In this paragraph the results of the test-case on the quantitative and qualitative benefits of
spatial SN data will be presented. For the quantitative part the results for two similar dike
breach scenarios are studied, respectively one for the densely populated area in the west
and one for the sparsely populated area in the east. To point out the qualitative benefits of
SN data only the eastern dike breach is studied since this area is characterized by the
largest variety and density of vulnerable objects and groups.
Quantitative result
Regarding the quantitative benefits of SN data, the results for the performance of P6 data in
comparison with object orientated SN data are studied by comparing the cumulative number
of potentially affected people in time. Two scenarios are studied: a dike breach in a densely
populated area and one in a sparsely populated area. These are areas with respectively
relatively small and large P6 areas.
For the densely populated area, with relatively small P6 areas, the performance of both
datasets shows a quite similar pattern. Within 24 hours a potential between 18 000–19 000
people, depending on the dataset, is affected by the flood. For the first 12 hours the P6
data shows an overestimation. This results in a maximum absolute difference of 2 000
potentially affected people. In the last 12 hours this changes into an underestimation with a
maximum absolute difference of 800 potentially affected people. Regarding the absolute
differences the relative differences for the over- and underestimation are respectively 40
and 4 %. Furthermore a phase lag is present between both datasets. According to the curve
for the P6 dataset the dike breach directly affects the potentially affected people. For the
object datasets, on the other hand, people are potentially affected after 1,2 hours. The
number of potentially affected people in time for a dike breach in a densely populated area
is depicted in Figure 7-3.
For the sparsely populated area the patterns of the two datasets differ significantly in time:
the peaks of both datasets do not coincide and a phase lag of 2 hours is present. The P6
dataset overestimates the number of potentially affected people at all times, when
excluding the first two hours, resulting in a maximum of 360%. The number of potentially
- 54 -
affected people in time for a dike breach in a sparsely populated area is depicted in Figure
7-4.
When comparing both scenarios the scenario for the sparsely populated area shows a more
irregular and relative higher difference in performance. The absolute difference however is
much higher for the densely populated area. For both scenarios the relative differences in
the first three hours are higher compared with the total series in time. More important for
both scenarios is that the cumulative number for the P6 datasets starts the first moment the
flood begins, in contrary to the object datasets where the P6 dataset starts after a couple of
hours. These differences in performance between the two datasets can be explained by the
flood routing: if a P6 area is affected by the flood the cumulative number of affected people
starts increasing along with the flooded area since the P6 approach makes use of a ratio of
the flooded area multiplied by the sum of residents in the P6 unit. The actual flooding
(geographically) of a household is therefore not relevant for the computations with a P6
dataset. This phenomenon is shown out in Figure 7-5 and Figure 7-6: pointing out the
differences after 24 hours for both datasets, respectively for the sparsely populated and the
densely populated area. In blue the flooded area is depicted, in green the affected P6 areas
are shown and the yellow and red dots respectively point out the households contributing to
the P6 and the object orientated approach. In the figures also the difference in size of the
P6 areas for sparsely and densely populated areas can clearly be seen.
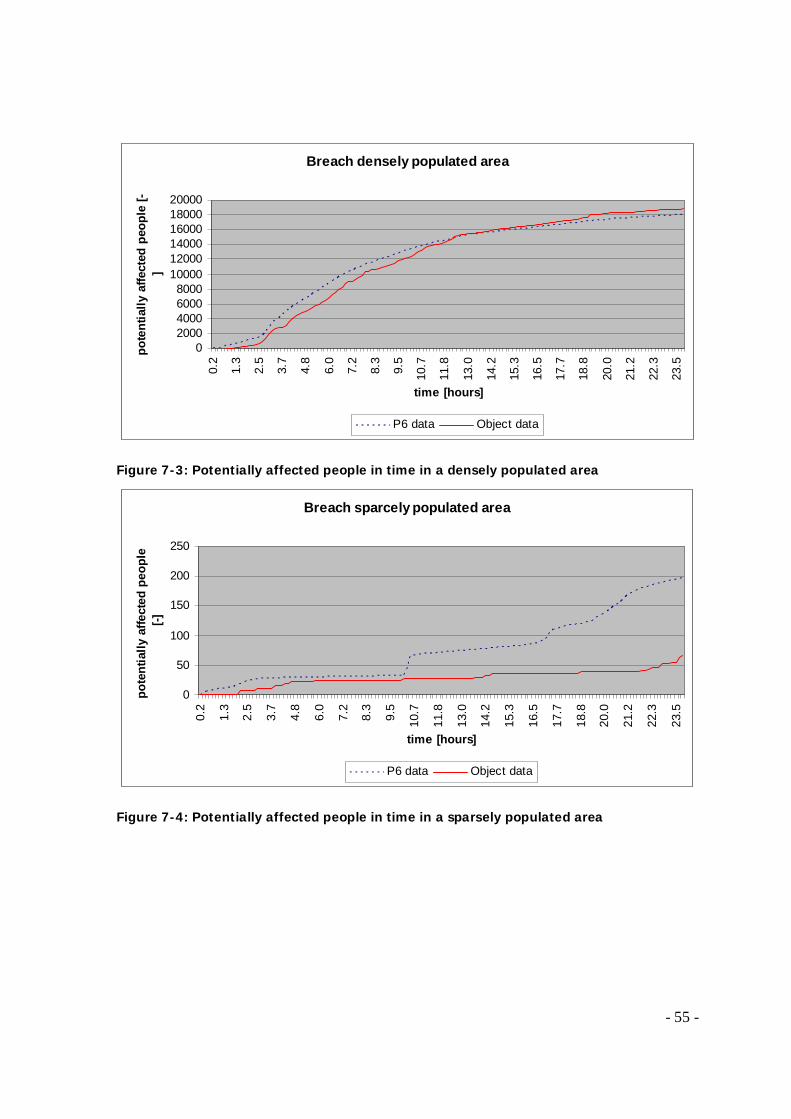
- 55 -
Breach densely populated area
02000400060008000
100001200014000160001800020000
0.2
1.3
2.5
3.7
4.8
6.0
7.2
8.3
9.5
10.7
11.8
13.0
14.2
15.3
16.5
17.7
18.8
20.0
21.2
22.3
23.5
time [hours]
pote
ntia
lly a
ffect
ed p
eopl
e [-
]
P6 data Object data
Figure 7-3: Potentially affected people in time in a densely populated area
Breach sparcely populated area
0
50
100
150
200
250
0.2
1.3
2.5
3.7
4.8
6.0
7.2
8.3
9.5
10.7
11.8
13.0
14.2
15.3
16.5
17.7
18.8
20.0
21.2
22.3
23.5
time [hours]
pote
ntia
lly a
ffect
ed p
eopl
e
[-]
P6 data Object data
Figure 7-4: Potentially affected people in time in a sparsely populated area
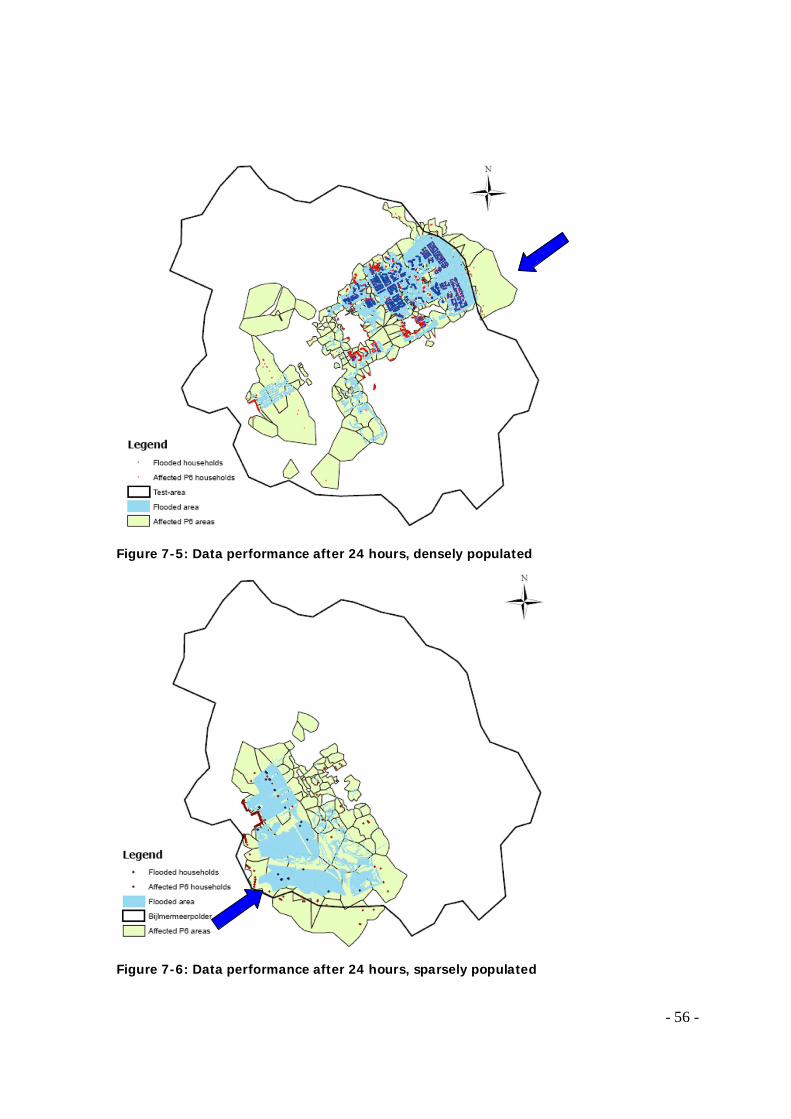
- 56 -
Figure 7-5: Data performance after 24 hours, densely populated
Figure 7-6: Data performance after 24 hours, sparsely populated
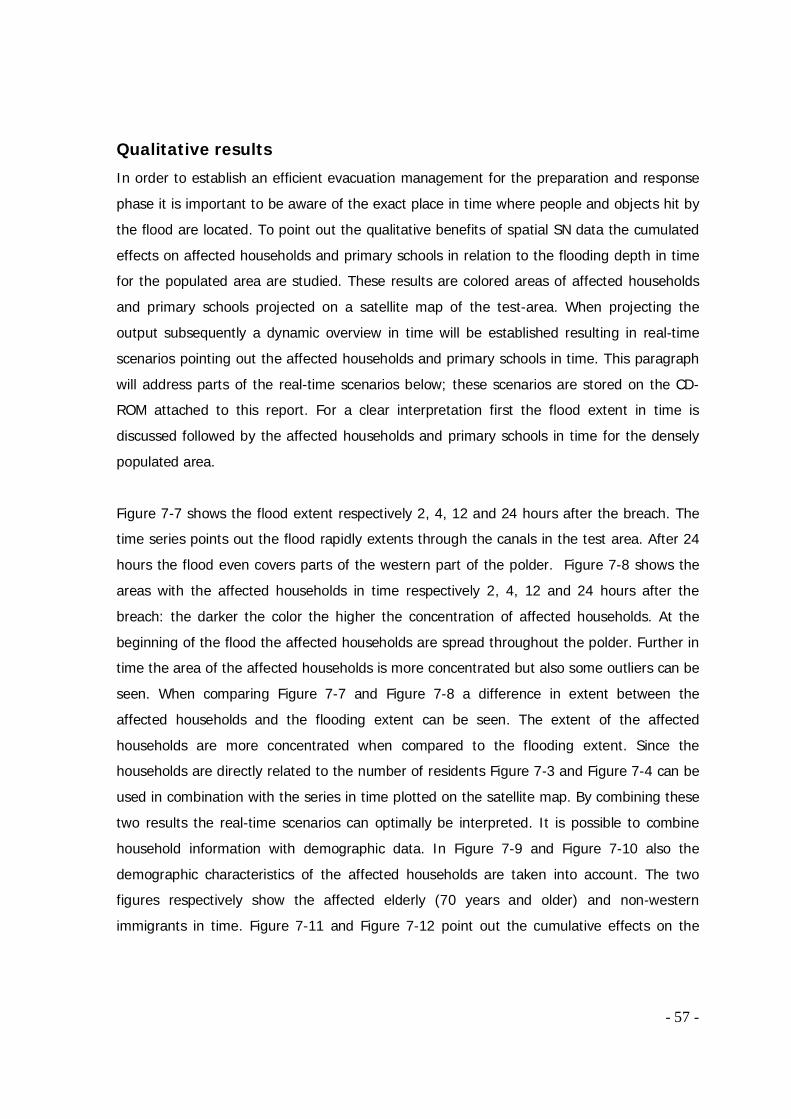
- 57 -
Qualitative results
In order to establish an efficient evacuation management for the preparation and response
phase it is important to be aware of the exact place in time where people and objects hit by
the flood are located. To point out the qualitative benefits of spatial SN data the cumulated
effects on affected households and primary schools in relation to the flooding depth in time
for the populated area are studied. These results are colored areas of affected households
and primary schools projected on a satellite map of the test-area. When projecting the
output subsequently a dynamic overview in time will be established resulting in real-time
scenarios pointing out the affected households and primary schools in time. This paragraph
will address parts of the real-time scenarios below; these scenarios are stored on the CD-
ROM attached to this report. For a clear interpretation first the flood extent in time is
discussed followed by the affected households and primary schools in time for the densely
populated area.
Figure 7-7 shows the flood extent respectively 2, 4, 12 and 24 hours after the breach. The
time series points out the flood rapidly extents through the canals in the test area. After 24
hours the flood even covers parts of the western part of the polder. Figure 7-8 shows the
areas with the affected households in time respectively 2, 4, 12 and 24 hours after the
breach: the darker the color the higher the concentration of affected households. At the
beginning of the flood the affected households are spread throughout the polder. Further in
time the area of the affected households is more concentrated but also some outliers can be
seen. When comparing Figure 7-7 and Figure 7-8 a difference in extent between the
affected households and the flooding extent can be seen. The extent of the affected
households are more concentrated when compared to the flooding extent. Since the
households are directly related to the number of residents Figure 7-3 and Figure 7-4 can be
used in combination with the series in time plotted on the satellite map. By combining these
two results the real-time scenarios can optimally be interpreted. It is possible to combine
household information with demographic data. In Figure 7-9 and Figure 7-10 also the
demographic characteristics of the affected households are taken into account. The two
figures respectively show the affected elderly (70 years and older) and non-western
immigrants in time. Figure 7-11 and Figure 7-12 point out the cumulative effects on the
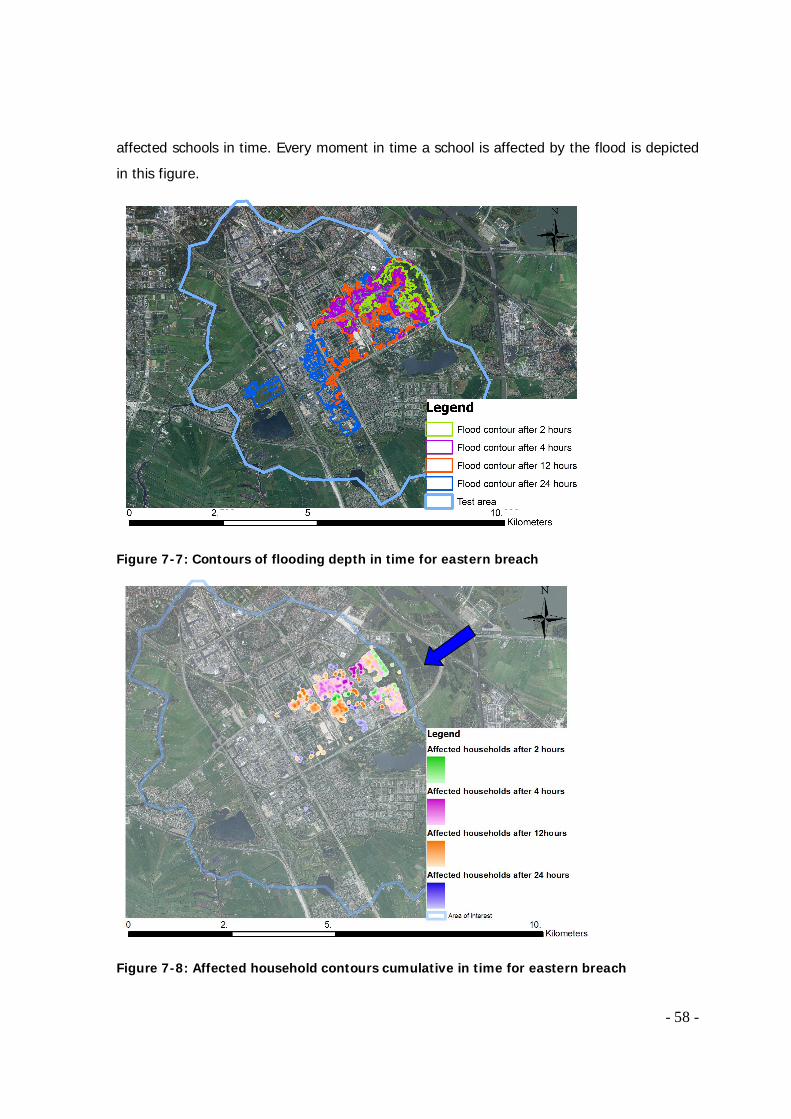
- 58 -
affected schools in time. Every moment in time a school is affected by the flood is depicted
in this figure.
Figure 7-7: Contours of flooding depth in time for eastern breach
Figure 7-8: Affected household contours cumulative in time for eastern breach
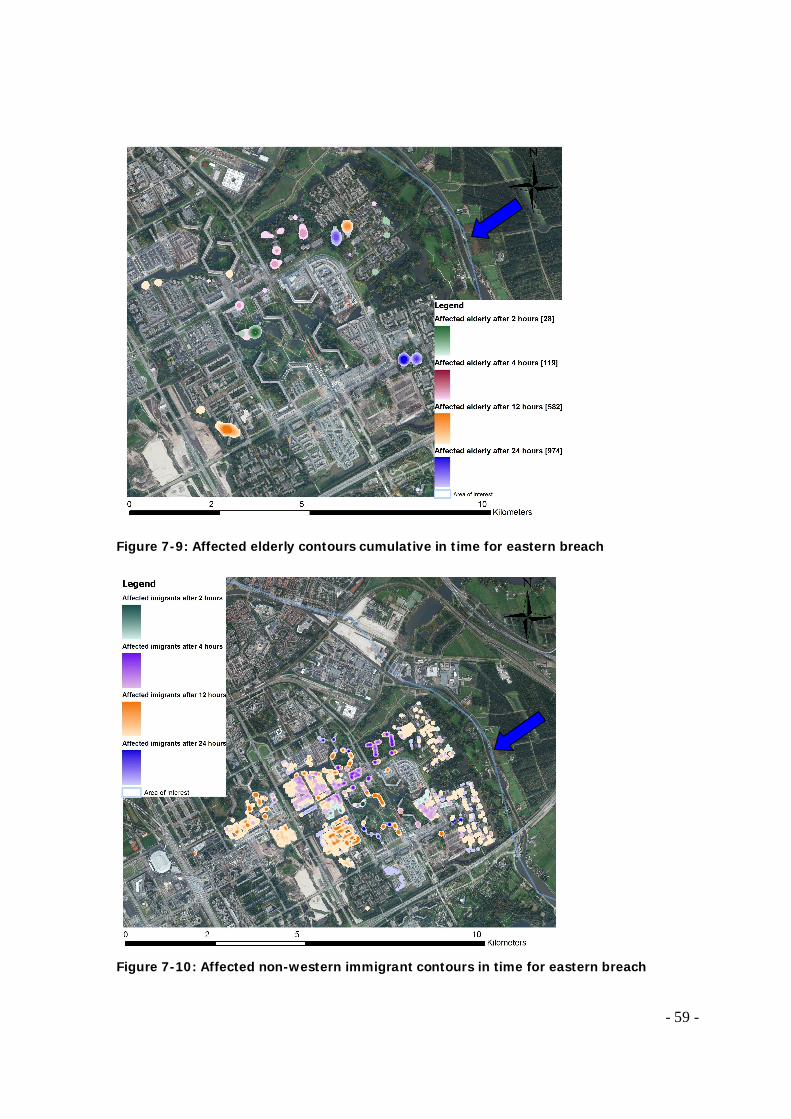
- 59 -
Figure 7-9: Affected elderly contours cumulative in time for eastern breach
Figure 7-10: Affected non-western immigrant contours in time for eastern breach
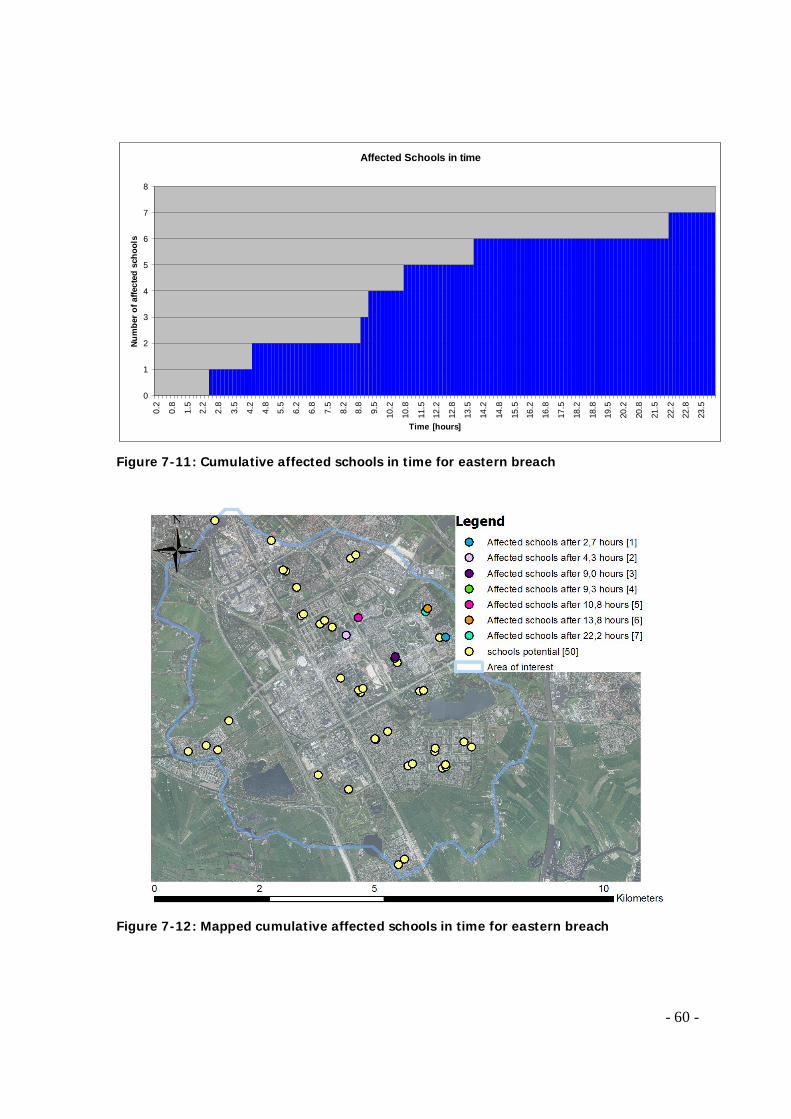
- 60 -
Affected Schools in time
0
1
2
3
4
5
6
7
8
0.2
0.8
1.5
2.2
2.8
3.5
4.2
4.8
5.5
6.2
6.8
7.5
8.2
8.8
9.5
10.2
10.8
11.5
12.2
12.8
13.5
14.2
14.8
15.5
16.2
16.8
17.5
18.2
18.8
19.5
20.2
20.8
21.5
22.2
22.8
23.5
Time [hours]
Num
ber o
f affe
cted
sch
ools
Figure 7-11: Cumulative affected schools in time for eastern breach
Figure 7-12: Mapped cumulative affected schools in time for eastern breach

- 61 -
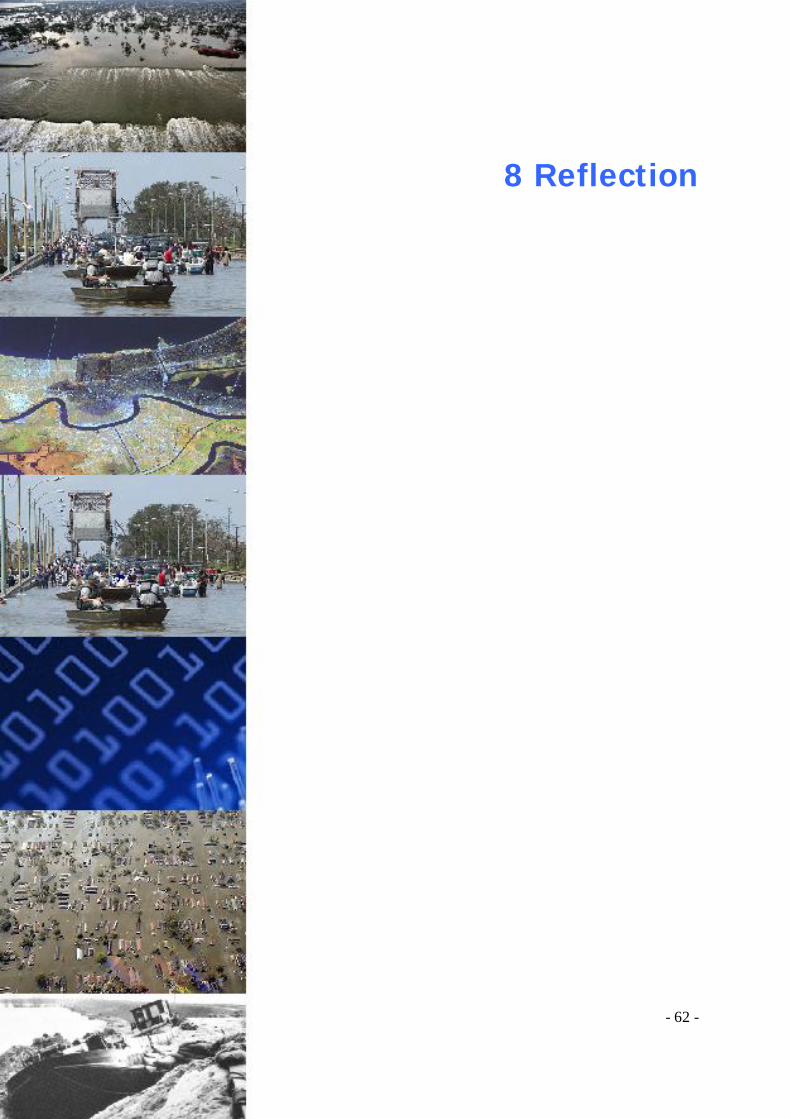
- 62 -
8 Reflection
- 63 -
8 Reflection
The coming years the sea level will keep on rising in combination with higher river
discharges. Furthermore the population in the Netherlands will increase and therefore also
the pressure on our land. Altogether this will intensify the debate on the safety of the Dutch
Delta, hence the importance of flood damage modeling. In order to maintain and evaluate
our safety standards renewing studies discussing innovative ideas and bringing new
solutions should be critically evaluated. This chapter will conclude on the additional value of
SN data within the field of flood risk management. This chapter forms a wrap up of analysis
conducted in this study by reflecting the research objective on the results of the previous
chapters. At first the limitations of this study will be pointed out followed by conclusions on
the research question. This chapter finishes with recommendations on how to optimally
integrate the SN data within the field of flood risk management.
8.1 Discussion
This report studies the challenges for elaboration on the data use for current flood damage
models and all formal stakeholders involved and tries to come up with innovative solutions
through the use of SN data. This paragraph will discuss the limitations of this study in order
to identify elements for future studies.
The data points used for this study are coupled to geographic locations based on their post
address. For some databases the geographic location of some object of interest differs from
the post address, resulting in a geographical mismatch. Sometimes the addresses are
archived improperly making it impossible to match these addresses to a geographical
location; this is the case of less than 1% of the addresses and can therefore be neglected.
Also a clear overview of all databases governed by SN is lacking. The overview is assumed
to be complete regarding the scope of this study. Since SN publications and stakeholder
demands change in time this overview should be reconsidered in the future throughout the
years in order to keep up to date. Furthermore SN has to respect privacy restriction which
implies they are not allowed to hand over databases which contain data on an individual
level to other parties.
- 64 -
In contrary to the dynamic behavior of people, demographic object databases are
geographically static. The results for the potentially affected people in time are largely
dependent by the moment in time during the day. People are mobile and can be on a
different location than their address during the day, for example children going to school
and adults to their work. Since this study and the newly developed model used fixed
databases, fluctuations of people during the day are not included within the model.
Especially for a micro-scale study as addressed here these fluctuations can influence the
results significantly. Regarding the affected people in time the best results will probably be
for a dike breach at night because in that case most people are located at their household
address. The model only studies the potential of affected people by analyzing the number of
households located in a certain small area. Parameters as factories, schools and large public
facilities are not included within the number of potentially affected people; also the
possibilities of preliminary evacuation are not taken into account. The quantitative
advantages for larger scale floods are not studied.
Regarding the accuracy of the model the DEM is the limiting factor because of its cell size
on the one hand and the inclusion of buildings on the other hand. The maximum accuracy is
formed by a cell size of 5 by 5 meters; this grid was not applicable within this model
because SOBEK has a limit to the size of the matrixes used for its computations. This grid
has the risk of a deceptive accuracy, since other parameters as a roughness coefficient are
not included into detail within this model. Furthermore the initial DEM obtains its data
trough elevation measurements. Therefore elevation is at some places determined by the
height of the roofs of buildings, roads and dikes. Especially on a micro-scale level this could
lead to an incorrect flood routing in the hydraulic model. But most importantly when using
the original DEM households will not flood according to the model since it designates their
location as dry grounds. Therefore an accurate filtering is essential.
In this model sluices are not included into the belt system. When modeling other areas it is
possible the discharge through the breach is reduced significantly when sluices are closed
during the breach, this prevents significant overestimations of the damages. Finally the used
P6 overview is self constructed, based on the GBA, and therefore the P6 areas are
geographically not completely similar with the original P6 map provided by Cendris (Cendris,
- 65 -
2009). The intention of this study is to compare aggregated data with object data; therefore
it is assumed the results are reliable and sufficiently similar when computed with the official
P6 map provided by Cendris.
8.2 Conclusions
Goal of this study is to study whether it is beneficial to apply SN object data within the field
of flood risk management. In order to provide an answer to this question it is important to
know what the present knowledge on flood damage modeling and the opportunities are (1),
which stakeholder requires what information at what moment in time (2), what relevant
object SN data is at hand (3) and how a sound coupling between SN data and flood damage
data can be designed (4).
What is the present knowledge on flood damage modeling and the
opportunities?
The international spectrum of flood damage is formed by economic damage models, which
mainly focus on direct, tangible damages. Depending on their interests, these models differ
of spatial scale. The flooding depth and extend are the most commonly used measures to
describe the character of a flooding event. Moreover, the use of other flood characteristics is
hardly incorporated. In contrast to the Standard Method, used in the Netherlands, most
international models make use of object databases. Regarding the contents of the used data
the Standard Method uses the most elaborate set of parameters, though there is still room
for improvements (4.3). Furthermore all models make use of the end results of a flood
disaster and do not study the damage processes during the time of flooding. For future use
international challenges lay within elaboration of parameters by incorporating intangible and
indirect damages, an interpretation of parameters in time and the use of more hydraulic
characteristics. For the Dutch situation a shift from aggregated to object oriented databases
will enhance the accuracy and applications of flood damage modeling.
- 66 -
Which stakeholder requires what information at what moment in
time?
Interviews with stakeholders point out a strong demand for more elaborate data supply and
scenarios planning in a qualitative and a quantitative way. Qualitatively a more detailed
(less capable of evacuating, critical hubs for electricity and drink water supply, pollution
sources) and tailor-made scenario planning per stakeholder is preferred. Also data should be
updated more frequently and damage calculations should be improved. Quantitatively a
higher level of detail is preferred. SN is able to keep up with these demands through the
use of object data. To point this out a new framework is developed, based on the safety
chain (Table 6-2). The newly developed framework points out the tasks per stakeholder
moment in time. These tasks are coupled to the applicable object databases of SN.
What relevant object SN data is at hand?
Relevant, available databases at SN for flood damage modeling on a micro scale level are
object databases because these databases can be coupled to an exact spatial location. At
SN 15 databases, containing over 300 parameters, are applicable in the field of flood risk
management. These databases enable more detailed computations and regional
differentiation. When the geographic information is interpreted in time a tailor-made and
more elaborate scenario planning can be established, for example an optimal evacuation
routing for the police. Furthermore they can be of use for estimations on under lighted
aspects as environmental subjects, public services, cultural damage and detailed information
on evacuation and emergency. At last SN data is updated annually, this forms an increase in
frequency compared to the Standard Method in which information is updated once every
four years.
The results of this study are based on data within the ACN, GBA, SSB, Primary Schools and
NAV databases. The GBA and SSB databases include data on the affected people in time
and their demographic characteristics. This demographic information enables a more
elaborate scenario planning in case of flooding. For example the locations with high
densities of people less capable of evacuating can be mapped for evacuation planning. Or
locations with high densities of immigrants can be pointed out to adjust warning messages.
The SSB database also contains WOZ values. The WOZ database forms an addition to the
- 67 -
Standard Method because it enables regional differentiation and more detailed estimation
on flood damages to houses. The vulnerable objects depicted in the map on evacuation
management are incorporated within the Primary Schools and NAV databases. This
overview can be elaborated with data form other databases (see Appendix D). A total
overview of all applicable SN object data regarding themes or stakeholders can be found in
the newly developed framework in Table 6-2.
How to design a sound coupling between SN data and flood damage
data?
By geographically coupling SN databases with hydraulic data in time, including the
challenges pointed out above, a newly developed high quality micro-scale model is
constructed. Model results point out the additional value of object SN data in a qualitative
and quantitative manner. Qualitatively it shows the possibility to convert static SN data into
dynamic information in time: pointing out the exact location of vulnerable objects and
groups in time. This enables a strategic, efficient and hands-on crisis management planning
for, in example, helpservices. Quantitatively the results point out SN offers a significant
improvement in accuracy in comparison to P6 data for the estimation of potentially affected
people in time. The differences are most significant for sparsely populated areas, which
have with large P6 units.
Altogether SN data forms an additional value in the field of flood risk
management: qualitatively for real time, tailor-made, micro-scale studies on the
one hand and quantitatively for relatively small, sparsely populated areas on the
other hand. This can be modeled through geographic referencing of hydraulic
models and SN data.
8.3 Recommendations
This study forms a starting point for the positioning of SN in the field of flood risk
management, since SN governs a large amount of value information for flood risk
management. However a change in organization is advisable. It could be beneficial to create
awareness within SN on the additional value its data within the field of flood risk
- 68 -
management. This way new ideas can be initiated and the overview of applicable data in
this report (Table 6-2) can be elaborated. The already ongoing shift from aggregated data
to object data should be stimulated within SN: all applicable data points should be coupled
to the geographical location.
In order for the micro scale model to function properly a filtered DEM is required. Buildings
should be excluded as well as parts of infrastructural objects where water pass under. When
filtered it is to be recommended to model the locations of buildings with a lower roughness
coefficient in comparison with other types of land use to model a realistic flood routing.
Furthermore it is important to model the test-area into detail, especially the boundary areas,
since DEM, SOBEK and SN data are spatially coupled. When modeled inaccurately it is
possible houses located on a dike in reality can be located within the flooded area or even in
a canal resulting in an overestimation of flooded households. Also attention need to be paid
to the number of affected people in time and elevation. People are dynamic and are often
located at a different location during the day and when they live in a flat their need for
evacuation is less urgent in comparison to those who live in a bungalow. Thereby preventive
evacuation of affected people needs to be included in the model. The currently under
development “distance statistics” of SN can fill an important role in this aspect but also a
combination with evacuation models can be beneficial for the results. At last sluices,
closures and emergency structures in waterways need to be included in the hydraulic model
to prevent an overestimation of the discharge.
Since flooding impacts touch up on a broad range of different disciplines an integral
approach into flood damages is required: engineers, sociologist and economists need to
cooperate in determine all consequences of a flood (tangible, intangible, direct and indirect).
For an efficient crisis management it is also to be recommended to compute every possible
scenario in advance. When the dynamic behavior of people is taken into even different
moments during the day should be computed in advance. When combined in thematic maps
every stakeholder has directly access to tailor-made information at the moment of crisis
management. Subsequently SN can publish these scenarios online for relevant stakeholders
respecting its privacy legislations.
- 69 -
In the future SN can offer its services through object databases for a wider application
within disaster management. Regarding flood disasters data on companies, schools etc. can
be elaborated with the numbers of respectively employees and students. Furthermore
evacuation scenarios can be elaborated by additional data on supply of food and water by
mapping supermarkets and shopping malls, locations for shelter like sport complexes and
temporary housing, emergency transport by (mal)functioning of public facilities as roads, rail
and big bus parking places can be highlighted as well as the (mal)functioning of vital
infrastructure as sewerage, ICT, gas, electricity etc. In a broader sense a coupling of
geographic data on pollution sources with hydraulic models can be constructed to map eco-
toxological disasters, which subsequently can be coupled to demographic databases to
estimate impact on society. Another example in a broader sense is the application of WOZ
values to enhance economic damages estimation within the Standard Method.

- 70 -
9 References
- 71 -
9 References
AGV. (2007). "Water Board Amstel, Gooi and Vecht (AGV)." from www.agv.nl. Buck, W. (2006). Zweckorientierte Aufstellung von Wasserstands-Schadensfunktionen. Proceedings of the International Conference "Strategies and Instruments fort he Improvement of a preventive Flood Protection Tangermünde": 23-25. BZK (1993). Integrated Safety Report. The Hague, Ministry of the Interior. Cappendijk-de Bok, A. M. (2004). Inwoners buitendijks. Rijkswaterstaat. Cendris (2009). Čihek F, F. P., Satrapa L (2005). Methodology for the evaluation of flood defence measures proposed for II. stage of the "Flood prevention" program. Colijn, F., M. Hamnann, S. Reese, T. Rohr (2000). Wertermittlung für die potenziell sturmflutgefährdeten Gebiete an den Küsten Schleswig-Holsteins, Ministeriums für ländliche Räume, Landesplanung, Landwirtschaft und Tourismus des Landes Schleswig-Holstein. Commission, E. (2005). European Pollutant Emission Register - EPER. E. Union. DEFRA (2001). National Appraisal of Assets at Risk from Flooding and Coastal Erosion, including the potential Impact of Climate Change. Final Report, Department For Environment, Food and Rural Affairs. DEFRA (2004). Making space for water: Developing a new government strategy for flood and coastal erosion risk management in England: A consultation exercise. London, Department For Environment, Food and Rural Affairs. Deltares (2006). SOBEK. 2.11. Delft, Deltares. Dutta, D., Herath, S., Musiake, K. (2003). "A mathematical model for flood loss estimation." Journal of Hydrological Processes: 24-49. EP (2008). Richtlijn Overstromings Risico´s. E. Parlement. ESRI (2008). ArcGIS Desktop. 9.3. FEMA (2006). Technical Manual van HAZUS®MH MR2. U.S. Multi-Hazard Flood Model, Federal Emergency Management Agency. FHRC. (2004). "Flood Hazard Research Centre." from www.fhrc.mdx.ac.uk. Google (2009). "Google Maps." Heerkens, R. (2003). Inventarisatie van de verzekerbaarheid van schade als gevolg van extreme regenval en wateroverlast.
- 72 -
Hermans, L. M. (2005). Actor analysis for water resources management. Delft, Delft University of Technology. PhD thesis: 245. Higler, L. W. G., J.W.H. Elbersen, P.F.M. Verdonkschot (2002). Definitiestudie ecologische effecten van laagwater. Een verkenning van de effecten van laagwater op de levensgemeenschappen van regionale wateren. Wageningen, Alterra. Jensen, B. J. (1994). The dynamic system of basic economic growth models, Kluwer Acedemic Publishers. Jonkman, S. N., B. Maaskant, E. Boyd, M.L. Levitan (2009). "Loss of Life Cause by the Flooding of New Orleans after Hurricane Katrina: Analysis of the Relationship Between Flood Characteristics and Mortality." Risk Analysis 29(Society for Risk Analysis): 23. Jonkman, S. N., E. Penning-Rowsell (2008). "Human instability in flood flows." Journal of the American Water Resources Association 44(5). Jonkman, S. N., M. Bočkarjovab, M. Kok, P. Bernardini (2007). "Integrated hydrodynamic and economic modelling of flood damage in the Netherlands." Ecological Economics 66(1): 77-90. Jonkman, S. N., Vrijling, J.K., Vrouwenvelder, A.C.W.M. (2008). "Methods for the estimation of loss of life due to floods: a literature review and a proposal for a new method." Natural Hazard 46: 353-389. Jorritsma-Lebbink, A. (1995). Wet op de Waterkering. M. v. V. e. Waterstaat. Den Haag, Ministerie van Verkeer en Waterstaat. Knabb, R., R. Rhome and P. Brown (2005). Tropical Cyclone Report, National Hurricane Center: 12. Kok, M. (2005). Een waterverzekering in Nederland: mogelijk en wenselijk?, Adviescommissie Water: 3. Kok, M., H.J. Huizinga, A.C.W.M. Vrouwenfelder, A. Barendregt (2004). Standard Method 2004. Damage and Casualties caused by Flooding, Highway and Hydraulic Engineering Department. Kok, M., Lammers, I.B.M., Vrouwenvelder, A.C.W.M., van den Braak, W.E.W. (2006). Standaardmethode2006-beta Schade en Slachtoffers als gevolg van overstromingen, Rijkswaterstaat DWW. Kok, M., R. Versteeg (2001). Normensystematiek voor Wateroverlast in Regionale Watersystemen. Het Waterschap. 3: 132-139. Kolen, B., C.A.H. Wouters (2007). Als het toch misgaat: Overstromingsscenario's voor rampenplannen, 2007. Delft, Rijkswaterstaat - Waterdienst. Maas, C. (2004). Visie op regionale waterkeringen. The Hague, Unie van Waterschappen & IPO: 53. Messner, F., Meyer, V. (2007). Evaluating flood damages: guidance and recommendations on principles and methods, FLOODsite. 2007. Meyer, V., F. Messner (2005). Interview with Merkuria Beyene from the Engineering Consultancy ProAqua. Aachen. Meyer, V., Messner, F. (2005). National Flood Damage Evaluation Methods. Leipzig, UFZ.
- 73 -
Meyer, V., Messner, F. (2005). National Flood Damage Evaluation Methods – A Review of Applied Methods in England, the Netherlands, the Czech Republic and Germany, UFZ. Ministerie-van-Verkeer-en-Waterstaat (2006). Ruimte voor de Rivier. Ministerie-van-Verkeer-en-Waterstaat. The Hague, Ministerie van Vekeer en Waterstaat. Morselt, T., Evenhuis, E. (2006). Review HIS-SSM, Dienst Weg- en Waterbouwkunde, Rijkswaterstaat. Mostert, E. (2007). Water Law and Organisation. Delft, Delft University of Technology. MURL (2000). Hochwasserschadenspotentiale am Rhein in Nordrhein-Westfalen. Abschlussbericht, MINISTERIUM FÜR UMWELT, RAUMORDNUNG UND LANDWIRTSCHAFT DES LANDES NORDRHEIN-WESTFALEN. Nelen&Schuurmans (2008). Lizard. Utrecht, Nelen&Schuurmans. Nelen&Schuurmans (2008). Lizard kadebreuk - Uitgangspunten notitie en functioneel ontwerp. Utrecht: 37. Parker, D. J. (2000). Flood - volumes 1 and 2. London, Routledge. Penning-Rowsell, E. C. E., C. Johnson, S. Tunstall, S.Tapsell, J. Morris, J. Chatterton, A. Coker, C. Green (2005). The Benefits of Flood and Coastal Risk Management: A Manual of Assessment Techniques. Enfield, Middlesex University Press. ProAqua, P., RWTH (2001). Studie zur Hochwasserschadensminderung an der baden-württembergischen Donau. Integriertes Donau-Programm - Risikoanalyse Donau. PythonSoftwareFoundation (2009). Python. 2.6.2, Python Software Foundation. Ranis, G., Stewart, F. and Angeles-Reyes, E. (1990). Linkages in Developing Economies: A Philippine Study. San Fransisco, International Center for Economic Growth. Reese, S. (2003). Die Vulnerabilität des schleswig-holsteinischen Küstenraumes durch Sturmfluten. Fallstudien von der Nord- und Ostseeküste. Kiel, Universität Kiel. Richardson (2005). Socio economical impacts of floods. Rijkswaterstaat (2005). Actueel Hoogtebestand Nederland. Lelystad, Rijkswaterstaat. Rijkswaterstaat (2005). Flood risks and safety in the Netherlands — full report. D. r. 2006-014. Delft, Ministry of Transport, Public Works and Water Management. Sayers P., J. H., R. Dawson, C. Rosa, J. Chatterton, R. Deakin (2002). Risk assessment of flood and coastal defences for strategic planning (RASP) - a High Level Methodology. DEFRA Conference for Coastal and River Engineers. Smith, K., Ward, R. (1998). Floods - Physical Processes and Human Impacts. Chichester. SN. (2007). "CBS in uw buurt." from www.cbsinuwbuurt.nl. Stelling, G., Verwey, A. (2005). "Numerical Flood Simulation." Encyclopedia of Hydrological Sciences.
- 74 -
ten Brinke, W. B. M. (2008). "Safety chain approach in flood risk management." Municipal Engineer 6(ME2). TMO. (2007). "Platform Overstromingen - Welke Veiligheidsnormen kent Nederland?" from www.platformoverstromingen.nl. Van der Knaap, F. C. M. (2000). Breach growth as a function of time. Delft, Deltares. Veiligheidsregio Utrecht, V. G. e. V. (2008). Rampenbestrijdingsplan (dreiging) Dijkdoorbraak Kromme Rijn, Dijkring 44. Hilversum: 262. Ven van de, F. (2007). watermangement in Urban Areas, Delft University of Technology. Wijdeveld, A. (2007). Toxic Stress. Development and use of the OMEGA Modelingframework in a Case Study - Final Report, FLOODsite: 84. Wijdeveld, A. (2009). E-mail correspondention with A. Wijdeveld. J. T. M. Kuilboer. Delft. Zaanstreek-Waterland, V. (2007). GRIP op hulpverlening, Veiligheidsregio Zaanstreek-Waterland: 26.

- 75 -
- 76 -
Appendixes
- 77 -
Appendix A Water Damage Processes in detail Below the water damage processes as discussed in chapter 2 are discussed more into detail.
The classification of HKV is elaborated with information on urban water management (Ven
van de, 2007).
Water surplus 1. Water damage in house
In-house damage can be caused internal for example by leakage of a water main, waterbed
or a aquarium or external when for example a roof is leaks during rainfall.
2. High ground water levels
High ground water levels can flood basements, moisture in walls, flooding of gardens and
can cause rotting of foundations when the water table lowers again.
3. Overload sewer system
In urban areas the sewer system is sometimes not able to cope with intense rainfalls; when
a lot of water falls within a short amount of time. This results in water on the streets, which
normally does not cause a lot of damage. But in some cases when the water flows from the
street into the house because of for example a missing threshold or when it enters the
house via the sewer system this sub-process can cause damage.
4. Flooding from regional surface water
In case of intensive rainfall events sometimes the regional water system is not able to store
all the surface run-off water. When this system is overloaded water is able to flow from the
water system via the surface level into houses (Kok, 2001).
5. Failure or overtopping of regional water defence system
Failure of the regional water defence system differs from the primary water defence system
regarding legislation. Regional water defence is governed by provincial government, this
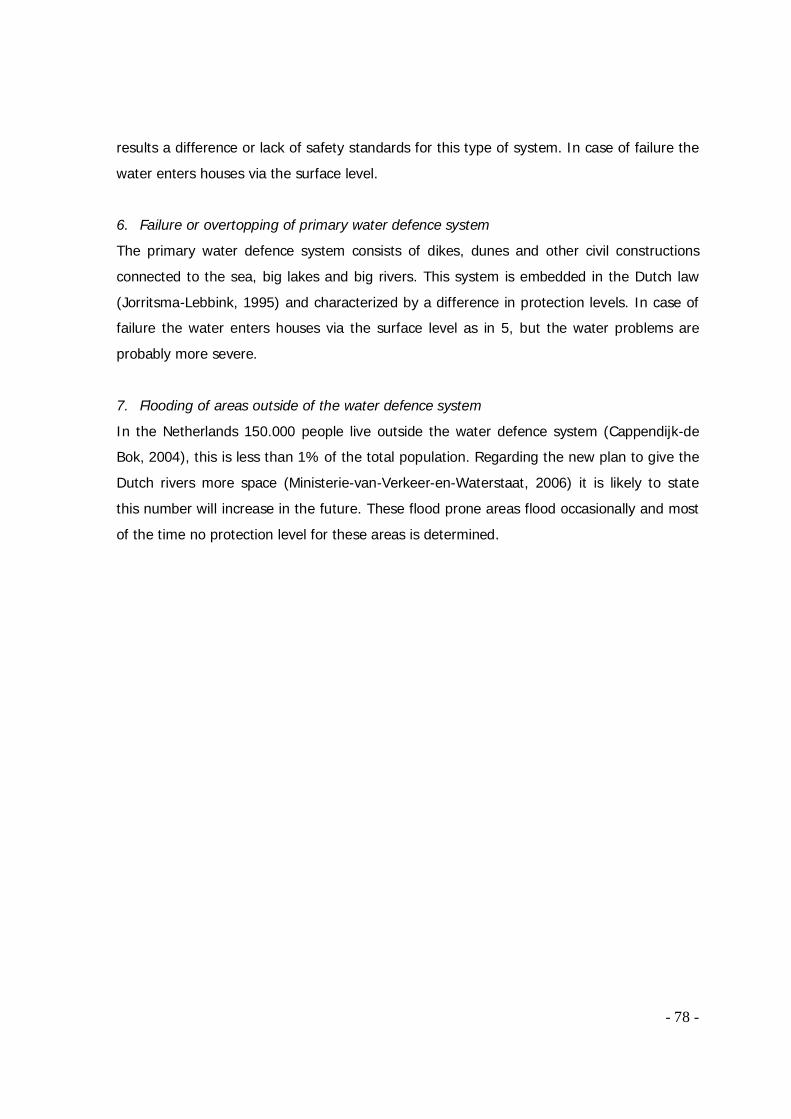
- 78 -
results a difference or lack of safety standards for this type of system. In case of failure the
water enters houses via the surface level.
6. Failure or overtopping of primary water defence system
The primary water defence system consists of dikes, dunes and other civil constructions
connected to the sea, big lakes and big rivers. This system is embedded in the Dutch law
(Jorritsma-Lebbink, 1995) and characterized by a difference in protection levels. In case of
failure the water enters houses via the surface level as in 5, but the water problems are
probably more severe.
7. Flooding of areas outside of the water defence system
In the Netherlands 150.000 people live outside the water defence system (Cappendijk-de
Bok, 2004), this is less than 1% of the total population. Regarding the new plan to give the
Dutch rivers more space (Ministerie-van-Verkeer-en-Waterstaat, 2006) it is likely to state
this number will increase in the future. These flood prone areas flood occasionally and most
of the time no protection level for these areas is determined.
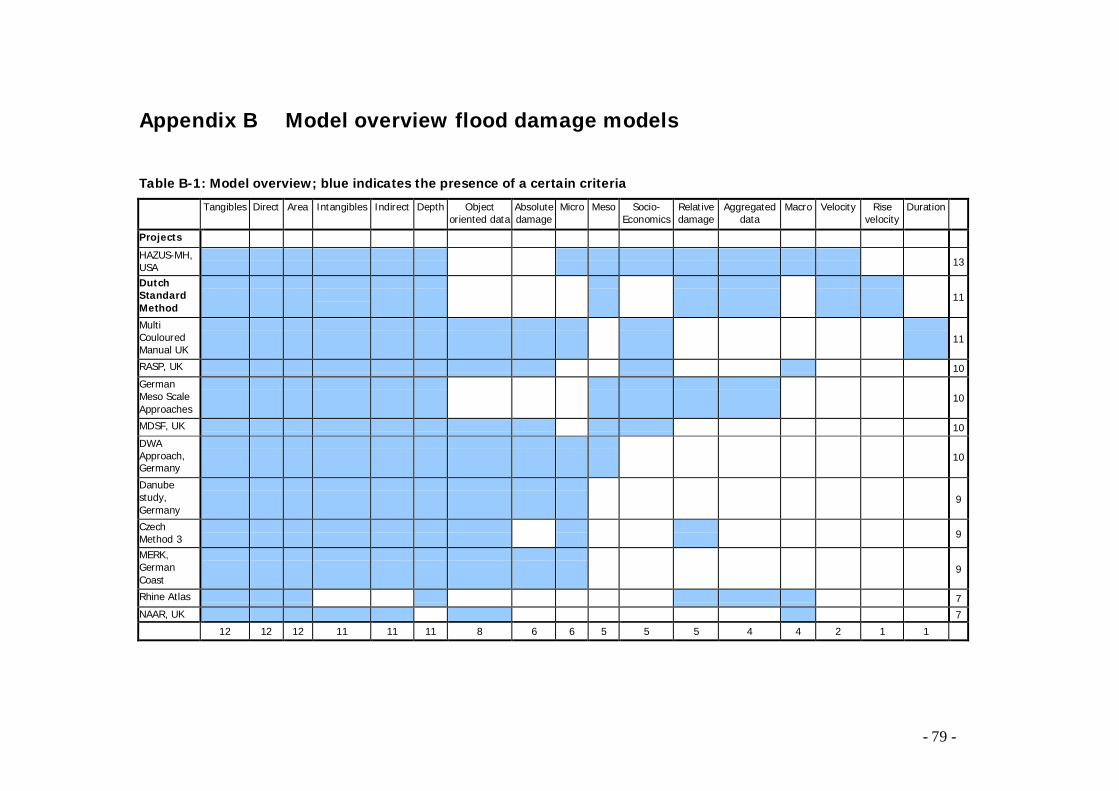
- 79 -
Appendix B Model overview flood damage models
Table B-1: Model overview; blue indicates the presence of a certain criteria
Tangibles Direct Area Intangibles Indirect Depth Object oriented data
Absolute damage
Micro Meso Socio-Economics
Relative damage
Aggregated data
Macro Velocity Rise velocity
Duration
Projects HAZUS-MH, USA
1 1 1 1 1 1 1 1 1 1 1 1 1 13
Dutch Standard Method
1 1 1 1
1 1 1 1 1 1 1 11
Multi Couloured Manual UK
1 1 1 1 1 1 1 1 1 1 111
RASP, UK 1 1 1 1 1 1 1 1 1 1 10 German Meso Scale Approaches
1 1 1 1 1 1 1 1 1 1 10
MDSF, UK 1 1 1 1 1 1 1 1 1 1 10 DWA Approach, Germany
1 1 1 1 1 1 1 1 1 1 10
Danube study, Germany
1 1 1 1 1 1 1 1 1 9
Czech Method 3
1 1 1 1 1 1 1 1 1 9
MERK, German Coast
1 1 1 1 1 1 1 1 1 9
Rhine Atlas 1 1 1 1 1 1 1 7 NAAR, UK 1 1 1 1 1 1 1 7 12 12 12 11 11 11 8 6 6 5 5 5 4 4 2 1 1
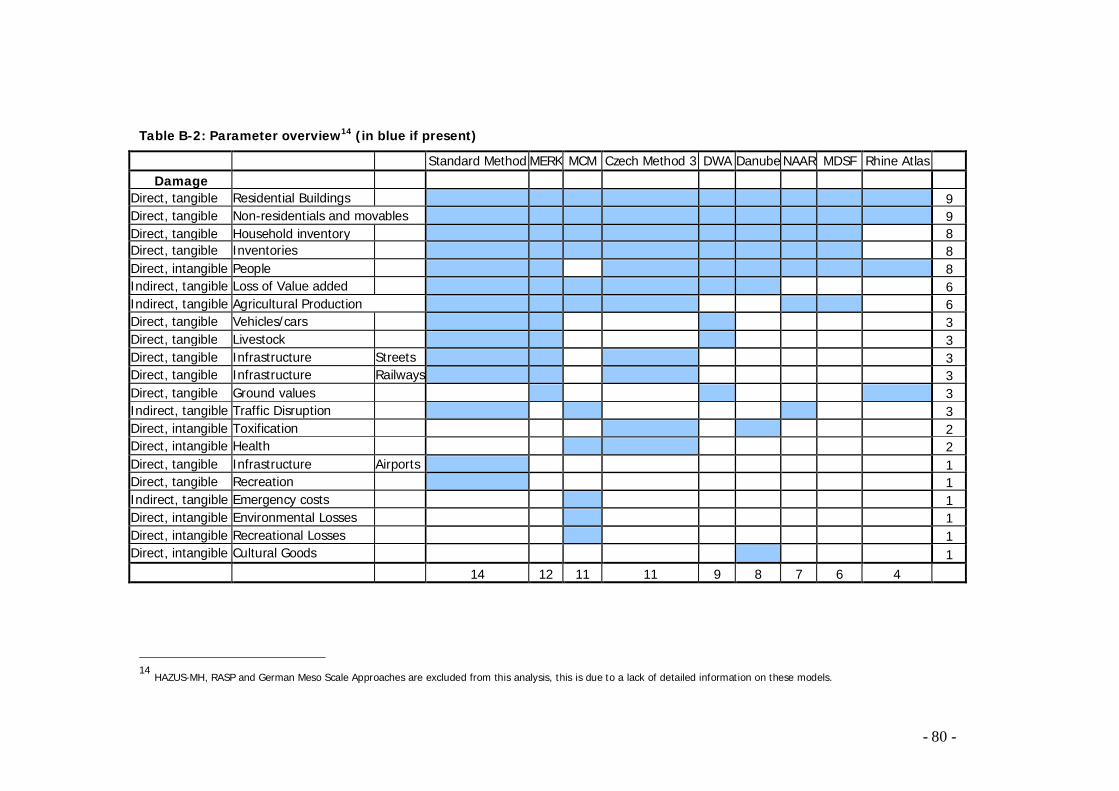
- 80 -
Table B-2: Parameter overview14 (in blue if present)
Standard Method MERK MCM Czech Method 3 DWA Danube NAAR MDSF Rhine Atlas Damage
Direct, tangible Residential Buildings 1 1 1 1 1 1 1 1 1 9 Direct, tangible Non-residentials and movables 1 1 1 1 1 1 1 1 1 9 Direct, tangible Household inventory 1 1 1 1 1 1 1 1 8 Direct, tangible Inventories 1 1 1 1 1 1 1 1 8 Direct, intangible People 1 1 1 1 1 1 1 1 8 Indirect, tangible Loss of Value added 1 1 1 1 1 1 6 Indirect, tangible Agricultural Production 1 1 1 1 1 1 6 Direct, tangible Vehicles/cars 1 1 1 3 Direct, tangible Livestock 1 1 1 3 Direct, tangible Infrastructure Streets 1 1 1 3 Direct, tangible Infrastructure Railways 1 1 1 3 Direct, tangible Ground values 1 1 1 3 Indirect, tangible Traffic Disruption 1 1 1 3 Direct, intangible Toxification 1 1 2 Direct, intangible Health 1 1 2 Direct, tangible Infrastructure Airports 1 1 Direct, tangible Recreation 1 1 Indirect, tangible Emergency costs 1 1 Direct, intangible Environmental Losses 1 1 Direct, intangible Recreational Losses 1 1 Direct, intangible Cultural Goods 1 1
14 12 11 11 9 8 7 6 4
14 HAZUS-MH, RASP and German Meso Scale Approaches are excluded from this analysis, this is due to a lack of detailed information on these models.
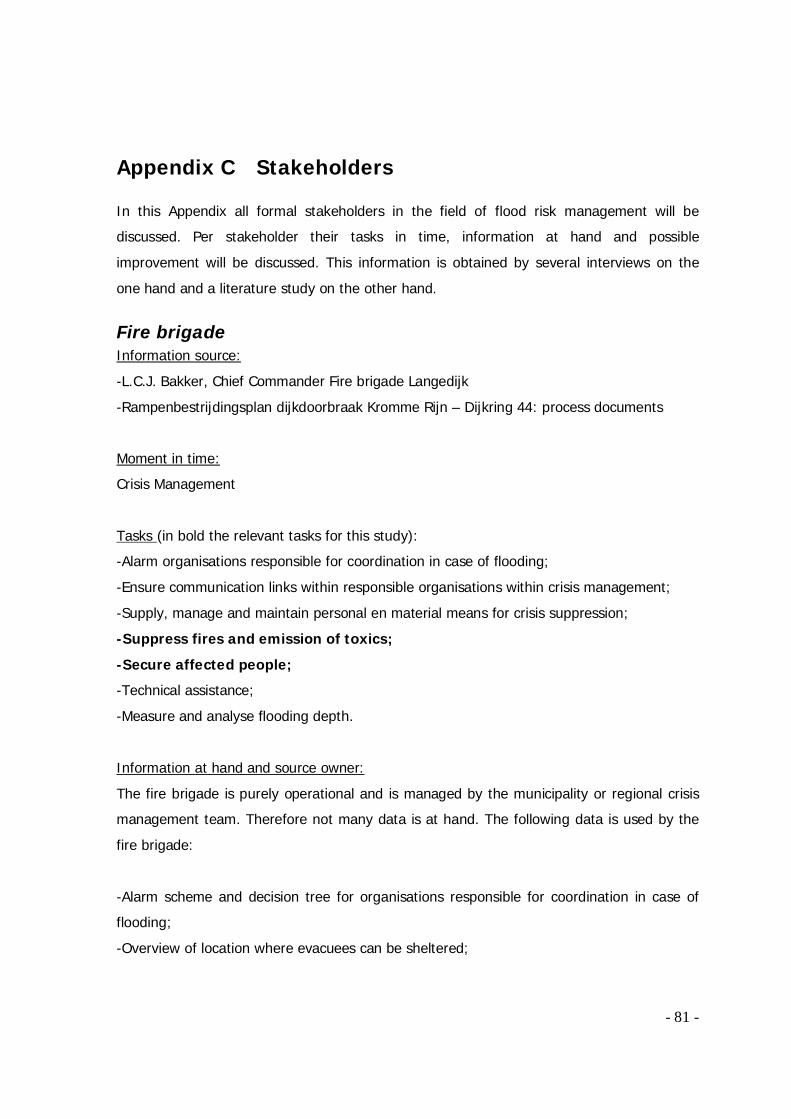
- 81 -
Appendix C Stakeholders In this Appendix all formal stakeholders in the field of flood risk management will be
discussed. Per stakeholder their tasks in time, information at hand and possible
improvement will be discussed. This information is obtained by several interviews on the
one hand and a literature study on the other hand.
Fire brigade Information source:
-L.C.J. Bakker, Chief Commander Fire brigade Langedijk
-Rampenbestrijdingsplan dijkdoorbraak Kromme Rijn – Dijkring 44: process documents
Moment in time:
Crisis Management
Tasks (in bold the relevant tasks for this study):
-Alarm organisations responsible for coordination in case of flooding;
-Ensure communication links within responsible organisations within crisis management;
-Supply, manage and maintain personal en material means for crisis suppression;
-Suppress fires and emission of toxics;
-Secure affected people;
-Technical assistance;
-Measure and analyse flooding depth.
Information at hand and source owner:
The fire brigade is purely operational and is managed by the municipality or regional crisis
management team. Therefore not many data is at hand. The following data is used by the
fire brigade:
-Alarm scheme and decision tree for organisations responsible for coordination in case of
flooding;
-Overview of location where evacuees can be sheltered;
- 82 -
-Reachability maps, constructed by municipality and fire brigade;
-Special objects (schools, libraries etc.): number of visitors and personnel and other
specialties, constructed by municipality and fire brigade.
Type of information:
Detailed information maps based on GBKN (grootschalige basiskaart) of the concerned
municipality alone.
Improvements:
-Higher frequency of updating data (often information is outdated, 4 years according to field
study).
-A higher level of detail within communication, maps where vulnerable objects and pollution
sources are determined. For example “Risicokaart voor professionals”;
-A prediction of different scenarios in which flooded areas and crisis management models
are included;
-An overview of pollution sources;
-An overview of affected people.
GHOR Information source:
Rampenbestrijdingsplan dijkdoorbraak Kromme Rijn – Dijkring 44: process documents
Moment in time:
Crisis Management
Tasks (in bold the relevant tasks for this study):
-Evacuate casualties and limit physical damage;
-Evacuate people less capable evacuating;
-Preventive public healthcare ;
-Psychological health aid.
- 83 -
Information at hand:
The fire brigade is purely operational and is managed by the regional crisis management
team. Therefore not many data is at hand. The following data is used by the GHOR:
-Overview per scenario of flooded ambulance posts.
Improvements:
-Real-time overview of flooded ambulance posts;
-Overview of sources threatening public healthcare and pollution sources;
-Overview of locations with people less capable of evacuating.
Government Information source:
National Crisis Plan – High water and flooding, part I: policy report
Moment in time:
Risk management and crisis management
Governmental organisations involved:
-BZK (Ministry of internal affairs);
-EZ (Ministry of Economics);
-FZ (Ministry of Finance);
-LNV (Ministry of Agriculture, Nature and Livestock);
-OCW (Ministry of Education, Culture and Science);
-V&W (Ministry of Roads and Transport);
-VROM (Ministry of Housing, Public Planning and Environment);
-VWS (Ministry of Public Health and Sport).
National prioritization:
In case of interregional flooding coordination of the national government is required. This is
broadly underlined within the field of water management. The most important ministries in
case of flooding are the ministries of V&W and BZK. The ministry of V&W is responsible for
the national water management and coordinates the operational organisation
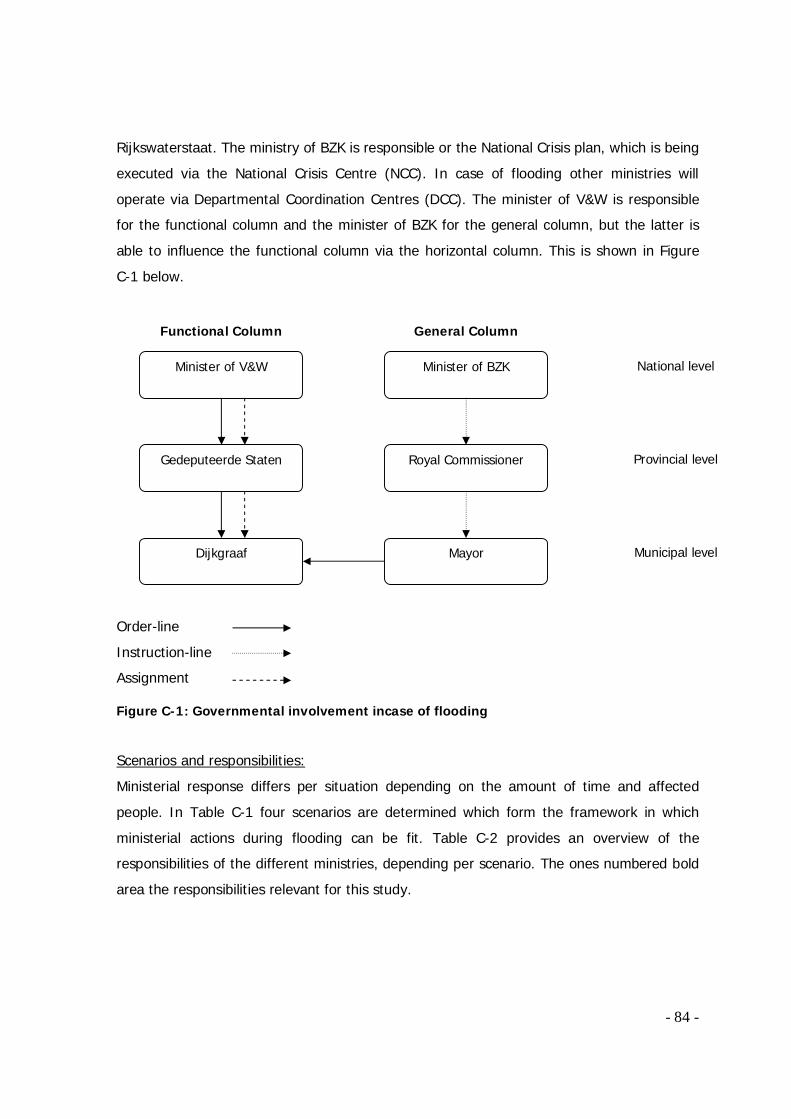
- 84 -
Rijkswaterstaat. The ministry of BZK is responsible or the National Crisis plan, which is being
executed via the National Crisis Centre (NCC). In case of flooding other ministries will
operate via Departmental Coordination Centres (DCC). The minister of V&W is responsible
for the functional column and the minister of BZK for the general column, but the latter is
able to influence the functional column via the horizontal column. This is shown in Figure
C-1 below.
Order-line
Instruction-line
Assignment
Figure C-1: Governmental involvement incase of flooding
Scenarios and responsibilities:
Ministerial response differs per situation depending on the amount of time and affected
people. In Table C-1 four scenarios are determined which form the framework in which
ministerial actions during flooding can be fit. Table C-2 provides an overview of the
responsibilities of the different ministries, depending per scenario. The ones numbered bold
area the responsibilities relevant for this study.
Functional Column General Column
Minister of V&W
Gedeputeerde Staten
Dijkgraaf
Minister of BZK
Royal Commissioner
Mayor
National level
Provincial level
Municipal level
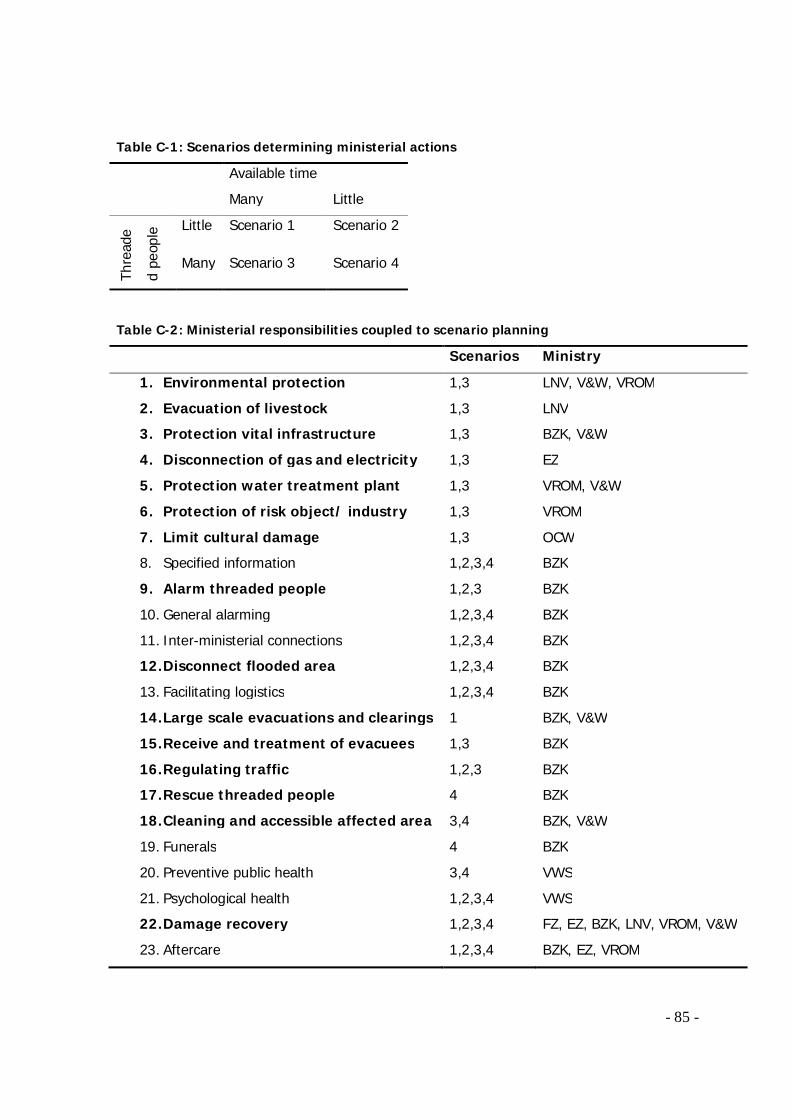
- 85 -
Table C-1: Scenarios determining ministerial actions
Available time
Many Little
Thre
ade
d pe
ople
Little Scenario 1 Scenario 2
Many Scenario 3 Scenario 4
Table C-2: Ministerial responsibilities coupled to scenario planning
Scenarios Ministry
1. Environmental protection 1,3 LNV, V&W, VROM
2. Evacuation of livestock 1,3 LNV
3. Protection vital infrastructure 1,3 BZK, V&W
4. Disconnection of gas and electricity 1,3 EZ
5. Protection water treatment plant 1,3 VROM, V&W
6. Protection of risk object/ industry 1,3 VROM
7. Limit cultural damage 1,3 OCW
8. Specified information 1,2,3,4 BZK
9. Alarm threaded people 1,2,3 BZK
10. General alarming 1,2,3,4 BZK
11. Inter-ministerial connections 1,2,3,4 BZK
12. Disconnect flooded area 1,2,3,4 BZK
13. Facilitating logistics 1,2,3,4 BZK
14. Large scale evacuations and clearings 1 BZK, V&W
15. Receive and treatment of evacuees 1,3 BZK
16. Regulating traffic 1,2,3 BZK
17. Rescue threaded people 4 BZK
18. Cleaning and accessible affected area 3,4 BZK, V&W
19. Funerals 4 BZK
20. Preventive public health 3,4 VWS
21. Psychological health 1,2,3,4 VWS
22. Damage recovery 1,2,3,4 FZ, EZ, BZK, LNV, VROM, V&W
23. Aftercare 1,2,3,4 BZK, EZ, VROM
- 86 -
Municipality Information source:
-Eveline Plomp, Crisis coördinator municipality of Langedijk
-Rampenbestrijdingsplan dijkdoorbraak Kromme Rijn – Dijkring 44: process documents
Moment in time:
Crisis Management
Tasks Municipality (in bold the relevant tasks for this study):
1. Information supply on flooding to threaded people;
2. Information supply on flooding for press;
3. Internal information supply on flooding;
4. Take care of wounded, homeless, evacuees and livestock;
5. Shelter wounded, homeless, evacuees and livestock;
6. Organization of funerals of deceased casualties;
7. Registration of casualties;
8. Inform family and relatives of registered casualties;
9. Supply of primary essentials (shelter for homeless, food, public service
companies, etc.);
10. Registration and taking care of damage;
11. Repression of environmental damages during and after the flooding;
12. Aftercare (health, psychologically, financially, etc.);
13. Evaluation of flooding and crisis management;
14. Archiving of all information which apply to the flooding in time and the
handling of the crisis management according to the Dutch law.
Type of information at hand and source owner:
-Flooding maps of the Water Boards based on worst credible flood scenarios
-SOBEK movie of EDO flooding scenario
Improvements:
-No specific plan in case of flooding is included within the municipal disaster planning;
- 87 -
-Forecasting of possible scenarios in order to be sufficiently prepared in case of flooding;
-Ensure all stakeholders work with the same scenario planning;
-Establish a descent and effective crisis management framework in which all different
disaster scenarios fit and every stakeholder is aware of its role and avoid making
exceptional plans for every possible crisis (flooding, epidemics, large scale fires, car bombs,
etc.).
Police Information source:
Rampenbestrijdingsplan dijkdoorbraak Kromme Rijn – Dijkring 44, process documents
Moment in time:
Crisis Management
Tasks (in bold the relevant tasks for this study):
-Vacating (small scale) en evacuating (large scale) of livestock and people;
-Disconnection of and surveillance within flooded area;
-Management of traffic streams;
-Maintain legal order;
-Identify casualties and inform relatives;
-Guide help services at moment of flooding.
Information at hand:
The policy is purely operational and is managed by the regional crisis management team.
Therefore not many data is at hand. The following data is used by the police:
-Evacuation areas per postcode 4 level: number of potential evacuees related to evacuation
routes;
-Evacuation-circulation plans for different scenarios;
-Overview of guiding posts (main roads);
-Criminal justice research.
- 88 -
Improvements:
-Overview of location of the less capable for evacuating;
-Real-time overview of flooded area.
Regional Operational Team (safety regions) Information source:
Arjan Nauta, Information manager ROT
Moment in time:
Crisis Management
Membership:
In case of flooding the Regional Operational Team will be in charge, which included
deputies of the following members:
-Municipality;
-Fire brigade;
-GHOR;
-Alarm central;
-Water Board;
-Public Works (drinking, water, electricity).
Moment in time of required information:
Risk management and crisis management
Required information and source owner:
-Water depth in time Water Board
-Number of residents in flooded area Municipalities
-Less capable of evacuating GHOR and municipalities
-Livestock Mininstry of LNV, LTO Netherlands,
Municipalities
-Economic value Water Board via the Standard Method
-Service drop outs 1. Electricity companies 2. Water companies
- 89 -
Type of information:
-Geographic maps for water depth;
-Tables per postcode level 4.
Improvements:
-Level of detail: the higher the level of detail the better;
-Information on the less capable of evacuating;
-Water depths in time;
-Information on critical hubs for electricity and drink water supply.
Rijkswaterstaat Information source:
A. Dollee, senior advisor and specialist crisis management and information supply
Moment in time:
Risk Management and Crisis Management
Task:
The task of Rijkswaterstaat is the information supply to all stakeholders involved on the
hydraulic conditions of a flood (in spé) on every moment in time according to the safety
chain and the maintenance of the regional water defence system.
Information at hand:
-Information on hydraulic characteristics (in time) as water depths, flow velocities, sediment
transports, discharges etc.
-Information on primary and secondary water defence systems, failure risks, construction
etc.
-Information on roads, for example until what moment in time are the roads accessible and
what is the maximum load a certain road is capable to bare?
-Worst credible flooding scenarios (EDO), developed by Rijkswaterstaat (Kolen, 2007).
- 90 -
Improvements:
-Challenges lie within its information supply framework in order to enhance the detail of
information in combination with a similar interpretation of all different stakeholders. At the
moment Rijkswaterstaat works with FLIWAS, an information system which enables the
information supply during high water scenarios for multiple different users.
Water Board Information source:
M. Galema, crisis coordinator Water Board Holland Noorderkwartier
Moment in time:
Risk Management and Crisis Management
Information at hand:
-Flooding depth and area;
-Damage calculations: the total sum of damage in order to determine relative damages
computed by the Standard Method.
For the Water Board of Holland Noorderkwartier 150 dike breach scenarios are at hand. This
information is digitally and hardcopy available. Every municipality has a CD-ROM with flood
scenarios in the light of crisis communication.
Improvements:
-Online scenarios in case of crisis, this is already in process;
-Simulation of secondary dike breaches, this will be available at the end of 2009.
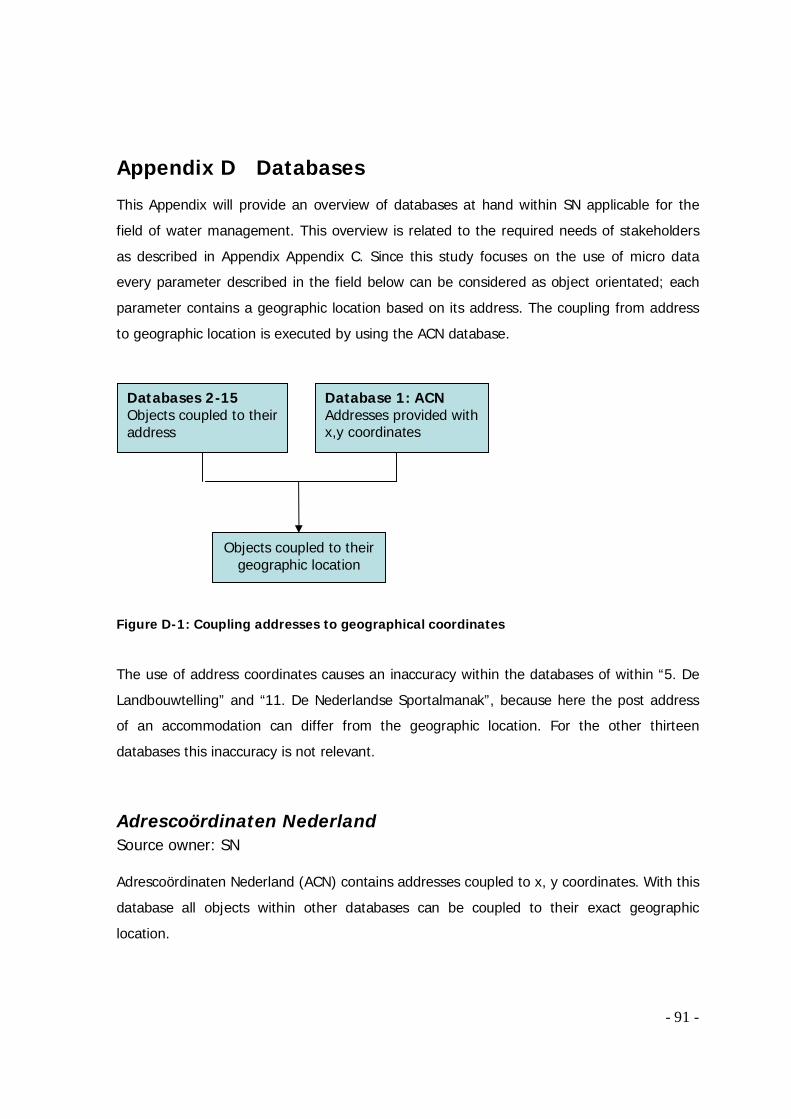
- 91 -
Appendix D Databases
This Appendix will provide an overview of databases at hand within SN applicable for the
field of water management. This overview is related to the required needs of stakeholders
as described in Appendix Appendix C. Since this study focuses on the use of micro data
every parameter described in the field below can be considered as object orientated; each
parameter contains a geographic location based on its address. The coupling from address
to geographic location is executed by using the ACN database.
Figure D-1: Coupling addresses to geographical coordinates
The use of address coordinates causes an inaccuracy within the databases of within “5. De
Landbouwtelling” and “11. De Nederlandse Sportalmanak”, because here the post address
of an accommodation can differ from the geographic location. For the other thirteen
databases this inaccuracy is not relevant.
Adrescoördinaten Nederland Source owner: SN Adrescoördinaten Nederland (ACN) contains addresses coupled to x, y coordinates. With this
database all objects within other databases can be coupled to their exact geographic
location.
Databases 2-15 Objects coupled to their address
Database 1: ACN Addresses provided with x,y coordinates
Objects coupled to their geographic location
- 92 -
Bodembestand 2006 Source owner: SN
This database described the land-use in the Netherlands. Below the different parameters are
decribed.
Infrastructure
o Railways
o Roads
o Airfields
Developed land
o Residential area
o Retail and cafeteria
o Public services
o Social-cultural services
o Industrial area
Semi developed land
o Dump ground
o Wreck yard
o Cemeteries
o Mineral industry
o Build area
o Semi paved other terrains
Recreational area
o Parks
o Sport terrains
o Allotment gardens
o Daily recreational area
o Camping sites
Agricultural area
o Glass houses
o Others agricultural terrain
- 93 -
Forest and open natural area
o Forest
o Open dry terrain
o Open wet terrain
Dutch Emission Registration Source owner: VROM
This database contains the 500 most potentially, industrial, pollution sources for air and
water in the Netherlands per emission source. Every emission source contains the annual
volume of pollution per type, the scope covers 316 different polluting matters. The ministry
of VROM gains this information annually by the yearly environment reports large polluting
companies have to hand over.
Waste Treatment
Waste Water Treatment plants
Building industry
Chemical industry
Energy
Trade, services and government
Agriculture
Nature
Other industry
Refineries
Drink water
Logistics
Consumer goods
- 94 -
Gemeentelijke Basis Administratie Source owner: SN The database “Gemeentelijke Basis Administratie” (GBA) contains data governed by the municipality of its residents.
Number of resident
Age per resident
Nationality per resident
Landbouwtelling Source owner: LNV
This database provides and overview of all livestock in the Netherlands and will be coupled
to address coordinates in 2010 based on EU guidelines (Commission, 2005). Data is based
on a yearly stock-taking in April (“landbouwtelling”) and is related to the coordinates of the
main settlement, these numbers can vary during the year. Assumption is made this will also
be the address where life-stock will be located. For agricultural companies this is harder to
determine and therefore these would not fully be taken into account. These address
coordinates will only be used for the stock of chemicals.
Agricultural companies
Livestock companies
Cows and bulls per age class: 0-1 years
Cows and bulls per age class: 1-2 years
Cows and bulls per age class: 2 years and older
Ducks
Turkeys
Other poultry
Horses per age class: 0-3 years
Horses per age class: older than 3 years
Ponies per age class: 0-3 years
Ponies per age class: older than 3 years
Sheep per age class: 0-1 years
- 95 -
Sheep per age class: older than 1 year
Goats per age class: 0-1 years
Goats per age class: older than 1 year
Rabbits
Minks
Foxes
Other fur
Other livestock: mules, rodents, donkeys, deer, water buffalos
Locatus Source owner: Wegener
Retail companies (136 different parameters)
Automotive
o Car dealers
o Garages
o Motor dealers
o Boat dealers
o Fuel stations
o Combustible companies
o Breaker’s yard
Leisure
o Cafeteria
o Discotheque
o Night club
o Hotels
o Restaurants (6 different parameters)
o Lunch rooms
o Bibliotheca
o Cinemas
o Musea
o Theaters
- 96 -
o Amusements parks
o Casinos
o Exhibition rooms
o Bowling centres
o Zoo
o Skating rinks
o Pools
Service companies
o Car lease
o 36 other different parameters
Mobility database Source owner: Rijksdienst voor Wegverkeer Per address the number of registered vehicles is included in this database.
Private cars
Motorcycles
Special vehicle
Delivery vans
Tractors
Trucks
Busses
Trailer
Semi trailer
Museums Source owner: SN
Within this database all museums including their opening times are included.

- 97 -
Nationaal wegenbestand Source owner: RWS
National roads
Provincial roads
Municipal roads
Nationale Atlas Volksgezondheid Source owner: RIVM This database contains all health service locations in the Netherlands. The healthcare system is subdivided in the following themes:
Hospitals
Homes for elderly
Psychiatric institutions
General practitioners
Homes for physically disabled
Homes for mentally disabled
Trauma centres
Private clinics
Nursing homes
Ambulance centres
Nederlandse Sportalmanak Source owner: SN
This database contains all sport accommodations in the Netherlands related to their address.
Athletics track
Bowling lawns
Outdoor sporting centres
Trotting courses
- 98 -
Fitness centres
Golf tracks
Skating rinks
Riding schools
Sports halls
Squash courts
Tennis courts
Tennis and soccer fields
Soccer stadiums, professional soccer
Podium arts Source owner: SN
This database contains different accommodation parameters for podium arts. For each
accommodation, if applicable, the capacity, number of seats and rooms are included.
Theatres
Opera house
Concert halls
Outdoor theatres
Puppet theatres
Churches
Event halls
Multifunctional podia
Cultural centres
Pop podia
Stadiums
Festivals

- 99 -
Primary schools Source owner: SN
This database only contains the locations of primary schools, data on numbers of students
are not included.
Public Utility Companies Source owner: SN
This database contains all locations of production units generating energy installations in the
Netherlands. Per type of installation the capacity, the controlling company, the usage of gas,
oil and coals, the electrical production and the fact whether this is an electricity central (44
installations) of not (4000 installations) is included.
Gas engines
Gas turbines
Nuclear plants
Others
Steam turbines
Combines steam and gas turbines
Water power centrals
Wind turbines
Solar energy
Sociaal Statistisch Bestand Source owner: SN
Within this database (SSB) social-economic data of Dutch residents is included. This
database will be elaborated within the coming years. The following data is at hand at the
moment:
Monthly income per resident
Social security payment per resident
Number of working residents per job status per company

- 100 -
Sum of distance between work and housing per company
WOZ value per house
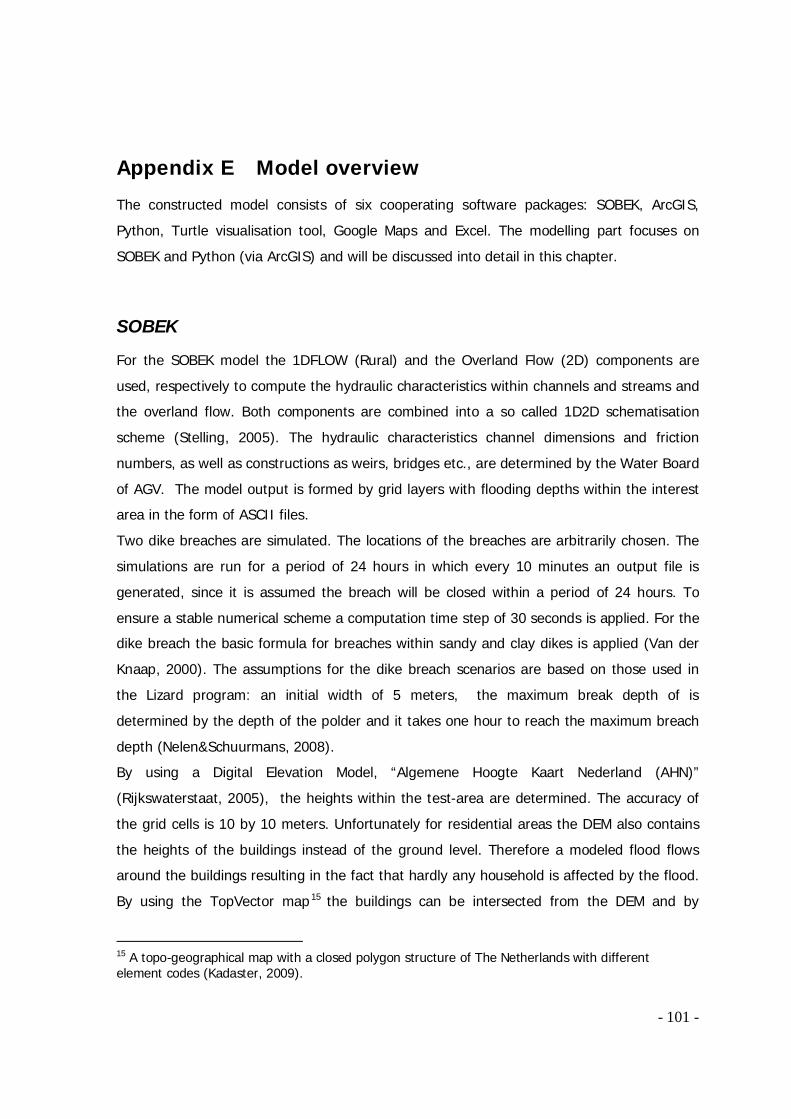
- 101 -
Appendix E Model overview
The constructed model consists of six cooperating software packages: SOBEK, ArcGIS,
Python, Turtle visualisation tool, Google Maps and Excel. The modelling part focuses on
SOBEK and Python (via ArcGIS) and will be discussed into detail in this chapter.
SOBEK
For the SOBEK model the 1DFLOW (Rural) and the Overland Flow (2D) components are
used, respectively to compute the hydraulic characteristics within channels and streams and
the overland flow. Both components are combined into a so called 1D2D schematisation
scheme (Stelling, 2005). The hydraulic characteristics channel dimensions and friction
numbers, as well as constructions as weirs, bridges etc., are determined by the Water Board
of AGV. The model output is formed by grid layers with flooding depths within the interest
area in the form of ASCII files.
Two dike breaches are simulated. The locations of the breaches are arbitrarily chosen. The
simulations are run for a period of 24 hours in which every 10 minutes an output file is
generated, since it is assumed the breach will be closed within a period of 24 hours. To
ensure a stable numerical scheme a computation time step of 30 seconds is applied. For the
dike breach the basic formula for breaches within sandy and clay dikes is applied (Van der
Knaap, 2000). The assumptions for the dike breach scenarios are based on those used in
the Lizard program: an initial width of 5 meters, the maximum break depth of is
determined by the depth of the polder and it takes one hour to reach the maximum breach
depth (Nelen&Schuurmans, 2008).
By using a Digital Elevation Model, “Algemene Hoogte Kaart Nederland (AHN)”
(Rijkswaterstaat, 2005), the heights within the test-area are determined. The accuracy of
the grid cells is 10 by 10 meters. Unfortunately for residential areas the DEM also contains
the heights of the buildings instead of the ground level. Therefore a modeled flood flows
around the buildings resulting in the fact that hardly any household is affected by the flood.
By using the TopVector map 15 the buildings can be intersected from the DEM and by
15 A topo-geographical map with a closed polygon structure of The Netherlands with different element codes (Kadaster, 2009).
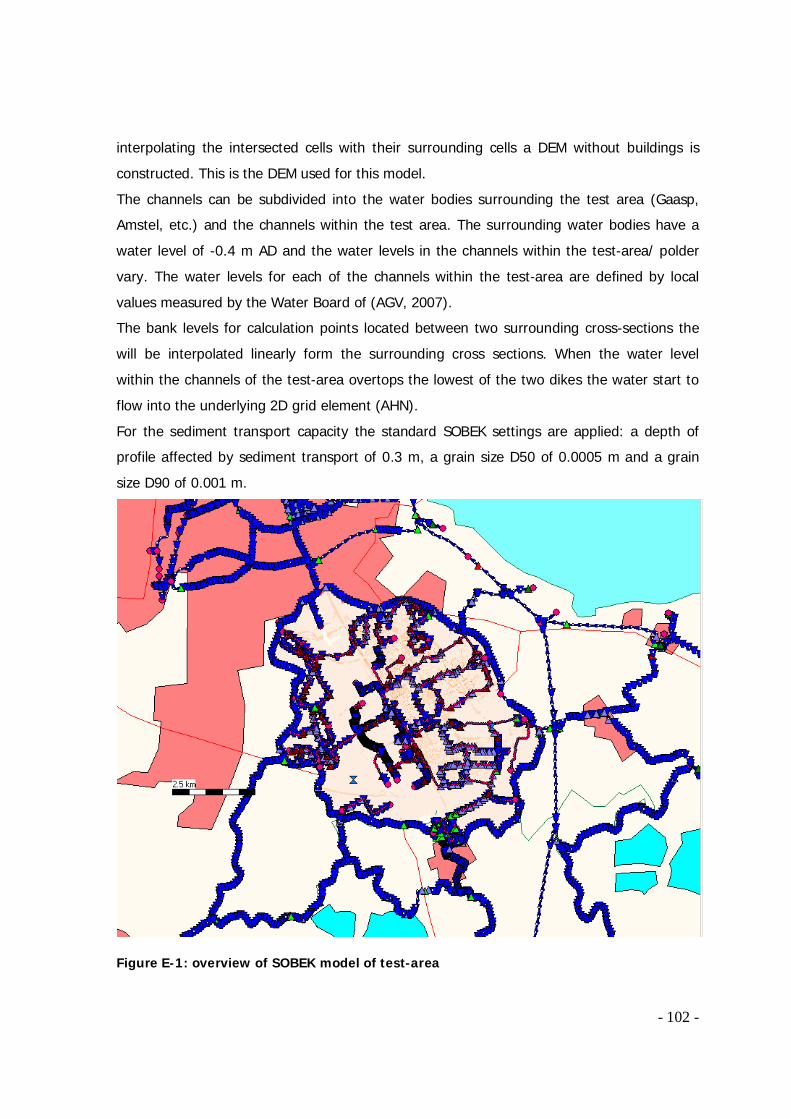
- 102 -
interpolating the intersected cells with their surrounding cells a DEM without buildings is
constructed. This is the DEM used for this model.
The channels can be subdivided into the water bodies surrounding the test area (Gaasp,
Amstel, etc.) and the channels within the test area. The surrounding water bodies have a
water level of -0.4 m AD and the water levels in the channels within the test-area/ polder
vary. The water levels for each of the channels within the test-area are defined by local
values measured by the Water Board of (AGV, 2007).
The bank levels for calculation points located between two surrounding cross-sections the
will be interpolated linearly form the surrounding cross sections. When the water level
within the channels of the test-area overtops the lowest of the two dikes the water start to
flow into the underlying 2D grid element (AHN).
For the sediment transport capacity the standard SOBEK settings are applied: a depth of
profile affected by sediment transport of 0.3 m, a grain size D50 of 0.0005 m and a grain
size D90 of 0.001 m.
Figure E-1: overview of SOBEK model of test-area
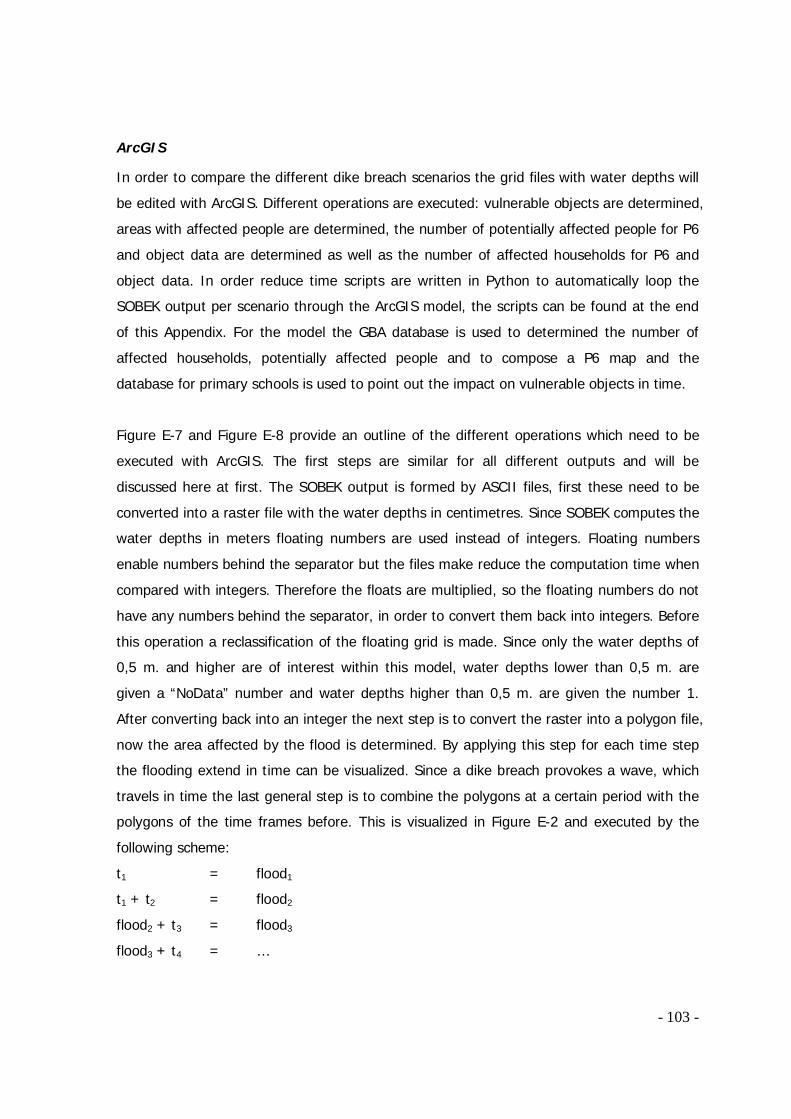
- 103 -
ArcGIS
In order to compare the different dike breach scenarios the grid files with water depths will
be edited with ArcGIS. Different operations are executed: vulnerable objects are determined,
areas with affected people are determined, the number of potentially affected people for P6
and object data are determined as well as the number of affected households for P6 and
object data. In order reduce time scripts are written in Python to automatically loop the
SOBEK output per scenario through the ArcGIS model, the scripts can be found at the end
of this Appendix. For the model the GBA database is used to determined the number of
affected households, potentially affected people and to compose a P6 map and the
database for primary schools is used to point out the impact on vulnerable objects in time.
Figure E-7 and Figure E-8 provide an outline of the different operations which need to be
executed with ArcGIS. The first steps are similar for all different outputs and will be
discussed here at first. The SOBEK output is formed by ASCII files, first these need to be
converted into a raster file with the water depths in centimetres. Since SOBEK computes the
water depths in meters floating numbers are used instead of integers. Floating numbers
enable numbers behind the separator but the files make reduce the computation time when
compared with integers. Therefore the floats are multiplied, so the floating numbers do not
have any numbers behind the separator, in order to convert them back into integers. Before
this operation a reclassification of the floating grid is made. Since only the water depths of
0,5 m. and higher are of interest within this model, water depths lower than 0,5 m. are
given a “NoData” number and water depths higher than 0,5 m. are given the number 1.
After converting back into an integer the next step is to convert the raster into a polygon file,
now the area affected by the flood is determined. By applying this step for each time step
the flooding extend in time can be visualized. Since a dike breach provokes a wave, which
travels in time the last general step is to combine the polygons at a certain period with the
polygons of the time frames before. This is visualized in Figure E-2 and executed by the
following scheme:
t1 = flood1
t1 + t2 = flood2
flood2 + t3 = flood3
flood3 + t4 = …
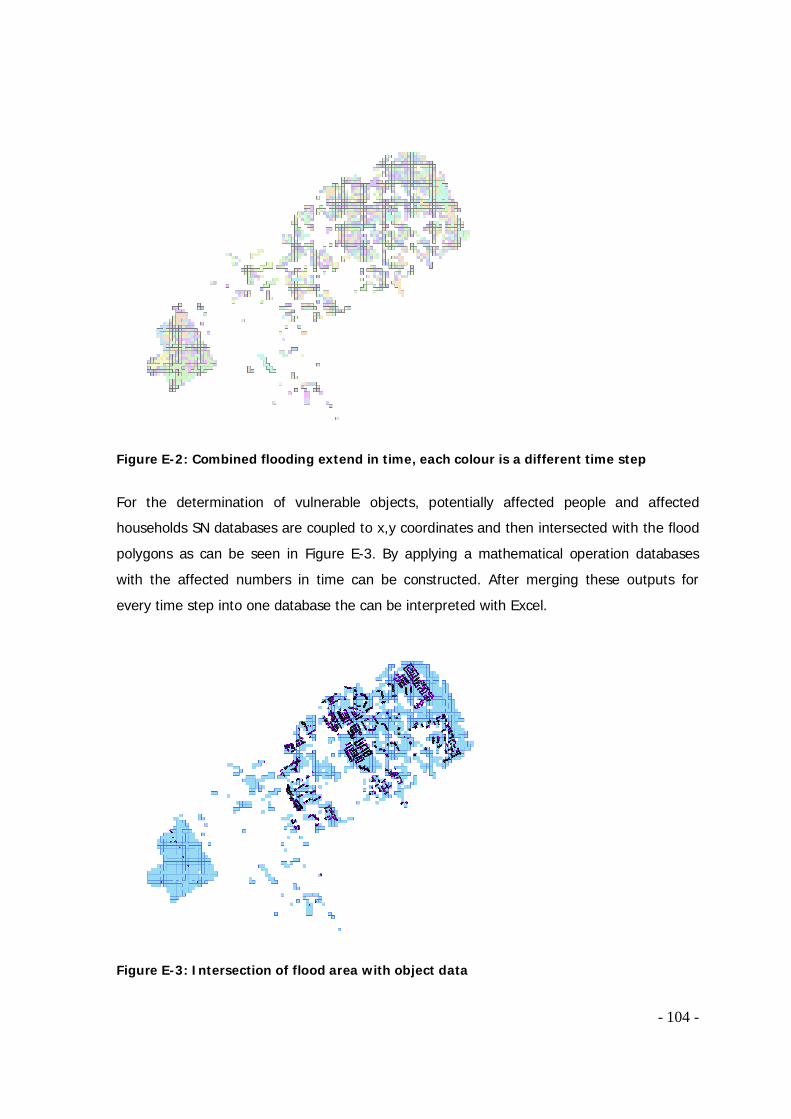
- 104 -
Figure E-2: Combined flooding extend in time, each colour is a different time step
For the determination of vulnerable objects, potentially affected people and affected
households SN databases are coupled to x,y coordinates and then intersected with the flood
polygons as can be seen in Figure E-3. By applying a mathematical operation databases
with the affected numbers in time can be constructed. After merging these outputs for
every time step into one database the can be interpreted with Excel.
Figure E-3: Intersection of flood area with object data
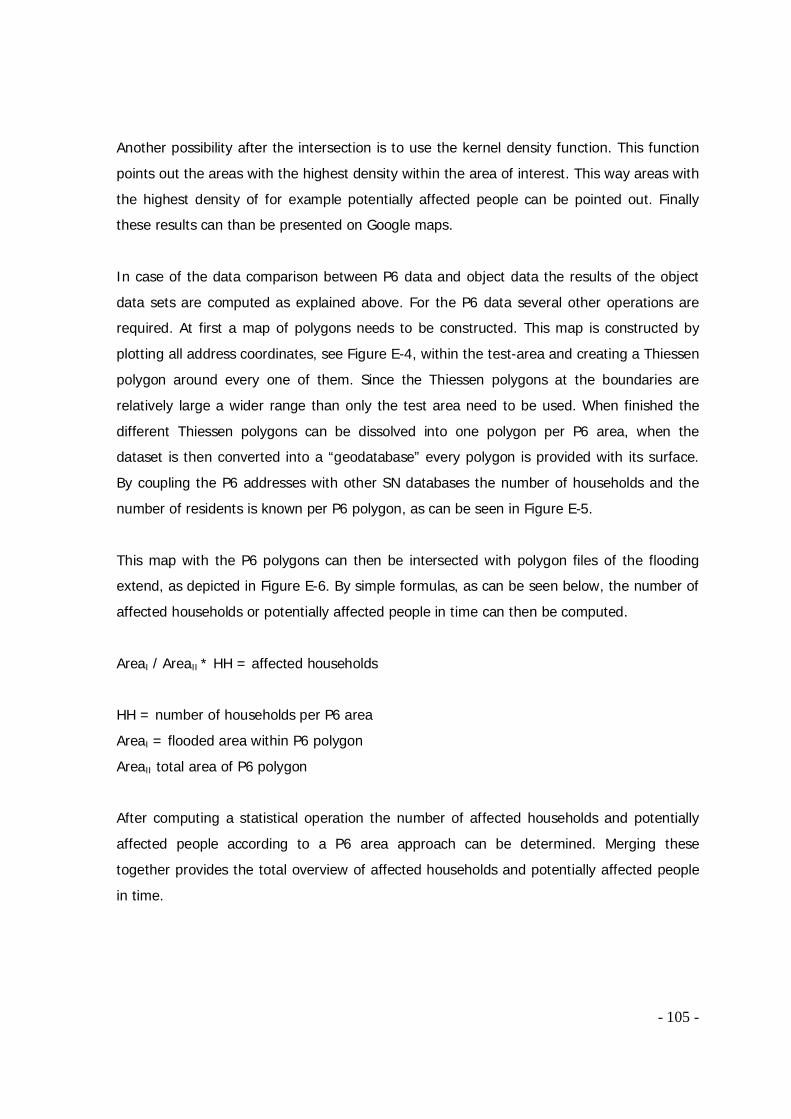
- 105 -
Another possibility after the intersection is to use the kernel density function. This function
points out the areas with the highest density within the area of interest. This way areas with
the highest density of for example potentially affected people can be pointed out. Finally
these results can than be presented on Google maps.
In case of the data comparison between P6 data and object data the results of the object
data sets are computed as explained above. For the P6 data several other operations are
required. At first a map of polygons needs to be constructed. This map is constructed by
plotting all address coordinates, see Figure E-4, within the test-area and creating a Thiessen
polygon around every one of them. Since the Thiessen polygons at the boundaries are
relatively large a wider range than only the test area need to be used. When finished the
different Thiessen polygons can be dissolved into one polygon per P6 area, when the
dataset is then converted into a “geodatabase” every polygon is provided with its surface.
By coupling the P6 addresses with other SN databases the number of households and the
number of residents is known per P6 polygon, as can be seen in Figure E-5.
This map with the P6 polygons can then be intersected with polygon files of the flooding
extend, as depicted in Figure E-6. By simple formulas, as can be seen below, the number of
affected households or potentially affected people in time can then be computed.
AreaI / AreaII * HH = affected households
HH = number of households per P6 area
AreaI = flooded area within P6 polygon
AreaII total area of P6 polygon
After computing a statistical operation the number of affected households and potentially
affected people according to a P6 area approach can be determined. Merging these
together provides the total overview of affected households and potentially affected people
in time.
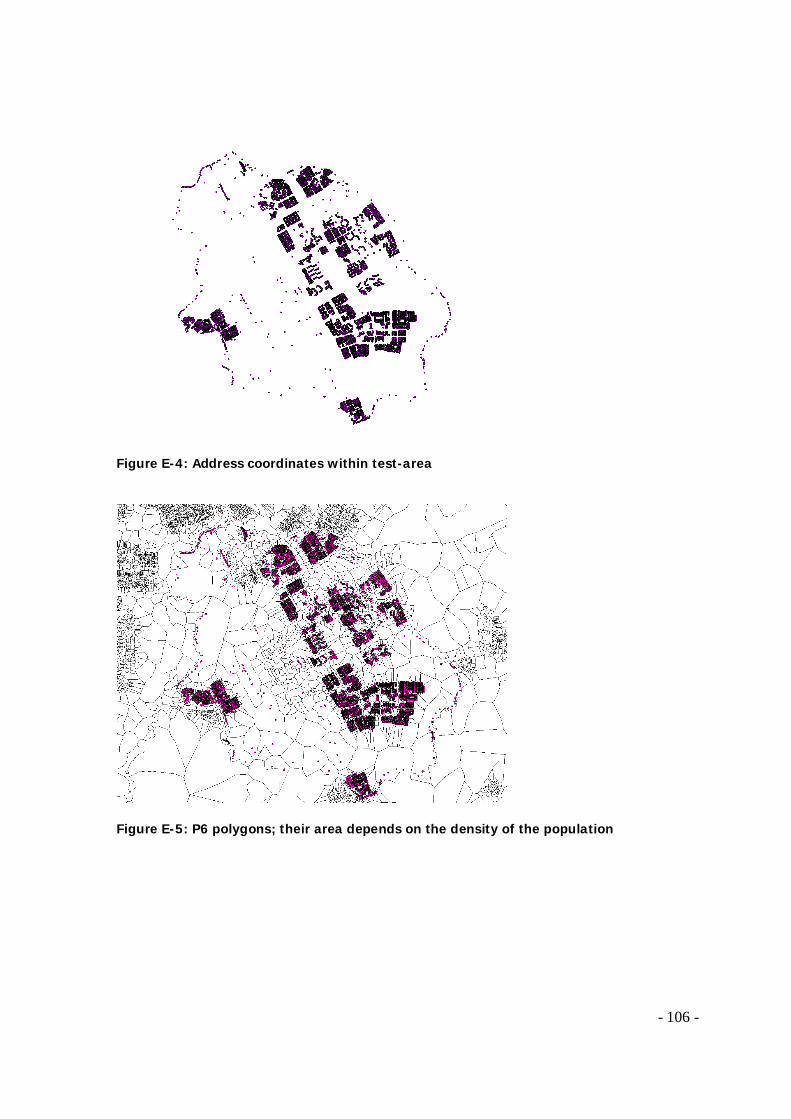
- 106 -
Figure E-4: Address coordinates within test-area
Figure E-5: P6 polygons; their area depends on the density of the population
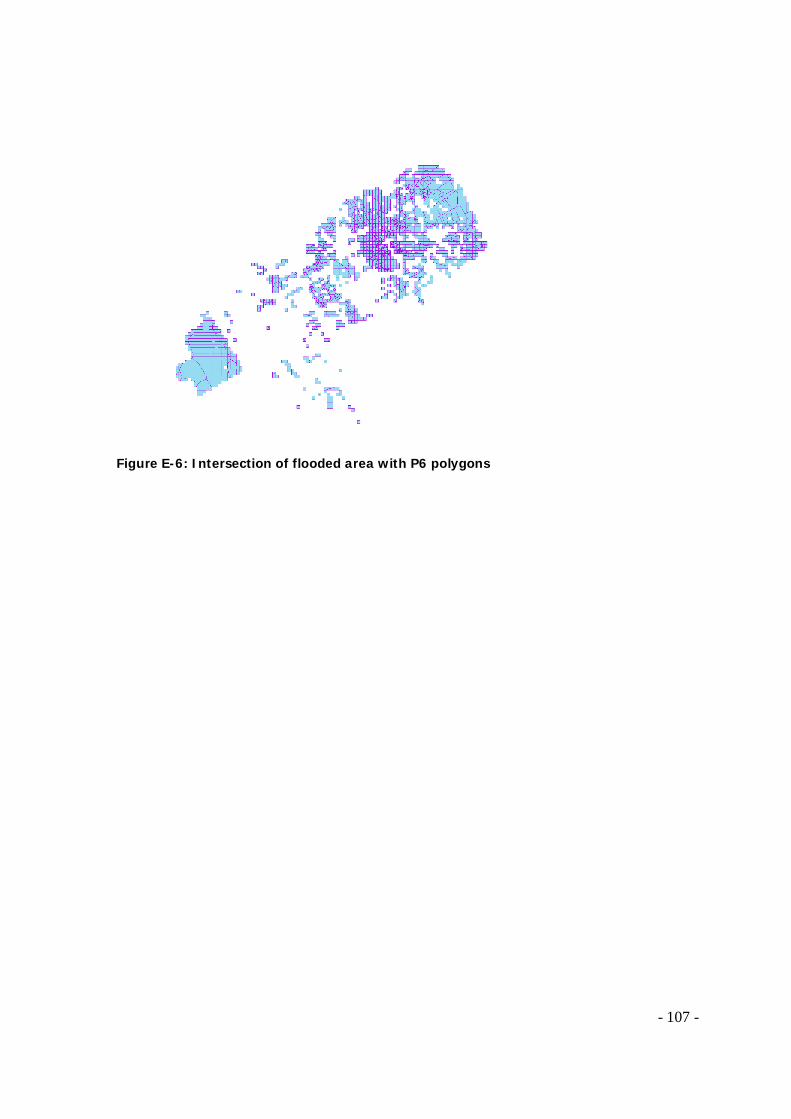
- 107 -
Figure E-6: Intersection of flooded area with P6 polygons
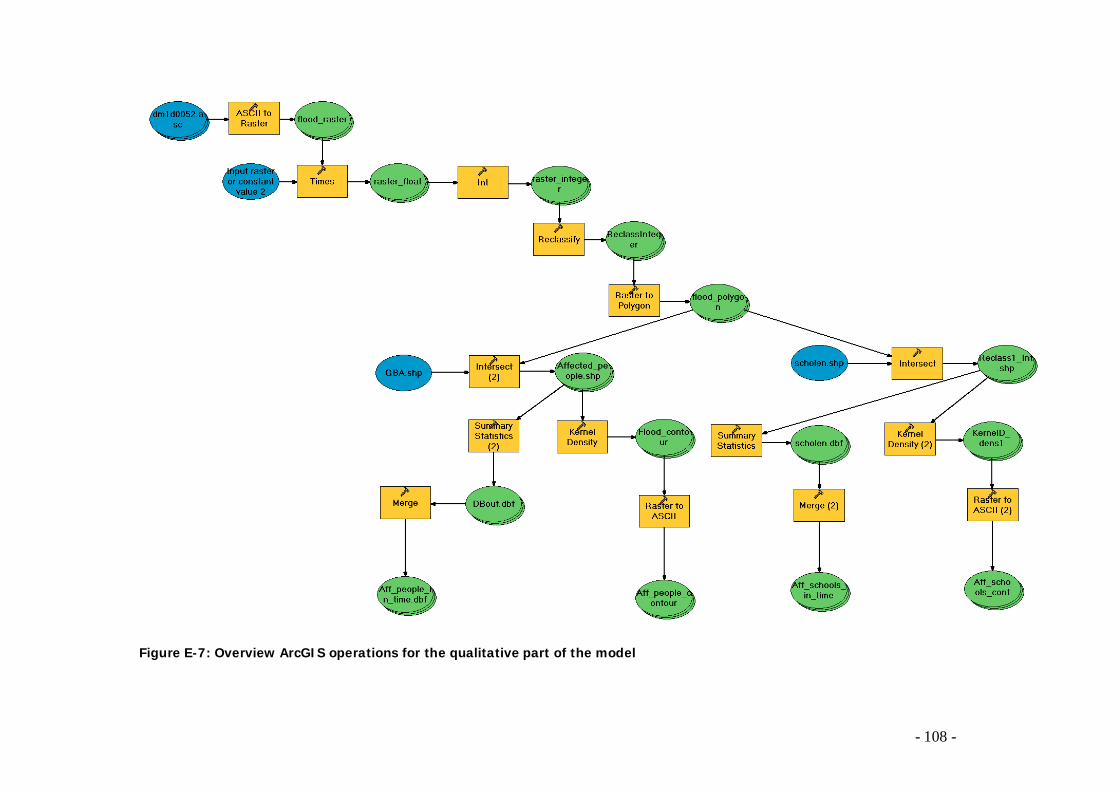
- 108 -
Figure E-7: Overview ArcGIS operations for the qualitative part of the model
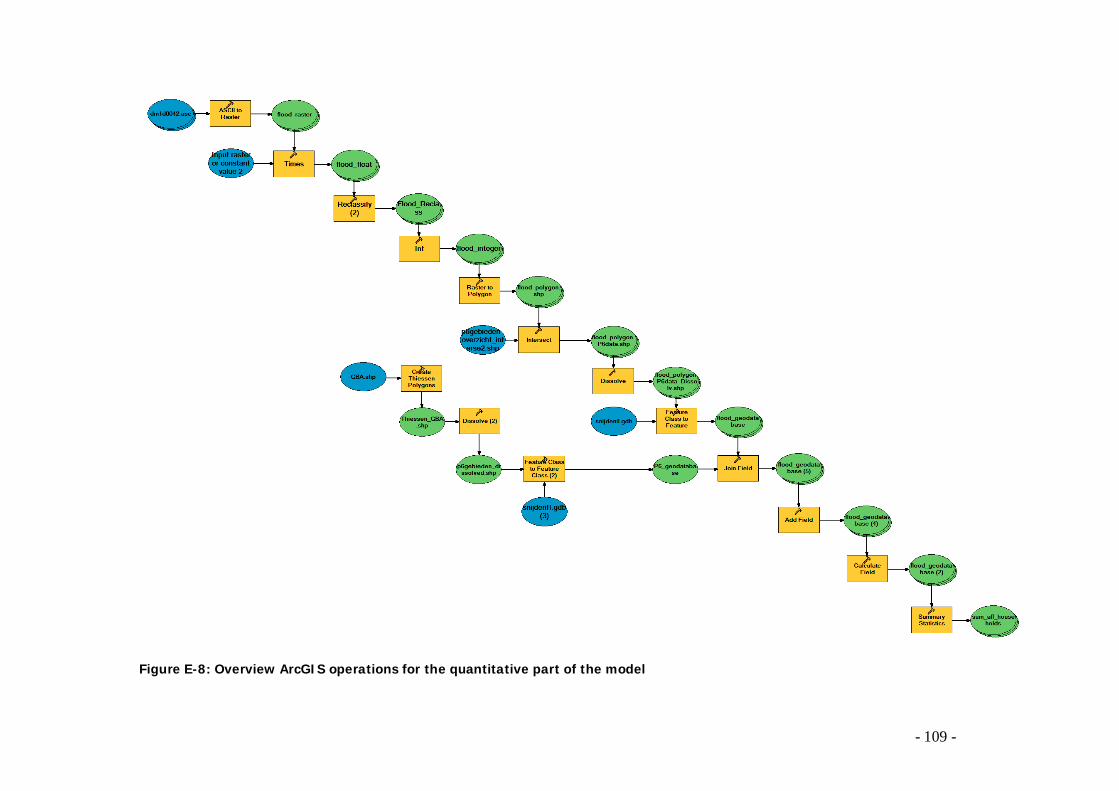
- 109 -
Figure E-8: Overview ArcGIS operations for the quantitative part of the model

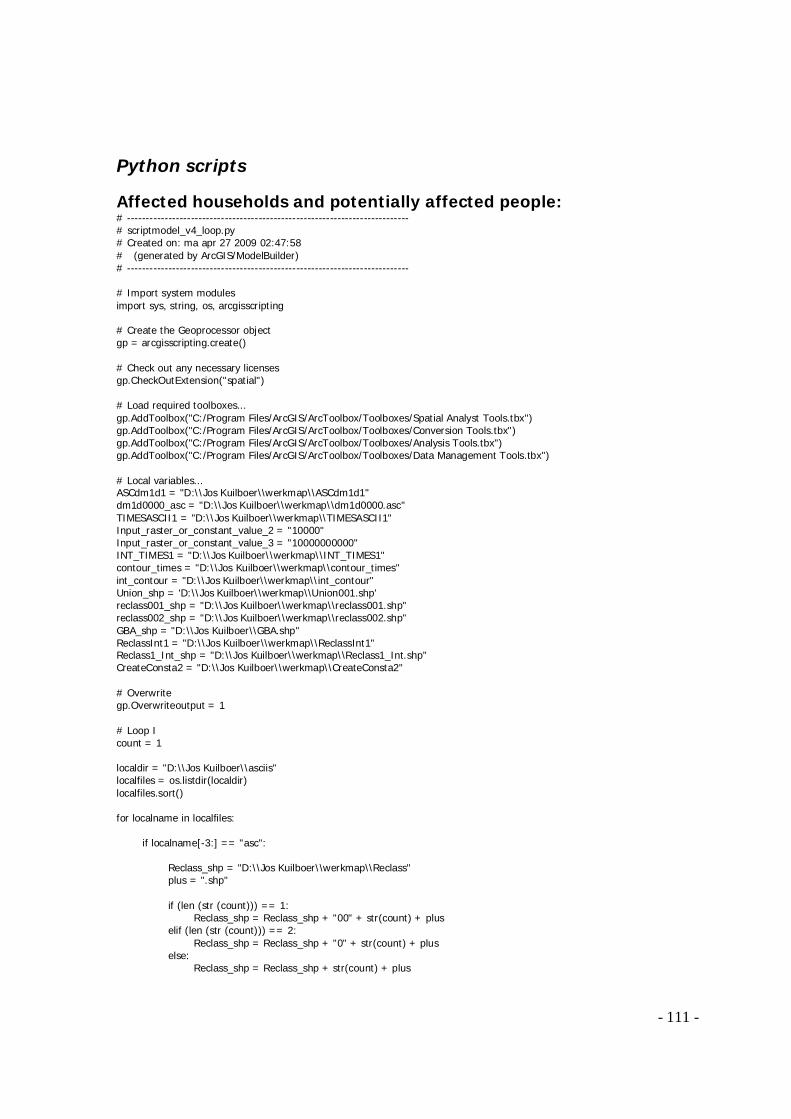
- 111 -
Python scripts
Affected households and potentially affected people: # --------------------------------------------------------------------------- # scriptmodel_v4_loop.py # Created on: ma apr 27 2009 02:47:58 # (generated by ArcGIS/ModelBuilder) # --------------------------------------------------------------------------- # Import system modules import sys, string, os, arcgisscripting # Create the Geoprocessor object gp = arcgisscripting.create() # Check out any necessary licenses gp.CheckOutExtension("spatial") # Load required toolboxes... gp.AddToolbox("C:/Program Files/ArcGIS/ArcToolbox/Toolboxes/Spatial Analyst Tools.tbx") gp.AddToolbox("C:/Program Files/ArcGIS/ArcToolbox/Toolboxes/Conversion Tools.tbx") gp.AddToolbox("C:/Program Files/ArcGIS/ArcToolbox/Toolboxes/Analysis Tools.tbx") gp.AddToolbox("C:/Program Files/ArcGIS/ArcToolbox/Toolboxes/Data Management Tools.tbx") # Local variables... ASCdm1d1 = "D:\\Jos Kuilboer\\werkmap\\ASCdm1d1" dm1d0000_asc = "D:\\Jos Kuilboer\\werkmap\\dm1d0000.asc" TIMESASCII1 = "D:\\Jos Kuilboer\\werkmap\\TIMESASCII1" Input_raster_or_constant_value_2 = "10000" Input_raster_or_constant_value_3 = "10000000000" INT_TIMES1 = "D:\\Jos Kuilboer\\werkmap\\INT_TIMES1" contour_times = "D:\\Jos Kuilboer\\werkmap\\contour_times" int_contour = "D:\\Jos Kuilboer\\werkmap\\int_contour" Union_shp = 'D:\\Jos Kuilboer\\werkmap\\Union001.shp' reclass001_shp = "D:\\Jos Kuilboer\\werkmap\\reclass001.shp" reclass002_shp = "D:\\Jos Kuilboer\\werkmap\\reclass002.shp" GBA_shp = "D:\\Jos Kuilboer\\GBA.shp" ReclassInt1 = "D:\\Jos Kuilboer\\werkmap\\ReclassInt1" Reclass1_Int_shp = "D:\\Jos Kuilboer\\werkmap\\Reclass1_Int.shp" CreateConsta2 = "D:\\Jos Kuilboer\\werkmap\\CreateConsta2" # Overwrite gp.Overwriteoutput = 1 # Loop I count = 1 localdir = "D:\\Jos Kuilboer\\asciis" localfiles = os.listdir(localdir) localfiles.sort() for localname in localfiles: if localname[-3:] == "asc": Reclass_shp = "D:\\Jos Kuilboer\\werkmap\\Reclass" plus = ".shp" if (len (str (count))) == 1: Reclass_shp = Reclass_shp + "00" + str(count) + plus elif (len (str (count))) == 2: Reclass_shp = Reclass_shp + "0" + str(count) + plus else: Reclass_shp = Reclass_shp + str(count) + plus
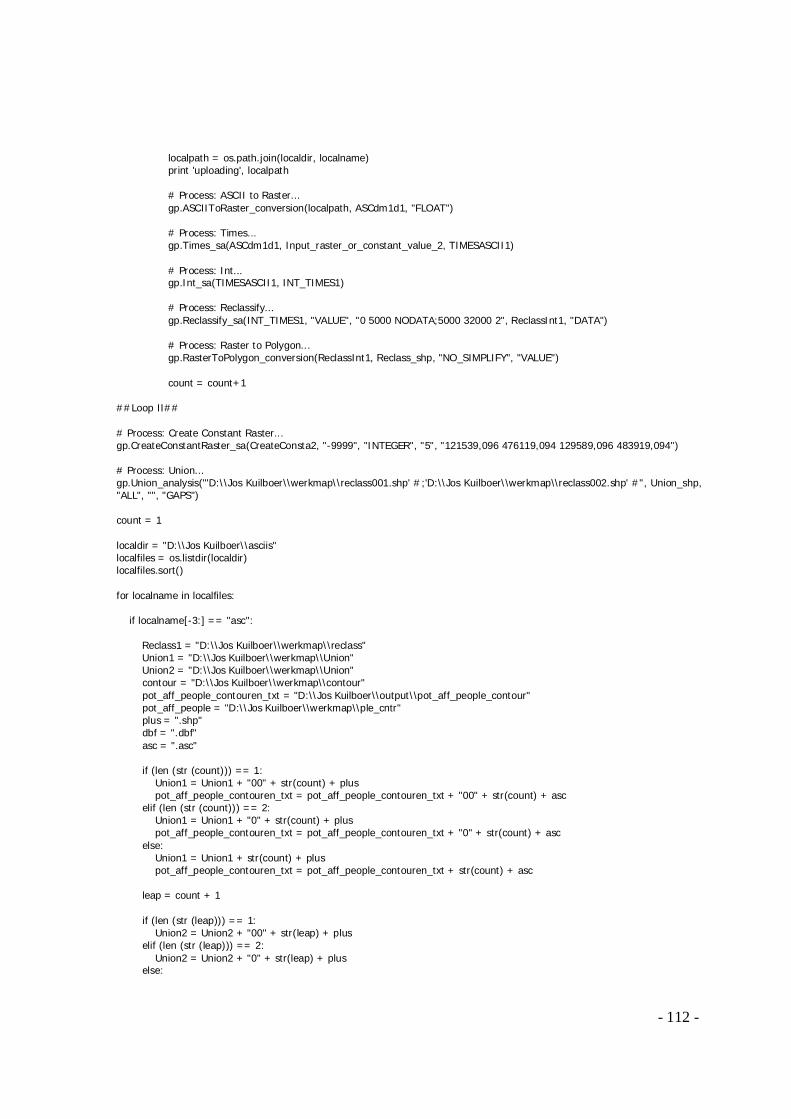
- 112 -
localpath = os.path.join(localdir, localname) print 'uploading', localpath # Process: ASCII to Raster... gp.ASCIIToRaster_conversion(localpath, ASCdm1d1, "FLOAT") # Process: Times... gp.Times_sa(ASCdm1d1, Input_raster_or_constant_value_2, TIMESASCII1) # Process: Int... gp.Int_sa(TIMESASCII1, INT_TIMES1) # Process: Reclassify... gp.Reclassify_sa(INT_TIMES1, "VALUE", "0 5000 NODATA;5000 32000 2", ReclassInt1, "DATA") # Process: Raster to Polygon... gp.RasterToPolygon_conversion(ReclassInt1, Reclass_shp, "NO_SIMPLIFY", "VALUE") count = count+1 ##Loop II## # Process: Create Constant Raster... gp.CreateConstantRaster_sa(CreateConsta2, "-9999", "INTEGER", "5", "121539,096 476119,094 129589,096 483919,094") # Process: Union... gp.Union_analysis("'D:\\Jos Kuilboer\\werkmap\\reclass001.shp' #;'D:\\Jos Kuilboer\\werkmap\\reclass002.shp' #", Union_shp, "ALL", "", "GAPS") count = 1 localdir = "D:\\Jos Kuilboer\\asciis" localfiles = os.listdir(localdir) localfiles.sort() for localname in localfiles: if localname[-3:] == "asc": Reclass1 = "D:\\Jos Kuilboer\\werkmap\\reclass" Union1 = "D:\\Jos Kuilboer\\werkmap\\Union" Union2 = "D:\\Jos Kuilboer\\werkmap\\Union" contour = "D:\\Jos Kuilboer\\werkmap\\contour" pot_aff_people_contouren_txt = "D:\\Jos Kuilboer\\output\\pot_aff_people_contour" pot_aff_people = "D:\\Jos Kuilboer\\werkmap\\ple_cntr" plus = ".shp" dbf = ".dbf" asc = ".asc" if (len (str (count))) == 1: Union1 = Union1 + "00" + str(count) + plus pot_aff_people_contouren_txt = pot_aff_people_contouren_txt + "00" + str(count) + asc elif (len (str (count))) == 2: Union1 = Union1 + "0" + str(count) + plus pot_aff_people_contouren_txt = pot_aff_people_contouren_txt + "0" + str(count) + asc else: Union1 = Union1 + str(count) + plus pot_aff_people_contouren_txt = pot_aff_people_contouren_txt + str(count) + asc leap = count + 1 if (len (str (leap))) == 1: Union2 = Union2 + "00" + str(leap) + plus elif (len (str (leap))) == 2: Union2 = Union2 + "0" + str(leap) + plus else:
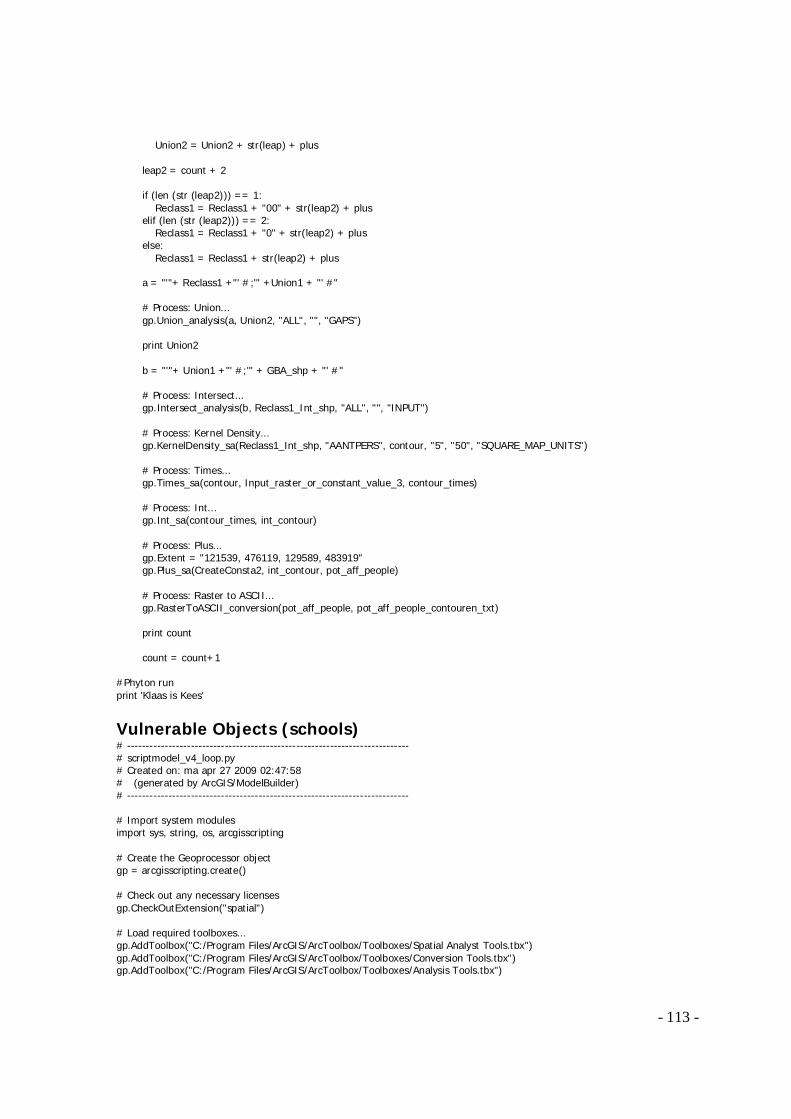
- 113 -
Union2 = Union2 + str(leap) + plus leap2 = count + 2 if (len (str (leap2))) == 1: Reclass1 = Reclass1 + "00" + str(leap2) + plus elif (len (str (leap2))) == 2: Reclass1 = Reclass1 + "0" + str(leap2) + plus else: Reclass1 = Reclass1 + str(leap2) + plus a = "'"+ Reclass1 +"' #;'" +Union1 + "' #" # Process: Union... gp.Union_analysis(a, Union2, "ALL", "", "GAPS") print Union2 b = "'"+ Union1 +"' #;'" + GBA_shp + "' #" # Process: Intersect... gp.Intersect_analysis(b, Reclass1_Int_shp, "ALL", "", "INPUT") # Process: Kernel Density... gp.KernelDensity_sa(Reclass1_Int_shp, "AANTPERS", contour, "5", "50", "SQUARE_MAP_UNITS") # Process: Times... gp.Times_sa(contour, Input_raster_or_constant_value_3, contour_times) # Process: Int... gp.Int_sa(contour_times, int_contour) # Process: Plus... gp.Extent = "121539, 476119, 129589, 483919" gp.Plus_sa(CreateConsta2, int_contour, pot_aff_people) # Process: Raster to ASCII... gp.RasterToASCII_conversion(pot_aff_people, pot_aff_people_contouren_txt) print count count = count+1 #Phyton run print 'Klaas is Kees'
Vulnerable Objects (schools) # --------------------------------------------------------------------------- # scriptmodel_v4_loop.py # Created on: ma apr 27 2009 02:47:58 # (generated by ArcGIS/ModelBuilder) # --------------------------------------------------------------------------- # Import system modules import sys, string, os, arcgisscripting # Create the Geoprocessor object gp = arcgisscripting.create() # Check out any necessary licenses gp.CheckOutExtension("spatial") # Load required toolboxes... gp.AddToolbox("C:/Program Files/ArcGIS/ArcToolbox/Toolboxes/Spatial Analyst Tools.tbx") gp.AddToolbox("C:/Program Files/ArcGIS/ArcToolbox/Toolboxes/Conversion Tools.tbx") gp.AddToolbox("C:/Program Files/ArcGIS/ArcToolbox/Toolboxes/Analysis Tools.tbx")
- 114 -
gp.AddToolbox("C:/Program Files/ArcGIS/ArcToolbox/Toolboxes/Data Management Tools.tbx") # Local variables... Input_raster_or_constant_value_3 = "10000000000" contour_times = "D:\\Jos KuilboerII\\werkmap\\contour_times" int_contour = "D:\\Jos KuilboerII\\werkmap\\int_contour" scholen_shp = "D:\\Jos KuilboerII\\scholen.shp" Reclass1_Int_shp = "D:\\Jos KuilboerII\\werkmap\\Reclass1_Int.shp" CreateConsta2 = "D:\\Jos KuilboerII\\werkmap\\CreateConsta2" # contour files always need to be cleaned! contour2 = "D:\\Jos KuilboerII\\werkmap\\contour6" # Overwrite gp.Overwriteoutput = 1 ## Loop III## # Process: Create Constant Raster... gp.CreateConstantRaster_sa(CreateConsta2, "-9999", "INTEGER", "10", "121539,096 476119,094 129589,096 483919,094") count = 37 localdir = "D:\\Jos KuilboerII\\asciis" localfiles = os.listdir(localdir) localfiles.sort() for localname in localfiles: if localname[-3:] == "asc": Reclass1_Int_shp = "D:\\Jos KuilboerII\\werkmap\\Int" Union1 = "D:\\Jos KuilboerII\\werkmap\\Union" pot_aff_people_contouren_txt = "D:\\Jos KuilboerII\\output\\scholen" pot_aff_people = "D:\\Jos KuilboerII\\werkmap\\ple_cntr" plus = ".shp" asc = ".asc" if (len (str (count))) == 1: pot_aff_people_contouren_txt = pot_aff_people_contouren_txt + "00" + str(count) + asc Reclass1_Int_shp = Reclass1_Int_shp + "00" + str (count) + plus Union1 = Union1 + "00" + str(count) + plus elif (len (str (count))) == 2: pot_aff_people_contouren_txt = pot_aff_people_contouren_txt + "0" + str(count) + asc Reclass1_Int_shp = Reclass1_Int_shp + "0" + str (count) + plus Union1 = Union1 + "0" + str(count) + plus else: pot_aff_people_contouren_txt = pot_aff_people_contouren_txt + str(count) + asc Reclass1_Int_shp = Reclass1_Int_shp + str (count) + plus Union1 = Union1 + str(count) + plus print Reclass1_Int_shp # Process: Kernel Density... gp.Extent = "121539, 476119, 129589, 483919" gp.KernelDensity_sa(Reclass1_Int_shp, "ID", contour2, "10", "50", "SQUARE_MAP_UNITS") print "overwinning!" # Process: Times... gp.Times_sa(contour2, Input_raster_or_constant_value_3, contour_times) # Process: Int... gp.Int_sa(contour_times, int_contour) # Process: Plus... gp.Extent = "121539, 476119, 129589, 483919" gp.Plus_sa(CreateConsta2, int_contour, pot_aff_people)
- 115 -
print "ja" # Process: Raster to ASCII... gp.Extent = "121539, 476119, 129589, 483919" gp.RasterToASCII_conversion(pot_aff_people, pot_aff_people_contouren_txt) print pot_aff_people_contouren_txt count = count+1 ##Step II## # Process: Union... gp.Union_analysis("'D:\\Jos KuilboerII\\werkmap\\reclass001.shp' #;'D:\\Jos KuilboerII\\werkmap\\reclass002.shp' #", Union_shp, "ALL", "", "GAPS") count = 1 localdir = "G:\\GeoProd\\afstudeerwerk Jos Kuilboer\\ArcGIS\\db\\1affpeople" localfiles = os.listdir(localdir) localfiles.sort() for localname in localfiles: if localname[-3:] == "asc": Reclass1 = "D:\\Jos KuilboerII\\werkbestand\\reclass" Union1 = "D:\\Jos KuilboerII\\werkbestand\\Union" Union2 = "D:\\Jos KuilboerII\\werkbestand\\Union" scholen_dbf = "D:\\Jos KuilboerII\\output\\scholen" scholen = "D:\\Jos KuilboerII\\scholen.shp" DBout1_dbf = "D:\\Jos KuilboerII\\werkbestand\\DBout" plus = ".shp" dbf = ".dbf" if (len (str (count))) == 1: Union1 = Union1 + "00" + str(count) + plus DBout1_dbf = DBout1_dbf + "00" + str(count) + dbf scholen_dbf = scholen_dbf + "00" + str(count) + dbf elif (len (str (count))) == 2: Union1 = Union1 + "0" + str(count) + plus DBout1_dbf = DBout1_dbf + "0" + str(count) + dbf scholen_dbf = scholen_dbf + "0" + str(count) + dbf else: Union1 = Union1 + str(count) + plus DBout1_dbf = DBout1_dbf + str(count) + dbf scholen_dbf = scholen_dbf + str(count) + dbf leap = count + 1 if (len (str (leap))) == 1: Union2 = Union2 + "00" + str(leap) + plus elif (len (str (leap))) == 2: Union2 = Union2 + "0" + str(leap) + plus else: Union2 = Union2 + str(leap) + plus leap2 = count + 2 if (len (str (leap2))) == 1: Reclass1 = Reclass1 + "00" + str(leap2) + plus elif (len (str (leap2))) == 2: Reclass1 = Reclass1 + "0" + str(leap2) + plus else: Reclass1 = Reclass1 + str(leap2) + plus
- 116 -
# Process: Union... a = "'"+ Reclass1 +"' #;'" +Union1 + "' #" gp.Union_analysis(a, Union2, "ALL", "", "GAPS") print Union2 # Process: Intersect... b = "'"+ Union1 +"' #;'" + scholen + "' #" gp.Intersect_analysis(b, Reclass1_Int_shp, "ALL", "", "INPUT") # Process: Summary Statistics... gp.Statistics_analysis(Reclass1_Int_shp, scholen_dbf, "SCHOLEN_ COUNT", "") print scholen_dbf count = count+1 #Phyton run print 'Klaas is Kees'
P6 Data # --------------------------------------------------------------------------- # reclass.py # Created on: ma apr 27 2009 02:47:58 # (generated by ArcGIS/ModelBuilder) # --------------------------------------------------------------------------- # Import system modules import sys, string, os, arcgisscripting # Create the Geoprocessor object gp = arcgisscripting.create() # Check out any necessary licenses gp.CheckOutExtension("spatial") # Load required toolboxes... gp.AddToolbox("C:/Program Files/ArcGIS/ArcToolbox/Toolboxes/Spatial Analyst Tools.tbx") gp.AddToolbox("C:/Program Files/ArcGIS/ArcToolbox/Toolboxes/Conversion Tools.tbx") gp.AddToolbox("C:/Program Files/ArcGIS/ArcToolbox/Toolboxes/Analysis Tools.tbx") gp.AddToolbox("C:/Program Files/ArcGIS/ArcToolbox/Toolboxes/Data Management Tools.tbx") # Local variables... ASCdm1d1 = "D:\\ThiesenP6\\bronbestanden\\asciis\\ASCdm1d1" dm1d0000_asc = "D:\\ThiesenP6\\bronbestanden\\asciis\\dm1d0000.asc" TIMESASCII1 = "D:\\ThiesenP6\\werkbestand\\TIMESASCII1" Input_raster_or_constant_value_2 = "10000" INT_TIMES1 = "D:\\ThiesenP6\\werkbestand\\INT_TIMES1" ReclassInt1 = "D:\\ThiesenP6\\werkbestand\\ReclassInt1" RrTReclass1_shp = "D:\\ThiesenP6\\werkbestand\\RrTReclass1.shp" Reclass1_Int_shp = "D:\\ThiesenP6\\werkbestand\\Reclass1_Int.shp" GBA_shp = "D:\\ThiesenP6\\bronbestanden\\GBA.shp" flood_raster = "D:\\ThiesenP6\\werkbestand\\flood_raster" dm1d0140_asc = "D:\\ThiesenP6\\bronbestanden\\asciis_breach east\\dm1d0140.asc" flood_ones = "D:\\ThiesenP6\\werkbestand\\flood_ones" flood_polygon_shp = "D:\\ThiesenP6\\werkbestand\\flood_polygon.shp" p6gebieden_overzicht_intersection_shp = "D:\\ThiesenP6\\bronbestanden\\p6gebieden_overzicht_interse2.shp" snijden_gdb__2_ = "D:\\ThiesenP6\\snijdenII.gdb" flood_polygon_P6data_shp = "D:\\ThiesenP6\\werkbestand\\flood_polygon_P6data.shp" flood_geodatabase = "D:\\ThiesenP6\\snijdenII.gdb\\flood_geodatabase" snijden_gdb = "D:\\ThiesenP6\\snijdenII.gdb" flood_polygon_P6data_Dissolv_shp = "D:\\ThiesenP6\\werkbestand\\flood_polygon_P6data_Dissolv.shp" flood_geodatabase__2_ = "D:\\ThiesenP6\\snijdenII.gdb\\flood_geodatabase"
- 117 -
flood_geodatabase__3_ = "D:\\ThiesenP6\\snijdenII.gdb\\flood_geodatabase" P6_geodatabase = "D:\\ThiesenP6\\snijdenII.gdb\\P6_geodatabase" flood_geodatabase__4_ = "D:\\ThiesenP6\\snijdenII.gdb\\flood_geodatabase" flood_geodatabase__5_ = "D:\\ThiesenP6\\snijdenII.gdb\\flood_geodatabase" p6gebieden_dissolved_shp = "D:\\ThiesenP6\\werkbestand\\p6gebieden_dissolved.shp # Overwrite gp.Overwriteoutput = 1 # Loop I count = 1 localdir = "D:\\ThiesenP6\\bronbestanden\\asciis" localfiles = os.listdir(localdir) localfiles.sort() for localname in localfiles: if localname[-3:] == "asc": Reclass_shp = "D:\\ThiesenP6\\reclass\\reclass" plus = ".shp" if (len (str (count))) == 1: Reclass_shp = Reclass_shp + "00" + str(count) + plus elif (len (str (count))) == 2: Reclass_shp = Reclass_shp + "0" + str(count) + plus else: Reclass_shp = Reclass_shp + str(count) + plus localpath = os.path.join(localdir, localname) print 'uploading', localpath # Process: ASCII to Raster... gp.ASCIIToRaster_conversion(localpath, ASCdm1d1, "FLOAT") # Process: Times... gp.Times_sa(ASCdm1d1, Input_raster_or_constant_value_2, TIMESASCII1) # Process: Int... gp.Int_sa(TIMESASCII1, INT_TIMES1) # Process: Reclassify... gp.Reclassify_sa(INT_TIMES1, "VALUE", "0 5000 NODATA;5000 32000 2", ReclassInt1, "DATA") # Process: Raster to Polygon... gp.RasterToPolygon_conversion(ReclassInt1, Reclass_shp, "NO_SIMPLIFY", "VALUE") count = count+1 print Reclass_shp print "finished reclass" # Local variables... Union1 = 'D:\\ThiesenP6\\union\\Union001.shp' # Overwrite gp.OverwriteOutput = 1 # Process: Union... gp.Union_analysis("'D:\\ThiesenP6\\reclass\\reclass001.shp' #;'D:\\ThiesenP6\\reclass\\reclass002.shp' #", Union1, "ALL", "", "GAPS") # Loop count = 1
- 118 -
localdir = "D:\\ThiesenP6\\bronbestanden\\asciis" localfiles = os.listdir(localdir) localfiles.sort() for localname in localfiles: if localname[-3:] == "asc": Reclass = "D:\\ThiesenP6\\reclass\\reclass" Union1 = "D:\\ThiesenP6\\union\\union" Union2 = "D:\\ThiesenP6\\union\\union" plus = ".shp" if (len (str (count))) == 1: Union1 = Union1 + "00" + str(count) + plus elif (len (str (count))) == 2: Union1 = Union1 + "0" + str(count) + plus else: Union1 = Union1 + str(count) + plus leap = count + 1 if (len (str (leap))) == 1: Union2 = Union2 + "00" + str(leap) + plus elif (len (str (leap))) == 2: Union2 = Union2 + "0" + str(leap) + plus else: Union2 = Union2 + str(leap) + plus leap2 = count + 2 if (len (str (leap2))) == 1: Reclass = Reclass + "00" + str(leap2) + plus elif (len (str (leap2))) == 2: Reclass = Reclass + "0" + str(leap2) + plus else: Reclass = Reclass + str(leap2) + plus a = "'"+ Reclass +"' #;'" +Union1 + "' #" # Process: Union... gp.Union_analysis(a, Union2, "ALL", "", "GAPS") localpath = os.path.join(localdir, localname) print 'uploading', localpath print Union1 count = count + 1 # Process: Feature Class to Feature Class (2)... gp.FeatureClassToFeatureClass_conversion(p6gebieden_overzicht_intersection_shp, snijden_gdb, "P6_geodatabase", "", "POSTCODE 'POSTCODE' true true false 6 Text 0 0 ,First,#,D:\\ThiesenP6\\bronbestanden\\p6gebieden_overzicht_interse2.shp,POSTCODE,-1,-1;PC6 'PC6' true true false 6 Text 0 0 ,First,#,D:\\ThiesenP6\\bronbestanden\\p6gebieden_overzicht_interse2.shp,PC6,-1,-1;SUM_AANTPE 'SUM_AANTPE' true true false 19 Double 0 0 ,First,#,D:\\ThiesenP6\\bronbestanden\\p6gebieden_overzicht_interse2.shp,SUM_AANTPE,-1,-1", "") ### Loop... count = 1 localdir = "D:\\ThiesenP6\\union" localfiles = os.listdir(localdir) localfiles.sort() for localname in localfiles:
- 119 -
if localname[-3:] == "shp": aap = "flood_geodatabase" flood_geodatabase = "D:\\ThiesenP6\\snijdenII.gdb\\flood_geodatabase" flood_geodatabase__2_ = "D:\\ThiesenP6\\snijdenII.gdb\\flood_geodatabase" flood_geodatabase__3_ = "D:\\ThiesenP6\\snijdenII.gdb\\flood_geodatabase" flood_geodatabase__4_ = "D:\\ThiesenP6\\snijdenII.gdb\\flood_geodatabase" affhouseholds = "D:\\ThiesenP6\\dbf_files\\sumHH" if (len (str (count))) == 1: aap = aap + "00" + str(count) flood_geodatabase = flood_geodatabase + "00" + str(count) flood_geodatabase__2_ = flood_geodatabase__2_ + "00" + str(count) flood_geodatabase__3_ = flood_geodatabase__3_ + "00" + str(count) flood_geodatabase__4_ = flood_geodatabase__4_ + "00" + str(count) affhouseholds = affhouseholds + "00" + str(count) + ".dbf" elif (len (str (count))) == 2: aap = aap + "0" + str(count) flood_geodatabase = flood_geodatabase + "0" + str(count) flood_geodatabase__2_ = flood_geodatabase__2_ + "0" + str(count) flood_geodatabase__3_ = flood_geodatabase__3_ + "0" + str(count) flood_geodatabase__4_ = flood_geodatabase__4_ + "0" + str(count) affhouseholds = affhouseholds + "0" + str(count) + ".dbf" else: aap = aap + str(count) flood_geodatabase = flood_geodatabase + str(count) flood_geodatabase__2_ = flood_geodatabase__2_ + str(count) flood_geodatabase__3_ = flood_geodatabase__3_ + str(count) flood_geodatabase__4_ = flood_geodatabase__4_ + str(count) affhouseholds = affhouseholds + str(count) + ".dbf" localpath = os.path.join(localdir, localname) print 'uploading', localpath # Overwrite gp.Overwriteoutput = 1 a = "'"+ localpath +"' #;'" +p6gebieden_overzicht_intersection_shp + "' #" # Process: Intersect... gp.Intersect_analysis(a, flood_polygon_P6data_shp, "ALL", "", "INPUT") # Process: Dissolve... gp.Dissolve_management(flood_polygon_P6data_shp, flood_polygon_P6data_Dissolv_shp, "POSTCODE", "", "MULTI_PART", "DISSOLVE_LINES") # Process: Feature Class to Feature Class... gp.FeatureClassToFeatureClass_conversion(flood_polygon_P6data_Dissolv_shp, snijden_gdb, ""+ aap +"", "", "POSTCODE 'POSTCODE' true true false 6 Text 0 0 ,First,#,D:\\ThiesenP6\\werkbestand\\flood_polygon_P6data_Dissolv.shp,POSTCODE,-1,-1", "") # Process: Join Field... gp.JoinField_management(flood_geodatabase, "POSTCODE", P6_geodatabase, "POSTCODE", "SUM_AANTPE;Shape_Area") # Process: Add Field... gp.AddField_management(flood_geodatabase__3_, "Households", "FLOAT", "", "", "", "", "NULLABLE", "NON_REQUIRED", "") # Process: Calculate Field... gp.CalculateField_management(flood_geodatabase__4_, "Households", " [SUM_AANTPE] * [Shape_Area] / [Shape_Area_1]", "VB", "") # Process: Summary Statistics... gp.Statistics_analysis(flood_geodatabase, affhouseholds, "Households SUM", "")

- 120 -
count = count + 1 print affhouseholds print "finished"
Top Related