


Languages
Pages
Legal

www.iifl.com
July 22, 2017
IIFL Holdings Limited
For the Quarter ended June 2017
Bloomberg: IIFL IN
1
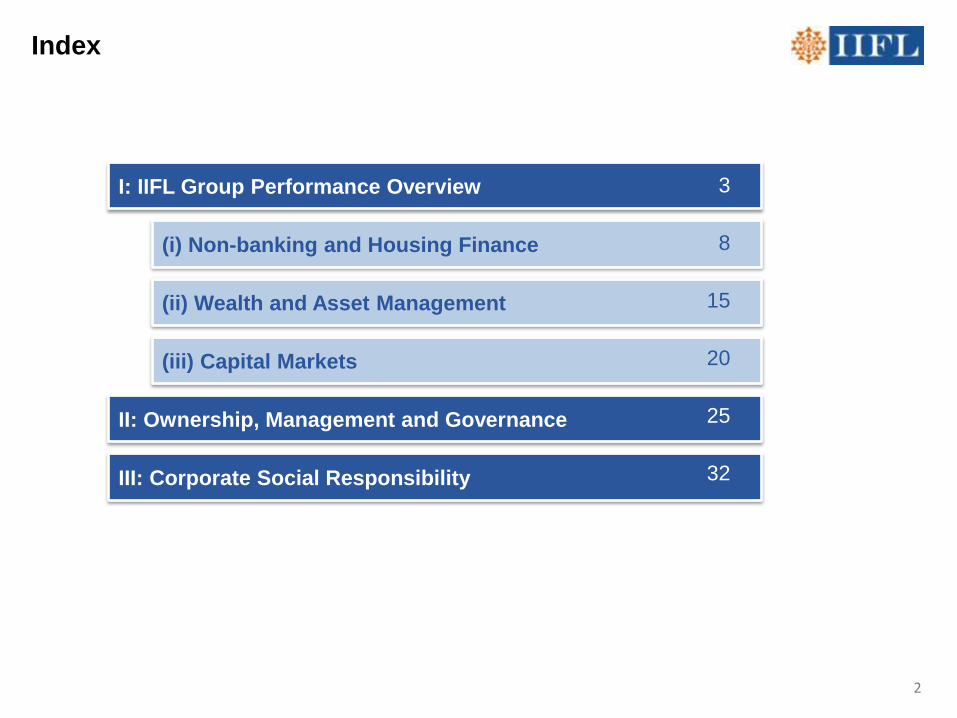
Index
I: IIFL Group Performance Overview
III: Corporate Social Responsibility
(i) Non-banking and Housing Finance
(ii) Wealth and Asset Management
(iii) Capital Markets
II: Ownership, Management and Governance
3
8
15
20
25
32
2
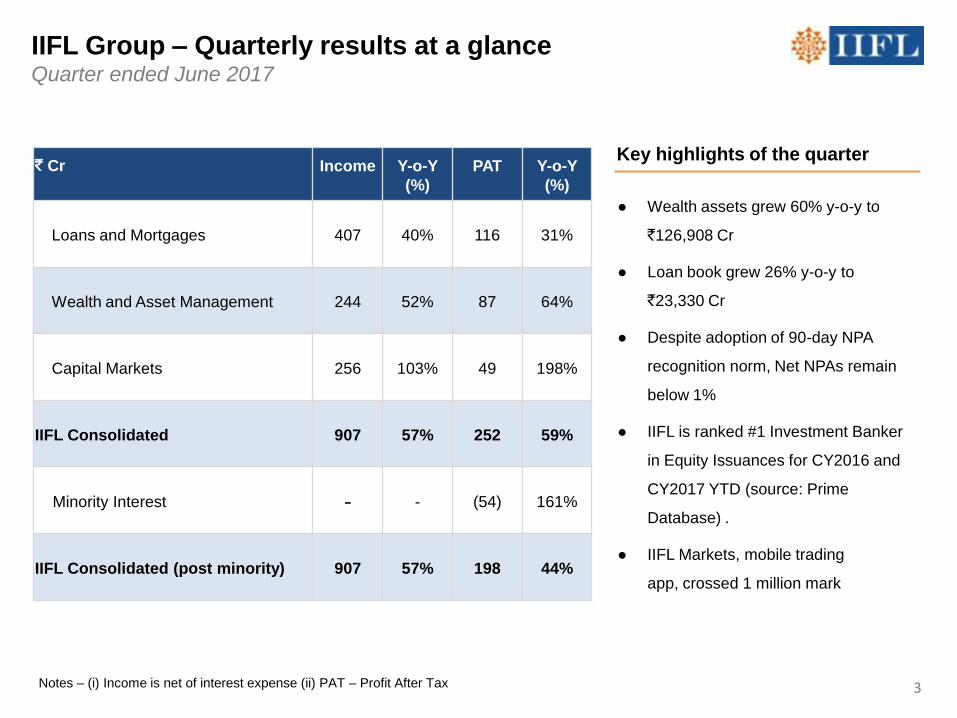
Notes – (i) Income is net of interest expense (ii) PAT – Profit After Tax
IIFL Group – Quarterly results at a glance Quarter ended June 2017
3
` Cr Income Y-o-Y
(%)
PAT Y-o-Y
(%)
Loans and Mortgages 407 40% 116 31%
Wealth and Asset Management 244 52% 87 64%
Capital Markets 256 103% 49 198%
IIFL Consolidated 907 57% 252 59%
Minority Interest - - (54) 161%
IIFL Consolidated (post minority) 907 57% 198 44%
Key highlights of the quarter
● Wealth assets grew 60% y-o-y to
`126,908 Cr
● Loan book grew 26% y-o-y to
`23,330 Cr
● Despite adoption of 90-day NPA
recognition norm, Net NPAs remain
below 1%
● IIFL is ranked #1 Investment Banker
in Equity Issuances for CY2016 and
CY2017 YTD (source: Prime
Database) .
● IIFL Markets, mobile trading
app, crossed 1 million mark
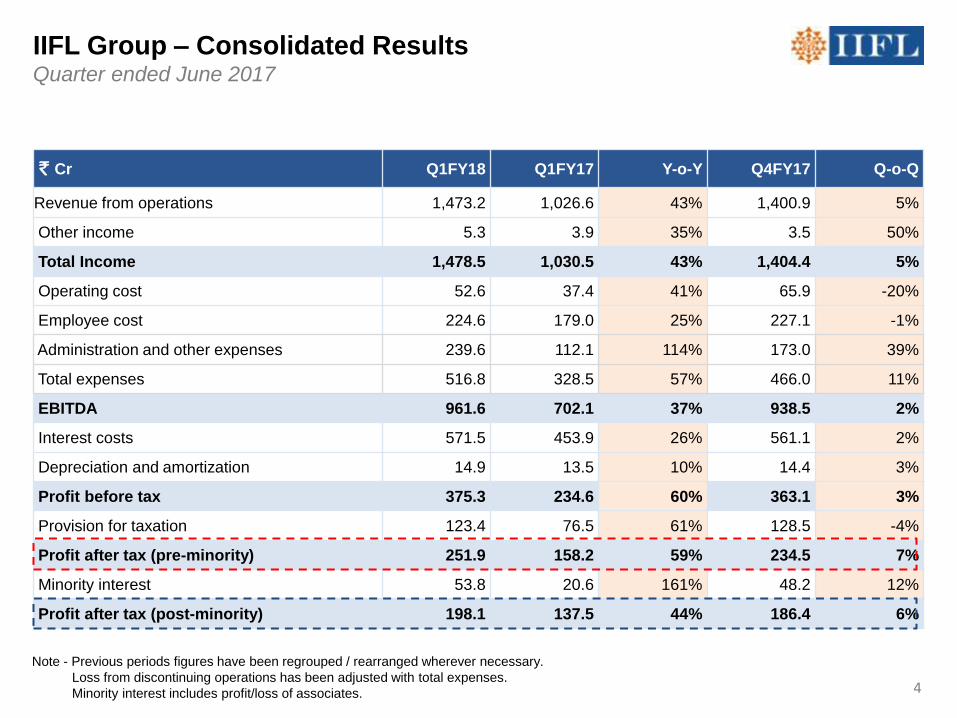
IIFL Group – Consolidated Results Quarter ended June 2017
Note - Previous periods figures have been regrouped / rearranged wherever necessary.
Loss from discontinuing operations has been adjusted with total expenses.
Minority interest includes profit/loss of associates.
` Cr Q1FY18 Q1FY17 Y-o-Y Q4FY17 Q-o-Q
Revenue from operations 1,473.2 1,026.6 43% 1,400.9 5%
Other income 5.3 3.9 35% 3.5 50%
Total Income 1,478.5 1,030.5 43% 1,404.4 5%
Operating cost 52.6 37.4 41% 65.9 -20%
Employee cost 224.6 179.0 25% 227.1 -1%
Administration and other expenses 239.6 112.1 114% 173.0 39%
Total expenses 516.8 328.5 57% 466.0 11%
EBITDA 961.6 702.1 37% 938.5 2%
Interest costs 571.5 453.9 26% 561.1 2%
Depreciation and amortization 14.9 13.5 10% 14.4 3%
Profit before tax 375.3 234.6 60% 363.1 3%
Provision for taxation 123.4 76.5 61% 128.5 -4%
Profit after tax (pre-minority) 251.9 158.2 59% 234.5 7%
Minority interest 53.8 20.6 161% 48.2 12%
Profit after tax (post-minority) 198.1 137.5 44% 186.4 6%
4
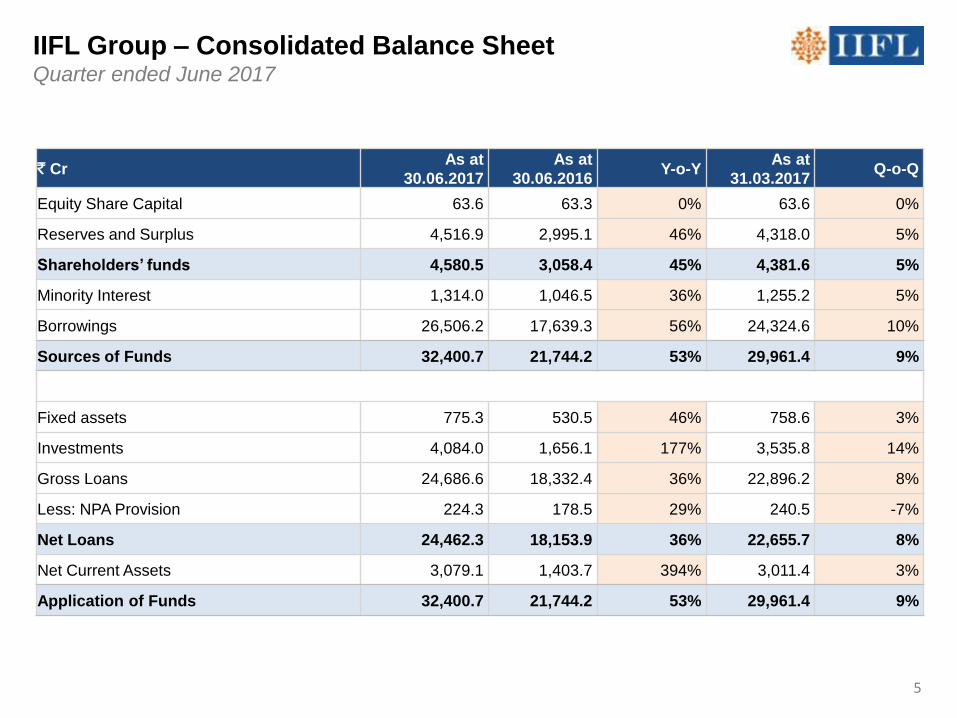
IIFL Group – Consolidated Balance Sheet Quarter ended June 2017
` CrAs at
30.06.2017
As at
30.06.2016Y-o-Y
As at
31.03.2017Q-o-Q
Equity Share Capital 63.6 63.3 0% 63.6 0%
Reserves and Surplus 4,516.9 2,995.1 46% 4,318.0 5%
Shareholders‟ funds 4,580.5 3,058.4 45% 4,381.6 5%
Minority Interest 1,314.0 1,046.5 36% 1,255.2 5%
Borrowings 26,506.2 17,639.3 56% 24,324.6 10%
Sources of Funds 32,400.7 21,744.2 53% 29,961.4 9%
Fixed assets 775.3 530.5 46% 758.6 3%
Investments 4,084.0 1,656.1 177% 3,535.8 14%
Gross Loans 24,686.6 18,332.4 36% 22,896.2 8%
Less: NPA Provision 224.3 178.5 29% 240.5 -7%
Net Loans 24,462.3 18,153.9 36% 22,655.7 8%
Net Current Assets 3,079.1 1,403.7 394% 3,011.4 3%
Application of Funds 32,400.7 21,744.2 53% 29,961.4 9%
5
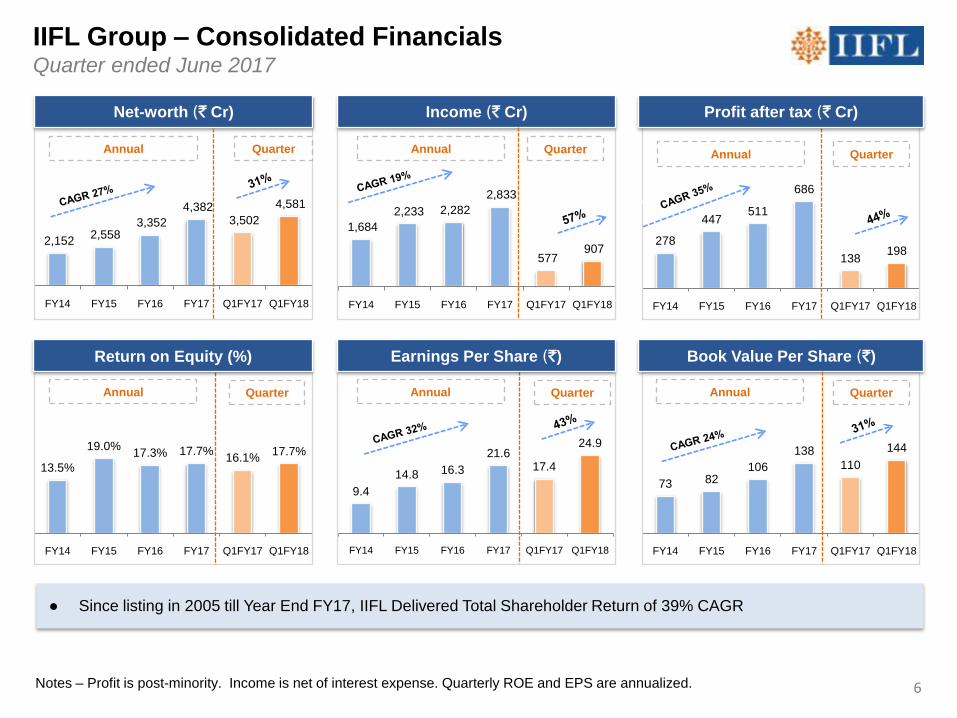
278
447511
686
138198
FY14 FY15 FY16 FY17 Q1FY17 Q1FY18
9.4
14.8 16.3
21.617.4
24.9
FY14 FY15 FY16 FY17 Q1FY17 Q1FY18
73 82106
138
110
144
FY14 FY15 FY16 FY17 Q1FY17 Q1FY18
13.5%
19.0%17.3% 17.7%
16.1%17.7%
FY14 FY15 FY16 FY17 Q1FY17 Q1FY18
1,684
2,233 2,282
2,833
577 907
FY14 FY15 FY16 FY17 Q1FY17 Q1FY18
2,152 2,558
3,352
4,382 3,502
4,581
FY14 FY15 FY16 FY17 Q1FY17 Q1FY18
IIFL Group – Consolidated Financials Quarter ended June 2017
Notes – Profit is post-minority. Income is net of interest expense. Quarterly ROE and EPS are annualized.
Income (` Cr)
Annual Annual
Profit after tax (` Cr) Net-worth (` Cr)
Annual Quarter
Annual
Return on Equity (%)
Annual
Book Value Per Share (`) Earnings Per Share (`)
Annual
● Since listing in 2005 till Year End FY17, IIFL Delivered Total Shareholder Return of 39% CAGR
Quarter
QuarterQuarterQuarter
Quarter
6
I: IIFL Group Performance Overview
III: Corporate Social Responsibility
(i) Non-banking and Housing Finance
(ii) Wealth and Asset Management
(iii) Capital Markets
II: Ownership, Management and Governance
7
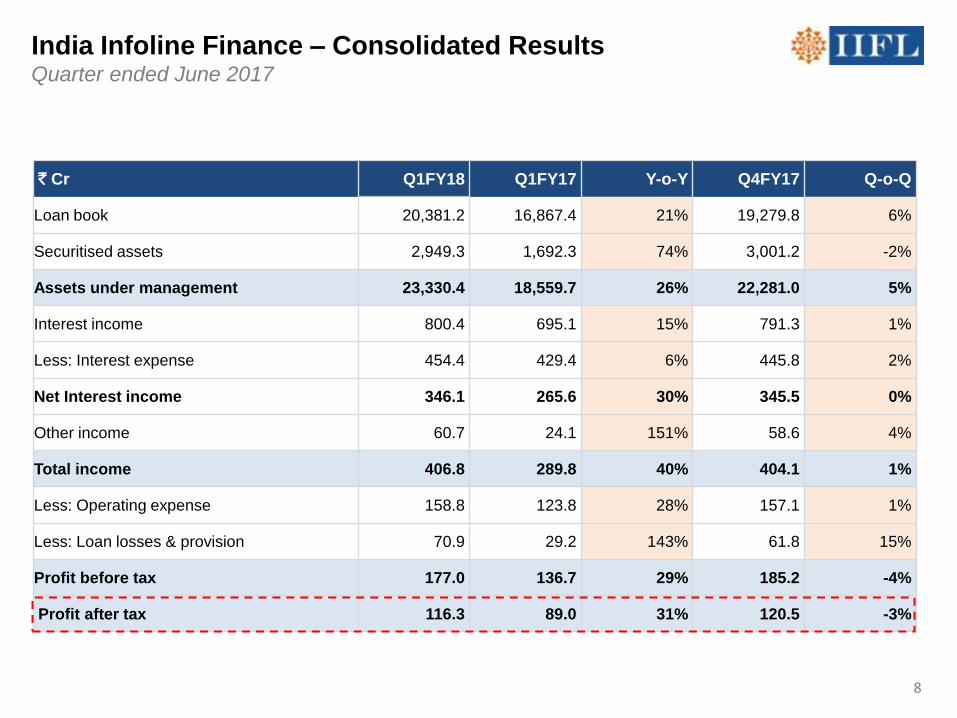
India Infoline Finance – Consolidated Results Quarter ended June 2017
` Cr Q1FY18 Q1FY17 Y-o-Y Q4FY17 Q-o-Q
Loan book 20,381.2 16,867.4 21% 19,279.8 6%
Securitised assets 2,949.3 1,692.3 74% 3,001.2 -2%
Assets under management 23,330.4 18,559.7 26% 22,281.0 5%
Interest income 800.4 695.1 15% 791.3 1%
Less: Interest expense 454.4 429.4 6% 445.8 2%
Net Interest income 346.1 265.6 30% 345.5 0%
Other income 60.7 24.1 151% 58.6 4%
Total income 406.8 289.8 40% 404.1 1%
Less: Operating expense 158.8 123.8 28% 157.1 1%
Less: Loan losses & provision 70.9 29.2 143% 61.8 15%
Profit before tax 177.0 136.7 29% 185.2 -4%
Profit after tax 116.3 89.0 31% 120.5 -3%
8
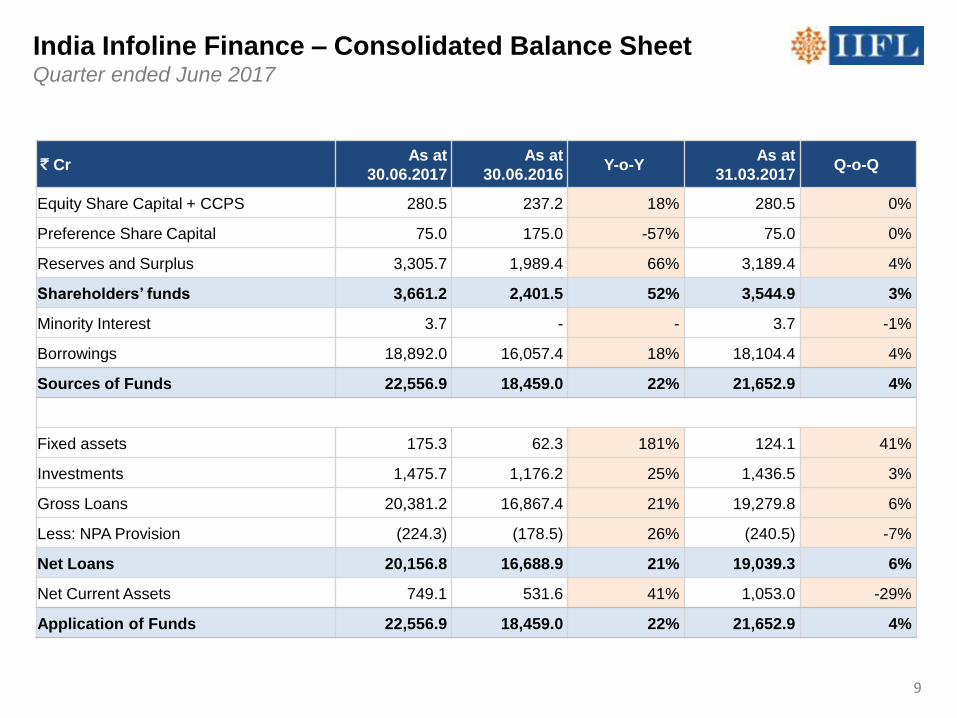
India Infoline Finance – Consolidated Balance SheetQuarter ended June 2017
` CrAs at
30.06.2017
As at
30.06.2016Y-o-Y
As at
31.03.2017Q-o-Q
Equity Share Capital + CCPS 280.5 237.2 18% 280.5 0%
Preference Share Capital 75.0 175.0 -57% 75.0 0%
Reserves and Surplus 3,305.7 1,989.4 66% 3,189.4 4%
Shareholders‟ funds 3,661.2 2,401.5 52% 3,544.9 3%
Minority Interest 3.7 - - 3.7 -1%
Borrowings 18,892.0 16,057.4 18% 18,104.4 4%
Sources of Funds 22,556.9 18,459.0 22% 21,652.9 4%
Fixed assets 175.3 62.3 181% 124.1 41%
Investments 1,475.7 1,176.2 25% 1,436.5 3%
Gross Loans 20,381.2 16,867.4 21% 19,279.8 6%
Less: NPA Provision (224.3) (178.5) 26% (240.5) -7%
Net Loans 20,156.8 16,688.9 21% 19,039.3 6%
Net Current Assets 749.1 531.6 41% 1,053.0 -29%
Application of Funds 22,556.9 18,459.0 22% 21,652.9 4%
9
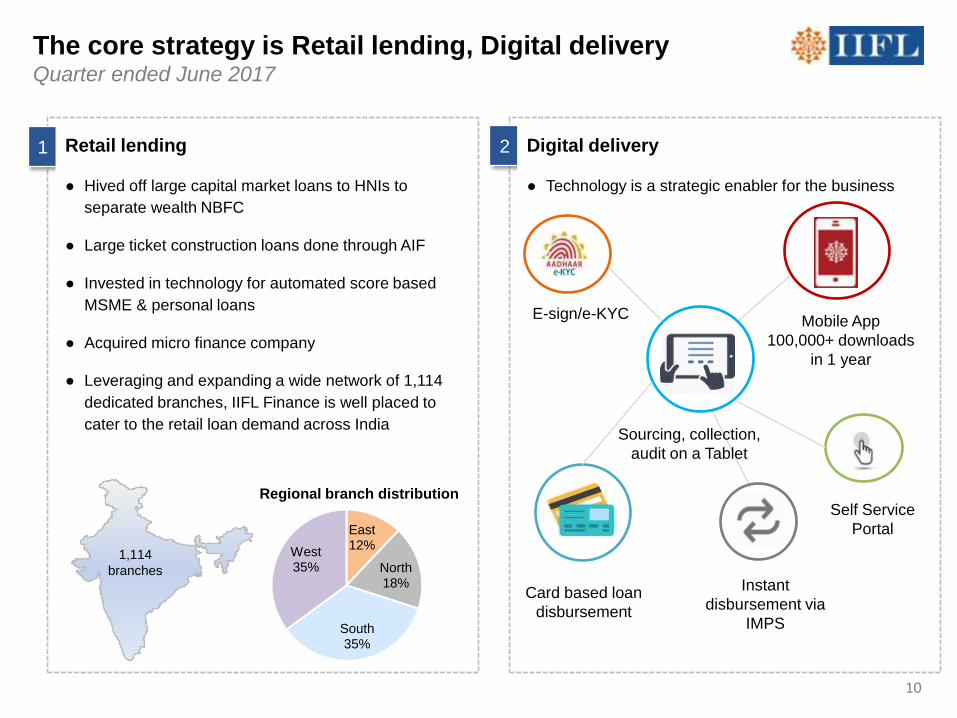
The core strategy is Retail lending, Digital delivery Quarter ended June 2017
1 Retail lending
● Hived off large capital market loans to HNIs to
separate wealth NBFC
● Large ticket construction loans done through AIF
● Invested in technology for automated score based
MSME & personal loans
● Acquired micro finance company
● Leveraging and expanding a wide network of 1,114
dedicated branches, IIFL Finance is well placed to
cater to the retail loan demand across India
2 Digital delivery
● Technology is a strategic enabler for the business
Mobile App
100,000+ downloads
in 1 year
Self Service
Portal
Sourcing, collection,
audit on a Tablet
E-sign/e-KYC
East12%
North18%
South 35%
West35%
1,114
branches
10
Card based loan
disbursement
Instant
disbursement via
IMPS
Regional branch distribution
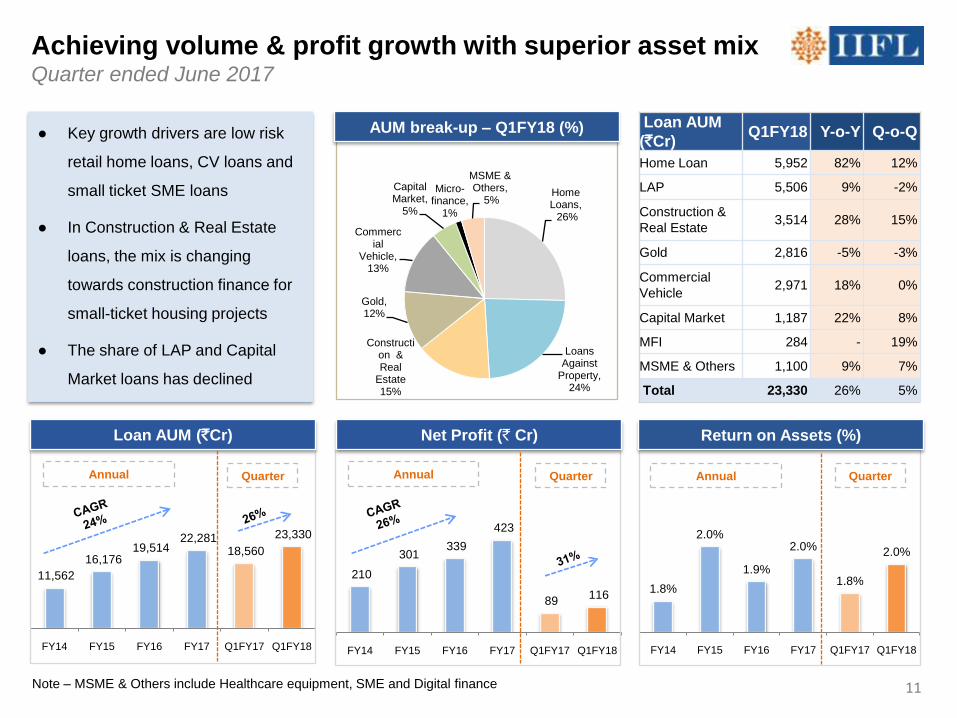
11,562
16,176 19,514
22,281 18,560
23,330
FY14 FY15 FY16 FY17 Q1FY17 Q1FY18
1.8%
2.0%
1.9%
2.0%
1.8%
2.0%
FY14 FY15 FY16 FY17 Q1FY17 Q1FY18
210
301 339
423
89 116
FY14 FY15 FY16 FY17 Q1FY17 Q1FY18
Achieving volume & profit growth with superior asset mix Quarter ended June 2017
Note – MSME & Others include Healthcare equipment, SME and Digital finance
Net Profit (` Cr)
Annual
Return on Assets (%)
Annual
Loan AUM (`Cr)
● Key growth drivers are low risk
retail home loans, CV loans and
small ticket SME loans
● In Construction & Real Estate
loans, the mix is changing
towards construction finance for
small-ticket housing projects
● The share of LAP and Capital
Market loans has declined
Home Loans,
26%
Loans Against
Property, 24%
Construction & Real
Estate 15%
Gold,12%
Commercial
Vehicle, 13%
Capital Market,
5%
Micro-finance,
1%
MSME & Others,
5%
Annual Quarter Quarter Quarter
Loan AUM
(`Cr)Q1FY18 Y-o-Y Q-o-Q
Home Loan 5,952 82% 12%
LAP 5,506 9% -2%
Construction &
Real Estate 3,514 28% 15%
Gold 2,816 -5% -3%
Commercial
Vehicle 2,971 18% 0%
Capital Market 1,187 22% 8%
MFI 284 - 19%
MSME & Others 1,100 9% 7%
Total 23,330 26% 5%
11
AUM break-up – Q1FY18 (%)
42%
35%
23%
Term Loan NCD Commercial Papers
7.0% 7.1%
6.2%6.4%
6.1%
6.6%
FY14 FY15 FY16 FY17 Q1FY17 Q1FY18
53.8%
44.5% 44.0%40.1%
42.7%39.0%
FY14 FY15 FY16 FY17 Q1FY17 Q1FY18
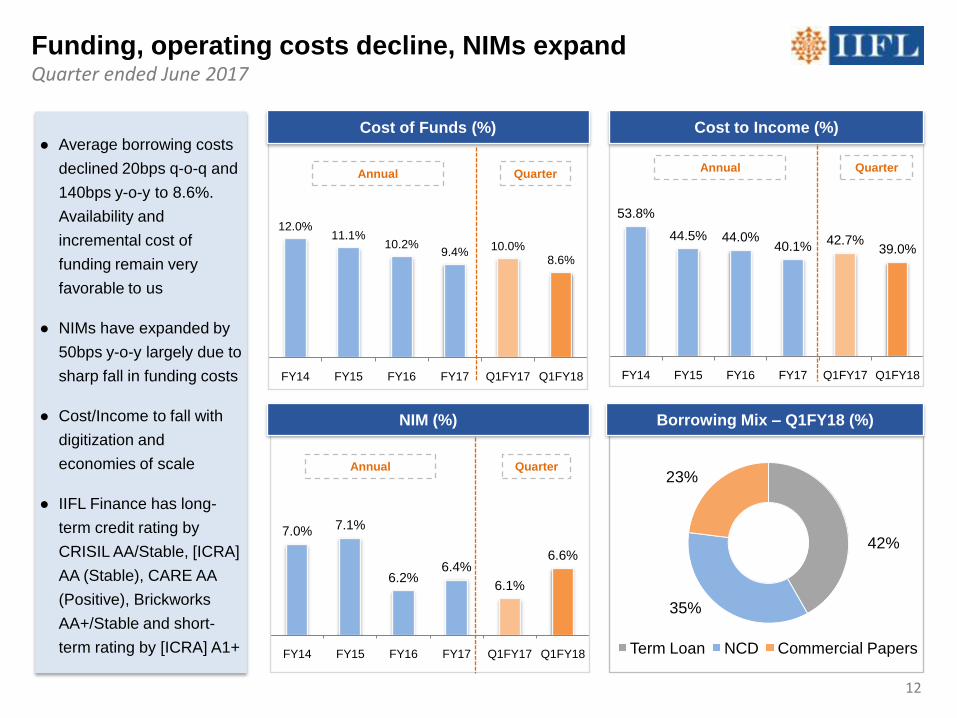
● Average borrowing costs
declined 20bps q-o-q and
140bps y-o-y to 8.6%.
Availability and
incremental cost of
funding remain very
favorable to us
● NIMs have expanded by
50bps y-o-y largely due to
sharp fall in funding costs
● Cost/Income to fall with
digitization and
economies of scale
● IIFL Finance has long-
term credit rating by
CRISIL AA/Stable, [ICRA]
AA (Stable), CARE AA
(Positive), Brickworks
AA+/Stable and short-
term rating by [ICRA] A1+
Funding, operating costs decline, NIMs expand Quarter ended June 2017
Annual Quarter
12.0%11.1%
10.2%9.4%
10.0%8.6%
FY14 FY15 FY16 FY17 Q1FY17 Q1FY18
Annual Quarter
Annual Quarter
Cost of Funds (%) Cost to Income (%)
NIM (%) Borrowing Mix – Q1FY18 (%)
12
0.86%
1.27%1.44%
1.82%1.97% 2.04%
FY14 FY15 FY16 FY17 Q1FY17 Q1FY18
0.33%
0.54% 0.54% 0.58%
0.91% 0.94%
FY14 FY15 FY16 FY17 Q1FY17 Q1FY18
Through cycles, maintaining superior quality of assets Quarter ended June 2017
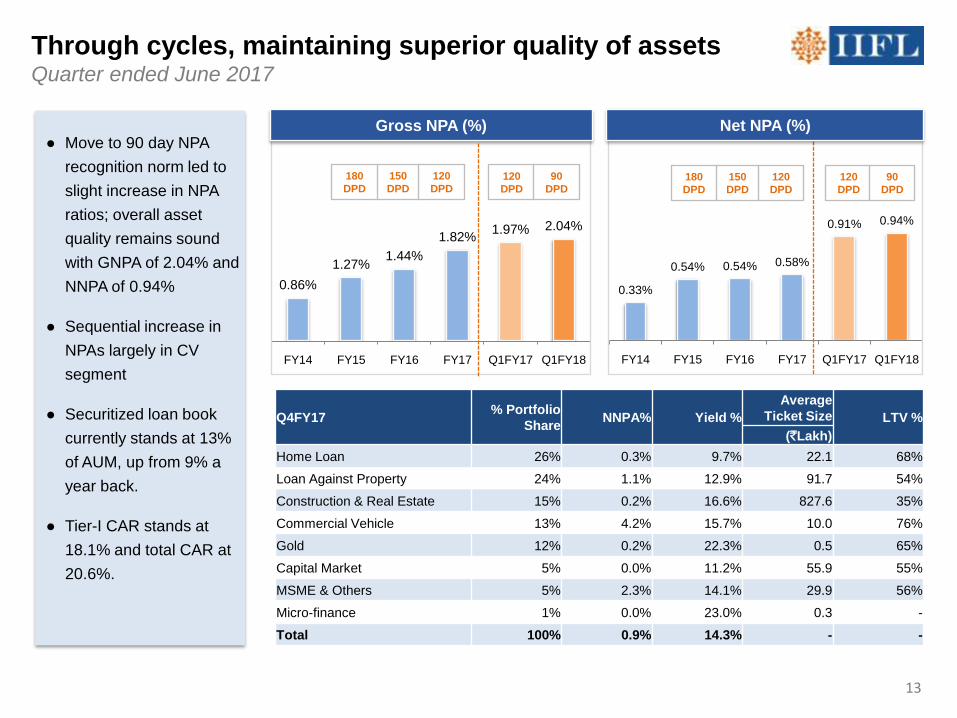
Gross NPA (%)● Move to 90 day NPA
recognition norm led to
slight increase in NPA
ratios; overall asset
quality remains sound
with GNPA of 2.04% and
NNPA of 0.94%
● Sequential increase in
NPAs largely in CV
segment
● Securitized loan book
currently stands at 13%
of AUM, up from 9% a
year back.
● Tier-I CAR stands at
18.1% and total CAR at
20.6%.
150
DPD
180
DPD
120
DPD150
DPD
180
DPD
120
DPD
120
DPD
90
DPD120
DPD
90
DPD
13
Net NPA (%)
Q4FY17% Portfolio
ShareNNPA% Yield %
Average
Ticket Size LTV %
(`Lakh)
Home Loan 26% 0.3% 9.7% 22.1 68%
Loan Against Property 24% 1.1% 12.9% 91.7 54%
Construction & Real Estate 15% 0.2% 16.6% 827.6 35%
Commercial Vehicle 13% 4.2% 15.7% 10.0 76%
Gold 12% 0.2% 22.3% 0.5 65%
Capital Market 5% 0.0% 11.2% 55.9 55%
MSME & Others 5% 2.3% 14.1% 29.9 56%
Micro-finance 1% 0.0% 23.0% 0.3 -
Total 100% 0.9% 14.3% - -
I: IIFL Group Business Overview
(i) Non-banking and Housing Finance
(ii) Wealth and Asset Management
(iii) Capital Markets
II: Ownership, Management and Governance
14
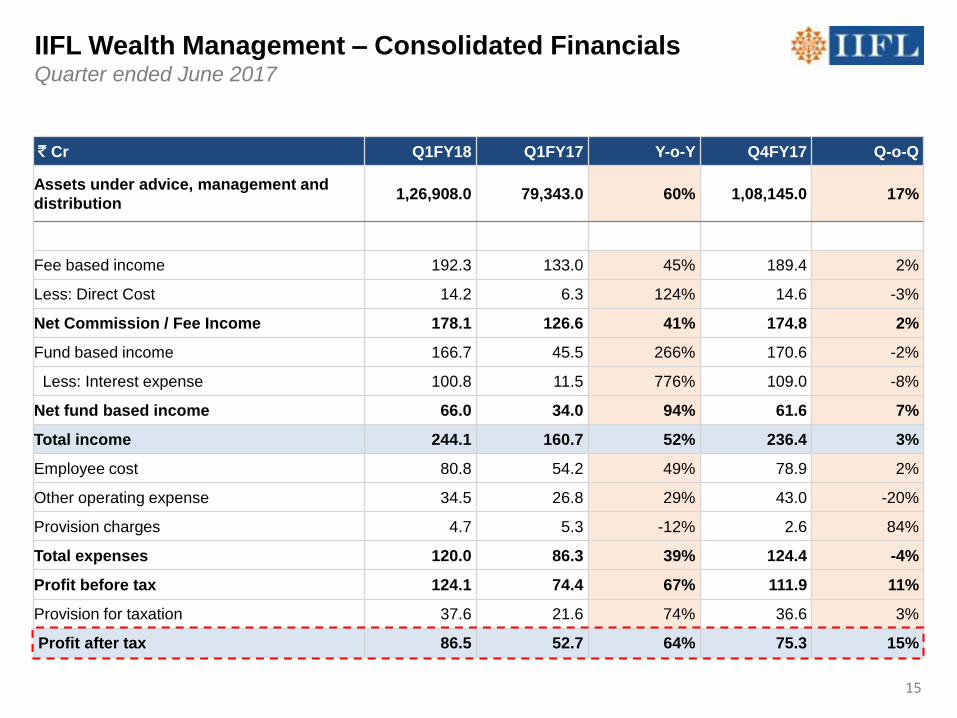
IIFL Wealth Management – Consolidated Financials Quarter ended June 2017
` Cr Q1FY18 Q1FY17 Y-o-Y Q4FY17 Q-o-Q
Assets under advice, management and
distribution1,26,908.0 79,343.0 60% 1,08,145.0 17%
Fee based income 192.3 133.0 45% 189.4 2%
Less: Direct Cost 14.2 6.3 124% 14.6 -3%
Net Commission / Fee Income 178.1 126.6 41% 174.8 2%
Fund based income 166.7 45.5 266% 170.6 -2%
Less: Interest expense 100.8 11.5 776% 109.0 -8%
Net fund based income 66.0 34.0 94% 61.6 7%
Total income 244.1 160.7 52% 236.4 3%
Employee cost 80.8 54.2 49% 78.9 2%
Other operating expense 34.5 26.8 29% 43.0 -20%
Provision charges 4.7 5.3 -12% 2.6 84%
Total expenses 120.0 86.3 39% 124.4 -4%
Profit before tax 124.1 74.4 67% 111.9 11%
Provision for taxation 37.6 21.6 74% 36.6 3%
Profit after tax 86.5 52.7 64% 75.3 15%
15
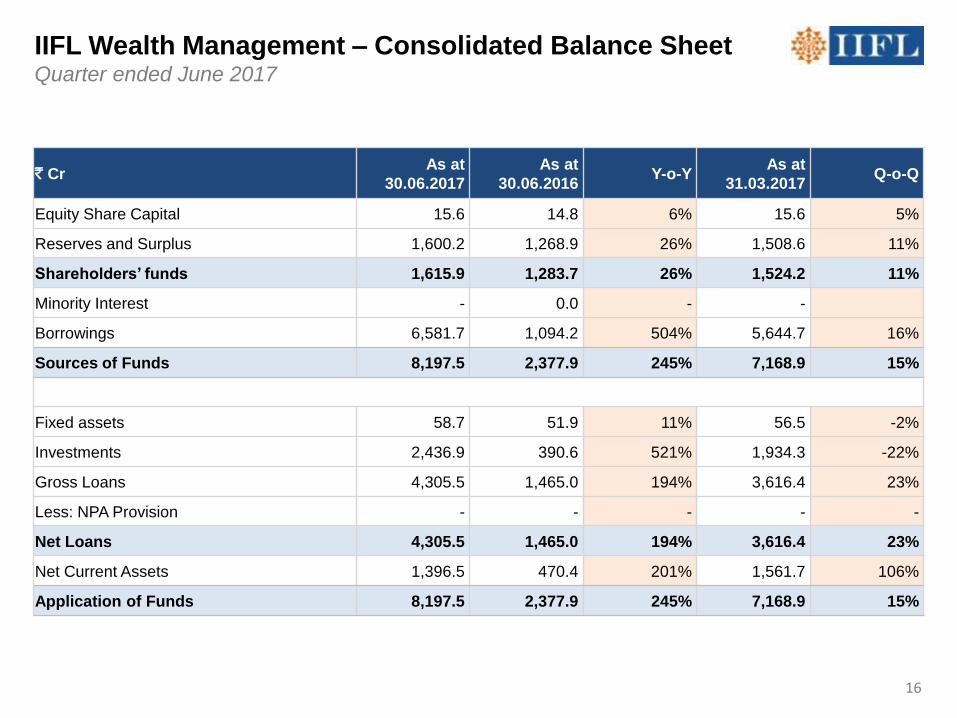
IIFL Wealth Management – Consolidated Balance SheetQuarter ended June 2017
` CrAs at
30.06.2017
As at
30.06.2016Y-o-Y
As at
31.03.2017Q-o-Q
Equity Share Capital 15.6 14.8 6% 15.6 5%
Reserves and Surplus 1,600.2 1,268.9 26% 1,508.6 11%
Shareholders‟ funds 1,615.9 1,283.7 26% 1,524.2 11%
Minority Interest - 0.0 - -
Borrowings 6,581.7 1,094.2 504% 5,644.7 16%
Sources of Funds 8,197.5 2,377.9 245% 7,168.9 15%
Fixed assets 58.7 51.9 11% 56.5 -2%
Investments 2,436.9 390.6 521% 1,934.3 -22%
Gross Loans 4,305.5 1,465.0 194% 3,616.4 23%
Less: NPA Provision - - - - -
Net Loans 4,305.5 1,465.0 194% 3,616.4 23%
Net Current Assets 1,396.5 470.4 201% 1,561.7 106%
Application of Funds 8,197.5 2,377.9 245% 7,168.9 15%
16
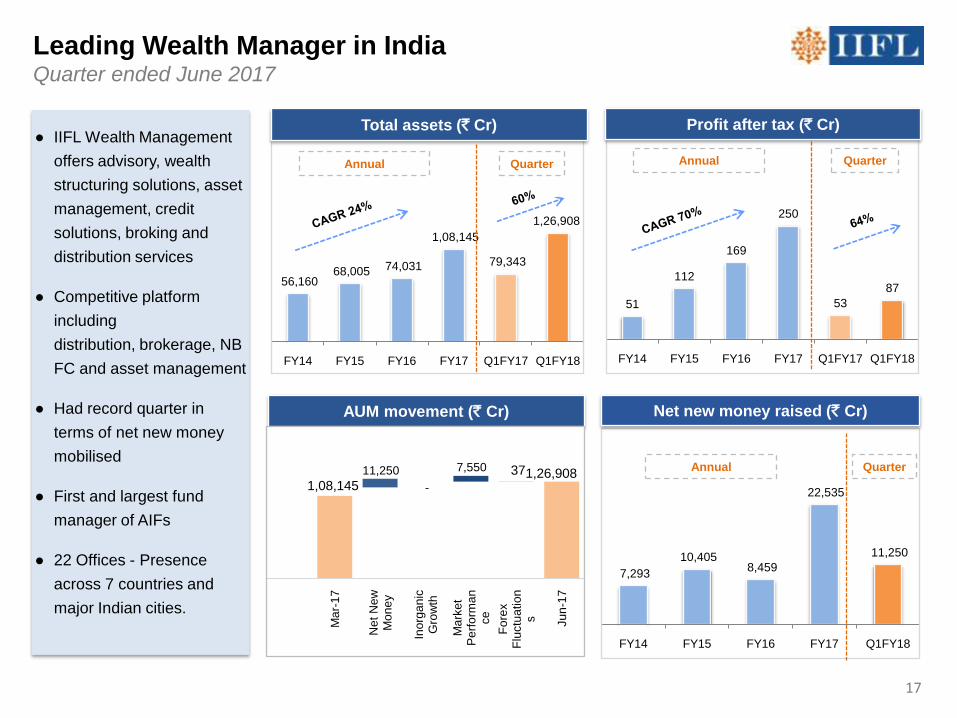
51
112
169
250
53
87
FY14 FY15 FY16 FY17 Q1FY17 Q1FY18
7,293
10,405 8,459
22,535
11,250
FY14 FY15 FY16 FY17 Q1FY18
56,160 68,005 74,031
1,08,145
79,343
1,26,908
FY14 FY15 FY16 FY17 Q1FY17 Q1FY18
Leading Wealth Manager in India Quarter ended June 2017
● IIFL Wealth Management
offers advisory, wealth
structuring solutions, asset
management, credit
solutions, broking and
distribution services
● Competitive platform
including
distribution, brokerage, NB
FC and asset management
● Had record quarter in
terms of net new money
mobilised
● First and largest fund
manager of AIFs
● 22 Offices - Presence
across 7 countries and
major Indian cities.
Total assets (` Cr)
Annual Quarter
Profit after tax (` Cr)
Annual
Net new money raised (` Cr)
Quarter
Annual Quarter
AUM movement (` Cr)
1,08,145 1,26,908 37 11,250
-
7,550
Ma
r-1
7
Net N
ew
M
on
ey
Ino
rga
nic
G
row
th
Ma
rke
t P
erf
orm
an
ce
Fo
rex
Flu
ctu
atio
ns Ju
n-1
7
17
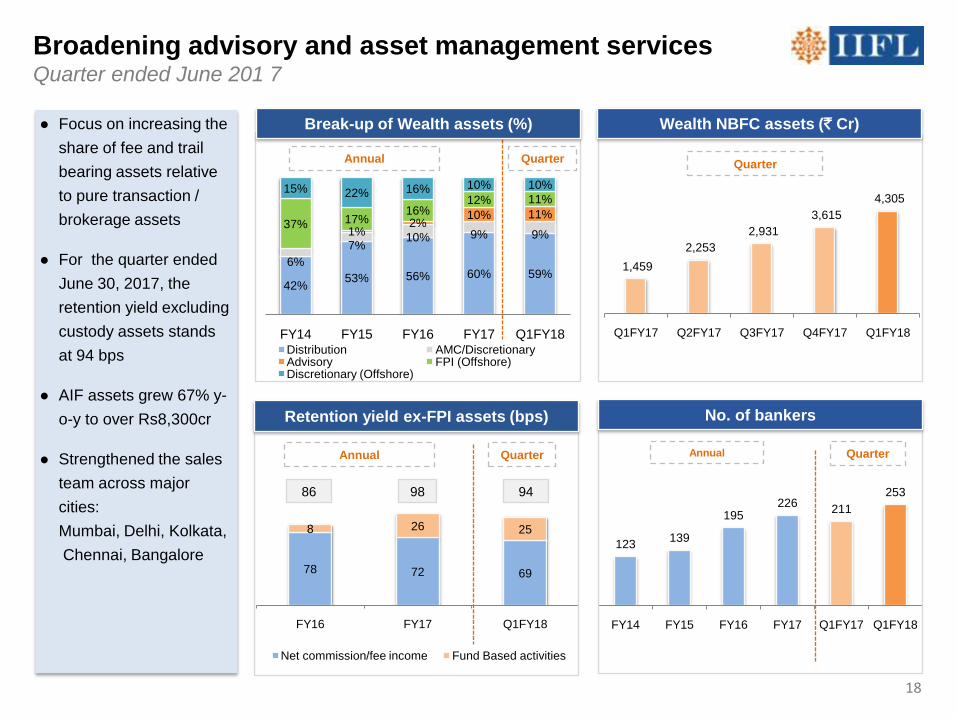
42%53% 56% 60% 59%
6%
7%10% 9% 9%1%2%
10% 11%37% 17%
16%12% 11%
15% 22% 16% 10% 10%
FY14 FY15 FY16 FY17 Q1FY18Distribution AMC/DiscretionaryAdvisory FPI (Offshore)Discretionary (Offshore)
78 72 69
8 26 25
FY16 FY17 Q1FY18
Net commission/fee income Fund Based activities
Annual
86 98 94
Broadening advisory and asset management servicesQuarter ended June 201 7
● Focus on increasing the
share of fee and trail
bearing assets relative
to pure transaction /
brokerage assets
● For the quarter ended
June 30, 2017, the
retention yield excluding
custody assets stands
at 94 bps
● AIF assets grew 67% y-
o-y to over Rs8,300cr
● Strengthened the sales
team across major
cities:
Mumbai, Delhi, Kolkata,
Chennai, Bangalore
1,459
2,253
2,931
3,615
4,305
Q1FY17 Q2FY17 Q3FY17 Q4FY17 Q1FY18
Retention yield ex-FPI assets (bps)
Wealth NBFC assets (` Cr)
Quarter
Quarter
123139
195226
211
253
FY14 FY15 FY16 FY17 Q1FY17 Q1FY18
No. of bankers
Annual Quarter
18
Annual Quarter
Break-up of Wealth assets (%)
I: IIFL Group Performance Overview
III: Corporate Social Responsibility
(i) Non-banking and Housing Finance
(ii) Wealth and Asset Management
(iii) Capital Markets
II: Ownership, Management and Governance
19
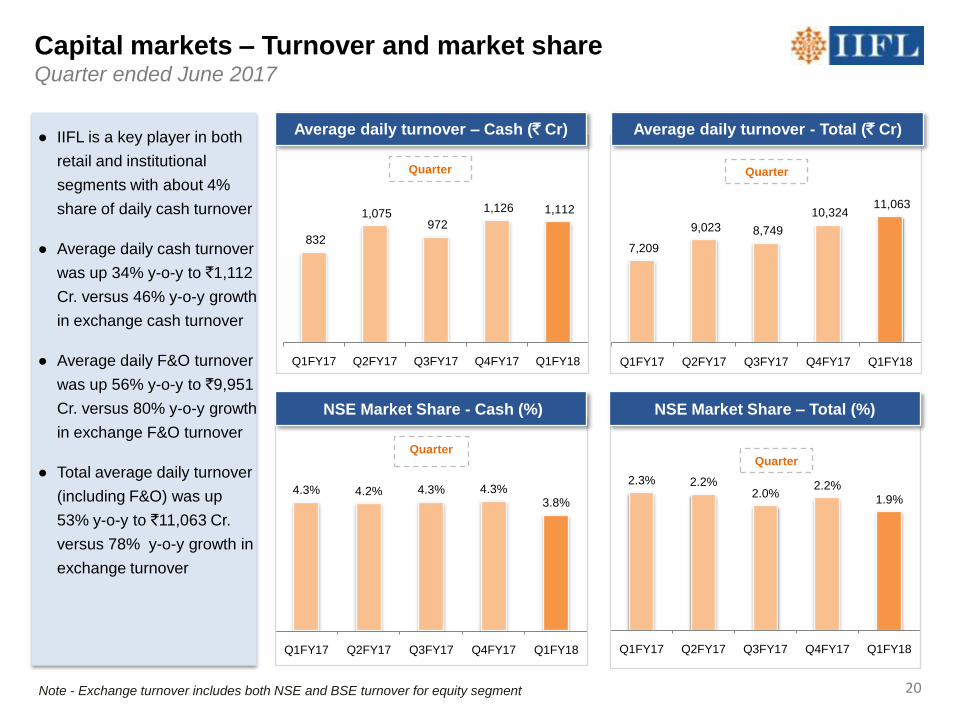
4.3% 4.2% 4.3% 4.3%3.8%
Q1FY17 Q2FY17 Q3FY17 Q4FY17 Q1FY18
Quarter
2.3% 2.2%2.0%
2.2%
1.9%
Q1FY17 Q2FY17 Q3FY17 Q4FY17 Q1FY18
7,209
9,023 8,749
10,324 11,063
Q1FY17 Q2FY17 Q3FY17 Q4FY17 Q1FY18
832
1,075 972
1,126 1,112
Q1FY17 Q2FY17 Q3FY17 Q4FY17 Q1FY18
Capital markets – Turnover and market share Quarter ended June 2017
Quarter
Quarter
● IIFL is a key player in both
retail and institutional
segments with about 4%
share of daily cash turnover
● Average daily cash turnover
was up 34% y-o-y to `1,112
Cr. versus 46% y-o-y growth
in exchange cash turnover
● Average daily F&O turnover
was up 56% y-o-y to `9,951
Cr. versus 80% y-o-y growth
in exchange F&O turnover
● Total average daily turnover
(including F&O) was up
53% y-o-y to `11,063 Cr.
versus 78% y-o-y growth in
exchange turnover
Note - Exchange turnover includes both NSE and BSE turnover for equity segment
Average daily turnover – Cash (` Cr) Average daily turnover - Total (` Cr)
NSE Market Share – Total (%)NSE Market Share - Cash (%)
Quarter
20
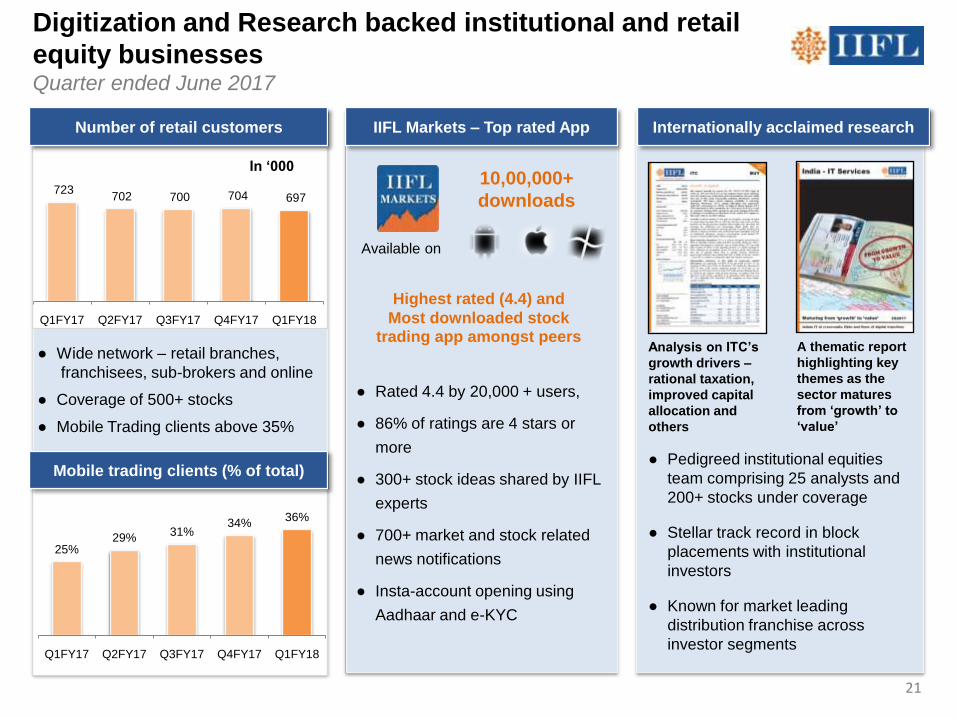
● Wide network – retail branches,
franchisees, sub-brokers and online
● Coverage of 500+ stocks
● Mobile Trading clients above 35%
● Pedigreed institutional equities
team comprising 25 analysts and
200+ stocks under coverage
● Stellar track record in block
placements with institutional
investors
● Known for market leading
distribution franchise across
investor segments
Digitization and Research backed institutional and retail
equity businessesQuarter ended June 2017
25%29%
31%34%
36%
Q1FY17 Q2FY17 Q3FY17 Q4FY17 Q1FY18
Analysis on ITC‟s
growth drivers –
rational taxation,
improved capital
allocation and
others
A thematic report
highlighting key
themes as the
sector matures
from „growth‟ to
„value‟
Mobile trading clients (% of total)
IIFL Markets – Top rated App
10,00,000+
downloads
Available on
● Rated 4.4 by 20,000 + users,
● 86% of ratings are 4 stars or
more
● 300+ stock ideas shared by IIFL
experts
● 700+ market and stock related
news notifications
● Insta-account opening using
Aadhaar and e-KYC
Highest rated (4.4) and
Most downloaded stock trading app amongst peers
Internationally acclaimed research
723 702 700 704 697
Q1FY17 Q2FY17 Q3FY17 Q4FY17 Q1FY18
In „000
Number of retail customers
21
22
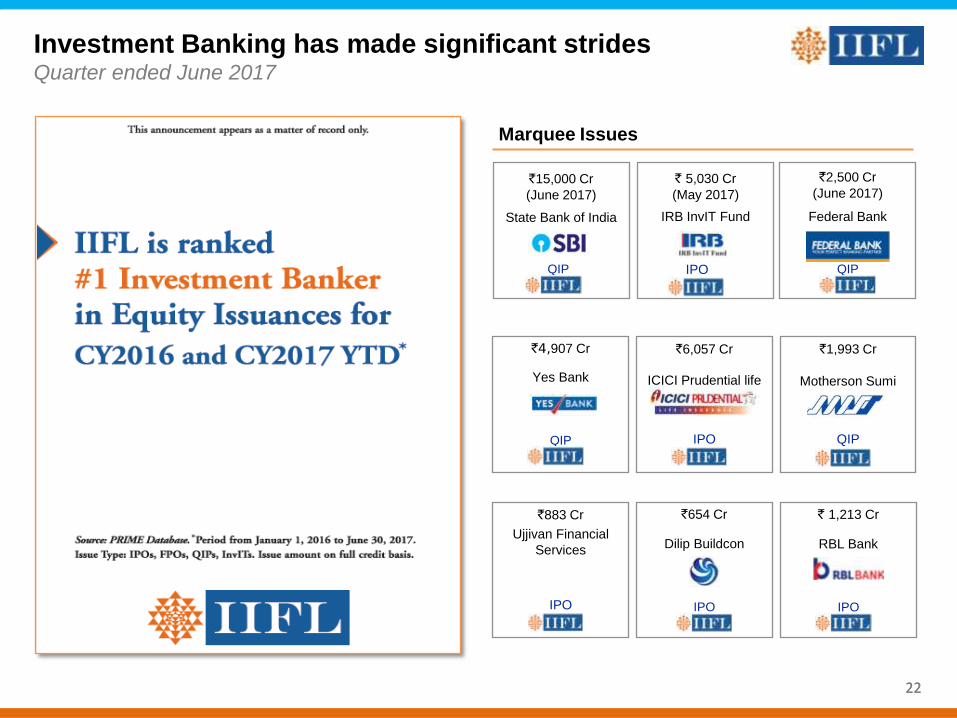
Investment Banking has made significant strides Quarter ended June 2017
22
`654 Cr
Dilip Buildcon
IPO
` 1,213 Cr
RBL Bank
IPO
`883 Cr
Ujjivan Financial
Services
IPO
`1,993 Cr
Motherson Sumi
Systems
QIP
`6,057 Cr
ICICI Prudential life
IPO
`4,907 Cr
Yes Bank
QIP
`15,000 Cr
(June 2017)
State Bank of India
QIP IPO
` 5,030 Cr
(May 2017)
IRB InvIT Fund
`2,500 Cr
(June 2017)
Federal Bank
QIP
Marquee Issues
23
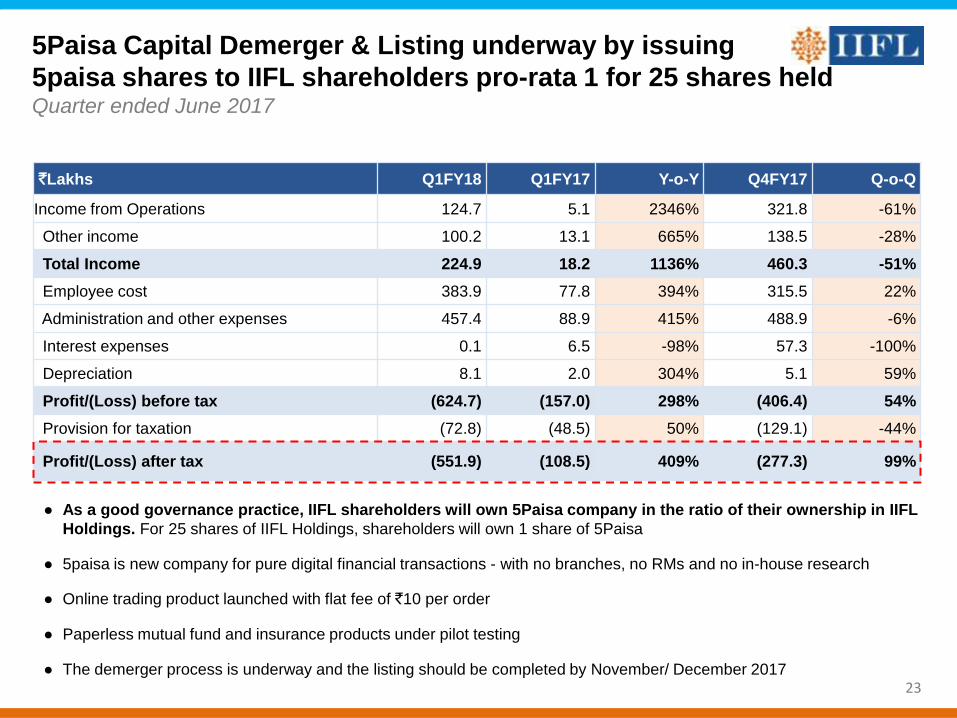
`Lakhs Q1FY18 Q1FY17 Y-o-Y Q4FY17 Q-o-Q
Income from Operations 124.7 5.1 2346% 321.8 -61%
Other income 100.2 13.1 665% 138.5 -28%
Total Income 224.9 18.2 1136% 460.3 -51%
Employee cost 383.9 77.8 394% 315.5 22%
Administration and other expenses 457.4 88.9 415% 488.9 -6%
Interest expenses 0.1 6.5 -98% 57.3 -100%
Depreciation 8.1 2.0 304% 5.1 59%
Profit/(Loss) before tax (624.7) (157.0) 298% (406.4) 54%
Provision for taxation (72.8) (48.5) 50% (129.1) -44%
Profit/(Loss) after tax (551.9) (108.5) 409% (277.3) 99%
5Paisa Capital Demerger & Listing underway by issuing
5paisa shares to IIFL shareholders pro-rata 1 for 25 shares held Quarter ended June 2017
● As a good governance practice, IIFL shareholders will own 5Paisa company in the ratio of their ownership in IIFL
Holdings. For 25 shares of IIFL Holdings, shareholders will own 1 share of 5Paisa
● 5paisa is new company for pure digital financial transactions - with no branches, no RMs and no in-house research
● Online trading product launched with flat fee of `10 per order
● Paperless mutual fund and insurance products under pilot testing
● The demerger process is underway and the listing should be completed by November/ December 2017
I: IIFL Group Business Overview
(i) Non-banking and Housing Finance
(ii) Wealth and Asset Management
(iii) Capital Markets
II: Ownership, Management and Governance
24

IIFL - India‟s leading integrated financial services group
Loan AUM
`23,330 Cr retail focused
diversified loan assets
Products
Home, LAP, Gold,
Commercial Vehicle, SME
and Micro Finance loans
Financials Q1FY18
Income `407Cr
Profit after tax `116 Cr
Minority Shareholders*
CDC Group plc - 15.4%
Non-Banking and
Housing Finance
Wealth and Asset
Management
IIFL Holdings Ltd
(Listed co. | Bloomberg Code: IIFL IN)
Notes – (i) Income is net of interest expense (ii) Profit is pre-minority (iii) Loan/Wealth assets as at June 30, 2017.
*Fully diluted basis.
Capital Market/
Others
Three key operating businesses - Multiple subsidiaries to comply with all applicable regulators
Wealth Assets
`1,26,908 Cr from 10,000+
high networth families
Products
Family office, AIFs, advisory
and distribution services
Financials Q1FY18
Income ` 244 Cr
Profit after tax ` 87 Cr
Minority Shareholders
General Atlantic - 23.2%
Employees – 19.1%
Customers and network
40 lakh customers serviced
from 1,200+ locations
Products
Retail and institutional
broking, investment
banking
Financials Q1FY18
Income `256Cr
Profit after tax `49 Cr
Minority Shareholders
Nil
25
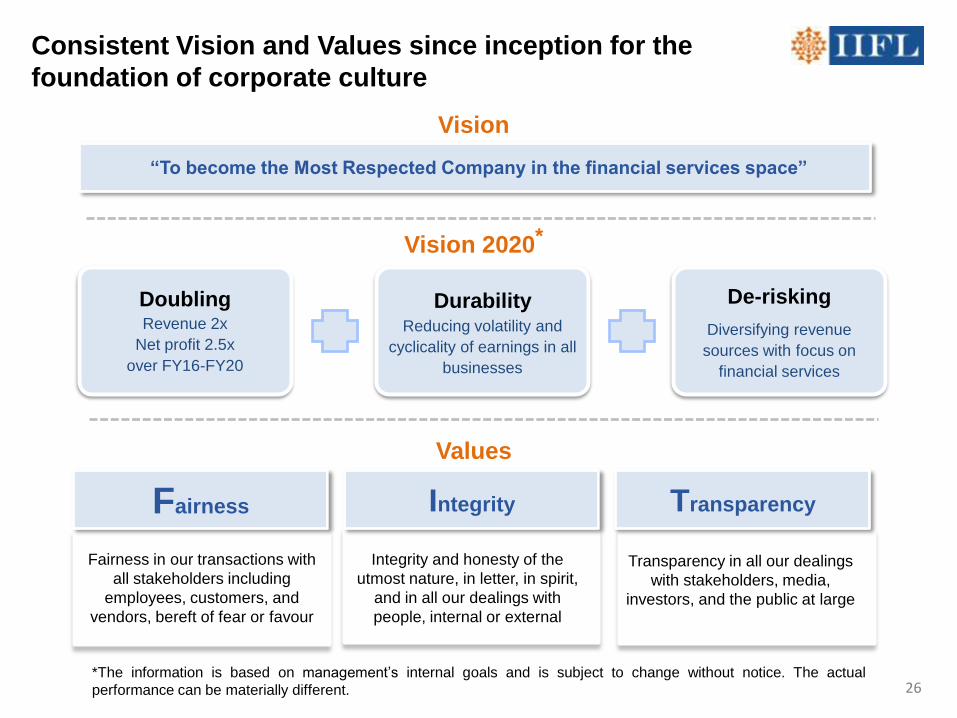
DoublingRevenue 2x
Net profit 2.5x
over FY16-FY20
Durability Reducing volatility and
cyclicality of earnings in all
businesses
De-risking
Diversifying revenue
sources with focus on
financial services
Values
Consistent Vision and Values since inception for the
foundation of corporate culture
Vision
Fairness Integrity Transparency
“To become the Most Respected Company in the financial services space”
Vision 2020*
*The information is based on management’s internal goals and is subject to change without notice. The actual
performance can be materially different. 26
Transparency in all our dealings
with stakeholders, media,
investors, and the public at large
Fairness in our transactions with
all stakeholders including
employees, customers, and
vendors, bereft of fear or favour
Integrity and honesty of the
utmost nature, in letter, in spirit,
and in all our dealings with
people, internal or external
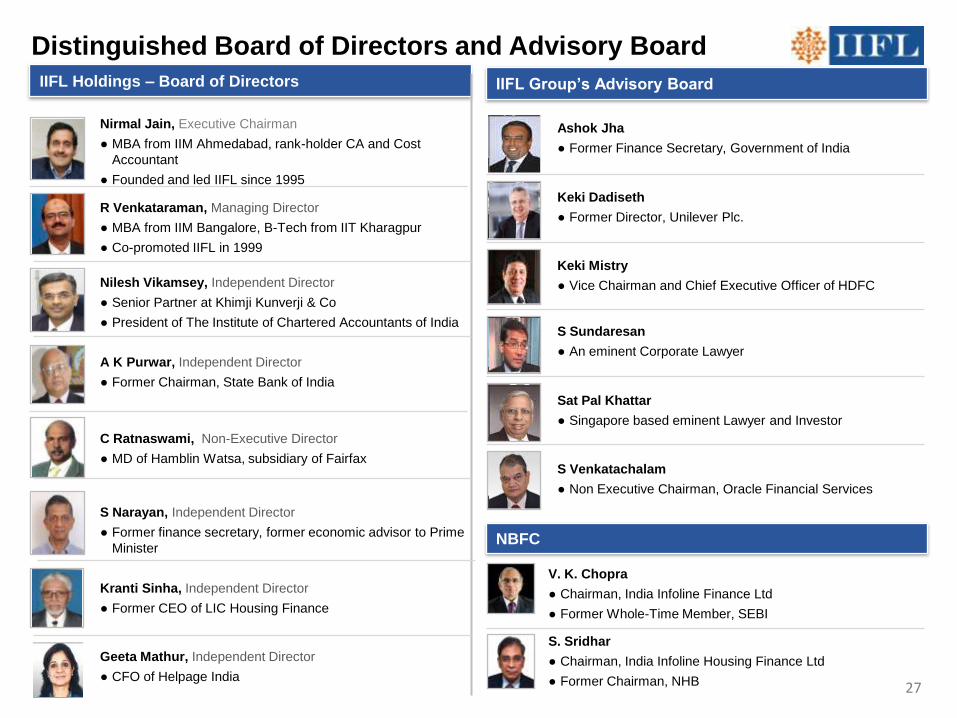
Nirmal Jain, Executive Chairman
● MBA from IIM Ahmedabad, rank-holder CA and Cost
Accountant
● Founded and led IIFL since 1995
C Ratnaswami, Non-Executive Director
● MD of Hamblin Watsa, subsidiary of Fairfax
Kranti Sinha, Independent Director
● Former CEO of LIC Housing Finance
A K Purwar, Independent Director
● Former Chairman, State Bank of India
Nilesh Vikamsey, Independent Director
● Senior Partner at Khimji Kunverji & Co
● President of The Institute of Chartered Accountants of India
R Venkataraman, Managing Director
● MBA from IIM Bangalore, B-Tech from IIT Kharagpur
● Co-promoted IIFL in 1999
S Narayan, Independent Director
● Former finance secretary, former economic advisor to Prime
Minister
Geeta Mathur, Independent Director
● CFO of Helpage India
IIFL Holdings – Board of Directors IIFL Group‟s Advisory Board
Ashok Jha
● Former Finance Secretary, Government of India
Keki Dadiseth
● Former Director, Unilever Plc.
Keki Mistry
● Vice Chairman and Chief Executive Officer of HDFC
S Sundaresan
● An eminent Corporate Lawyer
Sat Pal Khattar
● Singapore based eminent Lawyer and Investor
S Venkatachalam
● Non Executive Chairman, Oracle Financial Services
Distinguished Board of Directors and Advisory Board
NBFC
V. K. Chopra
● Chairman, India Infoline Finance Ltd
● Former Whole-Time Member, SEBI
S. Sridhar
● Chairman, India Infoline Housing Finance Ltd
● Former Chairman, NHB 27
28
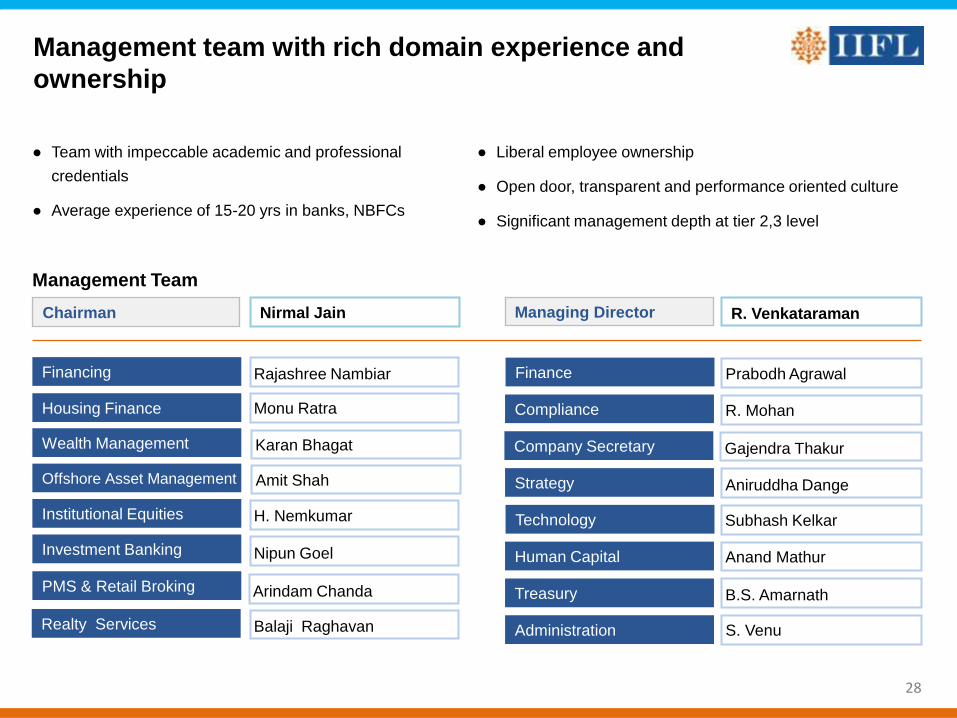
Management Team
● Team with impeccable academic and professional
credentials
● Average experience of 15-20 yrs in banks, NBFCs
● Liberal employee ownership
● Open door, transparent and performance oriented culture
● Significant management depth at tier 2,3 level
Chairman Nirmal Jain Managing Director R. Venkataraman
Institutional Equities
Wealth Management
Offshore Asset Management
Investment Banking
Financing
Karan Bhagat
Amit Shah
Nipun Goel
Rajashree Nambiar
Housing Finance Monu Ratra
PMS & Retail Broking Arindam Chanda
H. Nemkumar
Realty Services Balaji Raghavan
Compliance
Finance
Company Secretary
Prabodh Agrawal
Technology
Administration
Strategy
Human Capital
Treasury
Subhash Kelkar
S. Venu
Aniruddha Dange
Anand Mathur
B.S. Amarnath
R. Mohan
Gajendra Thakur
Management team with rich domain experience and
ownership
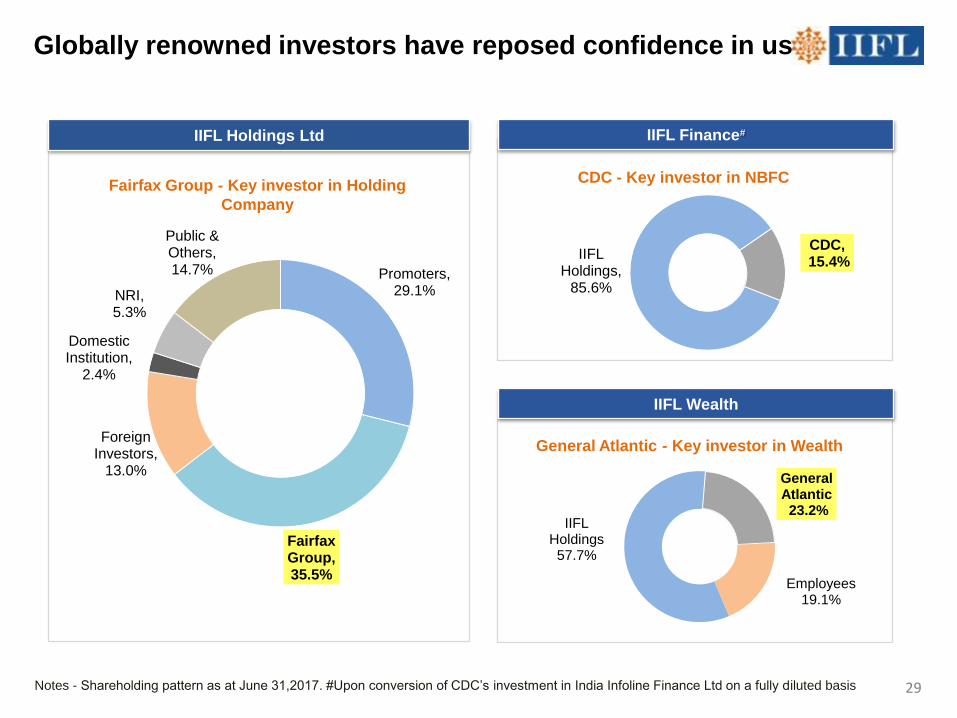
Promoters, 29.1%
Fairfax Group, 35.5%
Foreign Investors,
13.0%
Domestic Institution,
2.4%
NRI, 5.3%
Public & Others, 14.7%
IIFL Holdings,
85.6%
CDC,15.4%
IIFL Holdings57.7%
General Atlantic23.2%
Employees19.1%
Globally renowned investors have reposed confidence in us
Notes - Shareholding pattern as at June 31,2017. #Upon conversion of CDC’s investment in India Infoline Finance Ltd on a fully diluted basis
IIFL Holdings Ltd
Fairfax Group - Key investor in Holding
Company
IIFL Finance#
CDC - Key investor in NBFC
IIFL Wealth
General Atlantic - Key investor in Wealth
29
30
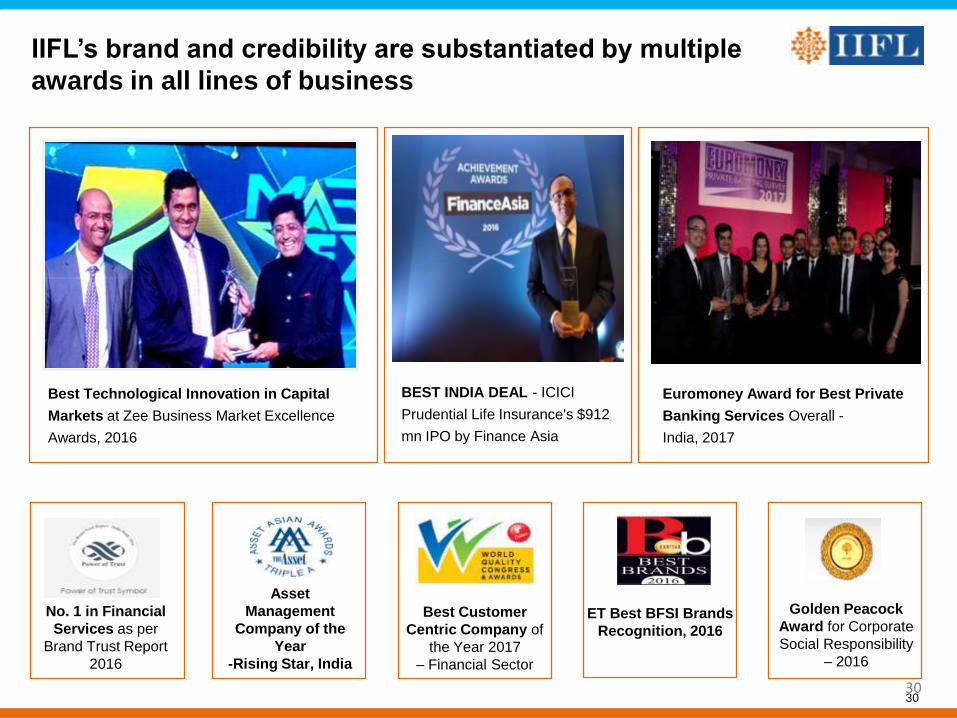
IIFL‟s brand and credibility are substantiated by multiple
awards in all lines of business
30
Golden Peacock
Award for Corporate
Social Responsibility
– 2016
Best Technological Innovation in Capital
Markets at Zee Business Market Excellence
Awards, 2016
Euromoney Award for Best Private
Banking Services Overall -
India, 2017
BEST INDIA DEAL - ICICI
Prudential Life Insurance's $912
mn IPO by Finance Asia
ET Best BFSI Brands
Recognition, 2016
No. 1 in Financial
Services as per
Brand Trust Report
2016
Asset
Management
Company of the
Year
-Rising Star, India
Best Customer
Centric Company of
the Year 2017
– Financial Sector
I: IIFL Group Performance Overview
III: Corporate Social Responsibility
(i) Non-banking and Housing Finance
(ii) Wealth and Asset Management
(iii) Capital Markets
II: Ownership, Management and Governance
31
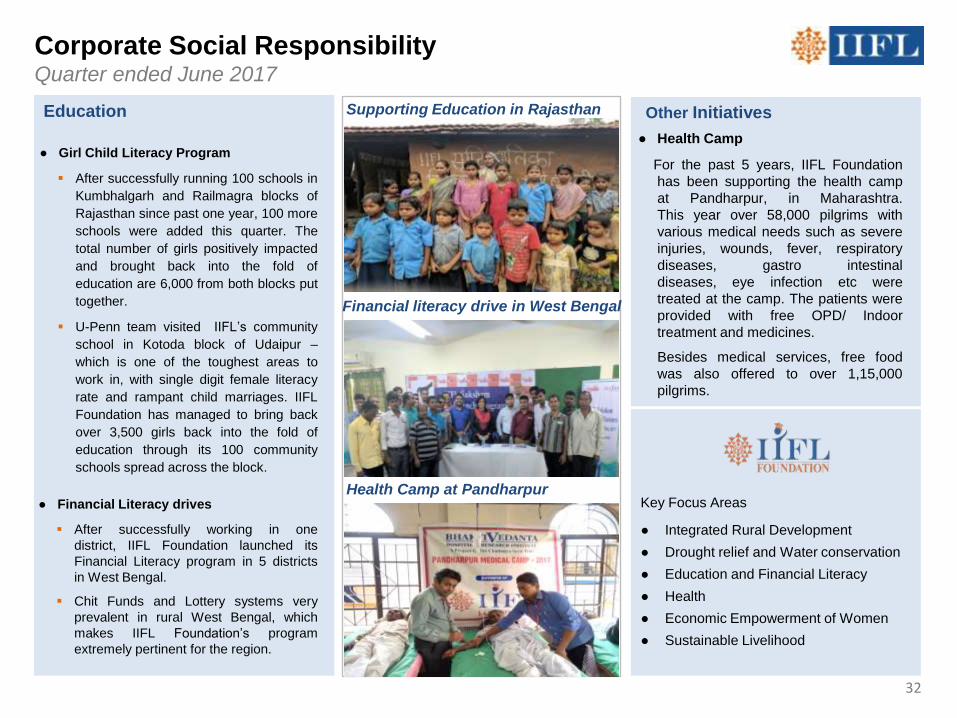
Corporate Social ResponsibilityQuarter ended June 2017
Key Focus Areas
● Integrated Rural Development
● Drought relief and Water conservation
● Education and Financial Literacy
● Health
● Economic Empowerment of Women
● Sustainable Livelihood
Education
● Health Camp
For the past 5 years, IIFL Foundation
has been supporting the health camp
at Pandharpur, in Maharashtra.
This year over 58,000 pilgrims with
various medical needs such as severe
injuries, wounds, fever, respiratory
diseases, gastro intestinal
diseases, eye infection etc were
treated at the camp. The patients were
provided with free OPD/ Indoor
treatment and medicines.
Besides medical services, free food
was also offered to over 1,15,000
pilgrims.
● Girl Child Literacy Program
After successfully running 100 schools in
Kumbhalgarh and Railmagra blocks of
Rajasthan since past one year, 100 more
schools were added this quarter. The
total number of girls positively impacted
and brought back into the fold of
education are 6,000 from both blocks put
together.
U-Penn team visited IIFL’s community
school in Kotoda block of Udaipur –
which is one of the toughest areas to
work in, with single digit female literacy
rate and rampant child marriages. IIFL
Foundation has managed to bring back
over 3,500 girls back into the fold of
education through its 100 community
schools spread across the block.
● Financial Literacy drives
After successfully working in one
district, IIFL Foundation launched its
Financial Literacy program in 5 districts
in West Bengal.
Chit Funds and Lottery systems very
prevalent in rural West Bengal, which
makes IIFL Foundation’s program
extremely pertinent for the region.
Other InitiativesSupporting Education in Rajasthan
Financial literacy drive in West Bengal
Health Camp at Pandharpur
32
Thank you
Published in July 2017 © IIFL Holdings Ltd 2017-18.
IIFL Holdings Ltd. All rights reserved. Regd. Off: IIFL House, Sun Infotech Park, Road No. 16V, Plot No.B-23, Thane Industrial Area, Wagle
Estate, Thane – 400604.
Tel.: +(91 22)4007 7000 Fax: 2685 0451.
This report is for information purposes only and does not construe to be any investment, legal or taxation advice. It is not intended as an offer or
solicitation for the purchase and sale of any financial instrument. Any action taken by you on the basis of the information contained herein is your
responsibility alone and IIFL Holdings Ltd (hereinafter referred as IHL) and its subsidiaries or its employees or directors, associates will not be liable in
any manner for the consequences of such action taken by you. We have exercised due diligence in checking the correctness and authenticity of the
information contained herein, but do not represent that it is accurate or complete. IHL or any of its subsidiaries or associates or employees shall not be
in any way responsible for any loss or damage that may arise to any person from any inadvertent error in the information contained in this publication.
The recipients of this report should rely on their own investigations. IHL and/or its subsidiaries and/or directors, employees or associates may have
interests or positions, financial or otherwise in the securities mentioned in this report.
Top Related