


Languages
Pages
Legal

GRE®
R E S E A R C H R E P O R T
Identifying the Writing Tasks Important for Academic
Success at the Undergraduate and Graduate Levels
Michael Rosenfeld Rosalea Courtney
Mary Fowles
November 2004
GRE Board Report No. 00-04 R ETS RR-04-42
Identifying the Writing Tasks Important for Academic Success at the
Undergraduate and Graduate Levels
Michael Rosenfeld, Rosalea Courtney, and Mary Fowles
ETS, Princeton, NJ
GRE Board Research Report No. 00-04 R
November 2004
The report presents the findings of a research project funded by and carried
out under the auspices of the Graduate Record Examinations Board.
Educational Testing Service, Princeton, NJ 08541
*********************
Researchers are encouraged to express freely their professional judgment. Therefore, points of view or opinions stated in Graduate
Record Examinations Board reports do no necessarily represent official Graduate Record Examinations Board position or policy.
*********************
The Graduate Record Examinations and Educational Testing Service are dedicated to the principle of equal opportunity, and their programs,
services, and employment policies are guided by that principle.
EDUCATIONAL TESTING SERVICE, ETS, the ETS logos, GRADUATE RECORD EXAMINATIONS, and GRE are
registered trademarks of Educational Testing Service. SAT is a registered trademark of the College
Board Entrance Examination Board.
Educational Testing Service Princeton, NJ 08541
Copyright © 2004 by Educational Testing Service. All rights reserved.

Abstract
The authors conducted a large-scale survey to confirm that the writing skills being assessed in
the GRE® General Test can be linked to writing tasks that were judged to be important by
graduate faculty from a variety of subject areas and across a wide range of institutions at both the
graduate and undergraduate levels. The results obtained in this study provide an additional
source of validity evidence for using the GRE Analytical Writing Assessment when making
admission decisions for graduate school and are also useful in evaluating its relevance for use as
an outcomes measure for upper-division undergraduates.
Key words: Validity, job analysis, analytical writing, graduate writing tasks
i
Table of Contents
Page
Introduction..................................................................................................................................... 1
Purposes of the Study ....................................................................................................... 3
Research Questions .......................................................................................................... 3
Method ............................................................................................................................................ 4
Overview of Methodology ............................................................................................... 4
The Steering Committee................................................................................................... 5
Defining the Domain of Task Statements ........................................................................ 5
Selecting Schools and Faculty to Participate in the Survey ............................................. 8
Producing and Administering the Survey Instrument ...................................................... 9
Confirming the Link Between GRE Writing Skills and Writing Task Statements ........ 10
Analyzing Data............................................................................................................... 11
Results........................................................................................................................................... 11
Response Rate ................................................................................................................ 11
Respondent Demographics............................................................................................. 12
Master’s Level ................................................................................................................ 14
Doctoral Level ................................................................................................................ 17
Comparing Faculty Ratings of Importance at the Master’s and Doctoral Levels .......... 21
Upper-Division Undergraduate Level ............................................................................ 31
Discussion..................................................................................................................................... 43
The Master’s and Doctoral Levels ................................................................................. 43
The Task Domain ........................................................................................................... 43
Linking Study ................................................................................................................. 44
Summary......................................................................................................................... 45
Upper-Division Undergraduates..................................................................................... 46
The Task Domain ........................................................................................................... 46
The Linking Study.......................................................................................................... 47
Summary......................................................................................................................... 47
Summary and Conclusions ........................................................................................................... 47
Summary......................................................................................................................... 47
iii

Conclusions .................................................................................................................... 49
References..................................................................................................................................... 52
List of Appendixes........................................................................................................................ 54
iv
List of Tables
Page
Table 1. Master’s-Level Tasks With Highest Overall Ratings ................................................. 14
Table 2. Master’s-Level Tasks With Overall Ratings Below 3.0 ............................................. 15
Table 3. Intercorrelation of Master’s-Level Importance Ratings for Six Subject Areas .......... 17
Table 4. Doctoral-Level Tasks With Highest Overall Average Ratings................................... 18
Table 5. Doctoral-Level Tasks With Overall Ratings Below 3.0 ............................................. 19
Table 6. Intercorrelation of Doctoral-Level Importance Ratings for Six Subject Areas .......... 21
Table 7. Core Tasks Important at Both the Master’s and Doctoral Levels............................... 23
Table 8. Master’s- and Doctoral-Level Linkage of Scoring Rubric Components to Important
Task Statements .......................................................................................................... 26
Table 9. Upper-Division Undergraduate Tasks With Highest Overall Average Ratings ......... 31
Table 10. Upper-Division Undergraduate Tasks With Overall Ratings Below 3.0.................... 32
Table 11. Intercorrelation of Upper-Division Undergraduate-Level Importance Ratings for Six
Subject Areas .............................................................................................................. 34
Table 12. Core Tasks Important at the Upper-Division Undergraduate Level........................... 35
Table 13. Upper-Division Undergraduate Linkages of Scoring Rubric Components to Important
Task Statements .......................................................................................................... 38
v
Introduction
The GRE® Analytical Writing Assessment, introduced as a stand-alone measure in
October 1999, was developed in response to the graduate community’s interest in a performance-
based assessment of critical reasoning and analytical writing. In October 2002, the analytical
writing section became part of the GRE General Test and was administered to all GRE
examinees. The GRE writing section assesses a test taker’s ability to articulate and support
complex ideas, analyze an argument, and sustain a focused and coherent discussion. It consists of
two separately timed analytical writing tasks: Present Your Perspective on an Issue (hereafter
referred to as the Issue task) and Analyze an Argument (hereafter referred to as the Argument
task). Examinees demonstrate their analytical writing skills or abilities by responding to both
tasks. Their responses are evaluated according to criteria published in the GRE scoring guides.
The developmental process for this examination included a number of steps: feedback
from focus groups of faculty members representing a range of academic departments, extensive
participation and guidance from a Writing Advisory Committee, guidance from the GRE
Technical Advisory Committee, as well as a number of formal research studies (e.g., Powers,
Burstein, Chodorow, Fowles, & Kukich, 2000; Powers & Fowles, 1997, 2000; Powers, Fowles,
& Welsh, 1999; Schaeffer, Briel, & Fowles, 2001). These and other studies provided essential
information about such topics as the comparative difficulty of the two types of tasks (Issue and
Argument) used in the analytical writing section, scoring calibration among scorers and between
scorers and faculty, and the impact that the inclusion of GRE writing scores might have on
admission decisions. (See the GRE.org Web site for a complete list of GRE writing research
reports.)
The study reported here should be viewed as part of the ongoing effort by the GRE
Program to accumulate validity information on this new measure. Validation is a continuous
process that involves accumulating evidence to provide support for the proposed score
interpretations. The Standards for Educational and Psychological Testing (American
Educational Research Association, American Psychological Association, & National Council on
Measurement in Education, 1999), hereafter referred to as the Standards, describes five major
sources of evidence that can be used to evaluate the appropriateness of a particular test score
interpretation. One of these sources, evidence based on test content, is the main focus of the
study described in this report.
1
According to the Standards, “evidence based on test content can include logical or
empirical analyses of the adequacy with which the test content represents the content domain and
the relevance of the content domain to the proposed interpretation of test scores. Evidence based
on test content can also come from expert judgment of the relationship between parts of the test
and the construct” (p. 11). Messick (1998) indicates that considerations of content relevance and
representativeness clearly do and should influence the nature of score inferences. Messick also
indicates that a key issue of the content aspect of construct validity is the specification of the
boundaries of the construct domain to be assessed. According to Messick, these boundaries can
be addressed by means of job analysis.
To facilitate a common understanding of the terminology used in this study and the
interpretation of its results, the following terms are described below: task, ability, and skill.
According to Gael (1983), “a task is an assigned piece or amount of work to be done, generally
under a time limit” (p. 8). Webster’s Third New International Dictionary of the English
Language (2002) has a similar definition. It defines task as a specific piece or amount of work.
Webster’s (2002) defines ability as “the physical or mental power to perform, competence in
doing” and skill as “a learned power of doing something competently.” Throughout this report, a
task will refer to an assignment to be performed. Two different levels of tasks are mentioned.
One refers to the broad Argument and Issue tasks presented in the analytic writing section of the
GRE General Test. The second refers to the more specific writing tasks that may be necessary to
accomplish the broader writing tasks (e.g., develop a well-focused, well-supported discussion,
using relevant reasons and examples). The terms skill and ability will be used interchangeably to
refer to a test taker’s capacity to perform a task.
This study used a series of steps involving the judgments of experts to define a domain of
writing tasks thought to be important for competent academic performance across a range of
subject areas. A large-scale job analysis survey was designed to provide supplemental evidence
about the relevance and job-relatedness of the writing skills assessed in the analytical writing
section of the General Test. Graduate faculty members from a variety of subject areas and across
a wide range of institutions provided data about the importance of these writing tasks for
competent performance in their courses. Those tasks verified as being important can be used as a
job-related framework for evaluating the writing skills assessed in the GRE assessment. In
addition, because the GRE Program has recently received requests from several institutions
2
regarding the possibility of using the analytical writing section as an outcomes measure for
upper-division undergraduate students, this study also gathered data evaluating the importance of
these tasks for upper-division undergraduates.
This study can be considered a job analysis of the writing tasks important for competent
performance in the coursework required for upper-division college students and for entry-level
graduate students at both the master’s and doctoral levels. Standard 14.8 of the Standards (1999)
states, “Evidence based on test content requires a thorough and explicit definition of the content
domain of interest. For selection, classification, and promotion, the characterization of the
domain should be based on job analysis” (p. 160). Standard 14.9 states, “When evidence of
validity based on test content is a primary source of validity evidence in support of the use of a
test in selection or promotion, a close link between test content and job content should be
demonstrated” (p. 160). This study was conducted to provide evidence to support these
standards.
Purposes of the Study
One purpose of this study was to gather data to verify that the skills currently measured in
the GRE Analytical Writing Assessment are relevant for entry-level graduate students at both the
master’s and doctoral levels. The study was designed to augment the validity evidence available
to support the use of the analytical writing section for admission into graduate school by
documenting the content relevance and importance of the writing skills being assessed in that
section of the examination.
A second purpose was to gather data that can be used to assess whether or not the
analytical writing section is appropriate for use as an outcomes measure for upper-division
undergraduate students in colleges and universities across the country.
Research Questions
This study was designed to answer the following six major research questions.
1. For entry-level graduate students, what writing task statements are judged to be important
for competent academic performance within each of six fields of study (selected to reflect
a range of disciplines)?
3
2. Also for entry-level graduate students, what is the overlap in writing task statements
judged to be important for competent academic performance across the six fields of
study?
3. For upper-division college students, what writing task statements are judged to be
important for competent academic performance within each of the six fields of study?
4. Also for upper-division college students, what writing task statements are judged to be
important for competent academic performance across the six fields of study?
5. For both undergraduate- and graduate-level students, what is the overlap in writing task
statements judged to be important for competent academic performance?
6. Can the writing skills assessed in the analytical writing section of the GRE General Test
be linked to writing tasks judged to be important for competent performance at the upper-
division undergraduate, master’s, and doctoral levels?
Method
Overview of Methodology
The process described below involved several different groups of experts in ways that
reflect their expertise and experience. A steering committee consisting of two representatives
from the ETS Research Division with expertise in research on writing, as well as two
representatives from the GRE Program, provided overall advice on each of the major steps in the
project. This guidance helped to ensure that the procedures employed were professionally sound
and would provide data useful to the GRE Program. Test Development staff with expertise in
teaching and assessing writing assisted in developing the initial list of writing task statements.
Because the planned survey was to be administered to faculty members from a range of subject
areas, the intent was to write these statements in language that would be clear and understandable
to nonwriting specialists. Faculty members across a range of subjects who taught both
undergraduate and graduate courses reviewed and critiqued drafts of the writing statements. In
addition, a five-person advisory committee composed of experts in writing across the curriculum
assisted project staff in describing the writing tasks important for competent academic
performance. The names, titles, and institutional affiliations of committee members appear in
Appendix A. The final task statements were placed in a scannable survey format, along with
4
importance rating scales, and administered to 1,512 faculty members at 33 colleges and
universities in six fields of study at the undergraduate and graduate levels. Data analyses were
conducted to identify tasks that faculty judged to be important at the undergraduate and graduate
levels. These data provide support for using the analytic writing section in graduate school
admissions and assist in evaluating the appropriateness of this examination for use as an
outcomes measure for upper-division college students.
The Steering Committee
An ETS steering committee was established consisting of four members: two researchers
experienced in conducting studies on writing and two senior GRE Program directors responsible
for the writing assessment. The names and titles of the steering committee members are provided
in Appendix B. Their role was to ensure that the research and development needs of the GRE
program were reflected in each major step of this project and that the procedures used were
professionally sound. Members of the steering committee reviewed the initial plan, provided
feedback on the content and design of the survey instrument, and offered recommendations
regarding the characteristics of schools to be included in the sample and the subject areas to be
sampled.
Defining the Domain of Task Statements
Several steps were taken to define the writing tasks thought to be important for competent
academic performance of upper-division college students and entry-level master’s and doctoral
students. Each of these is described below.
First draft of task statements. The first draft of writing task statements was developed
based on a review of relevant literature associated with the writing across the curriculum
movement, and other relevant sources. Task statements from previous needs analysis studies
(Bridgeman & Carlson, 1983; Hale et al., 1996; Rosenfeld, Wilson, & Oltman, 2001) were
reviewed and considered for possible inclusion in the initial draft. An additional review of the
writing across the curriculum literature revealed several studies with writing task statements
(Epstein, 1999; Kovacs, 1999; Rice, 1998; Wallner & Latosi-Wawin, 1999). ETS Test
Development staff experienced in teaching and assessing writing played a major role in drafting
the initial list of task statements. One focus was to ensure that the task statements were
descriptive of the writing tasks and scoring framework being used in the analytic writing section.
5
This was done so that those particular tasks and skills could be evaluated by large numbers of
undergraduate and graduate faculty members. The review of the literature was intended to
identify important writing tasks that could be added to the list and considered for possible use in
later versions of the analytic writing section. Fifty task statements were developed that were
consistent with the analytical writing section or reflective of the literature associated with writing
across the curriculum initiatives and that appear to be important for competent academic
performance across a range of subjects.
Since these statements were to be sent to faculty members across a range of subject -
matter areas, they needed to be expressed in language that was as clear and straightforward as
possible. Thus it seemed important to involve many different groups of faculty in the review
process. The first group came from the 2002 summer ETS Visiting Minority Faculty program. A
total of 12 faculty members from 10 institutions across the country completed the draft survey in
July 2002. Of that group, 7 participated in a group discussion explaining their impressions of the
task statements. Based on input from these reviewers, as well as suggestions from members of
the steering committee, a second draft of writing task statements was prepared.
Faculty review of second draft. Faculty members from 12 colleges and universities
participated in a review of the second draft of the writing task statements. Six general academic
areas representing a wide range of specific disciplines were selected for inclusion in this study:
the natural sciences, physical sciences, engineering, social science, English, and education.
These six areas were selected because they reflect a wide range of disciplines, include the fields
with the highest number of earned doctorates in 2000 (“Earned doctorates,” 2001), are the
subject areas most represented by GRE test takers, and have been used in previous studies of the
writing measure (Powers, Fowles, & Welsh, 1999; Schaeffer, Briel, & Fowles, 2001 ).
Participants were selected from a geographically diverse range of colleges and universities in the
United States that use the GRE. Other factors such as school size, whether the school was public
or private, and whether the school was a master’s or a research institution were also considered.
Faculty from one Historically Black College and University (HBCU) and three Hispanic-Serving
Institutions (HSI) participated in this review phase.
In initial phone conversations with writing center directors, it became evident that the
most efficient way to facilitate a nationwide faculty review would be for ETS project staff to
send invitations to faculty identified by the writing center director via e-mail. Writing center
6
directors in 12 institutions provided lists of faculty members across six academic areas. As a
result, more than 50 college instructors were invited to review the writing task statements,
transmitted via e-mail. They were asked:
• Are the tasks listed clear and understandable?
• Do they cover the scope of writing tasks you think are important for competent academic
performance in your subject area?
• What other important tasks are missing?
Twenty-three of the 50 faculty reviewers (46%) completed their review of the writing
statements. Their comments were reflected in the subsequent list of task statements.
External advisory committee review. Five faculty members experienced and
knowledgeable in writing across the curriculum were selected to participate on the advisory
committee. The committee had representation by gender, ethnicity, and geographic region. Their
review was provided in two parts: First they reviewed the second draft of the writing task
statements at the same time it was being reviewed by faculty from the 12 institutions. Based on
input from the advisory committee and the cross-site faculty reviews, a third draft of the task
statements was produced. The advisory committee then had an additional opportunity to review
this new list of statements. Additional input by committee members, provided through individual
telephone interviews, focused on the completeness of the list, the clarity of the statements, and
their perceived relevance across a range of subject areas. The committee also reviewed and
commented on the importance rating scale and the biographical information questions that were
to be used to describe respondents to the survey instrument.
GRE Research Committee review. The GRE Research Committee also reviewed the task
statements, project plans, and procedures. This committee believed that all of the task statements
appeared to be important and recommended that several task statements be added that would be
likely to obtain lower ratings as a way of verifying the accuracy of the ratings. As a result,
project staff, with the assistance of test development staff, developed three task statements that
were thought to be highly appropriate for English classes but much less so for those in the social
and physical sciences.
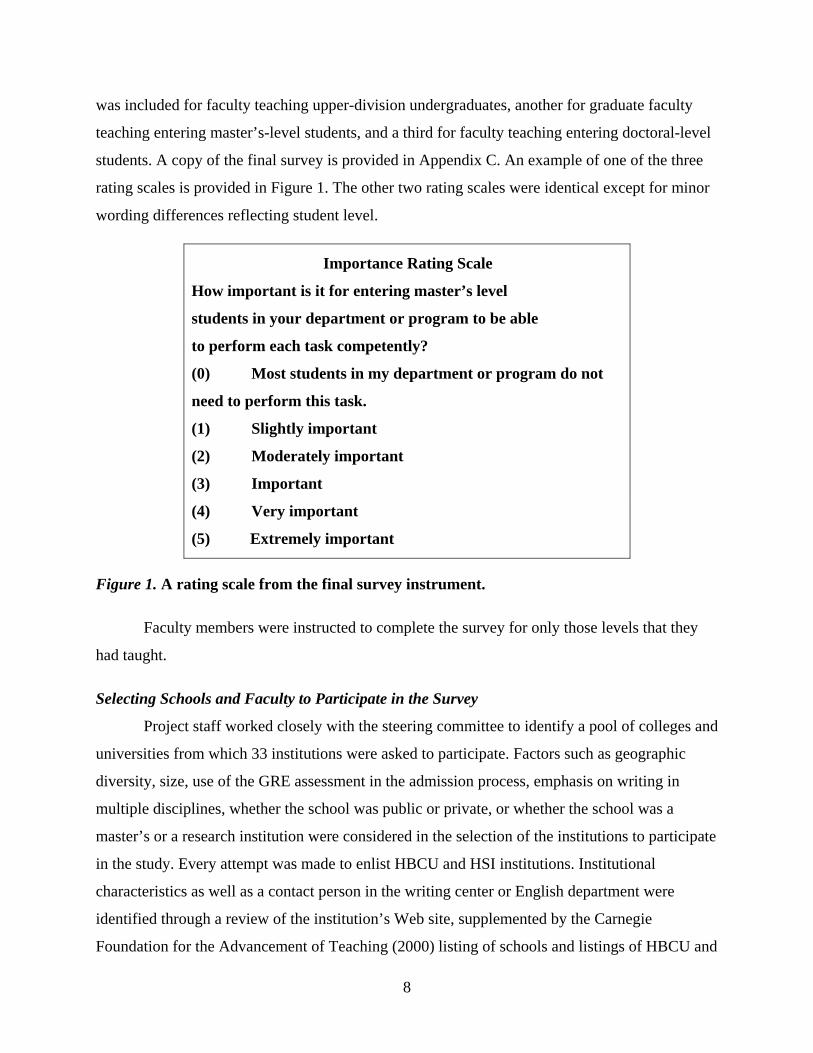
The final survey instrument. The final survey instrument contained 39 task statements,
three rating scales, and a background information section. A separate importance rating scale
7
8
was included for faculty teaching upper-division undergraduates, another for graduate faculty
teaching entering master’s-level students, and a third for faculty teaching entering doctoral-level
students. A copy of the final survey is provided in Appendix C. An example of one of the three
rating scales is provided in Figure 1. The other two rating scales were identical except for minor
wording differences reflecting student level.
Importance Rating Scale
How important is it for entering master’s level
students in your department or program to be able
to perform each task competently?
(0) Most students in my department or program do not
need to perform this task.
(1) Slightly important
(2) Moderately important
(3) Important
(4) Very important
(5) Extremely important
Figure 1. A rating scale from the final survey instrument.
Faculty members were instructed to complete the survey for only those levels that they
had taught.
Selecting Schools and Faculty to Participate in the Survey
Project staff worked closely with the steering committee to identify a pool of colleges and
universities from which 33 institutions were asked to participate. Factors such as geographic
diversity, size, use of the GRE assessment in the admission process, emphasis on writing in
multiple disciplines, whether the school was public or private, or whether the school was a
master’s or a research institution were considered in the selection of the institutions to participate
in the study. Every attempt was made to enlist HBCU and HSI institutions. Institutional
characteristics as well as a contact person in the writing center or English department were
identified through a review of the institution’s Web site, supplemented by the Carnegie
Foundation for the Advancement of Teaching (2000) listing of schools and listings of HBCU and
HSI institutions. Each contact received an e-mail letter explaining the purpose of the study and
the involvement required of the participating schools. This letter was followed by a telephone
call from a member of the ETS project staff to answer any questions and to ask if their institution
would be willing to participate in this study. If the school was interested in participating, the
initial contact person usually recommended a coordinator. In most cases, the coordinator was
either a faculty member or a graduate student associated with the writing center. The process of
recruiting the 33 schools was ongoing for several months.
The coordinators at institutions with both master’s and doctoral programs were asked to
identify 48 faculty members, 8 in each of the six areas, for participation in the study. The six
areas agreed upon by the steering committee were English, education, psychology, natural
sciences (biology), physical sciences, and engineering. Coordinators were asked to identify 4
faculty members who were currently teaching upper-division undergraduate courses and 4 who
were teaching beginning graduate courses at the master’s and doctoral levels from the
departments selected in each of the six areas. Coordinators from the 3 four-year institutions were
asked to distribute surveys to 24 faculty members (4 from each of the six subject areas). Separate
rating scales on the survey allowed for independent ratings of the tasks for the undergraduate and
graduate levels as appropriate. Procedures for selecting faculty were arranged with each
coordinator in order to identify the steps that would be most efficient for their institution.
Overall, surveys were sent to 1,512 faculty members (792 undergraduate and 720 graduate).
Coordinators distributed surveys to the faculty, followed up to ensure completion of the surveys,
and returned the completed surveys. A stipend of $500 was provided to each of the coordinators
who distributed surveys to undergraduate and graduate faculty, and a stipend of $300 was
provided to the three coordinators at the four-year institutions. These procedures were similar to
those used in other studies, which yielded return rates ranging from 50% to 82% (Bridgeman &
Carlson, 1983; Enright & Powers, 1986; Hale et al., 1996; Rosenfeld et al., 2001).
Producing and Administering the Survey Instrument
The final survey instrument was formatted as a scannable booklet and was printed and
mailed to each coordinator by National Computer Systems (NCS). Packets containing a sample
survey along with detailed directions were sent from ETS under separate cover to the
coordinators at each college and university participating in this phase of the study. The
coordinators distributed the survey along with a cover letter explaining the purpose of the project
9
to faculty members selected to participate in the study. Surveys were to be completed and
returned to the coordinator. Coordinators were also responsible for tracking returns, following up
with nonrespondents, and sending the completed surveys back to NCS for processing.
Confirming the Link Between GRE Writing Skills and Writing Task Statements
The GRE scoring guides used for the analytical writing tasks (Issue and Argument) have
six levels (ETS, 2003). Each level describes the skills that are typically demonstrated in essays at
each score level. For the purposes of this project, the two scoring guides were merged into a
single document consisting of nine skills. Overlapping skills appeared only once, whereas
distinctly different skills remained as separate entries. Because expertise in the evaluation of
writing and use of the scoring rubrics were both very important, the writing experts were ETS
assessment specialists. Five ETS writing assessment specialists with considerable experience
working on a variety of non-GRE programs participated in the linking process. The five writing
specialists met as a group and were first given an overview of the purposes of the project and a
description of how the task statements were developed and administered. They were then given
an opportunity to review sample GRE writing prompts, the scoring rubric, and the 39 task
statements. They were given a rating form and asked to rate how important each of the nine skills
(comprising the scoring rubrics for the Issue and Argument tasks) were for competent
performance of each of the 39 task statements. A six-point importance rating scale was used
ranging from 0 (of no importance) to 5 (extremely important).
The five writing assessment specialists independently rated the first seven task statements
and then discussed their interpretation of the scoring rubrics. They were told to interpret the
rubrics broadly and not limit their judgments of the tasks and writing skills reflected in the
scoring rubrics to only an Issue or Argument context. The wording of the scoring rubrics was
modified slightly to reflect this more generalized evaluation. The five assessment specialists then
independently rated the remaining task statements. Appendix D contains the 39 task statements,
the skills reflected in the scoring rubric, the importance rating scale, and the mean importance
ratings describing how important each skill was judged to be for performing each of the 39
writing tasks. A mean rating of 4.0 (very important) was used as the standard for establishing a
link between a skill and a task statement.
10
Analyzing Data
The analyses described below were designed to identify the writing task statements that
were judged by faculty to be important for competent academic performance within and across
subject areas at the undergraduate and graduate levels. Separate analyses were conducted at each
of three levels (undergraduate, master’s, and doctoral) for each of the six subject areas included
in the study.
Means and standard deviations. Means and standard deviations were computed for each
task statement at each of the three educational levels. The mean rating obtained from faculty
members provided an indication of the importance of each task for competent academic
performance. Project staff used an overall mean rating of 3.50 (across the six subject areas) at
each of three educational levels (rounds to a rating of very important) as the cut-point to
distinguish more important tasks from less important ones. In addition, a mean rating of 3.0
(important) was used as the cut-point for the within-level comparisons by subject area. Task
statements with overall mean ratings equal to or greater than 3.50 and subject area ratings of at
least 3.0 were classified as important, while tasks receiving ratings below those levels were
classified as less important. We recognize that all judgmental standards may be subject to debate;
however, our experience indicates that a value of 3.50 (a mean rating of very important) and a
secondary standard of 3.0 (important) on the importance rating scale described earlier provides a
solid foundation for supporting claims of job relatedness.
Correlation coefficients. Correlation coefficients were computed to evaluate the profile of
task ratings within and across the three levels of education.
Results
Response Rate
Of the 33 schools that agreed to participate, 30 returned surveys for a 91% institution
participation rate. Twenty-seven of the institutions had graduate programs and 3 were four-year
institutions with only undergraduate students. Each of the 27 institutions with graduate programs
distributed 48 surveys (8 across each of the six selected areas) and each of the four-year
institutions distributed 24 surveys (4 across each of the six areas). Overall 1,368 surveys were
distributed across the 30 participating schools. A total of 861 surveys were completed and
returned (a 63% return rate). As noted earlier, studies using similar procedures had return rates
11
ranging from 50% to 82%. The return rate obtained in this study falls within the range obtained
from studies using similar methods to distribute and return survey instruments.
Respondent Demographics
Two sets of demographic information will be provided. One set describes the
participating schools and the other describes the faculty members who completed the survey
instrument.
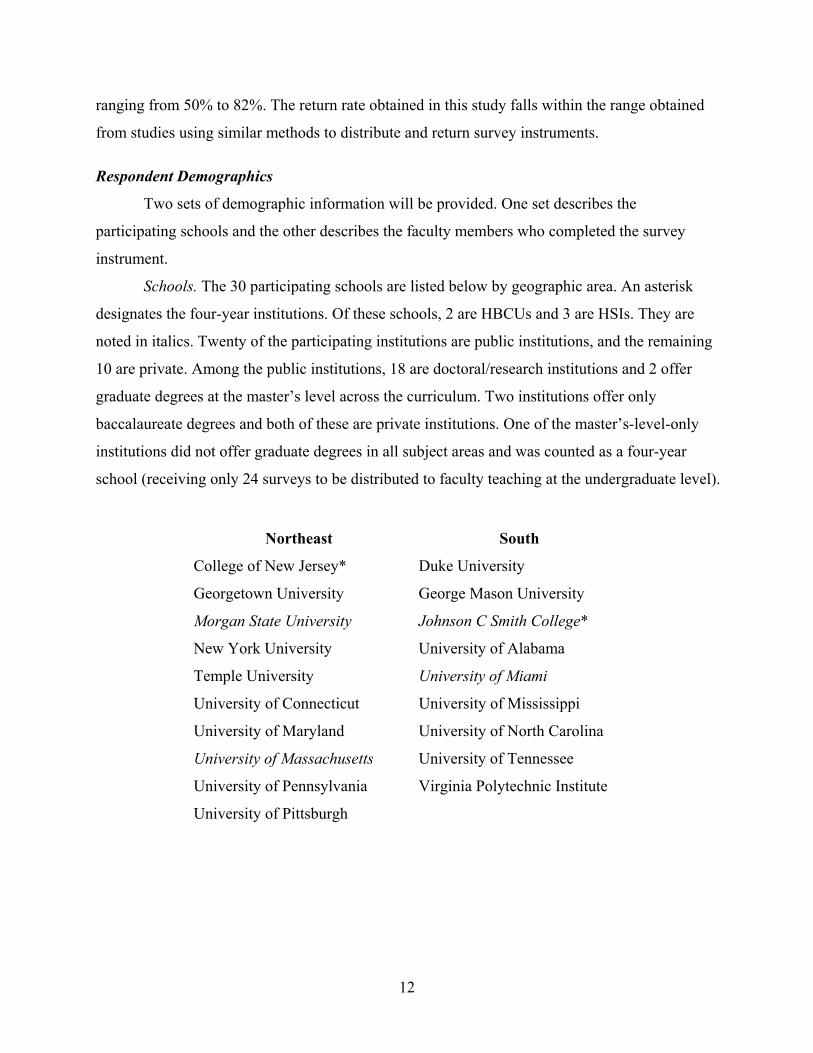
Schools. The 30 participating schools are listed below by geographic area. An asterisk
designates the four-year institutions. Of these schools, 2 are HBCUs and 3 are HSIs. They are
noted in italics. Twenty of the participating institutions are public institutions, and the remaining
10 are private. Among the public institutions, 18 are doctoral/research institutions and 2 offer
graduate degrees at the master’s level across the curriculum. Two institutions offer only
baccalaureate degrees and both of these are private institutions. One of the master’s-level-only
institutions did not offer graduate degrees in all subject areas and was counted as a four-year
school (receiving only 24 surveys to be distributed to faculty teaching at the undergraduate level).
Northeast South
College of New Jersey* Duke University
Georgetown University George Mason University
Morgan State University Johnson C Smith College*
New York University University of Alabama
Temple University University of Miami
University of Connecticut University of Mississippi
University of Maryland University of North Carolina
University of Massachusetts University of Tennessee
University of Pennsylvania Virginia Polytechnic Institute
University of Pittsburgh
12
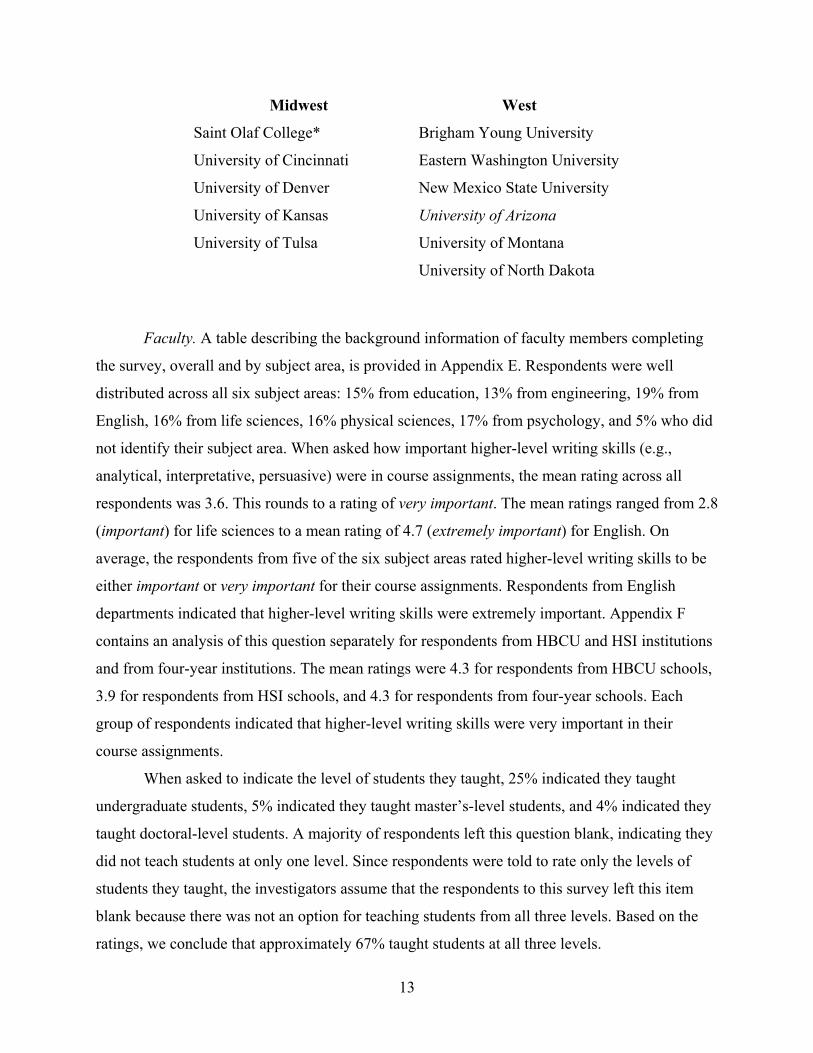
Midwest West
Saint Olaf College* Brigham Young University
University of Cincinnati Eastern Washington University
University of Denver New Mexico State University
University of Kansas University of Arizona
University of Tulsa University of Montana
University of North Dakota
Faculty. A table describing the background information of faculty members completing
the survey, overall and by subject area, is provided in Appendix E. Respondents were well
distributed across all six subject areas: 15% from education, 13% from engineering, 19% from
English, 16% from life sciences, 16% physical sciences, 17% from psychology, and 5% who did
not identify their subject area. When asked how important higher-level writing skills (e.g.,
analytical, interpretative, persuasive) were in course assignments, the mean rating across all
respondents was 3.6. This rounds to a rating of very important. The mean ratings ranged from 2.8
(important) for life sciences to a mean rating of 4.7 (extremely important) for English. On
average, the respondents from five of the six subject areas rated higher-level writing skills to be
either important or very important for their course assignments. Respondents from English
departments indicated that higher-level writing skills were extremely important. Appendix F
contains an analysis of this question separately for respondents from HBCU and HSI institutions
and from four-year institutions. The mean ratings were 4.3 for respondents from HBCU schools,
3.9 for respondents from HSI schools, and 4.3 for respondents from four-year schools. Each
group of respondents indicated that higher-level writing skills were very important in their
course assignments.
When asked to indicate the level of students they taught, 25% indicated they taught
undergraduate students, 5% indicated they taught master’s-level students, and 4% indicated they
taught doctoral-level students. A majority of respondents left this question blank, indicating they
did not teach students at only one level. Since respondents were told to rate only the levels of
students they taught, the investigators assume that the respondents to this survey left this item
blank because there was not an option for teaching students from all three levels. Based on the
ratings, we conclude that approximately 67% taught students at all three levels.
13
Respondents had a range of teaching experience. Approximately 30% had taught 5 years
or less, 19% had taught between 5 and 10 years, and 49% had taught for more than 10 years.
Approximately 10% were adjunct professors, 28% were assistant professors, 31% were full
professors, 57% were male, and 39% were female. The majority of respondents (78%) were
White, 6% were African American, 6% were Asian American or Pacific Islander, 3% were
Hispanic, and 1% were American Indian/Alaskan Native.
Master’s Level
This section of the report describes the survey results obtained from faculty members
who reported teaching master’s-level students. Mean ratings, standard deviations, and standard
errors for master’s-level students, overall and for each of the subject areas, are presented in
Appendix G.
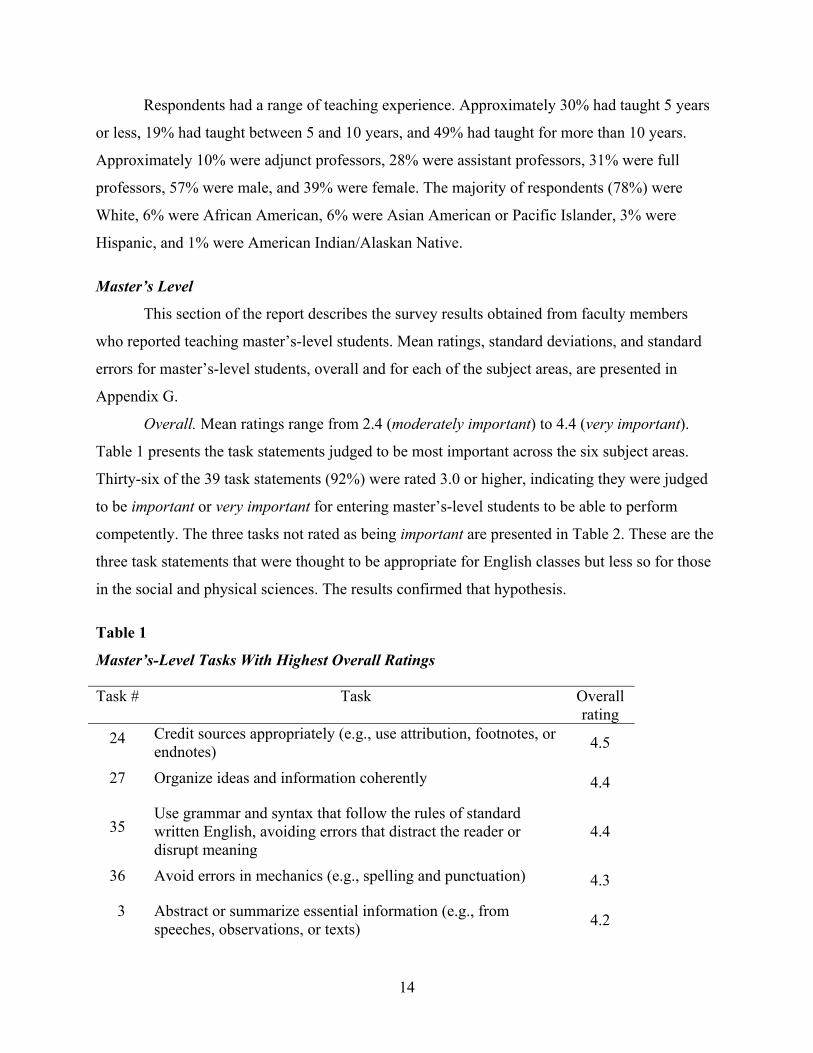
Overall. Mean ratings range from 2.4 (moderately important) to 4.4 (very important).
Table 1 presents the task statements judged to be most important across the six subject areas.
Thirty-six of the 39 task statements (92%) were rated 3.0 or higher, indicating they were judged
to be important or very important for entering master’s-level students to be able to perform
competently. The three tasks not rated as being important are presented in Table 2. These are the
three task statements that were thought to be appropriate for English classes but less so for those
in the social and physical sciences. The results confirmed that hypothesis.
Table 1
Master’s-Level Tasks With Highest Overall Ratings
Task # Task Overall rating
24 Credit sources appropriately (e.g., use attribution, footnotes, or endnotes) 4.5
27 Organize ideas and information coherently 4.4
35 Use grammar and syntax that follow the rules of standard written English, avoiding errors that distract the reader or disrupt meaning
4.4
36 Avoid errors in mechanics (e.g., spelling and punctuation) 4.3
3 Abstract or summarize essential information (e.g., from speeches, observations, or texts) 4.2
14
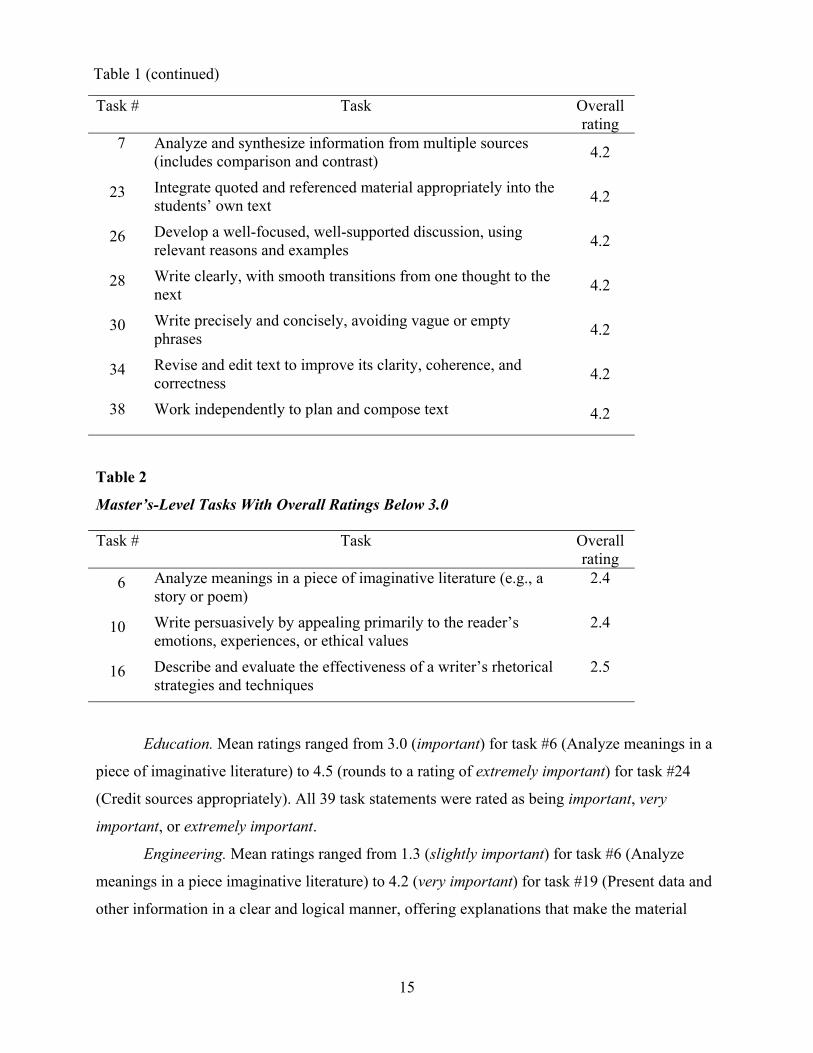
Table 1 (continued)
Task # Task Overall rating
7 Analyze and synthesize information from multiple sources (includes comparison and contrast) 4.2
23 Integrate quoted and referenced material appropriately into the students’ own text 4.2
26 Develop a well-focused, well-supported discussion, using relevant reasons and examples 4.2
28 Write clearly, with smooth transitions from one thought to the next 4.2
30 Write precisely and concisely, avoiding vague or empty phrases 4.2
34 Revise and edit text to improve its clarity, coherence, and correctness 4.2
38 Work independently to plan and compose text 4.2
Table 2
Master’s-Level Tasks With Overall Ratings Below 3.0
Task # Task Overall rating
6 Analyze meanings in a piece of imaginative literature (e.g., a story or poem)
2.4
10 Write persuasively by appealing primarily to the reader’s emotions, experiences, or ethical values
2.4
16 Describe and evaluate the effectiveness of a writer’s rhetorical strategies and techniques
2.5
Education. Mean ratings ranged from 3.0 (important) for task #6 (Analyze meanings in a
piece of imaginative literature) to 4.5 (rounds to a rating of extremely important) for task #24
(Credit sources appropriately). All 39 task statements were rated as being important, very
important, or extremely important.
Engineering. Mean ratings ranged from 1.3 (slightly important) for task #6 (Analyze
meanings in a piece imaginative literature) to 4.2 (very important) for task #19 (Present data and
other information in a clear and logical manner, offering explanations that make the material
15
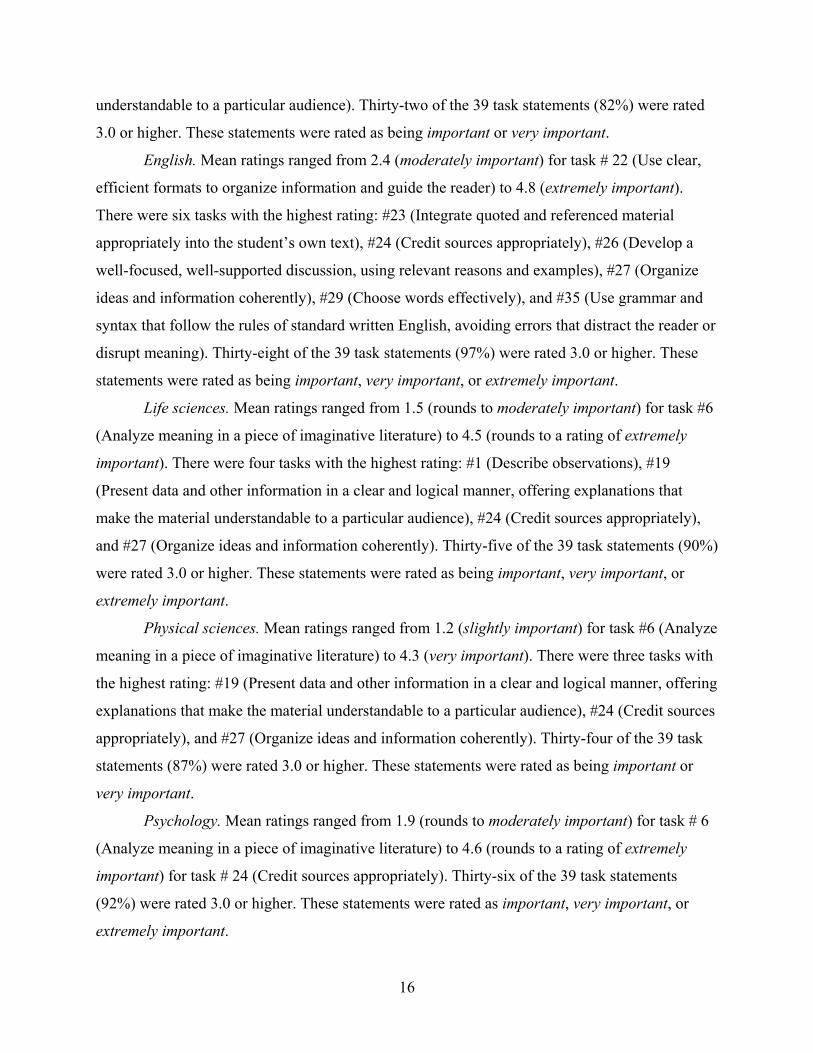
understandable to a particular audience). Thirty-two of the 39 task statements (82%) were rated
3.0 or higher. These statements were rated as being important or very important.
English. Mean ratings ranged from 2.4 (moderately important) for task # 22 (Use clear,
efficient formats to organize information and guide the reader) to 4.8 (extremely important).
There were six tasks with the highest rating: #23 (Integrate quoted and referenced material
appropriately into the student’s own text), #24 (Credit sources appropriately), #26 (Develop a
well-focused, well-supported discussion, using relevant reasons and examples), #27 (Organize
ideas and information coherently), #29 (Choose words effectively), and #35 (Use grammar and
syntax that follow the rules of standard written English, avoiding errors that distract the reader or
disrupt meaning). Thirty-eight of the 39 task statements (97%) were rated 3.0 or higher. These
statements were rated as being important, very important, or extremely important.
Life sciences. Mean ratings ranged from 1.5 (rounds to moderately important) for task #6
(Analyze meaning in a piece of imaginative literature) to 4.5 (rounds to a rating of extremely
important). There were four tasks with the highest rating: #1 (Describe observations), #19
(Present data and other information in a clear and logical manner, offering explanations that
make the material understandable to a particular audience), #24 (Credit sources appropriately),
and #27 (Organize ideas and information coherently). Thirty-five of the 39 task statements (90%)
were rated 3.0 or higher. These statements were rated as being important, very important, or
extremely important.
Physical sciences. Mean ratings ranged from 1.2 (slightly important) for task #6 (Analyze
meaning in a piece of imaginative literature) to 4.3 (very important). There were three tasks with
the highest rating: #19 (Present data and other information in a clear and logical manner, offering
explanations that make the material understandable to a particular audience), #24 (Credit sources
appropriately), and #27 (Organize ideas and information coherently). Thirty-four of the 39 task
statements (87%) were rated 3.0 or higher. These statements were rated as being important or
very important.
Psychology. Mean ratings ranged from 1.9 (rounds to moderately important) for task # 6
(Analyze meaning in a piece of imaginative literature) to 4.6 (rounds to a rating of extremely
important) for task # 24 (Credit sources appropriately). Thirty-six of the 39 task statements
(92%) were rated 3.0 or higher. These statements were rated as important, very important, or
extremely important.
16
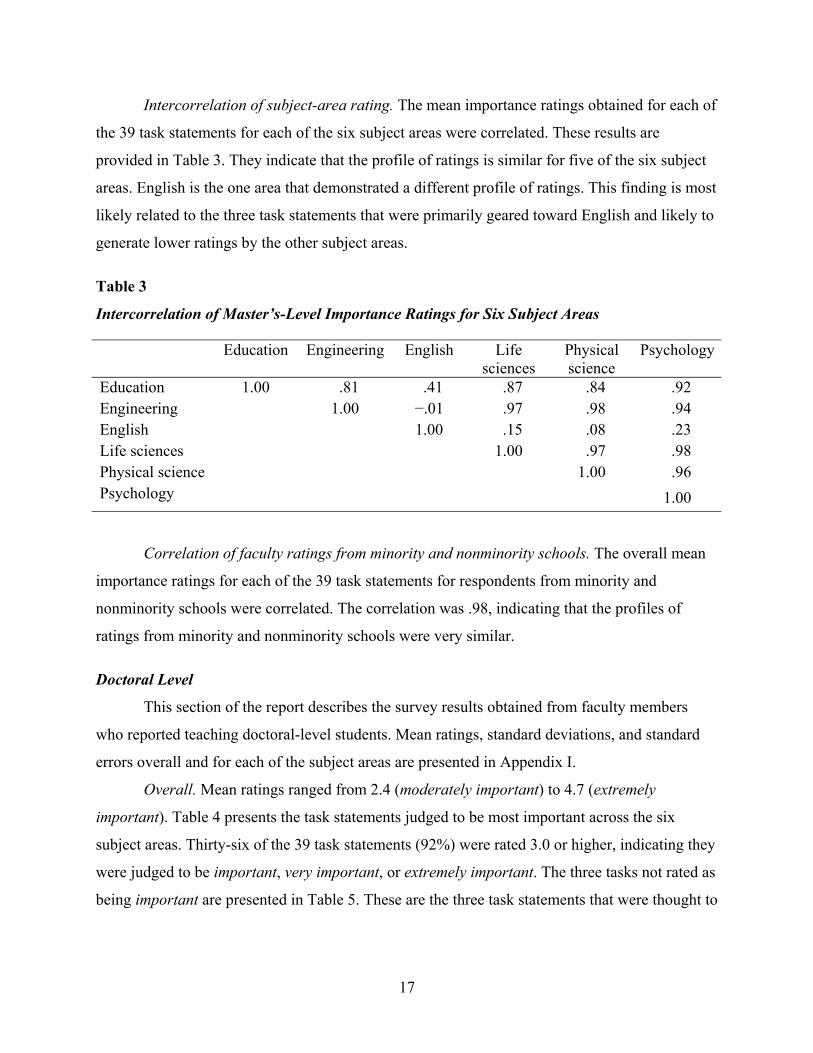
Intercorrelation of subject-area rating. The mean importance ratings obtained for each of
the 39 task statements for each of the six subject areas were correlated. These results are
provided in Table 3. They indicate that the profile of ratings is similar for five of the six subject
areas. English is the one area that demonstrated a different profile of ratings. This finding is most
likely related to the three task statements that were primarily geared toward English and likely to
generate lower ratings by the other subject areas.
Table 3
Intercorrelation of Master’s-Level Importance Ratings for Six Subject Areas
Education Engineering English Life sciences
Physical science
Psychology
Education 1.00 .81 .41 .87 .84 .92 Engineering 1.00 −.01 .97 .98 .94 English 1.00 .15 .08 .23 Life sciences 1.00 .97 .98 Physical science 1.00 .96 Psychology 1.00
Correlation of faculty ratings from minority and nonminority schools. The overall mean
importance ratings for each of the 39 task statements for respondents from minority and
nonminority schools were correlated. The correlation was .98, indicating that the profiles of
ratings from minority and nonminority schools were very similar.
Doctoral Level
This section of the report describes the survey results obtained from faculty members
who reported teaching doctoral-level students. Mean ratings, standard deviations, and standard
errors overall and for each of the subject areas are presented in Appendix I.
Overall. Mean ratings ranged from 2.4 (moderately important) to 4.7 (extremely
important). Table 4 presents the task statements judged to be most important across the six
subject areas. Thirty-six of the 39 task statements (92%) were rated 3.0 or higher, indicating they
were judged to be important, very important, or extremely important. The three tasks not rated as
being important are presented in Table 5. These are the three task statements that were thought to
17
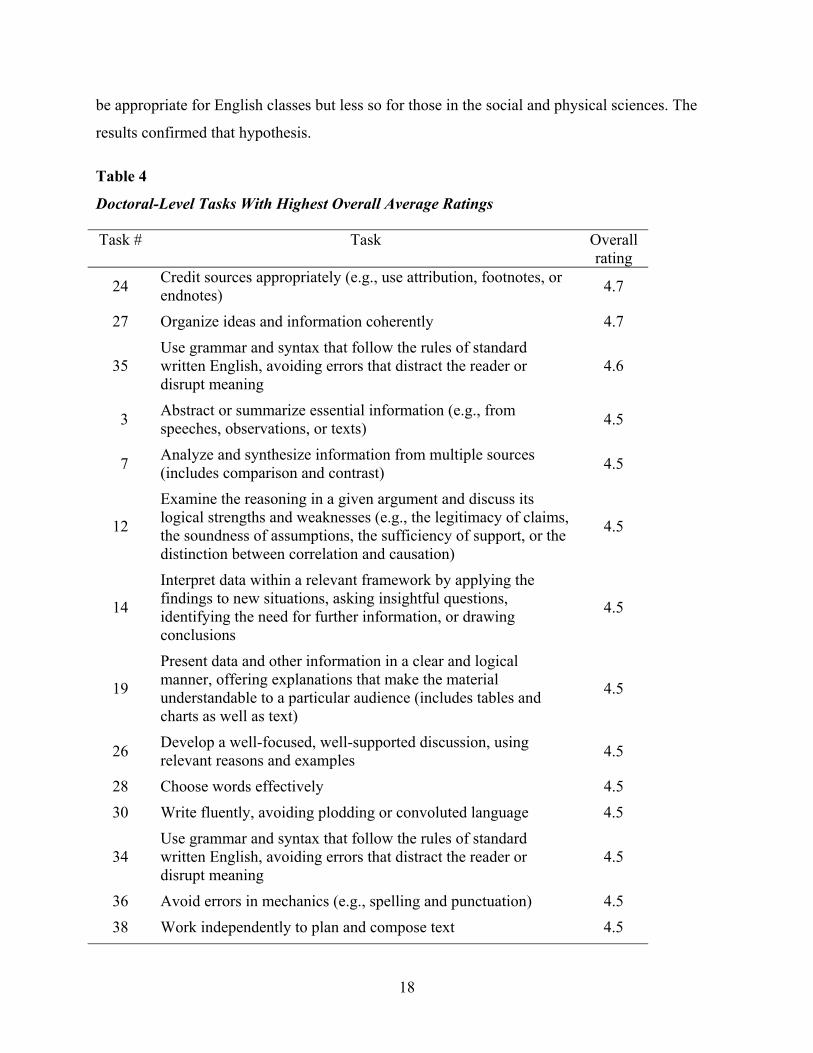
be appropriate for English classes but less so for those in the social and physical sciences. The
results confirmed that hypothesis.
Table 4
Doctoral-Level Tasks With Highest Overall Average Ratings
Task # Task Overall rating
24 Credit sources appropriately (e.g., use attribution, footnotes, or endnotes) 4.7
27 Organize ideas and information coherently 4.7
35 Use grammar and syntax that follow the rules of standard written English, avoiding errors that distract the reader or disrupt meaning
4.6
3 Abstract or summarize essential information (e.g., from speeches, observations, or texts) 4.5
7 Analyze and synthesize information from multiple sources (includes comparison and contrast) 4.5
12
Examine the reasoning in a given argument and discuss its logical strengths and weaknesses (e.g., the legitimacy of claims, the soundness of assumptions, the sufficiency of support, or the distinction between correlation and causation)
4.5
14
Interpret data within a relevant framework by applying the findings to new situations, asking insightful questions, identifying the need for further information, or drawing conclusions
4.5
19
Present data and other information in a clear and logical manner, offering explanations that make the material understandable to a particular audience (includes tables and charts as well as text)
4.5
26 Develop a well-focused, well-supported discussion, using relevant reasons and examples 4.5
28 Choose words effectively 4.5 30 Write fluently, avoiding plodding or convoluted language 4.5
34 Use grammar and syntax that follow the rules of standard written English, avoiding errors that distract the reader or disrupt meaning
4.5
36 Avoid errors in mechanics (e.g., spelling and punctuation) 4.5 38 Work independently to plan and compose text 4.5
18
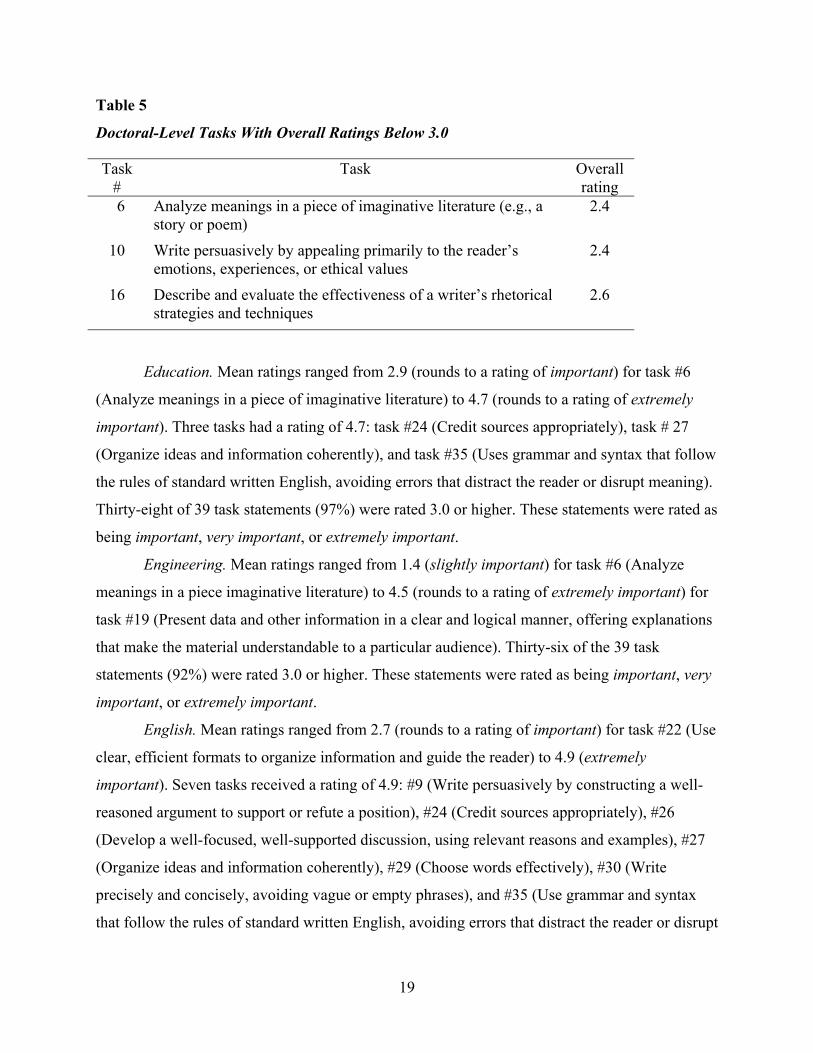
Table 5
Doctoral-Level Tasks With Overall Ratings Below 3.0
Task #
Task Overall rating
6 Analyze meanings in a piece of imaginative literature (e.g., a story or poem)
2.4
10 Write persuasively by appealing primarily to the reader’s emotions, experiences, or ethical values
2.4
16 Describe and evaluate the effectiveness of a writer’s rhetorical strategies and techniques
2.6
Education. Mean ratings ranged from 2.9 (rounds to a rating of important) for task #6
(Analyze meanings in a piece of imaginative literature) to 4.7 (rounds to a rating of extremely
important). Three tasks had a rating of 4.7: task #24 (Credit sources appropriately), task # 27
(Organize ideas and information coherently), and task #35 (Uses grammar and syntax that follow
the rules of standard written English, avoiding errors that distract the reader or disrupt meaning).
Thirty-eight of 39 task statements (97%) were rated 3.0 or higher. These statements were rated as
being important, very important, or extremely important.
Engineering. Mean ratings ranged from 1.4 (slightly important) for task #6 (Analyze
meanings in a piece imaginative literature) to 4.5 (rounds to a rating of extremely important) for
task #19 (Present data and other information in a clear and logical manner, offering explanations
that make the material understandable to a particular audience). Thirty-six of the 39 task
statements (92%) were rated 3.0 or higher. These statements were rated as being important, very
important, or extremely important.
English. Mean ratings ranged from 2.7 (rounds to a rating of important) for task #22 (Use
clear, efficient formats to organize information and guide the reader) to 4.9 (extremely
important). Seven tasks received a rating of 4.9: #9 (Write persuasively by constructing a well-
reasoned argument to support or refute a position), #24 (Credit sources appropriately), #26
(Develop a well-focused, well-supported discussion, using relevant reasons and examples), #27
(Organize ideas and information coherently), #29 (Choose words effectively), #30 (Write
precisely and concisely, avoiding vague or empty phrases), and #35 (Use grammar and syntax
that follow the rules of standard written English, avoiding errors that distract the reader or disrupt
19
meaning). Thirty-eight of 39 task statements (97%) were rated 3.0 or higher. These statements
were rated as being important, very important, or extremely important.
Life sciences. Mean ratings ranged from 1.3 (slightly important) for task #6 (Analyze
meaning in a piece of imaginative literature) to 4.8 (rounds to a rating of extremely important).
There were four tasks with the highest rating: #1 (Describe observations), #3 (Abstract or
summarize essential information), #24 (Credit sources appropriately), and #27 (Organize ideas
and information coherently). Thirty-six of the 39 task statements (92%) were rated 3.0 or higher.
These statements were rated as being important, very important, or extremely important.
Physical sciences. Mean ratings ranged from 1.1 (slightly important) for task #6 (Analyze
meaning in a piece of imaginative literature) to 4.6 (rounds to a rating of extremely important).
Six tasks received the highest rating: #8 (Predict consequences or outcomes by analyzing
information, patterns, or processes), #14 (Interpret data within a relevant framework by applying
the findings to new situations, asking insightful question, identifying the need for further
information, or drawing conclusions), #19 (Present data and other information in a clear and
logical manner offering explanations that make the material understandable to a particular
audience), #21 (Use technical content-specific vocabulary accurately and appropriately for a
particular purpose and audience), #24 (Credit sources appropriately), and #27 (Organize ideas
and information coherently). Thirty-three of the 39 task statements (85%) were rated 3.0 or
higher. These statements were rated as being important, very important, or extremely important.
Psychology. Mean ratings ranged from 2.0 (moderately important) for task #6 (Analyze
meaning in a piece of imaginative literature) to 4.8 (rounds to a rating of extremely important).
Three tasks received the highest rating: #12 (Examine the reasoning in a given argument and
discuss its logical strengths and weaknesses), #19 (Present data and other information in a clear
and logical manner, offering explanations that make the material understandable to a particular
audience), and task #24 (Credit sources appropriately). Thirty-six of the 39 task statements
(92%) were rated 3.0 or higher. These statements were rated as important, very important, or
extremely important.
Intercorrelation of subject-area ratings. The mean importance ratings obtained for each
of the 39 task statements for each of the six subject areas were correlated. These results, provided
in Table 6, indicated that the profile of ratings were similar for five of the six subject areas.
English was the one area that demonstrated a different profile of ratings. This finding was most
20
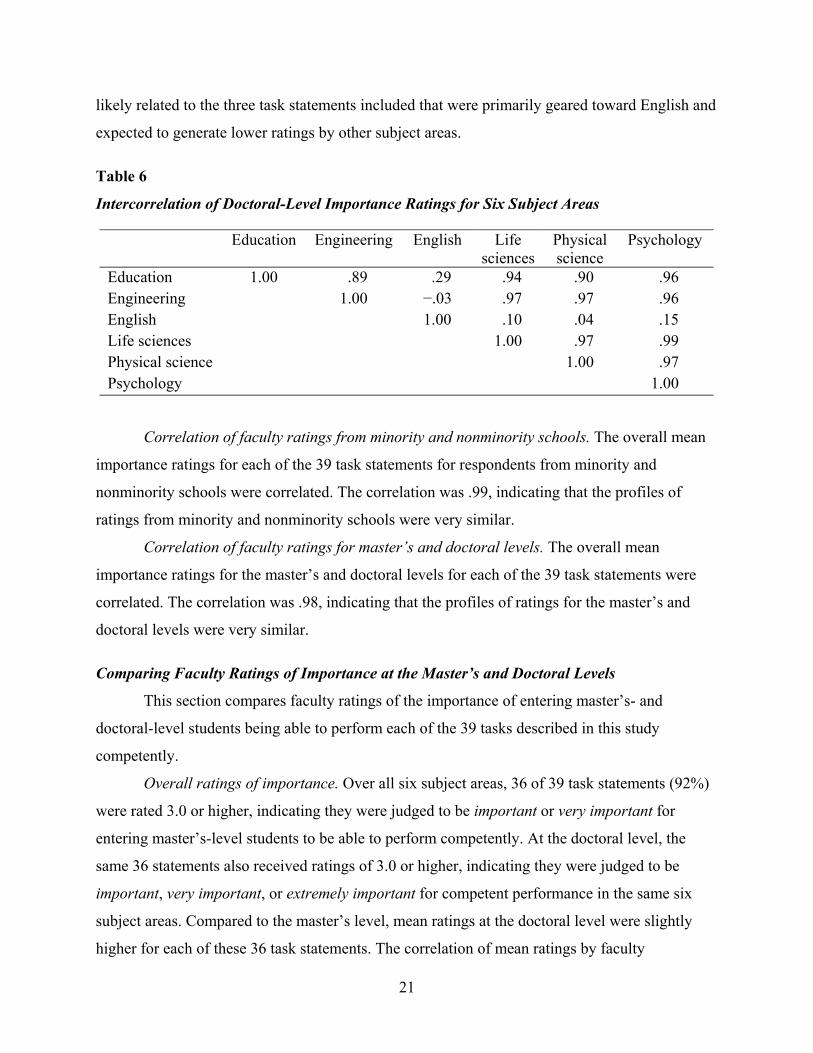
likely related to the three task statements included that were primarily geared toward English and
expected to generate lower ratings by other subject areas.
Table 6
Intercorrelation of Doctoral-Level Importance Ratings for Six Subject Areas
Education Engineering English Life sciences
Physical science
Psychology
Education 1.00 .89 .29 .94 .90 .96 Engineering 1.00 −.03 .97 .97 .96 English 1.00 .10 .04 .15 Life sciences 1.00 .97 .99 Physical science 1.00 .97 Psychology 1.00
Correlation of faculty ratings from minority and nonminority schools. The overall mean
importance ratings for each of the 39 task statements for respondents from minority and
nonminority schools were correlated. The correlation was .99, indicating that the profiles of
ratings from minority and nonminority schools were very similar.
Correlation of faculty ratings for master’s and doctoral levels. The overall mean
importance ratings for the master’s and doctoral levels for each of the 39 task statements were
correlated. The correlation was .98, indicating that the profiles of ratings for the master’s and
doctoral levels were very similar.
Comparing Faculty Ratings of Importance at the Master’s and Doctoral Levels
This section compares faculty ratings of the importance of entering master’s- and
doctoral-level students being able to perform each of the 39 tasks described in this study
competently.
Overall ratings of importance. Over all six subject areas, 36 of 39 task statements (92%)
were rated 3.0 or higher, indicating they were judged to be important or very important for
entering master’s-level students to be able to perform competently. At the doctoral level, the
same 36 statements also received ratings of 3.0 or higher, indicating they were judged to be
important, very important, or extremely important for competent performance in the same six
subject areas. Compared to the master’s level, mean ratings at the doctoral level were slightly
higher for each of these 36 task statements. The correlation of mean ratings by faculty
21
responding at the master’s and doctoral levels across all 39 tasks was .98, indicating that the
profile of ratings was quite similar. The vast majority of task statements were judged to be
important at both levels. The same three task statements received ratings below 3.0 at both the
master’s and doctoral levels; these were the task statements thought to be important for English
classes but less so for classes in the social and physical sciences.
Ratings by subject area. At the master’s level, the number of task statements receiving
ratings of 3.0 or above ranged from 32 (82%) for engineering to 39 (100%) for education. At the
doctoral level, the number of task statements receiving ratings of 3.0 or higher ranged from 33
(85%) for physical sciences to 38 of 39 (97%) for both education and English. A large majority
of task statements were judged to be important for competent performance in each of the subject
areas at each educational level. The intercorrelation of importance ratings across subject areas for
each of the 39 tasks indicated that the profile of ratings was similar for five of the six subject
areas. English was the one subject area that differed from the others. This occurred at both the
master’s and doctoral levels. The result of the three task statements is most likely to be more
important for English than for the other subject areas.
Ratings from minority and nonminority schools. The correlation of overall mean
importance ratings for each of the 39 task statements by faculty from minority and nonminority
schools was .98 for the master’s-level ratings and .99 at the doctoral level. This indicates that the
profiles of ratings from faculty at minority and nonminority schools were very similar at each of
the two educational levels. The absolute level of the mean ratings was also very similar.
Identifying the most important task statements. Thirty-six of the 39 task statements
received overall mean ratings of 3.0 or higher at both the master’s and doctoral levels. Some
statements were rated as being important, others very important, and a few were rated to be
extremely important. There was, however, a good deal of variability across the six subject areas.
Not all 36 task statements were rated 3.0 or higher for each subject area. Since the analytical
writing section of GRE is used to make admission decisions at both the master’s and doctoral
levels for a range of subject areas, it is useful to identify those tasks that are judged to be
important both overall and separately for each of the six subject areas. To identify the subset of
the most important tasks overall as well as those that were consistently rated as being important
by subject area, project staff developed the following standard: A task statement was considered
to be one of the most important task statements if it received an overall mean rating of 3.5 or
22

higher (rounds to a rating of very important) and received a rating of at least 3.0 (a rating of
important) for each of the six subject areas at both the master’s and doctoral levels. Twenty-nine
of 39 task statements (74%) met this standard. These 29 tasks can be considered the core of
important writing tasks at both the master’s and doctoral levels. They are listed in Table 7.
Table 7
Core Tasks Important at Both the Master’s and Doctoral Levels
Task # Statement Overall rating
1 Describe observations (e.g., of an event, behavior, place, object, or experiment). 4.1
2 Explain how to perform a procedure (e.g., for instructional materials or manuals). 3.8
3 Abstract or summarize essential information (e.g., from speeches, observations, or texts). 4.2
5 Explain an event or occurrence using such evidence as historical accounts, data, or research findings. 4.0
7 Analyze and synthesize information from multiple sources (includes comparison and contrast). 4.2
8 Predict consequences or outcomes by analyzing information, patterns, or processes. 3.8
9 Write persuasively by constructing a well-reasoned argument to support or refute a position. 4.1
11 Explore relationships among complex and possibly conflicting ideas. 4.0
12
Examine the reasoning in a given argument and discuss its logical strengths and weaknesses (e.g., the legitimacy of claims, the soundness of assumptions, the sufficiency of support, or the distinction between correlation and causation).
4.1
13 Identify problems in a proposed course of action or interpretation of events and propose solutions or alternative interpretations. 3.8
14 Interpret data within a relevant framework by applying the findings to new situations, asking insightful questions, identifying the need for further information, or drawing conclusions.
4.0
18 Write appropriately for a generally well-informed and thoughtful audience (e.g., maintain an appropriate tone, provide sufficient context or other information for readers to understand the points being made).
4.0
23
(Table continues)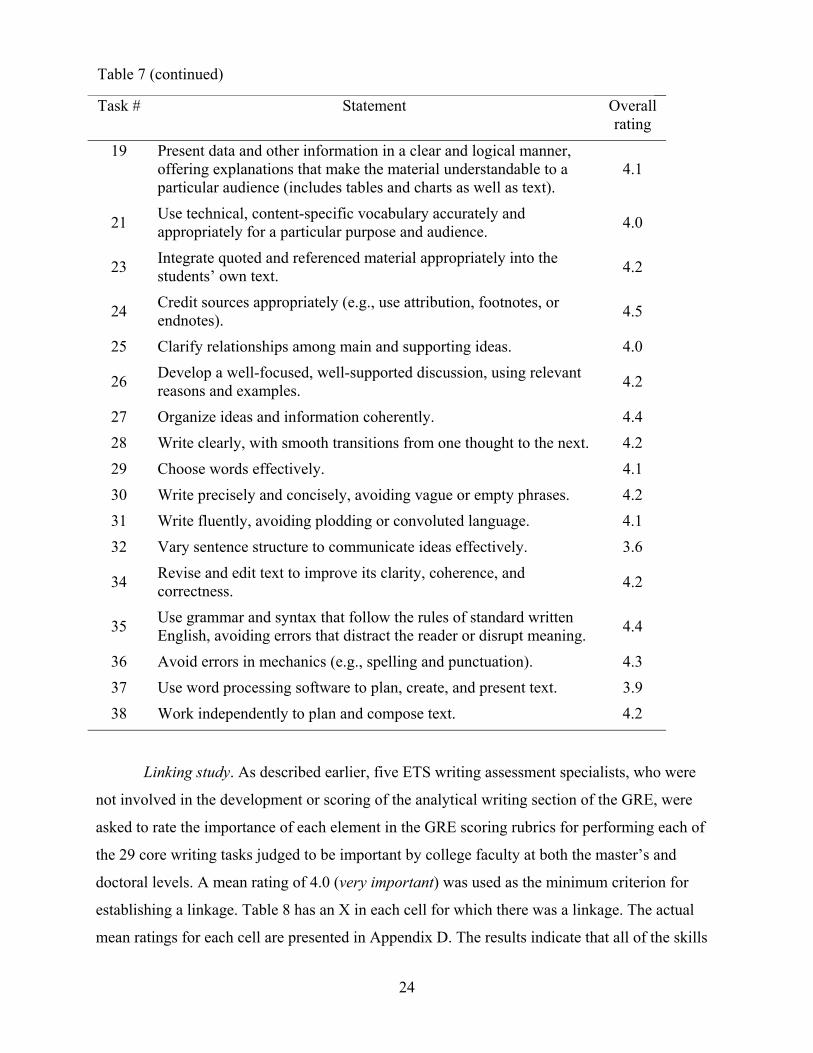
Task # Statement Overall rating
Table 7 (continued)
19 Present data and other information in a clear and logical manner, offering explanations that make the material understandable to a particular audience (includes tables and charts as well as text).
4.1
21 Use technical, content-specific vocabulary accurately and appropriately for a particular purpose and audience. 4.0
23 Integrate quoted and referenced material appropriately into the students’ own text. 4.2
24 Credit sources appropriately (e.g., use attribution, footnotes, or endnotes). 4.5
25 Clarify relationships among main and supporting ideas. 4.0
26 Develop a well-focused, well-supported discussion, using relevant reasons and examples. 4.2
27 Organize ideas and information coherently. 4.4 28 Write clearly, with smooth transitions from one thought to the next. 4.2 29 Choose words effectively. 4.1 30 Write precisely and concisely, avoiding vague or empty phrases. 4.2 31 Write fluently, avoiding plodding or convoluted language. 4.1 32 Vary sentence structure to communicate ideas effectively. 3.6
34 Revise and edit text to improve its clarity, coherence, and correctness. 4.2
35 Use grammar and syntax that follow the rules of standard written English, avoiding errors that distract the reader or disrupt meaning. 4.4
36 Avoid errors in mechanics (e.g., spelling and punctuation). 4.3 37 Use word processing software to plan, create, and present text. 3.9 38 Work independently to plan and compose text. 4.2
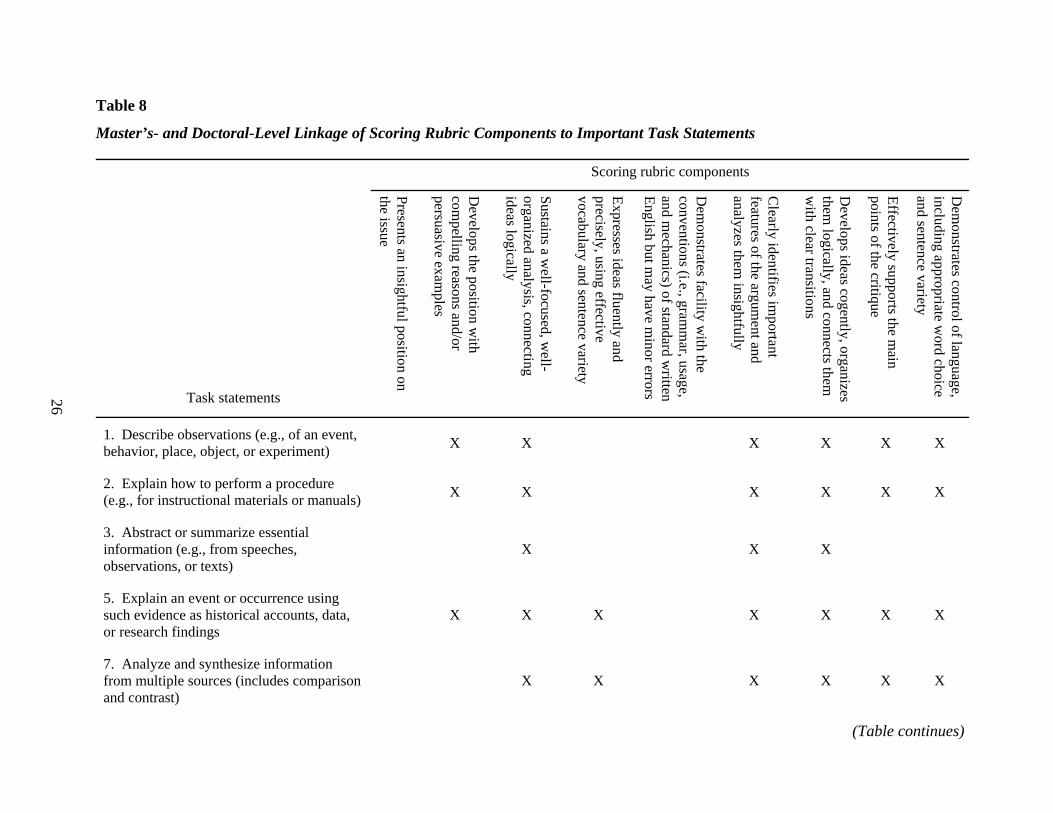
Linking study. As described earlier, five ETS writing assessment specialists, who were
not involved in the development or scoring of the analytical writing section of the GRE, were
asked to rate the importance of each element in the GRE scoring rubrics for performing each of
the 29 core writing tasks judged to be important by college faculty at both the master’s and
doctoral levels. A mean rating of 4.0 (very important) was used as the minimum criterion for
establishing a linkage. Table 8 has an X in each cell for which there was a linkage. The actual
mean ratings for each cell are presented in Appendix D. The results indicate that all of the skills
24
in the scoring rubric were judged to be important for successfully performing one or more of the
core tasks. The skill “Presents an insightful position” had the fewest linkages. It had four
linkages and was linked to 14% of the core tasks. The skill “Demonstrates control of language,
including appropriate word choice and sentence variety” was linked to 21, or 72%, of the core
task statements. The remaining skills were linked to from 24% to 59% of the core task
statements.
It should be noted that there were not linkages to all 29 important tasks. Four tasks had no
direct linkages: #23 (Integrate quoted and referenced material appropriately into the students’
own text), #24 (Credit sources appropriately), #37 (Use word processing software to plan, create,
and present text), and #38 (Work independently to plan and compose text). Although these four
tasks are not assessed by the GRE scoring rubrics, two of the four (tasks #37 and #38) are related
to the conditions under which the test is administered. The result that these tasks were rated as
being important lends support for the procedures GRE uses in administering the analytical
writing section.
25
26
Table 8
Master’s- and Doctoral-Level Linkage of Scoring Rubric Components to Important Task Statements
Scoring rubric components
Task statements
Presents an insightful position on the issue
Develops the position w
ith com
pelling reasons and/or persuasive exam
ples
Sustains a well-focused, w
ell-organized analysis, connecting ideas logically
Expresses ideas fluently and precisely, using effective vocabulary and sentence variety
Dem
onstrates facility with the
conventions (i.e., gramm
ar, usage, and m
echanics) of standard written
English but may have m
inor errors
Clearly identifies im
portant features of the argum
ent and analyzes them
insightfully
Develops ideas cogently, organizes
them logically, and connects them
w
ith clear transitions
Effectively supports the main
points of the critique
Dem
onstrates control of language, including appropriate w
ord choice and sentence variety
1. Describe observations (e.g., of an event, behavior, place, object, or experiment) X X X X X X
2. Explain how to perform a procedure (e.g., for instructional materials or manuals) X X X X X X
3. Abstract or summarize essential information (e.g., from speeches, observations, or texts)
X X X
5. Explain an event or occurrence using such evidence as historical accounts, data, or research findings
X X X X X X X
7. Analyze and synthesize information from multiple sources (includes comparison and contrast)
X X X X X X
(Table continues)
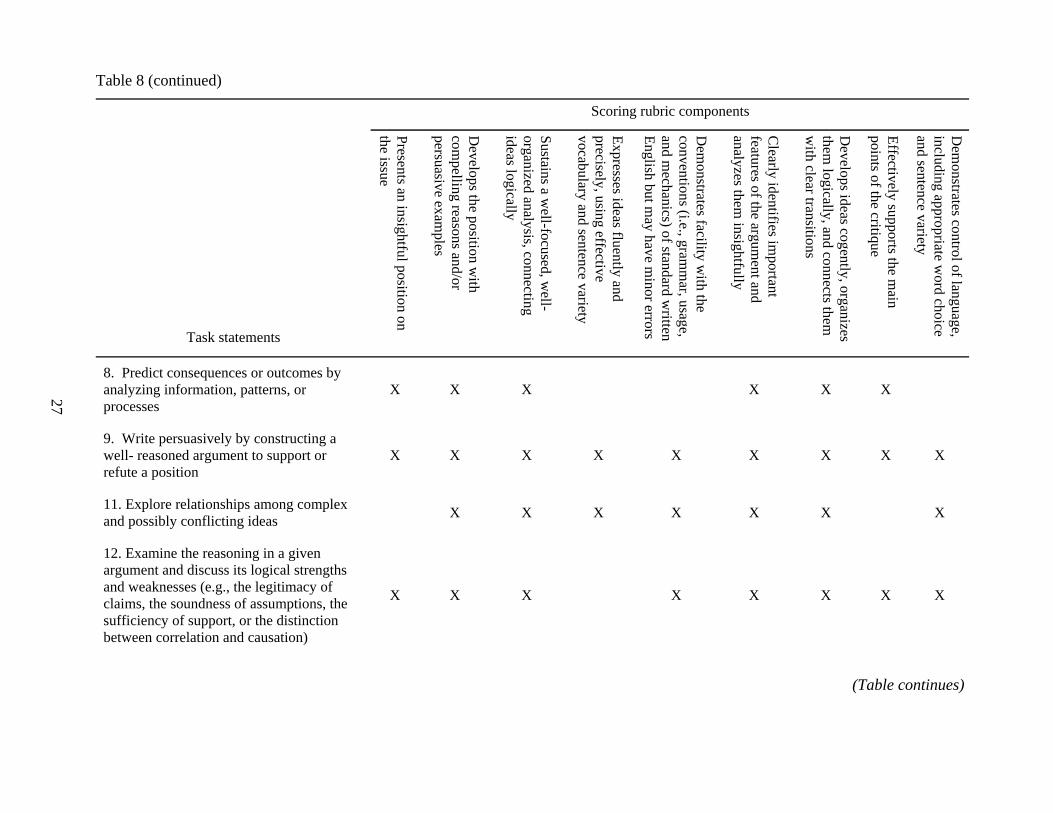
Table 8 (
27
8. Predianalyzinprocesse
9. Writewell- rearefute a p
11. Expland poss
12. Examargumenand weaclaims, tsufficienbetween
continued)
Scoring rubric components
Task statements
Presents an insightful position on the issue
Develops the position w
ith com
pelling reasons and/or persuasive exam
ples
Sustains a well-focused, w
ell-organized analysis, connecting ideas logically
Expresses ideas fluently and precisely, using effective vocabulary and sentence variety
Dem
onstrates facility with the
conventions (i.e., gramm
ar, usage, and m
echanics) of standard written
English but may have m
inor errors
Clearly identifies im
portant features of the argum
ent and analyzes them
insightfully
Develops ideas cogently, organizes
them logically, and connects them
w
ith clear transitions
Effectively supports the main
points of the critique
Dem
onstrates control of language, including appropriate w
ord choice and sentence variety
ct consequences or outcomes by g information, patterns, or s
X X X X X X
persuasively by constructing a soned argument to support or osition
X X X X X X X X X
ore relationships among complex ibly conflicting ideas X X X X X X X
ine the reasoning in a given t and discuss its logical strengths knesses (e.g., the legitimacy of he soundness of assumptions, the cy of support, or the distinction correlation and causation)
X X X X X X X X
(Table continues)
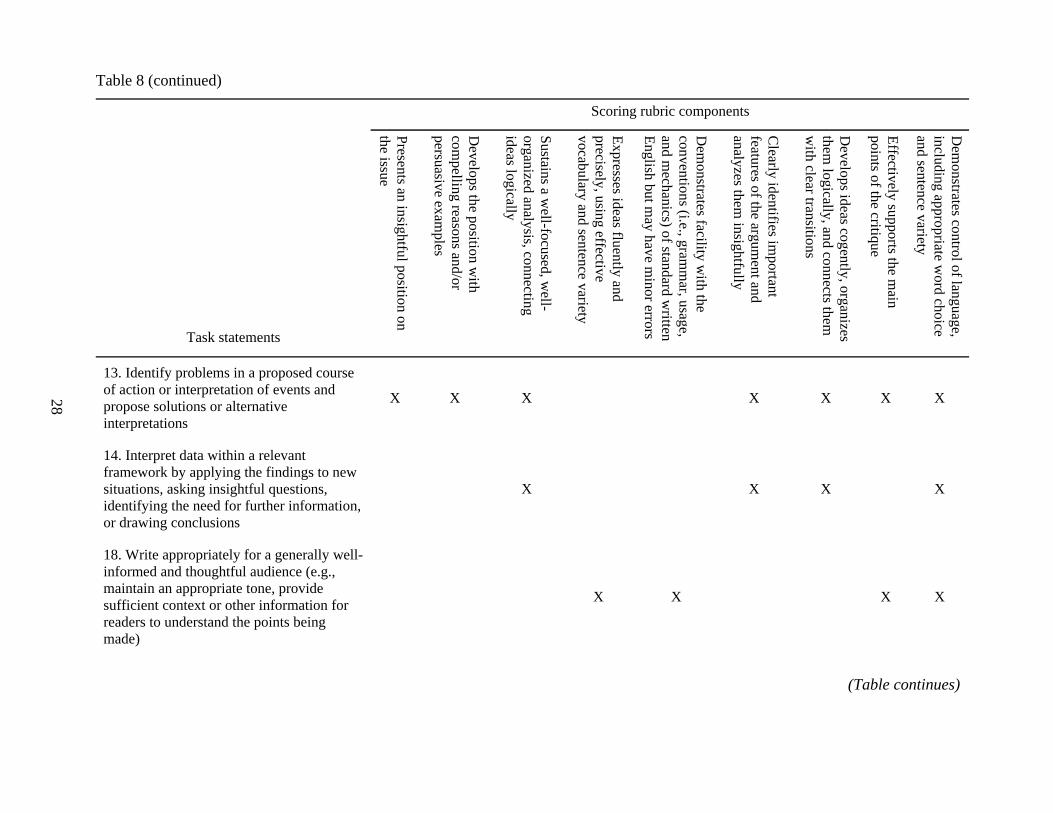
Table 8 (
28
13. Identof actionpropose interpret
14. Interframewosituationidentifyior drawi
18. Writinformedmaintainsufficienreaders tmade)
continued)
Scoring rubric components
Task statements
Presents an insightful position on the issue
Develops the position w
ith com
pelling reasons and/or persuasive exam
ples
Sustains a well-focused, w
ell-organized analysis, connecting ideas logically
Expresses ideas fluently and precisely, using effective vocabulary and sentence variety
Dem
onstrates facility with the
conventions (i.e., gramm
ar, usage, and m
echanics) of standard written
English but may have m
inor errors
Clearly identifies im
portant features of the argum
ent and analyzes them
insightfully
Develops ideas cogently, organizes
them logically, and connects them
w
ith clear transitions
Effectively supports the main
points of the critique
Dem
onstrates control of language, including appropriate w
ord choice and sentence variety
ify problems in a proposed course or interpretation of events and solutions or alternative ations
X X X X X X X
pret data within a relevant rk by applying the findings to new s, asking insightful questions, ng the need for further information, ng conclusions
X X X X
e appropriately for a generally well- and thoughtful audience (e.g., an appropriate tone, provide t context or other information for o understand the points being
X X X X
(Table continues)
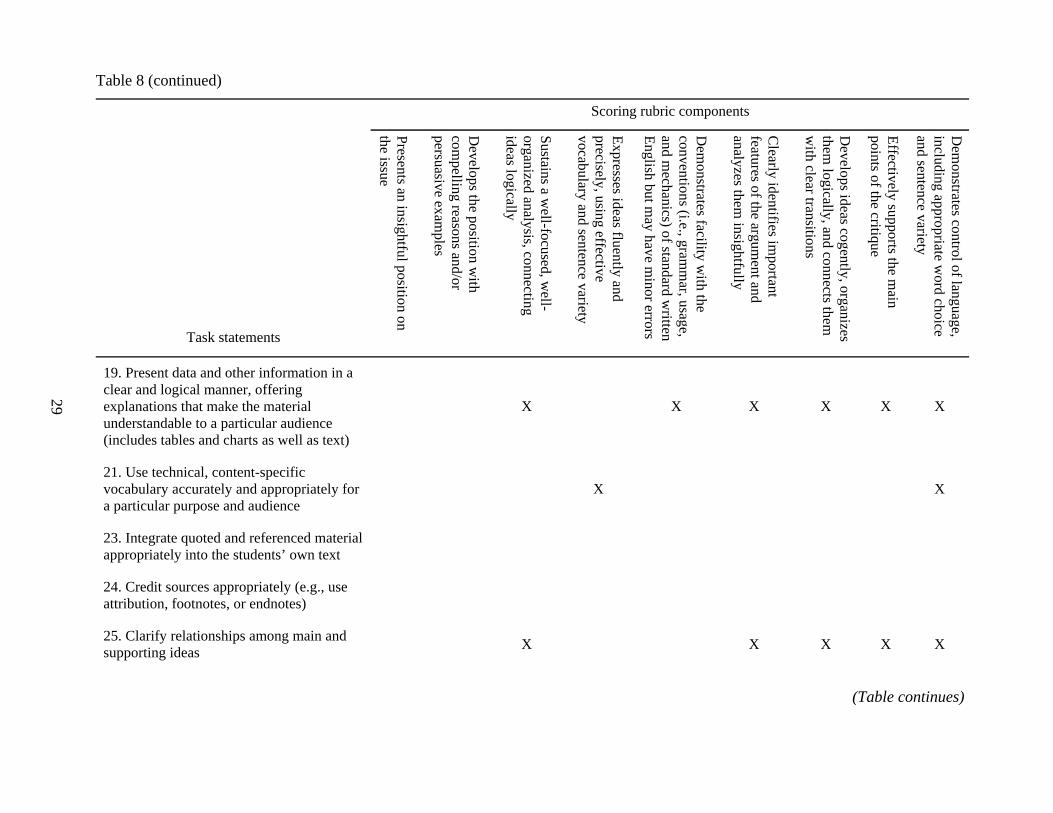
Table 8
29
19. Preclear aexplanunders(includ
21. Usvocabua parti
23. Intapprop
24. Crattribu
25. Clasuppor
(continued)
Scoring rubric components
Task statements
Presents an insightful position on the issue
Develops the position w
ith com
pelling reasons and/or persuasive exam
ples
Sustains a well-focused, w
ell-organized analysis, connecting ideas logically
Expresses ideas fluently and precisely, using effective vocabulary and sentence variety
Dem
onstrates facility with the
conventions (i.e., gramm
ar, usage, and m
echanics) of standard written
English but may have m
inor errors
Clearly identifies im
portant features of the argum
ent and analyzes them
insightfully
Develops ideas cogently, organizes
them logically, and connects them
w
ith clear transitions
Effectively supports the main
points of the critique
Dem
onstrates control of language, including appropriate w
ord choice and sentence variety
sent data and other information in a nd logical manner, offering ations that make the material tandable to a particular audience es tables and charts as well as text)
X X X X X X
e technical, content-specific lary accurately and appropriately for
cular purpose and audience X X
egrate quoted and referenced material riately into the students’ own text
edit sources appropriately (e.g., use tion, footnotes, or endnotes)
rify relationships among main and ting ideas
X X X X X
(Table continues)
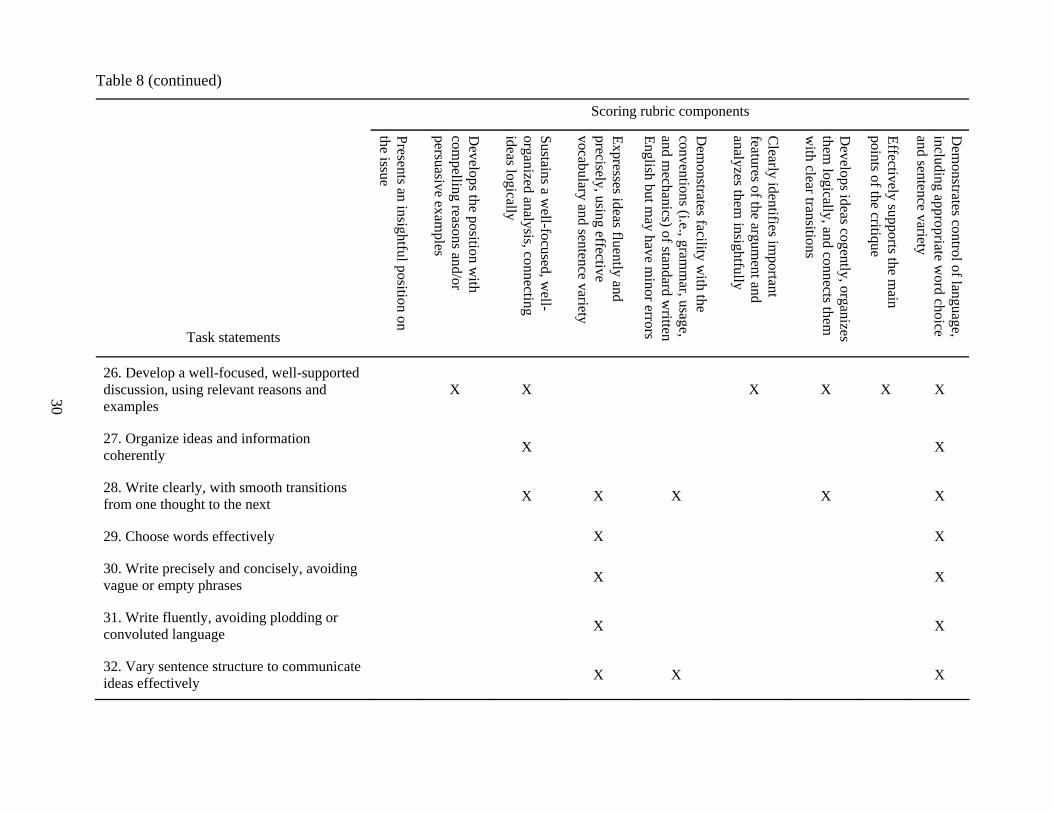
Table 8 (continued)
30
Scoring rubric components
Task statements
Presents an insightful position on the issue
Develops the position w
ith com
pelling reasons and/or persuasive exam
ples
Sustains a well-focused, w
ell-organized analysis, connecting ideas logically
Expresses ideas fluently and precisely, using effective vocabulary and sentence variety
Dem
onstrates facility with the
conventions (i.e., gramm
ar, usage, and m
echanics) of standard written
English but may have m
inor errors
Clearly identifies im
portant features of the argum
ent and analyzes them
insightfully
Develops ideas cogently, organizes
them logically, and connects them
w
ith clear transitions
Effectively supports the main
points of the critique
Dem
onstrates control of language, including appropriate w
ord choice and sentence variety
26. Develop a well-focused, well-supported discussion, using relevant reasons and examples
X X X X X X
27. Organize ideas and information coherently
X X
28. Write clearly, with smooth transitions from one thought to the next
X X X X X
29. Choose words effectively X X
30. Write precisely and concisely, avoiding vague or empty phrases
X X
31. Write fluently, avoiding plodding or convoluted language
X X
32. Vary sentence structure to communicate ideas effectively
X X X
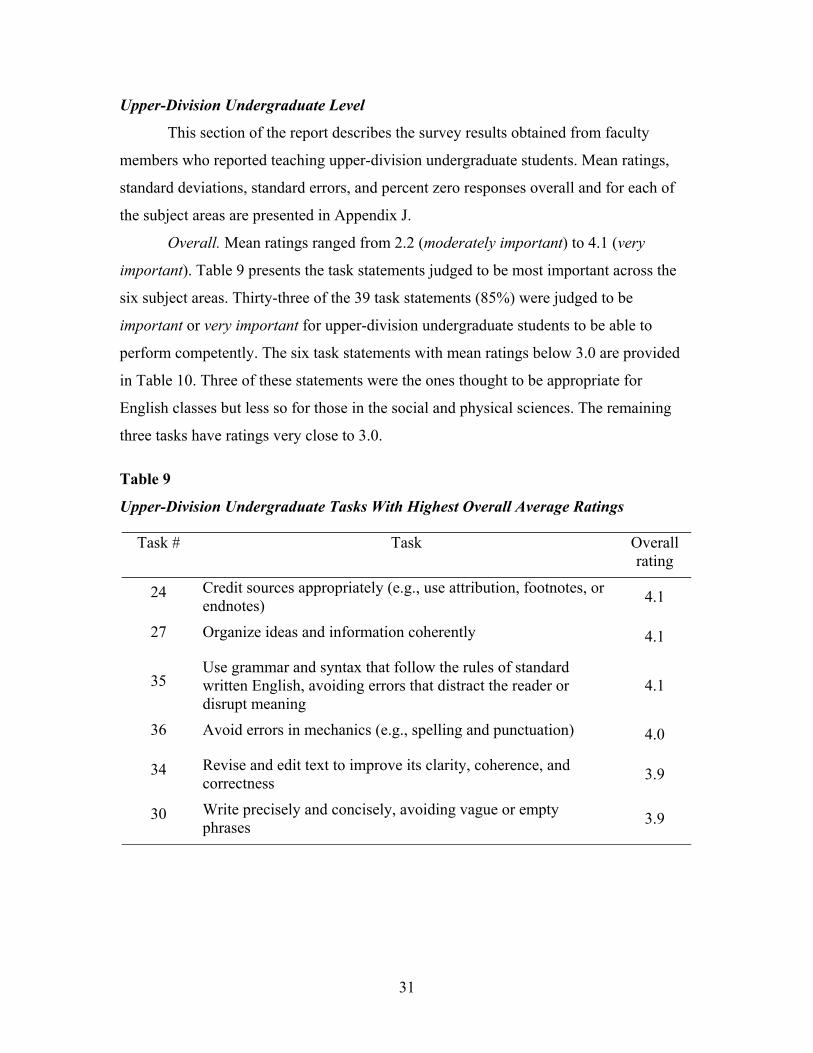
Upper-Division Undergraduate Level
This section of the report describes the survey results obtained from faculty
members who reported teaching upper-division undergraduate students. Mean ratings,
standard deviations, standard errors, and percent zero responses overall and for each of
the subject areas are presented in Appendix J.
Overall. Mean ratings ranged from 2.2 (moderately important) to 4.1 (very
important). Table 9 presents the task statements judged to be most important across the
six subject areas. Thirty-three of the 39 task statements (85%) were judged to be
important or very important for upper-division undergraduate students to be able to
perform competently. The six task statements with mean ratings below 3.0 are provided
in Table 10. Three of these statements were the ones thought to be appropriate for
English classes but less so for those in the social and physical sciences. The remaining
three tasks have ratings very close to 3.0.
Table 9
Upper-Division Undergraduate Tasks With Highest Overall Average Ratings
Task # Task Overall rating
24 Credit sources appropriately (e.g., use attribution, footnotes, or endnotes) 4.1
27 Organize ideas and information coherently 4.1
35 Use grammar and syntax that follow the rules of standard written English, avoiding errors that distract the reader or disrupt meaning
4.1
36 Avoid errors in mechanics (e.g., spelling and punctuation) 4.0
34 Revise and edit text to improve its clarity, coherence, and correctness 3.9
30 Write precisely and concisely, avoiding vague or empty phrases 3.9
31
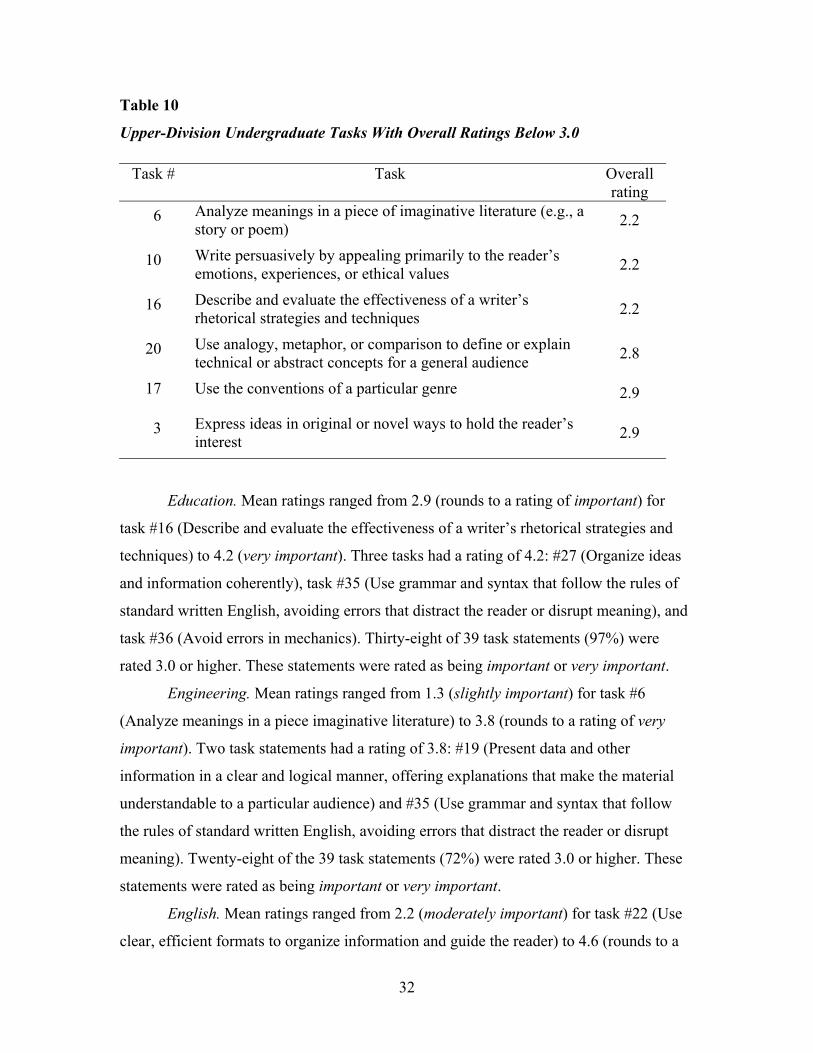
Table 10
Upper-Division Undergraduate Tasks With Overall Ratings Below 3.0
Task # Task Overall rating
6 Analyze meanings in a piece of imaginative literature (e.g., a story or poem) 2.2
10 Write persuasively by appealing primarily to the reader’s emotions, experiences, or ethical values 2.2
16 Describe and evaluate the effectiveness of a writer’s rhetorical strategies and techniques 2.2
20 Use analogy, metaphor, or comparison to define or explain technical or abstract concepts for a general audience 2.8
17 Use the conventions of a particular genre 2.9
3 Express ideas in original or novel ways to hold the reader’s interest 2.9
Education. Mean ratings ranged from 2.9 (rounds to a rating of important) for
task #16 (Describe and evaluate the effectiveness of a writer’s rhetorical strategies and
techniques) to 4.2 (very important). Three tasks had a rating of 4.2: #27 (Organize ideas
and information coherently), task #35 (Use grammar and syntax that follow the rules of
standard written English, avoiding errors that distract the reader or disrupt meaning), and
task #36 (Avoid errors in mechanics). Thirty-eight of 39 task statements (97%) were
rated 3.0 or higher. These statements were rated as being important or very important.
Engineering. Mean ratings ranged from 1.3 (slightly important) for task #6
(Analyze meanings in a piece imaginative literature) to 3.8 (rounds to a rating of very
important). Two task statements had a rating of 3.8: #19 (Present data and other
information in a clear and logical manner, offering explanations that make the material
understandable to a particular audience) and #35 (Use grammar and syntax that follow
the rules of standard written English, avoiding errors that distract the reader or disrupt
meaning). Twenty-eight of the 39 task statements (72%) were rated 3.0 or higher. These
statements were rated as being important or very important.
English. Mean ratings ranged from 2.2 (moderately important) for task #22 (Use
clear, efficient formats to organize information and guide the reader) to 4.6 (rounds to a
32

rating of extremely important). Four tasks received a rating of 4.6: #9 (Write persuasively
by constructing a well-reasoned argument to support or refute a position), #24 (Credit
sources appropriately), #26 (Develop a well-focused well-supported discussion, using
relevant reasons and examples), and #27 (Organize ideas and information coherently).
Thirty-three of 39 task statements (85%) were rated 3.0 or higher. These statements were
rated as being important, very important, or extremely important.
Life sciences. Mean ratings ranged from 1.3 (slightly important) for task #6
(Analyze meaning in a piece of imaginative literature) to 4.3 (very important) for task
#24 (Credit sources appropriately). Thirty-two of the 39 task statements (82%) were rated
3.0 or higher. These statements were rated as being important or very important.
Physical sciences. Mean ratings ranged from 1.0 (slightly important) for task #6
(Analyze meaning in a piece of imaginative literature) to 3.9 (rounds to a rating of very
important) for task #27 (Organize ideas and information coherently). Thirty of the 39 task
statements (77%) were rated 3.0 or higher. These statements were rated as being
important or very important.
Psychology. Mean ratings ranged from 1.7 (rounds to a rating of moderately
important) for task #6 (Analyze meaning in a piece of imaginative literature) and task
#16 (Describe and evaluate the effectiveness of a writer’s rhetorical strategies and
techniques). Three tasks received the highest rating of 4.1 (very important). These were
#24 (Credit sources appropriately), #27 (Organize ideas and information coherently), and
#35 (Use grammar and syntax that follow the rules of standard written English, avoiding
errors that distract the reader or disrupt meaning). Thirty-three of the 39 task statements
(85%) were rated 3.0 or higher. These statements were rated as important or very
important.
Intercorrelation of subject-area ratings. The mean importance ratings obtained
for each of the 39 task statements for each of the six subject areas were correlated. These
results, provided in Table 11, indicated that the profiles of ratings were similar for five of
the six subject areas. English was the one area with different profiles of ratings, which is
most likely related to the three task statements included that were primarily geared
toward English and expected to generate lower ratings by the other subject areas.
33
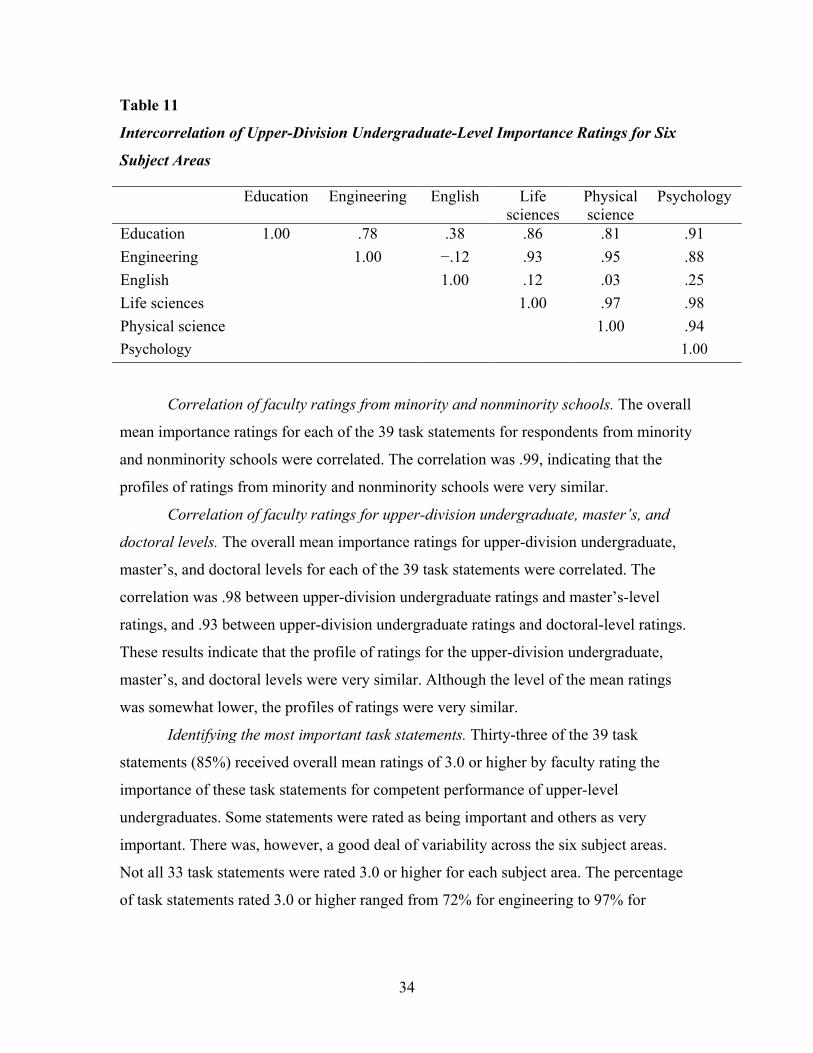
Table 11
Intercorrelation of Upper-Division Undergraduate-Level Importance Ratings for Six
Subject Areas
Education Engineering English Life sciences
Physical science
Psychology
Education 1.00 .78 .38 .86 .81 .91 Engineering 1.00 −.12 .93 .95 .88 English 1.00 .12 .03 .25 Life sciences 1.00 .97 .98 Physical science 1.00 .94 Psychology 1.00
Correlation of faculty ratings from minority and nonminority schools. The overall
mean importance ratings for each of the 39 task statements for respondents from minority
and nonminority schools were correlated. The correlation was .99, indicating that the
profiles of ratings from minority and nonminority schools were very similar.
Correlation of faculty ratings for upper-division undergraduate, master’s, and
doctoral levels. The overall mean importance ratings for upper-division undergraduate,
master’s, and doctoral levels for each of the 39 task statements were correlated. The
correlation was .98 between upper-division undergraduate ratings and master’s-level
ratings, and .93 between upper-division undergraduate ratings and doctoral-level ratings.
These results indicate that the profile of ratings for the upper-division undergraduate,
master’s, and doctoral levels were very similar. Although the level of the mean ratings
was somewhat lower, the profiles of ratings were very similar.
Identifying the most important task statements. Thirty-three of the 39 task
statements (85%) received overall mean ratings of 3.0 or higher by faculty rating the
importance of these task statements for competent performance of upper-level
undergraduates. Some statements were rated as being important and others as very
important. There was, however, a good deal of variability across the six subject areas.
Not all 33 task statements were rated 3.0 or higher for each subject area. The percentage
of task statements rated 3.0 or higher ranged from 72% for engineering to 97% for
34
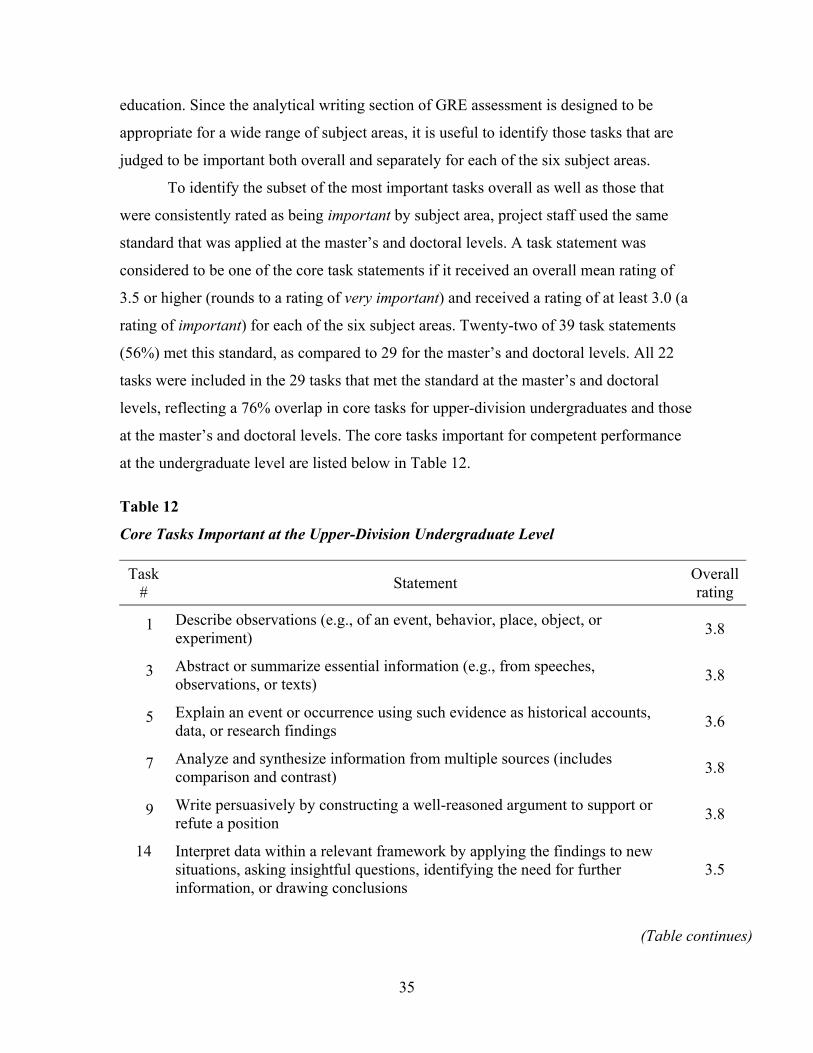
education. Since the analytical writing section of GRE assessment is designed to be
appropriate for a wide range of subject areas, it is useful to identify those tasks that are
judged to be important both overall and separately for each of the six subject areas.
To identify the subset of the most important tasks overall as well as those that
were consistently rated as being important by subject area, project staff used the same
standard that was applied at the master’s and doctoral levels. A task statement was
considered to be one of the core task statements if it received an overall mean rating of
3.5 or higher (rounds to a rating of very important) and received a rating of at least 3.0 (a
rating of important) for each of the six subject areas. Twenty-two of 39 task statements
(56%) met this standard, as compared to 29 for the master’s and doctoral levels. All 22
tasks were included in the 29 tasks that met the standard at the master’s and doctoral
levels, reflecting a 76% overlap in core tasks for upper-division undergraduates and those
at the master’s and doctoral levels. The core tasks important for competent performance
at the undergraduate level are listed below in Table 12.
Table 12
Core Tasks Important at the Upper-Division Undergraduate Level
Task # Statement Overall
rating
1 Describe observations (e.g., of an event, behavior, place, object, or experiment) 3.8
3 Abstract or summarize essential information (e.g., from speeches, observations, or texts) 3.8
5 Explain an event or occurrence using such evidence as historical accounts, data, or research findings 3.6
7 Analyze and synthesize information from multiple sources (includes comparison and contrast) 3.8
9 Write persuasively by constructing a well-reasoned argument to support or refute a position 3.8
14 Interpret data within a relevant framework by applying the findings to new situations, asking insightful questions, identifying the need for further information, or drawing conclusions
3.5
35
(Table continues)
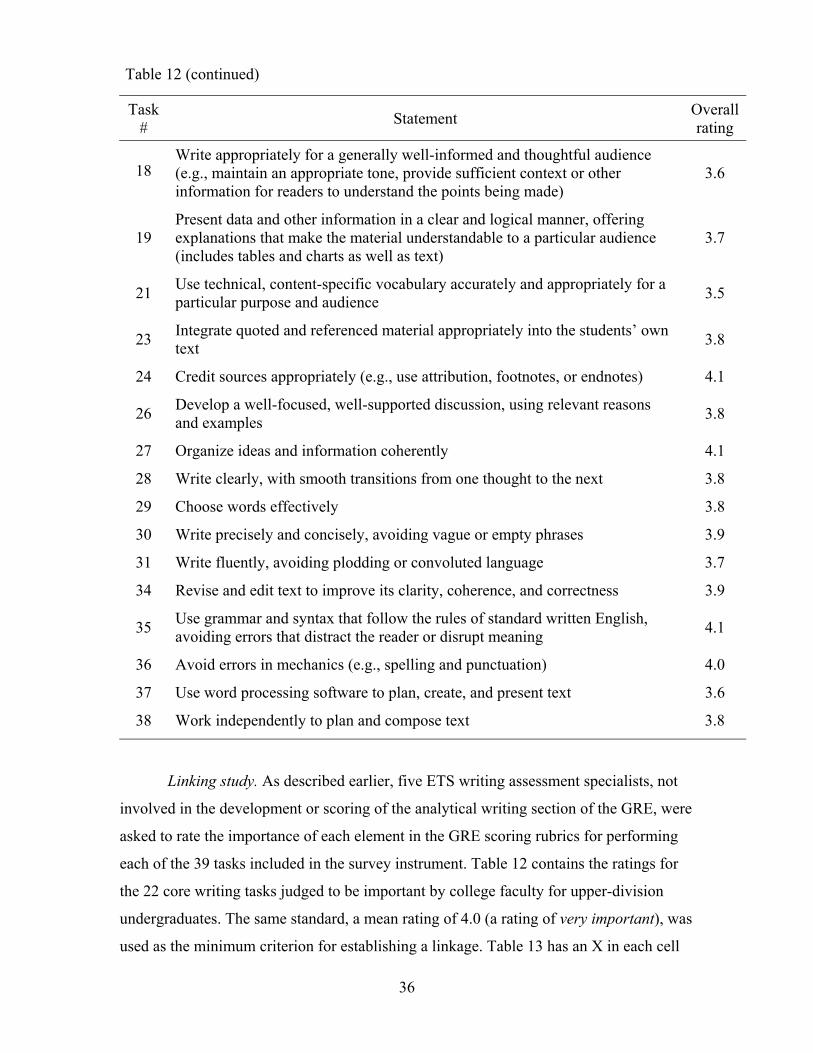
Task # Statement Overall
rating
Table 12 (continued)
18 Write appropriately for a generally well-informed and thoughtful audience (e.g., maintain an appropriate tone, provide sufficient context or other information for readers to understand the points being made)
3.6
19 Present data and other information in a clear and logical manner, offering explanations that make the material understandable to a particular audience (includes tables and charts as well as text)
3.7
21 Use technical, content-specific vocabulary accurately and appropriately for a particular purpose and audience 3.5
23 Integrate quoted and referenced material appropriately into the students’ own text 3.8
24 Credit sources appropriately (e.g., use attribution, footnotes, or endnotes) 4.1
26 Develop a well-focused, well-supported discussion, using relevant reasons and examples 3.8
27 Organize ideas and information coherently 4.1
28 Write clearly, with smooth transitions from one thought to the next 3.8
29 Choose words effectively 3.8
30 Write precisely and concisely, avoiding vague or empty phrases 3.9
31 Write fluently, avoiding plodding or convoluted language 3.7
34 Revise and edit text to improve its clarity, coherence, and correctness 3.9
35 Use grammar and syntax that follow the rules of standard written English, avoiding errors that distract the reader or disrupt meaning 4.1
36 Avoid errors in mechanics (e.g., spelling and punctuation) 4.0
37 Use word processing software to plan, create, and present text 3.6
38 Work independently to plan and compose text 3.8
Linking study. As described earlier, five ETS writing assessment specialists, not
involved in the development or scoring of the analytical writing section of the GRE, were
asked to rate the importance of each element in the GRE scoring rubrics for performing
each of the 39 tasks included in the survey instrument. Table 12 contains the ratings for
the 22 core writing tasks judged to be important by college faculty for upper-division
undergraduates. The same standard, a mean rating of 4.0 (a rating of very important), was
used as the minimum criterion for establishing a linkage. Table 13 has an X in each cell
36
for which there was a linkage. The mean ratings for all cells are presented in Appendix D.
The results indicate that all of the scoring rubric skills were judged to be important for
successfully performing one or more of the core tasks. The skill “Presents an insightful
position” had the fewest linkages. It had one linkage and was linked to 5% of the core
tasks. The skill “Demonstrates control of language, including appropriate word choice
and sentence variety” was linked to 15 (or 68%) of the core task statements. The
remaining skills were linked to from 14% to 55% of the core task statements. It should be
noted that linkages were not established with 4 of the 22 important tasks. These were task
numbers 23, 24, 37, and 38, which were described above.
37
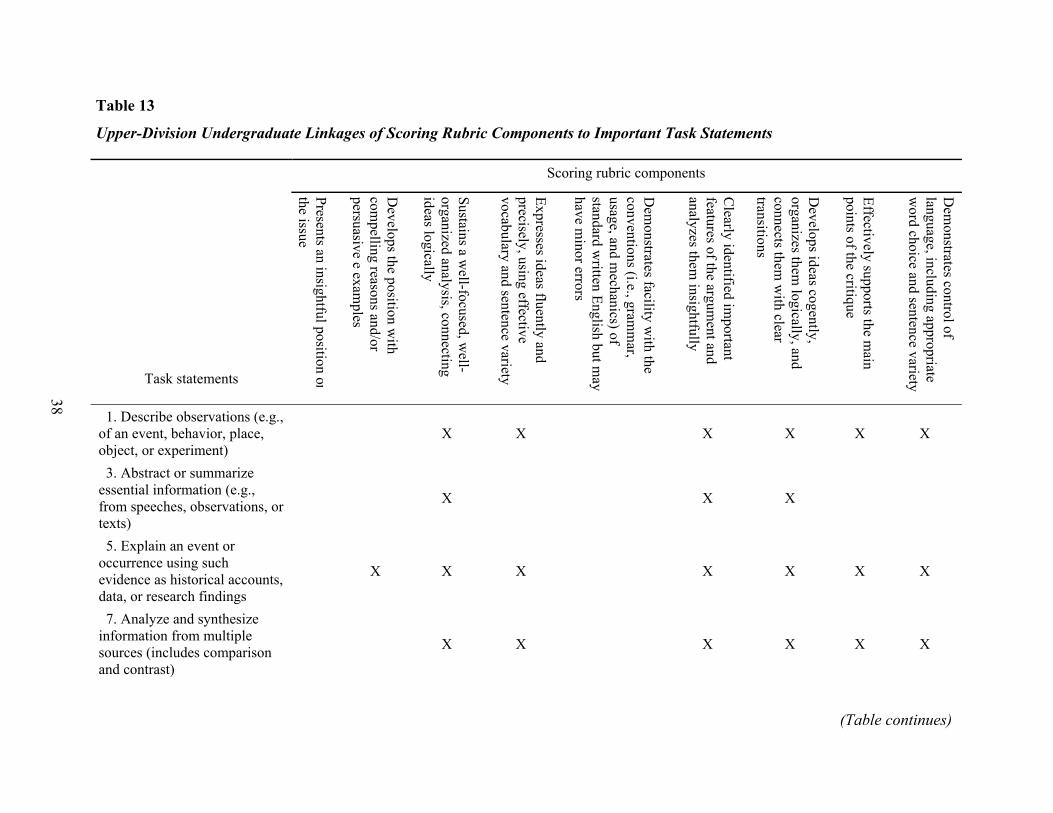
Tab
Upp
1. of aobj 3. essefromtext 5. occeviddata 7. infosouand
38
le 13
er-Division Undergraduate Linkages of Scoring Rubric Components to Important Task Statements
Scoring rubric components
Task statements
Presents an insightful position onthe issue
Develops the position w
ith com
pelling reasons and/or persuasive e exam
ples
Sustains a well-focused, w
ell-organized analysis, connecting ideas logically
Expresses ideas fluently and precisely, using effective vocabulary and sentence variety
Dem
onstrates facility with the
conventions (i.e., gramm
ar, usage, and m
echanics) of standard w
ritten English but may
have minor errors
Clearly identified im
portant features of the argum
ent and analyzes them
insightfully
Develops ideas cogently,
organizes them logically, and
connects them w
ith clear transitions
Effectively supports the main
points of the critique
Dem
onstrates control of language, including appropriate w
ord choice and sentence variety
Describe observations (e.g., n event, behavior, place, ect, or experiment)
X X X X X X
Abstract or summarize ntial information (e.g., speeches, observations, or
s)
X X X
Explain an event or urrence using such ence as historical accounts, , or research findings
X X X X X X X
Analyze and synthesize rmation from multiple rces (includes comparison contrast)
X X X X X X
(Table continues)
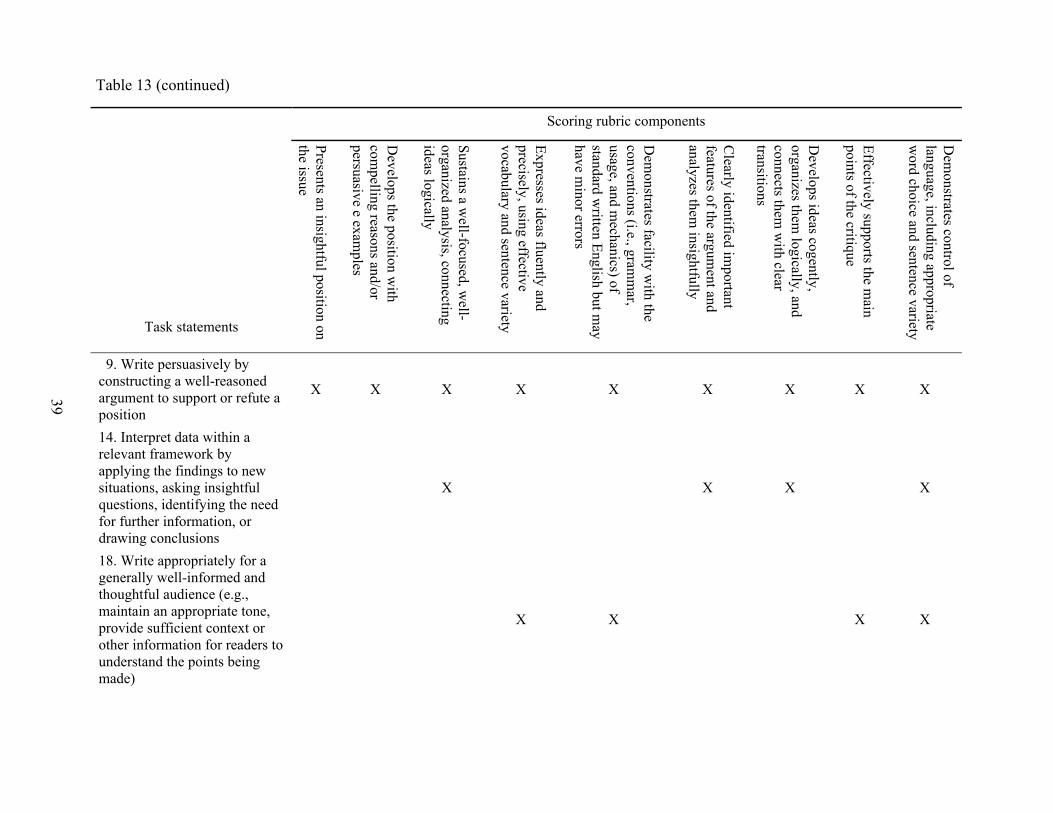
Ta
9coargpo14relapsitqufordra18gethomaproothunma
39
ble 13 (continued)
Scoring rubric components
Task statements
Presents an insightful position onthe issue
Develops the position w
ith com
pelling reasons and/or persuasive e exam
ples
Sustains a well-focused, w
ell-organized analysis, connecting ideas logically
Expresses ideas fluently and precisely, using effective vocabulary and sentence variety
Dem
onstrates facility with the
conventions (i.e., gramm
ar, usage, and m
echanics) of standard w
ritten English but may
have minor errors
Clearly identified im
portant features of the argum
ent and analyzes them
insightfully
Develops ideas cogently,
organizes them logically, and
connects them w
ith clear transitions
Effectively supports the main
points of the critique
Dem
onstrates control of language, including appropriate w
ord choice and sentence variety
. Write persuasively by nstructing a well-reasoned ument to support or refute a
sition
X X X X X X X X X
. Interpret data within a evant framework by plying the findings to new uations, asking insightful estions, identifying the need further information, or wing conclusions
X X X X
. Write appropriately for a nerally well-informed and ughtful audience (e.g., intain an appropriate tone, vide sufficient context or er information for readers to
derstand the points being de)
X X X X
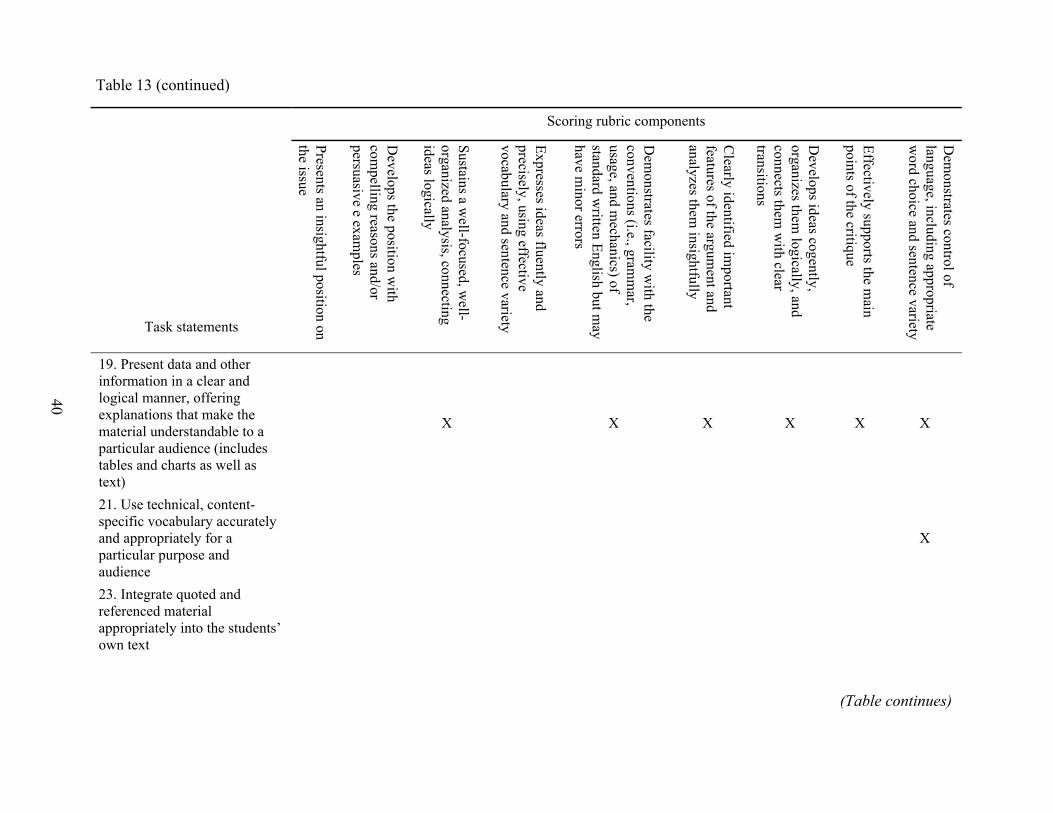
Table
19. Preinformlogicalexplanmateriparticutables text) 21. Usspecifiand apparticuaudien23. Intreferenappropown te
40
13 (continued)
Scoring rubric components
Task statements
Presents an insightful position onthe issue
Develops the position w
ith com
pelling reasons and/or persuasive e exam
ples
Sustains a well-focused, w
ell-organized analysis, connecting ideas logically
Expresses ideas fluently and precisely, using effective vocabulary and sentence variety
Dem
onstrates facility with the
conventions (i.e., gramm
ar, usage, and m
echanics) of standard w
ritten English but may
have minor errors
Clearly identified im
portant features of the argum
ent and analyzes them
insightfully
Develops ideas cogently,
organizes them logically, and
connects them w
ith clear transitions
Effectively supports the main
points of the critique
Dem
onstrates control of language, including appropriate w
ord choice and sentence variety
sent data and other ation in a clear and manner, offering ations that make the al understandable to a lar audience (includes and charts as well as
X X X X X X
e technical, content-c vocabulary accurately propriately for a lar purpose and ce
X
egrate quoted and ced material riately into the students’ xt
(Table continues)

Tabl
24. Capprattribendn26. Dwellusingexam27. Oinfor28. Wtransthe n29. C30. Wconcemp
41
e 13 (continued)
Scoring rubric components
Task statements
Presents an insightful position onthe issue
Develops the position w
ith com
pelling reasons and/or persuasive e exam
ples
Sustains a well-focused, w
ell-organized analysis, connecting ideas logically
Expresses ideas fluently and precisely, using effective vocabulary and sentence variety
Dem
onstrates facility with the
conventions (i.e., gramm
ar, usage, and m
echanics) of standard w
ritten English but may
have minor errors
Clearly identified im
portant features of the argum
ent and analyzes them
insightfully
Develops ideas cogently,
organizes them logically, and
connects them w
ith clear transitions
Effectively supports the main
points of the critique
Dem
onstrates control of language, including appropriate w
ord choice and sentence variety
redit sources opriately (e.g., use ution, footnotes, or otes)
evelop a well-focused, -supported discussion, relevant reasons and ples
X X X
X X X
rganize ideas and mation coherently X X
rite clearly, with smooth itions from one thought to ext
X X X X X
hoose words effectively X Xrite precisely and
isely, avoiding vague or ty phrases
X X
(Table continues)
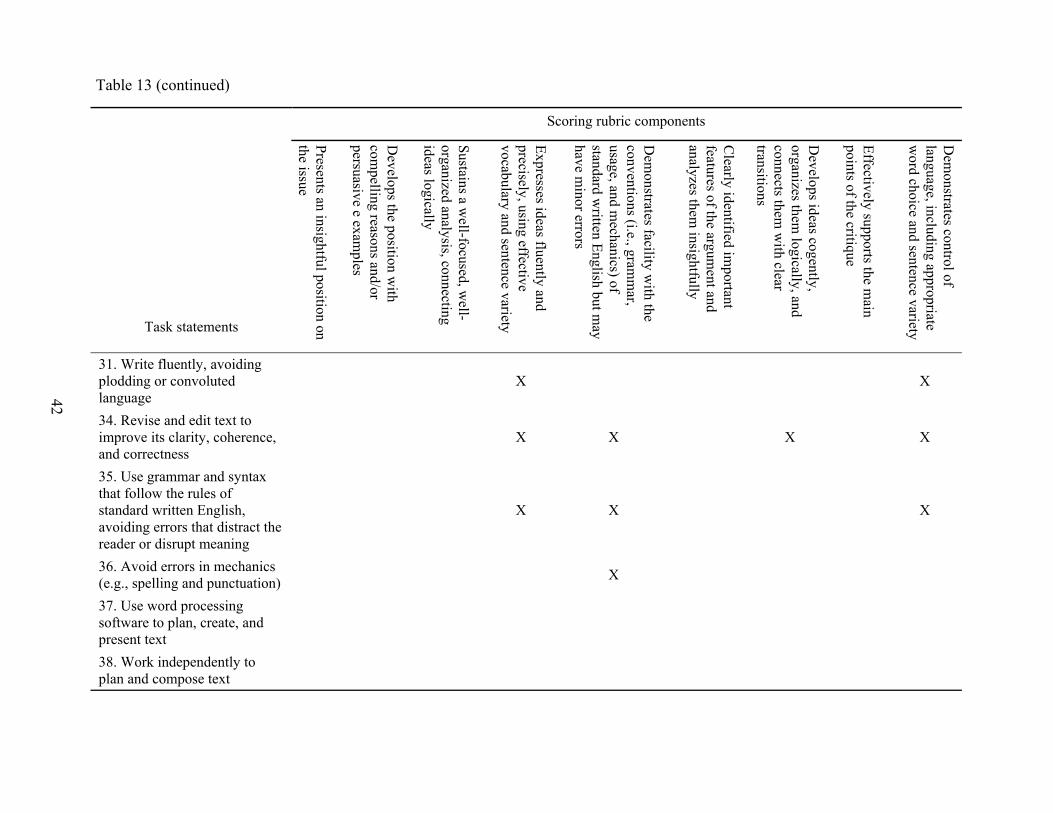
Table 13 (continued)
Scoring rubric components
Task statements
Presents an insightful position onthe issue
Develops the position w
ith com
pelling reasons and/or persuasive e exam
ples
Sustains a well-focused, w
ell-organized analysis, connecting ideas logically
Expresses ideas fluently and precisely, using effective vocabulary and sentence variety
Dem
onstrates facility with the
conventions (i.e., gramm
ar, usage, and m
echanics) of standard w
ritten English but may
have minor errors
Clearly identified im
portant features of the argum
ent and analyzes them
insightfully
Develops ideas cogently,
organizes them logically, and
connects them w
ith clear transitions
Effectively supports the main
points of the critique
Dem
onstrates control of language, including appropriate w
ord choice and sentence variety
31. Write fluently, avoiding plodding or convoluted language
X X
34. Revise and edit text to improve its clarity, coherence, and correctness
X X X X
35. Use grammar and syntax that follow the rules of standard written English, avoiding errors that distract the reader or disrupt meaning
X X X
36. Avoid errors in mechanics (e.g., spelling and punctuation) X
37. Use word processing software to plan, create, and present text 38. Work independently to plan and compose text
42
Discussion
The Standards state that “important validity evidence can be obtained from an analysis of
the relationship between a test’s content and the construct it is intended to measure” (p. 11). The
Standards further state that test content refers, among other things, to themes, format of items,
and procedures regarding test administration and scoring. For the purposes of this study, the
scoring rubric represents the content of the test, and the task statements reflect an operational
definition of the construct of the “writing job” of entering graduate students at both the master’s
and doctoral levels. Evidence based on test content can include logical or empirical analyses of
the relevance of the content domain to the proposed interpretation of test scores. The study
described in this report was designed to provide additional evidence of the content relevance of
GRE analytical writing assessment. It does so by defining a domain of writing tasks important
for competent performance across a range of academic areas and by demonstrating a linkage
between the important writing tasks and the writing skills assessed in the scoring rubrics for the
Issue and Argument tasks in the analytical writing assessment in the GRE General Test. The
discussion is divided into two sections. One addresses the findings obtained for the master’s and
doctoral levels, and the second focuses on the findings obtained at the upper-division
undergraduate level.
The Master’s and Doctoral Levels
The analytical writing section of the GRE General Test was designed for use in
admission decisions for candidates applying to graduate programs across a range of subject
areas. Therefore, this study focused on defining a domain of writing tasks that were important for
competent performance for candidates entering both master’s or doctoral programs across a
range of subject areas.
The Task Domain
The results indicated that faculty teaching in the master’s and doctoral programs judged
36 of the 39 tasks (92%) to be important for competent performance at both the master’s and
doctoral levels. The correlation of mean importance ratings by faculty at the master’s and
doctoral levels was .98, indicating that the profiles of ratings were quite similar. The correlation
of overall mean importance ratings by faculty at minority and nonminority schools was .98 for
the master’s level and .99 for the doctoral level, indicating that the profile of ratings for faculty
43
from minority and nonminority schools were very similar. The absolute level of ratings were also
similar, with mean ratings at the doctoral level being slightly higher than those obtained at the
master’s level. Project staff identified a subset of 29 most important tasks by using a criterion or
standard that required a task to have an overall mean rating of at least very important as well as a
rating of at least important for each of the six subject areas. For a task to be included, it needed
to meet this standard at both the master’s and doctoral levels. These findings indicate that
graduate-level faculty believed the writing domain defined by these tasks was important for
competent performance at both the master’s and doctoral levels.
Linking Study
The GRE analytical writing assessment uses two scoring rubrics, one for the “Present Your
Perspective on an Issue” task and one for the “Analyze an Argument” task. Both rubrics were
created by the GRE Writing Advisory Committee, an interdisciplinary group of faculty who teach
at various types of institutions and come from diverse ethnic and cultural backgrounds. Working
closely with ETS writing assessment specialists, the committee investigated a wide range of
writing tasks and, after extensive pilot testing, determined that these two writing tasks and scoring
criteria assessed skills considered important for success in many fields of graduate study.
Powers and Fowles (1997) discussed studies that provided support for these writing
skills. In a 1993 study involving graduate deans and faculty, 80% of the respondents indicated
they were either somewhat or very satisfied that the Issue task scoring criteria addressed the
writing skills required of first-year graduate students. Furthermore, their perceptions of the
quality of writing in GRE essays corresponded strongly with the scores assigned by trained GRE
readers. Thus, criteria in the GRE Issue scoring guide, as well as the scores themselves, appear to
reflect the values of GRE constituents. Although only the Issue topic was available in 1993, the
results are also likely to be relevant to the Argument task, since there is considerable overlap
between the Issue and Argument scoring guides.
In the current project, the linking study attempted to supplement the evidence presented
in the studies cited above by demonstrating a linkage between the statements in level six (the
highest level) of the scoring rubrics for the Issue and Argument tasks and the writing tasks
judged to be important at both the master’s and doctoral levels. As described earlier, five ETS
writing assessment specialists not involved in the development or scoring of the GRE analytical
writing assessment were asked to rate the importance of each element in the Issue and Argument
44
scoring rubrics to the performance of each of the writing tasks. The results of that linkage for the
29 tasks judged to be important at the master’s and doctoral levels is provided in Table 8. A
mean rating of 4.0 (very important) was used as the minimum criterion for establishing a linkage.
The results indicated that each of the elements of the scoring rubrics was judged to be important
for performing one or more of the 29 important writing tasks. The number of linkages for each
scoring rubric statement to the task statements ranged from 4 (14% of the tasks) to 21 (72%) of
the task statements.
As noted earlier, a direct linkage was not established for 4 of the 29 most important tasks.
From a Standards perspective, it is not necessary that the analytical writing section of the GRE
General Test assess every important task. The skills in the Issue and Argument rubrics were
linked to 25 of 29 (or 86%) of the important task domain. While not assessed directly, 2 of the
tasks (#37, “Use word processing software to plan, create, and present text,” and #38, “Work
independently to plan and compose text”) do reflect how the test is administered. The test is
administered on the computer and test takers respond independently using word processing
software. Moreover, a 3rd task, “Credit sources appropriately,” is not cited in the GRE scoring
rubrics but is required for a valid GRE score. Essays that are determined to be “unusually
similar” to other responses or to other sources, without attribution, are not considered valid
responses. Since credit sources was the most highly rated task, assessment development staff
may wish to consider incorporating a more direct assessment of this task into future versions of
the analytical writing section.
Summary
The findings obtained in this study support the use of the analytical writing section of the
GRE General Test in the admission process for candidates entering master’s- or doctoral-level
graduate programs. The study identified a set of 29 writing task statements that were judged to
be important for competent performance across six subject areas. These judgments were made by
more than 500 graduate faculty members from 27 institutions across the United States. This set
of task statements can be said to describe the common important aspects of the writing job of
entry-level graduate students. The linking study demonstrated the importance of each of the Issue
and Argument scoring rubrics for successful completion of 25 of the 29 important writing tasks.
These results provide evidence to support the content relevance of the scoring procedures and for
45
inferring that scores on the analytical writing section are related to entering graduate students’
ability to perform important writing tasks required for their graduate study.
Upper-Division Undergraduates
The GRE Program has recently received requests from some undergraduate programs
about the possible use of the analytical writing section of the GRE General Test, or some version
of it, as an outcomes measure for upper-division undergraduate students. The Standards indicate
that “the appropriateness of a given content domain is related to the specific inferences to be
made from test scores. Thus, when considering an available test for a purpose other than that for
which it was first developed, it is especially important to evaluate the appropriateness of the
original content domain for the proposed new use.” One purpose of this study was to gather data
to determine if the use of the analytical writing measure as an outcomes measure at the upper-
division undergraduate level was supportable. The findings are discussed below.
The Task Domain
The results indicated that 33 of the 39 task statements (85%) were judged by more than
700 faculty members to be important for upper-division undergraduate students to be able to
perform competently. The correlation of mean importance ratings by faculty from minority and
nonminority schools was .99, indicating that the profiles of ratings were very similar. The overall
mean ratings for upper-division undergraduates were correlated with the mean ratings obtained at
the master’s and doctoral levels. The correlations were .98 and .93, respectively. Although the
profile of ratings were similar to those obtained at the master’s and doctoral levels, the absolute
level of ratings was slightly lower. Project staff identified 22 tasks that formed the subset of most
important tasks by using the same criterion or standard that was used at the graduate level. A task
was required to have an overall mean rating of at least very important and a rating of at least
important for each of the six subject areas. Twenty-two tasks met this standard, indicating that
writing tasks were also judged to be important for competent performance for upper-division
undergraduates. All 22 of these tasks were included in the set of 29 that met the same standard at
the master’s and doctoral levels. These findings indicate that a substantial portion of the task
domain (76%) defined as being most important at the graduate levels was also judged to be
important at the upper-division undergraduate level.
46
The Linking Study
The results of the linking study described above were analyzed separately for the 22 tasks
that met the importance criterion for upper-division undergraduate students. Those results are
presented in Table 13. The same standard (a mean rating of 4.0, very important) was used to
establish a linkage. The results indicated that each element in the scoring rubrics was judged to
be very important for performing one or more of the 22 task statements. The number of linkages
for each scoring rubric statement ranged from 1 (5%) to 15 (68%) of the task statements.
Linkages occurred for 18 of the 22 task statements (82%). The scoring rubrics for the Issue and
Argument tasks were linked to a substantial portion of the writing task domain judged to be
important for upper-division undergraduates. The tasks that did not link are described in an
earlier section of this report.
Summary
The findings obtained in this portion of the study indicate that substantial portions of the
writing task domain are similar for both the undergraduate and graduate levels. The study
identified a set of 22 writing task statements that were judged to be important for competent
performance at the upper-division undergraduate level by more than 700 graduate faculty
members from 30 institutions across the United States. This set of task statements can be said to
describe the common important elements of the writing job of students at the upper-division
undergraduate level. The linking study demonstrated the importance of each element of the Issue
and Argument scoring rubrics to the successful completion of the 22 tasks. It should be noted,
however, that these scoring rubrics have not yet been reviewed and approved by undergraduate
faculty for use at the upper-division undergraduate level. Additional data are necessary to fully
support its use at the upper-division undergraduate level.
Summary and Conclusions
Summary
The primary purposes of this project were to:
1. Augment the validity evidence available to support the use of the analytical writing
section of the GRE General Test for admission into graduate school at both the master’s
and doctoral levels by documenting the content relevance of the writing skills assessed in
that section of the examination
47
2. Gather data that can be used to assess whether or not the analytical writing section is
appropriate for use as an outcomes measure for upper-division undergraduate students in
colleges and universities across the United States.
To accomplish these purposes, task statements were developed to define writing tasks
that were important for competent performance across a range of subject areas. A survey
instrument was developed that contained 36 task statements that were believed to be important
across a range of academic areas. An additional 3 task statements were included as a check on
the accuracy of the ratings; they were expected to be appropriate for English classes but less so
for those in the social and physical sciences. The survey instrument contained 39 task statements,
three rating scales, and a background information section. A separate importance rating scale
was included for faculty teaching upper-division undergraduates, another for faculty teaching
entering master’s-level students, and a third for faculty teaching entering doctoral-level students.
The survey instrument was administered in 30 colleges and universities across the United States
in six subject areas: education, engineering, English, life sciences, physical sciences, and
psychology. There were more than 800 respondents to the survey. After analyzing data by
educational level and by subject area within each level, project staff identified task statements
that were very important for competent performance at each educational level and were
important within levels for each of the six subject areas. A linking study was conducted with
writing assessment specialists to determine if the writing skills assessed in the scoring rubrics for
the Issue and Argument tasks composing the analytical writing section of the GRE General Test
could be linked to the important task statements.
As noted in the introduction to this report, the study was designed to answer six research
questions. The answers to those questions can be summarized as follows:
• Thirty-six of the 39 writing task statements were judged to be very important for
competent performance at the master’s and doctoral levels. The only tasks that were not
rated as being very important were the 3 writing tasks included as a reality check. That is,
they were expected to be much more relevant for English classes than for the social and
physical sciences. Of the 36 tasks judged to be very important, 29 (81%) were judged to
be important by each of the six subject areas at both the master’s and doctoral levels.
48
• Thirty-three of the 39 task statements were judged to be very important for competent
performance for upper-division undergraduates. Of these 33 tasks, 22 (56%) were judged
to be important by each of the six subject areas at the upper-division undergraduate level.
All 22 task statements were included within the 29 task statements judged to be important
at the graduate levels discussed above.
• A linking study established a direct connection between each skill assessed as part of the
GRE Issue and Argument scoring rubrics and one or more of the writing tasks identified
as important at both the graduate and upper-division undergraduate levels.
Conclusions
Overall, this study provides supplemental validity evidence to support the use of the GRE
analytical writing section of the General Test in the admission process to master’s and doctoral
programs. It also provides preliminary data to support its use as a possible outcomes measure for
upper-division undergraduate students because there was substantial overlap in the performance
domain of important writing tasks at the graduate and upper-division undergraduate levels. In
addition, the writing skills evaluated in the GRE scoring rubrics for the Issue and Argument
writing tasks were all linked to one or more writing task statements judged to be important at the
upper-division undergraduate level. However, additional data are necessary to fully support its
use at the upper-division undergraduate level. Specific conclusions are listed below.
1. Writing was judged by graduate faculty to be important for competent performance in a
wide variety of academic areas at the master’s and doctoral levels. The results were
similar for both minority and nonminority schools.
2. The results support the use of the analytical writing section of the GRE General Test in
the admissions process for candidates entering master’s- or doctoral-level graduate
programs. The study identified a set of 29 writing task statements that were judged by
more than 500 graduate faculty members from 27 institutions to be important for
competent performance both within and across six varied subject areas. This set of task
statements can be said to describe common important aspects of the writing job of
students at the graduate level. The study also demonstrated the importance of each of the
writing skills listed in the scoring rubrics of the Issue and Argument tasks for successful
49
completion of 86% of the writing tasks in the important writing domain identified in this
study. These results provide evidence to support the content relevance of the GRE
scoring criteria and provide support for inferring that GRE analytical writing scores are
related to entering graduate students’ ability to perform the writing tasks important for
their graduate study.
3. Writing was judged by undergraduate faculty to be important for competent performance
in a variety of subject areas for upper-division undergraduate level students. This was
true at both minority and nonminority schools.
4. Substantial portions of the writing task domain defined in this study were important for
both the undergraduate and graduate levels. However, the way in which the GRE assesses
that domain has not yet been reviewed and approved by undergraduate faculty. To be
consistent with the Standards, this activity should occur before the GRE analytical
writing assessment could be used as an outcomes measure for upper-division level
undergraduates.
A set of 22 writing task statements were judged to be important for competent
performance at the upper-division undergraduate level by more than 700 faculty members from
30 institutions across the United States. This set of task statements can be said to describe the
common important aspects of the writing job of students at the upper-division undergraduate
level. All 22 important writing task statements were included within the 29 writing task
statements judged to be important at the master’s and doctoral level, indicating a substantial
overlap (76%) in the writing task domain.
The linking study demonstrated the importance of each writing skill in the scoring rubrics
of the GRE Issue and Argument tasks for successful completion of 18 of the 22 (82%) writing
tasks identified as being important at the upper-division undergraduate level. While the task
domain has substantial overlap with the important task domain identified at the graduate levels,
and although the writing skills assessed in the Issue and Argument scoring rubrics all link to one
or more tasks judged to be important at the upper-division undergraduate level, the scoring
rubrics have not yet been reviewed or approved for use at that level by undergraduate faculty.
Project staff members believe that in order to be responsive to the Standards, undergraduate
faculty should review and approve as appropriate the GRE directions, the Issue and Argument
50

tasks and scoring guides, and the sample responses. If the results were positive, they would
provide support for inferring that scores on the analytical writing section are related to upper-
division undergraduate-level students’ ability to perform the important writing tasks required at
their level. If the scoring rubrics were changed, an additional linking study would need to be
conducted to demonstrate the content relevance of the revised scoring rubrics.
51
References
American Educational Research Association, American Psychological Association, & National
Council on Measurement in Education. (1999). Standards for educational and
psychological testing. Washington, DC: American Psychological Association.
Bridgeman, B., & Carlson, S. (1983). Survey of academic writing tasks required of graduate and
undergraduate foreign students (TOEFL Rep. No. 15). Princeton, NJ: ETS.
Carnegie Foundation for the Advancement of Teaching. (2000). The Carnegie classification of
institutions of higher education. Menlo Park, CA: Author.
Earned doctorates. (2001, November 30). The Chronicle of Higher Education, p. A11.
Enright, M. E., & Powers, D. E. (1986). Validating the GRE analytical ability measure against
faculty ratings of analytical reasoning skills (GRE Board Professional Rep. No. 86-06P;
ETS RR-90-22). Princeton, NJ: ETS.
Epstein, M. H. (1999). Teaching field-specific writing: Results of a WAC survey. Business
Communication Quarterly, 62(1), 29-41.
Gael, S. (1983). Job analysis: A guide to assessing work activities. San Francisco: Jossey-Bass.
ETS. (2003). An introduction to the analytical writing section of the GRE General Test.
Princeton, NJ: Author.
Hale, G., Taylor, C., Bridgeman, B., Carson, J., Kroll, B., & Kantor, R. (1996). A study of
writing tasks assigned in academic degree programs (TOEFL Rep. No. 54). Princeton,
NJ: Educational Testing Service.
Kovac, J., & Sherwood, D. W. (1999, October). Writing in chemistry: An effective learning tool.
Journal of Chemical Education, 76(10), 1399-1403.
Messick, S. (1989). Validity. In R. L. Linn (Ed.), Educational measurement (pp. 13-103). New
York: Macmillan.
Powers, D. E., Burstein, J. C., Chodorow, M., Fowles, M. E., & Kukich, K. (2000). Comparing
the validity of automated and human essay scoring (ETS RR-00-10). Princeton, NJ: ETS.
Powers, D. E., & Fowles, M. E. (1997). Correlates of satisfaction with graduate school
applicants’ performance on the GRE writing measure (ETS RR-96-24). Princeton, NJ:
ETS.
Powers, D. E., & Fowles, M. E. (2000). Likely impact of the GRE writing assessment on
graduate admissions decisions (ETS RR-00-16). Princeton, NJ: ETS.
52
Powers, D. E., Fowles, M. E., & Welsh, C. K. (1999). Further validation of a writing assessment
for graduate admissions (ETS RR-99-18). Princeton, NJ: ETS.
Rice, R. E. (1998, February). “Scientific writing” – A course to improve the writing of science
students. Journal of College Science Teaching, 27(4), 267-272.
Rosenfeld, M., Wilson, S., & Oltman, P. K. (2001). Reading, writing, speaking, and listening
tasks important for success at graduate and undergraduate levels (TOEFL Monograph
Series No. MS-21). Princeton, NJ: ETS.
Schaeffer, G. A., Briel, J. B., & Fowles, M. E. (2001, April). Psychometric evaluation of the new
GRE writing assessment (GRE Board Rep. No. 96-11). Princeton, NJ: ETS.
Wallner, A. S., & Latosi-Wawin, E. (1999, October). Technical writing and communication in a
senior-level chemistry seminar. Journal of Chemical Education, 76(10), 1404-1406.
Webster’s third new international dictionary of the English language, unabridged. (2002).
Springfield, MA: Merriam-Webster.
53
List of Appendixes
Page
A - Advisory Committee Members ..................................................................................... 55
B - Steering Committee....................................................................................................... 56
C - Survey Instrument ......................................................................................................... 57
D - Linkages of Scoring Rubric Components to Important Task Statements ..................... 62
E - Background Information of Respondents, Overall and by Department........................ 73
F - Mean Importance Ratings on Bio Data Question 2 For HBCU, HSI, and Four-Year
Institutions..................................................................................................................... 77
G - Mean Ratings, Standard Deviations, and Standard Errors for Master’s-Level Students,
Overall and by Department ........................................................................................... 78
H - Mean Ratings, Standard Deviations, and Standard Errors for Doctoral-Level Students,
Overall and by Department ........................................................................................... 81
I - Mean Ratings for Doctoral-Level Students, Overall and by Department ..................... 86
J - Mean Ratings for Upper-Division Undergraduate Students, Overall and by Department
....................................................................................................................................... 89
54
Appendix A
Advisory Committee Members
Amanda Espinosa-Aguilar
Assistant Professor of English
Washington State University
Keith Hjortshoj
Senior Lecturer and Director of Writing in the Disciplines
Knight Institute for Writing in the Disciplines
Cornell University
Jeffrey Kovac
Professor of Chemistry
University of Tennessee
Teresa Redd
Professor of English
Howard University
Art Young
Professor of English and Professor of Engineering
Clemson University
55

Appendix B
Steering Committee
Hunter Breland
Principal Research Scientist
Jacqueline Briel
Program Administrator
Donald Powers
Principal Research Scientist
Kathleen O’Neill
Program Administrator
56
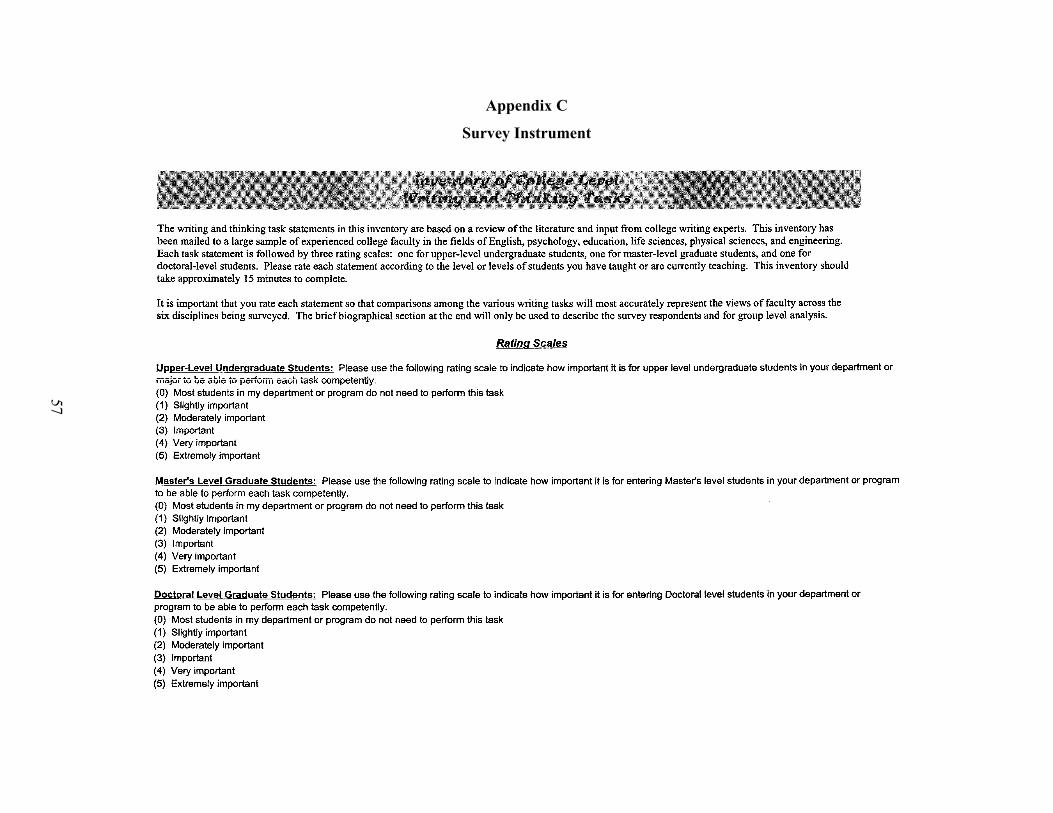
Appendix C
Survey Instrument
57
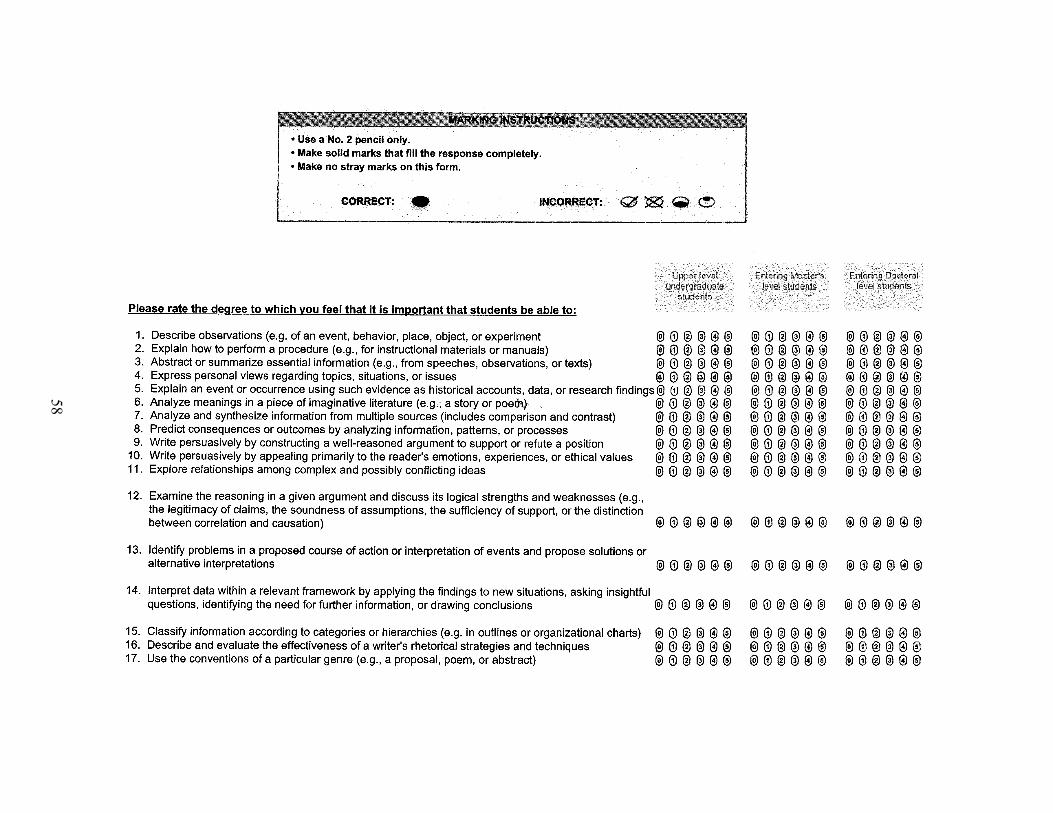
58
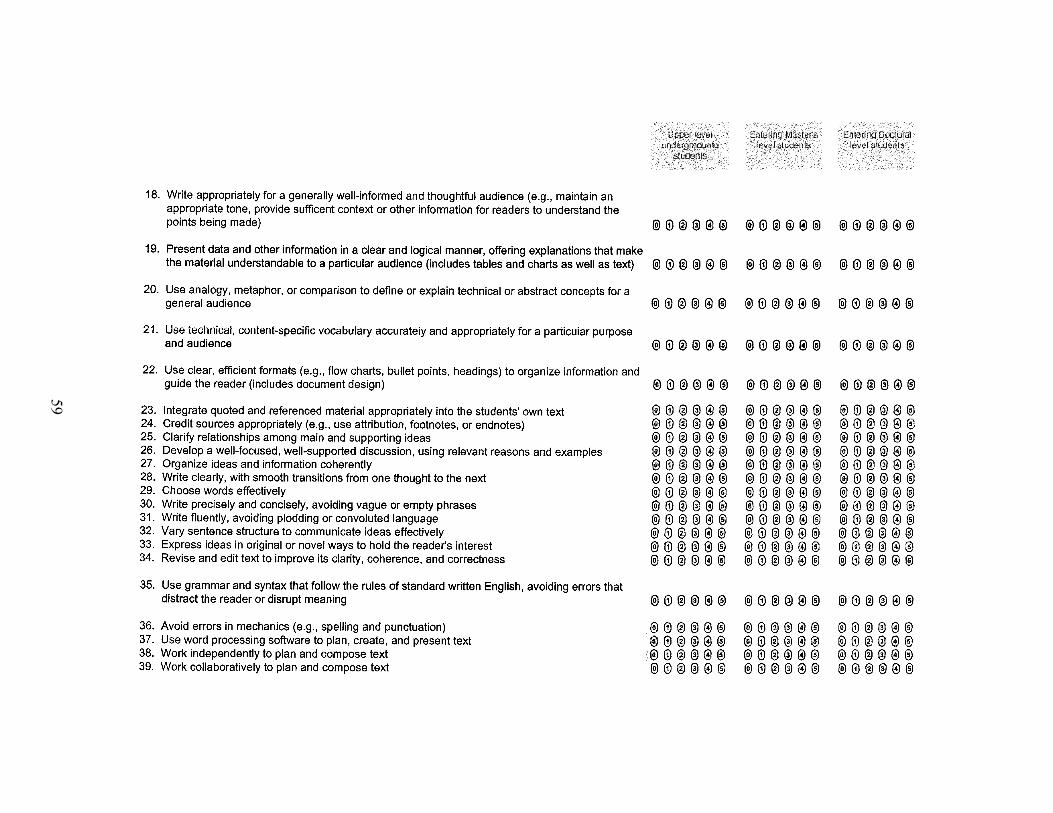
59
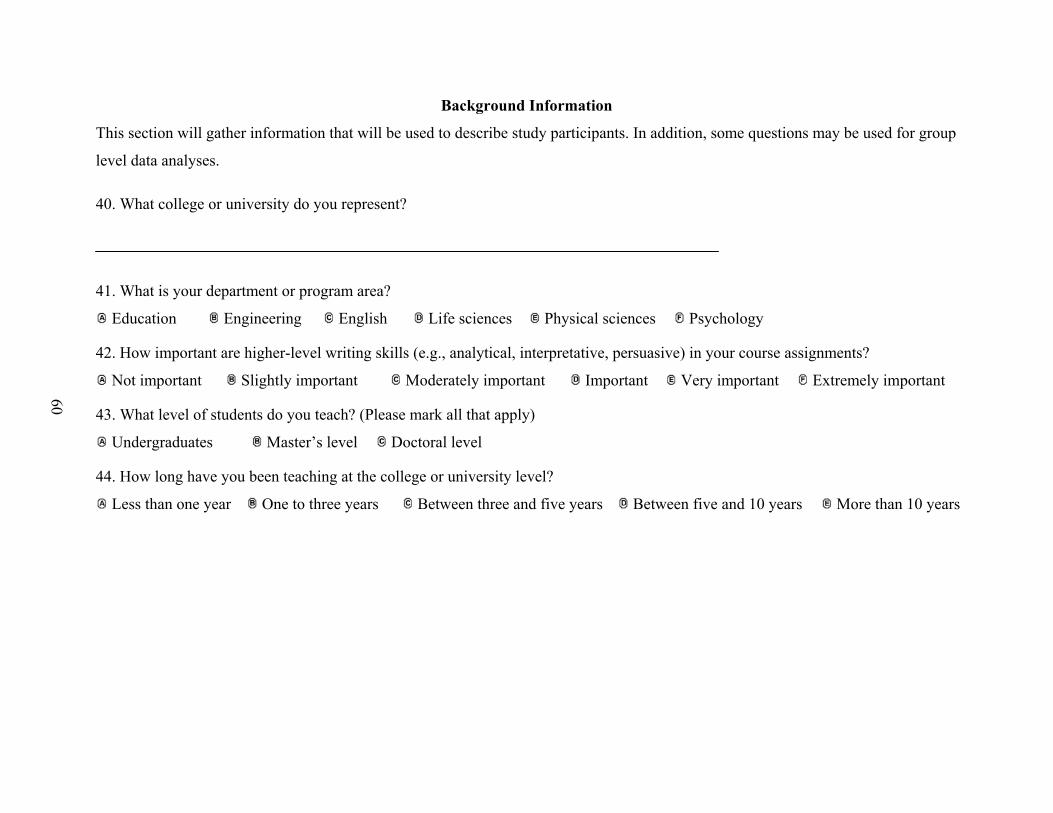
Background Information
This section will gather information that will be used to describe study participants. In addition, some questions may be used for group
level data analyses.
40. What college or university do you represent?
41. What is your department or program area?
Education Engineering English Life sciences Physical sciences Psychology
42. How important are higher-level writing skills (e.g., analytical, interpretative, persuasive) in your course assignments?
Not important Slightly important Moderately important Important Very important Extremely important
60
43. What level of students do you teach? (Please mark all that apply)
Undergraduates Master’s level Doctoral level
44. How long have you been teaching at the college or university level?
Less than one year One to three years Between three and five years Between five and 10 years More than 10 years
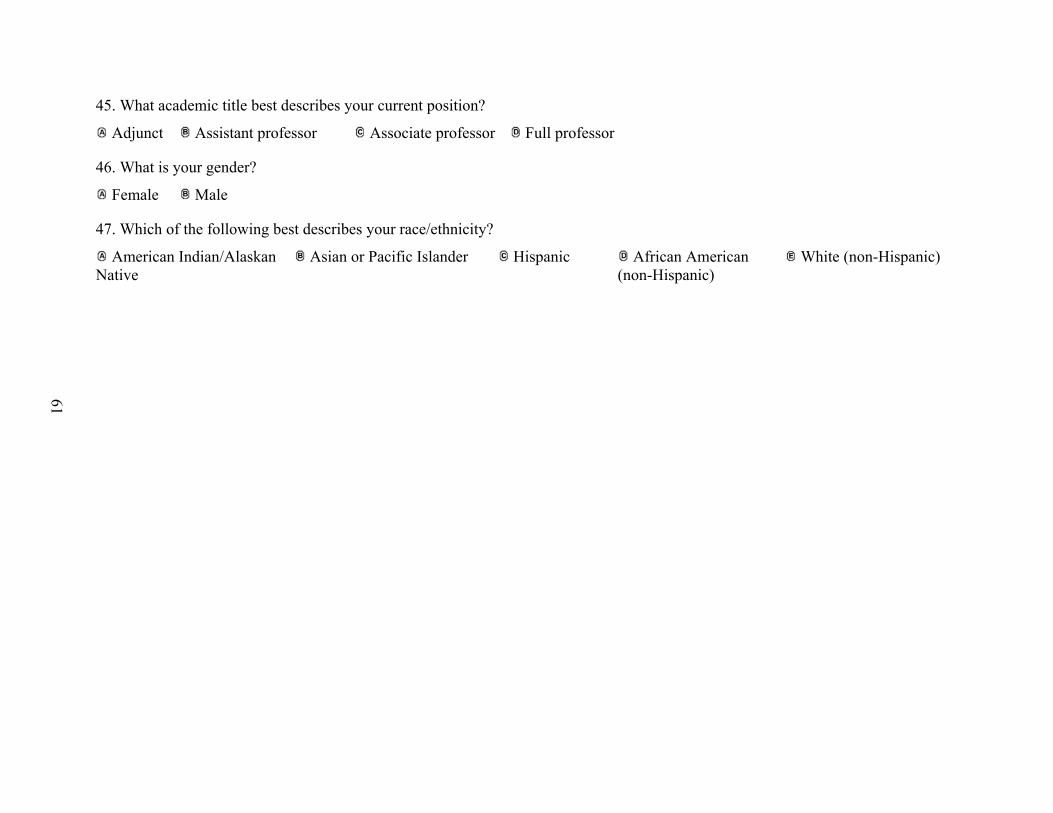
45. What academic title best describes your current position?
Adjunct Assistant professor Associate professor Full professor
46. What is your gender?
Female Male
47. Which of the following best describes your race/ethnicity?
American Indian/Alaskan Native
Asian or Pacific Islander Hispanic African American (non-Hispanic)
White (non-Hispanic)
61

Tab
Task
Tas
1
1
1
62
Appendix D
Linkages of Scoring Rubric Components to Important Task Statements
le D1
Statements
k # Task statement
1 Describe observations (e.g., of an event, behavior, place, object, or experiment)
2 Explain how to perform a procedure (e.g., for instructional materials or manuals)
3 Abstract or summarize essential information (e.g., from speeches, observations, or texts)
4 Express personal views regarding topics, situations, or issues
5 Explain an event or occurrence using such evidence as historical accounts, data, or research findings
6 Analyze meanings in a piece of imaginative literature (e.g., a story or poem)
7 Analyze and synthesize information from multiple sources (includes comparison and contrast)
8 Predict consequences or outcomes by analyzing information, patterns, or processes
9 Write persuasively by constructing a well-reasoned argument to support or refute a position
0 Write persuasively by appealing primarily to the reader’s emotions, experiences, or ethical values
1 Explore relationships among complex and possibly conflicting ideas
2 Examine the reasoning in a given argument and discuss its logical strengths and weaknesses (e.g., the legitimacy of claims, the soundness of assumptions, the sufficiency of support, or the distinction between correlation and causation)

Table D1 (continued)
Task # Task statement
63
13 Identify problems in a proposed course of action or interpretation of events and propose solutions or alteinterpretations
14 Interpret data within a relevant framework by applying the findings to new situations, asking insightful qidentifying the need for further information, or drawing conclusions
15 Classify information according to categories or hierarchies (e.g., in outlines or organizational charts)
16 Describe and evaluate the effectiveness of a writer’s rhetorical strategies and techniques
17 Use the conventions of a particular genre (e.g., a proposal, poem, or abstract)
18 Write appropriately for a generally well-informed and thoughtful audience (e.g., maintain an appropriatesufficient context or other information for readers to understand the points being made)
19 Present data and other information in a clear and logical manner, offering explanations that make the maunderstandable to a particular audience (includes tables and charts as well as text)
20 Use analogy, metaphor, or comparison to define or explain technical or abstract concepts for a general au
21 Use technical, content-specific vocabulary accurately and appropriately for a particular purpose and audi
22 Use clear, efficient formats (e.g., flow charts, bullet points, headings) to organize information and guide document design)
23 Integrate quoted and referenced material appropriately into the students’ own text
24 Credit sources appropriately (e.g., use attribution, footnotes, or endnotes)
25 Clarify relationships among main and supporting ideas
26 Develop a well-focused, well-supported discussion, using relevant reasons and examples
27 Organize ideas and information coherently
rnative
uestions,
tone, provide
terial
dience
ence
the reader (includes
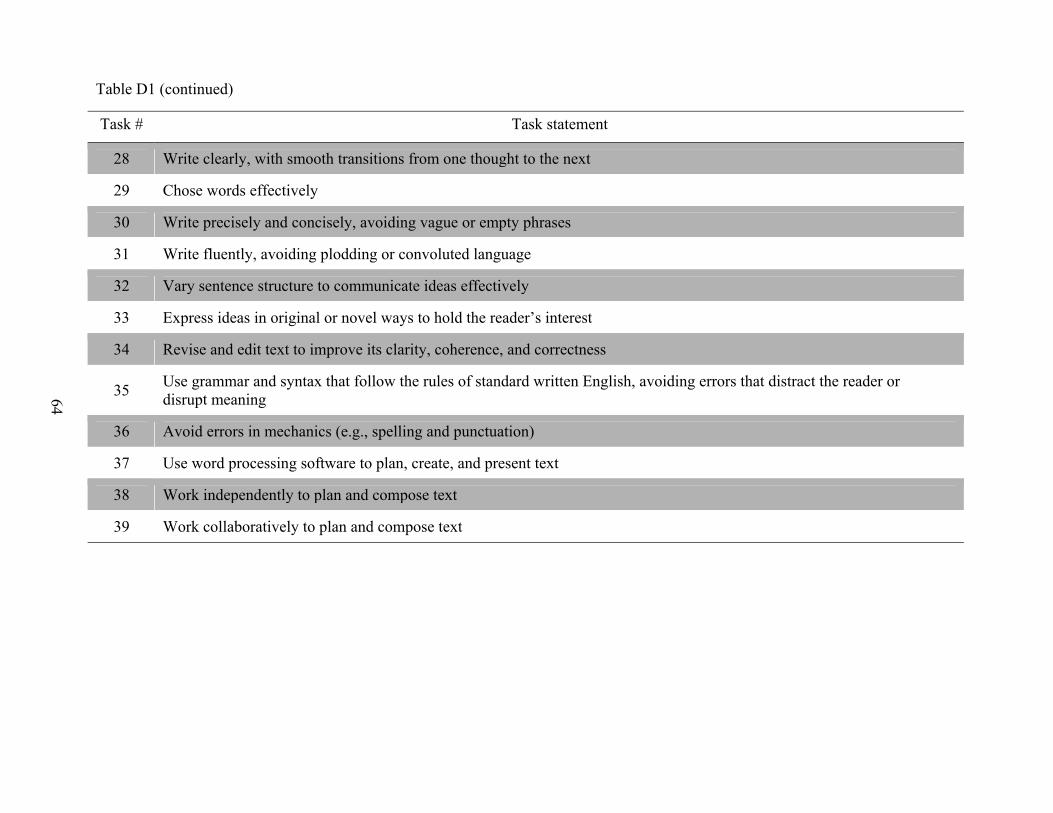
Table D1 (continued)
Task # Task statement
64
28 Write clearly, with smooth transitions from one thought to the next
29 Chose words effectively
30 Write precisely and concisely, avoiding vague or empty phrases
31 Write fluently, avoiding plodding or convoluted language
32 Vary sentence structure to communicate ideas effectively
33 Express ideas in original or novel ways to hold the reader’s interest
34 Revise and edit text to improve its clarity, coherence, and correctness
35 Use grammar and syntax that follow the rules of standard written English, avoiding errors that distract the reader or disrupt meaning
36 Avoid errors in mechanics (e.g., spelling and punctuation)
37 Use word processing software to plan, create, and present text
38 Work independently to plan and compose text
39 Work collaboratively to plan and compose text
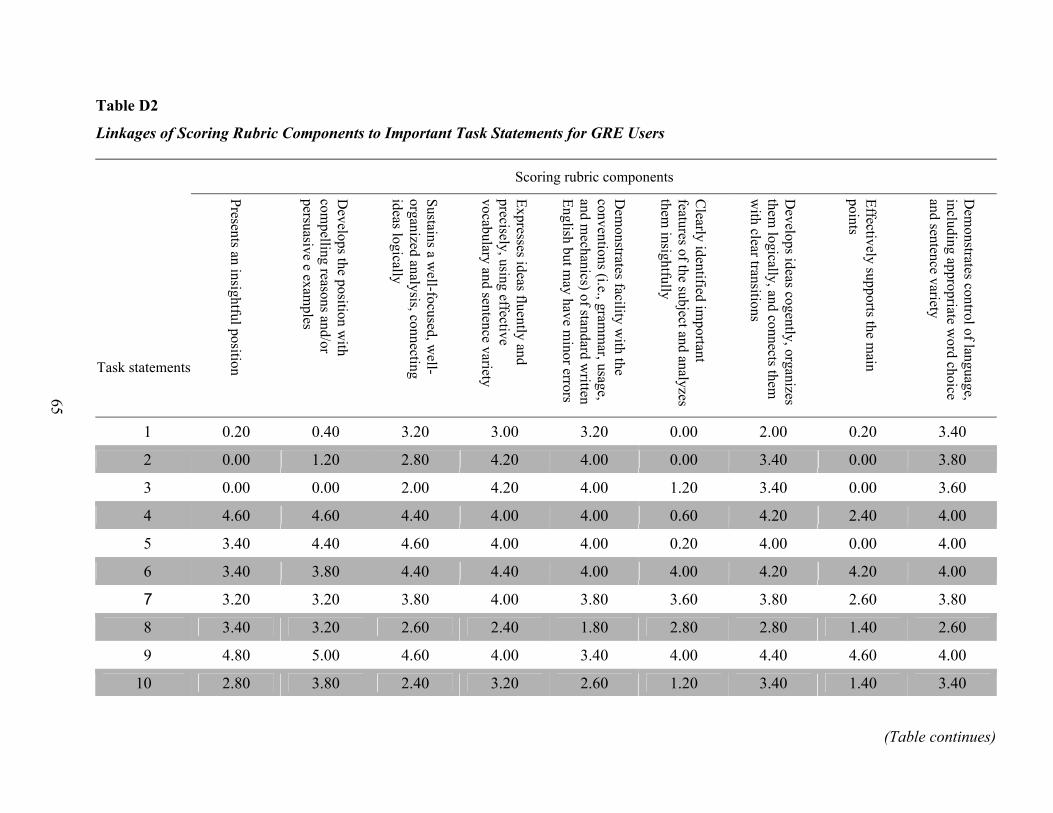
T
L
T
65
able D2
inkages of Scoring Rubric Components to Important Task Statements for GRE Users
Scoring rubric components
ask statements
Presents an insightful position
Develops the position w
ith com
pelling reasons and/or persuasive e exam
ples
Sustains a well-focused, w
ell-organized analysis, connecting ideas logically
Expresses ideas fluently and precisely, using effective vocabulary and sentence variety
Dem
onstrates facility with the
conventions (i.e., gramm
ar, usage, and m
echanics) of standard written
English but may have m
inor errors
Clearly identified im
portant features of the subject and analyzes them
insightfully
Develops ideas cogently, organizes
them logically, and connects them
w
ith clear transitions
Effectively supports the main
points
Dem
onstrates control of language, including appropriate w
ord choice and sentence variety
1 0.20 0.40 3.20 3.00 3.20 0.00 2.00 0.20 3.40
2 0.00 1.20 2.80 4.20 4.00 0.00 3.40 0.00 3.80
3 0.00 0.00 2.00 4.20 4.00 1.20 3.40 0.00 3.60
4 4.60 4.60 4.40 4.00 4.00 0.60 4.20 2.40 4.00
5 3.40 4.40 4.60 4.00 4.00 0.20 4.00 0.00 4.00
6 3.40 3.80 4.40 4.40 4.00 4.00 4.20 4.20 4.00
7 3.20 3.20 3.80 4.00 3.80 3.60 3.80 2.60 3.80
8 3.40 3.20 2.60 2.40 1.80 2.80 2.80 1.40 2.60
9 4.80 5.00 4.60 4.00 3.40 4.00 4.40 4.60 4.00
10 2.80 3.80 2.40 3.20 2.60 1.20 3.40 1.40 3.40
(Table continues)

T
T
66
able D2 (continued)
Scoring rubric components
ask statements
Presents an insightful position
Develops the position w
ith com
pelling reasons and/or persuasive e exam
ples
Sustains a well-focused, w
ell-organized analysis, connecting ideas logically
Expresses ideas fluently and precisely, using effective vocabulary and sentence variety
Dem
onstrates facility with the
conventions (i.e., gramm
ar, usage, and m
echanics) of standard written
English but may have m
inor errors
Clearly identified im
portant features of the subject and analyzes them
insightfully
Develops ideas cogently, organizes
them logically, and connects them
w
ith clear transitions
Effectively supports the main
points
Dem
onstrates control of language, including appropriate w
ord choice and sentence variety
11 2.80 3.00 4.20 3.40 1.40 4.00 4.40 1.80 2.40
12 3.20 3.60 3.20 3.00 2.00 5.00 4.40 3.00 2.00
13 4.20 3.00 2.80 2.60 1.00 4.40 3.40 3.40 1.40
14 3.00 2.20 3.20 2.60 1.00 4.00 2.60 2.40 1.40
15 0.60 0.80 2.20 2.20 0.80 2.20 2.00 1.00 1.00
16 2.00 3.20 2.60 3.80 1.80 3.00 3.40 3.40 2.40
17 0.60 0.40 0.40 2.00 2.00 0.20 0.80 0.20 1.80
18 4.20 4.20 3.00 4.20 3.80 1.20 4.00 1.80 3.80
19 1.20 3.40 3.80 3.20 3.40 2.00 4.40 1.80 4.60
20 1.00 1.60 1.40 2.80 2.20 0.80 2.40 1.00 2.60
21 0.20 0.20 0.20 2.60 2.20 0.20 1.40 0.60 4.00
22 0.20 0.40 1.00 2.00 1.00 0.20 2.40 1.20 1.00
(T bl i )
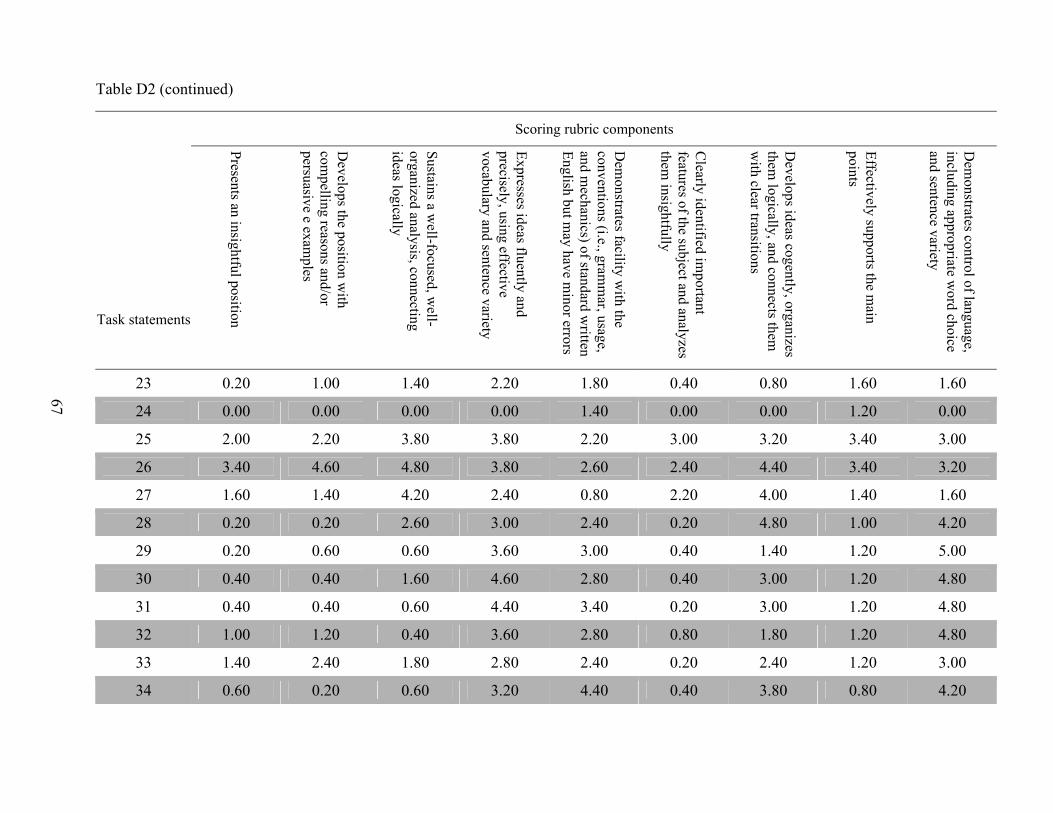
T
T
67
able D2 (continued)
Scoring rubric components
ask statements
Presents an insightful position
Develops the position w
ith com
pelling reasons and/or persuasive e exam
ples
Sustains a well-focused, w
ell-organized analysis, connecting ideas logically
Expresses ideas fluently and precisely, using effective vocabulary and sentence variety
Dem
onstrates facility with the
conventions (i.e., gramm
ar, usage, and m
echanics) of standard written
English but may have m
inor errors
Clearly identified im
portant features of the subject and analyzes them
insightfully
Develops ideas cogently, organizes
them logically, and connects them
w
ith clear transitions
Effectively supports the main
points
Dem
onstrates control of language, including appropriate w
ord choice and sentence variety
23 0.20 1.00 1.40 2.20 1.80 0.40 0.80 1.60 1.60
24 0.00 0.00 0.00 0.00 1.40 0.00 0.00 1.20 0.00
25 2.00 2.20 3.80 3.80 2.20 3.00 3.20 3.40 3.00
26 3.40 4.60 4.80 3.80 2.60 2.40 4.40 3.40 3.20
27 1.60 1.40 4.20 2.40 0.80 2.20 4.00 1.40 1.60
28 0.20 0.20 2.60 3.00 2.40 0.20 4.80 1.00 4.20
29 0.20 0.60 0.60 3.60 3.00 0.40 1.40 1.20 5.00
30 0.40 0.40 1.60 4.60 2.80 0.40 3.00 1.20 4.80
31 0.40 0.40 0.60 4.40 3.40 0.20 3.00 1.20 4.80
32 1.00 1.20 0.40 3.60 2.80 0.80 1.80 1.20 4.80
33 1.40 2.40 1.80 2.80 2.40 0.20 2.40 1.20 3.00
34 0.60 0.20 0.60 3.20 4.40 0.40 3.80 0.80 4.20
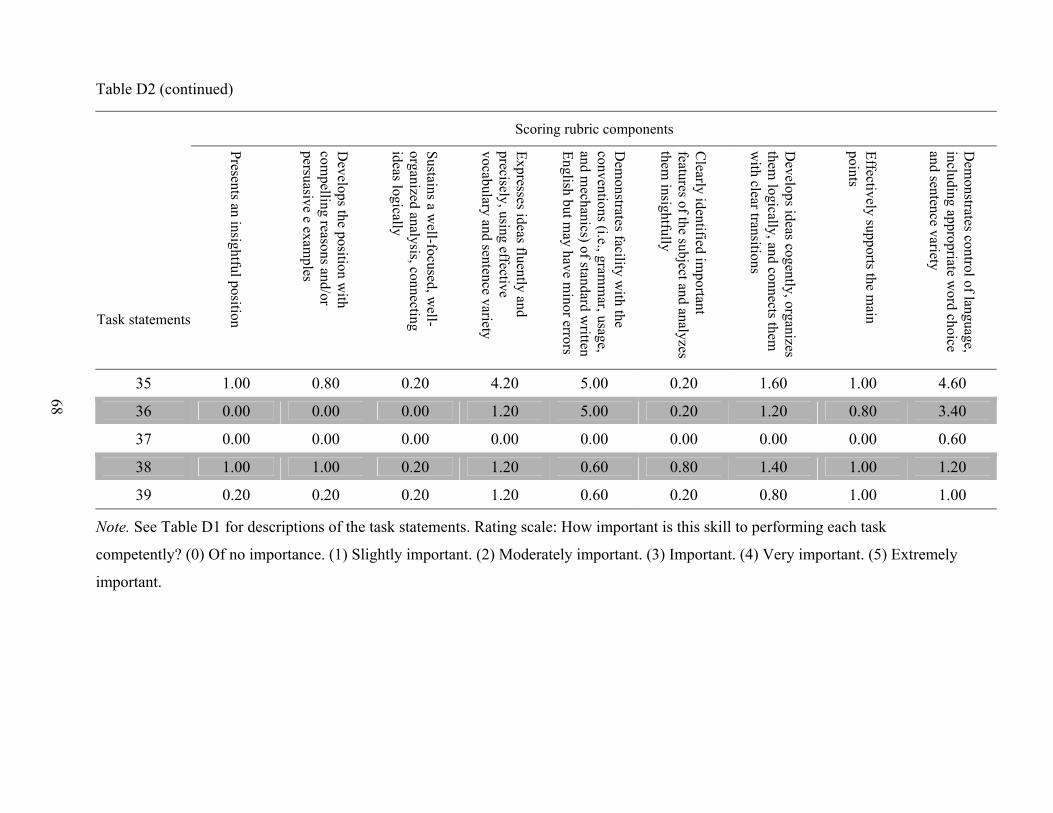
Table D2 (continued)
Scoring rubric components
Task statements
Presents an insightful position
Develops the position w
ith com
pelling reasons and/or persuasive e exam
ples
Sustains a well-focused, w
ell-organized analysis, connecting ideas logically
Expresses ideas fluently and precisely, using effective vocabulary and sentence variety
Dem
onstrates facility with the
conventions (i.e., gramm
ar, usage, and m
echanics) of standard written
English but may have m
inor errors
Clearly identified im
portant features of the subject and analyzes them
insightfully
Develops ideas cogently, organizes
them logically, and connects them
w
ith clear transitions
Effectively supports the main
points
Dem
onstrates control of language, including appropriate w
ord choice and sentence variety
35 1.00 0.80 0.20 4.20 5.00 0.20 1.60 1.00 4.60
36 0.00 0.00 0.00 1.20 5.00 0.20 1.20 0.80 3.40
37 0.00 0.00 0.00 0.00 0.00 0.00 0.00 0.00 0.60
38 1.00 1.00 0.20 1.20 0.60 0.80 1.40 1.00 1.20
39 0.20 0.20 0.20 1.20 0.60 0.20 0.80 1.00 1.00
68
Note. See Table D1 for descriptions of the task statements. Rating scale: How important is this skill to performing each task
competently? (0) Of no importance. (1) Slightly important. (2) Moderately important. (3) Important. (4) Very important. (5) Extremely
important.
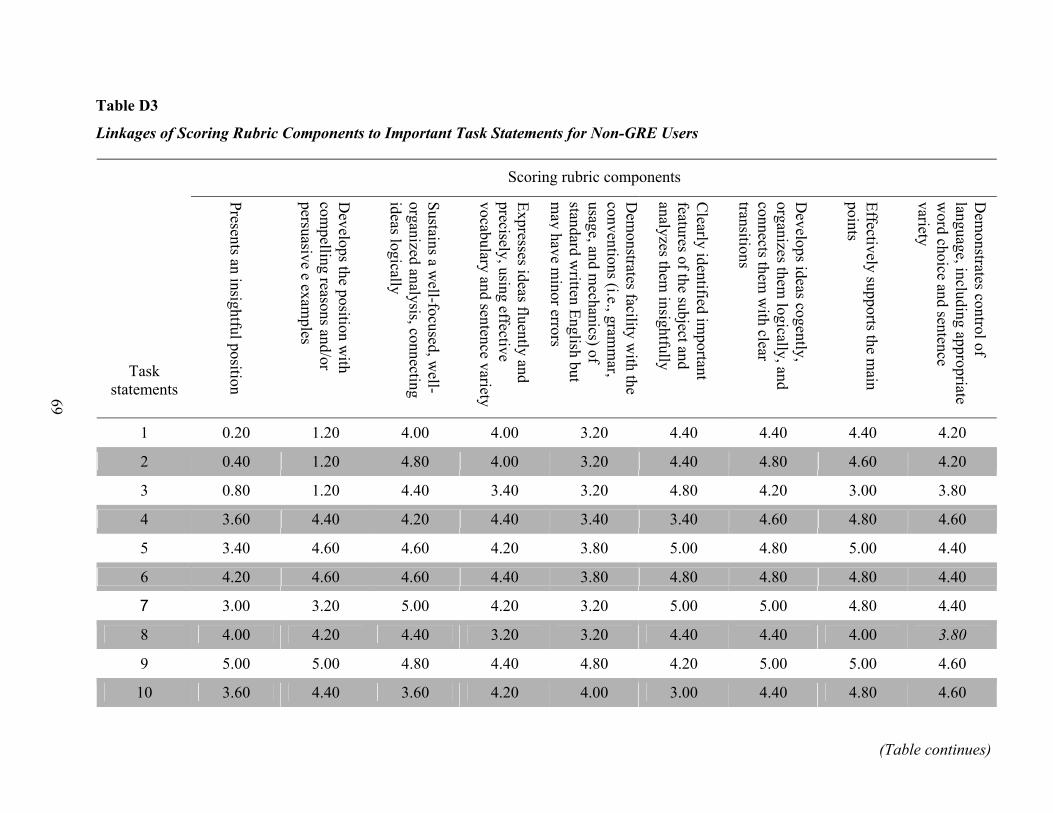
69
Table D3
Linkages of Scoring Rubric Components to Important Task Statements for Non-GRE Users
Scoring rubric components
Task statements
Presents an insightful position
Develops the position w
ith com
pelling reasons and/or persuasive e exam
ples
Sustains a well-focused, w
ell-organized analysis, connecting ideas logically
Expresses ideas fluently and precisely, using effective vocabulary and sentence variety
Dem
onstrates facility with the
conventions (i.e., gramm
ar, usage, and m
echanics) of standard w
ritten English but m
ay have minor errors
Clearly identified im
portant features of the subject and analyzes them
insightfully
Develops ideas cogently,
organizes them logically, and
connects them w
ith clear transitions
Effectively supports the main
points
Dem
onstrates control of language, including appropriate w
ord choice and sentence variety
1 0.20 1.20 4.00 4.00 3.20 4.40 4.40 4.40 4.20
2 0.40 1.20 4.80 4.00 3.20 4.40 4.80 4.60 4.20
3 0.80 1.20 4.40 3.40 3.20 4.80 4.20 3.00 3.80
4 3.60 4.40 4.20 4.40 3.40 3.40 4.60 4.80 4.60
5 3.40 4.60 4.60 4.20 3.80 5.00 4.80 5.00 4.40
6 4.20 4.60 4.60 4.40 3.80 4.80 4.80 4.80 4.40
7 3.00 3.20 5.00 4.20 3.20 5.00 5.00 4.80 4.40
8 4.00 4.20 4.40 3.20 3.20 4.40 4.40 4.00 3.80
9 5.00 5.00 4.80 4.40 4.80 4.20 5.00 5.00 4.60
10 3.60 4.40 3.60 4.20 4.00 3.00 4.40 4.80 4.60
(Table continues)

70
Table D3 (continued)
Scoring rubric components
Task statements
Presents an insightful position
Develops the position w
ith com
pelling reasons and/or persuasive e exam
ples
Sustains a well-focused, w
ell-organized analysis, connecting ideas logically
Expresses ideas fluently and precisely, using effective vocabulary and sentence variety
Dem
onstrates facility with the
conventions (i.e., gramm
ar, usage, and m
echanics) of standard w
ritten English but m
ay have minor errors
Clearly identified im
portant features of the subject and analyzes them
insightfully
Develops ideas cogently,
organizes them logically, and
connects them w
ith clear transitions
Effectively supports the main
points
Dem
onstrates control of language, including appropriate w
ord choice and sentence variety
11 3.20 4.40 4.60 4.20 4.20 4.80 4.80 4.80 4.20
12 4.00 4.60 4.60 3.80 4.00 5.00 4.80 5.00 4.40
13 4.80 4.20 4.40 3.80 3.80 4.60 4.60 5.00 4.00
14 3.60 3.20 4.40 3.20 3.00 4.60 4.60 3.80 4.00
15 1.40 0.60 3.40 1.80 2.00 4.40 2.60 2.60 2.60
16 3.20 4.60 4.40 3.80 4.40 4.60 4.40 4.40 4.20
17 1.00 1.00 2.60 2.20 3.60 1.60 2.60 1.80 3.40
18 2.80 3.80 3.60 4.20 4.20 3.00 3.80 4.20 4.40
19 2.00 3.40 4.80 3.60 4.20 4.20 4.80 4.40 4.00
20 2.20 4.00 3.80 4.00 3.40 2.60 3.40 3.20 4.00
21 1.00 2.20 2.40 4.20 3.60 1.80 1.60 2.00 4.80
22 0.60 2.00 2.60 2.00 2.80 3.00 3.00 2.20 2.20
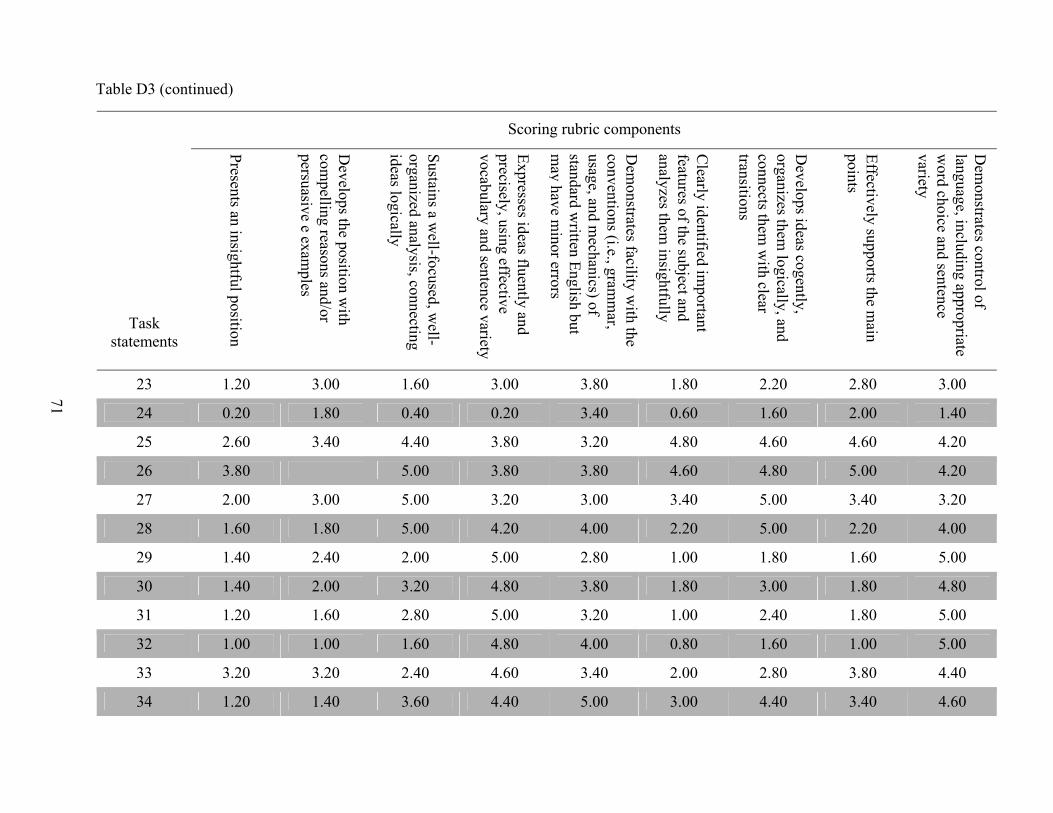
71
Table D3 (continued)
Scoring rubric components
Task statements
Presents an insightful position
Develops the position w
ith com
pelling reasons and/or persuasive e exam
ples
Sustains a well-focused, w
ell-organized analysis, connecting ideas logically
Expresses ideas fluently and precisely, using effective vocabulary and sentence variety
Dem
onstrates facility with the
conventions (i.e., gramm
ar, usage, and m
echanics) of standard w
ritten English but m
ay have minor errors
Clearly identified im
portant features of the subject and analyzes them
insightfully
Develops ideas cogently,
organizes them logically, and
connects them w
ith clear transitions
Effectively supports the main
points
Dem
onstrates control of language, including appropriate w
ord choice and sentence variety
23 1.20 3.00 1.60 3.00 3.80 1.80 2.20 2.80 3.00
24 0.20 1.80 0.40 0.20 3.40 0.60 1.60 2.00 1.40
25 2.60 3.40 4.40 3.80 3.20 4.80 4.60 4.60 4.20
26 5.00 5.00 3.80 3.80 4.60 4.80 5.00 4.20
27 2.00 3.00 5.00 3.20 3.00 3.40 5.00 3.40 3.20
28 1.60 1.80 5.00 4.20 4.00 2.20 5.00 2.20 4.00
29 1.40 2.40 2.00 5.00 2.80 1.00 1.80 1.60 5.00
30 1.40 2.00 3.20 4.80 3.80 1.80 3.00 1.80 4.80
31 1.20 1.60 2.80 5.00 3.20 1.00 2.40 1.80 5.00
32 1.00 1.00 1.60 4.80 4.00 0.80 1.60 1.00 5.00
33 3.20 3.20 2.40 4.60 3.40 2.00 2.80 3.80 4.40
34 1.20 1.40 3.60 4.40 5.00 3.00 4.40 3.40 4.60
3.80
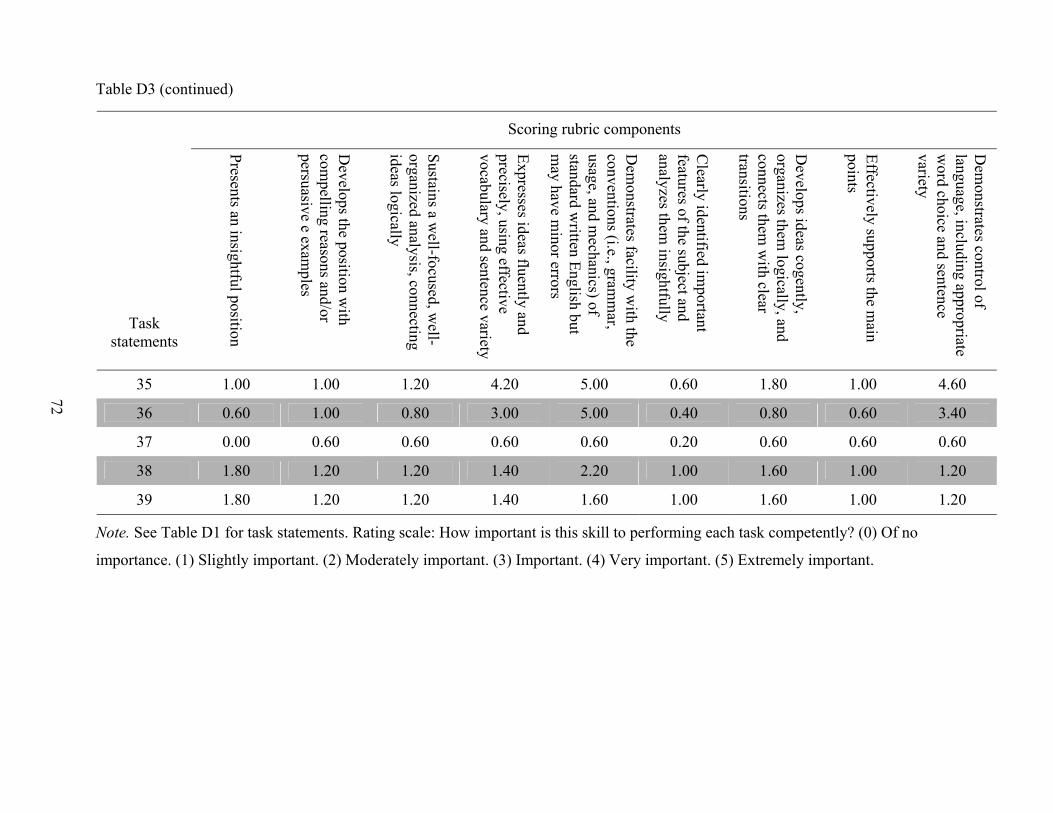
Table D3 (continued)
Scoring rubric components
Task statements
Presents an insightful position
Develops the position w
ith com
pelling reasons and/or persuasive e exam
ples
Sustains a well-focused, w
ell-organized analysis, connecting ideas logically
Expresses ideas fluently and precisely, using effective vocabulary and sentence variety
Dem
onstrates facility with the
conventions (i.e., gramm
ar, usage, and m
echanics) of standard w
ritten English but m
ay have minor errors
Clearly identified im
portant features of the subject and analyzes them
insightfully
Develops ideas cogently,
organizes them logically, and
connects them w
ith clear transitions
Effectively supports the main
points
Dem
onstrates control of language, including appropriate w
ord choice and sentence variety
35 1.00 1.00 1.20 4.20 5.00 0.60 1.80 1.00 4.60
36 0.60 1.00 0.80 3.00 5.00 0.40 0.80 0.60 3.40
37 0.00 0.60 0.60 0.60 0.60 0.20 0.60 0.60 0.60
38 1.80 1.20 1.20 1.40 2.20 1.00 1.60 1.00 1.20
39 1.80 1.20 1.20 1.40 1.60 1.00 1.60 1.00 1.20
72
Note. See Table D1 for task statements. Rating scale: How important is this skill to performing each task competently? (0) Of no
importance. (1) Slightly important. (2) Moderately important. (3) Important. (4) Very important. (5) Extremely important.
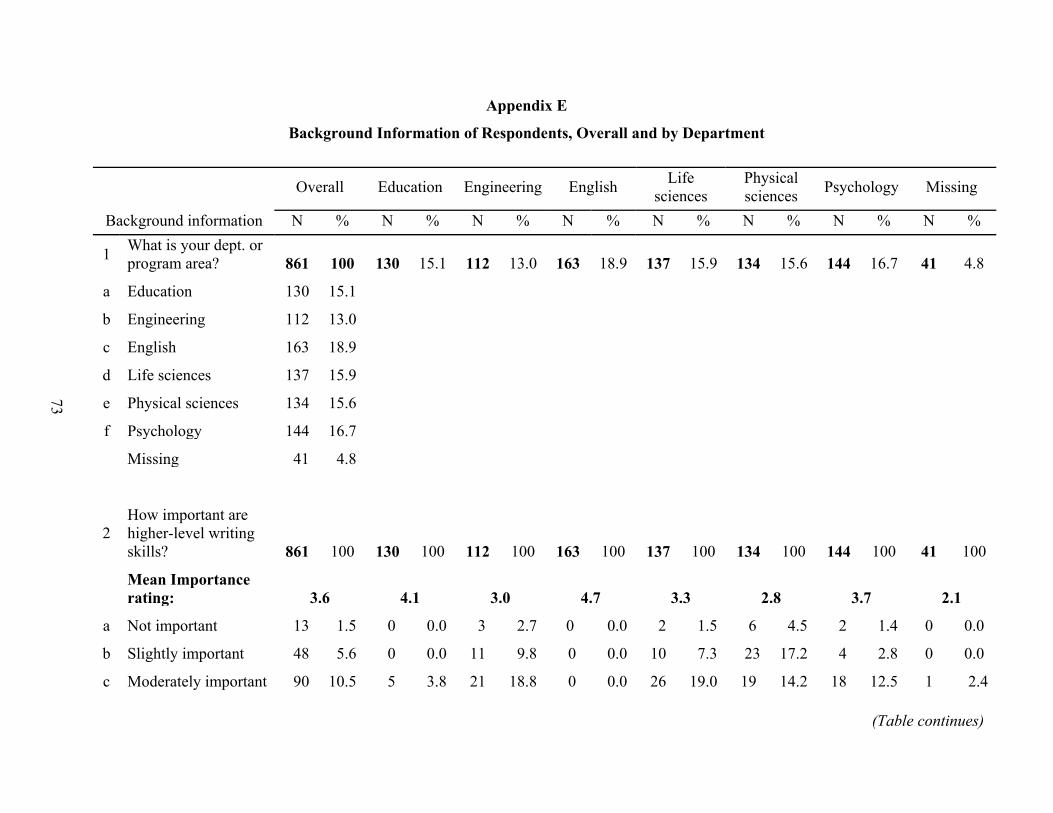
73
B
1
a
b
c
d
e
f
2
a
b
c
Appendix E
Background Information of Respondents, Overall and by Department
Overall Education Engineering English Life sciences
Physical sciences Psychology Missing
ackground information N % N % N % N % N % N % N % N %What is your dept. or program area? 861 100 130 15.1 112 13.0 163 18.9 137 15.9 134 15.6 144 16.7 41 4.8
Education 130 15.1
Engineering 112 13.0
English 163 18.9
Life sciences 137 15.9
Physical sciences 134 15.6
Psychology 144 16.7
Missing 41 4.8
How important are higher-level writing skills? 861 100 130 100 112 100 163 100 137 100 134 100 144 100 41 100
Mean Importance rating: 3.6 4.1 3.0 4.7 3.3 2.8 3.7 2.1
Not important 13 1.5 0 0.0 3 2.7 0 0.0 2 1.5 6 4.5 2 1.4 0 0.0
Slightly important 48 5.6 0 0.0 11 9.8 0 0.0 10 7.3 23 17.2 4 2.8 0 0.0
Moderately important 90 10.5 5 3.8 21 18.8 0 0.0 26 19.0 19 14.2 18 12.5 1 2.4
(Table continues)
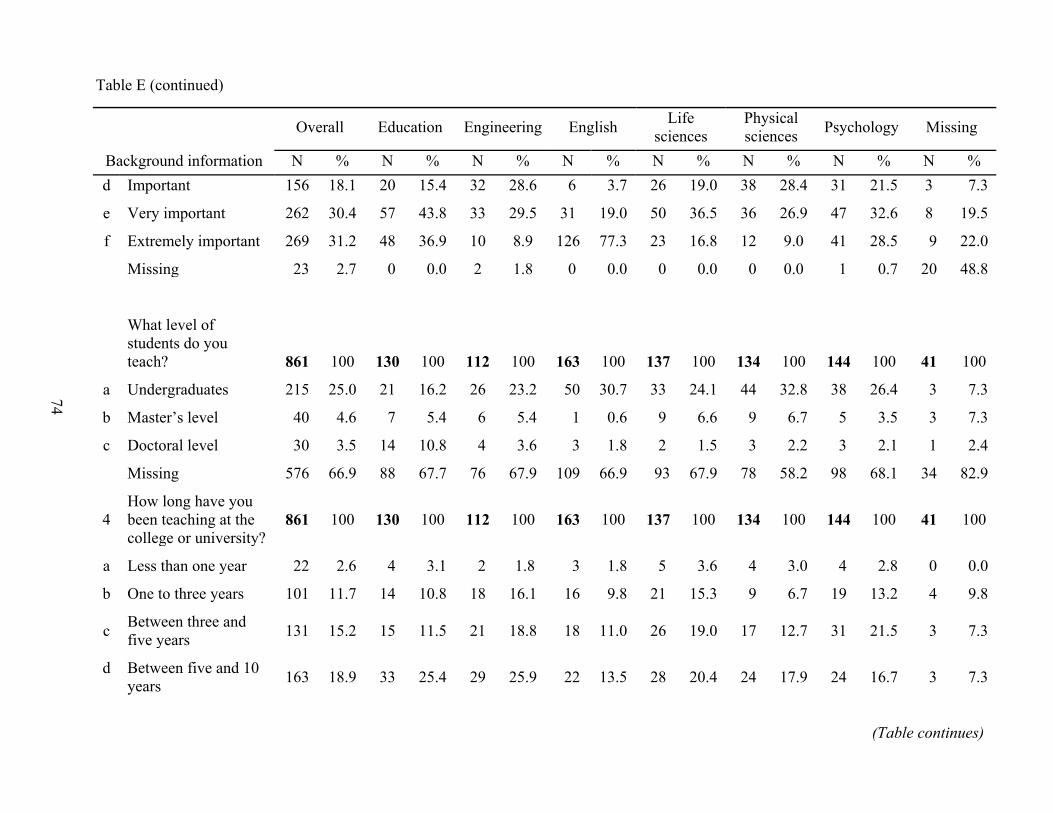
T
74
d
e
3
a
b
c
4
a
b
c
d
able E (continued)
Overall Education Engineering English Life sciences
Physical sciences Psychology Missing
Background information N % N % N % N % N % N % N % N % Important 156 18.1 20 15.4 32 28.6 6 3.7 26 19.0 38 28.4 31 21.5 3 7.3
Very important 262 30.4 57 43.8 33 29.5 31 19.0 50 36.5 36 26.9 47 32.6 8 19.5
f Extremely important 269 31.2 48 36.9 10 8.9 126 77.3 23 16.8 12 9.0 41 28.5 9 22.0
Missing 23 2.7 0 0.0 2 1.8 0 0.0 0 0.0 0 0.0 1 0.7 20 48.8
What level of students do you teach? 861 100 130 100 112 100 163 100 137 100 134 100 144 100 41 100
Undergraduates 215 25.0 21 16.2 26 23.2 50 30.7 33 24.1 44 32.8 38 26.4 3 7.3
Master’s level 40 4.6 7 5.4 6 5.4 1 0.6 9 6.6 9 6.7 5 3.5 3 7.3
Doctoral level 30 3.5 14 10.8 4 3.6 3 1.8 2 1.5 3 2.2 3 2.1 1 2.4
Missing 576 66.9 88 67.7 76 67.9 109 66.9 93 67.9 78 58.2 98 68.1 34 82.9
How long have you been teaching at the college or university?
861 100 130 100 112 100 163 100 137 100 134 100 144 100 41 100
Less than one year 22 2.6 4 3.1 2 1.8 3 1.8 5 3.6 4 3.0 4 2.8 0 0.0
One to three years 101 11.7 14 10.8 18 16.1 16 9.8 21 15.3 9 6.7 19 13.2 4 9.8
Between three and five years 131 15.2 15 11.5 21 18.8 18 11.0 26 19.0 17 12.7 31 21.5 3 7.3
Between five and 10 years 163 18.9 33 25.4 29 25.9 22 13.5 28 20.4 24 17.9 24 16.7 3 7.3
(Table continues)
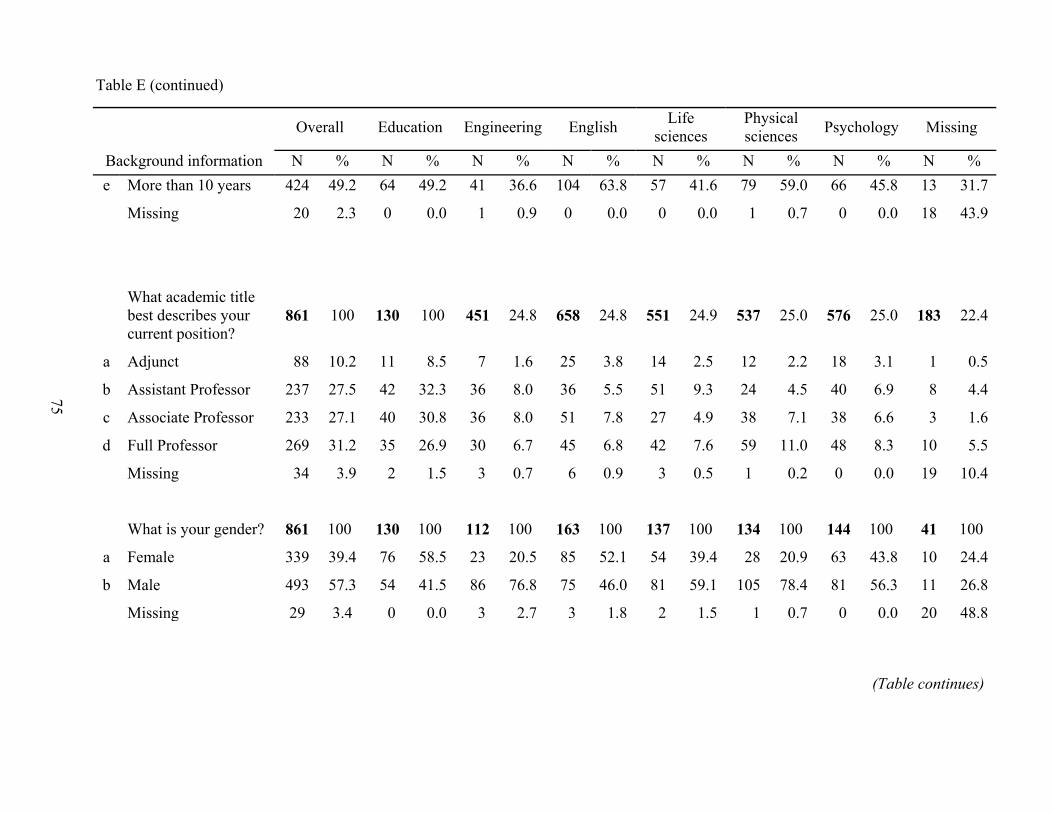
Table E (
Backgro
75
e Mor
Miss
5 Whabestcurr
a Adju
b Assi
c Asso
d Full
Miss
6 Wha
a Fem
b Mal
Miss
continued)
Overall Education Engineering English Life sciences
Physical sciences Psychology Missing
und information N % N % N % N % N % N % N % N % e than 10 years 424 49.2 64 49.2 41 36.6 104 63.8 57 41.6 79 59.0 66 45.8 13 31.7
ing 20 2.3 0 0.0 1 0.9 0 0.0 0 0.0 1 0.7 0 0.0 18 43.9
t academic title describes your ent position?
861 100 130 100 451 24.8 658 24.8 551 24.9 537 25.0 576 25.0 183 22.4
nct 88 10.2 11 8.5 7 1.6 25 3.8 14 2.5 12 2.2 18 3.1 1 0.5
stant Professor 237 27.5 42 32.3 36 8.0 36 5.5 51 9.3 24 4.5 40 6.9 8 4.4
ciate Professor 233 27.1 40 30.8 36 8.0 51 7.8 27 4.9 38 7.1 38 6.6 3 1.6
Professor 269 31.2 35 26.9 30 6.7 45 6.8 42 7.6 59 11.0 48 8.3 10 5.5
ing 34 3.9 2 1.5 3 0.7 6 0.9 3 0.5 1 0.2 0 0.0 19 10.4
t is your gender? 861 100 130 100 112 100 163 100 137 100 134 100 144 100 41 100
ale 339 39.4 76 58.5 23 20.5 85 52.1 54 39.4 28 20.9 63 43.8 10 24.4
e 493 57.3 54 41.5 86 76.8 75 46.0 81 59.1 105 78.4 81 56.3 11 26.8
ing 29 3.4 0 0.0 3 2.7 3 1.8 2 1.5 1 0.7 0 0.0 20 48.8
(Table continues)
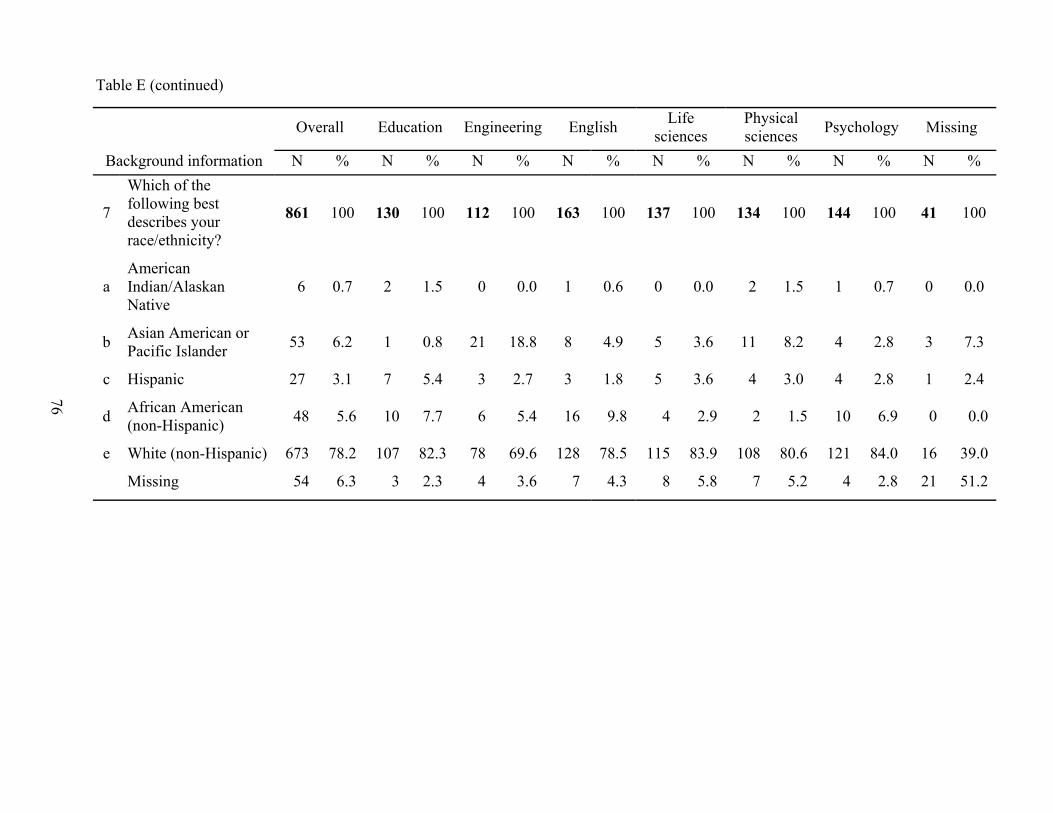
Table E (continued)
Overall Education Engineering English Life sciences
Physical sciences Psychology Missing
Background information N % N % N % N % N % N % N % N %
76
7
Which of the following best describes your race/ethnicity?
861 100 130 100 112 100 163 100 137 100 134 100 144 100 41 100
a American Indian/Alaskan Native
6 0.7 2 1.5 0 0.0 1 0.6 0 0.0 2 1.5 1 0.7 0 0.0
b Asian American or Pacific Islander 53 6.2 1 0.8 21 18.8 8 4.9 5 3.6 11 8.2 4 2.8 3 7.3
c Hispanic 27 3.1 7 5.4 3 2.7 3 1.8 5 3.6 4 3.0 4 2.8 1 2.4
d African American (non-Hispanic) 48 5.6 10 7.7 6 5.4 16 9.8 4 2.9 2 1.5 10 6.9 0 0.0
e White (non-Hispanic) 673 78.2 107 82.3 78 69.6 128 78.5 115 83.9 108 80.6 121 84.0 16 39.0
Missing 54 6.3 3 2.3 4 3.6 7 4.3 8 5.8 7 5.2 4 2.8 21 51.2
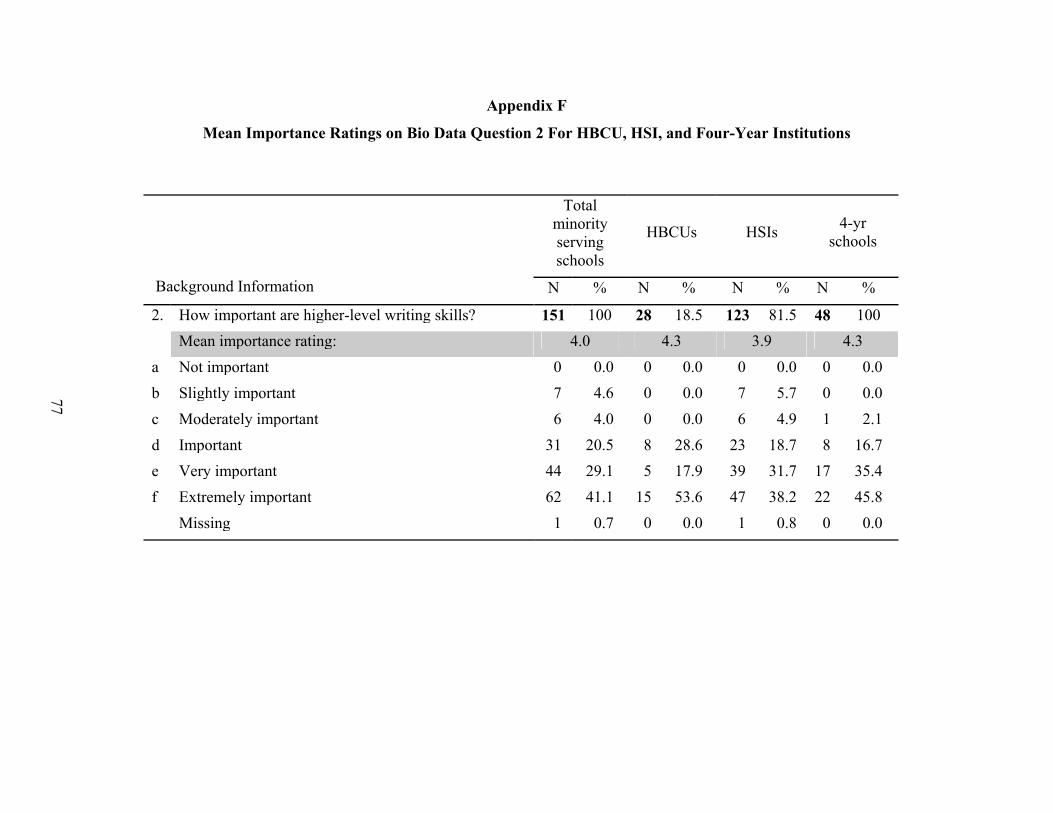
Appendix F
Mean Importance Ratings on Bio Data Question 2 For HBCU, HSI, and Four-Year Institutions
Total minority serving schools
HBCUs
HSIs 4-yr schools
Background Information N % N % N % N %
2. How important are higher-level writing skills? 151 100 28 18.5 123 81.5 48 100 Mean importance rating: 4.0 4.3 3.9 4.3 a Not important 0 0.0 0 0.0 0 0.0 0 0.0 b Slightly important 7 4.6 0 0.0 7 5.7 0 0.0 c Moderately important 6 4.0 0 0.0 6 4.9 1 2.1 d Important 31 20.5 8 28.6 23 18.7 8 16.7 e Very important 44 29.1 5 17.9 39 31.7 17 35.4 f Extremely important 62 41.1 15 53.6 47 38.2 22 45.8 Missing 1 0.7 0 0.0 1 0.8 0 0.0
77

78
Appendix G
Mean Ratings, Standard Deviations, and Standard Errors for Master’s-Level Students, Overall and by Department
Overall Education Engineering English Life Sciences
Physical Sciences Psychology
M SD = 1.1 M SD = 1.0 M SD =1.2 M SD = 1.0 M SD = 1.0 M SD = 1.1 M SD =0.9 Task statements N M SD N M SD N M SD N M SD N M SD N M SD N M SD
1 632 4.1 1.2 99 4.0 1.1 86 4.0 1.1 123 3.8 1.5 101 4.5 0.8 94 4.2 1.3 102 4.4 0.7
2 633 3.8 1.3 99 3.8 1.1 86 4.0 1.1 123 3.0 1.8 101 4.1 1.0 97 4.1 1.1 101 4.1 0.9
3 630 4.2 0.9 100 4.2 0.9 86 3.8 1.1 122 4.4 0.9 99 4.4 0.9 95 4.0 0.9 101 4.3 0.7
4 631 3.5 1.3 100 4.1 0.9 86 2.9 1.3 121 4.0 1.2 99 3.4 1.3 94 2.6 1.5 104 3.7 1.0
5 624 4.0 1.1 99 4.0 0.9 84 3.7 1.3 121 4.2 1.2 98 4.3 0.8 94 3.7 1.3 102 4.2 1.0
6 629 2.4 1.9 99 3.0 1.5 86 1.3 1.6 122 4.6 0.8 98 1.5 1.6 95 1.2 1.6 102 1.9 1.7
7 625 4.2 0.9 99 4.3 0.8 85 3.8 1.1 123 4.6 0.7 98 4.3 0.9 92 4.0 0.9 101 4.3 0.9
8 625 3.8 1.3 97 4.0 1.0 84 3.9 1.1 122 3.0 1.8 97 4.2 0.9 95 4.2 0.9 103 4.1 0.8
9 626 4.1 1.0 99 4.3 0.8 86 3.5 1.2 120 4.8 0.4 98 4.0 1.1 94 3.8 1.0 102 4.1 0.9
10 634 2.4 1.7 100 3.1 1.3 85 1.8 1.5 122 3.5 1.5 100 1.8 1.6 95 1.6 1.7 105 2.2 1.4
11 628 4.0 1.1 98 4.1 0.9 86 3.0 1.4 122 4.7 0.6 99 3.8 1.0 94 3.7 1.2 102 4.1 0.8
12 632 4.1 0.9 99 4.0 0.9 86 3.5 1.1 124 4.5 0.7 100 4.2 0.9 94 4.0 0.9 102 4.3 0.7
13 627 3.8 1.1 98 3.9 0.9 85 3.7 1.2 123 3.6 1.4 99 3.9 1.0 94 3.9 0.9 101 4.0 0.8
14 625 4.0 1.0 98 3.9 0.9 86 3.8 1.1 121 3.8 1.4 97 4.3 0.9 94 4.1 0.8 102 4.1 0.8
(Table continues)
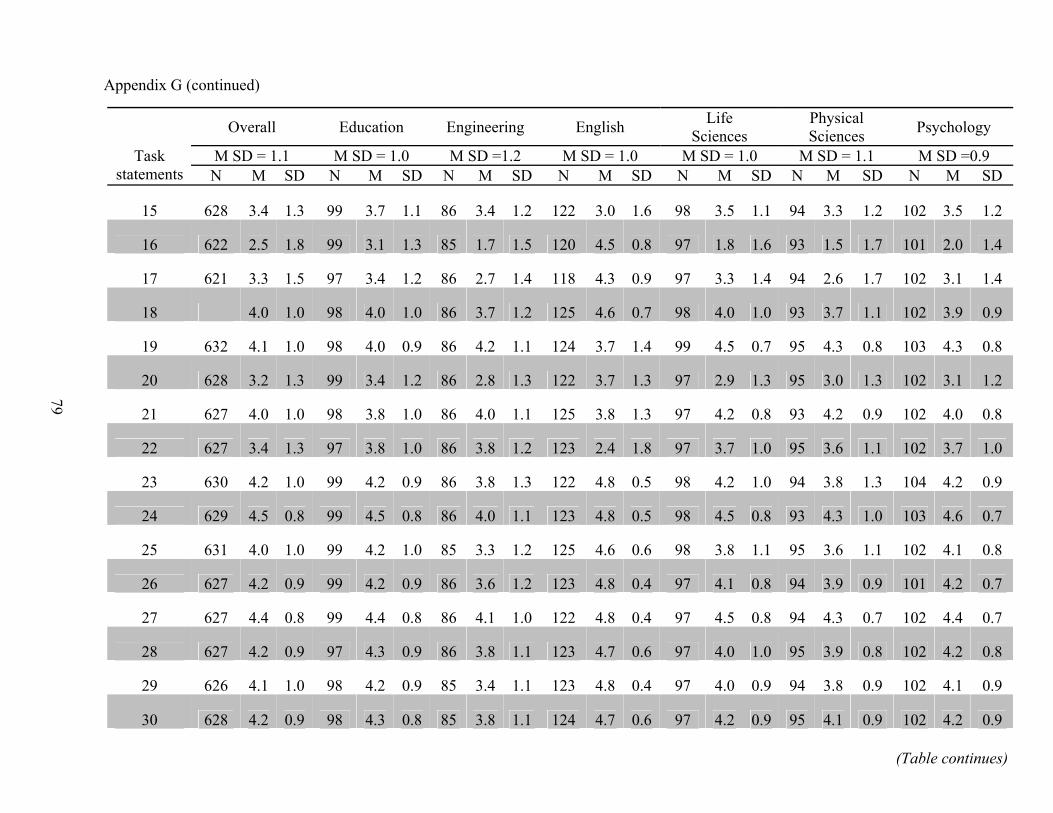
79
Appendix G (continued)
Overall Education Engineering English Life Sciences
Physical Sciences Psychology
M SD = 1.1 M SD = 1.0 M SD =1.2 M SD = 1.0 M SD = 1.0 M SD = 1.1 M SD =0.9 Task statements N M SD N M SD N M SD N M SD N M SD N M SD N M SD
15 628 3.4 1.3 99 3.7 1.1 86 3.4 1.2 122 3.0 1.6 98 3.5 1.1 94 3.3 1.2 102 3.5 1.2
16 622 2.5 1.8 99 3.1 1.3 85 1.7 1.5 120 4.5 0.8 97 1.8 1.6 93 1.5 1.7 101 2.0 1.4
17 621 3.3 1.5 97 3.4 1.2 86 2.7 1.4 118 4.3 0.9 97 3.3 1.4 94 2.6 1.7 102 3.1 1.4
18 4.0 1.0 98 4.0 1.0 86 3.7 1.2 125 4.6 0.7 98 4.0 1.0 93 3.7 1.1 102 3.9 0.9
19 632 4.1 1.0 98 4.0 0.9 86 4.2 1.1 124 3.7 1.4 99 4.5 0.7 95 4.3 0.8 103 4.3 0.8
20 628 3.2 1.3 99 3.4 1.2 86 2.8 1.3 122 3.7 1.3 97 2.9 1.3 95 3.0 1.3 102 3.1 1.2
21 627 4.0 1.0 98 3.8 1.0 86 4.0 1.1 125 3.8 1.3 97 4.2 0.8 93 4.2 0.9 102 4.0 0.8
22 627 3.4 1.3 97 3.8 1.0 86 3.8 1.2 123 2.4 1.8 97 3.7 1.0 95 3.6 1.1 102 3.7 1.0
23 630 4.2 1.0 99 4.2 0.9 86 3.8 1.3 122 4.8 0.5 98 4.2 1.0 94 3.8 1.3 104 4.2 0.9
24 629 4.5 0.8 99 4.5 0.8 86 4.0 1.1 123 4.8 0.5 98 4.5 0.8 93 4.3 1.0 103 4.6 0.7
25 631 4.0 1.0 99 4.2 1.0 85 3.3 1.2 125 4.6 0.6 98 3.8 1.1 95 3.6 1.1 102 4.1 0.8
26 627 4.2 0.9 99 4.2 0.9 86 3.6 1.2 123 4.8 0.4 97 4.1 0.8 94 3.9 0.9 101 4.2 0.7
27 627 4.4 0.8 99 4.4 0.8 86 4.1 1.0 122 4.8 0.4 97 4.5 0.8 94 4.3 0.7 102 4.4 0.7
28 627 4.2 0.9 97 4.3 0.9 86 3.8 1.1 123 4.7 0.6 97 4.0 1.0 95 3.9 0.8 102 4.2 0.8
29 626 4.1 1.0 98 4.2 0.9 85 3.4 1.1 123 4.8 0.4 97 4.0 0.9 94 3.8 0.9 102 4.1 0.9
30 628 4.2 0.9 98 4.3 0.8 85 3.8 1.1 124 4.7 0.6 97 4.2 0.9 95 4.1 0.9 102 4.2 0.9
(Table continues)

Appendix G (continued)
Overall Education Engineering English Life Sciences
Physical Sciences Psychology
M SD = 1.1 M SD = 1.0 M SD =1.2 M SD = 1.0 M SD = 1.0 M SD = 1.1 M SD =0.9 Task statements N M SD N M SD N M SD N M SD N M SD N M SD N M SD
31 624 1.0 98 4.2 0.8 85 3.5 1.1 122 4.6 0.6 4.0 0.9 93 3.7 1.1 102 4.1 0.9
32 3.6 1.2 98 3.9 0.9 86 3.0 1.2 123 4.4 98 3.3 1.2 93 3.0 1.3 102 3.4 1.1
628 3.3 1.3 97 3.7 1.1 86 2.7 1.2 123 0.9 98 2.9 1.1 94 2.7 1.5 103 3.1 1.1
34 626 4.2 0.9 98 4.3 0.9 85 3.7 1.2 4.7 0.6 97 4.2 0.9 94 4.1 1.0 102 4.2
35 624 4.4 0.9 98 4.4 0.9 86 4.0 121 4.8 0.5 96 4.4 0.8 94 4.1 1.0 102 0.8
36 623 4.3 0.9 97 4.4 0.9 86 1.2 121 4.7 0.7 97 4.2 0.9 94 4.1 1.0 4.3 0.8
37 624 3.9 1.2 98 4.1 1.1 3.8 1.2 122 3.7 1.5 97 4.0 1.0 94 3.9 101 4.0 1.0
38 626 4.2 0.9 98 4.3 86 3.9 1.1 122 4.6 0.6 97 4.2 0.9 94
4.1 97
80
626 0.7
33 4.1
123 0.8
1.1 4.4
3.8 101
86 1.1
0.9 4.1 0.9 102 4.1 0.7
39 625 3.4 97 4.0 1.0 86 3.3 1.3 121 3.0 1.7 97 1.3 3.5 1.2 94 3.4 1.4 103 3.4 1.1
Note. See Table D1 for an explanation of each task statement.
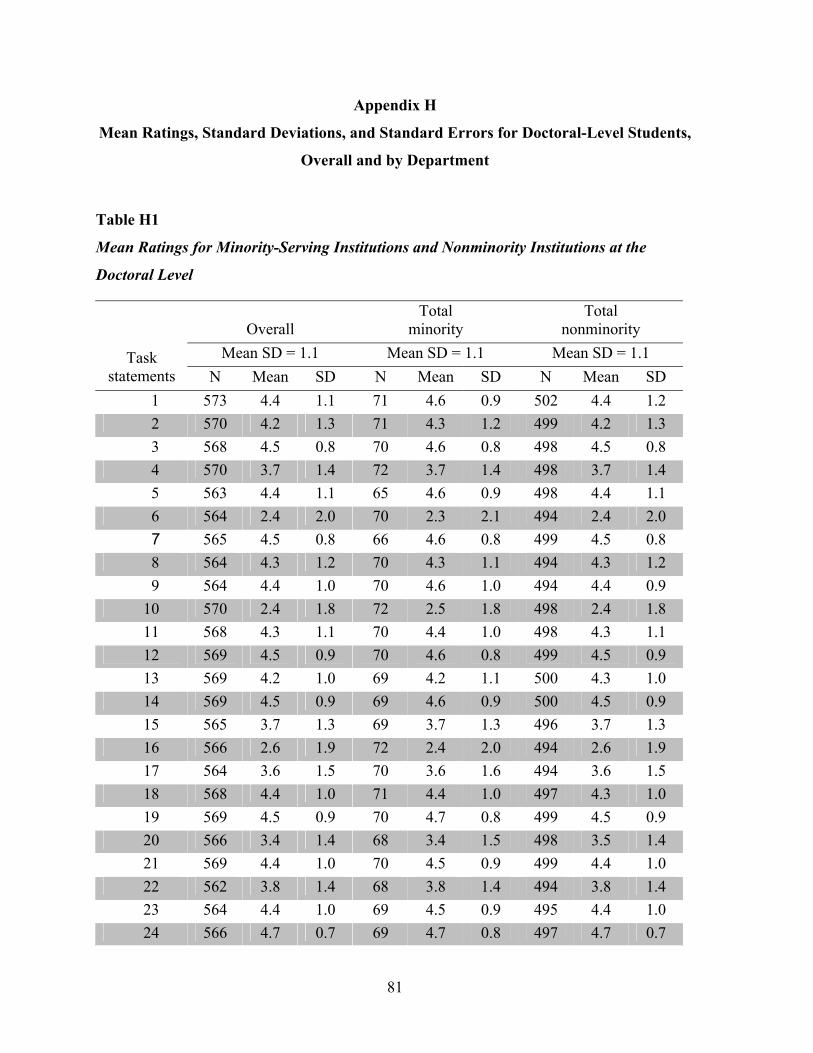
Appendix H
Mean Ratings, Standard Deviations, and Standard Errors for Doctoral-Level Students,
Overall and by Department
Table H1
Mean Ratings for Minority-Serving Institutions and Nonminority Institutions at the
Doctoral Level
Overall Total
minority Total
nonminority Mean SD = 1.1 Mean SD = 1.1 Mean SD = 1.1 Task
statements N Mean SD N Mean SD N Mean SD 1 573 4.4 1.1 71 4.6 0.9 502 4.4 1.2 2 570 4.2 1.3 71 4.3 1.2 499 4.2 1.3 3 568 4.5 0.8 70 4.6 0.8 498 4.5 0.8 4 570 3.7 1.4 72 3.7 1.4 498 3.7 1.4 5 563 4.4 1.1 65 4.6 0.9 498 4.4 1.1 6 564 2.4 2.0 70 2.3 2.1 494 2.4 2.0 7 565 4.5 0.8 66 4.6 0.8 499 4.5 0.8 8 564 4.3 1.2 70 4.3 1.1 494 4.3 1.2 9 564 4.4 1.0 70 4.6 1.0 494 4.4 0.9 10 570 2.4 1.8 72 2.5 1.8 498 2.4 1.8 11 568 4.3 1.1 70 4.4 1.0 498 4.3 1.1 12 569 4.5 0.9 70 4.6 0.8 499 4.5 0.9 13 569 4.2 1.0 69 4.2 1.1 500 4.3 1.0 14 569 4.5 0.9 69 4.6 0.9 500 4.5 0.9 15 565 3.7 1.3 69 3.7 1.3 496 3.7 1.3 16 566 2.6 1.9 72 2.4 2.0 494 2.6 1.9 17 564 3.6 1.5 70 3.6 1.6 494 3.6 1.5 18 568 4.4 1.0 71 4.4 1.0 497 4.3 1.0 19 569 4.5 0.9 70 4.7 0.8 499 4.5 0.9 20 566 3.4 1.4 68 3.4 1.5 498 3.5 1.4 21 569 4.4 1.0 70 4.5 0.9 499 4.4 1.0 22 562 3.8 1.4 68 3.8 1.4 494 3.8 23 564 4.4 1.0 69 4.5 0.9 495 4.4 1.0 24 566 4.7 0.7 69 4.7 0.8 497 4.7 0.7
1.4
81
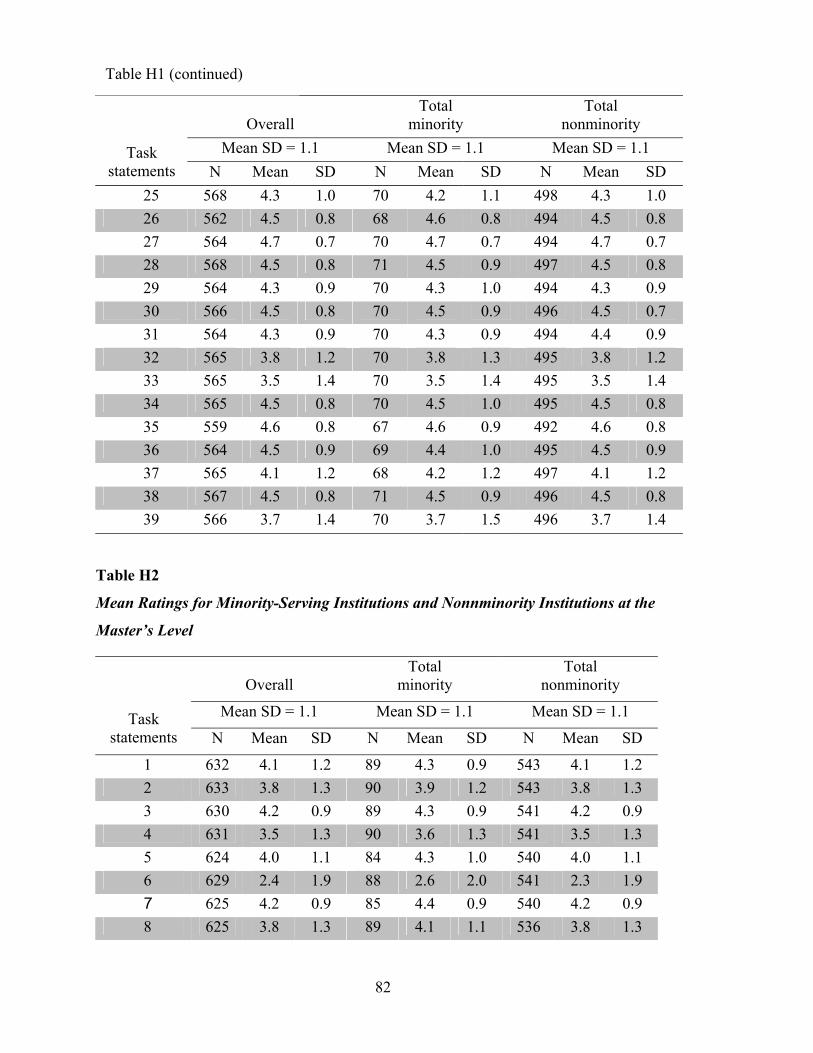
Overall Total
minority Total
nonminority Mean SD = 1.1 Mean SD = 1.1 Mean SD = 1.1 Task
statements N Mean SD N Mean SD N Mean SD 25 568 4.3 1.0 70 4.2 1.1 498 4.3 1.0 26 562 4.5 0.8 68 4.6 0.8 494 4.5 0.8 27 564 4.7 0.7 70 4.7 0.7 494 4.7 0.7 28 568 4.5 0.8 71 4.5 0.9 497 4.5 0.8 29 564 4.3 0.9 70 4.3 1.0 494 4.3 0.9 30 566 4.5 0.8 70 4.5 0.9 496 4.5 0.7 31 564 4.3 0.9 70 4.3 0.9 494 4.4 0.9 32 565 3.8 1.2 70 3.8 1.3 495 3.8 1.2 33 565 3.5 1.4 70 3.5 1.4 495 3.5 1.4 34 565 4.5 0.8 70 4.5 1.0 495 4.5 0.8 35 559 4.6 0.8 67 4.6 0.9 492 4.6 0.8 36 564 4.5 0.9 69 4.4 1.0 495 4.5 0.9 37 565 4.1 1.2 68 4.2 1.2 497 4.1 1.2 38 567 4.5 0.8 71 4.5 0.9 496 4.5 0.8 39 566 3.7 1.4 70 3.7 1.5 496 3.7 1.4
Table H2
Mean Ratings for Minority-Serving Institutions and Nonnminority Institutions at the
Master’s Level
Overall Total
minority Total
nonminority
Mean SD = 1.1 Mean SD = 1.1 Mean SD = 1.1 Task statements N Mean SD N Mean SD N Mean SD
1 632 4.1 1.2 89 4.3 0.9 543 4.1 1.2 2 633 3.8 1.3 90 3.9 1.2 543 3.8 1.3 3 630 4.2 0.9 89 4.3 0.9 541 4.2 0.9 4 631 3.5 1.3 90 3.6 1.3 541 3.5 1.3 5 624 4.0 1.1 84 4.3 1.0 540 4.0 1.1 6 629 2.4 1.9 88 2.6 2.0 541 2.3 1.9 7 625 4.2 0.9 85 4.4 0.9 540 4.2 0.9 8 625 3.8 1.3 89 4.1 1.1 536 3.8 1.3
82
Table H1 (continued)
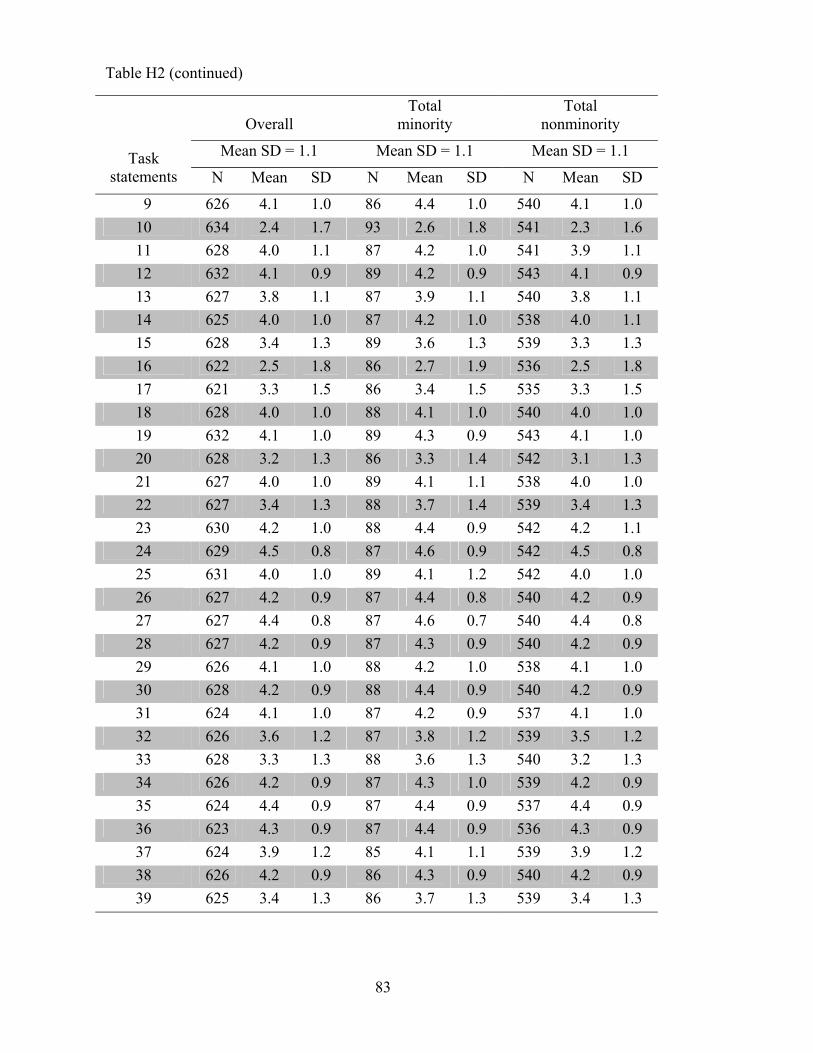
Overall Total
minority Total
nonminority
Mean SD = 1.1 Mean SD = 1.1 Mean SD = 1.1 Task statements N Mean SD N Mean SD N Mean SD
9 626 4.1 1.0 86 4.4 1.0 540 4.1 1.0 10 634 2.4 1.7 93 2.6 1.8 541 2.3 1.6 11 628 4.0 1.1 87 4.2 1.0 541 3.9 1.1 12 632 4.1 0.9 89 4.2 0.9 543 4.1 0.9 13 627 3.8 1.1 87 3.9 1.1 540 3.8 1.1 14 625 4.0 1.0 87 4.2 1.0 538 4.0 1.1 15 628 3.4 1.3 89 3.6 1.3 539 3.3 1.3 16 622 2.5 1.8 86 2.7 1.9 536 2.5 1.8 17 621 3.3 1.5 86 3.4 1.5 535 3.3 1.5 18 628 4.0 1.0 88 4.1 1.0 540 4.0 1.0 19 632 4.1 1.0 89 4.3 0.9 543 4.1 1.0 20 628 3.2 1.3 86 3.3 1.4 542 3.1 1.3 21 627 4.0 1.0 89 4.1 1.1 538 4.0 1.0 22 627 3.4 1.3 88 3.7 1.4 539 3.4 1.3 23 630 4.2 1.0 88 4.4 0.9 542 4.2 1.1 24 629 4.5 0.8 87 4.6 0.9 542 4.5 0.8 25 631 4.0 1.0 89 4.1 1.2 542 4.0 1.0 26 627 4.2 0.9 87 4.4 0.8 540 4.2 0.9 27 627 4.4 0.8 87 4.6 0.7 540 4.4 0.8 28 627 4.2 0.9 87 4.3 0.9 540 4.2 0.9 29 626 4.1 1.0 88 4.2 1.0 538 4.1 1.0 30 628 4.2 0.9 88 4.4 0.9 540 4.2 0.9 31 624 4.1 1.0 87 4.2 0.9 537 4.1 1.0 32 626 3.6 1.2 87 3.8 1.2 539 3.5 1.2 33 628 3.3 1.3 88 3.6 1.3 540 3.2 1.3 34 626 4.2 0.9 87 4.3 1.0 539 4.2 0.9 35 624 4.4 0.9 87 4.4 0.9 537 4.4 0.9 36 623 4.3 0.9 87 4.4 0.9 536 4.3 0.9 37 624 3.9 1.2 85 4.1 1.1 539 3.9 1.2 38 626 4.2 0.9 86 4.3 0.9 540 4.2 0.9 39 625 3.4 1.3 86 3.7 1.3 539 3.4 1.3
83
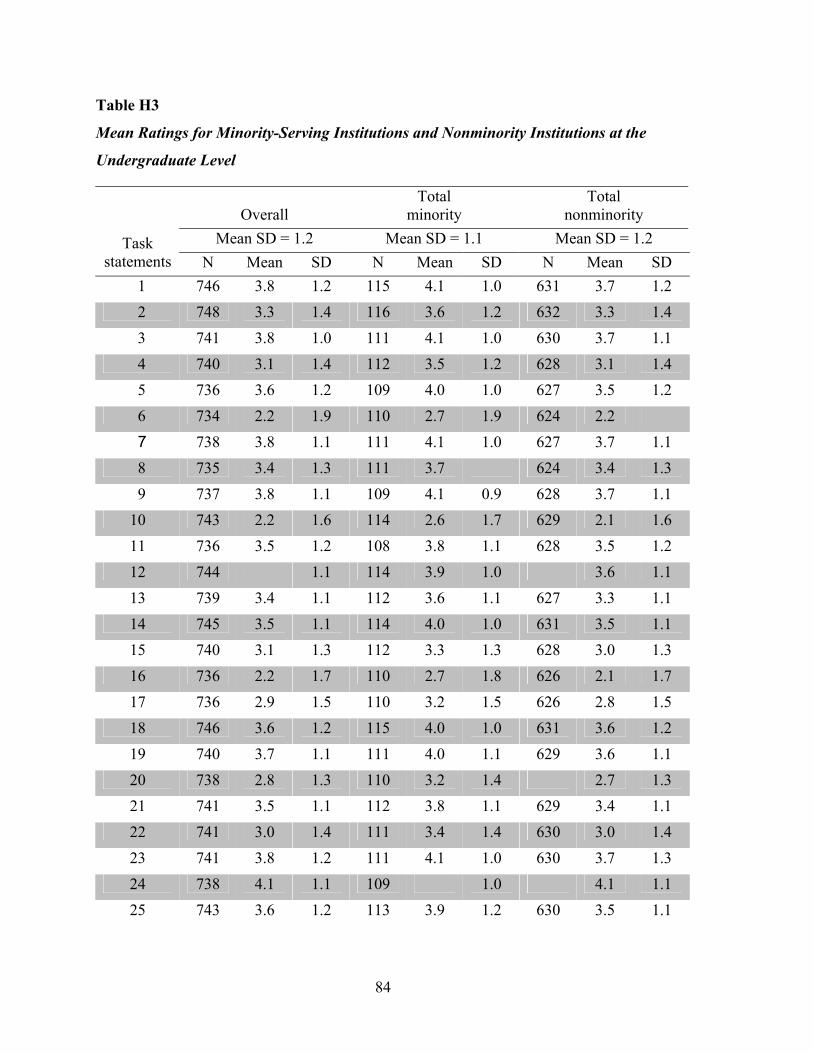
Table H3
Mean Ratings for Minority-Serving Institutions and Nonminority Institutions at the
Undergraduate Level
Overall Total
minority Total
nonminority Mean SD = 1.2 Mean SD = 1.1 Mean SD = 1.2 Task
statements N Mean SD N Mean SD N Mean SD 1 746 3.8 1.2 115 4.1 1.0 631 3.7 1.2 2 748 3.3 1.4 116 3.6 1.2 632 3.3 1.4 3 741 3.8 1.0 111 4.1 1.0 630 3.7 1.1 4 740 3.1 1.4 112 3.5 1.2 628 3.1 1.4
736 3.6 1.2 109 4.0 1.0 627 3.5 1.2 6 734 2.2 1.9 110 2.7 1.9 624 1.9 7 738 3.8 1.1 111 4.1 1.0 627 3.7 1.1 8 735 3.4 1.3 111 1.1 624 3.4 1.3 9 737 3.8 1.1 109 4.1 0.9 628 3.7 1.1 10 743 2.2 1.6 114 2.6 1.7 629 2.1 1.6 11 736 3.5 1.2 108 3.8 1.1 628 3.5 1.2
3.6 1.1 114 3.9 630 1.1 3.6 1.1
14 745 3.5 1.1 114 4.0 1.0 631 3.5 1.1 15 740 3.1 1.3 112 3.3 1.3 628 3.0 1.3 16 736 2.2 1.7 110 2.7 1.8 626 2.1 1.7 17 736 2.9 1.5 110 3.2 1.5 626 2.8 1.5 18 746 3.6 1.2 115 4.0 1.0 631 3.6 19 740 3.7 1.1 111 4.0 1.1 629 3.6 1.1 20 738 2.8 1.3 110 3.2 628 2.7 1.3 21 741 3.5 1.1 112 3.8 1.1 629 3.4 1.1 22 741 3.0 1.4 111 3.4 1.4 630 3.0 1.4 23 741 3.8 1.2 111 4.1 1.0 630 3.7 1.3 24 4.3 629 25 743 3.6 1.2 113 3.9 1.2 630 3.5 1.1
5 2.2
3.7
12 744 1.0 3.6 1.1 13 739 3.4 112 1.1 627 3.3
1.2
1.4
738 4.1 1.1 109 1.0 4.1 1.1
84
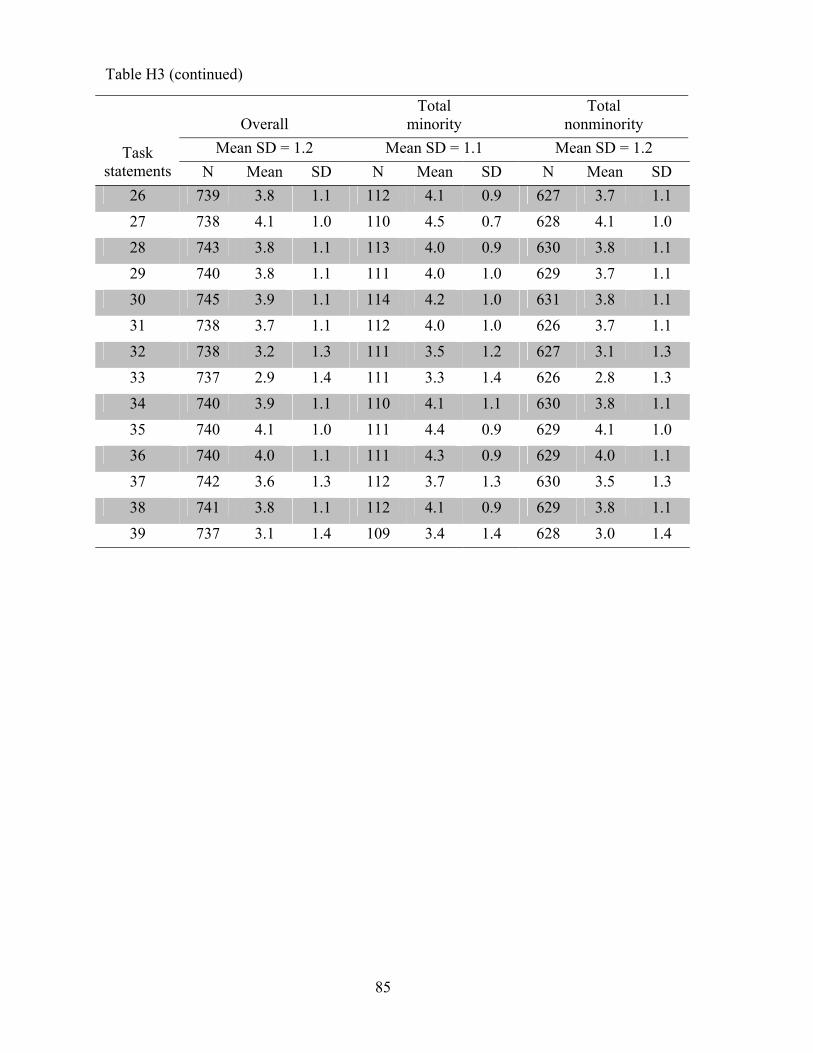
Overall Total
minority Total
nonminority Mean SD = 1.2 Mean SD = 1.1 Mean SD = 1.2 Task
statements N Mean SD N Mean SD N Mean SD 26 739 3.8 1.1 112 4.1 0.9 627 3.7 1.1 27 738 4.1 1.0 110 4.5 0.7 628 4.1 1.0 28 743 3.8 1.1 113 4.0 0.9 630 3.8 1.1 29 740 3.8 1.1 111 4.0 1.0 629 3.7 1.1 30 745 3.9 1.1 114 4.2 1.0 631 3.8 1.1 31 738 3.7 1.1 112 4.0 1.0 626 3.7 1.1 32 738 3.2 1.3 111 3.5 1.2 627 3.1 1.3 33 737 2.9 1.4 111 3.3 1.4 626 2.8 1.3 34 740 3.9 1.1 110 4.1 1.1 630 3.8 1.1 35 740 4.1 1.0 111 4.4 0.9 629 4.1 1.0 36 740 4.0 1.1 111 4.3 0.9 629 4.0 1.1 37 742 3.6 1.3 112 3.7 1.3 630 3.5 1.3 38 741 3.8 1.1 112 4.1 0.9 629 3.8 1.1 39 737 3.1 1.4 109 3.4 1.4 628 3.0 1.4
Table H3 (continued)
85
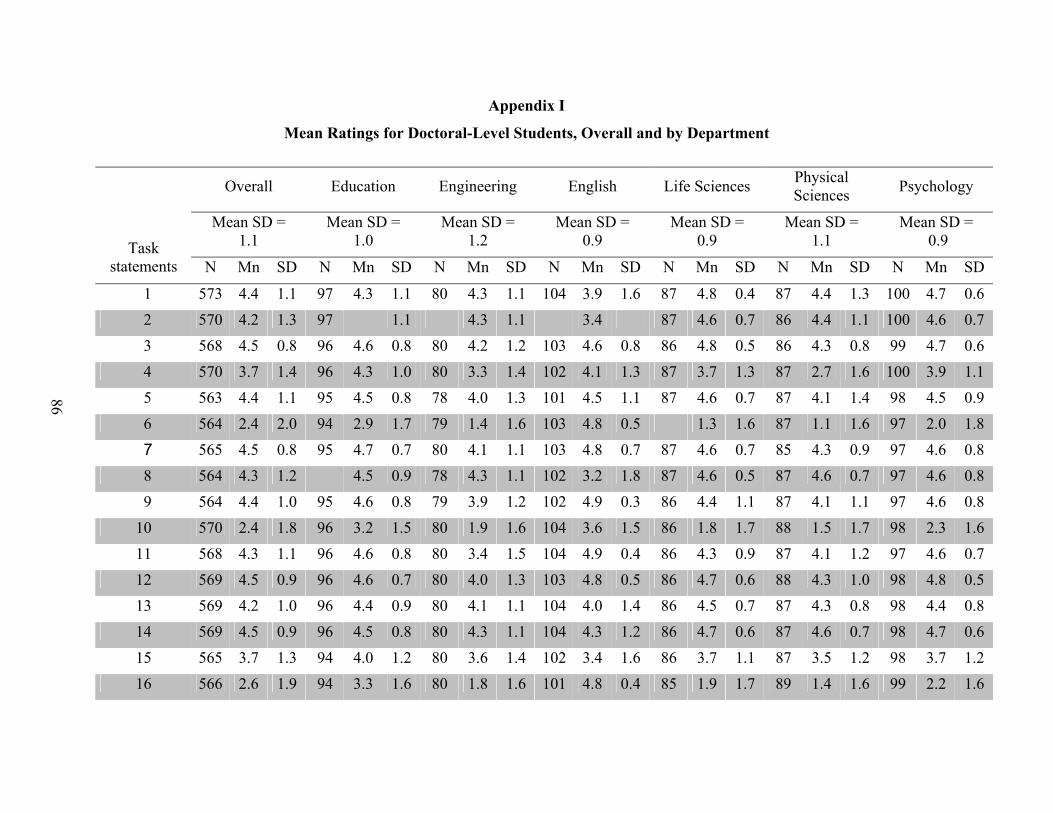
86
Appendix I
Mean Ratings for Doctoral-Level Students, Overall and by Department
Overall Education Engineering English Life Sciences Physical Sciences Psychology
Mean SD = 1.1
Mean SD = 1.0
Mean SD = 1.2
Mean SD = 0.9
Mean SD = 0.9
Mean SD = 1.1
Mean SD = 0.9
N Mn SD N Mn SD N Mn SD N Mn SD N Mn SD N Mn SD N Mn SD
1 573 4.4 1.1 97 4.3 1.1 80 4.3 1.1 104 3.9 1.6 87 4.8 0.4 87 4.4 1.3 100 4.7 0.6 2 570 4.2 1.3 4.1 80 4.3 102 1.8 87 4.6 0.7 86 4.4 1.1 100 4.6 0.7 3 0.5 568 4.5 0.8 96 4.6 0.8 80 4.2 1.2 103 4.6 0.8 86 4.8 86 4.3 0.8 99 4.7 0.6 4 570 3.7 1.4 96 4.3 1.0 80 3.3 1.4 102 4.1 1.3 87 3.7 1.3 87 2.7 1.6 100 3.9 1.1 5 87 563 4.4 1.1 95 4.5 0.8 78 4.0 1.3 101 4.5 1.1 4.6 0.7 87 4.1 1.4 98 4.5 0.9 6 564 2.4 2.0 94 2.9 1.7 79 1.4 1.6 103 4.8 86 1.3 1.6 87 1.1 1.6 97 2.0 1.8
0.8 95 4.7 0.7 80 4.1 1.1 103 4.8 0.7 87 4.6 0.7 0.9 97 4.6 0.8 8 564 95 4.5 0.9 78 4.3 1.1 102 3.2 1.8 87 4.6 0.5 87 4.6 0.7 97 4.6 0.8 9 4.4 564 1.0 95 4.6 0.8 79 3.9 1.2 102 4.9 0.3 86 4.4 1.1 87 4.1 1.1 97 4.6 0.810 570 2.4 1.8 96 3.2 1.5 80 1.9 1.6 104 3.6 1.5 86 1.8 1.7 88 1.5 1.7 98 2.3 1.6 11 4.3 568 1.1 96 4.6 0.8 80 3.4 1.5 104 4.9 0.4 86 4.3 0.9 87 4.1 1.2 97 4.6 0.712 569 4.5 0.9 96 4.6 0.7 80 4.0 1.3 103 4.8 0.5 86 4.7 0.6 88 4.3 1.0 98 4.8 0.5 13 4.2 569 1.0 96 4.4 0.9 80 4.1 1.1 104 4.0 1.4 86 4.5 0.7 87 4.3 0.8 98 4.4 0.814 569 4.5 0.9 96 4.5 0.8 80 4.3 1.1 104 4.3 1.2 86 4.7 0.6 87 4.6 0.7 98 4.7 0.6 15 565 3.7 1.3 94 4.0 1.2 80 3.6 1.4 102 3.4 1.6 86 3.7 1.1 87 3.5 1.2 98 3.7 1.216 566 2.6 1.9 94 3.3 1.6 80 1.8 1.6 101 4.8 0.4 85 1.9 1.7 89 1.4 1.6 99 2.2 1.6
Task statements
97 1.1 1.1 3.4
0.5 7 565 4.5 85 4.3
4.3 1.2

A
87
ppendix I (continued)
Overall Education Engineering English Life Sciences Physical Sciences Psychology
Mean SD = 1.1
Mean SD = 1.0
Mean SD = 1.2
Mean SD = 0.9
Mean SD = 0.9
Mean SD = 1.1
Mean SD = 0.9 Task
statements N Mn SD N Mn SD N Mn SD N Mn SD N Mn SD N Mn SD N Mn SD
17 564 3.6 1.5 93 3.8 1.3 80 3.2 1.5 102 4.6 0.8 85 3.7 1.4 87 2.7 1.8 99 3.6 1.518 568 4.4 1.0 96 4.4 0.9 80 4.0 1.1 105 4.8 0.7 86 4.3 1.0 86 4.0 1.1 98 4.4 0.9 19 4.5 569 0.9 95 4.5 0.8 80 4.5 1.0 104 4.1 1.4 86 4.7 0.5 88 4.6 0.7 98 4.8 0.520 566 3.4 1.4 95 3.7 1.2 80 3.2 1.4 102 3.9 1.4 86 3.1 1.4 87 3.3 1.4 98 3.4 1.3 21 569 4.4 1.0 95 4.3 0.9 80 4.3 1.0 104 4.2 1.4 87 4.6 0.6 87 4.6 0.7 98 4.5 0.722 562 3.8 1.4 94 4.1 1.0 79 4.1 1.1 103 2.7 1.9 85 4.0 1.1 86 4.0 1.0 97 4.1 1.0 23 564 4.4 1.0 95 4.6 0.8 80 4.0 1.4 102 4.8 0.5 86 4.5 1.0 86 4.0 1.3 98 4.5 0.824 566 4.7 0.7 95 4.7 0.7 80 4.3 1.1 104 4.9 0.4 85 4.8 0.5 86 4.6 0.8 98 4.8 0.7 25 4.3 568 1.0 95 4.5 0.9 79 3.7 1.2 105 4.8 0.5 86 4.1 1.1 87 3.8 1.0 98 4.4 0.826 562 4.5 0.8 94 4.5 0.8 80 4.0 1.1 102 4.9 0.3 85 4.6 0.6 86 4.3 0.9 97 4.6 0.7 27 564 4.7 0.7 93 4.7 0.7 80 4.3 1.0 102 4.9 0.4 85 4.8 0.4 87 4.6 0.7 99 4.7 0.528 568 4.5 0.8 95 4.6 0.8 79 4.0 1.1 105 4.8 0.5 85 4.4 0.8 88 4.2 0.8 98 4.6 0.7 29 564 4.3 0.9 95 4.5 0.9 79 3.7 1.1 103 4.9 0.3 85 4.3 0.8 86 3.9 1.0 98 4.4 0.730 566 4.5 0.8 95 4.5 0.8 79 4.1 1.1 104 4.9 0.4 85 4.6 0.7 87 4.4 0.8 98 4.6 0.7 31 4.3 564 0.9 96 4.5 0.8 79 3.8 1.2 104 4.8 0.5 84 4.3 0.8 85 4.0 1.1 98 4.4 0.832 565 3.8 1.2 94 4.2 1.0 80 3.3 1.2 104 4.7 0.6 85 3.5 1.3 86 3.1 1.4 98 3.7 1.2 33 565 3.5 1.4 94 4.0 1.1 80 3.0 1.3 104 4.4 0.9 85 3.1 1.2 86 2.8 1.6 98 3.3 1.334 565 4.5 0.8 95 4.6 0.8 78 4.1 1.1 104 4.9 0.4 85 4.6 0.7 88 4.4 0.9 97 4.6 0.6
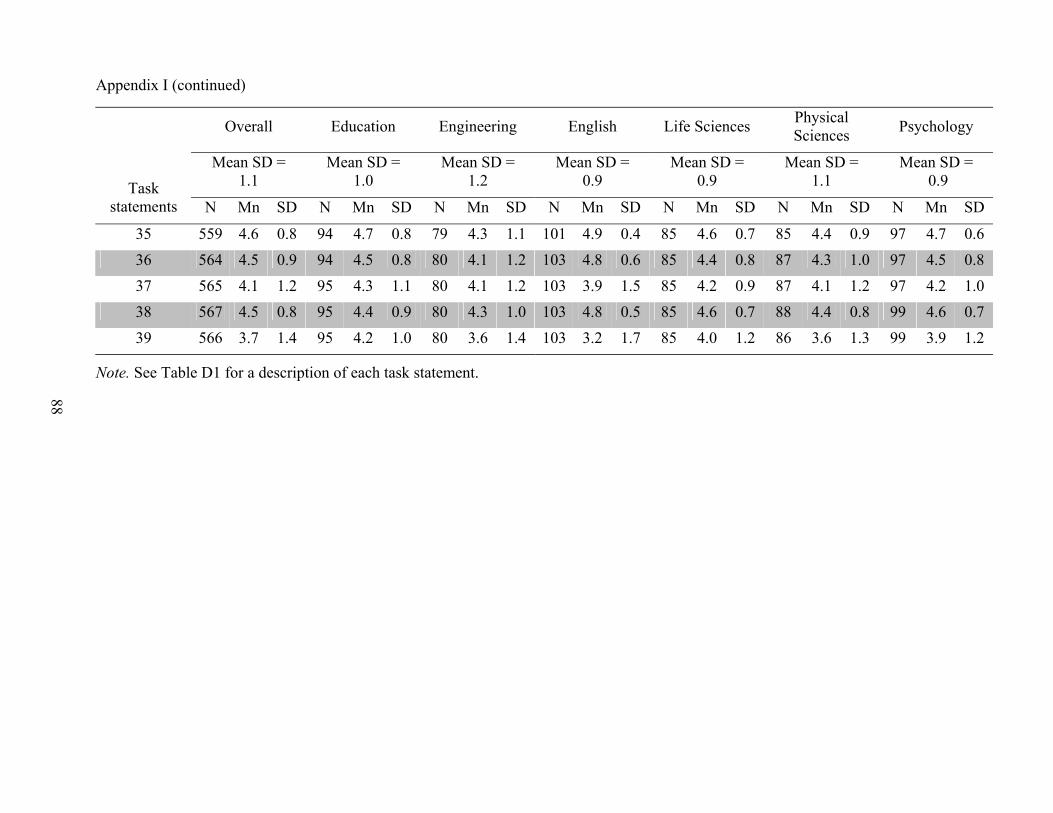
Appendix I (continued)
Overall Education Engineering English Life Sciences Physical Sciences Psychology
Mean SD = 1.1
Mean SD = 1.0
Mean SD = 1.2
Mean SD = 0.9
Mean SD = 0.9
Mean SD = 1.1
Mean SD = 0.9 Task
statements N Mn SD N Mn SD N Mn SD N Mn SD N Mn SD N Mn SD N Mn SD
88
35 559 0.8 94 4.7 0.8 79 4.3 1.1 101 4.9 0.4 85 4.6 0.7 85 4.4 0.9 97 4.7 0.6 4.636 564 4.5 0.9 94 4.5 0.8 80 4.1 1.2 103 4.8 0.6 85 4.4 0.8 87 4.3 1.0 97 4.5 0.8 37 565 1.2 95 4.3 1.1 80 4.1 1.2 103 3.9 1.5 85 4.2 0.9 87 4.1 1.2 97 4.2 1.0 4.138 567 4.5 0.8 95 4.4 0.9 80 4.3 1.0 103 4.8 0.5 85 4.6 0.7 88 4.4 0.8 99 4.6 0.7 39 566 3.7 1.4 95 4.2 1.0 80 3.6 1.4 103 3.2 1.7 85 4.0 1.2 86 3.6 1.3 99 3.9 1.2
Note. See Table D1 for a description of each task statement.
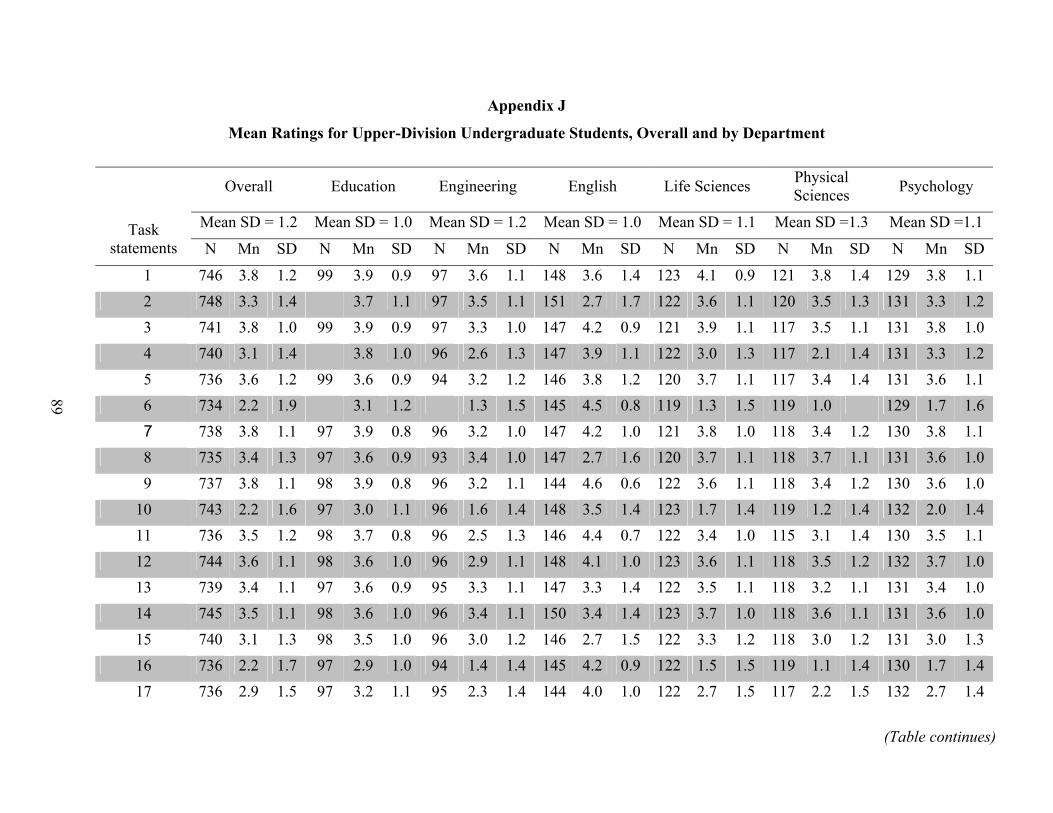
89
Appendix J
Mean Ratings for Upper-Division Undergraduate Students, Overall and by Department
Overall Education Engineering English Life Sciences Physical Sciences Psychology
Mean SD = 1.2 Mean SD = 1.0 Mean SD = 1.2 Mean SD = 1.0 Mean SD = 1.1 Mean SD =1.3 Mean SD =1.1 Task statements N Mn N Mn SD N Mn SD N Mn SD N Mn SD N Mn SD N Mn SD
1 1.2 746 3.8 99 3.9 0.9 97 3.6 1.1 148 3.6 1.4 123 4.1 0.9 121 3.8 1.4 129 3.8 1.1 2 748 3.3 99 3.7 1.1 97 3.5 1.1 151 2.7 1.7 122 3.6 1.1 120 3.5 1.3 131 3.3 1.2 3 741 3.8 99 3.9 0.9 97 3.3 1.0 147 4.2 0.9 121 3.9 1.1 117 3.5 1.1 131 3.8 1.0 4 740 3.1 98 3.8 1.0 96 2.6 1.3 147 3.9 1.1 122 3.0 1.3 117 2.1 1.4 131 3.3 1.2 5 736 3.6 99 3.6 0.9 94 3.2 1.2 146 3.8 1.2 120 3.7 1.1 117 3.4 1.4 131 3.6 1.1 6 734 2.2 98 95 1.4 129 1.7 1.6 7 738 0.8 4.2 1.0 121 3.8 3.4 1.2 130 3.8
SD
1.4 1.01.4 1.21.9 3.1 1.2 1.3 1.5 145 4.5 0.8 119 1.3 1.5 119 1.0 1.1 97 3.9 96 3.2 1.0 147 1.0 118 3.8 1.1
8 735 3.4 1.3 97 3.6 0.9 93 3.4 1.0 147 2.7 1.6 120 3.7 1.1 118 3.7 1.1 131 3.6 1.0 9 737 3.8 1.1 98 3.9 0.8 3.2 1.1 144 4.6 0.6 122 3.6 1.1 118 3.4 130 3.6 1.0 96 1.210 743 2.2 1.6 97 3.0 1.1 96 1.6 1.4 148 3.5 1.4 123 1.7 1.4 119 1.2 1.4 132 2.0 1.4 11 736 3.5 1.2 98 0.8 96 2.5 1.3 146 4.4 0.7 122 3.4 1.0 3.1 1.4 130 3.5 1.1 3.7 11512 744 3.6 1.1 98 3.6 1.0 96 2.9 1.1 148 4.1 1.0 123 3.6 1.1 118 3.5 1.2 132 3.7 1.0 13 739 3.4 97 3.6 0.9 95 3.3 1.1 147 3.3 1.4 122 1.1 118 3.2 1.1 131 3.4 1.0 1.1 3.514 745 3.5 1.1 98 3.6 1.0 96 3.4 1.1 150 3.4 1.4 123 3.7 1.0 118 3.6 1.1 131 3.6 1.0 15 3.1 1.3 98 3.5 1.0 96 3.0 1.2 146 2.7 122 3.3 1.2 118 3.0 1.2 131 3.0 1.3 740 1.516 736 2.2 1.7 97 2.9 1.0 94 1.4 1.4 145 4.2 0.9 122 1.5 1.5 119 1.1 1.4 130 1.7 1.4 17 736 2.9 1.5 97 3.2 1.1 95 2.3 1.4 4.0 1.0 122 2.7 1.5 117 2.2 1.5 132 2.7 144 1.4
(Table continues)
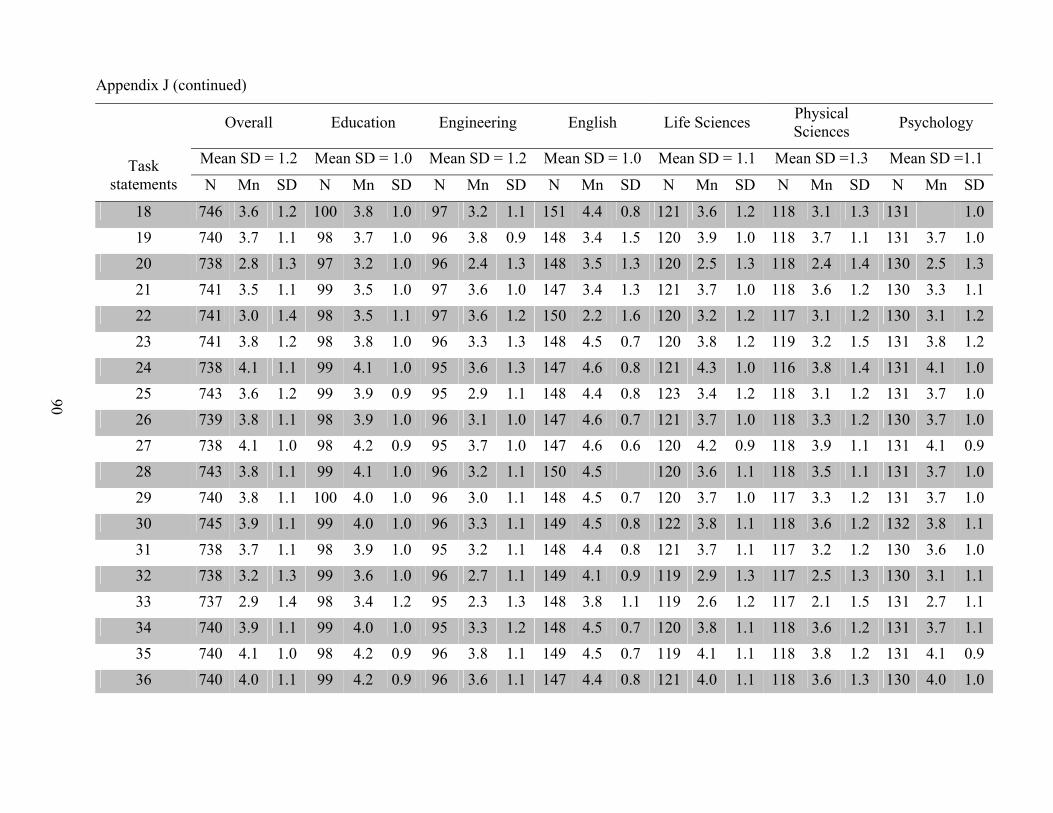
Appendix J (continued)
90
Overall Education Engineering English Life Sciences PhysiScien
Mean SD = 1.2 Mean SD = 1.0 Mean SD = 1.2 Mean SD = 1.0 Mean SD = 1.1 Mean SDTask statements N Mn SD N Mn SD N Mn SD N Mn SD N Mn SD N Mn
18 746 3.6 1.2 100 3.8 1.0 97 3.2 1.1 151 4.4 0.8 121 3.6 1.2 118 3.119 740 3.7 1.1 98 3.7 1.0 96 3.8 0.9 148 3.4 1.5 120 3.9 1.0 118 3.720 738 2.8 1.3 97 3.2 1.0 96 2.4 1.3 148 3.5 1.3 120 2.5 1.3 118 2.421 741 3.5 1.1 99 3.5 1.0 97 3.6 1.0 147 3.4 1.3 121 3.7 1.0 118 3.622 741 3.0 1.4 98 3.5 1.1 97 3.6 1.2 150 2.2 1.6 120 3.2 1.2 117 3.123 741 3.8 1.2 98 3.8 1.0 96 3.3 1.3 148 4.5 0.7 120 3.8 1.2 119 3.224 738 4.1 1.1 99 4.1 1.0 95 3.6 1.3 147 4.6 0.8 121 4.3 1.0 116 3.825 743 3.6 1.2 99 3.9 0.9 95 2.9 1.1 148 4.4 0.8 123 3.4 1.2 118 3.126 739 3.8 1.1 98 3.9 1.0 96 3.1 1.0 147 4.6 0.7 121 3.7 1.0 118 3.327 738 4.1 1.0 98 4.2 0.9 95 3.7 1.0 147 4.6 0.6 120 4.2 0.9 118 3.928 743 3.8 1.1 99 4.1 1.0 96 3.2 1.1 150 0.8 120 3.6 1.1 118 3.529 740 3.8 1.1 100 4.0 1.0 96 3.0 1.1 148 4.5 0.7 120 3.7 1.0 117 3.330 745 3.9 1.1 99 4.0 1.0 96 3.3 1.1 149 4.5 0.8 122 3.8 1.1 118 3.631 738 3.7 1.1 98 3.9 1.0 95 3.2 1.1 148 4.4 0.8 121 3.7 1.1 117 3.232 738 3.2 1.3 99 3.6 1.0 96 2.7 1.1 149 4.1 0.9 119 2.9 1.3 117 2.533 737 2.9 1.4 98 3.4 1.2 95 2.3 1.3 148 3.8 1.1 119 2.6 1.2 117 2.134 740 3.9 1.1 99 4.0 1.0 95 3.3 1.2 148 4.5 0.7 120 3.8 1.1 118 3.635 740 4.1 1.0 98 4.2 0.9 96 3.8 1.1 149 4.5 0.7 119 4.1 1.1 118 3.836 740 4.0 1.1 99 4.2 0.9 96 3.6 1.1 147 4.4 0.8 121 4.0 1.1 118 3.6
4.5
cal ces Psychology
=1.3 Mean SD =1.1
SD N Mn SD
1.3 3.5 1.0 1.1 131 3.7 1.0 1.4 130 2.5 1.3 1.2 130 3.3 1.1 1.2 130 3.1 1.2 1.5 131 3.8 1.2 1.4 131 4.1 1.0 1.2 131 3.7 1.0 1.2 130 3.7 1.0 1.1 131 4.1 0.9 1.1 131 3.7 1.0 1.2 131 3.7 1.0 1.2 132 3.8 1.1 1.2 130 3.6 1.0 1.3 130 3.1 1.1 1.5 131 2.7 1.1 1.2 131 3.7 1.1 1.2 131 4.1 0.9 1.3 130 4.0 1.0
131
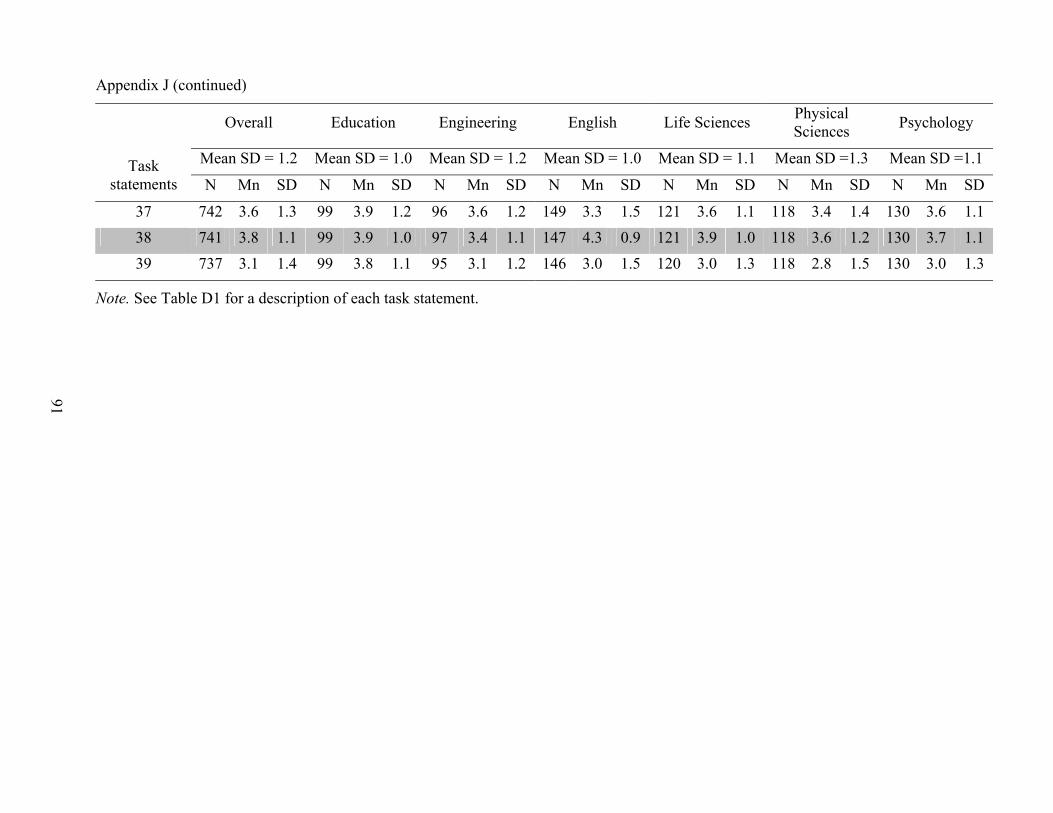
Appendix J (continued)
Overall Education Engineering English Life Sciences Physical Sciences Psychology
Mean SD = 1.2 Mean SD = 1.0 Mean SD = 1.2 Mean SD = 1.0 Mean SD = 1.1 Mean SD =1.3 Mean SD =1.1 Task statements N Mn SD N Mn SD N Mn SD N Mn SD N Mn SD N Mn SD N Mn SD
37 742 3.6 1.3 99 3.9 1.2 96 3.6 1.2 149 3.3 1.5 121 3.6 1.1 118 3.4 1.4 130 3.6 1.138 741 3.8 1.1 99 3.9 1.0 97 3.4 1.1 147 4.3 0.9 121 3.9 1.0 118 3.6 1.2 130 3.7 1.1 39 737 3.1 1.4 99 3.8 1.1 95 3.1 1.2 146 3.0 1.5 120 3.0 1.3 118 2.8 1.5 130 3.0 1.3
Note. See Table D1 for a description of each task statement.
91
GRE-ETS PO Box 6000
Princeton, NJ 08541-6000 USA
To obtain more information about GRE programs and services, use one of the following:
Phone: 1-866-473-4373 (U.S., U.S. Territories*, and Canada)
1-609-771-7670 (all other locations)
Web site: www.gre.org
* America Samoa, Guam, Puerto Rico, and US Virgin Islands
I.N. 726738
Top Related