![Analyzing the results of a usability study on CrosScan ... · Analyzing the results of a usability study on CrosScan ... to take and organize notes [19]. Whereas conventional note-taking](https://static.fdocuments.net/doc/165x107/5b350df37f8b9abc218cd8ce/analyzing-the-results-of-a-usability-study-on-crosscan-analyzing-the-results.jpg)


Languages
Pages
Legal


IDENTIFYING AND ANALYZING USABILITY PROBLEMS IN E-COMMERCE WEBSITES
Jungpil Hahn Assistant Professor of Management
Krannert School of Management, Purdue University West Lafayette, IN 47907
Email: [email protected]
Robert J. Kauffman W. P. Carey Chair in Information Systems
W. P. Carey School of Business, Arizona State University Tempe, AZ 85287
Email: [email protected]
Last revised: December 27, 2008
ABSTRACT
Managers at e-commerce firms are in need of proven methods for evaluating the usability of their websites. So, one of the most pressing issues is whether the design of their online storefronts is effective, and if not, which areas require attention and improvements. This paper proposes a new website evaluation approach which is grounded in information foraging theory. We model human-computer interaction during online shopping as a production process in which customers are making use of various functionalities provided by the e-commerce website in order to complete a purchase transaction. This view enables us to formulate a novel perspective on website usability — the ability to transform inputs through the use of website functionalities into outputs as completed purchase transactions. We use data envelopment analysis (DEA) to quantify inefficiencies that occur during online shopping, and further propose two metrics, InefficiencyBreadth and UnitInefficiency, that support an understanding of their source and extent. The value of the proposed method is illustrated by applying it to the evaluation of a real-world e-commerce website.
Keywords: Analytics, data envelopment analysis, e-commerce, empirical research, managerial approaches, software metrics, usability assessment, website evaluation
Acknowledgements. Prior versions of this article were presented at the Workshop in IS and Economics, the INFORMS Production and Operations Management Conference, the AIS Workshop on HCI Research in MIS, the University of Minnesota and Purdue University. We also thank Rajiv Banker, Gordon Davis, Alok Gupta, Kunsoo Han, Joe Konstan, Ramayya Krishnan and Gavriel Salvendy for useful suggestions that helped to improve the contents of this article. We acknowledge the chief executive officer and the managers of the anonymous electronic grocery company that sponsored this research for providing access to data and logistical support. Jungpil Hahn thanks the Carlson School of Management, University of Minnesota for fellowship support. Rob Kauffman thanks the W. P. Carey Chair in IS, as well as the Center for Advancing Business through Information Technology at the W. P. Carey School of Business, Arizona State University and the MIS Research Center at the Carlson School of Management, University of Minnesota for partial support. All errors are the sole responsibility of the authors.
1
1. INTRODUCTION
The concept of usability, which is concerned with making information systems easy to learn and
use, has recently gained increased attention with the development and wide diffusion of end-user
interactive software applications. Usability evaluation, which originally was considered as a burden on
software development costs and time, has now taken center stage as an integral part of the systems
development process as the success of an information system in terms of adoption and continued use
depends to a large extent on how easy the system is to use. This is especially true in the context of
electronic commerce due to the universal accessibility of Internet-based selling websites to a broad and
diverse population of consumers.
Managers at e-commerce firms intuitively know that providing a compelling online user
experience is essential for business success. Practitioners (Anderson et al. 2001, Tedeschi 2000) and
academics (e.g., Kotha et al. 2004, Novak et al. 2000, Venkatesh and Agarwal 2006) have emphasized the
role of online user experience as a critical success factor for e-commerce, especially in the B2C e-tailing
sector. Recent industry analyses, however, point out that e-commerce retailers are still failing to meet
consumers’ purchase needs with the poor usability and errant designs of their web-based storefronts
(Anderson 2002, Dorsey et al. 2006, Webcredible 2008). For example, a recent report issued by Questus
(LeClaire 2006) notes that over one-third of online shoppers surveyed cited website navigation, quality of
product descriptions and the checkout process to influence their purchase decisions. Over 20% of
respondents even noted that they left e-commerce websites without purchasing because of difficulty
locating products. Given the importance of usability in e-commerce, one of the most pressing questions
on the minds of e-commerce managers is whether the design of their online storefronts is effective, and if
not, which areas require attention and improvements. Answers to such questions allow managers to
prioritize design projects to maximize the return on investment of the firm’s systems development
initiatives.
Current empirical approaches to website evaluation fall into three major categories (Ivory and
Hearst 2001): (1) user testing, where users are asked to perform representative tasks with a given website

2
and usability problems are determined based on the range of observed user interactions (e.g., Rizzuti and
Dickinson 2000, Spool et al. 1999); (2) inspection, where domain experts use a set of criteria to identify
potential usability problems in the website design (e.g., Agarwal and Venkatesh 2002, Nielsen and Mack
1994); and (3) inquiry, where users provide feedback on the website via interviews, surveys, participation
in focus groups etc. (e.g., Schubert and Selz 1999). These methods have been adopted from the field of
user interface evaluation within the broader field of human-computer interaction.
However, even though these approaches have been successfully applied for the evaluation of user
interfaces of traditional IS and software applications, they are not perfectly suited for web-based e-
commerce applications. For example, websites are frequently updated and redesigned, which makes the
recurring cost of recruiting test users, experts or survey respondents for the evaluation of each redesign
overly excessive for most organizations. It is also important to emphasize that users of web-based
applications are most often consumers, which is untypical of traditional IS applications developed for use
by employees within a firm. Consumers exhibit a greater level of heterogeneity of human-computer
interaction than users of business applications. This makes it difficult to presume that a sufficiently large
enough set of usability problems will be detected with a limited number of subjects as is typical in
usability studies (Spool and Schroeder 2001). As a result, greater constraints are placed on what a
designer or developer must do to create a desirable setting for system use by a consumer since end-user
training is not a viable option.
Despite these difficulties and challenges, there are new opportunities offered by the web
environment that may be exploited. One notable opportunity is the large volume of clickstream data
available from web server log files (Bucklin et al. 2002), which make it possible for usability evaluators
to gain insights into how a website is being used by actual users. In fact, as individuals’ lives become
more and more digital, the ability to make sense of the large quantities of consumer data that are left as
digital traces of their online activities has become a source of competitive advantage (Baker 2008,
Davenport and Harris 2007). We propose a usability evaluation method for detecting potential usability
problems using clickstream data. Our proposed method, which is based on information foraging theory

3
(Pirolli and Card 1999), models consumer website usage as economic production and website usability in
terms of productive efficiency. The intuition behind our method is that it is possible to measure or
estimate the effectiveness of the website by analyzing how well it enables efficient customer purchasing
behaviors. Our approach to usability evaluation has the potential to resolve some of the aforementioned
problems inherent in current usability evaluation methods: (1) clickstream data can be collected
continuously and automatically from web server logs, enabling on-going website evaluations without
incurring extraneous costs; and (2) data can be collected for all customers making it possible to
effectively cope with heterogeneity in consumer behavior.
The next section presents a model of online shopping that provides the theoretical and analytical
foundation for our empirical method for usability evaluation of Internet-based selling websites. The third
section outlines the empirical method for website evaluation based on this conceptualization. We use
data envelopment analysis (DEA), a non-parametric frontier estimation technique to measure
inefficiencies in consumers’ website usage behaviors. We also define two metrics, InefficiencyBreadth
and UnitInefficiency, to help identify website functionalities that may be problematic. The
InefficiencyBreadth metric quantifies how widespread inefficiencies are for each kind of website
functionality, whereas the UnitInefficiency metric computes the relative severity of inefficiencies for them.
In the fourth section, we apply our proposed method to the evaluation of a real-world e-commerce
website to generate insights about its effectiveness. The paper concludes with discussions of the
contributions as well as the limitations of the proposed approach. We also discuss areas of extension for
future research.
2. THEORETICAL BACKGROUND AND MODEL
2.1. Website Usability: An Information Foraging Perspective
The International Organization for Standardization (ISO) defines usability as “… the quality of
use – the effectiveness, efficiency and satisfaction with which specified users achieve specified goals in

4
particular environments…” (ISO 1998).1 Essentially, usability refers to how well a system supports the
tasks a user performs – usability is maximized when the artifact a user interacts with supports her goals
and actions. Consequently, in order to evaluate the effectiveness e-commerce websites, we need a way to
understand how consumers behave online, including how they interact with the e-commerce website.
Information foraging theory (Pirolli and Card 1999) provides a useful theoretical perspective to enhance
our understanding of the human-computer interaction that occurs when consumers use the website of an
Internet-based seller.
Information foraging theory is a general theory of human information-seeking behavior in
information environments. The theory seeks to explain human information-seeking and sense-making
behaviors given the structure of the interface between people and information repositories. The key
assumption of information foraging theory is that the structure of the interface between the user and an
information repository determines the magnitude of the costs, which include time, resource and
opportunity costs, of different information foraging and sense-making strategies. These costs are weighed
against the rate at which useful information is encountered. Users either select an information foraging
strategy or an information system that maximizes their return on information foraging. This reflects the
rate at which they are able to gain valuable information. Hence, this implies that it is possible to evaluate
systems and information foraging strategies by quantifying the amount of useful information gained per
unit cost of usage.
Since consumer purchasing behavior can be regarded as information processing (Bettman 1979,
Howard and Sheth 1969, O'Keefe and McEachern 1998), online purchasing behavior can also be
characterized as information foraging. A consumer can be thought of as foraging for information that she
needs to process to fulfill a purchase need, such as completing a purchase transaction. In online shopping,
foraging behaviors are exhibited as consumers use various system functionalities provided by the e-
1 In typical usability studies, effectiveness is measured by number of errors (or lack thereof), efficiency as task completion time, and satisfaction via self-reports after systems use. We take a different approach. Rather than continue to use this taken-for-granted conceptualization and measurement, we develop a novel way to measure usability by reconceptualizing usability from an information foraging perspective.

5
commerce website. These include searching, browsing through product catalogs, and so on. Therefore,
the effectiveness of an online storefront can be assessed by measuring how well consumers’ website
usage behaviors contribute to the success and quality of her purchase transaction.
2.2. Online Shopping as Production
The preceding discussion of online shopping as information foraging provides a useful foundation
for developing empirical methods for evaluating Internet-based selling websites. Return on information
foraging is essentially a measure of productivity – a ratio of outputs over inputs, such as the amount of
valuable information gained divided by the amount of system usage. Hence, we may model consumer-
website interaction during online shopping as a production process in which the customer conducts a
purchase transaction by utilizing various functionalities provided by the e-commerce website. The
customers’ use of the various types of functionalities provided by the e-commerce website can be thought
of as the inputs to the production process. These are the effort put forth by the customers in filling their
virtual shopping carts. For example, the number of product page views, extent of navigation through
product listings, and references to help pages can be regarded as actions that constitute the inputs into the
production process. Similarly, the contents of the purchase transaction can be thought of as the output of
production. For example, the number or dollar value of items purchased during a shopping trip can be
regarded as possible outputs of the production process. Additional factors may additionally impact the
efficiency of the production process. For instance, a customer’s general competence and skill level with
computers and the Internet, her familiarity with a particular e-tailer’s website design, and the speed of her
Internet connection all may impact how efficient the customer is in producing an online transaction.
These other factors can be thought of as environmental factors that impact the production process.
More generally, a production process defines the technical means by which inputs are converted
into outputs, in terms of materials and resources consumed to create goods and services. This technical
relationship is represented by the production function, which articulates the maximum level of outputs
produced for each given level of inputs – the efficient frontier or the “best practice” production frontier.
Deviations from the production frontier reflect inefficiencies in production (Aigner and Chu 1968).

6
Figure 1 illustrates the basic logic of the production perspective. The production frontier represents the
most efficient production process. All points that lie on the curve (e.g., points B, C and D) are said to be
efficient since they do not deviate from the frontier (i.e., εoutput = εinput = 0). All observations that lie below
the production curve (e.g., point A) are inefficient since a level of output greater by εoutput may be achieved
with the same level of input (point A′) or the same level of output may be achieved with εinput less input
(point A′′). Point B is clear more efficient than point A since it produces a greater amount of output with
less input. Although point C uses more input than point A, it is also producing a greater amount of output
even when compared with the efficient projection of point A (point A′). Finally, although point D is
producing a lesser amount of output compared to point A, it is doing so with substantially lesser amount
of input.
Figure 1. Efficiency Frontiers
3. E-COMMERCE WEBSITE EVALUATION: A DEA APPROACH
Conceptualizing online shopping as production enables us to develop a novel perspective for e-
commerce website evaluation. Since customers are producing a transaction through the e-commerce
website, Internet-based selling can be viewed as a service production environment. Usability of the
website thus can be assessed by examining how well the production environment on the e-commerce
website supports efficient transformation of information foraging effort to product purchases.
Furthermore, we may utilize frontier estimation methods from production econometrics – empirical
7
methods typically used for productivity analysis – in evaluating e-commerce website performance. Of the
various analysis methods available, we selected data envelopment analysis (DEA), a linear programming-
based non-parametric method for production frontier estimation. DEA only requires simple assumptions
of monotonically increasing and convex input-output relationships and does not impose strict assumptions
with respect to the functional form of the production function. Moreover, DEA can effectively handle
production functions where multiple inputs and multiple outputs are involved. Finally, in addition to
computing an observation’s final efficiency score, DEA also produces ample diagnostic information
relating to where inefficiencies are observed. Prior research has also shown that the parametric
formulation for stochastic frontier estimation and the non-parametric formulation of DEA yield similar
results (Banker et al. 1991).
3.1. Data Envelopment Analysis (DEA)
In DEA, the unit of analysis is called the decision-making unit (DMU).2 This represents a
production unit. A DMU may be defined narrowly as an individual or as broadly as a firm, an industry, or
even as an economy. DEA estimates the relative efficiencies of DMUs from observed measures of inputs
and outputs. The productivity of a DMU is evaluated by comparing it against a hypothetical DMU that is
constructed as a convex combination of other DMUs in the dataset. Several variants of DEA are available
to the analyst to fit the situation at hand. The analyst may choose between input-oriented or output-
oriented DEA models. This choice reflects the distinction between the input minimization and the output
maximization perspectives. In addition, the analyst may choose between different models depending on
whether the production process exhibits constant or variable returns to scale (Banker et al. 2004). The
CCR (Charnes, Cooper and Rhodes) model (Charnes et al. 1978, 1981) allows for constant returns to
scale, whereas the BCC (Banker, Charnes and Cooper) model (Banker et al. 1984) allows for variable
returns to scale. By combining these two considerations, the analyst may model a wide variety of
situations. For example, the input-oriented BCC model is appropriate for estimating the productivity of
2 Additional details on DEA and its recent developments can be obtained in recent comprehensive texts such as Charnes et al. (1994), Cooper et al. (2000) and Cooper et al. (2004). We only review the basic concepts here.

8
DMUs in terms of input minimization when the production process exhibits variable returns to scale.
The efficiency hj0 of DMU j0, characterized on the basis of the consumption of inputs xij0 and
production of outputs yrj0, is assessed by solving the linear program shown below. The first constraint
ensures that all observed input combinations lie on or within the production possibility set defined by the
production frontier. The second constraint maintains that the output levels of inefficient observations are
compared to the output levels of a reference DMU that is composed of a convex combination of observed
outputs. The third constraint ensures that all values of the production convexity weights are greater than
or equal to zero so that the hypothetical reference DMU is within the production possibility set. The final
constraint allows variable returns to scale.3 Taken together, the specification of the constraints is such
that the production possibilities set conforms to the axioms of production in production economics in
terms of convexity, monotonicity, variable returns to scale and minimum extrapolation (Banker et al.
1984).
Min 0j
h subject to:
∑=
+=J
j
inputijjijijj xxh
100
ελ , i = 1, …, I inputs
∑=
−=J
j
outputrjjrjrj yy
10
ελ , r = 1, …, R outputs
λj ≥ 0, for ∀j
11
J
jjλ
=
=∑ , j = 1, …, J observations
3.2. Identifying Usability Problems
Efficiency estimation via DEA produces efficiency scores, h*j, for each transaction.4 Hence, we
may gain an overall assessment of the effectiveness of the e-commerce website by examining the
3 This constraint is relaxed for the CCR model, so that it restricts the production process to have constant returns to scale. 4 This is a novel approach to using DEA. Conventionally, research using DEA focuses on generating efficiency scores for individual DMUs to identify which observations are efficient and which are not. Here, we shift our focus to the distribution of the efficiency scores, rather than focus on the on the individual efficiency scores. This shift in focus allows us to generate insights about the overall effectiveness of the production environment in terms of enabling efficient production processes across DMUs.
9
distribution of these efficiency scores or inefficiency deviations, θ*j = 1/h*
j - 1. If most efficiency scores
lie close to the efficiency frontier (based on h*j ≈ 1 or θ*
j ≈ 0), then we may infer that the e-commerce
website is quite effective. However, recall from our earlier discussion that an important managerial
concern is to understand not only how the e-commerce website is performing, but more importantly,
which areas of the website are not effective, so as to identify areas for improvement. In such cases,
overall efficiency scores do not help us since the efficiency score relates to the productivity of the
production environment as a whole for the e-commerce website. Instead we would need to delve deeper
into the potential causes by investigating the sources of the observed inefficiencies. One straightforward
way to do this is to examine the breadth (or scope) of observed inefficiencies for each type of website
functionality, for example, how many customers exhibited inefficiencies with respect to using the search
functionality. Another consideration is the severity (or scale) of the observed inefficiencies for each type
of website functionality. This will describe the level of observed inefficiencies when inefficiencies are
observed for a particular website functionality. Toward this goal, we define two metrics:
• Definition 1 (Inefficiency Breadth). The InefficiencyBreadth of website functionality represents how widespread inefficiencies due to the particular website functionality are.
• Definition 2 (Unit Inefficiency). The UnitInefficiency of website functionality on output represents how much the inefficiencies due to the particular website functionality are with respect to a unit of output. The two metrics above can be easily computed from the DEA results. Since input i in the online
shopping production model is conceptualized as the customer’s use of website functionality i, all non-zero
εijinput represent excess input in the use of website functionality i that resulted in the inefficiency in the
production of output r. We define the set Di = {j ∈ J | εijinput > 0}, representing all DMUs where
inefficiency in the use of website functionality i was observed. We also define ni = |Di| as the cardinality
of Di, the number of elements/observations in set Di. Then the InefficiencyBreadth metric, which
represents the scope of inefficiency due to functionality i, can be calculated by determining the proportion
of observations for which input inefficiencies were observed: InefficiencyBreadthi = ni / J.
InefficiencyBreadth is a thus proportional measure. It basically counts the number of observations or

10
purchase transactions that have inefficiency (excess input, εijinput) observed with respect to a particular
input measure representing a type of website functionality i out of the population of all observations J.
For instance, if we have a total of 100 observations, and of those, 20 observations exhibited input
inefficiencies for input x1 (e.g., the search function), then InefficiencyBreadth1 would be 20/100 = 0.20 or
20%. This means that 20% of all transactions had inefficiencies with respect to the use of the search
functionality of the website.
Even though InefficiencyBreadth provides a useful metric that represents how widespread
inefficiencies due to specific website functionality were, it does not provide much information as to the
severity of those observed inefficiencies. The UnitInefficiency metric, which represents the severity of
observed inefficiencies for a specific website functionality, can be determined by analyzing the magnitude
of observed input inefficiencies εijinput. Since, each observation may have differing levels of outputs, we
normalize by output: UnitInefficiencyirj = εijinput / yrj. For instance, the first observation j = 1 had input
inefficiency with respect to the first type of website functionality x1 (e.g., search) and the actual measure
of the excess input was ε11input = 5. If we further assume that the output or number of products purchased
for this observation was y1 = 50, then the UnitInefficiency111 is 5/50 = 0.1 or 10%. In other words,
although this observation exhibited some input inefficiency (ε11input = 5), given that her output was quite
large (y1 = 50), the overall severity of the observed inefficiency can be deemed minimal
(UnitInefficiency111 = 10%). The UnitInefficiency measure can be computed for each transaction (j = 1,
…, J), for each input website functionality xi (i = 1, …, I), and for each output yr (r = 1, …, R). Hence,
investigating distributional measures (e.g., mean, median, and variance etc.) will simplify the
interpretation of the results. We illustrate the value of our proposed website evaluation method by
applying it to a real-world operational e-commerce website to obtain empirical results.

11
4. EMPIRICAL APPLICATION
4.1. Research Site and Data Collection
Data for this study were collected at an online grocery retailer, which requested to remain
anonymous. The online grocer is a pure-play Internet-based retailer that delivers groceries directly to its
customers’ doorsteps with the mission of “taking the dread out of grocery shopping.” The company made
its first delivery in April 1999 and by mid-July 2000, it had over 9,000 customers who generated more
than $16 million in revenue. At the time of data collection, the firm operated in one metropolitan area,
where it was the only e-grocer in its regional market.
Clickstream data were collected directly from the online grocer’s web servers. The website uses
HTTP session cookies downloaded onto the visitor’s computer to track the customer’s shopping behavior
at the website. Typical data pre-processing procedures for using web server logs were used to extract
navigation path sequences for visitors from the clickstream data (Cooley et al. 1999). The navigation
sessions were combined to identify purchase transactions. Then website usage metrics were extracted to
measure the extent to which various areas of the website were used in each of the purchasing processes.
The data span two weeks from June 23 to July 5, 2001, during which a total of 36,051 sessions were
recorded for 18,297 unique customers. Our analysis focuses on 5,383 actual completed purchase
transactions from 4,941 customers.
Website meta-data were defined to adequately represent the structure and content of the e-
commerce website. This was used to make sense of the usage behavior patterns by identifying the nature
and content of the pages the customers have gone through to browse and purchase products on the
website. The data integration process is presented in Figure 2.

12
Figure 2. Data Integration
Pre-processing - Data cleaning- Path completion- Session identification- User identification- Transaction identification
Web Site Design Metadata
Web Site UsageMetrics
User-Session-Transaction
Database
Web Site Design Analysis - Page classification - Web site topology identification
Web Site Source Code(HTML, ASP files)
Web ServerLogs
4.2. DEA Model Specification
For our current analyses, we employ the input-oriented BCC model (Banker et al. 1984) to
estimate the efficiencies of the online purchase transactions in the evaluation of the effectiveness of the
online grocer’s e-commerce website. Before presenting the specification of the input and output variables,
we first discuss the rationale for selecting the input-oriented model in lieu of the output-oriented model,
as well as the BCC model over the CCR model.
The input-oriented DEA model with its focus on input minimization for a given level of output is
appropriate for modeling online purchase situations where goal-directed purchasing is prevalent.
Shopping efficiency is meaningful and important in the online grocery shopping context that is
investigated here. In fact, the target consumer market for the grocery shopping website is the time-
pinched customer who seeks convenience in her grocery shopping activities. Consequently, one of the
key operational goals for website design set forth by the managers at the research site is to have first-time
customers be able to checkout and complete a purchase transaction within an hour and have their

13
subsequent transaction sessions not exceed thirty minutes. Hence, shopping efficiency in terms of input
minimization is a major focus in the current context.
We also employ the BCC model because it allows for variable returns to scale in the production
process. The CCR model enforces constant returns to scale in the production process, and so it is less
desirable for this context. This is because in the online shopping context, the size of the transaction in
terms of the number of items purchased as an indicator of scale size is under the control of the customer
and not the e-commerce firm. Hence, even if an optimal production scale were to exist and be found, one
cannot enforce it.5 Besides the theoretical reason for this choice, it is also possible to determine
empirically whether the production function exhibits constant or variable returns to scale (Banker and
Slaughter 1997). Our analyses show that the online shopping production process exhibits variable returns
to scale, hence the BCC model formulation is appropriate.6
Once the model specification has been determined, the next step is to select the appropriate input
and output variables for empirical estimation. DEA analysis is only as good as the initial selection of
input and output variables. Following recommendations in the DEA literature (Thomas et al. 1998), we
operationalized the input and output variables via in-depth discussions with the managers at the online
grocer. We categorized all webpages that are accessible by customers into different types of website
functionalities and counted, from the clickstream data, the number of times a customer views a particular
type of webpage. These included product category pages, product detail pages, product lists, and search
pages. We used them as measures of input into the online shopping production process. We obtained the
output measure, basket size, by counting the number of different products that were purchased by the
customer. This operationalization is consistent with our production model of online shopping, where the
inputs consist of customers’ use of various website functionalities to produce a transaction, and the output
consists of a checkout of a basket of products. The input and output variables for website efficiency
5 Enforcing a production scale on a consumer would be analogous to suggesting that she purchase more (or fewer) items because she would be more scale efficient with a different transaction size. 6 Details of the returns-to-scale analyses are not shown here but are available from the authors upon request.

14
measurement are summarized in Table 1.
Table 1. DEA Model’s Input and Output Variables
CATEGORY VARIABLE MEASURE DESCRIPTION FOR NUMBER OF … x1 Products Product page views x2 Lists Product list views x3 Personal Personal list views x4 OrderHistory Order history page views x5 Search Searches conducted x6 Promotion Promotional page views x7 Recipe Recipe page views x8 Checkout Checkout pages
Inputs
x9 Help Help page views Output y1 BasketSize Different products at checkout
Taken together, the nine input variables (x1 through x9) represent all major website functionalities
a customer has used in conducting her purchase transaction.7 The output measure, the number of different
products at checkout (y1 = BasketSize), represents the level of performance for online shopping.
4.3. Results
4.3.1. DEA Results
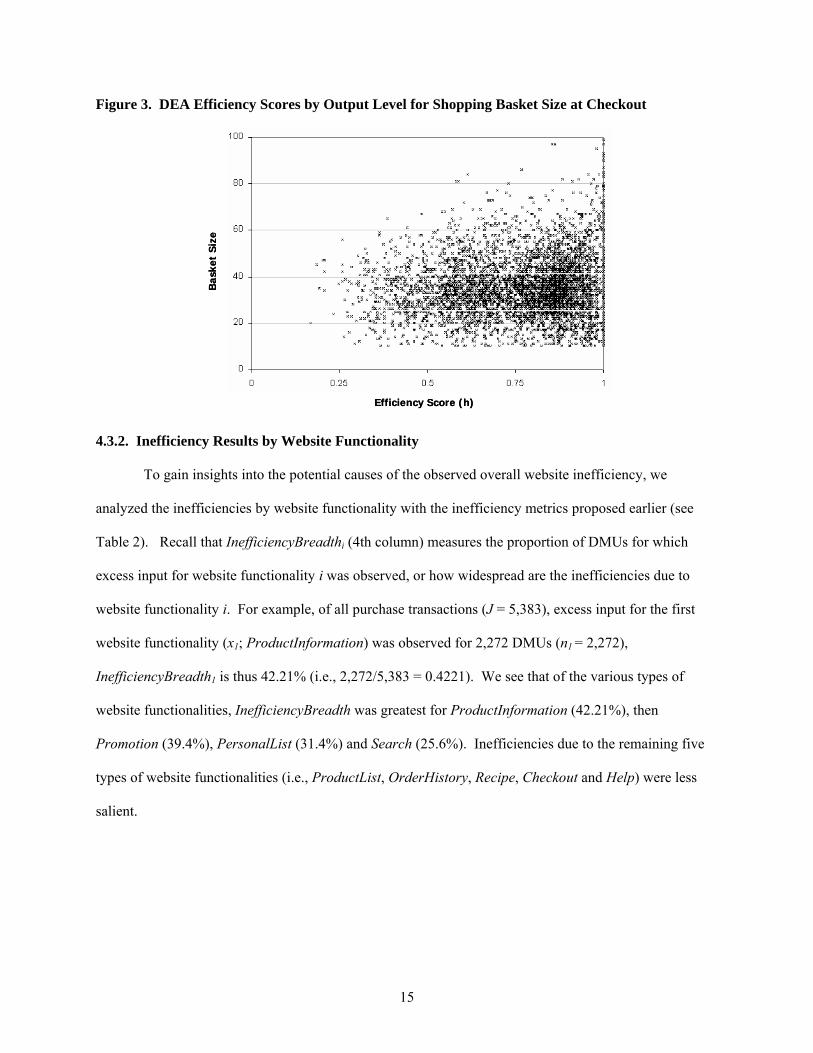
Figure 3 shows the efficiency scores of all 5,383 DMUs (J = 5,383) against the respective output
of each observation. The horizontal axis represents the efficiency scores (hj*) of the online shopping
transactions, whereas the output level (y1) is represented on the vertical axis. The efficient transactions lie
on or near the right edge of the graph (h*j ≈ 1). Visual inspection of the graph shows that there is
significant variability in efficiency scores at all output levels, suggesting that the website may not be
entirely effective.
7 Some of these website functionalities are general, such as product page views, product list views, search, help and checkout. Others are more specific to the online grocery context. They include personal grocery lists, order history, recipes, etc. When applying our proposed website evaluation method, the inputs need to be determined in such a way to represent the major types of website functionalities relevant to the context at hand.
15
Figure 3. DEA Efficiency Scores by Output Level for Shopping Basket Size at Checkout
Bas
ket
Size
Efficiency Score (h)
Bas
ket
Size
Efficiency Score (h)
4.3.2. Inefficiency Results by Website Functionality
To gain insights into the potential causes of the observed overall website inefficiency, we
analyzed the inefficiencies by website functionality with the inefficiency metrics proposed earlier (see
Table 2). Recall that InefficiencyBreadthi (4th column) measures the proportion of DMUs for which
excess input for website functionality i was observed, or how widespread are the inefficiencies due to
website functionality i. For example, of all purchase transactions (J = 5,383), excess input for the first
website functionality (x1; ProductInformation) was observed for 2,272 DMUs (n1 = 2,272),
InefficiencyBreadth1 is thus 42.21% (i.e., 2,272/5,383 = 0.4221). We see that of the various types of
website functionalities, InefficiencyBreadth was greatest for ProductInformation (42.21%), then
Promotion (39.4%), PersonalList (31.4%) and Search (25.6%). Inefficiencies due to the remaining five
types of website functionalities (i.e., ProductList, OrderHistory, Recipe, Checkout and Help) were less
salient.

16
Table 2. Inefficiency of Web Site Functionality
VARIABLE (i) WEB SITE FUNCTIONALITY ni
INEFFICIENCY BREADTH
UNITINEFFICIENCY (Average)
x1 ProductInformation 2272 42.21% 0.3368 x2 ProductList 359 6.67% 0.3851 x3 PersonalList 1690 31.40% 0.2609 x4 OrderHistory 128 2.38% 0.1248 x5 Search 1378 25.60% 0.3415 x6 Promotion 2121 39.40% 0.1763 x7 Recipe 499 9.27% 0.1580 x8 Checkout 240 4.46% 0.1427 x9 Help 621 11.54% 0.0348
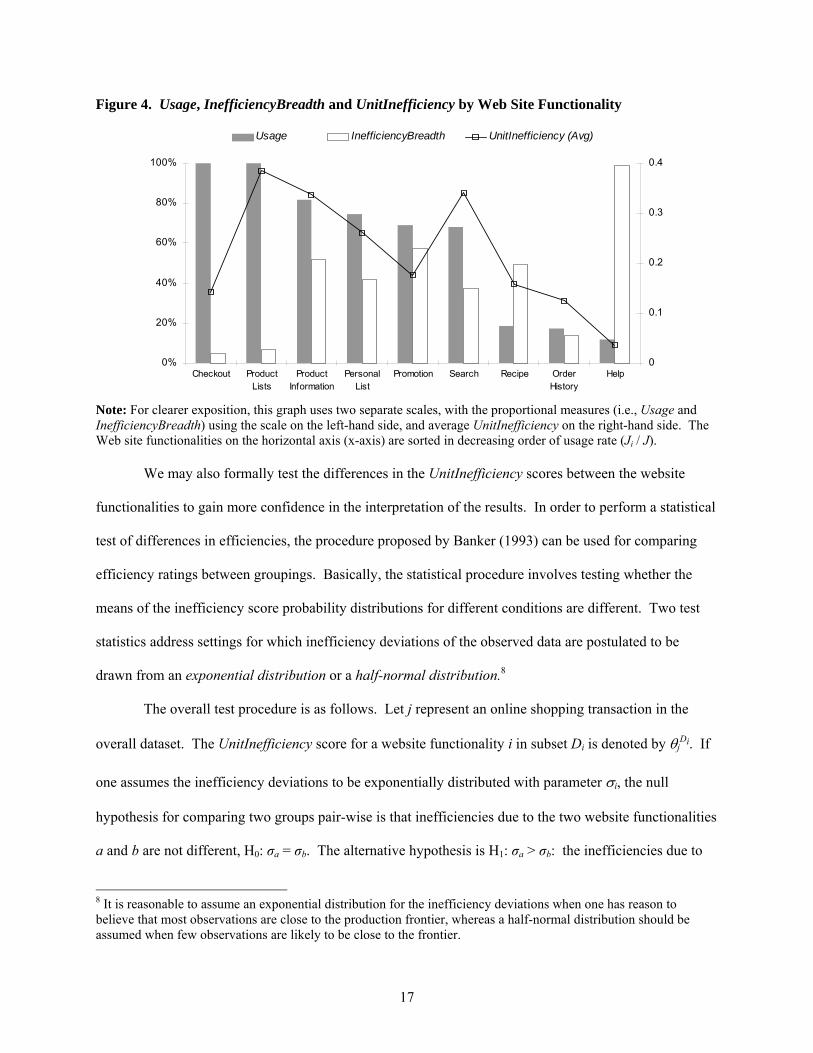
To gain further insights into how severe the observed inefficiencies were, we also investigate the
UnitInefficiency metric to gain more insights. Figure 4 charts the proportion of transactions that used
each website functionality (Usage); of those, how widespread inefficiencies were observed
(InefficiencyBreadth); and the average magnitudes of the observed inefficiencies per unit product at
checkout (UnitInefficiency). The results show that the types of website functionalities
ProductInformation, Search and PersonalList were most problematic in incurring inefficiencies at the e-
tailer’s website. Inefficiencies due to the types of functionalities OrderHistory, Help, Checkout and
Recipe also were quite insignificant. For example, we see that the website functionality of
ProductInformation was the area in which inefficiencies were not only the most widespread
(InefficiencyBreadth = 42.21%) but also the most severe (average UnitInefficiency = 0.337).
Inefficiencies due to OrderHistory were neither widespread nor serious though (InefficiencyBreadth =
2.38%, average UnitInefficiency = 0.125). We also observe interesting results for the functionality types
Promotion and ProductList. Inefficiencies due to Promotion were widespread (InefficiencyBreadth =
39.4%), but the degree of inefficiency was low (average UnitInefficiency = 0.176). Meanwhile, the scope
of inefficiencies due to ProductList was narrow (InefficiencyBreadth = 6.67%) but the degree of
inefficiency was quite substantial (average UnitInefficiency = 0.385).
17
Figure 4. Usage, InefficiencyBreadth and UnitInefficiency by Web Site Functionality
0%
20%
40%
60%
80%
100%
Checkout ProductLists
ProductInformation
PersonalList
Promotion Search Recipe OrderHistory
Help0
0.1
0.2
0.3
0.4
Usage InefficiencyBreadth UnitInefficiency (Avg)
Note: For clearer exposition, this graph uses two separate scales, with the proportional measures (i.e., Usage and InefficiencyBreadth) using the scale on the left-hand side, and average UnitInefficiency on the right-hand side. The Web site functionalities on the horizontal axis (x-axis) are sorted in decreasing order of usage rate (Ji / J).
We may also formally test the differences in the UnitInefficiency scores between the website
functionalities to gain more confidence in the interpretation of the results. In order to perform a statistical
test of differences in efficiencies, the procedure proposed by Banker (1993) can be used for comparing
efficiency ratings between groupings. Basically, the statistical procedure involves testing whether the
means of the inefficiency score probability distributions for different conditions are different. Two test
statistics address settings for which inefficiency deviations of the observed data are postulated to be
drawn from an exponential distribution or a half-normal distribution.8
The overall test procedure is as follows. Let j represent an online shopping transaction in the
overall dataset. The UnitInefficiency score for a website functionality i in subset Di is denoted by θjDi. If
one assumes the inefficiency deviations to be exponentially distributed with parameter σi, the null
hypothesis for comparing two groups pair-wise is that inefficiencies due to the two website functionalities
a and b are not different, H0: σa = σb. The alternative hypothesis is H1: σa > σb: the inefficiencies due to
8 It is reasonable to assume an exponential distribution for the inefficiency deviations when one has reason to believe that most observations are close to the production frontier, whereas a half-normal distribution should be assumed when few observations are likely to be close to the frontier.

18
website functionality a is greater than those due to website functionality b. The test statistic used is
( 1) ( 1)a b
a b
D Dj a j b
j D j Dn nθ θ
∈ ∈
− −∑ ∑ and it asymptotically follows the F-distribution with (2na, 2nb) degrees
of freedom for large n, where na and nb are the number of observations in the subsets Da and Db. But if
one assumes the inefficiency deviations to be half-normally distributed then the appropriate test statistic is
2 2( 1) ( 1)a b
a b
D Dj a j b
j D j Dn nθ θ
∈ ∈
− −∑ ∑ . This statistic again asymptotically follows an F-distribution with (na,
nb) degrees of freedom for large values of n.
Using these tests, we conducted pair-wise comparison of the UnitInefficiency scores for each type
of website functionality (see Table 3). We conducted all of the statistical tests at the 1% significance
level. The results show that, with a few exceptions, the rank ordering of the severity of inefficiencies by
website functionality seems to represent quite distinct levels of severity. For example, we see that
inefficiencies due to ProductList are more severe (in the statistical sense) than all inefficiencies due to all
other website functionalities. Inefficiencies due to Search and ProductInformation are not statistically
different, but these inefficiencies are more severe than inefficiencies due to all other types of website
functionalities except ProductList. The remainder of the results table can be interpreted in a similar
manner.9
9 Note that we are naively presenting these statistical test results without making use of additional background information that designers and managers would typically have in practice. For example, although we find that the Web site functionalities of ProductInformation, Search and PersonalList are the most problematic, the designers of the Web site may not find this result particularly alarming if they have reason to believe that those functionalities are inherently inefficient. In other words, Web site designers may (and should) incorporate their prior knowledge as benchmark expectations. The purpose of this exposition is to illustrate that such statistical testing is possible, not to formally test any hypothesis about the efficacy of various Web site functionalities.

19
Table 3. Statistical Pair-Wise Comparison of UnitInefficiency for Web Site Functionalities
SITE FUNCTIONALITIES SITE FUNCTIONALITY DIMENSIONS (1) (2) (3) (4) (5) (6) (7) (8) (9) (1) ProductList H E E, H E, H E, H E, H E, H E, H (2) Search E, H E, H E, H E, H E, H E, H (3) ProductInformation E, H E, H E, H E, H E, H E, H (4) PersonalList E, H E, H E E, H E, H (5) Promotion E, H E, H E, H (6) Recipe H E, H (7) Checkout H H E, H (8) OrderHistory E, H (9) Help Note: The comparisons are from row to column. “E” denotes statistically significant differences in UnitInefficiency scores between the Web site functionality of the row and the Web site functionality of the column under the assumption of exponentially-distributed UnitInefficiency scores. “H” denotes a statistically significant difference when assuming the UnitInefficiency scores follow a half-normal distribution.
Until now, we have presented general results from using the website evaluation method in
identifying potentially problematic website areas. There are numerous ways in which insightful analyses
can be conducted. A simple extension is to divide the dataset into multiple groups to see if observed
website inefficiencies are similar or different across groups of customers. For example, the dataset could
be divided based on demographics or on the length of relationship with the online service, for example,
loyal and frequently returning customers vs. newly registered customers. This would enable us to see
whether or not different customer segments exhibit differences in overall inefficiencies or if a different set
of website functionalities are problematic for different customer segments. We conduct this analysis next.
Inefficiency Results by Customer History. To verify whether loyal and frequently returning customers
exhibit differences in terms of website usage and website efficiency with newly registered customers, we
divided our sample of customers based on the number of prior purchases at the online grocer. We
categorized customers into two groups representing the first and last quartiles in number of prior
purchase transactions (ntrans). The first group represents newly registered customers who have made 4
or less transactions at the online grocer (i.e., ntrans ≤ 4); the second group represents loyal customers who
have made more than 16 purchases (i.e., ntrans > 16). Figure 5 compares the overall usage and
InefficiencyBreadth metrics by website functionality between the two groups. First, in terms of usage, we

20
see that although Checkout and Product List functionalities are used universally regardless of customer
history, other functionalities show differences. For example, loyal customers (i.e., ntrans > 16) use the
PersonalList and Search functionalities more extensively than the newer customers (i.e., ntrans ≤ 4);
whereas the Recipe, OrderHistory and Help functionalities are used more extensively by newer customers
compared to the loyal and frequent customers. When we consider InefficiencyBreadth, we see that a
slightly different picture emerges. For example, it is interesting to note that although loyal customers use
the PersonalList functionality more than the newer customers, they are more inefficient at it. This is quite
surprising as the online grocer developed the PersonalList functionality specifically to cater to frequently
returning shoppers. In addition to providing the customer with the ability to create customized lists for
easy access (e.g., a list of grocery items for a barbeque party), the PersonalList also supports regular
grocery purchases by automatically compiling all items that were previously purchased. Since grocery
shopping typically involves repetitive purchases for replenishment, this functionality was specifically
designed to help the frequent shopper. The results suggest that this design goal was not met.
Figure 5. Usage, InefficiencyBreadth by Customer History
Inefficiency Results by Output Volume. To further demonstrate the value of the proposed evaluation
method and also further investigate the reasons behind the above surprising result, we investigated
website inefficiencies by output volume. The key question that guides this analysis is whether output

21
volume has an impact on efficiency. Since customers that conduct high volume transactions may exhibit
different purchasing and website interaction behaviors from those that conduct lower volume ones, we
analyzed the DEA results to explore these issues (see Figure 6).
Figure 6. Distribution of UnitInefficiency Scores by Output Volume and Functionality ProductInformation ProductList PersonalList
OrderHistory Search Promotion
Recipe Checkout Help
Note: The height of the surface shows the proportion of transactions in which a particular UnitInefficiency value was observed for a particular output volume.
Figure 6 shows the distributions of UnitInefficiency values by output volume for each of the
website functionalities. Several results are noteworthy. The distribution of UnitInefficiency values is
skewed with most observations in the lower range with a long tail. UnitInefficiency seems to follow an
exponential or half-normal distribution rather than a symmetric distribution such as the normal

22
distribution. Second, we reconfirm some of the insights that we discussed previously. On average,
UnitInefficiency was most salient for website functionalities ProductInformation, Promotion, Search and
PersonalList. This can be seen by observing the heights of the surface plots. Closer investigation
indicates that higher volume transactions seem to be relatively more likely to incur inefficiencies than
lower volume ones, regardless of the website functionality. This suggests that the website may be geared
toward supporting smaller carts more effectively than larger ones.
The last finding is interesting when we consider the nature of the products being sold by the
online grocer and how this impacts consumer purchase behaviors. The overall design strategy of the
current website is typical in Internet-based selling, with hierarchical product categories for drill-down, a
search function, basic checkout functions, help pages and promotional pages for specials and recipes.
What the results may be suggesting is that even though such a design strategy may be effective for e-
tailers where the typical number of products being purchased is small with a cart size of 1 to 5 items, a
different overall design strategy may be required to support grocery shopping where the number of
different items being purchased is larger, for example, a cart size of 40-plus items.
When we relate this with our results earlier, we may hypothesize about the reasons why loyal and
frequent shoppers exhibited greater inefficiency with respect to the Personal List functionality compared
to the newer customers. Loyal and frequent shoppers have purchased more items. Hence, their personal
lists are more populated compared to newer customers. The frequent shoppers have to deal with a greater
number of items when using this functionality, which may be causing information overload and
consequently inefficient use. This is similar to our observation of greater inefficiency for larger cart sizes.
Such analyses and insights have prompted the online grocer to further investigate the effectiveness of the
personal list functionality and subsequently redesign it so that it is more efficient for large cart sizes and
purchase histories.

23
5. CONCLUSION AND DISCUSSIONS
Evaluating the effectiveness of e-commerce website design is an important, yet complex problem
for e-commerce retailers. Their success hinges largely on their ability to provide a high-quality website.
So e-commerce retailers need to constantly monitor the effectiveness of their web-based storefronts to
identify those website areas that are problematic. However, current methods do not offer any practical
means for a solution to this problem. We proposed an innovative method for identifying e-commerce
website inefficiencies.
5.1. Contributions
By modeling online shopping as an economic production process and using evaluative methods
for frontier analysis, we defined and estimated a productivity-based model for website effectiveness that
allows us to identify problematic areas within the site. We also demonstrated the value of our method by
applying it to the evaluation of a real-world e-commerce website. Through the application, it was
possible to gain a deeper understanding of which website functionalities were potentially problematic. It
was also possible to discover unexpected knowledge related to the potential inappropriateness of the
design of some of the functionalities of the e-tailer’s website. Such knowledge discovery provides a
useful starting point for delving deeper into these issues.
The proposed website evaluation method provides significant benefits over current methods that
are used widely. Our empirical insights could not have been uncovered using the traditional methods of
user testing, inspection or inquiry. One of the major advantages of the proposed method is that firms can
make use of observable customer actions for all users and customers at a given website. In fact, the
problem of scalability is a major concern with the previous evaluation methods. With user testing, for
instance, deciding on the adequate number of subjects to test for a representative picture of website
usability problems is still in debate (Bevan et al. 2003, Spool and Schroeder 2001). Also, it is difficult for
usability experts to be able to identify all usability problems that may arise for the wide variety of
different users who may be customers at the website due to bounded rationality (Fu et al. 2002). We are
not arguing, however, that traditional testing, inquiry and inspection do not provide value. Instead, these

24
methods have their own specific complementary strengths, especially during the design stages in the
systems development life cycle before a site is launched. Consequently, they should be employed in
conjunction with the proposed method. For example, user satisfaction is an important attribute of
usability that can only be measured with inquiry techniques, such as surveys or interviews.
Our method also provides the benefit of an unobtrusive approach to data collection. Although
online user surveys leverage available web technologies, and are widely adopted, response bias (Schwarz
1999) and non-response bias (Andrews et al. 2003) will persist. Moreover, with the frequent website
redesigns, it becomes difficult to solicit continuous responses for each redesign. A major benefit of the
proposed method is that one may bypass the aforementioned problems by making use of automatically-
collected web server logs of customer web navigation behavior that occur in a genuine real-world setting.
The empirical methods we used do not employ any proprietary data specific to our particular research site.
Indeed, we expect that the required data will be available to all e-commerce firms. So the proposed
method should be readily applicable to any transactional e-commerce website. With some additional
effort, the data preparation and even the DEA programs can be systematically programmed into the web
application servers. This makes it possible to automatically generate metrics so that e-commerce
managers can continuously monitor the effectiveness of their website without incurring the costs of
extraneous data collection and tedious analysis.
5.2. Limitations and Future Research
We should also acknowledge a number of caveats and considerations with respect to the
interpretation of the results of this study, as well as the implementation of the proposed method. Even
though the value of the proposed website evaluation method can be inferred by the interesting results
enumerated above, care must be taken not only when interpreting the results but also when trying to apply
the method more broadly. For example, the results show that the some website functionalities (e.g.,
Product List, Search and Product Information) were more problematic than others (e.g., Help, Order
History and Checkout). However, the reader should not over-generalize and assume that these website
functionalities would also be problematic on other e-commerce websites. The main focus of our

25
evaluation method proposed here is not in uncovering universal design guidelines that may be applied to
any setting (e.g., identifying the optimal organization of product hierarchies in an e-commerce website).
Instead, the focus of the proposed evaluation method is to provide to managers at e-commerce firms
useful feedback concerning how their customers are performing in the presence of their current website
designs.
Furthermore, it is important to note that the data collection window of two weeks could have
introduced bias in the dataset; only transactions completed within the two-week window are included.
This is an important concern since many online consumers engage in “look-to-book” type shopping.10
Consequently, the results of the current analyses need to be interpreted with this limitation in mind. That
said, our method could be applied with a more complex model that tracks consumer purchases for a
longer period so that such situations might also be handled.
Another data-related limitation and concern relates to the timeframe of the data that we used. Our
data are from 2001 to 2002. A natural question that arises is whether our proposed method is applicable
to the usability evaluation of more contemporaneous websites. Without access to recent data, it is not
possible to make definitive comments on this issue. However, we feel that our method still applies. Our
reasoning for this is that the design and operation of e-commerce websites have not fundamentally
changed since our data collection period. This is true for the firm that hosted this study, too, even though
it is no longer directly available to us for additional data collection. The general approach to e-commerce
website design has remained relatively stable, with drill-down of product categories as the basic
navigational mechanism, and recommendations (e.g., promotions) and search as supporting navigational
functions. No doubt, customers’ online shopping behaviors may have evolved since the early stages of e-
commerce. For example, with the reduction of search costs for shopping in electronic marketplaces,
customers may conduct more price comparisons across retailers, rather than relying on a single retailer’s
10 “Look-to-book” type shopping is where the customer adds items to the cart not for the purpose of immediate purchase, but to keep track of items of interest. For example, when a consumer identifies an interesting book on Amazon.com she would put that item in her cart to keep track of it. However, the actual purchase transaction at checkout may occur at a later point in time when several such “look-to-book” sessions have been aggregated.
26
website. Nevertheless, we believe that consumer behavior has remained relatively stable, especially
customer website usage behaviors within a website.
Another limitation stems from the assumptions of the production model. The production model is
essentially additive in that the use (or consumption) of inputs contributes independently to the production
of outputs. In other words, our method currently does not allow for investigating interaction effects in
website functionalities. Our future research agenda includes extending the online shopping model so that
such interaction effects can also be addressed.
We also acknowledge potential concerns relating to the applicability of our proposed method to
other contexts of Internet-based selling. In our currently study, we have applied our method to gain
insights into the effectiveness of the website of an online grocer. An important characteristic of the
grocery domain is that purchase behaviors are primarily goal-directed. In our analyses, we have
instantiated our online shopping model to take into account this aspect. For example, we have modeled
the online shopping production process with an input-oriented production framework, which is more
appropriate for goal-directed purchasing. Other e-commerce websites that deal with different types of
goods (e.g., books, CDs, DVDs, apparel etc.) may need be evaluated with a different modeling
perspective depending on the nature of the purchase behaviors that are typically expected for such
websites. For instance, in the case of Internet-based selling of clothes, consumer purchase behaviors will
typically entail experiential or hedonic shopping motives. In such cases, the online shopping production
process should be instantiated with an output-oriented model focusing on maximizing the level of outputs
given a level of inputs. With this modeling perspective, website navigation behaviors that results in more
products identified, considered and purchased given the same amount of website use would be regarded
as more effective. The proposed model and method is general enough so these different types of
consumer behaviors can be appropriately captured.
Even if the proposed usability evaluation method can in fact be applied to Internet-based selling
websites that deal with different types of products and shopping motives, we also need to think about
whether the proposed method can effectively be applied to non-commercial web-based applications.
27
These include search engines, online portals, informational websites, etc. We believe that our proposed
method works as long as the production analogy is appropriate. So, if it is appropriate to model human-
computer interaction behavior as a production process, our method will be applicable. The production
framework and the efficiency orientation are consistent with information foraging theory, which has been
widely used in the human-computer interaction literature. It posits that people modify their information-
seeking strategies or the structure of the information environment to maximize their rate of gaining
valuable information. This refers to the maximization of valuable information while minimizing the use
of different information-seeking strategies. This is in line with the production efficiency paradigm used
here. We acknowledge, however, that the production framework applies more easily in the context of
transactional e-commerce websites due to the relatively unambiguous characterization of inputs, and more
importantly outputs, especially if defined as products purchased. For informational websites, it may be
more difficult to distinguish between genuine outputs and false positives. For example, if a user retrieves
a particular web page, how can we be sure that that page contains information that the user is seeking,
rather than a page a user mistakenly retrieved. In e-commerce, this is not problematic because if a
consumer purchases an item (or adds the item to her shopping cart), then we can reasonably assume that
she was seeking that item. Techniques for inferring user needs from observable clickstream behaviors
should prove to be valuable (Chi et al. 2001). Moreover, we believe that some mismeasurement –
whatever source it emanates from – is inevitable in the kinds of real-world contexts that we are discussing.
Finally, as we discussed at the outset, the proposed evaluation method is intended to be used as a
tool for the continuous management of website quality. The rationale is similar in spirit to an important
research stream in software engineering economics, where metrics for evaluating software development
and maintenance productivity have been developed as a vehicle for managing and maximizing the value
of software development projects (Banker et al. 1991, Banker and Kauffman 1991, Banker and Slaughter
1997, Chidamber et al. 1998). Likewise, the proposed evaluation method is intended for use within a firm
for managing its website development initiatives.
28
Given such a use context, we need to discuss the broader applicability issues within the context of
systems development for Internet-based selling. Recall from our earlier discussion that one of the major
goals of this research is to propose a website evaluation technique that provides automated analysis
capabilities to help deal with faster software development life cycles by minimizing, or at least reducing
the evaluation costs at each redesign. But automation is not free. For such automation to seamlessly
occur, the website development process must incur additional costs of designing the user interface so that
the log data that are automatically collected are in a structure and form that can be readily analyzed. For
example, developers may need to incorporate additional flags in the web application code so that it is
easier to automatically identify customers, transactions, sessions, page views and also the content within
the web pages shown. Such additional activities may increase the level of complexity in the design and
consequently increase the difficulty and costs of functional testing and debugging. There are even firms
that believe that the world is changing so fast that any attempt at analysis is fruitless since it would deter
them from quickly adapting to take advantage of emerging market opportunities. However, as Andreas
Weigend, former chief scientist at Amazon.com and one of the world’s leading data mining experts, notes,
the benefits of making better decisions based on careful analyses of implicit behavioral data (e.g.,
clickstream data) far outweigh the extra costs of developing and maintaining information systems that
support such analyses (Wegner 2005).
REFERENCES
Agarwal, R. and V. Venkatesh. 2002. Assessing a firm's web presence: A heuristic evaluation procedure for the measurement of usability. Information Systems Research 13(2) 168-186.
Aigner, D. J. and S. F. Chu. 1968. On estimating the industry production function. American Economic Review 58(4) 826-839.
Anderson, J., F. Fleak, K. Garrity and F. Drake. 2001. Integrating usability techniques into software development. IEEE Software 18(1) 46-53.
Anderson, L. 2002. In search of the perfect web site. Smart Business (March) 60-64. Andrews, D., B. Nonnecke and J. Preece. 2003. Electronic survey methodology: A case study in reaching
hard-to-involve Internet users. International Journal of Human-Computer Interaction 16(2) 185-210.
Baker, S. 2008. The Numerati. Houghton Mifflin Company, Boston, MA. Banker, R. D. 1993. Maximum likelihood, consistency and data envelopment analysis: A statistical
foundation. Management Science 39(10) 1265-1273.

29
Banker, R. D. and S. A. Slaughter. 1997. A field study of scale economies in software maintenance. Management Science 43(12) 1709-1725.
Banker, R. D., A. Charnes and W. W. Cooper. 1984. Some models for estimating technical and scale inefficiencies in data envelopment analysis. Management Science 30(9) 1078-1092.
Banker, R. D. and R. J. Kauffman. 1991. Reuse and productivity: An empirical study of integrated computer-aided software engineering (ICASE) at the First Boston Corporation. MIS Quarterly 15(3) 374-401.
Banker, R. D., S. M. Datar and C. F. Kemerer. 1991. A model to evaluate variables impacting the productivity of software maintenance projects. Management Science 37(1) 1-18.
Banker, R. D., W. W. Cooper, L. M. Seiford, R. M. Thrall and J. Zhu. 2004. Returns to scale in different DEA models. European Journal of Operational Research 154(2) 345-362.
Bettman, J. R. 1979. An Information Processing Theory of Consumer Choice. Addison-Wesley, Reading, MA.
Bevan, N., C. Barnum, G. Cockton, J. Nielsen, J. M. Spool and D. Wixon. 2003. Panel: The 'magic number 5:' is it enough for web testing? G. Cockton and P. Korhonen eds. Proceedings of the 2003 ACM Conference on Human Factors in Computing Systems, Ft. Lauderdale, FL, ACM Press, New York, NY, 698-699.
Bucklin, R. E., J. M. Lattin, A. Ansari, D. Bell, E. Coupey, S. Gupta, J. D. C. Little, C. Mela, A. Montgomery and J. Steckel. 2002. Choice and the Internet: from click stream to research stream. Marketing Letters 13(3) 235-258.
Charnes, A., W. W. Cooper and E. Rhodes. 1978. Measuring efficiency of decision-making units. European Journal of Operations Research 2(6) 428-449.
Charnes, A., W. W. Cooper and E. Rhodes. 1981. Evaluating program and managerial efficiency: An application of data envelopment analysis to program follow through. Management Science 27(6) 668-697.
Charnes, A., W. W. Cooper, A. Y. Lewin and L. M. Seiford. 1994. Data Envelopment Analysis: Theory, Methodology, and Applications. Kluwer Academic Publishers, Boston, MA.
Chi, E. H., P. L. T. Pirolli, K. Chen and J. E. Pitkow. 2001. Using information scent to model user information needs and actions on the web. J. A. Jacko and A. Sears and M. Beaudouin-Lafon and R. J. K. Jacob eds. Proceedings of the 2001 ACM Conference on Human Factors in Computing Systems, Seattle, WA, ACM Press, New York: NY, 490-497.
Chidamber, S. R., D. P. Darcy and C. F. Kemerer. 1998. Managerial use of metrics for object oriented software: An exploratory analysis. IEEE Transactions on Software Engineering. 24(8) 629-639.
Cooley, R., B. Mobasher and J. Srivastava. 1999. Data preparation for mining world wide web browsing patterns. Journal of Knowledge and Information Systems 1(1) 5-32.
Cooper, W. W., L. M. Seiford and J. Zhu. 2004. Handbook on Data Envelopment Analysis. Kluwer Academic Publishers, Boston, MA.
Cooper, W. W., L. M. Seiford and K. Tone. 2000. Data Envelopment Analysis: A Comprehensive Text with Models, Applications, References, and DEA-Solver Software. Kluwer Academic Publishers, Boston, MA.
Davenport, T. H. and J. G. Harris. 2007. Competing on Analytics: The New Science of Winning. Harvard Business School Press, Boston, MA.
Dorsey, M., H. Manning and C. L. Carney. 2006. Death by a thousand cuts kills web experience, Forrester Research Inc., Cambridge, MA.
Fu, L., G. Salvendy and L. Turley. 2002. Effectiveness of user testing and heuristic evaluation as a function of performance classification. Behaviour Inform. Tech. 21(2) 137-143.
Howard, J. A. and J. N. Sheth. 1969. The Theory of Buyer Behavior. John Wiley & Sons, New York, NY. International Organization for Standardization (ISO). 1998. Ergonomic requirements for office work with
visual display terminals (VDTs): Guidance on usability (ISO 9241-11), Geneva, Switzerland. Ivory, M. Y. and M. A. Hearst. 2001. The state of the art in automating usability evaluation of user
interfaces. ACM Computing Surveys 33(4) 470-516.

30
Kotha, S., M. Venkatachalam and S. Rajgopal. 2004. The role of online buying experience as a competitive advantage: Evidence from third-party ratings for e-commerce firms. Journal of Business 77(2) S109-S133.
LeClaire, J. 2006. Web site design impacts online sales, E-Commerce Times (January 26), http://www.ecommercetimes.com/story/48416.html.
Nielsen, J. and R. L. Mack. 1994. Usability Inspection Methods. John Wiley & Sons, New York, NY. Novak, T. P., D. L. Hoffman and Y.-F. Yung. 2000. Measuring the customer experience in online
environments: A structural modeling approach. Marketing Science 19(1) 22-42. O'Keefe, R. M. and T. McEachern. 1998. Web-based customer decision support systems.
Communications of the ACM 41(3) 71-78. Pirolli, P. L. T. and S. K. Card. 1999. Information foraging. Psychological Review 106(4) 643-675. Rizzuti, K. and J. Dickinson. 2000. Satisfying the experienced on-line shopper: Global e-shopping survey,
A.T. Kearney, London, UK. Schubert, P. and D. Selz. 1999. Web assessment: Measuring the effectiveness of electronic commerce
sites going beyond traditional marketing paradigms. R. H. Sprague ed. Proceedings of the 32nd Hawaii International Conference on System Sciences, Maui, HI, IEEE Computer Society Press, Los Alamitos, CA.
Schwarz, N. 1999. Self-reports: How the questions shape the answers. American Psychologist 54(2) 93-105.
Spool, J. M. and W. Schroeder. 2001. Testing web sites: Five users is nowhere near enough. J. A. Jacko and A. Sears eds. Proceedings of the 2001 ACM Conference on Human Factors in Computing Systems, Seattle, WA, ACM Press, New York, NY, 285-286.
Spool, J. M., T. Scanlon, W. Schroeder, C. Synder and T. DeAngelo. 1999. Web Site Usability: A Designer's Guide. Morgan Kaufmann Publishers, San Francisco, CA.
Tedeschi, B. 2000. Easier-to-use sites would help e-tailers close more sales. The New York Times (June 12) C14.
Thomas, R. R., R. S. Barr, W. L. Cron and J. W. Slocum, Jr. 1998. A process for evaluating retail store efficiency: A restricted DEA approach. International Journal of Research in Marketing 15(5) 487-503.
Venkatesh, V. and R. Agarwal. 2006. Turning visitors into customers: A usability-centric perspective on purchase behavior in electronic channels. Management Science 52(3) 367-382.
Webcredible, 2008. The online High Street: Ecommerce usability for UK High Street retailers in 2008, Webcredible, London.
Wegner, J. 2005. I search, therefore I am. SASCOM, First Quarter 37-41.
Top Related