


Languages
Pages
Legal

TECHNISCHE UNIVERSITÄT MÜNCHEN
Lehrstuhl für Entwicklungsgenetik
Identification and analysis of the cis-regulatory element for the AID-
mediated somatic hypermutation and application of this process for the
artificial protein evolution in chicken B-cell line DT40
Vera Batrak
Vollständiger Abdruck der von der Fakultät Wissenschaftszentrum Weihenstephan für
Ernährung, Landnutzung und Umwelt der Technischen Universität München zur Erlangung
des akademischen Grades eines
Doktors der Naturwissenschaften
genehmigten Dissertation.
Vorsitzender: Univ.- Prof. Dr. S. Scherer
Prüfer der Dissertation:
1. Univ.- Prof. Dr. W. Wurst
2. Univ.- Prof. Dr. M. J. Atkinson
Die Dissertation wurde am 23.06.2009 bei der Technischen Universität München
eingereicht und durch die Fakultät Wissenschaftszentrum Weihenstephan für Ernährung,
Landnutzung und Umwelt am 27.10.2009 angenommen.

ii
SUMMARY
Somatic hypermutation (SHM) is one of three mechanisms of immunoglobulin (Ig)
gene diversification at the post-V(D)J-recombination stage. Depending on species SHM is
responsible for antibody repertoire production and/or affinity maturation of germinal centre B
lymphocytes. The diversification process involves introducing non-template mutations into
the Ig gene at a rate which is 106
higher than the spontaneous mutation rate in somatic cells.
SHM is initiated by activation-induced cytidine deaminase (AID), an enzyme that deaminates
cytosine residues in transcription-dependent manner and completed by error-prone repair of
the resulted uracils.
SHM is specific for the Ig locus; other transcribed genes of B-cells do not undergo
mutations at such a high rate. When mistargeted, hypermutation represents a threat to genome
integrity and was shown to be associated with a number of B-cell lymphomas. Although there
have been identified a number of factors including cis- and trans- regulatory elements which
seem to play a role in recruiting of the SHM to the Ig locus, unambiguous element responsible
for the SHM targeting has not been identified and mechanisms of this process remain unclear.
The present study describes the generation of a reporter for somatic hypermutation
which allowed deletion analysis of the Ig light chain (IgL) locus of the DT40 B-cell line in
order to identify a cis-regulatory element responsible for activation of the hypermutation.
Deletion of this element, extending for 9.8 kb from the IgL transcription start site towards the
next downstream locus, named DIVAC for diversification activator, abolished hypermutation.
It was also shown that DIVAC is able to act over a distance in both directions, which allowed
suggesting of a model for the action of this element.
Also the study describes the generation of a second type of a hypermutation vector
which allowed biotechnological exploitation of the somatic hypermutation. Use of this vector
and the DT40 cell line allowed the specific and efficient mutation of a transgene placed within
the Ig locus. This strategy permits optimization of in situ directed protein evolution based on
hypermutation. This artificial evolution system has a number of advantages compared to the
known methods of in vitro and in situ directed evolution and can be applied for optimization
of any gene whose phenotype can be screened in DT40 cells. Using the described system it
was possible to optimize both green and red fluorescent proteins and generate variants with
higher fluorescent intensity and spectrally shifted emissions.

iii
ZUSAMENFASSUNG
Die Somatische Hypermutation (SHM) ist einer von drei Mechanismen des
Rearrangements der Immunoglobulin(Ig)-Gene, die im Anschluss an die V(D)J
Rekombination stattfindet und, je nach Spezies, entweder für das Antikörperrepertoire
und/oder für Reifung von Antikörper-Affinität verantwortlich ist. Durch die SHM werden
Zufallsmutationen in das Ig Gen eingeführt, wobei die Mutationshäufigkeit um bis zu 106-
fach höher ist als die spontane Mutationsrate in somatischen Zellen. SHM wird während der
Transkription durch Deaminierung von Cytosin durch das Enzym Aktivierungsinduzierte
Cytidin Deaminase (AID) ausgelöst und durch eine fehlerhafte DNA-Reparatur des daraus
resultierenden Uracils abgeschlossen.
SHM ist spezifisch für den Ig Locus, während andere transkribierte Gene in B-Zellen
nicht eine solche hohe Mutationshäufigkeit zeigen. Bei fehlerhafter unspezifischer Aktivität
von AID stellt die SHM aber eine Gefahr für die Integrität des Genoms und wird mit
verschiedenen B-Zell Lymphomen in Zusammenhang gebracht. Es ist noch weitgehend
unklar, welche Mechanismen dazu führen, dass SHM auf den Ig-locus beschränkt ist.
In dieser Arbeit ist die Entwicklung eines Reporterkonstrukts zum Nachweis der SHM
beschrieben, das erlaubte eine Deletionsanalyse des Ig-Leichtkettenlocus der DT40 B-
Zelllinie durchzuführen. Dabei wurde das cis-regulatorisches Element (DIVAC,
Diversification Activator) entdeckt, das für die Auslösung von SHM verantwortlich ist. Bei
Deletion von DIVAC konnte keine SHM mehr nachgewiesen werden. Des weiteren wurde
auch bestimmt, über welche genomischen Distanzen DIVAC seine Funktion entfalten kann.
Diese Ergebnisse erlaubten die Erstellung eines Modells zur Funktionsweise von DIVAC
während der SHM.
Darüberhinaus wird in dieser Arbeit auch die Entwicklung eines Vektors beschrieben,
der eine biotechnologische Anwendung der SHM möglich macht. Der Vektor ist für die
Zellinie DT40 konstruiert und ermöglicht ein beliebiges Transgen spezifisch und effizient im
Ig Locus durch SHM zu mutieren. Das daraus resultierende System der künstlichen in situ
Proteinevolution hat eine Reihe von Vorteilen zu bereits etablierten Methoden, Proteine in
vitro oder in situ artifiziel zu verändern. SHM kann zur Optimierung eines jeden Proteins
angewendet werden, dessen Phänotyp in der DT40 Zellinie erkennbar ist. Im Rahmen dieser
Arbeit war es daher möglich, grün und rot fluoreszierende Proteine zu optimieren, wobei
sowohl Varianten mit erhöhter Fluoreszensintensität als auch mit Verschiebung des
Emissionsspektrums entwickelt wurden.

iv
ABBREVIATIONS
AID Activation Induced Cytidine Deaminase
APOBEC-1 Apolipoprotein B RNA Editing Catalytic Polypeptide 1
BDT Big Dye Terminator
BSR Blasticidine S Resistance gene
C region Immunoglobulin Constant region
CIP Calf Intestine Phosphatase
CSR Class Switch Recombination
D region Immunoglobulin Diversity region
DMSO Dimethyl Sulfoxide
dNTP Deoxynucleotide Triple Phosphate
DSB Double Strand Break
EDTA Ethylene di-Amine Tetra Acetic Acid
EF Elongation Factor
FACS Fluorescence Activated Cell Sorting
FBS Fetal Bovine Serum
FRET Fluorescence Resonance Energy Transfer
FSC Forward Scatter
EtBr Ethidium Bromide
GC Gene Conversion
GFP Green Fluorescent Protein
GPT Guanine Phosphoribosyl Transferase
4-HT 4-Hydroxy Tamoxifen
Ig Immunoglobulin
IgL Immunoglobulin Light Chain
IRES Internal Ribosome Entry Site
J region Immunoglobulin Joining region
LB Luria Broth
MAR Matrix Attachment Region
MMR Mismatch Repair
NHEJ Nonhomologues End Joining
PBS Phosphate Buffer Saline
PCR Polymerase Chain Reaction
pKS (+) pBluescript vector
Pol Polymerase
Puro Puromycin
RFP Red Fluorescent Protein
RSV Rous Sarcoma Virus
S region Switch region
SDS Sodium Dodecyl Sulphate
SHM Somatic Hypermutation
sIgM Surface Immunoglobulin M
SSB Single Strand Break
TAE Tris Acetic Acid ETDA
TE Tris EDTA
TLS Trans Lesion Synthesis
UNG Uracil DNA Glycosylase
V region Immunoglobulin Variable region
2YT 2 x Yeast Extract Tryptone

v
TABLE OF CONTENTS
SUMMARY II
ZUZAMMENFASSUNG III
ABBREVIATIONS IV
TABLE OF CONTENTS V
INTRODUCTION
I. Evolution of the immune system 1
II. Immunoglobulin repertoire generation in gnathostomata 3
1. V(D)J recombination 3
2. Post-V(D)J remodeling of the immunoglobulin gene 4
a. Gene conversion 4
b. Somatic hypermutation 5
c. Class switch recombination 6
III. B- lymphocytes development 8
1. Mouse and human 8
2. Gallus gallus and other species with post-V(D)J-Ig repertoire formation 9
IV. Chicken B-cell line DT40 10
1. Unique characteristics of DT40 10
2. Elimination of gene conversion in DT40. Cross talk between gene conversion
and somatic hypermutation 11
V. Molecular mechanism of somatic hypermutation 13
1. First phase: cytidine deamination by AID 13
2. Processing the AID-generated mismatches 14
a. Uracil excision by UNG 15
b. Mismatch repair 16
c. Translesion synthesis 17
d. Triggering of the translesion synthesis by PCNA 19
VI. Ig locus specificity of somatic hypermutation 20
1. Cis-acting DNA elements 20
2. Trans-acting factors 22
3. Chromatin structure 22
4. Cell cycle restriction 23
5. Subcellular localization 24
VII. Application of the somatic hypermutation and gene conversion for biotechnology 24

vi
1. Green and red fluorescent proteins as objects for the directed protein
evolution in vitro 25
2. Using of in situ directed protein evolution based on hypermutation 26
OBJECTIVES 29
MATERIALS AND METHODS
I. Materials 30
1. Equipment 30
2. Experimental kits 30
3. Enzymes 30
4. DNA size marker 31
5. Plasmids 31
6. Bacterial strain 31
7. Mammalian cell line 31
8. Media 31
9. Oligonucleotides 32
II. Methods 34
1. Polymerase Chain Reaction (PCR) 34
2. Analysis of DNA by electrophoresis 34
3. Restriction enzyme digestion 34
4. Purification and gel purification of DNA 34
5. DNA ligation 35
6. Culture of E.coli 35
7. E.coli DH5α competent cell preparation 35
8. Transformation 36
9. Colony PCR 36
10. Plasmid preparation 36
11. Determination of DNA and RNA concentration 36
12. Basic cell culture techniques 37
13. Thawing of DT40 cells 37
14. Freezing down of DT40 cells 37
15. Transfection 37
16. Identifying Targeted Events by PCR 38
17. Subcloning of DT40 cells 38
18. Drug resistance marker recycling 38
19. Flow cytometry 39
20. Fluorescence Activated Cell Sorting (FACS) 39
21. Genomic DNA isolation 39
22. Total RNA isolation 40
23. First strand cDNA synthesis 40
24. Fluorescent spectra measurement in DT40 40

vii
RESULTS
I. Application of somatic hypermutation for artificial protein evolution 41
1. Improvement of the artificial evolution system and application for
optimization of the GFP proteins 41
a. Analysis of the mutations responsible for the increase of the eGFP
brightness 41
b. Construction of a vector pHypermut2 for improvement of the artificial
evolution system 42
c. Confirmation of the new GFP phenotypes 46
d. Development of chimeric GFP variants for an additional
increase of brightness 47
e. Spectral properties of the brightest GFP variants 49
2. Application of the advanced artificial evolution system for optimization of the
RFP proteins 50
1. EqFP615 and strategy for its improvement by somatic hypermutation 50
2. Generation of the RFP variants with increased fluorescence and far-red
shifted emission spectrum 52
3. Spectral characteristics of the new RFP variants 57
4. Analysis of the mutations responsible for the RFP improvement 58
5. Confirmation of the new RFP phenotypes 60
II. Identification and characterization of a cis-acting diversification activator
necessary for the AID mediated hypermutation 63
1. Construction of a GFP2 - reporter for somatic hypermutation activity 63
2. Identification of a cis-regulatory element for the somatic hypermutation 65
3. Distance of the bidirectional effect of the cis-regulatory element
for hypermutation 70
DISCUSSION
I. Application of the somatic hypermutation for artificial protein evolution 77
II Identification of a cis-acting diversification activator both necessary
and sufficient for the AID mediated hypermutation 84
REFERENCES 87
PUBLICATION LIST 102
ACKNOWLEDGEMENTS 104
LEBENSLAUF 106

1
INTRODUCTION
I. Evolution of the immune system
The major part of the earth biomass consists of microorganisms, many of which are
pathogens capable of causing life-threating infections to other organisms. The first host
response to infection is innate immunity, which is based on the recognition of specific
pathogen-associated molecular patterns (PAMPs) by germ-line encoded Toll-like receptors
[1]. Some of the innate immunity pathways are conserved between plants and animals that are
divided by billions of years of evolution [2].
In addition to the PAMPs-recognition system, vertebrates have evolved an adaptive
immunity which is triggered by innate defense mechanisms and mediated primarily by
specialized white blood cells (lymphocytes). There are two classes of lymphocytes: T-cells,
responsible for the cell-mediated immune response, and B-cells which mediate humoral
immunity. Lymphocytes perform antigen-specific recognition using receptors expressed on
their surface, T-cell receptors (TCRs) and B-cell receptors (BCRs, antibodies or
immunoglobulins (Igs)). All receptors produced by an individual lymphocyte have the same
antigen-biding site recognizing a specific epitope of the antigen [3]. The recognition is
achieved in different manner: while BCRs are capable to interact with antigens directly, TCRs
recognize a processed form of antigen, presented on the surface of the specialized cells by
Major Histocompatibility Complex (MHC)-encoded proteins.
While the T-cell receptor has a dimeric configuration, the immunoglobulin is a
tetramer of two light and two heavy polypeptide chains encoded by different loci: light chains
fall into the lambda (λ) and kappa (κ) families and heavy chains form a single family. Each Ig
or TCR polypeptide consists of a terminal variable region contributing to the antigen
recognition and a constant region that serves structural, signaling and effector functions.
Antigen receptor genes exist in the germline in a “split” configuration and are assembled
somatically during B- and T-lymphocytes development by site-specific recombination.
Multiple C regions, each with specialized effector function, are encoded in the heavy chain
locus. The Variable (V) region is encoded by Variable (V), Joining (J) (in heavy chain also
Diversity (D)) gene segments which are assembled by V(D)J recombination, a process, which
can be found in all jawed vertebrates (gnathostomata), beginning with cartilaginous fish [4-7].
Evolutionary appearance of RAG1 and RAG2 recombinases coincides with V(D)J
rearrangements [8, 9]. As these recombinases are able to catalyze transposition, it was
suggested that during evolution the diversification of germ-line antigen receptors may have
2
developed by germline insertion of a transposable element into an ancestral receptor gene,
probably containing an Ig-like V-domain [10, 11] soon after the evolutionary divergence of
jawed and jawless vertebrates [12-14].
As BCRs and TCRs possess sequence conservation and use the same recombination
machinery, it is speculated that they may have derived from a common “primordial” receptor
[15, 16]. While configuration and diversification mechanisms of TCRs have been maintained
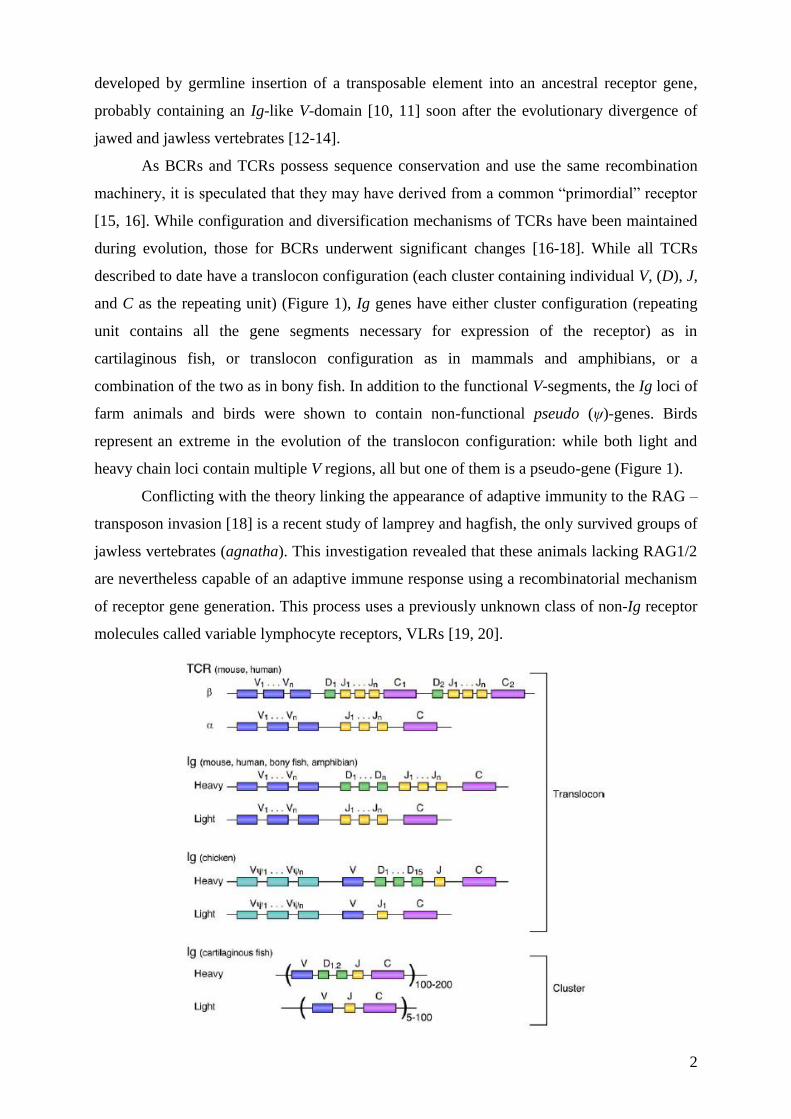
during evolution, those for BCRs underwent significant changes [16-18]. While all TCRs
described to date have a translocon configuration (each cluster containing individual V, (D), J,
and C as the repeating unit) (Figure 1), Ig genes have either cluster configuration (repeating
unit contains all the gene segments necessary for expression of the receptor) as in
cartilaginous fish, or translocon configuration as in mammals and amphibians, or a
combination of the two as in bony fish. In addition to the functional V-segments, the Ig loci of
farm animals and birds were shown to contain non-functional pseudo (ψ)-genes. Birds
represent an extreme in the evolution of the translocon configuration: while both light and
heavy chain loci contain multiple V regions, all but one of them is a pseudo-gene (Figure 1).
Conflicting with the theory linking the appearance of adaptive immunity to the RAG –
transposon invasion [18] is a recent study of lamprey and hagfish, the only survived groups of
jawless vertebrates (agnatha). This investigation revealed that these animals lacking RAG1/2
are nevertheless capable of an adaptive immune response using a recombinatorial mechanism
of receptor gene generation. This process uses a previously unknown class of non-Ig receptor
molecules called variable lymphocyte receptors, VLRs [19, 20].

3
Figure 1. The organization of antigen receptor genes depicted using rectangles to indicate the
individual variable region gene segments (blue, V, green, D; and yellow, J) or the constant region
genes (violet). Pseudo-genes of chicken are depicted in light blue. Taken from [18].
As only lamprey, hagfish and jawed vertebrates survived from the early vertebrate
radiation, it is not clear whether the agnathan VLRs were the precursors of vertebrate
immune receptors or if the rearranging VLRs and Igs/TCRs developed independently from
“primordial” receptors during convergent evolution [15, 20].
Unlike TCRs, B-cell receptors undergo additional diversification following V(D)J
recombination, including gene conversion, somatic hypermutation and class switch
recombination. It is known that somatic hypermutation was found already in cartilaginous fish
(sharks) [15, 16, 21-23], class switch recombination appears in a primitive form in
amphibians [24, 25]. Dogfish (cartilaginous fish) was found also to have a structural and
functional homolog of the protein AID (Activation Induced Deaminase), necessary for
initiation of the post-V(D)J-recombination diversification processes (Section V) [26].
II. Immunoglobulin repertoire generation in gnathostomata
Diversification of the Ig receptor gene allowed jawed vertebrates to generate a
lymphocyte receptor repertoire of sufficient diversity for recognition the antigenic component
of many potential pathogens or toxins.
In the mice and humans the primary Ig repertoire is achieved by V(D)J recombination
within the light and heavy chains separately while in farm animals and birds primary diversity
is mediated by post-V(D)J remodeling that includs gene conversion and somatic
hypermutation. After antigen stimulation, the affinity maturation of Ig gene in most species is
achieved by somatic hypermutation (in rare cases accompanied by gene conversion) and the
effector function of immunoglobulin can be changed by class switch recombination.
II.1. V(D)J recombination
In order to assemble the complete receptor molecule early in lymphocyte development
(Section III) germline-encoded segments of the Ig gene are somatically recombined in
different permutations within individual lymphocytes (Figure 2) [4, 5, 27]. V(D)J
recombination is mediated by lymphocyte–specific recombinases RAG1 and RAG2 using
special signal sequences flanking the individual segments [8]. This recombinatorial joining of

4
the segments uses non-homologous end-joining (NHEJ) DNA-repair complexes in order to
join the double strand breaks (DSBs) [28].
Figure 2. V(D)J rearrangement. The genomic organization of the murine germline IgH locus is shown.
One diversity (D) segment (yellow rectangles) and one joining segment (orange rectangles) rearrange
to form DJ segment that subsequently recombines with a variable (V) segment (brown rectangles) to
form a VDJ (V) region (bottom diagram). Taken from [29].
II.2. Post-V(D)J remodeling of the immunoglobulin gene
II.2.a. Gene conversion
As rabbit, cattle, swine, sheep, horse and birds have only a limited number of germline
V, D and J segments (only one in birds), the rearranged variable (V) regions of their Ig genes
have minimal diversity [30-32]. The required level of diversity of the primary Ig repertoire in
these species is achieved mainly by gene conversion (well described in chicken) and
accompanied to different extents by SHM [33-37].
Ig gene conversion (GC) is a form of diversification that involves “copy and paste”
insertion of donor sequences derived from cis-located pseudo-genes into the rearranged V
region (Figure 4) with the approximate frequency of 0.05-0.1 conversions per cell generation
[38, 39]. Reciprocal transfer of the donor fragment does not take place and there is no change
to the sequence of the ψV [40]. Pseudo-genes have high homology to the target sequence and
differ by about 10 to 20% from the V-segment [34, 38]. The actual donor sequences range
from 8 to 200 bp [34]. There are 25 pseudo-genes located in the light chain of chicken Ig
locus and 80 - in the heavy chain [38, 41], each of these are transcriptionally silent and
characterized by the absence of the V(D)J-recombination signals [42].
There is no clear data on mechanisms for the activation of gene conversion, but as it is
known that it starts right after lymphocytes enter the developmental microenvironment
(Peyer‟s patches, bursa of Fabricius (Section III)), it is likely that the activation is mediated
by external cytokines or cell interactions specific for the microenvironments. It has not been
tested whether transcription of the Ig locus itself is required for the initiation of gene

5
conversion. However, GC is dependent on the activity of AID [43, 44] which only works on
transcribed genes (Section V) and, as was recently shown in the chicken light chain locus, on
the presence of a cis-element containing the Ig enhancer [45, 46]. While the initial DNA
change leading to GC is not yet known (likely to be a single strand break (SSB) if it is related
to AID editing model), it is clear that the further processing is mediated by the homologous
recombination pathway [33].
II.2.b. Somatic hypermutation
Binding of the immunoglobulin to the inducing antigen epitope during the primary
response is of low affinity (in fact one epitope can be recognized by a number of different
primary antibodies). Affinity is improved during the secondary response by Somatic
Hypermutation (SHM) which, depending on the species, can be accompanied by gene
conversion (Section III). SHM is a process of introducing non-templated point mutations into
the rearranged variable region of the Ig gene at a high rate (10-5
to 10-3
mutation per base pair
per cell division, which is 106-fold higher than the spontaneous rate in somatic cells) [47, 48].
Improvement in the ability to bind antigen is known as affinity maturation [49] which results
in the clonal expansion of lymphocytes expressing highly specific immunoglobulins (Section
III). SHM is targeted to the rearranged V region [39, 50] beginning approximately 150-200 bp
downstream of the Ig promoter and extending for a further 1-1.5 kb downstream [51-53]
(Figure 3), leaving the promoter and the terminal constant region unaffected [54].
Although mutations can occur throughout the rearranged V region, the majority of
them are preferentially targeted to deoxycytidines within the hotspot motive WRCY (W = A
or T, R = purin, Y = pyrimidin) [50, 55]. These were shown to correspond to the
complementarity-determining regions (CDRs) of the immunoglobulin molecule that are most
implicated in contact with antigen [29, 56, 57]. In the V region some potential hot spots are
targeted by SHM while others are not, suggesting that an additional influence on the selection
of mutation targets is mediated by higher-order structures [58, 59], or is inherent to the
structure of the DNA binding proteins mediating SHM [60]. Transition mutations (exchange
of a purin for a purin or pyrimidine for a pyrimidine) arise more frequently than transversions
(C to A or G; G to C or T) [61].
Initiation of SHM (of either the Ig locus or an artificial substrate) requires
transcription [62-64] and the activity of AID which was shown in mouse [60, 65], human [66]
and chicken [67] models. Transcription alone though is not sufficient, as sequence analysis of
transcribed non-Ig genes in B-cells revealed either no or infrequent mutations compared to the

6
Ig genes [68-70]. SHM activity was also shown to be influenced by the presence of murine Ig
enhancers and their flanking regions [71-73].
It is unclear if SHM is initiated and/or associated with a break of DNA and if so, it is
unknown if it is a single DNA strand break (SSB) [74] or a double strand DNA break [35, 75-
77] or both [78], because later DSBs were shown to arise independently of AID [75, 79].
Mutations in SHM are produced by Base Excision Repair (BER), error-prone repair
processing (translesion synthesis) or Mismatch Repair System (described in Section V).
Figure 3. V(D)J rearrangement and somatic hypermutation of antibody of a heavy chain. (A) A
scheme of a germline heavy chain. (B) Rearranged Ig gene. (C) Distribution of mutations. The VDJ
region was expanded as a histogram to illustrate the existence of intrinsic mutational hot spots.
Consistency of hot spots with CDRs are shown. Taken from [29].
II.2.c. Class switch recombination
Ig isotype (or class), defining the antibody effector function, is determined by the
constant region of the heavy chain (CH). The first naive cells in the B-cell lineage use the Cμ
constant Ig region and express only IgM. During affinity maturation the Ig isotype can be
changed by Class Switch Recombination (CSR) which allows expression of antibodies that
retain the same antigen specifity but have different to naive B-cells function. CSR occurs
between switch sequences (S-regions) [80] located upstream of the CH regions and results in
the joining of a variable region with a different CH, followed by excision of the intervening
sequence (Figure 3) [81].
Activation of B-cells by antigen or signaling from T-cells and/or macrophages initiates
selection of a target S-region [82] and induction of the class-switch recombination [65, 83].
A
B
C

7
Initiation of CSR requires AID [65, 83-85] and germline transcription (through the
recombining S-regions) [86] which is probably important for the recruitment of the AID [87].
There are several lines of evidence indicating that CSR uses a DNA double-stranded-
break intermediate [81, 86, 88]. The rejoining processes in CSR are mediated by the non-
homologous end-joining repair pathway [59, 83, 89].
Figure 3. Scheme of class switch recombination of murine primary Ig type M (Cμ constant region) to
the IgA. (A) Heavy chain locus in B-cells expressing IgM. During CSR, AID deaminates dC residues
in the transcriptionally active S-regions (Sμ and Sα), initiating a process that results in double-strand
DNA breaks in both S-regions and CSR by intrachromosomal deletion (B). (C) Heavy chain locus
after switch to IgA. Splicing of the Igα transcript is shown. Taken from [90].
A
B
C
8
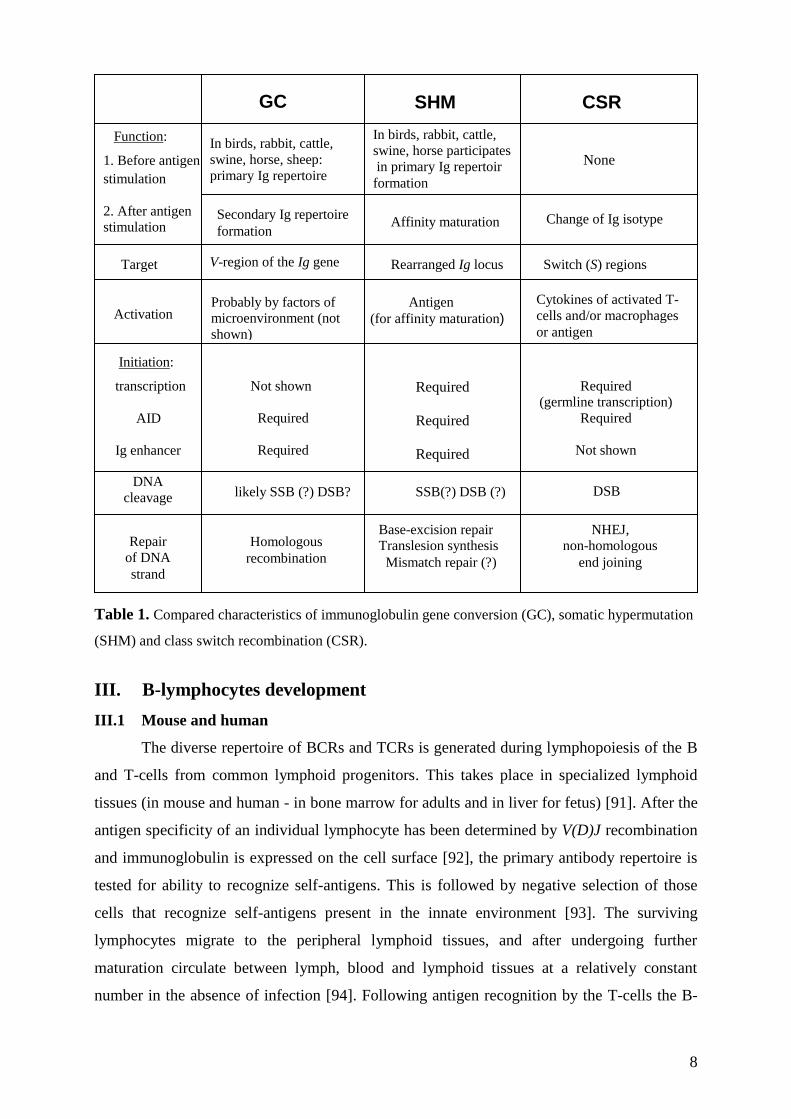
Table 1. Compared characteristics of immunoglobulin gene conversion (GC), somatic hypermutation
(SHM) and class switch recombination (CSR).
III. B-lymphocytes development
III.1 Mouse and human
The diverse repertoire of BCRs and TCRs is generated during lymphopoiesis of the B
and T-cells from common lymphoid progenitors. This takes place in specialized lymphoid
tissues (in mouse and human - in bone marrow for adults and in liver for fetus) [91]. After the
antigen specificity of an individual lymphocyte has been determined by V(D)J recombination
and immunoglobulin is expressed on the cell surface [92], the primary antibody repertoire is
tested for ability to recognize self-antigens. This is followed by negative selection of those
cells that recognize self-antigens present in the innate environment [93]. The surviving
lymphocytes migrate to the peripheral lymphoid tissues, and after undergoing further
maturation circulate between lymph, blood and lymphoid tissues at a relatively constant
number in the absence of infection [94]. Following antigen recognition by the T-cells the B-
In birds, rabbit, cattle,
swine, horse participates
in primary Ig repertoir
formation
GC SHM CSR
Function:
1. Before antigen
stimulation
2. After antigen
stimulation
In birds, rabbit, cattle,
swine, horse, sheep:
primary Ig repertoire
formation
Secondary Ig repertoire
formation Affinity maturation Change of Ig isotype
Target V-region of the Ig gene Rearranged Ig locus Switch (S) regions
Activation Antigen
(for affinity maturation)
Cytokines of activated T-
cells and/or macrophages
or antigen
Initiation:
transcription
AID
Ig enhancer
Required
(germline transcription)
Required
Not shown
Not shown
Required
Required
Repair
of DNA
strand
NHEJ,
non-homologous
end joining
DNA
cleavage
likely SSB (?) DSB? SSB(?) DSB (?)
Homologous
recombination
Base-excision repair
Translesion synthesis
Mismatch repair (?)
DSB
Probably by factors of
microenvironment (not
shown)
None
Required
Required
Required

9
cells begin to proliferate and migrate to primary lymphoid follicles where they form germinal
centers where rapid proliferation and differentiation takes place [95, 96]. This is accompanied
by activation of SHM [97] and CSR [98] to increase the affinity to the antigen. Negative
selection of those cells whose affinity is reduced due to diversification also occurs [99].
Recently, it has been shown in mice that CSR is actually activated prior to germinal center
formation [100, 101]. Cells demonstrating improved ability to bind antigen are expanded and
then differentiated into either antibody-secreting plasma cells or memory cells. Therefore, in
mice and human the polyclonal migration of antigen-activated B-cells into germinal centers
results in oligoclonal expansion, i.e. clonal selection of antibody specifity [99, 102, 103].
III.2 Gallus gallus and other species with post-V(D)J-Ig repertoire formation
In birds, rabbit, cattle, swine, horse and sheep after V(D)J recombination the primary
Ig repertoire is developed by gene conversion and somatic hypermutation that takes place in
special microenvironments. In sheep, cattle and horse – in ileal Peyer‟s patches [35, 104,
105]. In rabbit and chicken it is in gut-associated appendix [106] and the bursa of Fabricius,
respectively [107].
Chicken prebursal stem cells are derived from hematopoietic precursors in the dorsal
aorta. Primary lymphocytes with completed V(D)J recombination can be found in spleen,
thymus, blood and even in nonlymphoid organs [108, 109]. These progenitor populations
expand and diversify only in the bursa of Fabricius and decline with time at the other sites
[107, 110, 111]. The mature bursa of Fabricius contains approximately 10000 lymphoid
follicles, each of which is seeded by oligoclonal B-stem cells [33] in which Ig is diversified
by gene conversion even in the absence of antigen stimulation [33, 112] and to a minor extent
– by somatic hypermutation [113]. Therefore, opposite to mouse and human, in spite of the
oligoclonal initialization each follicle in the bursa of Fabricius develops a highly diverse
repertoire.
Starting at about the time of hatching, B-cells migrate from the bursa to populate
peripheral organs. Upon antigen stimulation activated lymphocytes form germinal centers in
the spleen. At the early stage of the germinal centers Ig is diversified by both GC and SHM
[114]; at later stages gene conversion is downregulated and most of subsequent modifications
are created by SHM [115].

10
IV. Chicken B-cell line DT40
IV.1. Unique characteristic of DT40
DT40 is an avian leucosis virus (ALV)-induced chicken lymphoma developmentally
arrested at the stage of the B-lymphocytes from the bursa of Fabricius [116] with ALV-
induced downregulation of p53 and overexpression of Myc gene [117-121]. DT40 contains
one V(D)J rearranged and one germline allele at the Ig light chain locus and expresses surface
IgM [34, 118, 122]. DT40 was shown to continue the process of diversification of the
rearranged Ig gene allele during in vitro culture by the process of gene conversion [118, 122].
While gene conversion in bursal B-lymphocytes occurs on average once every 10-20
divisions (Section II.2.a), in DT40 one GC event occurs once per 40 cell cycles [122].
Although most DT40 cells express surface IgM receptor, IgM-negative clones with
frameshifts in the V-region, most likely deriving from non-functional recombination events,
can be detected. It was shown that on-going gene conversion resulted in repair of these
frameshifts leading to the appearance of the cells reexpressing surface IgM (Ig reversion
assay, Figure 4) [122].
The unique characteristic of DT40 is its ability to maintain a high frequency of
targeted integration into virtually any locus, including those not transcribed, unlike
transfection in mammalian or murine cell lines which results in random genome integrations
[123, 124]. Such an endogenous high efficiency of targeted integration is not present in
murine and human B-cell lines, nor in chicken non-B-cell lines, which suggests that this
unique property of DT40 might be related to the diversification of the Ig locus by gene
conversion [125]. The high efficiency of targeted integration in DT40 makes it a powerful
tool for testing the function of candidate genes by gene knockout [126, 127].
Figure 4. Ig reversion assay. One of the pseudo-genes is depicted in grey. Surface IgM-negative cells
and cells reexpressing Ig molecule are shown on the right side. Taken from [128].
Besides efficient targeted integration, DT40 possess such advantageous properties as
karyotype and phenotype stability even during extended periods of culture, rapid growth rate

11
with a doubling time of approximately 8-10h facilitating colony-formation essays, nearly
100% cloning efficiency of wild-type cells which results in efficient stable transfection and
subcloning. The absence of functional apoptosis-inducing p53 makes it possible to isolate
clones with a targeted disruption of genes responsible for genome instability [129]. Taken
together the properties of DT40 make it convenient for reverse genetics studies [121].
IV.2. Elimination of gene conversion in DT40. Cross talk between gene conversion and
somatic hypermutation
Although a few single nucleotide substitutions were found in the IgL VJ region of wild-
type DT40 cells [118, 122], it is difficult to classify these mutations as non-templated because
the sequence of the ψV genes used in this strain is not available [128]. The first evidence for
hypermutation in DT40 appeared after disruption of the genes responsible for homologous
recombination which suppresses gene conversion and later by the deletion of the pseudo-gene
templates.
Among numerous reverse genetic experiments in DT40, the data on disruption of three
particular gene groups is important for understanding the mechanism of the Ig gene
conversion and somatic hypermutation, and their cross talk in this cell line: 1) Aid, 2) Rad51
paralogues responsible for the homology search and strand invasion in the homology
recombination [130] and proteins Brac2 [131] and Brac1 [132] which are though to regulate
Rad51, 3) Rad54 which is suggested to contribute to late stages of homologous recombination
[133] and its counterpart Nbs1 [134].
DT40 cells with either disrupted Rad54 or Nbs1 have 100-fold decreased ratios of
targeted integration and also reduced gene conversion activity [135].
DT40 mutants of each of 5 paralogues of Rad51 in vertebrates have reduced targeted
integration frequencies and double strand break repair deficiencies [136]. The disruption of
either one of three Rad51-paralogues (Xrcc2, Xrcc3 and Rad51b) caused the appearance of
single non-templated mutations within the V-region at a high rate of 0.4x10⁴ per bp per
generation (similar to the rate previously calculated for the human Ramos lymphoma cell
line) [78] whereas only a few gene conversion events were detected [137].
The hypermutation activity associated with Rad51-paralogues mutants was measured by
quantifying the frequency of surface IgM-negative cells, which presumably had appeared due
to introduction of the deleterious mutations in the rearranged Ig light and heavy alleles (Ig
loss assay, similar to the Ig reversion assay used for measurement of the gene conversion)
[137].

12
The deletion of the upstream ψV genes resulted in the abolition of gene conversion
together with an upregulation of AID-dependent somatic hypermutation. The mutation rate
observed using both FACS analysis of Ig loss and sequencing of the VJ region was
approximately 2.5 times higher than that observed for the Xrcc3-mutant [67].
The characteristics of the mutations observed in both assays, using disruption of the
Rad51-paralogues or deletion of the ψV genes, had features typical for the somatic
hypermutation in mammalian B-cell lines [60, 138, 139]: namely Ig locus specificity with the
typical distribution downstream of the promoter with preference for the hotspots, dependence
on AID and occurrence by way of transversions of G to C and C to G bases and absence of
mutations at A/T pairs observed for the germinal centers in mouse and human.
These experiments suggested a model of initiation and regulation of gene conversion
and somatic hypermutation pathways (Figure 5). As AID disruption blocks GC completely
but does not produce a DNA repair defect, the first step of Ig GC is most likely AID-
dependent DNA modification, which leads to the recruitment of a series of cofactors that
result in a DNA lesion within the V region (detailed in Section V). Processing of this lesion in
the absence of the nearby ψV donors or factors of homologous recombination (RAD51-
paralogues) leads to a single nucleotide substitution (Figure 5, right side). However, if the
donor sequences are available, processing of the AID-induced lesion can be divided into two
stages, before and after strand invasion, with and without a possibility of shifting to a somatic
hypermutation, respectively. As the first stage requires the involvement of the RAD51-
paralogues, the second stage involves more downstream recombination factors, such as
RAD54. This model explains why the disruption of Rad51-paralogues or pseudo-genes not
only abolishes gene conversion but also induces hypermutation while disruption of Rad54
alone only decreases GC. DT40 mutants for Brca1 [7] and Brca2 [132] behave like the
Rad51-paralogues mutants, whereas mutants of the Nbs1 gene [134] or of members of the
Faconi anemia pathway [140] show phenotypes similar to the Rad54 mutant, indicating that
encoded proteins participate either in first or the second stage of gene conversion,
respectively. The model also predicts that low homologous recombination activity in the B-
cell prevents Ig gene conversion, even when conversion donor pseudo-genes are present
[128]. Such a low homologous recombination activity might be the reason why chicken
germinal center B-cells have shifted the balance from Ig gene conversion to Ig hypermutation
[115] and also why human and murine B-cells never diversify Ig by gene conversion despite
the presence of nearby candidate donors in the form of unrearranged V segments.

13
Figure 5. Cross talk of gene conversion and somatic hypermutation in DT40. Taken from [128].
V. Molecular mechanisms of somatic hypermutation
V. 1. First phase: cytidine deamination by AID
All three processes known to be involved in the post-V(D)J recombination, SHM, GC
and CSR, require AID, activation induced deaminase, that is specifically expressed in
activated B-cells [141]. The role of AID as the initiating factor for SHM and CSR became
evident after the generation of Aid-deficient mice [65] and the finding that the human hyper-
IgM syndrome (HIGM-2), characterized by a lack of CSR and SHM, is caused by inactivating
mutations in the AID gene [66]. Later it was shown that disruption of the Aid gene in DT40
completely blocks Ig gene conversion, and in the absence of the pseudo-gene donors, SHM
[43, 44, 67].
After its identification AID was suggested to be an RNA-editing enzyme because of
strong homology with APOBEC-1, a protein editing the mRNA of the apoB gene [141, 142].
However, numerous in vitro studies have established that purified AID acts specifically on
single-stranded DNA (ssDNA) [143-146] by deamination of deoxicytidine residues,
producing U:G mismatches [147, 148] and does not deaminate RNA [149, 150]. Since
transcription is thought to have a key role in opening double strand DNA to provide ssDNA,
the single stranded specificity can explain the fact that AID action depends on transcription
[87, 144, 151, 152].

14
An ssDNA-binding Replication Protein A (RPA), involved in replication,
recombination and repair, may play a role in the control of AID activity as it was shown to
determine AID targeting to ssDNA-transcribed substrates in vitro. This was by direct
interaction with AID that is phosphorylated by Protein Kinase A (PKA) [153-155]. One
model suggests that in vivo the small regions of ssDNA produced during transcription are
bound by RPA, which in turn facilitates activity of AID at the V- and S-regions [153, 156].
Although AID is specifically expressed in the B-lymphocytes, overexpression of this
enzyme in bacteria, fibroblasts and hybridomas results in the induction of SHM in multiple
highly expressed genes [60, 64, 87]. Aberrant expression of AID in the mouse caused T-cell
lymphoma that is associated with hypermutation in Tcr and Myc genes [143, 157].
Deregulation of AID may, through its mutagenic activity, lead to malignancy in vivo. All this
data suggest that the B-cell and Ig specificity of SHM is probably maintained by specific
factors of B lymphocytes.
Mutation of the N-terminal domain of AID diminishes SHM but does not influence
CSR whereas C-terminal region is absolutely required for CSR but seems to be dispensable
for both SHM and GC in eukaryotic cells [158-160]. These results raise the possibility that
different cofactors for SHM and CSR interact with the N- and C-terminal regions of AID,
respectively.
As might be expected for an enzyme that mutates DNA, the access of AID to the
nucleus is regulated. The major fraction of AID is found in the cytoplasm. The C-terminal
domain contains a strong nuclear export signal (NES), removal of which causes the
accumulation of the AID in the nucleus. However, a putative nuclear localization signal in the
N terminus does not appear to be functional [161-164]. Together, these results suggest that
AID passively diffuses into the nucleus but that it is actively transported out of the nucleus by
an NES-mediated mechanism.
Studies showing increased nuclear AID content after induced DNA lesions do not
show increased SHM [161]. Therefore AID alone is not sufficient for SHM and factors in
addition to AID are involved in regulation of this process [159, 161, 163].
V.2. Processing the AID-generated mismatches
There are different possible ways of processing the U:G mismatch generated by the
AID-catalyzed deoxycytidine deamination within the Ig locus. If the mismatch is not repaired
before the onset of DNA replication then DNA polymerases will insert an A opposite the U
nucleotide creating both C to T (C→T) and G→A transition mutations (Figure 7). All other
types of nucleotide substitutions (transversions at G:C and all kinds of substitutions at A:T

15
pairs) require recognition of the U:G lesion by factors of the base excision repair or mismatch
repair pathways.
V.2.a. Uracil excision by UNG
After they have been generated by AID, the U:G lesions are most commonly removed
by the Base Excision Repair pathway (BER), leading to the transversion mutations at G:C
pairs [165]. BER is initiated by one of the four uracil-DNA-glycosylases described in
vertebrates, UNG [166], which excises uracils from the DNA deoxyribose-phosphate
backbone and thereby generates abasic sites [167].
The involvement of uracil glycosylase in SHM became apparent before the evidence
for the presence of AID-created uracils in the Ig locus in vivo [168]. Expression of Uracil
Glycosylase Inhibitor (UGI) in hypermutating cells revealed that the spectrum of mutations
shifted from the more usual transversions to the transitions C→T and G→A. [147]. This
could be explained by UGI-mediated inhibition of the removal of the AID-induced uracils by
uracil glycosylases, leading to pairing of the unexcised uracils with adenines during the next
round of replication. As transfection of the Ugi transgene to the wild type DT40 reduced the
rate of gene conversion, it was suggested that excision of uracils is also required for this type
of Ig diversification [169]. In human, deficiency of UNG leads to a decrease in CSR and
perturbation of SHM [170]. These observations were confirmed by knock-out of the Ung
gene: a similar shift in the mutation spectrum to transitions at G:C pairs, together with
inhibition of the CSR, was observed for Ung-/-
mice [171]; Ung-/-
DT40 also possessed
dramatically reduced gene conversion; at the same time the SHM rate was 7 times higher than
that in the cell line with deleted ψV genes. Due to a lack of abasic sites 98% of the SHM
substitutions were transitions C→T or G→A [172]. Relatively frequent conversion of uracils
into mutations (one in seven, if it is assumed that the transition mutations of the Ung-/-
reflect
the total number of the induced uracils) support the error-prone repair pathway.
It was shown using DT40 and mice that in vivo none of the other uracil-DNA
glycosylases of vertebrates act as a backup for UNG in SHM and CSR [164, 173-175].
However, in the absence of UNG other uracil glycosylases are able to process the U:G lesion.
Overexpressed uracil glycosylase SMUG1 partially substitutes for UNG to assist SHM and
restores isotype switching in Msh2-/-
Ung-/-
mice [174]. In contrast to endogenous UNG, the
overexpression of SMUG1 in mice diminishes the frequency of Ig diversification [174],
probably because SMUG1 favors conventional non-mutagenic repair of U:G lesion [176].
The involvement of UNG in immunoglobulin diversification may be regulated through
interaction with other proteins [174, 177, 178]. It was shown that UNG is able to form a

16
complex with PCNA and RPA in replication foci at defined cell cycle stages [178].
Regulation of UNG expression timing could be crucial in deciding the competition between
BER and mismatch repair pathway for these factors and error-prone polymerases [48].
V.2.b. Mismatch repair
Mismatch Repair (MMR) is a complex process of maintaining the fidelity of DNA
replication by removing errors from newly synthesized DNA. Genetic inactivation of the
MMR system elevates spontaneous mutability 50-1000-fold and predisposes to cancer [179].
In eukaryotes MMR is initiated by the recognition of DNA mismatches by the
heterodimeric protein MSH2-MSH6 (bacterial MMR protein MutSα homolog). Via the
recruitment of a number of additional proteins it introduces a ssDNA nick near the mismatch
through exonuclease Exo1 [48, 180]. After excision of the mismatch, high-fidelity
polymerases resynthesize the excised DNA strand and the ends are ligated. It is known that
MMR requires several other factors, most of which are also involved in transcription and
replication, including PCNA (Section V.2.d), RFC (Replication Factor C) and RPA [48].
During SHM the U:G mismatch, in addition to recruitment of UNG-dependent BER,
can activate the mismatch repair machinery. This is thought to result in mutations at A:T pairs
near the initiating lesion, probably through an error-prone repair process [181-183].
Experiments using knock-out of Msh2 and/or Msh6 in mice showed that MMR
influences the pattern of hypermutation [184, 185]; in the absence of these proteins a
considerable bias for mutations at G:C pairs was observed while the global frequency of the
SHM did not change. Consequently, the frequency of mutations at A:T pairs was considerably
decreased [175, 181, 186, 187]. Among the models explaining this phenomenon [188] it has
been suggested that a two-step mutation mechanism is supported by a number of studies. The
first step of this model suggests introduction of mutations at G:C targets whereas during the
second phase (for which recognition of the mismatch by MSH2-MSH6 heterodimer is
required) error-prone translesion repair introduces secondary nucleotide substitutions at A:T
pairs near the initiating lesion [182, 183] (Figure 7; Section V.2.c).
According to this mechanism, MMR might be responsible for creating the ssDNA
breaks during SHM, GC and CSR [74, 189-191]. In Exo1-/-
mice the activity of CSR is
decreased and the SHM spectrum is similar to that observed for the Msh2-/-
mutant [181]. In
the case of CSR, two opposing strands mismatches in the S-region could result in the
formation of double-stranded breaks. If the process of repair of the single- or double-stranded
DNA break is through homologous recombination, then gene conversion would occur (Figure
6).

17
T
Figure 6. MMR resulting in SHM, GC or CSR. Taken from [189].
It was also shown that the A:T mutations can be created via short-patch DNA repair
by both MSH2–MSH6-mediated and also by UNG-mediated recognition of the U:G. The
inactivation of both pathways (Ung and either Msh2 or Msh6) leads to a loss of practically all
mutations at A:T bases in the V regions and a profound loss of CSR [175, 192]. However,
analysis of Msh2-/-
and Msh6-/-
mice suggests that MSH2–MSH6-mediated recognition is the
major pathway [181, 193].
Figure 7. Activation-induced-cytidine-deaminase-dependent lesion repair. Taken from [156].
V.2.c. Translesion synthesis
In contrast to high fidelity replicative DNA polymerases which are usually stalled by
encountering a damaged nucleotide, translesion synthesis (TLS) polymerases are able to
synthesize through lesions, with a high processivity, albeit at the cost of high error rates [194,
195].

18
During normal cell growth uracils are frequently incorporated into DNA at the time of
synthesis. This is independent of AID activity [177] and is repaired predominantly through
BER by error-free polymerases. In the Ig locus, however, AID-induced uracils are repaired in
an error-prone manner resulting in SHM [156, 196, 197].
In general, translesion synthesis produces mutations at the following pairs: 1) C:G
while bypassing UNG-mediated abasic sites; 2) at C:G and A:T while extending past these
abasic sites and 3) at C:G and A:T while copying undamaged DNA template during patch
DNA synthesis in MMR or BER. In fact the mismatches introduced by TLS polymerases
could trigger a new round of MMR, resulting in the amplification of the original mutations
(Figure 7 and 8).
During SHM Pol η, Rev1 and pol ζ act together. Due to their low processivity pol η
and Rev1 perform mispair insertion while pol ζ extends the DNA strand ignoring mispairs
previously inserted by pol η or Rev1 [198] (Figure 8).
Pol η is supposed to play a key role in introducing mutations at A:T pairs since there is
a lack of such substitutions in the mutation spectrum seen in Xeroderma pigmentosum variant
(XP-V) patients, who are pol η deficient, and in pol η-deficient mice [199-201]. As deficiency
of pol ι, a paralog of pol η, causes in mice slight reduction in overall mutation spectrum only
when combined with Pol η disruption, this polymerase seems to play only a minor role in
SHM [202, 203].
Rev1 is responsible for introducing most of the C→G and G→C transversions at
abasic sites, as seen in DT40 and Rev1-deficient mice [204-206].
Pol θ is the first DNA polymerase recognized that can bypass efficiently an abasic site
by functioning as both a mismatch inserter and a mismatch extender [207]. Pol θ−/−
mice had
decreased overall frequency of mutations at C:G and A:T [208]. This polymerase is though to
contribute to the residual mutation activity at A:T found in the η-deficient mice [57, 198, 200,
201].
Figure 8. Recruitment of different error-prone polymerases into repair of abasic site within Ig locus.
While Pol η, Rev1 and pol ι perform mispair insertion, pol ζ extends DNA strand past mispair. Pol θ is
involved in both mismatch insertion and strand extension. Taken from [209].
19
Biochemical studies indicate that TSL polymerases are recruited at the sites of DNA
lesion through interactions with repair factors as part of a TSL complex including RPA,
proteins of MMR and BER and PCNA.
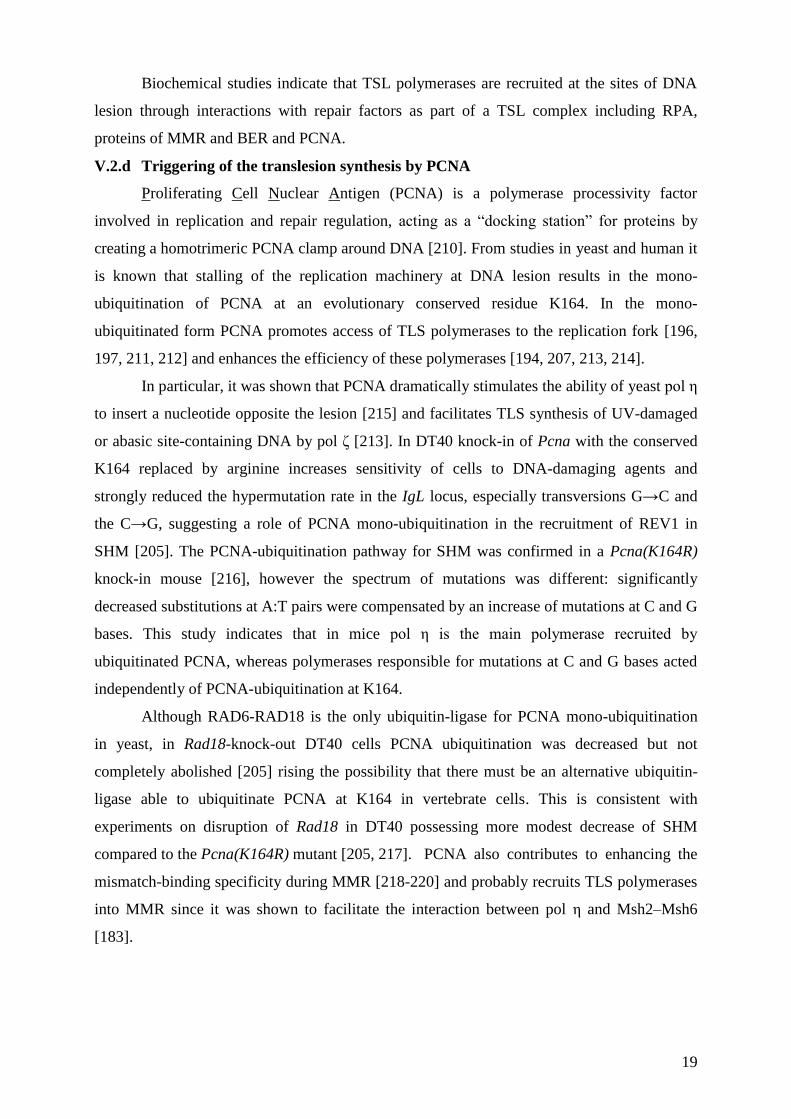
V.2.d Triggering of the translesion synthesis by PCNA
Proliferating Cell Nuclear Antigen (PCNA) is a polymerase processivity factor
involved in replication and repair regulation, acting as a “docking station” for proteins by
creating a homotrimeric PCNA clamp around DNA [210]. From studies in yeast and human it
is known that stalling of the replication machinery at DNA lesion results in the mono-
ubiquitination of PCNA at an evolutionary conserved residue K164. In the mono-
ubiquitinated form PCNA promotes access of TLS polymerases to the replication fork [196,
197, 211, 212] and enhances the efficiency of these polymerases [194, 207, 213, 214].
In particular, it was shown that PCNA dramatically stimulates the ability of yeast pol η
to insert a nucleotide opposite the lesion [215] and facilitates TLS synthesis of UV-damaged
or abasic site-containing DNA by pol ζ [213]. In DT40 knock-in of Pcna with the conserved
K164 replaced by arginine increases sensitivity of cells to DNA-damaging agents and
strongly reduced the hypermutation rate in the IgL locus, especially transversions G→C and
the C→G, suggesting a role of PCNA mono-ubiquitination in the recruitment of REV1 in
SHM [205]. The PCNA-ubiquitination pathway for SHM was confirmed in a Pcna(K164R)
knock-in mouse [216], however the spectrum of mutations was different: significantly
decreased substitutions at A:T pairs were compensated by an increase of mutations at C and G
bases. This study indicates that in mice pol η is the main polymerase recruited by
ubiquitinated PCNA, whereas polymerases responsible for mutations at C and G bases acted
independently of PCNA-ubiquitination at K164.
Although RAD6-RAD18 is the only ubiquitin-ligase for PCNA mono-ubiquitination
in yeast, in Rad18-knock-out DT40 cells PCNA ubiquitination was decreased but not
completely abolished [205] rising the possibility that there must be an alternative ubiquitin-
ligase able to ubiquitinate PCNA at K164 in vertebrate cells. This is consistent with
experiments on disruption of Rad18 in DT40 possessing more modest decrease of SHM
compared to the Pcna(K164R) mutant [205, 217]. PCNA also contributes to enhancing the
mismatch-binding specificity during MMR [218-220] and probably recruits TLS polymerases
into MMR since it was shown to facilitate the interaction between pol η and Msh2–Msh6
[183].
20
VI. Ig locus specificity of somatic hypermutation
Unregulated somatic hypermutation represents a threat to genome integrity and has
been suggested to play a role in the development of cell lymphomas when inappropriately
activated [68, 221]. Only Ig genes undergo hypermutation at a high rate, and this seems to be
precisely targeted as sequence analysis of neighboring to the IgL locus genes in DT40
revealed no diversity [222]. However, some non-Ig genes, including BCL6, FAS, CD79A and
CD95B were found to undergo SHM in normal B-cells, albeit at lower frequencies compared
to the Ig locus [68, 223-225]. In human B-cell tumours several other loci, such as BCL6,
MYC, PIM1, RHOH and PAX5 were demonstrated to be targeted by SHM [221, 225].
Since a retroviral reporter construct was shown to undergo AID-mediated SHM in
mice when introduced at different genomic sites [226, 227] and sequence analysis indicated
that AID of B-cells from Peyer‟s patch acts broadly on the genome [70], the term “targeting
of SHM” implicates not only recruitment of AID (which still might be important for high
rates of hypermutation) but also mechanisms for the enlistment of error-prone BER and MMR
factors to the Ig locus. Recent determination of the human MSH2-MSH6 complex crystal
structure around various types of mismatches demonstrated that confirmation of this dimer
does not depend on the type of the DNA lesion indicating that nature of the U:G mismatch
itself is unlikely to play a role in recruitment of error-prone repair [228]. Although an
unambiguous factor responsible for targeting of SHM has not been found, numerous studies
suggest that this process could be driven by a complex of factors including cis- and trans-
elements binding to the Ig locus. These may well act in a temporal manner, corresponding to
cell cycle restriction, specific nuclear localization of SHM and accessibility of the V-region
due to the transcription activity, a high density of mutational hotspots or epigenetic pattern
which is discussed in following chapters.
VI.1. Cis-acting DNA elements
Recent evidence indicated that the coding sequence of the V region does not itself
contain the sequences necessary for targeting of SHM, since replacement of the V and J
segment by heterologous DNA fragments does not affect the rates of hypermutation [156,
229].
Correlation between transcriptional activity and SHM indicates the involvement of cis-
regulatory transcriptional elements in the recruitment of factors specific for SHM, including
AID as well as proteins of BER, MMR and translesion synthesis. The observation that non-Ig
promoters are able to promote SHM of the Ig genes [62, 71, 230-233] further suggests that the
Ig promoter itself also lacks the sequences responsible for the recruitment of the SHM.

21
A number of studies on transgenic and knock-in mice have indicated that some of the
enhancers identified within light and heavy chains of the Ig locus influence targeting of the
SHM to the V-region. This is consistent with the key role of transcription in the recruitment of
AID-mediated deamination (Section V.1). However, these results were not unequivocal due to
the interference of the mutation rate with the transcription level. Moreover, some of these
observations have been disproved by deletion analysis within the endogenous Ig locus. For
example, both enhancers identified within murine κ light chain locus (intronic iEκ and 3‟Eκ)
were shown to be required for the SHM in the context of Igκ transgene [71, 234] and to be
sufficient for targeting of SHM to the non-Ig transgene in Ramos cell line [76]. However,
both of these cis-elements turned out to be dispensable for SHM in the endogenous murine κ
locus [235, 236]. The same contradiction was observed when comparing the transgenic and
endogenous contexts for testing various parts of the 3‟ regulatory region of the murine IgH
[237, 238].
A recent study using an AID-expressing hybridoma cell line suggests that the effect of
the cis-regulatory elements on SHM is not exclusively positive, but can also be negative. This
observation is based on results showing that the IgH intronic core enhancer Eμ is required for
SHM of the endogenous V region if the flanking matrix attachment region (MAR) was
present. If both core Eμ and MAR were deleted, SHM was reduced back to the level of the
wild-type [239]. Deletion analysis of the Eμ enhancer in the Ramos cell line resulted in a
change of the SHM pattern [240] denoting the possible involvement of this cis-regulatory
element in recruitment of the error-prone BER and MMR.
In DT40 the deletion of the only known IgL enhancer did not affect gene conversion
activity [229]. However, the deletion of a sequence including the enhancer together with its
flanking regions prevented gene conversion and non-template mutations within the V region
[46]. As the locus containing ψV-genes was shown to be dispensable for SHM in DT40 [67],
it is likely that the cis-regulatory element for targeting of the SHM is included in the 9.8 kb
fragment starting from the IgL transcriptional start site until the border of the neighboring
locus.
Although it was shown that insertion of the binding sites for a number of particular B-
cell trans-factors, such as E2A, PU.1 and NF-EM5 increases the rate of SHM in vivo [73,
241], these cis-sequences are unlikely to be the main regulators of SHM as they are common
to many other loci that are not influenced by SHM.
SsDNA structures represent a class of cis-elements which might play a role in
targeting of the SHM, such as the G-loops observed in the transcribed switch-regions which

22
could serve as targets for AID binding [48, 242]. An experiment using cross-linking of
proteins to DNA revealed the prevalence of ssDNA patches in genes undergoing SHM
compared to other highly transcribed genes which are not targeted by hypermutation [243].
While SHM, unlike CSR, does not seem to target specialized RNA or DNA secondary
structures, the mutability was found to correlate with the density of the SHM hotspots within
the given sequence [230].
VI.2. Trans-acting factors
Consistent with a possible role of enhancers in targeting of SHM, it is likely that
enhancer-binding transcription factors might be involved in the recruitment of components of
hypermutation. This hypothesis was confirmed for the study of the elongation factor E2A,
where overexpression of one of the alternatively spliced forms of E2a caused an increase in
gene conversion in DT40 [45] and disruption of the E2a gene in DT40 with deleted ψV-genes
resulted in a 3-fold decrease in SHM [244].
The inactivating mutations in AID [158, 159] and the importance of AID
phosphorylation [153-155], both indicate that AID is accompanied by cofactors which might
be responsible for targeting of this protein to the Ig locus. RNA Polymerase II is thought to be
one such cofactor, as it was found to co-immunoprecipitate with AID [245] and RNA
Polymerase II promoters were shown to support SHM [71, 230]. The possible preference of
AID to bind the elongation, but not the initiation form of this polymerase, may explain why
the 5‟ boundary of the SHM is located 150 bp downstream of the Ig gene transcription start
site [246]. Among other cofactors which were shown to associate with AID are RPA, PKA,
DNA PKs and ubiquitin ligase 3; however all these proteins are encoded by house-keeping
genes or genes important for the B-cell development, therefore it is difficult to determine their
specific role in SHM.
A recent study showed that AID purified from insect B-cells can associate with
endogenous ssRNA and that degradation of this RNA is required for the AID deamination
activity [149]. This is consistent with the possibility that in B-cells the association of AID
with RNA has a negative regulatory role and interferes with the targeting of SHM.
VI.3. Chromatin structure
Regulation of transcription, replication and repair is often associated with changes in
the epigenetic pattern, such as DNA methylation and post-transcriptional modifications of
histones, associated with reduced transcription activity or silencing and increased accessibility
to the trans-factors, respectively [48, 247]. It was suggested that these modifications could

23
also be involved in the targeting of SHM factors to the Ig locus by facilitating accessibility of
the V and S-regions.
A role of methylation in targeting of SHM was indicated by the finding that an
unmethylated allele of the κ light chain was modified ten-fold more frequently by SHM than
the unmethylated locus in transgenic mice [248]. However, the mechanism of this regulation
is not clear as it was shown earlier that the presence of methylated CpG in DNA does not
influence AID deamination at nearby cytosines [249].
A number of studies suggested the involvement of histone acetylation in the control of
SHM locus specificity: firstly, hyperacetylation was observed for AID-targeted S-regions
undergoing CSR [90, 245, 250, 251] and for gene segments during V(D)J recombination
[252], secondly, it was shown that the histones of the IgH V region of the hypermutation-
inducible B-cell line BL2 are hyperacetylated while the following C region lacks acetylation
[253], a finding later confirmed in mice [254]. Treatment of BL2 with an inhibitor of the
histone deacetylase resulted in the acetylation of the C region followed by an increase in the
SHM of this-region [253]. However, this result has no bearing in the specific targeting of
SHM. Curiously, no difference in the acetylation pattern was observed in vivo for the Igλ V
and C regions which could be explained by closer colocalization between these regions in the
light chain compared to the IgH locus and possible transcriptional activity of the Igλ C region,
which is also known to be accompanied by acetylation [254].
Another modification possibly involved in targeting of SHM is phosphorylation of
histone H2B at S14 which was found to be associated with V regions of the light and heavy
chains in vivo as opposed to the following C regions and correlate with both SHM and CSR
[254]. As histone phosphorylation at S14 was found to be dependent on AID, it is unlikely
that this modification is involved in initial targeting of this protein. However it might play a
role in the subsequent recruitment of the error-prone BER and MMR factors. This is
supported by the finding that phosphorylation of the histones at S14 that occurs at sites of
DNA damage provides the requirement of the repair factors [255, 256] and also known to
participate in the response to induced DSBs [257].
VI.4. Cell cycle restriction
While error-prone repair is important for SHM, error-free repair is required for DNA
replication during S phase of the cell cycle. There might be a possibility that these two
processes are temporally restricted, i.e. SHM may happen only during the non-replicative
phase of the cycle. This hypothesis is supported by several studies, including finding that
SHM can only be detected within the V-region of BL2 cell line during G1 and G2 phases but

24
not at S phase [139] and that during CSR the IgH V gene is colocalized with proteins involved
in NHEJ exclusively in the G1 phase [258]. Immunohistochemical and immunofluorescent
staining techniques indicated that colocalisation of AID and other molecules involved in Ig
diversification, including UNG and RAD51, depends on the cell cycle stage in rabbit [259,
260].
VI.5. Subcellular localization
Taking in account that the Ig loci contain MAR elements [45, 72, 261] and that
transcription and V(D)J recombination is presumed to be regulated by the subnuclear
positioning [262] it is possible that a defined localization of the Ig locus within the nucleus
might be important for regulation of the SHM. Therefore, the weak hypermutation observed
in non-Ig genes could be explained by the proximity of these genes to the Ig locus within the
nucleus. Recently it was demonstrated that IgH and IgL genes are colocalized with Myc
within the “transcription factories” in primary B-cells [263]. Although colocalization of these
genes during SHM or CSR remains to be determined, this raises the possibility that SHM
could be regulated by factors recruited by the colocalized genes.
VII. Application of the somatic hypermutation and gene conversion for
biotechnology
A powerful tool for the development and optimization of new proteins is directed
protein evolution. One of the most common technologies for this artificial evolution is
random DNA mutagenesis in vitro, followed by a selection for desirable protein phenotypes.
However, screening for advantageous mutations and analysis of the new phenotypes require
routine methods, including expression of diverse gene libraries in bacteria, phage or
translation systems followed by transfer into eukaryotic cells or organisms for analysis [264-
267]. In vivo random mutagenesis strategies avoid the repetitive transfection and re-isolation
of genes. However, randomizing mutations of genome often leads to the deleterious instead of
the desired mutations [268]. In this respect hypermutation and gene conversion of the
transgene combined with the appropriate selection of phenotypes carrying beneficial
mutations, could become a powerful tool for artificial evolution due to the high rate of
mutation and precise targeting of the diversification. Fluorescent proteins are convenient
objects for establishing and validation of such a system as screening of the new phenotypes
can be easily managed by Fluorescence Activated Cell Sorting (FACS).
25
VII.1. Green and red fluorescent proteins as objects for the directed protein evolution
in vitro
The most popular fluorescent proteins used as reporters in cell and molecular biology
[269] are mutants of the Green Fluorescent Protein (GFP) initially purified from the jellyfish
Aequorea victoria [270, 271]. These mutants were generated using different methods of
genetic engineering including random and site-directed mutagenesis [272-274]. These
methods also allowed the development of GFP-derived proteins with new colors, such as
yellow, cyan and blue fluorescent proteins [275]. The fluorescence of GFP-like proteins and
GFP-derived mutants now cover almost the whole visible spectrum [276]. So far several GFP
variants with high fluorescent intensity including eGFP [277] and Emerald [278] have been
developed.
Proteins that emit red and especially far-red light are of particular interest for both
basic and applied science as they are important for multicolor imaging and applications based
on fluorescence resonance energy transfer (FRET) [276]. Far-red fluorescence photons cause
less damage to proteins and DNA because of their lower energy, which makes far-red
fluorescent proteins (RFPs) to be in high demand for labeling of tissues and whole-organisms
[280, 281].
The favorable „optical window‟ for the visualization in living tissues is approximately
650–1,100 nm as the water in tissues absorb photons and wavelengths longer than 1,100 nm
[282]. Additionally, the light-scattering intensity drops off as the wavelength increases [281].
Recently, far-red fluorescent variants, with the reaching the 650 nm barrier, such as HcRed,
mPlum and AQ143, have been derived from the DsRed or its homologs [283-285]. These
proteins, however, are either characterized by weak brightness or their emission peaks are of a
too short wave to reach the optical window.
Recently, the groups of S. Lukyanov and J. Wiedenmann independently purified from
the sea anemone Entacmaea quadricolor red fluorescent proteins eqFP578 and eqFP611
encoded by the paralogous genes. These became competitive compared to the earlier RFPs
due to their high fluorescent brightness (eqFP578 was 1.5 fold times brighter than DsRed),
complete chromophore maturation and a reduced tendency to oligomerize [286, 287]. Brought
together, these characteristics made Entacmaea quadricolor – derived fluorescent proteins an
attractive starting point for the generation of the bright far-red fluorescent proteins. Up to
2007 the group of S. Lukyanov published a number of bright far-red proteins with different
advantageous characteristics such as TurboRFP and Katyushka and their monomer forms
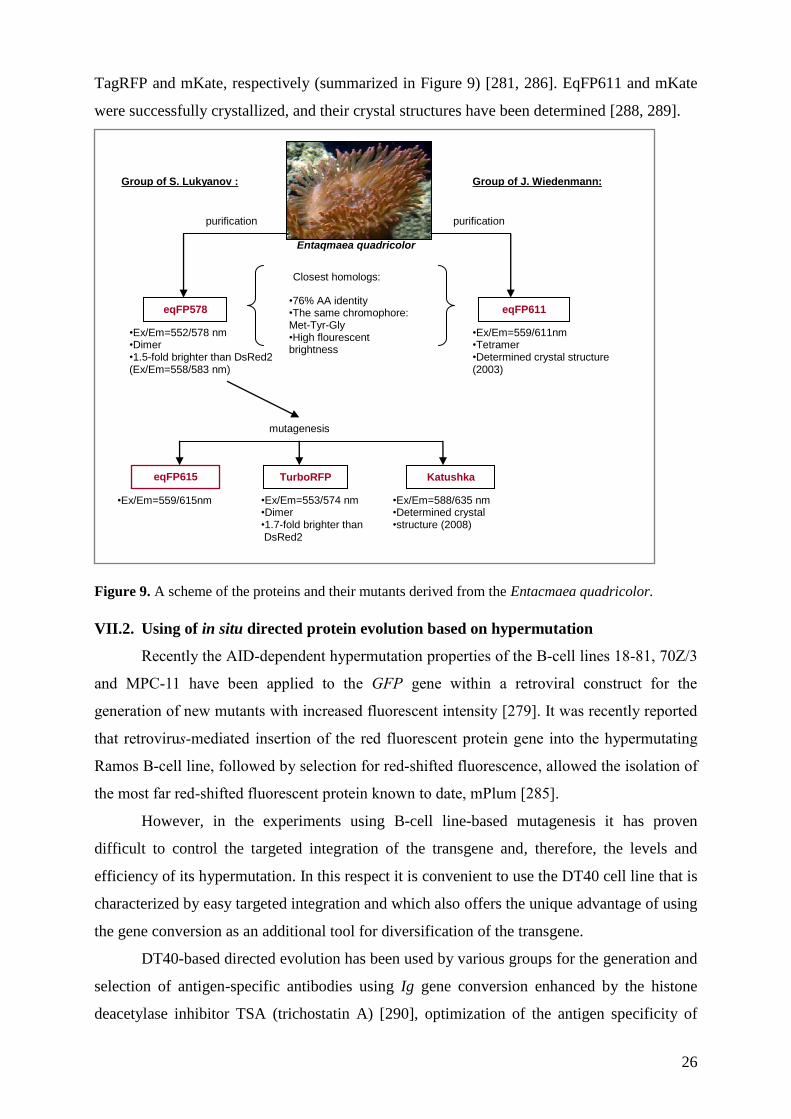
26
TagRFP and mKate, respectively (summarized in Figure 9) [281, 286]. EqFP611 and mKate
were successfully crystallized, and their crystal structures have been determined [288, 289].
Figure 9. A scheme of the proteins and their mutants derived from the Entacmaea quadricolor.
VII.2. Using of in situ directed protein evolution based on hypermutation
Recently the AID-dependent hypermutation properties of the B-cell lines 18-81, 70Z/3
and MPC-11 have been applied to the GFP gene within a retroviral construct for the
generation of new mutants with increased fluorescent intensity [279]. It was recently reported
that retrovirus-mediated insertion of the red fluorescent protein gene into the hypermutating
Ramos B-cell line, followed by selection for red-shifted fluorescence, allowed the isolation of
the most far red-shifted fluorescent protein known to date, mPlum [285].
However, in the experiments using B-cell line-based mutagenesis it has proven
difficult to control the targeted integration of the transgene and, therefore, the levels and
efficiency of its hypermutation. In this respect it is convenient to use the DT40 cell line that is
characterized by easy targeted integration and which also offers the unique advantage of using
the gene conversion as an additional tool for diversification of the transgene.
DT40-based directed evolution has been used by various groups for the generation and
selection of antigen-specific antibodies using Ig gene conversion enhanced by the histone
deacetylase inhibitor TSA (trichostatin A) [290], optimization of the antigen specificity of
Entaqmaea quadricolor
eqFP578 eqFP611
Group of J. Wiedenmann: Group of S. Lukyanov :
Closest homologs:
•Ex/Em=552/578 nm •Dimer •1.5-fold brighter than DsRed2 (Ex/Em=558/583 nm)
•Ex/Em=559/611nm •Tetramer •Determined crystal structure (2003)
eqFP615
•Ex/Em=559/615nm
Katushka
purification purification
mutagenesis
•76% AA identity •The same chromophore: Met-Tyr-Gly •High flourescent brightness
TurboRFP
•Ex/Em=588/635 nm •Determined crystal •structure (2008)
•Ex/Em=553/574 nm •Dimer •1.7-fold brighter than DsRed2
27
antibodies to independent test antigens using gene conversion and hypermutation in RAD51
[291], converting the fluorescence of BFP to green using the GFP gene as a donor for gene
conversion [292].
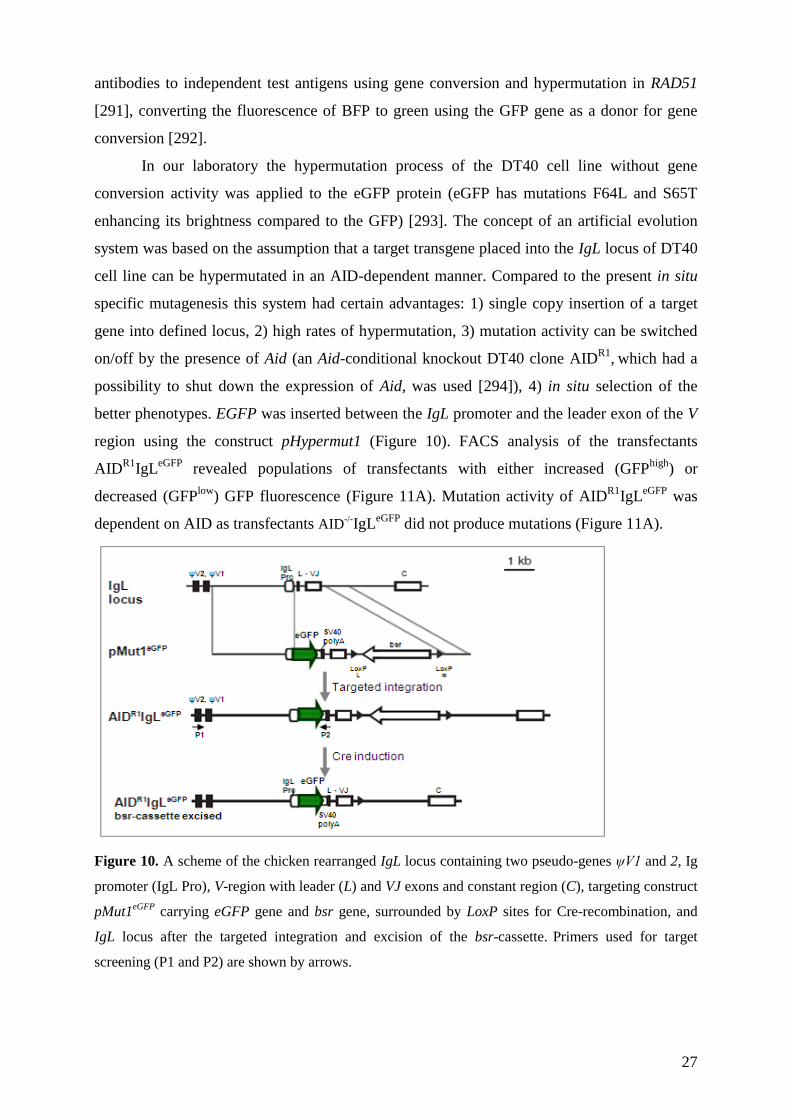
In our laboratory the hypermutation process of the DT40 cell line without gene
conversion activity was applied to the eGFP protein (eGFP has mutations F64L and S65T
enhancing its brightness compared to the GFP) [293]. The concept of an artificial evolution
system was based on the assumption that a target transgene placed into the IgL locus of DT40
cell line can be hypermutated in an AID-dependent manner. Compared to the present in situ
specific mutagenesis this system had certain advantages: 1) single copy insertion of a target
gene into defined locus, 2) high rates of hypermutation, 3) mutation activity can be switched
on/off by the presence of Aid (an Aid-conditional knockout DT40 clone AIDR1
, which had a
possibility to shut down the expression of Aid, was used [294]), 4) in situ selection of the
better phenotypes. EGFP was inserted between the IgL promoter and the leader exon of the V
region using the construct pHypermut1 (Figure 10). FACS analysis of the transfectants
AIDR1
IgLeGFP
revealed populations of transfectants with either increased (GFPhigh
) or
decreased (GFPlow
) GFP fluorescence (Figure 11A). Mutation activity of AIDR1
IgLeGFP
was
dependent on AID as transfectants AID-/-IgL
eGFP did not produce mutations (Figure 11A).
Figure 10. A scheme of the chicken rearranged IgL locus containing two pseudo-genes ψV1 and 2, Ig
promoter (IgL Pro), V-region with leader (L) and VJ exons and constant region (C), targeting construct
pMut1eGFP
carrying eGFP gene and bsr gene, surrounded by LoxP sites for Cre-recombination, and
IgL locus after the targeted integration and excision of the bsr-cassette. Primers used for target
screening (P1 and P2) are shown by arrows.

28
In order to enrich the cells with the increased brightness, GFPhigh
were sorted from the
AIDR1
IgLeGFP
clone (sort I) (Figure 11B). After this two subsequent sorts of the populations
with the increased fluorescent brightness were done and each time the cells, expanded after
the sort, demonstrated superior brightness compared to the cells from the previous sort.
B
Figure 11. (A) FACS profiles of the AID
R1IgL
eGFP and AID
-/-IgL
eGFP clones. Average percentages of
events falling into GFPhigh
and GFPlow
gates based on the measurement of 24 subclones are shown. (B)
Sorting strategy of highly bright GFP population. The gate I population was sorted from three
subclones of the AIDR1
IgLeGFP
after 1 month of culture (sort I). After three weeks of culture of this
sorted population, the gate II population was enriched by two rounds of sorts (sort III).
AIDR1IgLeGFP
1 month culture
AIDR1IgLeGFP sort I 3-weeks culture
AIDR1IgLeGFP sort III
Analyzed subclones: 24 24 Average GFP
low: 3.8% 0.0%
Average GFPhigh
: 0.5% 0.0%

29
OBJECTIVES
The first goal of the present study was to confirm and analyze new GFP phenotypes
generated using the artificial protein evolution system created in our laboratory
(“Introduction”, VII.2) and combine the different optimizations created using this method
through site-directed mutagenesis.
Despite a number of advantages compared to the known in situ mutation systems, the
artificial protein evolution system created in our laboratory is not efficient, due to the
disadvantage that the transgene cannot be mutated specifically. Thus, the second objective of
the present work was to design a vector which would allow diversification of the transgene
specifically and therefore increase the efficiency of the artificial evolution system. In order to
validate the new system, it was applied to the optimization of the red fluorescent protein.
It was previously shown that somatic hypermutation at the IgL locus is dependent on
AID and requires transcription, but it remains unclear why this diversification process is
targeted only to the immunoglobulin (Ig) genes, as other transcribed genes of B-cells do not
undergo mutations at such a high rate. The final objective of the study was to find and
characterize the cis-DNA element responsible for activation and regulation of the somatic
hypermutation within the Ig locus of the DT40 cell line.

30
MATERIALS AND METHODS
I. Materials
I.1. Equipment
Automatic Micropipettes [Eppendorf GmbH, Germany]
Laminar Flow: HERA safe [Kendro lab. Products, Germany]
Nitrogen tank: LS6000 [Taylor-Wharton Laboratory Systems, US]
PCR machines: GeneAmp PCR System 9700 [Applied Biosystems, USA]
Centrifuges: Heraeus [Kendro Lab. Products, Germany]
Electrophoresis chambers: Horizontal [Bio-Rad Lab., USA]
Gel Visualization: Gel Doc 2000TM
[Bio-Rad Lab., USA]
Spectrophotometer: BioPhotometer [Eppendorf GmbH, Germany]
Incubators: Heraeus [Kendro Lab. Products, Germany]
Culture Shaker: Innova 4430 [New Brunswick Scientific, Germany]
Electronic balance [KERN, Germany]
Electroporator: Gene Pulse XcellTM
[Bio-Rad Lab., USA]
Vacuum Pump [Vacuubrand GmbH, Germany]
Vacuum Manifold [Millipore GmbH, Germany]
Analytical FACS: BDTM LSRII Flow Cytometer [Becton Dickinson, USA]
Quantitative FACS: MoFloTM
Cell Sorter [Dako Colorado Inc., USA]
Quantitative FACS: BD FACSAria Cell Sorter [Becton Dickinson, USA]
Light Microscope: Axiovert 25 [Zeiss, Germany]
Cell Viability Analyzer: Vi-CellTM
[Beckman Coulter GmbH, Germany]
Luminescence Spectrometer: LS50B [Perkin Elmer, USA]
DNA Sequencer: ABI 3730 DNA Analyzer [Applied Biosystems & Hitachi; Hitachi
High Tech. Corp., Japan].
I.2. Experimental kits
PCR Purification: Kit [Qiagen GmbH, Germany]
Gel Extraction: Kit [Qiagen GmbH, Germany]
DNA Ligation: Kit Version 2.1 [Takara Bio Inc., Japan]
Plasmid Isolation (Mini): [Qiagen GmbH, Germany]
Plasmid Isolation (Maxi): [Qiagen GmbH, Germany]
First strand cDNA Synthesis: Super Script IIITM
[Invitrogen GmbH, Germany]
I.3. Enzymes
DNA Polymerases:
Pfu Ultra Hotstart [Stratagene, USA]
Expand Long System [Roche Diagnostics GmbH, Germany]
GC-rich PCR System [Roche Applied Science, USA]
Restriction Enzymes [New England Biolabs GmbH, Germany]
Calf Intestinal Phosphatase [New England Biolabs GmbH, Germany]
Proteinase K [Qiagen, Germany]
RNaseA [Qiagen, Germany]

31
I.4. DNA size marker
A DNA marker which was prepared from phage φX174 DNA (HaeIII digest) and
phage λ DNA (HindIII digest) was used in the present study [New England Biolabs GmbH,
Germany].
I.5. Plasmids
As a backbone for the vectors, prepared for the study, pBluescript II KS (+) (pKS)
vector [Stratagene, USA] was used. It contains AmpR gene for selection of transformed
bacteria and lacZα gene for blue/white selection of successful ligations.
I.6. Bacterial strain
A DH5α strain of E. coli was used as a source of competent cells for transformation.
I.7. Mammalian cell line
The chicken B-cell line DT40 was used as a source of mammalian cells for
transfections.
I.8. Media
Molecular Biology:
2YT Broth:
Mix: Bacto tryptone 16 g, Yeast extract 10 g, NaCl 5 g, 10N NaOH 250 μl, distilled water
1000 ml. The mixture was autoclaved and if needed, ampicillin was added (to final
concentration 50-100 mg/ml).
Agar Luria Broth (LB) Media for agar plates:
Mix: LB Broth Base 20 g, BactoTM
Agar 15 g, distilled water 1000 ml.
The mixture was autoclaved. Before pouring onto Petri plates, 1 ml of ampicillin (to final
concentration 50-100 mg/ml) and 1 ml 4% X-gal was added to the mixture.
SOB Broth:
Mix: Bacto tryptone 16 g, Yeast extract 10 g, NaCl 5 g, KCl 0.l86 g, 10N NaOH 250 μl,
distilled water 1000 ml, MgCl2 to the final concentration 10 mM, MgSO4 to the final
concentration 10 mM (MgCl2 and MgSO4 were added after autoclave of mixture).
FTB:
Mix: 0,5 M PIPES 20 ml, CaCl2·2H2O 2.2 g, distilled water 1000 ml, KCl 18.64 g,
MnCl2·4H2O 10,88 g. The pH was adjusted to 6.7 after KCl and MnCl2·4H2O treatments,
respectively.
Cell culture:
Mixes for cell culture media preparation:

32
RPMI [Invitrogen, USA]; DMEM [Invitrogen, USA]; FBS, Fetum Bovine Serum
[Biochrom AG, Germany]
Chicken Medium:
RPMI 500 ml, FBS 50 ml, penicillin / streptomycin (10.000 units of penicillin G sodium
and 10.000 μg/ml of streptomycin sulfate) 10ml, 200mM L-glutamine 5ml, chicken serum 5
ml, 1 M β-mercaptoethanol 50 μl (RPMI could be also substituted by DMEM medium).
Freezing Medium: RPMI 70 ml, FBS 20 ml, DMSO 10 ml.
I.9. Oligonucleotides
The oligonucleotides (5‟ to 3‟) [Invitrogene GmbH, Germany] are enumerated
according to the genes, fragments and plasmids to which they were applied.
I.9.a. Primers for Section I of the “Results”:
Plasmid pHypermut2
Outside primer for the targeting screening
P1: GGGACTAGTAAAATGATGCATAACCTTTTGCACA
Inside primer for the targeting screening
P2: CCCACCGACTCTAGAGGATCATAATCAGCC
eGFP and GFP variants amplification for cloning into the pHypermut2
P3: GAACCTAGGGCCACCATGGTGAGCAAGGGCGAGGA
P4: GAACCTAGGACTTGTACAGCTCGTCCATGCCG
Checking of the orientation and sequencing of the GFP variants within pHypermut2
P4: CCTAGCTCGATACAATAAACGCCATTTGAC
P5: TGGCTTCGGTCGGAGCCATGGAGATC
Site-directed mutagenesis for development of the GFP chimeras:
P6: AACGGCATCAAGGcGAACTTCAAGATC
P7: GATCTTGAAGTTCgCCTTATGCCGTT
P8: CCCGACCACATGAAGgAGCACGACTTCTTC
P9: GAAGAAGTCGTGCTcCTTCATGTGGTCGGG
P10: GATCACATGGTCCTGgTGGAGTTCGTGACC
P11: GGTCACGAACTCCAcCAGGACCATGTGATC
P12: GCCGACCACTACCAGgAGAACACCCCCATC
P13: GATGGGGGTGTTCTcCTGGTAGTGGTCGGC
P14: CTGAgCACCCAGTCCaCCCTGAgCAAAGAC
P15: GTCTTTGcTCAGGGtGGACTGGGTGcTCAG
P16: ATCCTGGGGCACAAGgTGGAGTACAACT
P17: AGTTGTACTCCAcCTTGTGCCCCAGGAT
I.9.b. Primers for Section II of the “Results”:
Plasmid pIgLGFP2
5‟-arm forward: GGGGTCGACATATGATACACAGACCTGACATCTC
5‟-arm reverse: GGGGGATCCACTAGTATCACATAATCACCAAGGTTGGAAA
3‟-arm forward: GGGGGATCCTTCCGCCATGGCCTGGGCTCCTCTC
33
3‟-arm reverse: GGGGCTAGCCCTCTCAGCTTTTTCAGCAGAATAA
Outside primer for the targeting screening: P1 (Section I.9.a)
Inside primer for the targeting screening: P2 (Section I.9.a)
Plasmids pIgL-,GFP2
, pIgLW,GFP2
5‟-arm forward: GGGCTCGAGGGTACTGCGTTTTCCACAAAATTCTCACAG
5‟-arm reverse: GGGAGATCTCTGCACTCTGGCACCGTTAAGCACCATCAC
3‟-arm forward: GGGTGATCAAGATCTGCTAGCACTAGTGGATCCGTCGA
3‟-arm reverse: GGGGAAAAGCGGCCGCCACTGGAAGGAGCTGAAGGCCAC
Outside primer for the targeting screening: AGCTTGGAATTTAACCTCTCCTGTAAA
Inside primer for the targeting screening: P2 (Section I.9.a)
Plasmid p+26IgLGFP2
5‟-arm forward: GGGATCGATTTCCCTGGTGTGGGTTTTTTTGGGT
5‟-arm reverse: GGGATCGATTTGAGAAAGCTCACGCTCCTTCCAA
3‟-arm forward: GGGACTAGTCATCTCAGCGGTGCTTATGAATGAC
3‟-arm reverse: GGGACTAGTACCCCAAAAAGCAGCCGAGCATTTC
Outside primer for the targeting screening: GCTGCTCACCTTCCTTACCCTGCTGCTCCT
Inside primer for the targeting screening: P2 (Section I.9.a)
Plasmid p-15IgLGFP2
5‟-arm forward: TTTATCGATGGAGAAGTGAGCGGCAGAGGGAAAT
5‟-arm reverse: TTTATCGATTCAGCAGGGCAATGGGCACACACTG
3‟-arm forward: TTTACTAGTGCGCAGCAGAGCGCACCAACCACAG
3‟-arm reverse: GGGACTAGTTCGACAGCGAGTGCAAAATCATCTT
Outside primer for the targeting screening: GGACCGGGGGTGCTCACAGCACGGCTTT
Inside primer for the targeting screening: P2 (Section I.9.a)
Plasmid p+52IgLGFP2
Arms forward: GGGACTAGT TGCCCTTTTGCTTGCAGCCAGCCT
Arms reverse: GGGCTCGAGAATCTCAACAGCTGTGAAGTTTCGA
Outside primer for the targeting screening: GGGGAAACAGTGAGCATGGGGATTCCCT
Inside primer for the targeting screening: P2 (Section I.9.a)
Plasmid p-135IgLGFP2
Arms forward: GGGTCTAGAAGTAGTCCAACCAACCTATGCAGT
Arms reverse: GGGCTCGAGTCTGAAGCCTGAAATCACACAGCA
Outside primer for the targeting screening: CTTTCTATCCGTGCTTAGTCTGGTT
Inside primer for the targeting screening: P2 (Section I.9.a)
IRES-bsr-cassette:
Forward: AAATGATCACCCCTCTCCCTCCCCCCCCCCTAACGTTACT
Reverse: GGGTGATCAGGATCCGATCCAGACATGATAAGATACATTG
VJ interveining sequence of unrearranged IgL locus:
Forward (VJi1): GGGGGATCCAGATCTGTGACCGGTGCAAGTGATAGAAAACT
Reverse(VJi2):TACAAAAACCTCCTGCCACTGCAAGGAGCGAGCTGATGGTTTTTAC
TGTCT
GFP RT-PCR:
Forward: GGGTCTAGAGCCATCATGGTGAGCAAGGGCGAGGAGCTGT
Reverse: TGCGGTTCACCAGGGTGTCGCCCTCGAACT
34
Ef1α RT-PCR:
Forward: GGGAAGCTTCGGAAGAAAGAAGCTAAAGACCATC
Reverse: GGGACTAGTAGAAGAGCGTGCTCACGGGTCTGCC
II. Methods
II.1. Polymerase chain reaction (PCR)
For the amplification of DNA different pairs of primers were used; their nucleotide
sequences are enumerated in “Materials”, I.9. For the amplification of genomic DNA with the
Expand Long System, a hot start was preferred in order to prevent unspecific bands. For this
reason, upper and lower mixes were prepared separately and upper mix was added onto lower
mix at 80oC after pre-incubation on the machine. In case of high fidelity polymerases, one
common mix was prepared.
Lower Mix: Upper Mix:
DNA 1 – 100 ng Expand System 0.5 U
Primer forward 5 pmol 10x Expand buffer
Primer reverse 5 pmol 10xCrezol Red 1 μl
dNTP mix 0.2 mM MiliQ water rest
10x Expand buffer Total 5 μl
MiliQ water rest
Total 5 μl
Amplifications were done by using Long-range PCR protocol as following:
1 cycle: 93oC, 2 min (pre-denaturation)
35 cycles: 93oC, 10 sec (denaturation)
65oC, 30 sec (annealing)
68oC, 5 min (20 sec. increase after each cycle) (extension)
1 cycle: 68oC, 7 min (final extension)
II.2. Analysis of DNA by electrophoresis
0.8% to 2% agarose gel (for long and short DNA fragments, respectively) which
contains 0.1 μg/ml EtBr was used to visualize DNA by Gel Doc 2000TM
[Bio-Rad Lab.,
USA]. DNA samples were run at 120 V.
II.3. Restriction enzyme digestion
In general 1-5 U of enzyme was enough to digest 1μg of DNA in 1 h.
For analytical restriction 0.5 μg of DNA was mixed with Enzyme, 10x Buffer, 100x BSA and
water up to the total volume10-20 μl was added.
For preparative restriction 3-5 μg of DNA was mixed with the same components of analytical
restriction mix; total volume of reaction was 30-40 μl. Samples were incubated with enzyme
at appropriate temperature for at least 3 h.
II.4. Purification and gel purification of DNA

35
After PCR or restriction enzyme digestion, DNA was purified by Qiagen PCR
Purification Kit (see “Methods, I.1) according to the manufacturer‟s instructions.
II.5. DNA ligation
Ligation was done by using a DNA Ligation Kit (see “Methods, I.1) according to
manufacturer‟s instructions. In principle, 1 volume of DNA (ratio of vector to insert was
approximately 1:9) and 1 volume of Ligation Solution were used.
II.6. Culture of E.coli
For culture of E.coli LB agar plates and 2YT Broth medium were used. The plates
with E.coli were stored at 4°C for about 1 month. For longer E.coli maintenance storage
glycerol stocks were prepared as follows: (2 volumes of cells + 1 volume of 50% glycerol).
Stocks were frozen at -80°C freezer.
II.7. E.coli DH5α competent cells preparation
1) A streak of bacterial strain DH5α was made on a LB agar plate without antibiotics
for single colony isolation. The plate was incubated overnight at 37oC. 2) A single colony was
picked and was cultured in 5 ml of L Broth or SOB broth medium at 37oC over night. 3) 2.5
ml of the overnight culture was transferred into 500 ml of SOB Broth which had been kept at
25oC, and bacteria were cultured at 25
oC. 4) OD600 was measured every 30 min or every 1 h
(background of SOB Broth was measured in advance). 5) As soon as the OD600 reached 0.4,
the bacterial culture was cooled down immediately on ice and then was kept on ice for 10
min. 6) The culture was transferred into the large centrifuge tubes and was centrifuged at
3000 rpm for 10 min at 4oC. 7) Supernatant was discarded and the pellet was resuspended in
330 ml of ice-cold FTB. (Vortex should not be used during this step). 8) The culture was kept
on ice for 10 min, and was centrifuged at 3000 rpm at 4oC for 10 min. 9) Supernatant was
discarded and the pellet was resuspended in 50 ml of ice-cold FTB. (Vortex should not be
used). 3.5 ml of DMSO was added, mixed gently. 10) 400 μl of aliquots was dispensed into
1.5 ml tubes. Tubes were frozen immediately by liquid nitrogen and the competent cells were
kept at -80oC. 11) The efficiency of competent cells was tested by using 1 ng of pKS plasmid
for transformation to one competent cell tube (400 μl). After heat shock, 600 ml of L Broth
was added to the tube. Before spreading, 10 μl (1/100) and 100 μl (1/10) of bacterial liquid
was taken onto agar plates. The left (89/100) was centrifuged for 1 min at 13000 rpm. Then,
the bacteria were spread by a loop. 13) The number of colonies was counted, and the titer of
competent cells was calculated.

36
II.8. Transformation
A heat shock protocol was performed during transformation of plasmids into bacterial
cells:
1) The plasmid (1-5ng) was added into 50-400 μl of thawed competent cells (the quantity of
cells depended on their efficiency titer).
2) The tube was incubated on ice for 20 min and then heat shocked at 42oC for 40 sec on a
heat block and put on ice for 2 min.
3) 2YT Broth was added into tube until the mixture reached 1 ml and the tube was incubated
at 37oC for at least 10 min.
4) After mixing, 100 μl (1/10) was taken from the bacterial liquid and was put onto half of LB
agar plate. The rest (9 /10) was centrifuged at 8000 rpm for 30 sec, the supernatant was
discarded and the pellet (~50 μl) was put onto another half of the plate.
7) The plates were incubated overnight at 37oC.
II.9. Colony PCR
At first the successful ligations of DNA were checked by colony PCR. Single bacterial
colonies were resuspended in 20 μl of 2YT Broth into U-Bottom 96 well plates. 1μl of
suspension was used as a DNA template for PCR.
PCR Mix: PCR Programme:
Bacteria suspension 1 μl 1 cycle: 94oC, 1 min
Primer forward 5 pmol 30 cycles: 94oC, 20 sec
Primer reverse 5 pmol 55oC, 1 min
10x Expand buffer 1 μl 72oC, 2 min
dNTP mix 0.2 mM 1 cycle: 72oC, 6 min
Expand Long System 0.5 U
10x Crezol red 1 μl
MiliQ water rest
Total 10 μl
II.10. Plasmid preparation
Plasmid extraction from the E.coli culture was made using a Plasmid Isolation Kit
(Mini) (“Methods, I.1) according to the manufacturer‟s protocol. After the constructs were
checked by enzyme digest, a maxi-prep was made.
II.11. Determination of DNA and RNA concentration
The purity and the concentration of the DNA were checked by a spectrophotometer
(see “Methods, I.1). Generally, the intensity of absorbance at the wavelength 260 nm was
used for calculation of concentration and the ratio of 260/280 nm was used to estimate the
purity of DNA. For pure DNA samples this value should be between 1.8 and 2.0.

37
II.12. Basic cell culture techniques
The culture conditions for DT40 cells were 41°C with 5% CO2 according to the ATCC
(American Type Culture Collection) standards. Chicken Medium (“Materials”, I.8) was used
for culture of DT40 cells and Freezing Medium (“Materials”, I.8) was used for freezing down
the cell.
II.13. Thawing of DT40 cells
1) The tube with the cells was transferred from a liquid nitrogen storage tank to 41°C
and, after the cell suspension melted, the tube was centrifuged at 1.500 rpm for 5 min.
2) The supernatant was discarded; the pellet was resuspended in the Chicken Medium and
transferred to a flask or plate.
II.14. Freezing down of DT40 cells
The cells were centrifuged at 1.500 rpm for 5 min. The supernatant was discarded,
and the cells were resuspended in Freezing Medium (“Methods”, I.8); the suspension was
transferred to the cryotubes. At first the tubes were kept at - 80°C overnight and then
transferred to the nitrogen tank.
II.15. Transfection
Plasmid Preparation:
1) The plasmid DNA was linearized outside of the genes of interest by an appropriate
restriction enzyme. Overnight digestion was preferred. The quality of DNA and its digestion
was checked by electrophoresis.
2) The DNA was prepared by phenol/chloroform purification and following isopropanol
precipitation.
3) The pellet was dried up sterile inside the laminar flow and resuspended in distilled water
for final concentration 1 μg/ml.
Electroporation:
1) The concentration of the cells was determined (10 million cells were used per
electroporation). Calculated amount was transferred into a 50 ml tube and centrifuged for 5
min at 1500 rpm, 4oC.
2) The supernatant was removed; the pellet was resuspended in 800 μl of Chicken Medium
and transferred into the electroporation cuvette, where 40 μl of linearized DNA had been
transferred in advance.
3) Electroporation was done using 25 μF and 700 V.
4) The mixture was put into the tube containing 9.5 ml of Chicken Medium and the solution
was distributed on a flat-bottom microtiter plates (100μl each well).

38
5) The following day (12-24 h after electroporation), 100 μl of selective medium (containing
twice the final concentration of the drug) was added to each well.
6) The plates were left for about seven to ten days in the incubator without changing the
medium. Drug resistant colonies were identified at this stage.
II.16. Identifying targeted events by PCR
7-10 days after of electroporation, the visible colonies were picked up into 300 μl of
Chicken Medium in flat-bottom 96-well plates and incubated for 3 days.
1) Crude extract preparation:
The cells were transferred to 96 well PCR plate, washed with PBS and centrifuged for 5 min
at 1500 rpm. The supernatant was discarded; the pellet was resuspended in 10 μl of K buffer
[1 x PCR buffer, 0.1 mg/ml proteinase K and 0.5% Tween 20] for proteolysis. The cells were
incubated for 45 min at 56°C and then for 10 min at 95°C for inactivation of proteinase K.
2) 1 μl of the crude extract was used for PCR analysis.
II.17. Subcloning of DT40 cells
1) Viability and concentration of the cells were counted using Cell Viability Analyzer
(“Methods”, I.1).
2) Four wells of a six well plate were prepared to contain 300, 100 , 30 and 10 viable cells/ml
(in 5 ml of chicken medium in each well).
3) The cell suspension in each well was mixed and distributed on the 96 well flat bottom
microtiter plate (100 μl into each well) for final concentration 30, 10, 3 and 1 cells / well.
4) After incubation for 7-8 days (without changing the medium) subclones became visible as
defined round colonies.
5) In general 24 colonies from the lowest dilutions were picked up into 1 ml of chicken
medium in 24-well flat-bottom plates.
II.18. Drug resistance marker recycling
1) Around 105 cells were cultured with fresh chicken medium containing 0.01 mM 4-
hydroxi- tamoxifen (1 day for partial and 2 days for complete excision).
2) The cells were subcloned by limiting dilution for final concentration of 0.3, 1, 3 and 10
cells / well in 96-well flat-bottom plates.
3) 7 – 8 days after subcloning, 10 μl of the visible subclones were transferred into 1 ml of
chicken medium.
4) In order to test the excision of the drug-resistance genes, the aliquots of cells were
incubated with drug-containing mediums. Retained samples of cells deficient for markers
were selected for further studies.
39
II.19. Flow cytometry
In order to quantify the intensity of green (or red) fluorescence or percentage of cells
expressing proteins with decreased fluorescence intensity, FACS analysis was done. 200 μl of
cell culture was transferred into round-bottom 96-well plates, washed 2 times with PBS and
analyzed by analytical flow cytometer (“Methods”, I.1).
II.20. Fluorescence-Activated Cell Sorting (FACS)
Cells were washed in sterile conditions and collected in 1-2 ml of sterile PBS in
concentration of 0.5-1x10⁶ cells/ml. 2x10
7of the viable cells were used for each sort. This
number was a reasonable estimate, as using less cells might exclude rarely occurring
mutations and using more cells would lengthen the time of the sort. During every sort
(excluding the sorts for the sequencing of the defined populations) approximately 0.2% of the
population, i.e. 4x10³ cells were collected. According to the cell division rate of the DT40 we
should have had sufficient amount of cells for the next sort within 6 days of culture of the
sorted population. However, in practice about 10-14 days was needed as the procedure of
sorting was in fact damaging for cells. After each sort the results have been evaluated by
comparison of the re-grown sorted population with the culture of the previous sort by FACS
analysis. Sorting was done on Quantitative FACS (“Methods”, I.1). Sorted cells were
collected into receiver tubes containing 50% chicken medium and 50% FBS.
II.21. Genomic DNA isolation
1) 50 ml of cells (~ 50x106
cells) in good condition were centrifuged at 1500 rpm for 5
min. The supernatant was discarded, the pellet was washed with 1-2 ml 1x PBS and again was
centrifuged at 1500 rpm for 5 min.
2) The supernatant was discarded, the pellet was resuspended in 500μl proteinase K Buffer (5
M NaCl 2 ml, 1 M Tris-HCl (pH 8.0), 1 ml 0.5 M EDTA 5 ml, MiliQ water 92 ml) containing
0.1 mg/ml of proteinase K. The mixture was transferred into a 2 ml tube and 12.5 μl of SDS
(20%) was added, mixed by inverting and spinned down shortly. Protein degradation was
carried out overnight at 56oC.
3) The next day, 1 volume of phenol was added to the DNA extract and mixed carefully.
After this the tube was centrifuged at 13000 rpm for 5 min.
4) The upper phase was transferred into a new tube and 1 volume of phenol/ chloroform was
added. After mixing the tube was centrifuged at 13000 rpm for 5 min.
5) The upper phase was transferred to a new tube and 1 volume of chloroform was added.
After mixing the tube was centrifuged again at 13.000 rpm for 5 min.

40
6) The upper phase was transferred to a new tube and 2 μl of RNAseA (100mg/ml) was added
for digesting of RNA. After this tube was it was incubated for 2 h at 37oC.
7) DNA was transferred into dialysis membrane and the ends were closed with clamps. The
membrane was put into a glass of cold 1x TE and kept at 4oC for 2 h. (Alternatively, the
reaction can be stopped by adding 50μl of 0,5M EDTA pH 8.0). TE was changed at least
three times with 2-4 h intervals.
8) DNA was transferred to a new tube and the concentration was measured.
II.22. Total RNA isolation
1) 20 ml cells (~ 20x106
cells) were centrifuged at 1500 rpm for 5 min.
2) The supernatant was discarded and the pellet was resuspended in 1.5 ml of TRIzol reagent.
After that it was transferred into a 2 ml Eppendorf tube and was incubated for 5 min at room
temperature to permit the complete dissociation of nucleoprotein complexes.
3) 0.3 ml of chloroform was added into the tube. The tube was mixed for 15 sec and incubated
for 3 min at room temperature, then centrifuged at 13000 rpm, 4oC for 15 min.
5) The upper phase was transferred into a new 2 ml Eppendorf tube; 750 μl of propanol was
added and centrifuged at 13000 rpm, 4oC for 10 min.
6) RNA pellet was washed with 1 ml of 75% ethanol, and centrifuged at 13000 rpm for 5 min.
The supernatant was discarded, the sample was air dried for ~10 min and dissolved in 100 μl
of DEPC water. The quality was checked using 1% agarose gel after 50 min run.
II.23. First strand cDNA synthesis
Super Script III (Invitrogen, USA) was used to synthesize first strand cDNA according
to the manufacturer‟s instructions.
II.24. Fluorescent spectra analysis
1 ml of cell suspension was used for analysis of excitation and emission spectra of the
fluorescent proteins on Luminescence Spectrometer (“Methods, I.1) according to the
manufacturer‟s instructions.

41
RESULTS
I. Application of somatic hypermutation for artificial protein evolution
The present study describes the development of a new vector, pHypermut2, which
allowed diversification of a transgene specifically and efficiently when it is placed into the
IgL locus of the DT40 cell line. PHypermut2 proved to be a convenient tool for the efficient
artificial evolution of proteins and was applied for the optimization of the fluorescent
proteins. PHypermut2 formed the basis of a research project studying the activation and
regulation of the somatic hypermutation process.
I.1. Improvement of the artificial evolution system and application for optimization
of the GFP proteins
I.1.a. Analysis of the mutations responsible for the increase of the GFP brightness
Although previously the pHypermut1 vector allowed the developing of brighter
variants of eGFP (“Introduction”, VII.2), the system had a disadvantage: not only the GFP
coding sequence but also its downstream sequences, including splice donor, could potentially
undergo mutation. In order to analyze the mutations responsible for the increase of the GFP
brightness, the coding sequence of the eGFP gene was PCR-amplified from the cells after the
first and the third sorts, cloned into a plasmid and sequenced. Surprisingly, only a few
mutations were found in the eGFP coding sequence of the cells after the first sort (Table 2).
Extension of the sequence analysis to the region downstream of the eGFP coding sequence by
primer walking revealed that most of mutations were concentrated at the splice donor site of
the Ig light chain leader intron (polyA-L in the Table 2). Apparently inhibition of splicing
increased the mRNA stability which leads to a brighter GFP phenotype.
In contrast, most of the sequences after the third sort revealed mutations in the eGFP
coding sequence (221 mutations/85 seq) (Table 2). Many of the observed amino acid changes
were not shared among independent sorts, and their functional significance remained
uncertain. However, a number of codon changes occurred independently in different
subclones suggesting that they were related to the increased fluorescence of the expressed
proteins. The GFP variants, whose altered sequences were found more than once, were
selected and named as GFPv 1 – 9.

42
Table 2. Analysis of the mutation profile of the eGFP and its splice donor (polyA-L) after three rounds
of the sorts for increased intensity of the green fluorescence.
As our main interest was to improve GFP by mutations in its coding sequence rather
than mutations in the splicing signal, which could interfere with the amount of transcripts, it
was decided to design a new vector pHypermut2 for improvement of the artificial evolution
system.
I.1.b. Construction of a vector pHypermut2 for improvement of the artificial evolution
system
PHypermut2 was generated by five cloning steps using three plasmids, developed
earlier in our laboratory: pIgPromKoArms, pRSVExpress and pLoxPuro. pIgPromKoArms
was based on the pKS plasmid and contained target arms for homologous recombination with
the IgL locus. For the 3‟ target arm the LVJ fragment of the IgL locus was used, and for the 5‟
arm a 2.5 kb fragment downstream of the ψV – gene 2. Targeted integration of the vector
would result in the replacement of the IgL promoter with sequences contained between the
target arms (Figure 12). A cassette for the cloning of the target gene for artificial evolution
was amplified and inserted into the pIgPromKoArms from the pRSVExpress. The coding
sequence of the target gene can be cloned into the multiple cloning sites of pRSVExpress
(NheI, EcoRV and BglII sites) allowing transcription to be driven by the strong RSV (Rous
sarcoma virus) promoter. The coding sequence is followed by the SV40 polyadenylation
signal (SV40 polyA). For selection of stable transfectants of pHypermut2 a puromycin
resistance (puroR) gene driven by the β–actin promoter was amplified from the pLoxPuro
vector and inserted into pHypermut2 downstream of the cassette for the cloning of the
reporter gene coding sequence. The puroR–cassette from pLoxPuro is flanked by loxP sites
which allowed excision by Cre recombinase following stable integration of the construct. As
this cassette was located downstream of the reporter gene, it was unlikely that it would
interfere with the transcription or mutagenesis of the reporter gene. For this reason the
possibility of excising the drug-resistance cassette was retained in pHypermut2 but was not
used in the following experiments.
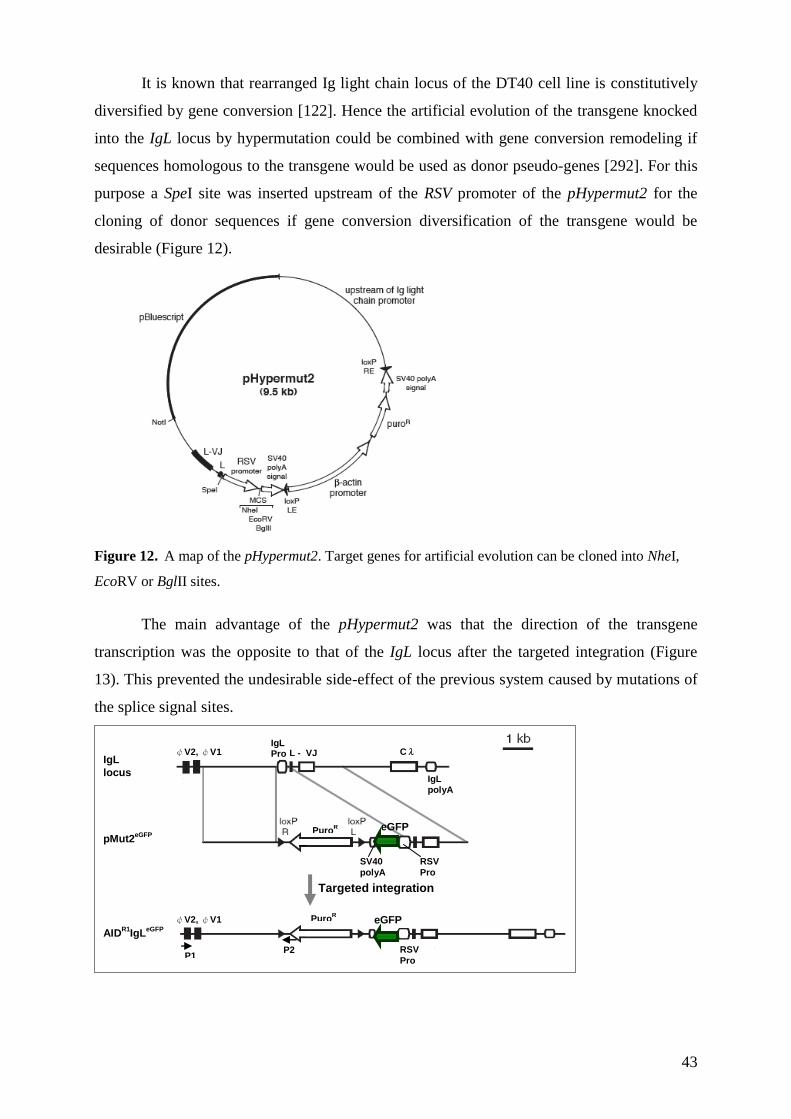
43
It is known that rearranged Ig light chain locus of the DT40 cell line is constitutively
diversified by gene conversion [122]. Hence the artificial evolution of the transgene knocked
into the IgL locus by hypermutation could be combined with gene conversion remodeling if
sequences homologous to the transgene would be used as donor pseudo-genes [292]. For this
purpose a SpeI site was inserted upstream of the RSV promoter of the pHypermut2 for the
cloning of donor sequences if gene conversion diversification of the transgene would be
desirable (Figure 12).
Figure 12. A map of the pHypermut2. Target genes for artificial evolution can be cloned into NheI,
EcoRV or BglII sites.
The main advantage of the pHypermut2 was that the direction of the transgene
transcription was the opposite to that of the IgL locus after the targeted integration (Figure
13). This prevented the undesirable side-effect of the previous system caused by mutations of
the splice signal sites.
Targeted integration
IgL Pro L - VJ Cλ
IgL polyA
SV40
polyA
PuroR
IgL
locus
ψV2, ψV1
eGFP
ψV2, ψV1
P1
PuroR eGFP
RSV
Pro
P2 RSV
Pro
pMut2eGFP
AIDR1
IgLeGFP

44
Figure 13. A scheme of the rearranged IgL locus, targeting construct pMut2eGFP
carrying the GFP2
reporter and targeting arms for replacement of the IgL promoter after targeted integration of the
pMut2eGFP
. Transcriptional orientation of the reporter cassette is opposite to that one of the IgL locus
(the primers for the targeting screening are indicated as P1 and P2).
In order to test the suitability of pHypermut2 for the artificial evolution system, the
eGFP gene was cloned into the multiple cloning site of this vector. For this AvrII sites were
added to the cDNA of the gene by amplification with Pfu Ultra Hotstart polymerase
(“Materials”, I.3, “Enzymes”) using primers P3 and P4 (“Materials” I.9,
“Oligonucleotides”) and the resulted amplicon was cloned into the NheI site of the
pHypermut2. (Primer pair P3/P4 was used further for the amplification of all the GFP variants
in order to clone them into this vector). PHypermut2, carrying the eGFP reporter gene, was
named pMut2eGFP
. Following transfection of this vector into the V-knockout AIDR1
cell line,
puromycin resistant clones were expanded and targeted integration was checked by PCR
screening with Expand Long Template PCR system (“Materials”, I.3, “Enzymes”) using one
primer annealing at the remaining V2-gene, and another to the polyA signal of the puroR
gene of the pHypermut2 (primers P1 and P2, respectively; see “Materials”, I.9,
“Oligonucleatides” and Figure 13). The frequency of the targeted integrations after
transfections of the pHypermut2 was about 50 - 70% (Figure 14).
After insertion of the reporter into the IgL locus, it was important to test whether the
vector was correctly integrated into the chromosome carrying the rearranged IgL locus. This
is essential in order to achieve the high mutation rate desired for the transgene. This could be
confirmed by a PCR for checking the presence of the intervening sequence inside of a
fragment between V and J (using primers VJi1 and VJi2 (“Materials”, I.9,
“Oligonucleotides”), which is normally excised during the process of rearrangement. Since
LVJ was used as one of the targeting arms, the successful amplification of the described
fragment after targeting means, by exclusion, that the construct was inserted into the
rearranged allele of the IgL locus (Figure 14).
A positive clone, V-AID
R1IgL
eGFP, (indicated in the Figure 13 as AID
R1IgL
eGFP) was
subcloned by limited dilution, and 24 subclones were analyzed by FACS after 14 days of
culture. The average percentage of the cells with the decreased fluorescence of GFP (GFPlow
population) was 10.9%. This result suggested that the pHypermut2 can be used for efficient
diversification of the transgene by the hypermutation for the artificial evolution. In the project
for improvement of the GFP protein, pHypermut2 was used for confirmation of the brighter
variants developed earlier using pHypermut1. For validation of the suitability of the system in

45
situ, pHypermut2 was applied to a red fluorescent protein (“Results”, I.2).
V-AID
R1IgL
eGFP V
-AID
R1IgL
eGFP
control
water DNA 1 2 M 3 4 5 6 7 .
Primer pairs
for each well:
P1/ VJi1/
P2 VJi2
V-AID
R1IgL
eGFP V
-AID
R1IgL
eGFP
8 9 10 11 M 12 13 14 15 16 .
V-AID
R1IgL
eGFP V
-AID
R1IgL
eGFP
17 18 19 20 M 21 22 23 24 25 .
Total 16/25 targeted clones
Figure 14. Targeting screening after integration of the pMut2eGFP
to the V-AID
R1 cell line. Crude
extract of the V-AID
R1IgL
eGFP cells was used as a template. Different clones are shown by numbers
above lines. DNA size marker is indicated by “M”. For each clone two pairs of primers were used:
outside and inside targeting primers P1 and P2 allowed a check of the proper integration of the vector
(in case of successful targeting the length of the PCR product was ~2.5 kb); a pair of primers VJi1 and
VJi2 were used to test whether the integration took place into the rearranged allele of the IgL locus
(this is indicated by the appearance of the PCR product of length 0.5 kb). Purified genomic DNA of
the AID-/-V
r-E clone of DT40 was used as a positive control for primers VJi1 and VJi2 and PCR mix
without template was used as a negative control. 16 correctly targeted clones were identified from 25
screened clones (65%).
mQ 0.5 kb
2.5 kb
46
I.1.c. Confirmation of the new GFP phenotypes
In order to confirm the phenotypes of the developed GFP variants, their coding
sequences were cloned into the pHypermut2 and transfected to the AID -/-
cell line which does
not have the hypermutation activity. EGFP and GFP variant Emerald [278] were cloned into
pHypermut2 and transfected into the same cell line as a control for the measurement of the
brightness increase. Following transfection into the AID-/-
cell line, puromycin resistant
clones containing targeted integration of the vectors were identified by PCR screening using
primers described in Figure 14. More than 50% of all stable transfectants had integrated the
constructs into the rearranged IgL locus and these clones were named according to the
inserted transgene (AID-/-
IgLeGFP
, AID-/-
IgLEmerald
, AID-/-
IgLGFPv1
, AID-/-
IgLGFPv2
etc.).
Two independent clones from each cell line were analyzed by FACS (Figure 15). The
brightness of two clones of the same cell lines showed slight variation (Table 3). This was
possibly due to an epigenetic effect as the FACS machine was calibrated every time prior the
experiment. The comparison of the transfectants revealed that the fluorescent intensity of the
AID-/-
IgLEmerald
clone was 1.2 times higher than of the AID-/-
IgLeGFP
clone. Among nine GFP
variant knock-in cell lines, four (AID-/-
IgLGFPv2
, AID-/-
IgLGFPv5
, AID-/-
IgLGFPv6
and AID-/-
IgLGFPv8
) were brighter than the control AID-/-
IgLeGFP
clone, and the fluorescent intensity of
three clones (AID-/-
IgLGFPv5
, AID-/-
IgLGFPv6
and AID-/-
IgLGFPv8
) even exceeded the intensity of
the AID-/-
IgLEmerald
.
Among the analyzed GFP variants, the AID-/-
IgLGFPv6
possessed the highest
fluorescent intensity (2.5-fold higher than of AID-/-
IgLeGFP
clone) and the AID-/-
IgLGFPv5
clone
was the second brightest (2.0-fold brighter than the AID-/-
IgLeGFP
) (Figure 15, Table 3).
Figure 15. FACS analysis for comparison of the fluorescence intensity among the transfectants
containing different GFP variants. The brightness of AID-/-
IgLeGFP
is shown at each dot plot by green
guideline. Quantitative FACS data is shown in Table 3.

47
Table 3. Amino acids changes of the GFP variants and their relative to the eGFP brightness. aRelative
brightness was estimated based on the analysis of the two clones of each transfectant.
I.1.d. Development of chimeric GFP variants for an additional increase of brightness
Since not all beneficial nucleotide changes were shared among the GFP variants
(Table 3), it was decided to combine the obtained mutations by site-directed mutagenesis into
a single sequence in order to achieve brighter GFP variants. Nucleotide substitutions
corresponding to the amino acid changes of GFPv6, v5, v8, v2 and v9 were chosen for this
(Table 3 and Figure 16). This also served to validate the observed nucleotide changes indeed
influence function.
In order to combine the codon changes found in different eGFP variants, primers P6–
P17 were designed (“Materials”, I.9, “Oligonucleotides”) which included the described
mutations in the center of the primer sequence for a specific codon change. As a first step,
parts of the eGFP gene were amplified by PCR using at least one mutation-containing primer.
In the second step PCR fragments containing mutations were mixed with other PCR
fragments to cover the full eGFP coding sequence. This mixture served as a template for
chimeric PCR using the primer pair of P3/P4 for cloning the final amplicon into the NheI site
of the pHypermut2. The orientation and the sequence of the mutant eGFPs within the
pHypermut2 were confirmed by sequencing using primer pair P4/P5.
48
Using the technique of chimeric PCR, at first Y145F and S202T amino
acid changes of the GFPv6 were combined with V163A (GFPv5) to
generate GFPv10. Because GFPv1 containing Q80E showed less
brightness than eGFP, we subtracted Q80E from GFPv10 and generated
GFPv11. We also added L221V of GFPv8 to GFPv11, and generated
GFPv12. Finally we added Q184E and A206T of GFPv2 and L141V of
GFPv9 to produce GFPv13. All the chimeric GFP PCR products were
cloned into pHypermut2, and inserted into the rearranged IgL locus of
AID-/-
cells for confirmation of the new phenotypes.
Figure 16. Subsequent introduction of the amino acids changes during site-directed mutagenesis.
Generations of the variants GFPv10-13.
Using FACS two clones of each of the new cell lines were analyzed (Figure 17). All of
these new clones showed higher fluorescent intensity than the AID-/-
IgLGFPv6
clone. The AID-
/-IgL
GFPv10 was 3.0-fold brighter than the AID
-/-IgL
eGFP clone (Figure 17). The AID
-/-IgL
GFPv11
and the AID-/-
IgLGFPv12
clones were even brighter, showing 3.2- and 3.3- fold more brightness
than the AID-/-
IgLeGFP
, respectively. The AID-/-
IgLGFPv13
did not show higher brightness than
other chimeric GFP-expressing clones (Figure 17). The second brightest GFP chimera,
GFPv11 was named as “GFPnovo1” and the brightest one, GFPv12, as “GFPnovo2”.
Figure 17. Relative fluorescence of the transfectants normalized to the fluorescence of AID-/-
IgLeGFP
.

49
I.1.e. Spectral properties of the brightest GFP variants
EGFP has its excitation maximum at 488 nm and emission maximum at 509 nm [277].
In order to characterize the spectral profiles of the new GFP variants, clones AID-/-
IgLEmerald
,
the AID-/-
IgLGFPv5
, the AID-/-
IgLGFPv6
, the AID-/-
IgLGFPnovo1
and the AID-/-
IgLGFPnovo2
were
analyzed by a luminescence scanning spectrometer (Figure 18A). AID-/-
IgLeEGFP
was used as a
control. Excitation spectra were scanned using fixed emission 540nm and emission spectra
were measured using excitation at 460nm. This analysis showed that the fluorescent intensity,
not the excitation and emission spectra, had been changed in the transfectants expressing
variant GFPs. All the analyzed GFP variants possessed almost the same excitation and
emission spectrum with the eGFP of the AID-/-
IgLeGFP
clone. The lack of shift of the
excitation or emission maxima was most likely due to our selection strategy which only
enriched for cells with an increased brightness, not for shifts in spectra.
We also analyzed AID-/-
IgLeGFP
, AID-/-
IgLEmerald
, AID-/-
IgLGFPv5
, AID-/-
IgLGFPv6
, AID-/-
IgLGFPnovo1
and AID-/-
IgLGFPnovo2
by fluorescence microscopy (Figure 18B). Consistent with
the FACS and spectral analysis the GFPv5, v6, GFPnovo1 and GFPnovo2 variants showed
the same color as eGFP, with increased brightness. Especially the brightness of AID-/-
IgLGFPnovo1
and the AID-/-
IgLGFPnovo2
clones over the AID-/-
IgLeGFP
clone were confirmed by
images of the eukaryotic cells (Figure 18B).
A
B

50
Figure 18. (A) Excitation and emission spectra of the GFP variants. (B) Image of single cells by
fluorescence microscopy. The image of the same single cells is shown with fluorescence activation
using blue filter with the range of 450-490 nm (upper row) and without fluorescence activation (lower
row). No time lack was used between the measurements in order to prevent the photobleaching.
I.2. Application of the advanced artificial evolution system for optimization of the
RFP proteins
The described artificial evolution system can theoretically be applied to any gene
whose phenotype can be screened in the DT40 cell line. After establishing the method using
the GFP protein, we have chosen a red fluorescent protein as the next object for optimization
by artificial evolution. We were successful in generating the new variants of this protein with
either increased or red shifted emission compared to the starting protein.
I.2.a. EqFP615 and strategy for its improvement by somatic hypermutation
The group of S. Lukyanov provided us with the cDNA of the mutant protein eqFP615,
which was one of the intermediates of the eqFP578 in vitro mutagenesis, which lead later to
the development of the TurboRFP and Katushka (“Introduction, VII.2, Figure 9). The
alignment of mentioned proteins together with the eqFP611 revealed that the sequence of the
eqFP615 has 8 amino acid changes in comparison with the wild type eqFP578, seven of
which share with Katushka and its monomer mKate and 4 – with TurboRFP; the eqFP611 and
eqFP615 had 76% identity in amino acid sequence (Figure 19).
Figure 19. Amino acid sequence alignment of the wild types eqFP578 and eqFP611 and the mutants
of the eqFP578: TurboRFP, Katushka and its monomer - mKate.

51
615 660 576 nm 488 laser
633 laser
615 660 576 nm 633 laser
488 laser
The eqFP615 protein is less bright than the wild type precursor, but is more red-
shifted, with excitation and emission maxima at 559 nm and 615 nm, respectively
(unpublished data from the provider). The emission spectrum measurement of the DT40 cells
expressing the eqFP615 by the luminescence spectrometer (“Materials and Methods”, I.1)
confirmed that this protein had a large stock shift and a broad peak of emission (Figure 28 and
29B). Due to these properties of the eqFP615, it was suggested that this protein could be
excited by the red laser 633 nm used in the FACS analysis.
We reasoned that two optimizations of this protein, regarding either intensity or
spectrum, might be worthwhile.
Optimization strategy A. In order to increase the brightness of the eqFP615 a FACS
screening for sorting of mutants with increased fluorescence intensity after excitation by the
red laser could be used. Such a protein would be useful in the cell and mouse biology
applications because it can be easily visualized.
Optimization strategy B. Development of a variant with an emission maximum shifted,
if possible, to the far red spectrum with an emission peak of sufficient intensity at the red laser
excitation was of special interest. The fluorescence of such a variant could be easily
distinguished from those of other FPs commonly used for FACS because the later have
detectable emissions at excitations by lasers of blue or shorter wavelengths. This would allow
coexpression and analysis of the new mutant even in the presence of other red fluorescent
proteins.
A B
Figure 20. Suggested optimizations for the eqFP615 fluorescent properties. The present spectrum of
the eqFP615 protein is indicated by a solid line; the spectrum of the theoretical mutant proteins
expected from the defined optimization is drawn by a dashed line. The FACS blue and red lasers
excitation wavelengths are indicated by blue and red arrows respectively. Wavelengths corresponding
to the FACS red fluorescence detection filters are shown in red. (A) Suggested increase of the
excitation/emission intensity. (B) Suggested far- red shift of the spectrum.

52
I.2.b. Generation of the RFP variants with increased fluorescence and far-red shifted
emission spectrum
In order to perform the artificial evolution of the eqFP615, its coding sequence was
cloned into the pHypermut2 vector. To do this the cDNA was firstly amplified using Pfu Ultra
Hotstart polymerase (“Materials and Methods”, I.3) using primers P18 and P19. The cDNA
was then cloned into the pHypermut2 vector between the NheI and EcoRV sites (Figure 12).
The correct orientation of the cloned gene was checked using primer P3 annealing at the RSV
promoter of the vector. The resulted plasmid, named pMuteqFP
, was transfected into the ψV-
AIDR1
cell line (further – AIDR1
). Targeted integration of the transgene into the IgL locus in
the AIDR1
IgLeqFP
transfectants was validated by target screened using the primer pair P1/P2.
Similar to the integration of the eGFP using pHypermut2, described in the “Results” I.1, the
transcriptional orientation of the eqFP615 transgene was designed to be opposite to that of the
V gene of the IgL locus (Figure 13).
FACS analysis of the AIDR1
IgLeqFP
revealed that it was possible to excite these cells
with both of blue (488 nm) and red (633 nm) lasers; the fluorescence was analyzed at 660/20
nm long pass detection filter (further referred as 660 nm DF) (Figure 21B). FACS analysis of
10000 cells revealed that each clone contained a major cell population with high fluorescence,
which most likely represented cells expressing non-mutated eqFP615, and a minor population
of 5-10 % with a decreased or absent fluorescence, most likely representing cells with
deleterious mutations in the RFP gene.
In order to generate a reference point for the new RFP variants, pMuteqFP
was
transfected to the AID-/-
clone of the DT40. Almost none of the cells possessing the decreased
or vanished fluorescence were observed in the transfectant AID-/-
IgLeqFP
cells (Figure 25),
confirming the AID – dependency of the hypermutation of the eqFP615 gene.
In order to test whether the AIDR1
IgLeqFP
transfectant produced mutants with
characteristics fitting the suggested optimizations, approximately 106 of the cells were
analyzed by FACS using appropriate detection filters. To determine if intensity increased
mutants were excited by the red laser (633 nm) and the fluorescence intensity at 660 nm DF
was plotted against FSC as shown on the Figure 21A. A minor population of the cells with
increased fluorescent brightness was indeed detected. These cells were further gated and
sorted according to the strategy A.
In order to recover the cells expressing the mutated protein according to the
optimization B, the fluorescence of the AIDR1
IgLeqFP
cells was analyzed using a dotplot with a
combination of two different detection filters: fluorescence intensity at 576/26 nm (further –

53
“576 nm”; excitation at the 488 nm laser) was plotted against the fluorescence at 660 nm
(excitation by the 633 nm red laser) (Figure 21B). There was a minor population of the cells
expressing the protein with the desirable properties observed. These had a fluorescence
intensity increased at 660 nm and decreased at 576 nm. These were most likely corresponded
to the mutant eqFP615, possessing emission with a maximum, shifted to the far red spectrum
(Figure 20B).
Figure 21. FACS analysis of the AIDR1
IgLeqFP
cells in order to test the suggested sort strategies. (A)
Fluorescence intensity at 660 nm detection filter after red laser excitation. (B) Fluorescence intensity
at 660 nm detection filter after red laser excitation plotted against intensity at 576 nm DF after blue
laser excitation. Gated cells were used for the sorts.
In order to enrich the cell population with an increased fluorescent brightness of the
expressed eqFP615, three sequential sorts were done in agreement with the sort strategy A.
Each time approximately 0.2% of the cells (shown in blue and violet on the Figure 22) were
sorted. After each sort we obtained an enrichment of the cell populations with the increased
fluorescence intensity (Figure 22).
Figure 22. Sorts of the populations with the increase of the fluorescent intensity at the 660 nm DF.
(sort strategy A).
Sort A
1
FSC
A1 A2 A3
AIDR1
IgLeqFP
AID
R1IgL
eqFP
sorted population 1 (A1) AID
R1IgL
eqFP
A2
Sort A
2
B A
576 nm FSC

54
FACS analysis after expansion of the sorted cell population by culture according to
the strategy B (AIDR1
IgLeqFP
B1), revealed a new population, named β (Figure 23).
Figure 23. Sort according to the strategy B. The gates set up for enrichment of the cells with the
fluorescence, increased at 660 nm DF and reduced at the 576 nm DF. The gates for the next sort of the
population β (marked in blue) are shown on the right dotplot.
The population with the increased brightness after sorts A (Figure 22) could also
contain cells expressing mutant protein with a spectrum change, because increase of the
fluorescence at the 660 nm detection filter could indicate either increase of the emission
maximum, but also a the far red shift of the emission peak as well (Figure 20A and 20B). To
distinguish between different spectrum changes of the cells after the first sorts A they were
analyzed using the combination of detection filters used for the sort B. This analysis revealed
that the AIDR1
IgLeqFP
A1, A2 and A3 populations all contained new multiple populations
(Figure 24B for A1, Figure 26 (left dotplot) for A3; for A2 data is not shown), which were
very uncommon in the initial cells AIDR1
IgLeqFP
(Figure 23A). Interestingly, when the cells
from sort A1 were analyzed using the combination of the 660 nm and 576 nm DFs, it
appeared that A1 cells contained a population (named α) which was similar in properties to
the population β enriched after the sort B1 (Figure 23 (right dotplot) and 24B).
AIDR1
IgLeqFP
Sort B 1
β
576 nm 576 nm
AIDR1
IgLeqFP
sorted population 1 (B1)

55
Figure 24. FACS analysis of the cells after the first sort A (AIDR1
IgLeqFP
A1 clone) analyzed using
different combinations of filters. (A) A dotplot with the 660 nm on y-axis and FSC on x-axis was used.
Cells marked in blue belong to the population α in (B). (B) A dotplot with the 660 nm on y-axis and
576 nm on x-axis was used. The gates for the sort of the population α are shown.
There was a possibility that these populations (named AIDR1
IgLeqFP
α and
AIDR1
IgLeqFP
β) contained cells expressing a mutant eqFP615 with similar or identical
sequence changes. In order to check the sequence similarity of the eqFP transgenes, each of
the RFP genes from the sorted populations α and β was PCR-amplified (the sequenced genes
were named Mα1 and Mβ1 respectively). These coding sequences were re-cloned into the
pHyprmut2 and sequenced using primers P4 and P5 annealing at RSV promoter and polyA
signal. Sequence analysis (“Results”, I.2.d) confirmed that both of these genes and hence the
two cell clones arising through repeated selection contained identical nucleotide changes
(Figure 31).
As the sort strategy A identified more mutated populations than the sort strategy B,
and as it delievered the population containing a mutant identical to that obtained with sort B,
it was decided to concentrate upon the sort strategy A for future studies.
The brightness increase of the major cell population after the third sort (A3) in
comparison with the cells expressing initial eqFP615 was approximately 2 fold (Figure 25).
Figure 25. FACS analysis of the AID-/-
IgLeqFP
clone and AID
R1IgL
eqFPA3 cells after three sort rounds
according to the strategy A. Upper panel: the fluorescence at 660 nm DF plotted against FSC (the
brightness of AID-/-
IgLeqFP
is shown at each dot plot by grey guideline); lower panel: the fluorescence
at 660 nm (x-axis) plotted against the number of the analyzed cells (y-axis).

56
After the AIDR1
IgLeqFP
A3 sorted population was expanded, an analysis using the two
detection filters (660 nm and 576 nm) was applied again in order to distinguish between the
cells expressing proteins with different spectrum changes, as was done for the
AIDR1
IgLeqFP
A1 cells. This analysis revealed that A3 cells contained three different
populations: P1, P2 and P3 with the percentages 42, 46 and 0.4% respectively (Figure 26).
This analysis allowed a clear distinction between populations that had an increase only at 660
nm DF (P1) and those that combined an increase at 660 nm with a reduced fluorescence at
576nm DF (P2 and P3). Due to the low percentage of cells in the population P3 an additional
sort for its enrichment was performed. After this sort the percentage of P3 cells increased
from 0.4% to 57% (Figure 26).
Figure 26. Sort π for enrichment of the P3 population of the AIDR1
IgLeqFP
A3 cells. The gates are
shown in red.
In order to analyze the spectrums and sequences of the eqFP expressed by the cell
populations P1 - P3, we subcloned AIDR1
IgLeqFP
A3 to obtaine monoclonal P1, P2 and P3
cells. In order to prevent the further mutations the Aid cassette was excised from the
AIDR1
IgLeqFP
A3 and AIDR1
IgLeqFP
π prior to subcloning using tamoxifen induction of Cre
recombinase (“Methods”, II.18). Figure 27 shows the FACS profiles of the subclones, AID-/-
IgLeqFP
P1, AID-/-
IgLeqFP
P2 and AID-/-
IgLeqFP
P3 in comparison with the AID-/-
IgLeqFP
cells
analyzed using dotplots with the combination of the 660 nm and 576 nm DFs.
576 nm
Sort π
for population P3
576 nm
AIDR1IgLeqFP
π AIDR1IgLeqFP A3
A3
P1
P2
P3
P1 P2 P3
57
Figure 27. FACS analysis of the AID-/-
IgLeqFP
transfectant and the subclones AID-/-
IgLeqFP
P1,
AID-/-
IgLeqFP
P2 and AID-/-
IgLeqFP
P3 on the dotplot with the combination of the 660 nm and 576 nm
DFs. On each dotplots the positions of the other clones are shown by their respective gates.
I.2.c. Spectral characteristics of the new RFP variants
Excitation and emission spectra of the RFP variants were analyzed by the
luminescence spectrometry. The background luminescence of the non-transfected DT40 cells
was subtracted from the obtained spectrums of the monoclonal populations. Excitation was
scanned for 670 nm of emission (Figure 28), and emission spectra were obtained using
excitation at 550 nm (close to the maximum of the excitation peak for parental eqFP615) as
well as at wavelengths corresponding to the blue (488nm) and red (633nm) lasers of the
FACS machine (Figure 29).
Compared to the cells expressing the initial eqFP615 protein, the excitation and
emission spectra of the cells from all three analyzed clones were improved as predicted under
the optimization strategies. As discussed below, the spectral changes were consistent with the
differences observed for the FACS profile of the populations P1-P3, except for the case of the
excitation at 633 nm (Figure 29C). The probable reason for this is the lower sensitivity of the
spectrometer compared to that of the FACS machine, which prevented us from distinguishing
between the clones after excitation at 633 nm.
P1 population. The excitation spectrum of the AID-/-
IgLeqFP
P1 cells had approximately
twice the intensity compared to the AID-/-
IgLeqFP
cells (Figure 28). Accordingly, there was an
increase observed in the emission spectrum maximum of the P1 clone at all three used
excitation wavelengths (Figure 29). This result was consistent with the FACS data,
demonstrating that this population was brighter than the AID-/-
IgLeqFP
cells at both 660 nm
and 576 nm DFs (Figure 27). The increase at 576 nm in the FACS analysis was less than at
660 nm. This is explained by the emission spectrum at 488 nm excitation on Figure 29A: the
curves of the AID-/-
IgLeqFP
and AID-/-
IgLeqFP
P1 almost interfuse at 576 nm which complicates
the distinguishing of the fluorescence at this DF. Comparing P1 cells to those expressing wild
type eqFP615, the emission peak of the P1 cells exhibited a very minor shift to the far red
wavelengths. Therefore, the population AID-/-
IgLeqFP
P1 expressed a mutant protein which
was improved in intensity but nit wavelength, according to optimization A.
P2 and P3 populations. The cells from the clones AID-/-
IgLeqFP
P2 and P3 possessed
excitation spectra with a reduced background at wavelengths shorter than 550 nm, and at the
same time a new peak that was considerably shifted into the far-red spectrum compared to the
cells expressing eqFP615. This result was consistent with the FACS analysis of these clones

58
(Figure 27), demonstrating that the P2 and P3 clones were excited more efficiently by the red
laser and less efficiently by the blue laser compared to the clone expressing parental eqFP615.
According to the excitation spectra changes, the emission spectra maximums of the P2 and P3
clones were far-red shifted (new emission maximum accounted for approximately 640nm)
(Figure 29B). The shift of the excitation spectrum also explains why it was not possible to
obtain a clear emission spectrum of the P2 and P3 clones at 488 nm excitation (Figure 29A)
as this wavelength is now out of the range of the excitation peak of these cells.
Figure 28. Excitation spectrum scan. Emission fixed at 670 nm.
Therefore, the proteins expressed by the cells of the P2 and P3 clones corresponded to
the suggested optimization B. As they had a considerably reduced fluorescence at 488 nm
excitation and increased fluorescence intensity at 633 nm excitation, it could be possible to
coexpress and analyze them in parallel with many other known RFPs, most of which are
excited efficiently at 488 nm but are not excited by the 633 nm red laser. However, compared
to the AID-/-
IgLeqFP
and AID-/-
IgLeqFP
P1cells, the fluorescence intensity of these dropped, due
to the reduction of the intensity of their excitation peaks maximums.
I.2.d. Analysis of the mutations responsible for the RFP improvement
In order to analyze the nucleotide and amino acid changes of the obtained eqFP
variants, the coding sequence of the eqFP transgene was amplified from the cell extracts
using the primers P4 and P5 annealing at the RSV promoter and the polyA signal of the
pHypermut2 reporter cassette; respectively. The amplicons were digested with NheI and BglII
and cloned back into the pHypermut2 vector. For sequencing the same primer pair P4/P5 was
used for detection of mutations outside of the coding sequence. The sequence analysis
revealed amino acid changes in the coding sequences of all three mutants.
[nm]
Intensity
eqFP615
eqFP P1
eqFP P2
eqFP P3

59
eqFP615
eqFP M1
eqFP M2
eqFP M3
Figure 29. Emission spectra of the AID-/-
cells expressing eqFP615 and its mutants eqFP M1, M2 and
M3. (A). Excitation of the FACS blue laser, 488 nm, was used. Wavelength corresponding to the 576
nm DF is marked in red. (B) Excitation 550 nm was used. (C) Excitation of the FACS red laser, 633
[nm]
A
B
C
Intensity
[nm]
Intensity
Intensity
[nm]
eqFP615
eqFP P1
eqFP P2
eqFP P3

60
nm, was used. Negative values appear due to the subtraction of the values of the background, which
appeared to be higher than intensity of the cells due to the low sensitivity of the spectrophotometer at
these wavelengths.
At first, the sequences of the eqFP mutants amplified from the cell populations α and
β (named Mα and Mβ), sorted from the cells AID-/-
IgLeqFP
A1 and AID-/-
IgLeqFP
B1,
respectively, were analyzed. The alignment of these two sequences to the initial eqFP615
revealed that both Mα and Mβ carried identical nucleotide substitution, C589T which
corresponds to the amino acid change H197Y.
Later the RFP sequences of the obtained subclones AID-/-
IgLeqFP
, AID-/-
IgLeqFP
P1,
AID-/-
IgLeqFP
P2 and AID-/-
IgLeqFP
P3 were analyzed.
Gene M1 amplified from the AID-/-
IgLeqFP
P1 clone contained a nucleotide substitution
C439A which corresponds to the amino acid change L147M.
Genes M2 and M3 from the AID-/-
IgLeqFP
P2 and AID-/-
IgLeqFP
P3 clones shared one
common mutation C589T which corresponds to the amino acid change H197Y (the mutation
of earlier observed Mα and Mβ).
The gene M3 contained an additional mutation G243C which corresponds to the amino
acid substitution K81N (Figure 31).
I.2.e. Confirmation of the new RFP phenotypes
In order to confirm the phenotypes of the eqFP615 variants, the vectors pMuteqFPM1
,
pMuteqFPM2
and pMuteqFPM3
, used for sequencing, were transfected into the AID-/-
cells. Figure
30 demonstrates the FACS analysis of one of the clones (AID-/-
IgLeqFPM2
) compared to the
AIDR1
IgLeqFP
A3 cells. Population P2 of the AIDR1
IgLeqFP
A3 cells and AID-/-
IgL eqFPM2
fall into
the same gate (Figure 30).
Figure 30. FACS analysis of the transfectant after integration of the eqFPM2 to the AID
-/- clone of the
DT40 (right dotplot) compared to the AIDR1
IgLeqFP
A3 cells (left dotplot).

61

62

63
II. Identification and characterization of a cis-acting diversification
activator necessary for the AID mediated hypermutation
Based on the concept of the pHypermut2 described in Section I.1 of the “Results", a
new reporter construct pGFP2 was developed, which was suitable for the analysis of the
activation and regulation of the somatic hypermutation. This reporter construct was used to
perform deletion analysis of the IgL locus, which revealed that a 9.8 kb sequence (DIVAC for
the diversification activator), extending from the IgL transcription start site to the border with
the neighboring downstream carbonic anhydrase gene, is required for the induction and
regulation of hypermutation.
II.1. Construction of a GFP2 - reporter for somatic hypermutation activity
A new vector pGFP2 was designed in order to perform quantification analysis of the
mutational activity. We assumed that the percentage of cells with a decreased or absent
fluorescence (GFPlow
population) reflects the hypermutation activity of any particular DT40
clones. The GFPhigh
population was not included to this estimation because of its low
percentage (“Results”, I.1). The AID dependency of this process indicated that the changes in
the fluorescence are indeed caused by hypermutation rather than silencing of the GFP gene.
This was confirmed in the present study by the semi- quantitative RT-PCR analysis
(“Results”, II.3).
The reporter cassette of the pGFP2 contained the eGFP gene (for the visualization of
the hypermutation) and the blasticidin resistance gene (bsr) (for the selection of the stable
transfectants). In order to avoid the artifacts due to the activity of the β-actin promoter used to
drive in the pHypermut2, these two coding sequences (eGFP and bsr), spaced by an internal
ribosome entry site (IRES), were put under the common RSV promoter and were followed by
the SV40 polyadenylation signal (Figure 32). Such a reporter cassette is referred further as
GFP2. Fragments, including the RSV promoter and the GFP open reading frame were
amplified from pHypermut2; the IRES was amplified from pAidExpressPuro2 [43], and
pLoxBsr, developed earlier in our laboratory, was used for amplifications of the bsr and the
SV40 polyA signal. PCR was performed using the primers described in the Section I.9 of the
“Materials and Methods”.
All the targeting constructs containing the GFP2 reporter cassette were made using
pKS as a backbone. The reporter cassette was designed to be excisable by flanking BamHI
restriction sites (Figure 32) as this strategy simplified cloning of most target arms into the
targeting vectors. All the target arms, except the ones for replacement of the IgL promoter by

64
GFP2, were prepared in the following way. The DT40 genome was screened for the presence
of BamHI or BglII restriction site located at appropriate distance from the IgL locus (Figure
45A). Primers were designed for amplification of ~4 kb fragments containing this restriction
site (extending ~1 kb to the 5‟ and 3 kb to the 3‟ from the BamHI/BglII sites). At the first step
of cloning this 4 kb fragment, containing both targeting arms, was inserted into the multiple
cloning site of pKS. In the second step the GFP2 reporter cassette was cloned into the BamHI
(BglII) site between the 3‟ and 5‟ targeting arms.
Figure 32. A map of the pGFP2. Reporter cassette includes eGFP and blasticidin resistance gene
(bsr) coding sequences, which are spaced by internal ribosome entry site (IRES) and driven by the
common RSV promoter. GFP2 reporter cassette can be excised by the BamHI restriction sites.
All targeting constructs were named according to the position of the insertion toward
IgL locus; the GFP2 reporter cassette was indicated in superscript; upstream and downstream
positions were indicated by “+” and “-“(for example, the name p-15IgLGFP2
denoted insertion
of the GFP2 reporter cassette 15Kb downstream of the IgL locus). In the case of vectors for
insertion into the IgL locus, the targeting arms of the pHypermut2 were used (“Results”,
Section I.1), which allowed cloning of the GFP2 cassette in a way that the final insertion
within the genome would be in the opposite orientation to the IgL gene (Figure 33). This
avoided mutations in the splice donor sequences for GFP transgene (described in the Section
I.1 of the “Results”). Such an orientation of the reporter cassette was maintained for the rest
of the constructs.
Targeted clones were identified by the PCR screening using one primer annealing at
the polyA signal of the GFP2 and another – annealing at a DT40 genome sequence 100-150
bp upstream of the insert (“Materials”, I.9, “Oligonucleotides”). In case of vectors for

65
insertion of the reporter into the IgL locus, the targeted integration to the rearranged allele was
confirmed by PCR, described in the Section I.1.B of the “Results”, using primers VJi1 and
VJi2.
II.2. Identification of a cis-regulatory element for somatic hypermutation
In order to test the hypothesis for the existence of a cis-regulatory element responsible
for the activation and regulation of the hypermutation, a deletion analysis was used.
First it was important to determine the rate at which the GFP2 reporter is normally
mutated within the IgL locus in AID proficient DT40 cells. The targeting construct pIgLGFP
for insertion of the GFP2 reporter into the IgL locus contained the target arms of the
pHypermut2, therefore, the reporter cassette replaced the IgL promoter after targeted
integration (Figure 33).
A
Figure 33. A scheme of the rearranged IgL locus with the deletion of the V locus (ψV-IgL locus),
targeting construct pIgLGFP2
and the locus after targeted integration (ψV-IgL
GFP2).
The resulted transfectants were called V-IgL
GFP2. Two independent primary
transfectants were chosen for subcloning by limited dilution. 14 days after this procedure
twenty four subclones of each transfectant were analysed by FACS. Median values of
decreased green fluorescence for individual subclones from the two independent V-IgL
GFP2 –
transfectants were 5.2% and 7.5% (Figure 36A and 36B). This result confirmed previous data
of this study on pHypermut2, indicating that the GFP transgene is mutated at the same high
rate within the rearranged IgL locus, and that the cell populations with decreased green
fluorescence can be used for quantification of the hypermutation activity.
A fragment extending for 9.8 kb from the IgL transcription start site until the border
with the carbonic anhydrase gene was chosen as a candidate of the sequence containing a cis-
regulatory element for hypermutation. As we planned to perform a deletion of this fragment, a
new recipient cell line with the deletion of the whole IgL locus was generated. This clone of
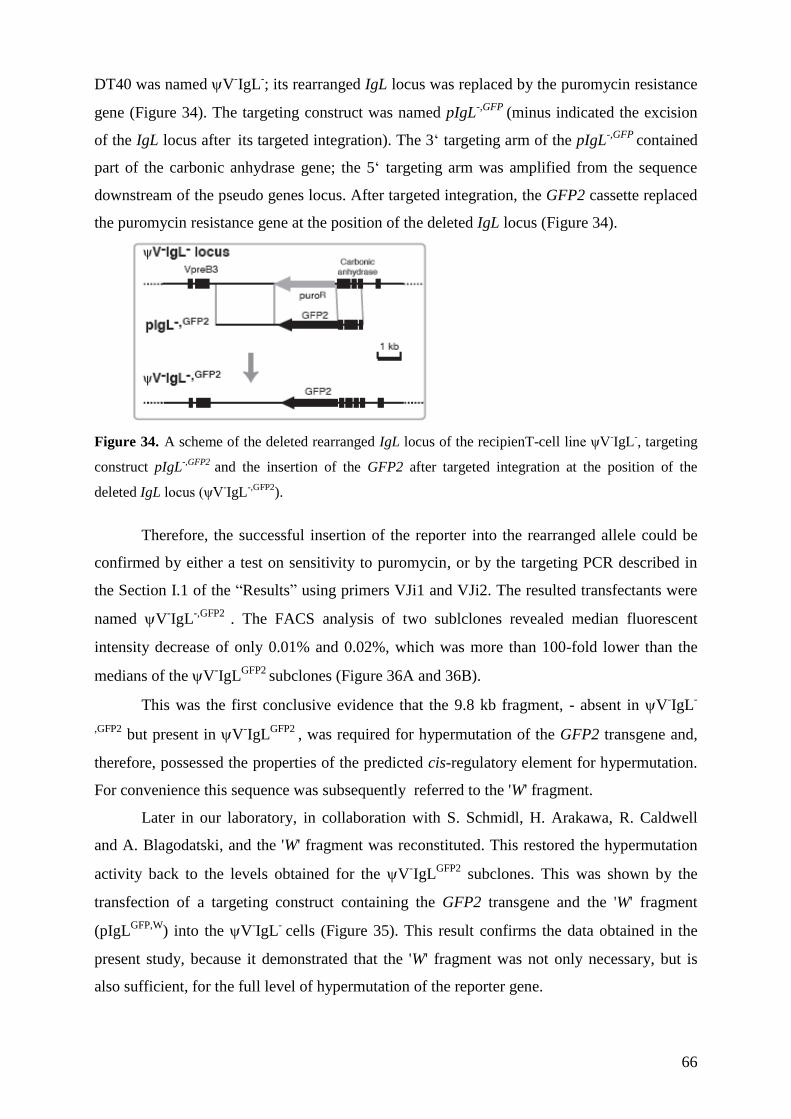
66
DT40 was named V-IgL
-; its rearranged IgL locus was replaced by the puromycin resistance
gene (Figure 34). The targeting construct was named pIgL-,GFP
(minus indicated the excision
of the IgL locus after its targeted integration). The 3’ targeting arm of the pIgL
-,GFP contained
part of the carbonic anhydrase gene; the 5’ targeting arm was amplified from the sequence
downstream of the pseudo genes locus. After targeted integration, the GFP2 cassette replaced
the puromycin resistance gene at the position of the deleted IgL locus (Figure 34).
Figure 34. A scheme of the deleted rearranged IgL locus of the recipienT-cell line ψV-IgL
-, targeting
construct pIgL-,GFP2
and the insertion of the GFP2 after targeted integration at the position of the
deleted IgL locus (ψV-IgL
-,GFP2).
Therefore, the successful insertion of the reporter into the rearranged allele could be
confirmed by either a test on sensitivity to puromycin, or by the targeting PCR described in
the Section I.1 of the “Results” using primers VJi1 and VJi2. The resulted transfectants were
named V-IgL
-,GFP2 . The FACS analysis of two sublclones revealed median fluorescent
intensity decrease of only 0.01% and 0.02%, which was more than 100-fold lower than the
medians of the V-IgL
GFP2 subclones (Figure 36A and 36B).
This was the first conclusive evidence that the 9.8 kb fragment, - absent in V-IgL
-
,GFP2 but present in V
-IgL
GFP2 , was required for hypermutation of the GFP2 transgene and,
therefore, possessed the properties of the predicted cis-regulatory element for hypermutation.
For convenience this sequence was subsequently referred to the 'W' fragment.
Later in our laboratory, in collaboration with S. Schmidl, H. Arakawa, R. Caldwell
and A. Blagodatski, and the 'W' fragment was reconstituted. This restored the hypermutation
activity back to the levels obtained for the V-IgL
GFP2 subclones. This was shown by the
transfection of a targeting construct containing the GFP2 transgene and the 'W' fragment
(pIgLGFP,W
) into the V-IgL
- cells (Figure 35). This result confirms the data obtained in the
present study, because it demonstrated that the 'W' fragment was not only necessary, but is
also sufficient, for the full level of hypermutation of the reporter gene.
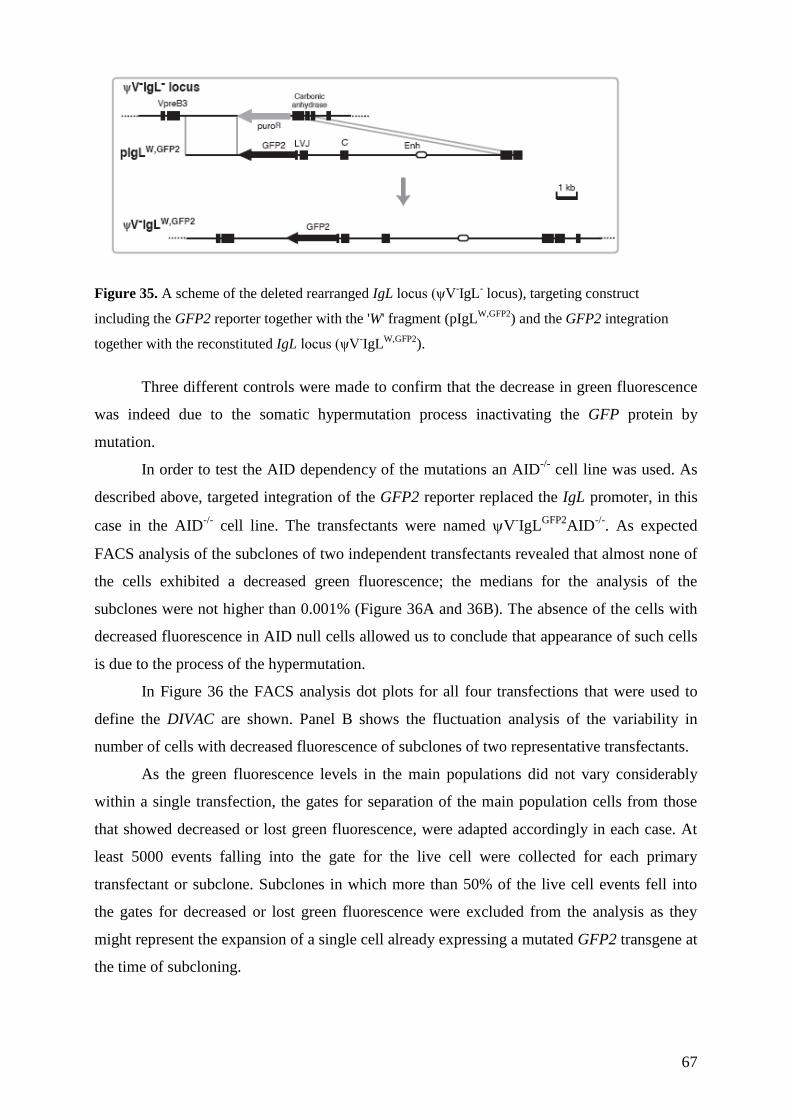
67
Figure 35. A scheme of the deleted rearranged IgL locus (ψV-IgL
- locus), targeting construct
including the GFP2 reporter together with the 'W' fragment (pIgLW,GFP2
) and the GFP2 integration
together with the reconstituted IgL locus (ψV-IgL
W,GFP2).
Three different controls were made to confirm that the decrease in green fluorescence
was indeed due to the somatic hypermutation process inactivating the GFP protein by
mutation.
In order to test the AID dependency of the mutations an AID-/-
cell line was used. As
described above, targeted integration of the GFP2 reporter replaced the IgL promoter, in this
case in the AID-/-
cell line. The transfectants were named V-IgL
GFP2AID
-/-. As expected
FACS analysis of the subclones of two independent transfectants revealed that almost none of
the cells exhibited a decreased green fluorescence; the medians for the analysis of the
subclones were not higher than 0.001% (Figure 36A and 36B). The absence of the cells with
decreased fluorescence in AID null cells allowed us to conclude that appearance of such cells
is due to the process of the hypermutation.
In Figure 36 the FACS analysis dot plots for all four transfections that were used to
define the DIVAC are shown. Panel B shows the fluctuation analysis of the variability in
number of cells with decreased fluorescence of subclones of two representative transfectants.
As the green fluorescence levels in the main populations did not vary considerably
within a single transfection, the gates for separation of the main population cells from those
that showed decreased or lost green fluorescence, were adapted accordingly in each case. At
least 5000 events falling into the gate for the live cell were collected for each primary
transfectant or subclone. Subclones in which more than 50% of the live cell events fell into
the gates for decreased or lost green fluorescence were excluded from the analysis as they
might represent the expansion of a single cell already expressing a mutated GFP2 transgene at
the time of subcloning.

68
A
B
Figure 36. (A) FACS analysis profiles of the primary transfectants. First three dot plots correspond to
the transfections based on the schemes in Figures 33-35, respectively; the last dot plot shows the
analysis of the transfection of the GFP2 to the AID-/-
cell line. (B) Variation of the subclones
corresponding to the transfectants in (A). Each dot represents the analysis of a single subclone and the
median of all subclones from the same primary transfectants is indicated by a bar.
Although the AID dependency seen in Figure 36 was a convincing argument for the
pesence of hypermutation, there was a possibility that some of the cells with decreased
fluorescence appeared due to non-mutational silencing of the GFP gene. In order to
demonstrate that the decrease in fluorescence was indeed caused exclusively by inactivating
AID-mediated mutations due to the hypermutation process, GFP gene expression was
analyzed by semi-quantitative RT-PCR. For this purpose a bright green fluorescence
population (GFPhigh
) and a population with decreased green fluorescence (GFPlow
) were sorted
from the V-IgL
GFP2 cells (Figure 37A). The Ef1 gene was used as a control; its expression
was analyzed in parallel with GFP, amplified from cells of all three populations. RT-PCR
revealed that the cDNA product of both GFP and Ef1 could be visualized by the 25th
cycle

69
of the PCR in the case of all three populations, and after 25th
cycle its quantity increased
proportionally (Figure 37B). This result indicated that the expression levels of the GFP gene
in both GFPhigh
and GFPlow
populations were indeed similar, in spite of a more than 100-fold
difference in the brightness of these populations. This data conclusively confirmed that the
changes in the green fluorescence after insertion of the GFP2 reporter into the IgL locus are
not caused by gene silencing. Therefore, they appear most likely to be mutations within the
GFP coding sequence.
A
Figure 37. (A) FACS sorting
of GFP-high and GFP-low
populations from the V-
IgLGFP2
cells.
(B) Electrophoresis of the
semi-quantitative RT-PCR of
GFP and Ef1 genes from
non-sorted (left raw) and
sorted cells (middle and right
raw).
Sequence analysis was applied to identify and confirm presence of AID-induced
mutations in the reporter gene from the two cell lines: V-IgL
GFP2 and V
-IgL
-,GFP2, which
have the IgL locus present and deleted, respectively. The sequencing was performed on cells
grown for six weeks after subcloning. 250 individual clones of the V-IgL
GFP2 cells
were
analyzed. The sequencing analysis revealed that 224 of them contained GFP with nucleotide
substitutions, which on average had 0.9 mutations per sequence (Figure 38A). For the 273 bp
reading frame of the eGFP gene it could be estimated that 0.9 mutations/723 bp = 1.3 x 10⁻³
mutations per 1 bp. It is known that the doubling time of the DT40 cell line is 10 h. As the
sequencing was performed 6 weeks after subcloning, it means that the sequences analysis was
done after 100 generations. The actual mutation rate in the V-IgL
GFP2 cells can thus be
represented as 1.3x10⁻⁵
mutation per bp per cell generation. Such a mutational rate was
relatively high when compared to that obtained for the Ramos cell line, which mutates its V
B
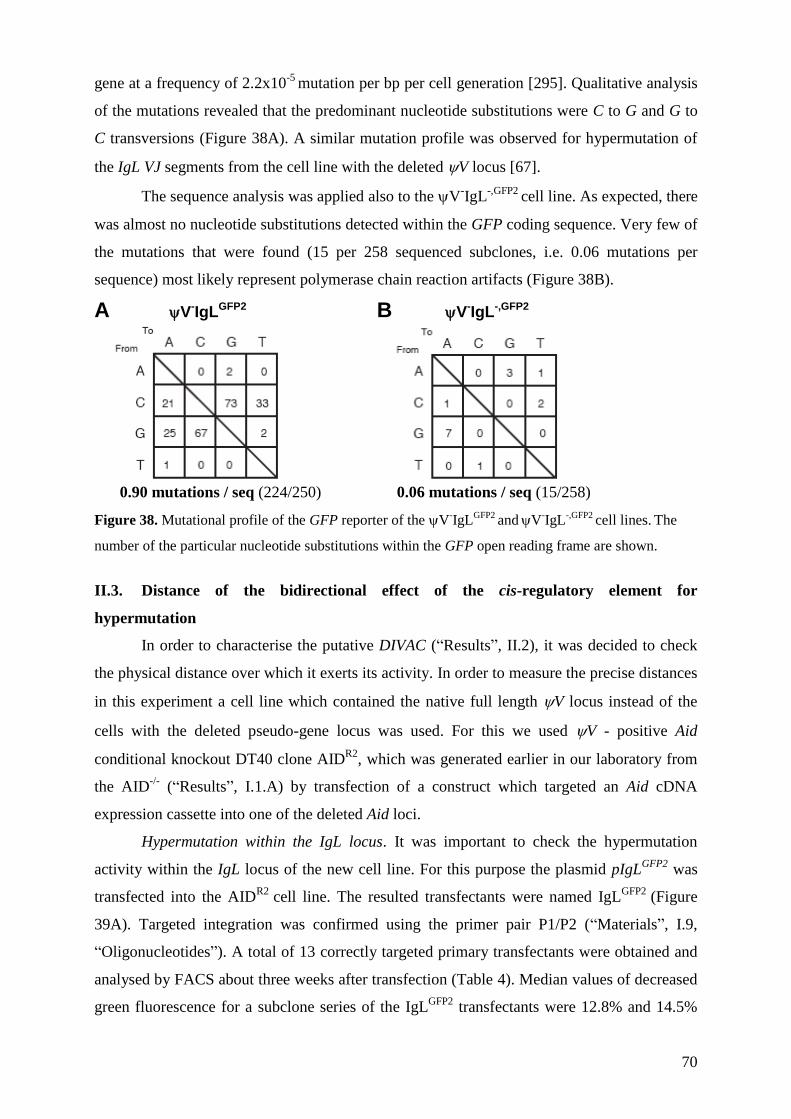
70
gene at a frequency of 2.2x10⁻⁵
mutation per bp per cell generation [295]. Qualitative analysis
of the mutations revealed that the predominant nucleotide substitutions were C to G and G to
C transversions (Figure 38A). A similar mutation profile was observed for hypermutation of
the IgL VJ segments from the cell line with the deleted V locus [67].
The sequence analysis was applied also to the V-IgL
-,GFP2 cell line. As expected, there
was almost no nucleotide substitutions detected within the GFP coding sequence. Very few of
the mutations that were found (15 per 258 sequenced subclones, i.e. 0.06 mutations per
sequence) most likely represent polymerase chain reaction artifacts (Figure 38B).
A V-IgLGFP2 B V-IgL-,GFP2
0.90 mutations / seq (224/250) 0.06 mutations / seq (15/258)
Figure 38. Mutational profile of the GFP reporter of the V-IgL
GFP2 and
V
-IgL
-,GFP2 cell lines.
The
number of the particular nucleotide substitutions within the GFP open reading frame are shown.
II.3. Distance of the bidirectional effect of the cis-regulatory element for
hypermutation
In order to characterise the putative DIVAC (“Results”, II.2), it was decided to check
the physical distance over which it exerts its activity. In order to measure the precise distances
in this experiment a cell line which contained the native full length V locus instead of the
cells with the deleted pseudo-gene locus was used. For this we used V - positive Aid
conditional knockout DT40 clone AIDR2
, which was generated earlier in our laboratory from
the AID-/-
(“Results”, I.1.A) by transfection of a construct which targeted an Aid cDNA
expression cassette into one of the deleted Aid loci.
Hypermutation within the IgL locus. It was important to check the hypermutation
activity within the IgL locus of the new cell line. For this purpose the plasmid pIgLGFP2
was
transfected into the AIDR2
cell line. The resulted transfectants were named IgLGFP2
(Figure
39A). Targeted integration was confirmed using the primer pair P1/P2 (“Materials”, I.9,
“Oligonucleotides”). A total of 13 correctly targeted primary transfectants were obtained and
analysed by FACS about three weeks after transfection (Table 4). Median values of decreased
green fluorescence for a subclone series of the IgLGFP2
transfectants were 12.8% and 14.5%

71
(Figure 45B). The activity of the hypermutation that was previously seen in the presence of
the V genes was only twice that of the V negative transfectants V-IgL
GFP2 (Figure 36). As
a one-fold difference in the green fluorescence decrease is within the experimental variation
due to the different AID expression levels in the AIDR2
and V-AID
R1 precursors, the
conclusion was that the V locus did not contain a cis-regulatory element for hypermutation.
A B
Figure 39. (A) A scheme of the rearranged IgL locus, targeting construct pIgLGFP2
carrying the GFP2
reporter and targeting arms for replacement of the IgL promoter and IgL locus after targeted insertion
of the reporter. (B) FACS analysis of the primary transfectant after integration of the GFP2 reporter to
the IgL locus of the AIDR2
clone.
Hypermutation in the vicinity of the IgL locus. It was important to check if the DIVAC
sequence could activate hypermutation outside the IgL locus, and whether this activity was
bidirectional. To test this, GFP2 was inserted into the neighboring to the IgL locus genes. The
targeting constructs were named according to the distance of the insertion from the
transcriptional start point of the V gene: p+26KbIgLGFP2
for insertion into the VpreB3 gene
and p-15KbIgLGFP2
for insertion into the carbonic anhydrase gene (26 kb upstream and 15 kb
downstream of the V gene respectively) of the AIDR2
clone (Figure 40 and 41).
Targeting the reporter upstream of the putative DIVAC. After targeted integration into
one of the alleles of the carbonic anhydrase gene, the transfectants were named +26KbIgLGFP2
(Figure 40).
FSC
IgLGFP2

72
A B
Figure 40. (A) Targeting strategy of the GFP2 reporter 26 kb upstream of the IgL locus and the (B)
FACS analysis of the primary transfectant +26IgLGFP2
.
Targeting reporter downstream of putative DIVAC. After targeted integration into one
of the alleles of the VpreB3 gene, the transfectants were named -15KbIgLGFP2
(Figure 41).
A B
Figure 41. (A) Targeting strategy of the GFP2 reporter 15 kb downstream of the IgL locus and the
(B) FACS analysis of the primary transfectant -15IgLGFP2
.
After confirmation of the targeted integration, hypermutation activity was measured
as before. FACS analysis of the primary transfectants (Figure 40 and 41, Table 4) and their
subclones (Figure 45B) revealed that the hypermutation activity decreased, but did not
disappear, within these genes when compared to the IgLGFP2
cells. Compared to the IgLGFP2
the medians of the cell number with decreased green fluorescence fell to about 3% at both the
+26 kb and -15 kb positions.
The fact that the hypermutation rate was reduced, but did not disappear when the
reporter was inserted into the flanking genes of the IgL locus, raised the question of how large
-15IgLGFP2
FSC
FSC
+26IgLGFP2
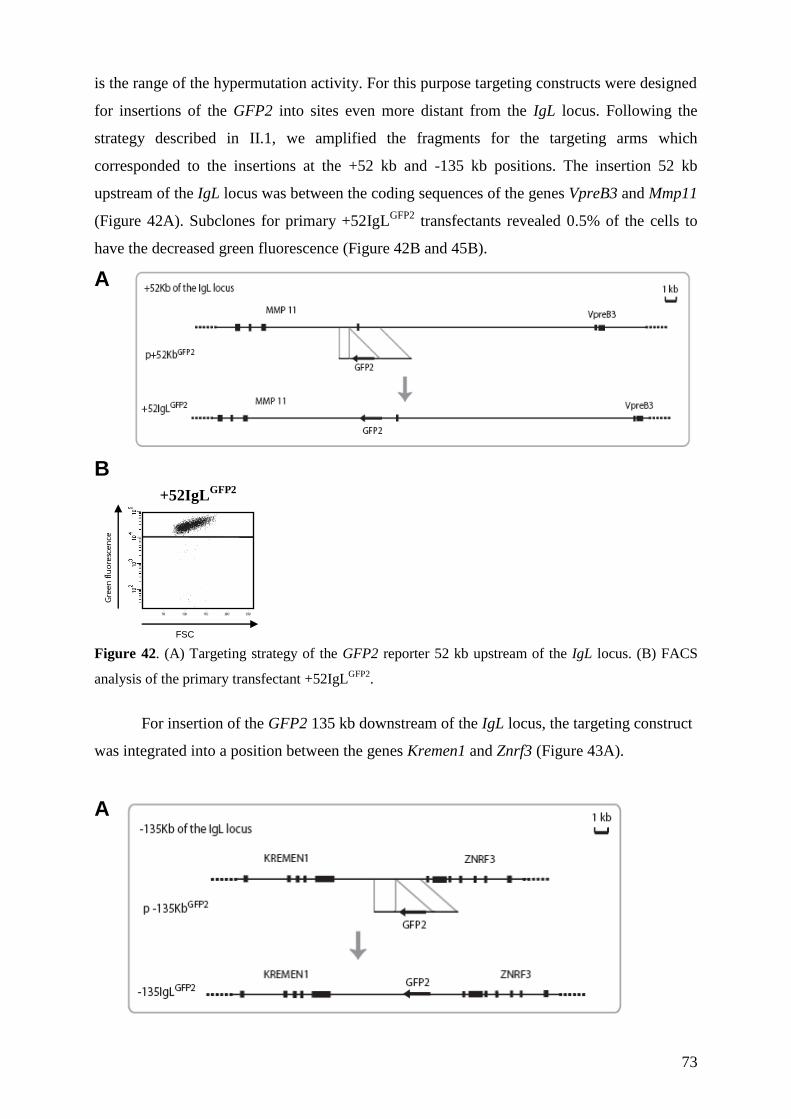
73
is the range of the hypermutation activity. For this purpose targeting constructs were designed
for insertions of the GFP2 into sites even more distant from the IgL locus. Following the
strategy described in II.1, we amplified the fragments for the targeting arms which
corresponded to the insertions at the +52 kb and -135 kb positions. The insertion 52 kb
upstream of the IgL locus was between the coding sequences of the genes VpreB3 and Mmp11
(Figure 42A). Subclones for primary +52IgLGFP2
transfectants revealed 0.5% of the cells to
have the decreased green fluorescence (Figure 42B and 45B).
A
B
Figure 42. (A) Targeting strategy of the GFP2 reporter 52 kb upstream of the IgL locus. (B) FACS
analysis of the primary transfectant +52IgLGFP2
.
For insertion of the GFP2 135 kb downstream of the IgL locus, the targeting construct
was integrated into a position between the genes Kremen1 and Znrf3 (Figure 43A).
A
FSC
+52IgLGFP2

74
B
Figure 43. (A) Targeting strategy of the GFP2 reporter 135 kb downstream of the IgL locus. (B)
FACS analysis of the primary transfectant -135IgLGFP2
.
The medians of the cells possessing decreased green fluorescence for the subclones of
the two transfectants -135IgLGFP2 fell to 0.05% and 0.07% of the total population (Figure 43B
and 45B).
To confirm whether the hypermutation in the vicinity of the IgL locus was still
dependent on AID, the cell line AID-/-
was also used for transfections of the targeting
constructs corresponding to the +52, +26 and –135 kb insertions of the GFP2 reporter (Figure
44, Table 4). As expected, the medians number of cells with decreased green fluorescence for
all three insertions were not higher than 0.001% (Figure 44 and 45B). This result
demonstrated that the hypermutation of the GFP2 reporter in the vicinity of the IgL locus still
had its typical dependency on the functionality of the Aid gene.
Figure 44. FACS analysis profiles of the primary transfectants after integration of the GFP2 reporter
to three different positions on the chromosome 15 of the AID-/-
clone.
The insertions outside of the IgL locus may target either the rearranged or
unrearranged allele of the 15th
chromosome. For each transfection we obtained FACS
measurements for several independent primary clones (Table 4), which allowed us to claim
that obtained results were representative.
+52IgLGFP2
AID-/-
FSC
+26IgLGFP2
AID-/-
-135IgLGFP2
AID-/-
FSC
-135IgLGFP2

75
Table 4. Green fluorescence decrease of individual primary transfectants. GFP2 reporter is integrated
either into the IgL locus (IgLGFP2
) or in the vicinity of the IgL locus (+52IgLGFP2
, +26IgL
GFP2, -
15IgLGFP2
). AID
-/- indicates transfections to the cell line without Aid.
In Figure 45 positions of all five insertions of the GFP2 within the chromosome 15 of
the AIDR2
clone are shown. The subcloning data for all corresponding transfections is
summarized in one graph (Figure 45B).
It is important to emphasize that the decrease of the hypermutation activity in the vicinity
of the IgL locus was not caused by changes in the transcription activity of the GFP gene. For
this purpose transcriptional levels of the GFP and the decrease of the hypermutation activity
were compared for the insertions at different distances from the IgL locus. The GFP
transcription is reflected by the levels of green fluorescence in the major cell population in
FACS profile, which most likely expresses un-mutated GFP. There was only a slight
fluctuation in the transcriptional levels of the major cell populations of the primary
transfectants of different GFP2 insertions (Figure 33-35, 44), which could be explained by a
chromosomal position effect. At the same time, the hypermutation activity levels among these
transfectants varied considerably. A pair of transfectants IgLGFP2
and +52IgL
GFP2 was quite
representative in this respect: the fluorescence level for the major cell populations of these
clones (therefore, transcriptional levels) were almost similar, while the medians of the
florescence decrease varied more than 20-fold. This comparison conclusively demonstrated
that the regulation of hypermutation activity has a distance effect, with a decline in activity
relative to the distance from the IgL locus; this is independent of the changes in the
transcription of the reporter gene.
Cell Line
Number of
cells with
decreased
green
fluorescence
of individual
primary
transfectants,
%
+52IgLGFP2
+26IgLGFP2
IgLGFP2
-15IgLGFP2
-135IgLGFP2
0.50
0.30
0.80
0.20
1.00
0.50
0.30
0.30
0.20
1.20
0.40
0.20
4.40
4.60
4.90
3.70
1.50
11.30
6.80
4.30
6.30
18.90
27.00
40.60
12.60
12.50
8.60
23.90
12.80
13.00
16.90
7.40
21.10
14.90
2.50
2.30
3.40
0.40
2.30
2.60
0.03
0.01
0.14
0.02
0.12
0.08
0.02
0.10
0.10
0.00
0.08
0.10
+52IgLGFP2
AID-/-
+26IgL
GFP2
AID-/-
-135IgL
GFP2
AID-/-
0.06
0.015
0.000
0.018
0.016
0.000
0.03
0.000
0.000
0.000
0.000
0.03
0.000

76
A
B
Figure 45. (A) Positions of the GFP2 insertions on chromosome 15 at different distances from the IgL
locus. (B) Fluctuation analysis of the subclones. The names of the respective transfections are
indicated below the graph.

77
DISCUSSION
The main goals of the present study were: 1) to develop an improved artificial protein
evolution system and to validate it by the analysis of new GFP phenotypes, 2) to apply the
new system to the optimization of the red fluorescent protein; 3) to find and characterize a cis-
DNA-element responsible for activation and regulation of the somatic hypermutation within
the IgL locus of the DT40 cell line.
I. Application of the somatic hypermutation for artificial protein
evolution
The generation of the new vector pHypermut2 described in the present study allows in
vivo diversification of transgenes inserted into the IgL locus of the DT40 cell line. This
reaction is specific and efficient and results in an artificial evolution system that improves
upon that created earlier in our laboratory (“Introduction”, VII.2).
The use of the pHypermut2 in conjunction with a clone of the DT40 cell line with
deleted pseudo-genes and Aid-conditional knockout results in a high ratio of targeted
integration. The new system allowed standardization of the artificial protein evolution process
(Figure 46). The evolution of a selected protein in this system includes the following steps: 1)
cloning of the gene template to be modified by artificial evolution into the pHypermut2 vector
followed by transfection of the final construct into the ψV-AID
R1 cell line; 2) target screening
PCR for the identification of the clones with transgene inserted into the IgL locus; 3) selection
and expansion of the cells expressing the protein with the desired new properties introduced
by hypermutation (expansion can be repeated until the final mutant has acquired the desired
properties); 4) isolation of the clonal cell population expressing this mutant, followed by
switching off further hypermutation by excision of the AID-expression cassette; 5)
subcloning, PCR - amplification of the transgene and cloning of it back to the pHypermut2
vector; 6) after analysis of the mutations responsible for the optimization of the protein, the
new phenotype can be confirmed by insertion of the mutant sequence into the IgL locus of
DT40 cells lacking AID.
Using pHypermut2 we created and analyzed the phenotypes of a range of new eGFP
variants of enhanced brightness. Alignment of the gene sequences found in those mutants
with AID-induced substitutions observed in previous studies revealed that several of the
amino acid changes in the GFP structure increasing fluorescence have already been reported
(discussed below). The fact that some of the found amino acid changes were previously
reported for GFP mutants validated the strategy of artificial evolution, and gave hints of the

78
process by which GFP variants developed in the present study were improved. Combination
of the nucleotide substitutions observed in different enhanced fluorescence-variants into a
single sequence by site-directed mutagenesis allowed the production of GFP proteins with an
even stronger increase in brightness.
Figure 46. Artificial protein evolution in the DT40 cell line.
Amino acid changes found in the enhanced GFP clones v6, v5, v8, v2 and v9
(“Results”, Figure 17 and Table 3) are candidates for the substitutions responsible for the
observed improvement in GFP brightness. These amino acids did not locate close to each
other, and were dispersed through the protein (Figure 47). The V163A change, which plays a
pivotal role in folding of the GFP protein [296], was previously seen in the GFP variants
transgene within the pHypermut2
transfection to AID
R1 and target
screening
selection of the better mutant phenotypes
and cell expansion
subcloning and
AID excision
PCR-amplification of
the mutated transgene mutant transgene within the pHypermut2
sequencing and retransfection – confirmation of the new
phenotype

79
Cycle3 [297], T-Sapphire [298], Venus [299, 300], eCFP and W1C [278]. The Y145F change
responsible for the increase of the protein brightness [301] was reported in GFP variants of
Sapphire [292], p4-3 [278, 301] and eBFP [277, 278]. The V163A substitution is suggested to
support correct protein folding of GFP, most likely increasing the yield of a properly matured
protein.
Figure 47. Amino acids involved in increase of the brightness of eGFP variants. The positions of
amino acids (in yellow), which are identified in the brighter GFP variants (GFPv6, v5, v8, v2 and v9)
are mapped on the crystal structure of GFP. Chromophore is highlighted in red. Made using Swiss
PDB Viewer program in collaboration with H. Kudo.
The other amino acid changes associated with improvement in the properties of GFP
are newly identified in this study. Because amino acids A206 and L221 can play a role in
dimerization of GFP, A206T and L221V may act to stabilize the GFP dimer, leading to higher
fluorescence intensity. The Q80E change did not contribute to GFP brightness although
interestingly, this mutation was shared among all the GFP variants. This apparently neutral
mutation might be selected for as the result of a high frequency of hypermutation at this site,
because this amino acid may be located in the hotspot motif of the hypermutation.
The combination of the Y145F, V163A and S202T amino acid changes into a single
peptide further increased GFP brightness, generating the “GFPnovo1” variant. The addition of
the L221V mutation to GFPnovo1 resulted in the slightly brighter GFPnovo2 variant (Figure
6 and 7). The novo1/2 GFP variants might have advantageous applications in imaging

80
biology. The GFPnovo1 might be also recommended for constructing fusion protein reporters
because this variant is probably less likely to dimerize due to the lack of the L221V mutation.
In the process of generating chimeric GFP molecules, their brightness could not be
predicted simply as the additive or multiplicative effects of individual amino acid changes.
Some of the individual amino acid changes observed may have the same effect on protein
structure and, therefore, may not show any synergy. As seen in GFPv13, some of the amino
acid changes might in fact interfere with each other and thus, decrease overall brightness
(Figure 16 and 17, Table 3).
Although the crystal structure of GFP is determined [302], the role of all individual
amino acid substitutions in the increase of the fluorescence of variant GFP proteins is not
clear. As the residues of the changed amino acids are not predicted to locate in the direct
proximity of the chromophore, the most likely reason for the increase of the brightness is
enhanced protein maturation, improved folding or stability.
Compared to other techniques of protein mutagenesis (“Intorduction”, VII), the
creation of an artificial evolution system in hypermutating DT40 cell line has an important
advantage. The selection of the optimized phenotypes takes place from an almost infinite pool
of mutant proteins within living vertebrate cells. This is extremely important as the folding
and properties of many proteins are affected by intra-cellular parameters such as pH and salt
concentration, post-translational modifications and interactions with other proteins that are
not presented in in vitro systems. In conventional ex-vivo systems protein degradation after
the expression of the in vitro developed mutants may be encountered. Moreover, the proteins
encoded by such mutants may prove to be toxic to cells. These issues are automatically
avoided in the in vivo DT40 system created in the present study. Although optimization of
proteins has been previously reported in hypermutating mammalian B-cell lines such as
Ramos [285] or 18–81 [279], DT40 offers considerable advantages, such as insertion of only
a single copy of the transgene into the IgL locus, specific and efficient mutation of the
transgene and the possibility to stop mutation via the inducible deletion of the AID
expression. Diversification of a target protein in DT40 may even be facilitated by a
combination of hypermutation and gene conversion if homologous conversion donor
sequences are inserted upstream of the transgene. Recently it was demonstrated that gene
conversion on its own can be a useful strategy for the diversification of transgenes [292].
As the artificial evolution system is based on IgL hypermutation, the mutations are
supposed to be restricted to the 1 kb region at the 5‟ end of the transcribed sequence.
Therefore, this system is more suitable for the evolution of small gene targets within 1 kb.

81
Different rates of hypermutation may be suitable for different artificial evolution
goals. Hypermutation at a very low frequency cannot diversify the transgene efficiently, and
may make it difficult to achieve the desired variants in a limited time period. On the other
hand, hypermutation at too high frequency may mask or even remove a desired mutation after
its generation unless AID is switched off. The hypermutation rate of our AIDR1
IgLeGFP
cell
line fell into the appropriate range to achieve efficient and speedy in situ engineering of the
eGFP transgene. When targeted to the IgL locus of the ψV-AID
R1 cell line, the GFP transgene
is mutated at a rate 4.7x10⁻⁶
mutations per bp per cell generation within the pHypermut2
cassette [303] and 1.3x10⁻⁵
mutations/bp/generation within the pGFP2 cassette. This mutation
frequency is slightly lower than the mutation rate observed for the rearranged VJ segment in
the pseudo-gene deleted ψV-AID
R cell line, which showed 2.2x10
-5 mutations/bp/generation
[67]. This reduction could be a reflection of a difference in promoter strength, transcriptional
orientation, and lower numbers of hypermutation hotspots within the eGFP sequence in
comparison with the V gene. In general, the mutation rate in our system has a similar mutating
rate compared to that seen in the mammalian cell line Ramos used for the alternative artificial
protein evolution (average rate 2.2x10⁻⁵
mutations/bp/generation [295]). If needed, a higher
frequency of hypermutation may be achieved in our system by creating stronger over-
expression of AID, the additional use of an UNG knockout [172] or histone deacetylase
inhibitors treatment [253, 290] (corresponding effects are described in “Introduction”, V.2.a
and VI.3, respectively).
The artificial evolution system might be applied to optimization of any coding or non-
coding sequences whose phenotype can be screened in DT40 cells, including enzymes,
pharmaceutical drugs, cis-regulatory elements, sensors etc. As FACS analysis is convenient
for the screening for the new variant phenotypes, fluorescent proteins are ideal objects for the
artificial evolution.
Therefore, the created system of artificial protein evolution was applied for the
optimization of the red fluorescent protein eqFP615 derived from the sea anemone Entacmaea
quadricolor. The different screening strategies led to the generation of variants with increased
brightness and a red-shift of the emission spectrum. In total, three new mutations were
selected for study, that alone or in combination, lead to changes to the starting protein
phenotype. Compared to the initial eqFP615 template, the variant eqFP_M1 possessed a 2.5-
fold higher fluorescent brightness, whilst the other two variants, eqFP_M2 and eqFP_M3, had
the emission peak shifted approximately 25 nm into the far-red spectrum (Figure 29B).
Sequence analysis of each of these improved variants of wild type eqFP578, combined with
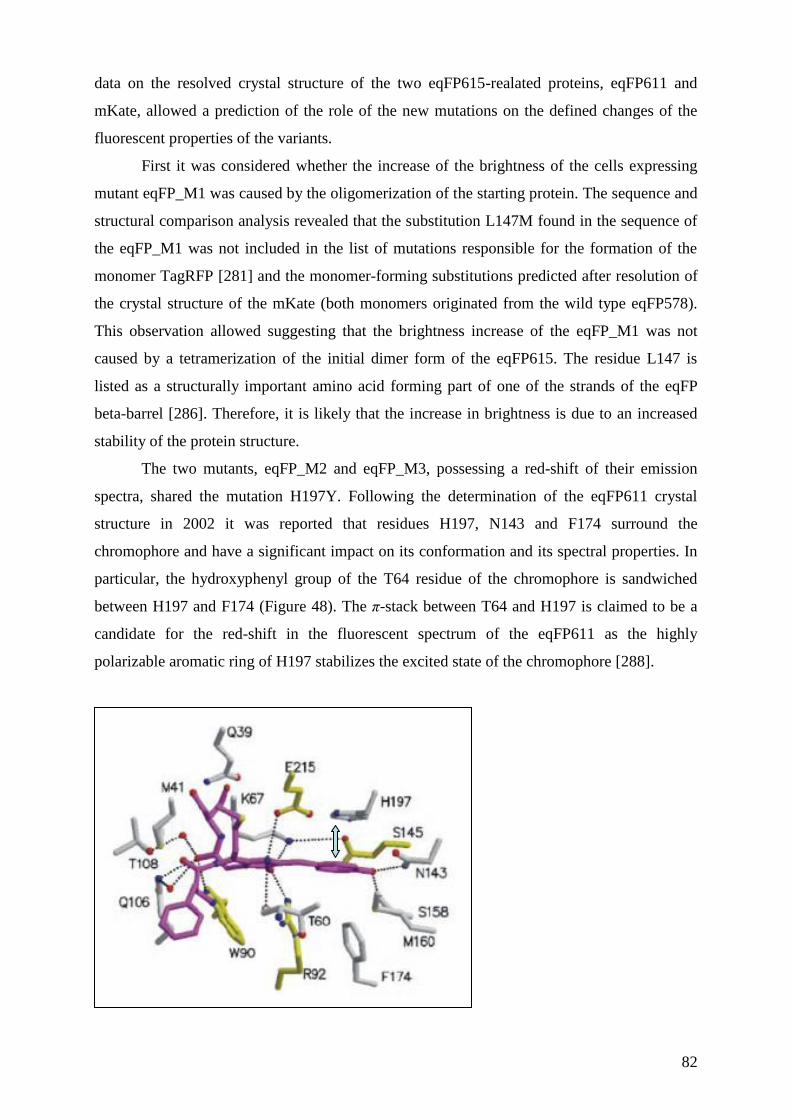
82
data on the resolved crystal structure of the two eqFP615-realated proteins, eqFP611 and
mKate, allowed a prediction of the role of the new mutations on the defined changes of the
fluorescent properties of the variants.
First it was considered whether the increase of the brightness of the cells expressing
mutant eqFP_M1 was caused by the oligomerization of the starting protein. The sequence and
structural comparison analysis revealed that the substitution L147M found in the sequence of
the eqFP_M1 was not included in the list of mutations responsible for the formation of the
monomer TagRFP [281] and the monomer-forming substitutions predicted after resolution of
the crystal structure of the mKate (both monomers originated from the wild type eqFP578).
This observation allowed suggesting that the brightness increase of the eqFP_M1 was not
caused by a tetramerization of the initial dimer form of the eqFP615. The residue L147 is
listed as a structurally important amino acid forming part of one of the strands of the eqFP
beta-barrel [286]. Therefore, it is likely that the increase in brightness is due to an increased
stability of the protein structure.
The two mutants, eqFP_M2 and eqFP_M3, possessing a red-shift of their emission
spectra, shared the mutation H197Y. Following the determination of the eqFP611 crystal
structure in 2002 it was reported that residues H197, N143 and F174 surround the
chromophore and have a significant impact on its conformation and its spectral properties. In
particular, the hydroxyphenyl group of the T64 residue of the chromophore is sandwiched
between H197 and F174 (Figure 48). The π-stack between T64 and H197 is claimed to be a
candidate for the red-shift in the fluorescent spectrum of the eqFP611 as the highly
polarizable aromatic ring of H197 stabilizes the excited state of the chromophore [288].

83
Figure 48. Residues surrounding the chromophore of the eqFP611. The hydroxyphenyl group of the
chromophore-forming Y64 is sandwiched between H197 and F174. Stacking of the hydroxyphenil
group of the Y64 and heterocycle ring of the H197 is shown by blue arrow. Taken from [288].
Later in 2008, the report of the analysis of the mKate crystal structure [289] revealed
that the red-shift of its fluorescent spectrum is due to substitutions at three key residues; all of
which were identified in the eqFP611 crystal structure analysis: H197, N143 and F174.
Sequence alignment with mKate revealed that eqFP615 initially had two of these key “far-
red-shifting” substitutions, N143S and F174L (Figure 19). The third substitution, crucial for
the red shift in case of the mutants eqFP_M2 and eqFP_M3, was at the residue H197, but in
contrast to Kate which has changed histidine to arginine (H197R), eqFP_M2 and M3 had it
changed to the tyrosine (H197Y).
It is known that the electron density of the phenyl ring of tyrosine is higher than that of
the two-nitrogen heterocycle of the histidine. Therefore, it is possible to speculate that in the
eqFP_M2 and eqFP_M3 proteins, having H197 substituted by Tyrosine, the stacking with the
chromophore is more powerful which leads to the stronger stabilization of the excited state of
the chromophore.
The residue R197 of mKate is also noted in the list of amino acids forming the
backbone of the pore of the β-barrel that is suggested to be essential for maturating of the
chromophore by providing access for molecular oxygen [289, 304]. We cannot exclude the
possibility that the spectrum of the mutants eqFP_M2 and eqFP_M3 is red-shifted due to the
influence of the H197Y substitution on the improvement of this mechanism.
Compared to eqFP_M2, the eqFP_M3 mutant contained an additional substitution
K81N. As this mutant possessed a slightly greater red shift in emission than that of eqFP_M2,
it is possible that the mutation K81N was responsible. The residue K81 is located in the
alpha-helix mentioned as one of the structurally important regions of the β-barrel of the wild
type eqFP578 [286]. Therefore, the additional red shift of the eqFP_M3 spectrum may be
caused by an additional stabilization of the protein structure due to the K81N substitution.
The generation of the optimized variants of eqFP615 validated our artificial evolution
system. The analyzed mutations demonstrated two new phenotypes, both of which are
relevant improvements for imaging biology. The variant with increased brightness is
advantageous for bio-imaging in living cells, while the far-red shifted variants are of high
value for methods based on FRET and imaging in living tissues due to penetration of red light
into tissues. The mutants developed in this study are not superior to the best proteins currently
available on the market, such as Katushka and others, as none of the single mutations could

84
satisfy all of the spectral requirements necessary to compete with the commercial products.
For example the emission peak of the bright eqFP_M1 is not shifted as far as that of
Katushka; mutants eqFP_M2 and eqFP_M3, having emission maximum further than of
Katushka, are not sufficiently bright.
The developed mutants may be further improved using different approaches. Firstly, it
is reasonable to combine the single mutations, responsible for different changes in phenotype,
into one common sequence as shown for GFP above. Secondly, it should be possible to
further improve the phenotype of the obtained variants by additional FACS sorts. For
example, the detection of the shift of emission analyzed with a 660 nm detection filter would
be possible until the emission maximum would reach 660 nm (after that we would detect the
decrease of the fluorescent intensity (Figure 20)). This could be solved by switching to the
more far-red detection filter.
II. Identification of a cis-acting diversification activator both necessary
and sufficient for the AID mediated hypermutation
The idea of the artificial evolution system was based on the observation that a
transgene inserted into the chicken IgL locus undergoes hypermutation at a high rate. Based
on the idea of the pHypermut2 a new vector, pGFP2, was generated. Using this reporter gene
construct a deletion analysis of the IgL locus was performed. This allowed identification of a
cis-regulatory element responsible for activation of the somatic hypermutation. This cis-
acting diversification activator (DIVAC), extending for 9.8 kb from the IgL transcription start
site towards the next downstream gene, carbonic anhydrase, activated the hypermutation more
than 100-fold above the background level.
As somatic hypermutation is commonly used to diversify Ig in most vertebrates
species (“Introduction”, I), DIVAC may be conserved during the evolution of vertebrates.
Consistent with this hypothesis, it was reported that the hypermutation in mice is recruited
and controlled by the sequences included into and surrounding sequences of the Ig enhancers
[71, 72, 305, 306]. The functional characteristics of these mammalian regions appear to be
similar to chicken DIVAC sequence obtained in the present study. The difficulty to find an
exact sequence match between the sequences of chicken and murine cis-regulatory element
can be explained by large size of the murine Ig loci compared to that of the chicken Ig loci
and the assumption that these diversification activators seem to be composed of multiple
interacting regions.
As the rearranged IgL locus of the B-lymphocytes is constitutively diversified by gene

85
conversion in the bursa Fabricius [107] and DT40 [122] using V genes, DIVAC may also
activate gene conversion. This is supported by a recent publication showing that a deletion of
the rearranged IgL locus downstream of the C region stopped IgL gene diversification in V
positive DT40 [46].
The experiments on insertion of the pGFP2 reporter upstream and downstream of the
IgL locus revealed that the reporter transgene was subjected to AID-dependent hypermutation
outside the normal boundaries of the IgL locus, with the degree of the decrease in the
mutation activity proportional to the distance from the IgL locus. This result allowed us to
characterize the DIVAC as an element with a bidirectional action with a wide range of
activity. The assumption that this effect also affects the endogenous IgL locus requires
additional experiments, including sequence analysis of the endogenous genes present
alongside the insertions.
Sequence analysis of the region neighboring the IgL locus genes was performed
recently by S. Fugmann‟s group [222]. They used a different experiment system and their
results partially contradict the data obtained in the present study. Based on the sequence
analysis, the researches claim that sequences flanking the IgL locus genes, namely the VpreB3
and carbonic anhydrase, do not undergo hypermutation in DT40. In the case of carbonic
anhydrase the lack of hypermutation is completely expected, as this gene is not transcribed in
this cell line [222]. As hypermutation is tied to transcription, after insertion of the GFP2
cassette with its own promoter, thus transcribed, into this gene, we could observe the
hypermutation. In contrast to carbonic anhydrase, the VpreB3 gene is transcribed in DT40
[222]. Sequence analysis in Fugmann‟s study revealed only a single A to G point mutation in
a total of 84 sequences of VpreB3, while in the present study the GFP2 reporter inserted into
the VpreB3 undergoes hypermutation although the medians of the green fluorescent decrease
dropped to 3.1% and 2.7% compared to the hypermutation within the IgL locus (12.8% and
14.5%). The explanation for these contradictory results can be found in the difference of the
experimental approaches. One possible reason is using of the transgene instead of the
endogenous VpreB3. In this case different promoter and transcription orientation of the
reporter, presence of the SHM hotspots within the GFP, epigenetic changes after integration
might separately or together allow the hypermutation of the transgene. Also S. Fugmann‟s
group tested too low number of the gene sequences that together with possible sequencing
artifacts, was probably not enough sensitive method to detect the decreased hypermutation,
whilst FACS analysis used in the present study allowed testing the green fluorescent decrease

86
in 104 of cells for each transfection that significantly increased chances to detect the
mutations.
The ability of the GFP2 reporter to undergo hypermutation when inserted into
different positions on chromosome 15 of the chicken genome may be interpreted as an
indication of the ability of AID to act outside the IgL locus. This correlates with the recent
observation of D. Schatz‟s group showing a broad action of the murine AID on the genome
[70]. This result suggested that, while this enzyme deaminates uracils of transcribed genes
throughout the genome, it is not the targeting of AID itself but targeting of the error-prone
DNA repair which makes hypermutation specific for the IgL locus.
As switch recombination is accompanied by hypermutation of the switch regions [307]
and chicken IgL DIVAC can activate hypermutation in both directions over large distances,
we can speculate that a single DIVAC may regulate both somatic hypermutation and class
switch recombination in the heavy chain loci.
One of the hints to the mechanism of DIVAC action, which in general remains unclear,
is the fact that it not only contains the IgL transcriptional enhancer but also functions in the
manner characteristic for typical enhancers, i.e. acting in both directions and over large
distances. Concerning the enhancer function of DIVAC, and the dependency of the somatic
hypermutation on transcription [62, 63, 307], one can assume that this cis-regulatory element
plays a role in regulation of the B-cell specificity of SHM [308] and the targeting of this
process to the Ig loci [39, 50-52] via involvement with the protein transcription factory [309].
In respect of the targeting of the hypermutation to the IgL locus, the hypothesis for DIVAC
functioning would assume that this element contains DNA motifs essential for the binding of
cofactors of the transcription machinery and for proteins of the error-prone DNA-repair
pathway.
Therefore the present study allowed identification of the cis-regulatory element
necessary for the activation of the hypermutation targeted to the IgL locus and also provided a
hint to the mechanism of the action of this element.

87
REFERENCES
1. Medzhitov, R. and C. Janeway, Jr., Innate immune recognition: mechanisms and
pathways. Immunol Rev, 2000. 173: p. 89-97.
2. Medzhitov, R. and C.A. Janeway, Jr., An ancient system of host defense. Curr Opin
Immunol, 1998. 10(1): p. 12-5.
3. Janeway, C.A., Jr., How the immune system protects the host from infection. Microbes
Infect, 2001. 3(13): p. 1167-71.
4. Hozumi, N. and S. Tonegawa, Evidence for somatic rearrangement of
immunoglobulin genes coding for variable and constant regions. Proc Natl Acad Sci
U S A, 1976. 73(10): p. 3628-32.
5. Tonegawa, S., Somatic generation of antibody diversity. Nature, 1983. 302(5909): p.
575-81.
6. Papavasiliou, F., et al., V(D)J recombination in mature B-cells: a mechanism for
altering antibody responses. Science, 1997. 278(5336): p. 298-301.
7. Longerich, S., et al., Brca1 in immunoglobulin gene conversion and somatic
hypermutation. DNA Repair (Amst), 2008. 7(2): p. 253-66.
8. Schatz, D.G., M.A. Oettinger, and D. Baltimore, The V(D)J recombination activating
gene, RAG-1. Cell, 1989. 59(6): p. 1035-48.
9. Oettinger, M.A., et al., RAG-1 and RAG-2, adjacent genes that synergistically activate
V(D)J recombination. Science, 1990. 248(4962): p. 1517-23.
10. Cannon, J.P., R.N. Haire, and G.W. Litman, Identification of diversified genes that
contain immunoglobulin-like variable regions in a protochordate. Nat Immunol, 2002.
3(12): p. 1200-7.
11. Rast, J.P. and G.W. Litman, Towards understanding the evolutionary origins and
early diversification of rearranging antigen receptors. Immunol Rev, 1998. 166: p.
79-86.
12. Agrawal, A., Q.M. Eastman, and D.G. Schatz, Transposition mediated by RAG1 and
RAG2 and its implications for the evolution of the immune system. Nature, 1998.
394(6695): p. 744-51.
13. Hiom, K., M. Melek, and M. Gellert, DNA transposition by the RAG1 and RAG2
proteins: a possible source of oncogenic translocations. Cell, 1998. 94(4): p. 463-70.
14. Fugmann, S.D., et al., An ancient evolutionary origin of the Rag1/2 gene locus. Proc
Natl Acad Sci U S A, 2006. 103(10): p. 3728-33.
15. Eason, D.D., et al., Mechanisms of antigen receptor evolution. Semin Immunol, 2004.
16(4): p. 215-26.
16. Cannon, J.P., et al., The phylogenetic origins of the antigen-binding receptors and
somatic diversification mechanisms. Immunol Rev, 2004. 200: p. 12-22.
17. Litman, G.W., M.K. Anderson, and J.P. Rast, Evolution of antigen binding receptors.
Annu Rev Immunol, 1999. 17: p. 109-47.
18. Schatz, D.G., Antigen receptor genes and the evolution of a recombinase. Semin
Immunol, 2004. 16(4): p. 245-56.
19. Pancer, Z., et al., Somatic diversification of variable lymphocyte receptors in the
agnathan sea lamprey. Nature, 2004. 430(6996): p. 174-80.
20. Pancer, Z. and M.D. Cooper, The evolution of adaptive immunity. Annu Rev Immunol,
2006. 24: p. 497-518.
21. Greenberg, A.S., et al., A new antigen receptor gene family that undergoes
rearrangement and extensive somatic diversification in sharks. Nature, 1995.
374(6518): p. 168-73.
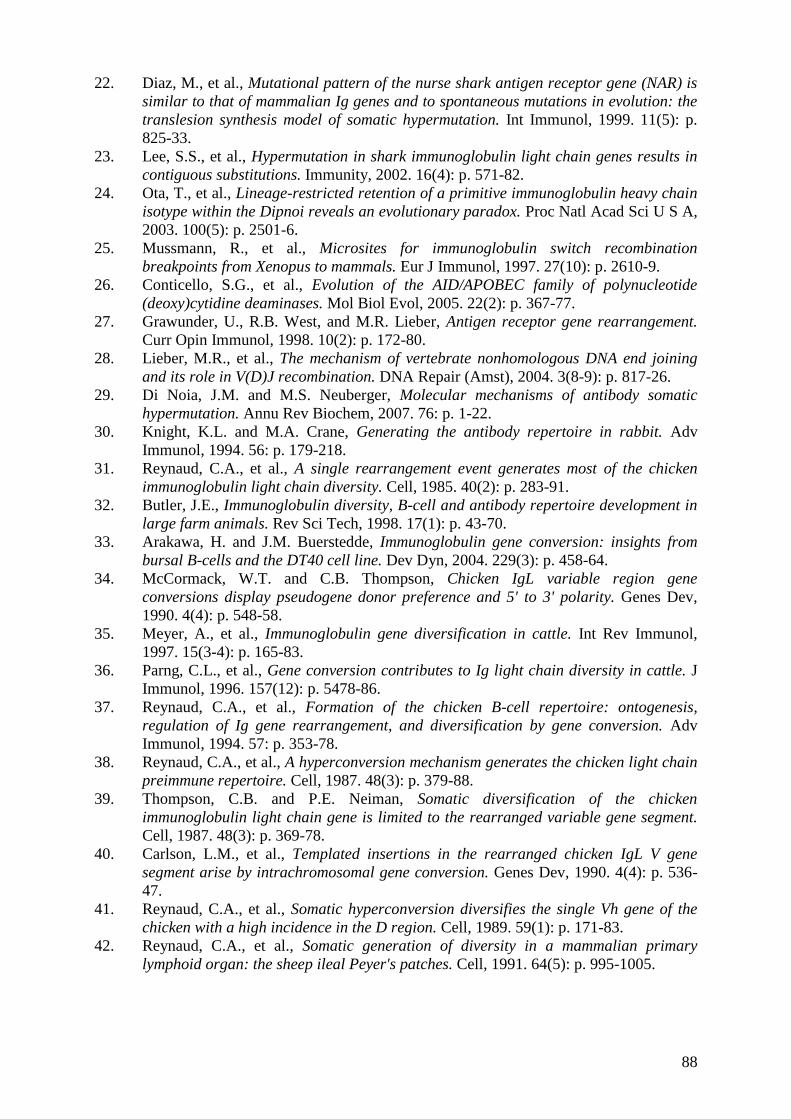
88
22. Diaz, M., et al., Mutational pattern of the nurse shark antigen receptor gene (NAR) is
similar to that of mammalian Ig genes and to spontaneous mutations in evolution: the
translesion synthesis model of somatic hypermutation. Int Immunol, 1999. 11(5): p.
825-33.
23. Lee, S.S., et al., Hypermutation in shark immunoglobulin light chain genes results in
contiguous substitutions. Immunity, 2002. 16(4): p. 571-82.
24. Ota, T., et al., Lineage-restricted retention of a primitive immunoglobulin heavy chain
isotype within the Dipnoi reveals an evolutionary paradox. Proc Natl Acad Sci U S A,
2003. 100(5): p. 2501-6.
25. Mussmann, R., et al., Microsites for immunoglobulin switch recombination
breakpoints from Xenopus to mammals. Eur J Immunol, 1997. 27(10): p. 2610-9.
26. Conticello, S.G., et al., Evolution of the AID/APOBEC family of polynucleotide
(deoxy)cytidine deaminases. Mol Biol Evol, 2005. 22(2): p. 367-77.
27. Grawunder, U., R.B. West, and M.R. Lieber, Antigen receptor gene rearrangement.
Curr Opin Immunol, 1998. 10(2): p. 172-80.
28. Lieber, M.R., et al., The mechanism of vertebrate nonhomologous DNA end joining
and its role in V(D)J recombination. DNA Repair (Amst), 2004. 3(8-9): p. 817-26.
29. Di Noia, J.M. and M.S. Neuberger, Molecular mechanisms of antibody somatic
hypermutation. Annu Rev Biochem, 2007. 76: p. 1-22.
30. Knight, K.L. and M.A. Crane, Generating the antibody repertoire in rabbit. Adv
Immunol, 1994. 56: p. 179-218.
31. Reynaud, C.A., et al., A single rearrangement event generates most of the chicken
immunoglobulin light chain diversity. Cell, 1985. 40(2): p. 283-91.
32. Butler, J.E., Immunoglobulin diversity, B-cell and antibody repertoire development in
large farm animals. Rev Sci Tech, 1998. 17(1): p. 43-70.
33. Arakawa, H. and J.M. Buerstedde, Immunoglobulin gene conversion: insights from
bursal B-cells and the DT40 cell line. Dev Dyn, 2004. 229(3): p. 458-64.
34. McCormack, W.T. and C.B. Thompson, Chicken IgL variable region gene
conversions display pseudogene donor preference and 5' to 3' polarity. Genes Dev,
1990. 4(4): p. 548-58.
35. Meyer, A., et al., Immunoglobulin gene diversification in cattle. Int Rev Immunol,
1997. 15(3-4): p. 165-83.
36. Parng, C.L., et al., Gene conversion contributes to Ig light chain diversity in cattle. J
Immunol, 1996. 157(12): p. 5478-86.
37. Reynaud, C.A., et al., Formation of the chicken B-cell repertoire: ontogenesis,
regulation of Ig gene rearrangement, and diversification by gene conversion. Adv
Immunol, 1994. 57: p. 353-78.
38. Reynaud, C.A., et al., A hyperconversion mechanism generates the chicken light chain
preimmune repertoire. Cell, 1987. 48(3): p. 379-88.
39. Thompson, C.B. and P.E. Neiman, Somatic diversification of the chicken
immunoglobulin light chain gene is limited to the rearranged variable gene segment.
Cell, 1987. 48(3): p. 369-78.
40. Carlson, L.M., et al., Templated insertions in the rearranged chicken IgL V gene
segment arise by intrachromosomal gene conversion. Genes Dev, 1990. 4(4): p. 536-
47.
41. Reynaud, C.A., et al., Somatic hyperconversion diversifies the single Vh gene of the
chicken with a high incidence in the D region. Cell, 1989. 59(1): p. 171-83.
42. Reynaud, C.A., et al., Somatic generation of diversity in a mammalian primary
lymphoid organ: the sheep ileal Peyer's patches. Cell, 1991. 64(5): p. 995-1005.

89
43. Arakawa, H., J. Hauschild, and J.M. Buerstedde, Requirement of the activation-
induced deaminase (AID) gene for immunoglobulin gene conversion. Science, 2002.
295(5558): p. 1301-6.
44. Harris, R.S., et al., AID is essential for immunoglobulin V gene conversion in a
cultured B-cell line. Curr Biol, 2002. 12(5): p. 435-8.
45. Conlon, T.M. and K.B. Meyer, The chicken Ig light chain 3'-enhancer is essential for
gene expression and regulates gene conversion via the transcription factor E2A. Eur J
Immunol, 2006. 36(1): p. 139-48.
46. Kothapalli, N., D.D. Norton, and S.D. Fugmann, Cutting edge: a cis-acting DNA
element targets AID-mediated sequence diversification to the chicken Ig light chain
gene locus. J Immunol, 2008. 180(4): p. 2019-23.
47. Rajewsky, K., I. Forster, and A. Cumano, Evolutionary and somatic selection of the
antibody repertoire in the mouse. Science, 1987. 238(4830): p. 1088-94.
48. Peled, J.U., et al., The biochemistry of somatic hypermutation. Annu Rev Immunol,
2008. 26: p. 481-511.
49. Siskind, G.W. and B. Benacerraf, Cell selection by antigen in the immune response.
Adv Immunol, 1969. 10: p. 1-50.
50. Sharpe, M.J., et al., Somatic hypermutation of immunoglobulin kappa may depend on
sequences 3' of C kappa and occurs on passenger transgenes. EMBO J, 1991. 10(8):
p. 2139-45.
51. Lebecque, S.G. and P.J. Gearhart, Boundaries of somatic mutation in rearranged
immunoglobulin genes: 5' boundary is near the promoter, and 3' boundary is
approximately 1 kb from V(D)J gene. J Exp Med, 1990. 172(6): p. 1717-27.
52. Both, G.W., et al., Distribution of mutations around rearranged heavy-chain antibody
variable-region genes. Mol Cell Biol, 1990. 10(10): p. 5187-96.
53. Rada, C. and C. Milstein, The intrinsic hypermutability of antibody heavy and light
chain genes decays exponentially. EMBO J, 2001. 20(16): p. 4570-6.
54. Longerich, S., et al., The very 5' end and the constant region of Ig genes are spared
from somatic mutation because AID does not access these regions. J Exp Med, 2005.
202(10): p. 1443-54.
55. Betz, A.G., et al., Passenger transgenes reveal intrinsic specificity of the antibody
hypermutation mechanism: clustering, polarity, and specific hot spots. Proc Natl Acad
Sci U S A, 1993. 90(6): p. 2385-8.
56. Gonzalez-Fernandez, A., et al., Somatic mutation of immunoglobulin lambda chains: a
segment of the major intron hypermutates as much as the complementarity-
determining regions. Proc Natl Acad Sci U S A, 1994. 91(26): p. 12614-8.
57. Diaz, M., M.F. Flajnik, and N. Klinman, Evolution and the molecular basis of somatic
hypermutation of antigen receptor genes. Philos Trans R Soc Lond B Biol Sci, 2001.
356(1405): p. 67-72.
58. Rogozin, I.B. and M. Diaz, Cutting edge: DGYW/WRCH is a better predictor of
mutability at G:C bases in Ig hypermutation than the widely accepted RGYW/WRCY
motif and probably reflects a two-step activation-induced cytidine deaminase-
triggered process. J Immunol, 2004. 172(6): p. 3382-4.
59. Kinoshita, K. and T. Honjo, Linking class-switch recombination with somatic
hypermutation. Nat Rev Mol Cell Biol, 2001. 2(7): p. 493-503.
60. Martin, A., et al., Activation-induced cytidine deaminase turns on somatic
hypermutation in hybridomas. Nature, 2002. 415(6873): p. 802-6.
61. Golding, G.B., P.J. Gearhart, and B.W. Glickman, Patterns of somatic mutations in
immunoglobulin variable genes. Genetics, 1987. 115(1): p. 169-76.
62. Fukita, Y., H. Jacobs, and K. Rajewsky, Somatic hypermutation in the heavy chain
locus correlates with transcription. Immunity, 1998. 9(1): p. 105-14.

90
63. Peters, A. and U. Storb, Somatic hypermutation of immunoglobulin genes is linked to
transcription initiation. Immunity, 1996. 4(1): p. 57-65.
64. Yoshikawa, K., et al., AID enzyme-induced hypermutation in an actively transcribed
gene in fibroblasts. Science, 2002. 296(5575): p. 2033-6.
65. Muramatsu, M., et al., Class switch recombination and hypermutation require
activation-induced cytidine deaminase (AID), a potential RNA editing enzyme. Cell,
2000. 102(5): p. 553-63.
66. Revy, P., et al., Activation-induced cytidine deaminase (AID) deficiency causes the
autosomal recessive form of the Hyper-IgM syndrome (HIGM2). Cell, 2000. 102(5): p.
565-75.
67. Arakawa, H., H. Saribasak, and J.M. Buerstedde, Activation-induced cytidine
deaminase initiates immunoglobulin gene conversion and hypermutation by a common
intermediate. PLoS Biol, 2004. 2(7): p. E179.
68. Shen, H.M., et al., Mutation of BCL-6 gene in normal B-cells by the process of
somatic hypermutation of Ig genes. Science, 1998. 280(5370): p. 1750-2.
69. Storb, U., et al., Molecular aspects of somatic hypermutation of immunoglobulin
genes. Cold Spring Harb Symp Quant Biol, 1999. 64: p. 227-34.
70. Liu, M., et al., Two levels of protection for the B-cell genome during somatic
hypermutation. Nature, 2008. 451(7180): p. 841-5.
71. Betz, A.G., et al., Elements regulating somatic hypermutation of an immunoglobulin
kappa gene: critical role for the intron enhancer/matrix attachment region. Cell,
1994. 77(2): p. 239-48.
72. Klix, N., et al., Multiple sequences from downstream of the J kappa cluster can
combine to recruit somatic hypermutation to a heterologous, upstream mutation
domain. Eur J Immunol, 1998. 28(1): p. 317-26.
73. Michael, N., et al., The E box motif CAGGTG enhances somatic hypermutation
without enhancing transcription. Immunity, 2003. 19(2): p. 235-42.
74. Kong, Q. and N. Maizels, DNA breaks in hypermutating immunoglobulin genes:
evidence for a break-and-repair pathway of somatic hypermutation. Genetics, 2001.
158(1): p. 369-78.
75. Bross, L., et al., DNA double-strand breaks in immunoglobulin genes undergoing
somatic hypermutation. Immunity, 2000. 13(5): p. 589-97.
76. Papavasiliou, F.N. and D.G. Schatz, Cell-cycle-regulated DNA double-stranded
breaks in somatic hypermutation of immunoglobulin genes. Nature, 2000. 408(6809):
p. 216-21.
77. Zan, H., et al., AID-dependent generation of resected double-strand DNA breaks and
recruitment of Rad52/Rad51 in somatic hypermutation. Immunity, 2003. 18(6): p.
727-38.
78. Sale, J.E. and M.S. Neuberger, TdT-accessible breaks are scattered over the
immunoglobulin V domain in a constitutively hypermutating B-cell line. Immunity,
1998. 9(6): p. 859-69.
79. Chua, K.F., F.W. Alt, and J.P. Manis, The function of AID in somatic mutation and
class switch recombination: upstream or downstream of DNA breaks. J Exp Med,
2002. 195(9): p. F37-41.
80. Dunnick, W., et al., DNA sequences at immunoglobulin switch region recombination
sites. Nucleic Acids Res, 1993. 21(3): p. 365-72.
81. Honjo, T., K. Kinoshita, and M. Muramatsu, Molecular mechanism of class switch
recombination: linkage with somatic hypermutation. Annu Rev Immunol, 2002. 20: p.
165-96.

91
82. Stavnezer-Nordgren, J. and S. Sirlin, Specificity of immunoglobulin heavy chain
switch correlates with activity of germline heavy chain genes prior to switching.
EMBO J, 1986. 5(1): p. 95-102.
83. Rolink, A., F. Melchers, and J. Andersson, The SCID but not the RAG-2 gene product
is required for S mu-S epsilon heavy chain class switching. Immunity, 1996. 5(4): p.
319-30.
84. Longerich, S., et al., AID in somatic hypermutation and class switch recombination.
Curr Opin Immunol, 2006. 18(2): p. 164-74.
85. Okazaki, I.M., et al., The AID enzyme induces class switch recombination in
fibroblasts. Nature, 2002. 416(6878): p. 340-5.
86. Manis, J.P., M. Tian, and F.W. Alt, Mechanism and control of class-switch
recombination. Trends Immunol, 2002. 23(1): p. 31-9.
87. Chaudhuri, J., et al., Transcription-targeted DNA deamination by the AID antibody
diversification enzyme. Nature, 2003. 422(6933): p. 726-30.
88. Chaudhuri, J. and F.W. Alt, Class-switch recombination: interplay of transcription,
DNA deamination and DNA repair. Nat Rev Immunol, 2004. 4(7): p. 541-52.
89. Casellas, R., et al., Ku80 is required for immunoglobulin isotype switching. EMBO J,
1998. 17(8): p. 2404-11.
90. Stavnezer, J., J.E. Guikema, and C.E. Schrader, Mechanism and regulation of class
switch recombination. Annu Rev Immunol, 2008. 26: p. 261-92.
91. Akashi, K., et al., Lymphoid development from stem cells and the common lymphocyte
progenitors. Cold Spring Harb Symp Quant Biol, 1999. 64: p. 1-12.
92. ten Boekel, E., F. Melchers, and A. Rolink, The status of Ig loci rearrangements in
single cells from different stages of B-cell development. Int Immunol, 1995. 7(6): p.
1013-9.
93. Casellas, R., et al., Contribution of receptor editing to the antibody repertoire.
Science, 2001. 291(5508): p. 1541-4.
94. Hardy, R.R. and K. Hayakawa, B-cell development pathways. Annu Rev Immunol,
2001. 19: p. 595-621.
95. Berek, C., A. Berger, and M. Apel, Maturation of the immune response in germinal
centers. Cell, 1991. 67(6): p. 1121-9.
96. Ziegner, M., G. Steinhauser, and C. Berek, Development of antibody diversity in
single germinal centers: selective expansion of high-affinity variants. Eur J Immunol,
1994. 24(10): p. 2393-400.
97. Jacob, J., et al., Intraclonal generation of antibody mutants in germinal centres.
Nature, 1991. 354(6352): p. 389-92.
98. Honjo, T. and T. Kataoka, Organization of immunoglobulin heavy chain genes and
allelic deletion model. Proc Natl Acad Sci U S A, 1978. 75(5): p. 2140-4.
99. Rajewsky, K., Clonal selection and learning in the antibody system. Nature, 1996.
381(6585): p. 751-8.
100. Cunningham, A.F., et al., Salmonella induces a switched antibody response without
germinal centers that impedes the extracellular spread of infection. J Immunol, 2007.
178(10): p. 6200-7.
101. Pape, K.A., et al., Visualization of the genesis and fate of isotype-switched B-cells
during a primary immune response. J Exp Med, 2003. 197(12): p. 1677-87.
102. Brenner, S. and C. Milstein, Origin of antibody variation. Nature, 1966. 211(5046): p.
242-3.
103. Kuppers, R., et al., Tracing B-cell development in human germinal centres by
molecular analysis of single cells picked from histological sections. EMBO J, 1993.
12(13): p. 4955-67.

92
104. Reynaud, C.A., et al., Hypermutation generating the sheep immunoglobulin repertoire
is an antigen-independent process. Cell, 1995. 80(1): p. 115-25.
105. Jenne, C.N., L.J. Kennedy, and J.D. Reynolds, Antibody repertoire development in the
sheep. Dev Comp Immunol, 2006. 30(1-2): p. 165-74.
106. Becker, R.S. and K.L. Knight, Somatic diversification of immunoglobulin heavy chain
VDJ genes: evidence for somatic gene conversion in rabbits. Cell, 1990. 63(5): p. 987-
97.
107. Weill, J.C. and C.A. Reynaud, The chicken B-cell compartment. Science, 1987.
238(4830): p. 1094-8.
108. Reynaud, C.A., et al., Emergence of committed B lymphoid progenitors in the
developing chicken embryo. EMBO J, 1992. 11(12): p. 4349-58.
109. Kohonen, P., K.P. Nera, and O. Lassila, Avian model for B-cell immunology--new
genomes and phylotranscriptomics. Scand J Immunol, 2007. 66(2-3): p. 113-21.
110. Pink, J.R., O. Vainio, and A.M. Rijnbeek, Clones of B lymphocytes in individual
follicles of the bursa of Fabricius. Eur J Immunol, 1985. 15(1): p. 83-7.
111. Weill, J.C., S. Weller, and C.A. Reynaud, A bird's eye view on human B-cells. Semin
Immunol, 2004. 16(4): p. 277-81.
112. Mansikka, A., et al., Rearrangement of immunoglobulin light chain genes in the
chicken occurs prior to colonization of the embryonic bursa of Fabricius. Proc Natl
Acad Sci U S A, 1990. 87(23): p. 9416-20.
113. Arakawa, H., et al., Effect of environmental antigens on the Ig diversification and the
selection of productive V-J joints in the bursa. J Immunol, 2002. 169(2): p. 818-28.
114. Arakawa, H., et al., Immunoglobulin gene hyperconversion ongoing in chicken splenic
germinal centers. EMBO J, 1996. 15(10): p. 2540-6.
115. Arakawa, H., et al., Oligoclonal development of B-cells bearing discrete Ig chains in
chicken single germinal centers. J Immunol, 1998. 160(9): p. 4232-41.
116. Baba, T.W., B.P. Giroir, and E.H. Humphries, Cell lines derived from avian
lymphomas exhibit two distinct phenotypes. Virology, 1985. 144(1): p. 139-51.
117. Hayward, W.S., B.G. Neel, and S.M. Astrin, Activation of a cellular onc gene by
promoter insertion in ALV-induced lymphoid leukosis. Nature, 1981. 290(5806): p.
475-80.
118. Kim, S., et al., Ongoing diversification of the rearranged immunoglobulin light-chain
gene in a bursal lymphoma cell line. Mol Cell Biol, 1990. 10(6): p. 3224-31.
119. Sale, J.E., Immunoglobulin diversification in DT40: a model for vertebrate DNA
damage tolerance. DNA Repair (Amst), 2004. 3(7): p. 693-702.
120. Schubach, W. and M. Groudine, Alteration of c-myc chromatin structure by avian
leukosis virus integration. Nature, 1984. 307(5953): p. 702-8.
121. Yamazoe, M., et al., Reverse genetic studies of the DNA damage response in the
chicken B lymphocyte line DT40. DNA Repair (Amst), 2004. 3(8-9): p. 1175-85.
122. Buerstedde, J.M., et al., Light chain gene conversion continues at high rate in an ALV-
induced cell line. EMBO J, 1990. 9(3): p. 921-7.
123. Smithies, O., et al., Insertion of DNA sequences into the human chromosomal beta-
globin locus by homologous recombination. Nature, 1985. 317(6034): p. 230-4.
124. Thomas, K.R., K.R. Folger, and M.R. Capecchi, High frequency targeting of genes to
specific sites in the mammalian genome. Cell, 1986. 44(3): p. 419-28.
125. Buerstedde, J.M. and S. Takeda, Increased ratio of targeted to random integration
after transfection of chicken B-cell lines. Cell, 1991. 67(1): p. 179-88.
126. Takeda, S., et al., RAG-2 expression is not essential for chicken immunoglobulin gene
conversion. Proc Natl Acad Sci U S A, 1992. 89(9): p. 4023-7.
127. Winding, P. and M.W. Berchtold, The chicken B-cell line DT40: a novel tool for gene
disruption experiments. J Immunol Methods, 2001. 249(1-2): p. 1-16.
93
128. Arakawa, H. and J.M. Buerstedde, Review. Activation-induced cytidine deaminase-
mediated hypermutation in the DT40 cell line. Philos Trans R Soc Lond B Biol Sci,
2008.
129. Sonoda, E., et al., Reverse genetic studies of homologous DNA recombination using
the chicken B-lymphocyte line, DT40. Philos Trans R Soc Lond B Biol Sci, 2001.
356(1405): p. 111-7.
130. West, S.C., Molecular views of recombination proteins and their control. Nat Rev
Mol Cell Biol, 2003. 4(6): p. 435-45.
131. Jasin, M., Homologous repair of DNA damage and tumorigenesis: the BRCA
connection. Oncogene, 2002. 21(58): p. 8981-93.
132. Hatanaka, A., et al., Similar effects of Brca2 truncation and Rad51 paralog deficiency
on immunoglobulin V gene diversification in DT40 cells support an early role for
Rad51 paralogs in homologous recombination. Mol Cell Biol, 2005. 25(3): p. 1124-
34.
133. Solinger, J.A., K. Kiianitsa, and W.D. Heyer, Rad54, a Swi2/Snf2-like
recombinational repair protein, disassembles Rad51:dsDNA filaments. Mol Cell,
2002. 10(5): p. 1175-88.
134. Tauchi, H., et al., Nbs1 is essential for DNA repair by homologous recombination in
higher vertebrate cells. Nature, 2002. 420(6911): p. 93-8.
135. Bezzubova, O., et al., Reduced X-ray resistance and homologous recombination
frequencies in a RAD54-/- mutant of the chicken DT40 cell line. Cell, 1997. 89(2): p.
185-93.
136. Takata, M., et al., Chromosome instability and defective recombinational repair in
knockout mutants of the five Rad51 paralogs. Mol Cell Biol, 2001. 21(8): p. 2858-66.
137. Sale, J.E., et al., Ablation of XRCC2/3 transforms immunoglobulin V gene conversion
into somatic hypermutation. Nature, 2001. 412(6850): p. 921-6.
138. Bachl, J. and M. Wabl, An immunoglobulin mutator that targets G.C base pairs. Proc
Natl Acad Sci U S A, 1996. 93(2): p. 851-5.
139. Faili, A., et al., AID-dependent somatic hypermutation occurs as a DNA single-strand
event in the BL2 cell line. Nat Immunol, 2002. 3(9): p. 815-21.
140. Yamamoto, K., et al., Fanconi anemia protein FANCD2 promotes immunoglobulin
gene conversion and DNA repair through a mechanism related to homologous
recombination. Mol Cell Biol, 2005. 25(1): p. 34-43.
141. Muramatsu, M., et al., Specific expression of activation-induced cytidine deaminase
(AID), a novel member of the RNA-editing deaminase family in germinal center B-
cells. J Biol Chem, 1999. 274(26): p. 18470-6.
142. Muramatsu, M., et al., Discovery of activation-induced cytidine deaminase, the
engraver of antibody memory. Adv Immunol, 2007. 94: p. 1-36.
143. Petersen-Mahrt, S.K., R.S. Harris, and M.S. Neuberger, AID mutates E. coli
suggesting a DNA deamination mechanism for antibody diversification. Nature, 2002.
418(6893): p. 99-103.
144. Sohail, A., et al., Human activation-induced cytidine deaminase causes transcription-
dependent, strand-biased C to U deaminations. Nucleic Acids Res, 2003. 31(12): p.
2990-4.
145. Shen, H.M., S. Ratnam, and U. Storb, Targeting of the activation-induced cytosine
deaminase is strongly influenced by the sequence and structure of the targeted DNA.
Mol Cell Biol, 2005. 25(24): p. 10815-21.
146. Yu, K., F.T. Huang, and M.R. Lieber, DNA substrate length and surrounding
sequence affect the activation-induced deaminase activity at cytidine. J Biol Chem,
2004. 279(8): p. 6496-500.

94
147. Di Noia, J. and M.S. Neuberger, Altering the pathway of immunoglobulin
hypermutation by inhibiting uracil-DNA glycosylase. Nature, 2002. 419(6902): p. 43-
8.
148. Neuberger, M.S., et al., Immunity through DNA deamination. Trends Biochem Sci,
2003. 28(6): p. 305-12.
149. Bransteitter, R., et al., Activation-induced cytidine deaminase deaminates
deoxycytidine on single-stranded DNA but requires the action of RNase. Proc Natl
Acad Sci U S A, 2003. 100(7): p. 4102-7.
150. Dickerson, S.K., et al., AID mediates hypermutation by deaminating single stranded
DNA. J Exp Med, 2003. 197(10): p. 1291-6.
151. Besmer, E., E. Market, and F.N. Papavasiliou, The transcription elongation complex
directs activation-induced cytidine deaminase-mediated DNA deamination. Mol Cell
Biol, 2006. 26(11): p. 4378-85.
152. Ramiro, A.R., et al., Transcription enhances AID-mediated cytidine deamination by
exposing single-stranded DNA on the nontemplate strand. Nat Immunol, 2003. 4(5):
p. 452-6.
153. Chaudhuri, J., C. Khuong, and F.W. Alt, Replication protein A interacts with AID to
promote deamination of somatic hypermutation targets. Nature, 2004. 430(7003): p.
992-8.
154. Basu, U., et al., The AID antibody diversification enzyme is regulated by protein
kinase A phosphorylation. Nature, 2005. 438(7067): p. 508-11.
155. Pasqualucci, L., et al., PKA-mediated phosphorylation regulates the function of
activation-induced deaminase (AID) in B-cells. Proc Natl Acad Sci U S A, 2006.
103(2): p. 395-400.
156. Odegard, V.H. and D.G. Schatz, Targeting of somatic hypermutation. Nat Rev
Immunol, 2006. 6(8): p. 573-83.
157. Okazaki, I.M., et al., Constitutive expression of AID leads to tumorigenesis. J Exp
Med, 2003. 197(9): p. 1173-81.
158. Barreto, V., et al., C-terminal deletion of AID uncouples class switch recombination
from somatic hypermutation and gene conversion. Mol Cell, 2003. 12(2): p. 501-8.
159. Shinkura, R., et al., Separate domains of AID are required for somatic hypermutation
and class-switch recombination. Nat Immunol, 2004. 5(7): p. 707-12.
160. Ta, V.T., et al., AID mutant analyses indicate requirement for class-switch-specific
cofactors. Nat Immunol, 2003. 4(9): p. 843-8.
161. Brar, S.S., M. Watson, and M. Diaz, Activation-induced cytosine deaminase (AID) is
actively exported out of the nucleus but retained by the induction of DNA breaks. J
Biol Chem, 2004. 279(25): p. 26395-401.
162. Ito, S., et al., Activation-induced cytidine deaminase shuttles between nucleus and
cytoplasm like apolipoprotein B mRNA editing catalytic polypeptide 1. Proc Natl Acad
Sci U S A, 2004. 101(7): p. 1975-80.
163. McBride, K.M., et al., Somatic hypermutation is limited by CRM1-dependent nuclear
export of activation-induced deaminase. J Exp Med, 2004. 199(9): p. 1235-44.
164. Rada, C., J.M. Jarvis, and C. Milstein, AID-GFP chimeric protein increases
hypermutation of Ig genes with no evidence of nuclear localization. Proc Natl Acad
Sci U S A, 2002. 99(10): p. 7003-8.
165. Lindahl, T., Suppression of spontaneous mutagenesis in human cells by DNA base
excision-repair. Mutat Res, 2000. 462(2-3): p. 129-35.
166. Nilsen, H., et al., Nuclear and mitochondrial uracil-DNA glycosylases are generated
by alternative splicing and transcription from different positions in the UNG gene.
Nucleic Acids Res, 1997. 25(4): p. 750-5.

95
167. Pearl, L.H., Structure and function in the uracil-DNA glycosylase superfamily. Mutat
Res, 2000. 460(3-4): p. 165-81.
168. Martomo, S.A., et al., Deoxyuridine is generated preferentially in the nontranscribed
strand of DNA from cells expressing activation-induced cytidine deaminase. J
Immunol, 2005. 174(12): p. 7787-91.
169. Di Noia, J.M. and M.S. Neuberger, Immunoglobulin gene conversion in chicken DT40
cells largely proceeds through an abasic site intermediate generated by excision of the
uracil produced by AID-mediated deoxycytidine deamination. Eur J Immunol, 2004.
34(2): p. 504-8.
170. Imai, K., et al., Human uracil-DNA glycosylase deficiency associated with profoundly
impaired immunoglobulin class-switch recombination. Nat Immunol, 2003. 4(10): p.
1023-8.
171. Rada, C., et al., Immunoglobulin isotype switching is inhibited and somatic
hypermutation perturbed in UNG-deficient mice. Curr Biol, 2002. 12(20): p. 1748-55.
172. Saribasak, H., et al., Uracil DNA glycosylase disruption blocks Ig gene conversion
and induces transition mutations. J Immunol, 2006. 176(1): p. 365-71.
173. Bardwell, P.D., et al., Cutting edge: the G-U mismatch glycosylase methyl-CpG
binding domain 4 is dispensable for somatic hypermutation and class switch
recombination. J Immunol, 2003. 170(4): p. 1620-4.
174. Di Noia, J.M., C. Rada, and M.S. Neuberger, SMUG1 is able to excise uracil from
immunoglobulin genes: insight into mutation versus repair. EMBO J, 2006. 25(3): p.
585-95.
175. Rada, C., J.M. Di Noia, and M.S. Neuberger, Mismatch recognition and uracil
excision provide complementary paths to both Ig switching and the A/T-focused phase
of somatic mutation. Mol Cell, 2004. 16(2): p. 163-71.
176. Pham, P., et al., Processive AID-catalysed cytosine deamination on single-stranded
DNA simulates somatic hypermutation. Nature, 2003. 424(6944): p. 103-7.
177. Krokan, H.E., F. Drablos, and G. Slupphaug, Uracil in DNA--occurrence,
consequences and repair. Oncogene, 2002. 21(58): p. 8935-48.
178. Otterlei, M., et al., Post-replicative base excision repair in replication foci. EMBO J,
1999. 18(13): p. 3834-44.
179. Jiricny, J., The multifaceted mismatch-repair system. Nat Rev Mol Cell Biol, 2006.
7(5): p. 335-46.
180. Nielsen, F.C., et al., Characterization of human exonuclease 1 in complex with
mismatch repair proteins, subcellular localization and association with PCNA.
Oncogene, 2004. 23(7): p. 1457-68.
181. Bardwell, P.D., et al., Altered somatic hypermutation and reduced class-switch
recombination in exonuclease 1-mutant mice. Nat Immunol, 2004. 5(2): p. 224-9.
182. Neuberger, M.S. and C. Rada, Somatic hypermutation: activation-induced deaminase
for C/G followed by polymerase eta for A/T. J Exp Med, 2007. 204(1): p. 7-10.
183. Wilson, T.M., et al., MSH2-MSH6 stimulates DNA polymerase eta, suggesting a role
for A:T mutations in antibody genes. J Exp Med, 2005. 201(4): p. 637-45.
184. Cascalho, M., et al., Mismatch repair co-opted by hypermutation. Science, 1998.
279(5354): p. 1207-10.
185. Phung, Q.H., et al., Increased hypermutation at G and C nucleotides in
immunoglobulin variable genes from mice deficient in the MSH2 mismatch repair
protein. J Exp Med, 1998. 187(11): p. 1745-51.
186. Reynaud, C.A., et al., Mismatch repair and immunoglobulin gene hypermutation: did
we learn something? Immunol Today, 1999. 20(11): p. 522-7.
187. Wiesendanger, M., et al., Somatic hypermutation in MutS homologue (MSH)3-,
MSH6-, and MSH3/MSH6-deficient mice reveals a role for the MSH2-MSH6

96
heterodimer in modulating the base substitution pattern. J Exp Med, 2000. 191(3): p.
579-84.
188. Kim, N., et al., Different mismatch repair deficiencies all have the same effects on
somatic hypermutation: intact primary mechanism accompanied by secondary
modifications. J Exp Med, 1999. 190(1): p. 21-30.
189. Martin, A. and M.D. Scharff, AID and mismatch repair in antibody diversification.
Nat Rev Immunol, 2002. 2(8): p. 605-14.
190. Surtees, J.A., J.L. Argueso, and E. Alani, Mismatch repair proteins: key regulators of
genetic recombination. Cytogenet Genome Res, 2004. 107(3-4): p. 146-59.
191. Vallur, A.C. and N. Maizels, Activities of human exonuclease 1 that promote cleavage
of transcribed immunoglobulin switch regions. Proc Natl Acad Sci U S A, 2008.
105(43): p. 16508-12.
192. Shen, H.M., et al., Somatic hypermutation and class switch recombination in Msh6(-/-
)Ung(-/-) double-knockout mice. J Immunol, 2006. 177(8): p. 5386-92.
193. Martomo, S.A., W.W. Yang, and P.J. Gearhart, A role for Msh6 but not Msh3 in
somatic hypermutation and class switch recombination. J Exp Med, 2004. 200(1): p.
61-8.
194. Prakash, S., R.E. Johnson, and L. Prakash, Eukaryotic translesion synthesis DNA
polymerases: specificity of structure and function. Annu Rev Biochem, 2005. 74: p.
317-53.
195. Goodman, M.F., Error-prone repair DNA polymerases in prokaryotes and eukaryotes.
Annu Rev Biochem, 2002. 71: p. 17-50.
196. Fischhaber, P.L. and E.C. Friedberg, How are specialized (low-fidelity) eukaryotic
polymerases selected and switched with high-fidelity polymerases during translesion
DNA synthesis? DNA Repair (Amst), 2005. 4(2): p. 279-83.
197. Friedberg, E.C., A.R. Lehmann, and R.P. Fuchs, Trading places: how do DNA
polymerases switch during translesion DNA synthesis? Mol Cell, 2005. 18(5): p. 499-
505.
198. Zan, H., et al., The translesion DNA polymerase zeta plays a major role in Ig and bcl-
6 somatic hypermutation. Immunity, 2001. 14(5): p. 643-53.
199. Zeng, X., et al., DNA polymerase eta is an A-T mutator in somatic hypermutation of
immunoglobulin variable genes. Nat Immunol, 2001. 2(6): p. 537-41.
200. Delbos, F., et al., Contribution of DNA polymerase eta to immunoglobulin gene
hypermutation in the mouse. J Exp Med, 2005. 201(8): p. 1191-6.
201. Martomo, S.A., et al., Different mutation signatures in DNA polymerase eta- and
MSH6-deficient mice suggest separate roles in antibody diversification. Proc Natl
Acad Sci U S A, 2005. 102(24): p. 8656-61.
202. McDonald, J.P., et al., 129-derived strains of mice are deficient in DNA polymerase
iota and have normal immunoglobulin hypermutation. J Exp Med, 2003. 198(4): p.
635-43.
203. Martomo, S.A., et al., Normal hypermutation in antibody genes from congenic mice
defective for DNA polymerase iota. DNA Repair (Amst), 2006. 5(3): p. 392-8.
204. Simpson, L.J. and J.E. Sale, Rev1 is essential for DNA damage tolerance and non-
templated immunoglobulin gene mutation in a vertebrate cell line. EMBO J, 2003.
22(7): p. 1654-64.
205. Arakawa, H., et al., A role for PCNA ubiquitination in immunoglobulin
hypermutation. PLoS Biol, 2006. 4(11): p. e366.
206. Jansen, J.G., et al., Strand-biased defect in C/G transversions in hypermutating
immunoglobulin genes in Rev1-deficient mice. J Exp Med, 2006. 203(2): p. 319-23.
207. Seki, M., et al., High-efficiency bypass of DNA damage by human DNA polymerase Q.
EMBO J, 2004. 23(22): p. 4484-94.

97
208. Zan, H., et al., The translesion DNA polymerase theta plays a dominant role in
immunoglobulin gene somatic hypermutation. EMBO J, 2005. 24(21): p. 3757-69.
209. Casali, P., et al., DNA repair in antibody somatic hypermutation. Trends Immunol,
2006. 27(7): p. 313-21.
210. Maga, G. and U. Hubscher, Proliferating cell nuclear antigen (PCNA): a dancer with
many partners. J Cell Sci, 2003. 116(Pt 15): p. 3051-60.
211. Hoege, C., et al., RAD6-dependent DNA repair is linked to modification of PCNA by
ubiquitin and SUMO. Nature, 2002. 419(6903): p. 135-41.
212. Kannouche, P.L., J. Wing, and A.R. Lehmann, Interaction of human DNA polymerase
eta with monoubiquitinated PCNA: a possible mechanism for the polymerase switch in
response to DNA damage. Mol Cell, 2004. 14(4): p. 491-500.
213. Garg, P., et al., Proliferating cell nuclear antigen promotes translesion synthesis by
DNA polymerase zeta. J Biol Chem, 2005. 280(25): p. 23446-50.
214. Garg, P. and P.M. Burgers, Ubiquitinated proliferating cell nuclear antigen activates
translesion DNA polymerases eta and REV1. Proc Natl Acad Sci U S A, 2005.
102(51): p. 18361-6.
215. Haracska, L., et al., Interaction with PCNA is essential for yeast DNA polymerase eta
function. Mol Cell, 2001. 8(2): p. 407-15.
216. Langerak, P., et al., A/T mutagenesis in hypermutated immunoglobulin genes strongly
depends on PCNAK164 modification. J Exp Med, 2007. 204(8): p. 1989-98.
217. Bachl, J., I. Ertongur, and B. Jungnickel, Involvement of Rad18 in somatic
hypermutation. Proc Natl Acad Sci U S A, 2006. 103(32): p. 12081-6.
218. Clark, A.B., et al., Functional interaction of proliferating cell nuclear antigen with
MSH2-MSH6 and MSH2-MSH3 complexes. J Biol Chem, 2000. 275(47): p. 36498-
501.
219. Flores-Rozas, H., D. Clark, and R.D. Kolodner, Proliferating cell nuclear antigen and
Msh2p-Msh6p interact to form an active mispair recognition complex. Nat Genet,
2000. 26(3): p. 375-8.
220. Lee, S.D. and E. Alani, Analysis of interactions between mismatch repair initiation
factors and the replication processivity factor PCNA. J Mol Biol, 2006. 355(2): p.
175-84.
221. Pasqualucci, L., et al., Hypermutation of multiple proto-oncogenes in B-cell diffuse
large-cell lymphomas. Nature, 2001. 412(6844): p. 341-6.
222. Gopal, A.R. and S.D. Fugmann, AID-mediated diversification within the IgL locus of
chicken DT40 cells is restricted to the transcribed IgL gene. Mol Immunol, 2008.
45(7): p. 2062-8.
223. Gordon, M.S., et al., Somatic hypermutation of the B-cell receptor genes B29 (Igbeta,
CD79b) and mb1 (Igalpha, CD79a). Proc Natl Acad Sci U S A, 2003. 100(7): p.
4126-31.
224. Muschen, M., et al., Somatic mutation of the CD95 gene in human B-cells as a side-
effect of the germinal center reaction. J Exp Med, 2000. 192(12): p. 1833-40.
225. Pasqualucci, L., et al., BCL-6 mutations in normal germinal center B-cells: evidence
of somatic hypermutation acting outside Ig loci. Proc Natl Acad Sci U S A, 1998.
95(20): p. 11816-21.
226. Parsa, J.Y., et al., AID mutates a non-immunoglobulin transgene independent of
chromosomal position. Mol Immunol, 2007. 44(4): p. 567-75.
227. Wang, C.L., R.A. Harper, and M. Wabl, Genome-wide somatic hypermutation. Proc
Natl Acad Sci U S A, 2004. 101(19): p. 7352-6.
228. Warren, J.J., et al., Structure of the human MutSalpha DNA lesion recognition
complex. Mol Cell, 2007. 26(4): p. 579-92.

98
229. Yang, S.Y. and D.G. Schatz, Targeting of AID-mediated sequence diversification by
cis-acting determinants. Adv Immunol, 2007. 94: p. 109-25.
230. Michael, N., et al., Effects of sequence and structure on the hypermutability of
immunoglobulin genes. Immunity, 2002. 16(1): p. 123-34.
231. Tumas-Brundage, K. and T. Manser, The transcriptional promoter regulates
hypermutation of the antibody heavy chain locus. J Exp Med, 1997. 185(2): p. 239-50.
232. Bachl, J. and M. Wabl, Enhancers of hypermutation. Immunogenetics, 1996. 45(1): p.
59-64.
233. Lin, M.M., et al., The effects of E mu, 3'alpha (hs 1,2) and 3'kappa enhancers on
mutation of an Ig-VDJ-Cgamma2a Ig heavy gene in cultured B-cells. Int Immunol,
1998. 10(8): p. 1121-9.
234. Goyenechea, B., et al., Cells strongly expressing Ig(kappa) transgenes show clonal
recruitment of hypermutation: a role for both MAR and the enhancers. EMBO J,
1997. 16(13): p. 3987-94.
235. Inlay, M.A., et al., Roles of the Ig kappa light chain intronic and 3' enhancers in Igk
somatic hypermutation. J Immunol, 2006. 177(2): p. 1146-51.
236. van der Stoep, N., J.R. Gorman, and F.W. Alt, Reevaluation of 3'Ekappa function in
stage- and lineage-specific rearrangement and somatic hypermutation. Immunity,
1998. 8(6): p. 743-50.
237. Morvan, C.L., et al., The immunoglobulin heavy-chain locus hs3b and hs4 3'
enhancers are dispensable for VDJ assembly and somatic hypermutation. Blood,
2003. 102(4): p. 1421-7.
238. Terauchi, A., et al., A pivotal role for DNase I-sensitive regions 3b and/or 4 in the
induction of somatic hypermutation of IgH genes. J Immunol, 2001. 167(2): p. 811-20.
239. Ronai, D., et al., Complex regulation of somatic hypermutation by cis-acting
sequences in the endogenous IgH gene in hybridoma cells. Proc Natl Acad Sci U S A,
2005. 102(33): p. 11829-34.
240. Komori, A., et al., Biased dA/dT somatic hypermutation as regulated by the heavy
chain intronic iEmu enhancer and 3'Ealpha enhancers in human lymphoblastoid B-
cells. Mol Immunol, 2006. 43(11): p. 1817-26.
241. Yu, K. and M.R. Lieber, Nucleic acid structures and enzymes in the immunoglobulin
class switch recombination mechanism. DNA Repair (Amst), 2003. 2(11): p. 1163-74.
242. Duquette, M.L., et al., AID binds to transcription-induced structures in c-MYC that
map to regions associated with translocation and hypermutation. Oncogene, 2005.
24(38): p. 5791-8.
243. Ronai, D., et al., Detection of chromatin-associated single-stranded DNA in regions
targeted for somatic hypermutation. J Exp Med, 2007. 204(1): p. 181-90.
244. Schoetz, U., et al., E2A expression stimulates Ig hypermutation. J Immunol, 2006.
177(1): p. 395-400.
245. Nambu, Y., et al., Transcription-coupled events associating with immunoglobulin
switch region chromatin. Science, 2003. 302(5653): p. 2137-40.
246. Storb, U., et al., Targeting of AID to immunoglobulin genes. Adv Exp Med Biol, 2007.
596: p. 83-91.
247. Kurdistani, S.K. and M. Grunstein, Histone acetylation and deacetylation in yeast. Nat
Rev Mol Cell Biol, 2003. 4(4): p. 276-84.
248. Fraenkel, S., et al., Allelic 'choice' governs somatic hypermutation in vivo at the
immunoglobulin kappa-chain locus. Nat Immunol, 2007. 8(7): p. 715-22.
249. Larijani, M., et al., Methylation protects cytidines from AID-mediated deamination.
Mol Immunol, 2005. 42(5): p. 599-604.

99
250. Li, Z., Z. Luo, and M.D. Scharff, Differential regulation of histone acetylation and
generation of mutations in switch regions is associated with Ig class switching. Proc
Natl Acad Sci U S A, 2004. 101(43): p. 15428-33.
251. Wang, L., et al., AID-dependent histone acetylation is detected in immunoglobulin S-
regions. J Exp Med, 2006. 203(1): p. 215-26.
252. Hesslein, D.G. and D.G. Schatz, Factors and forces controlling V(D)J recombination.
Adv Immunol, 2001. 78: p. 169-232.
253. Woo, C.J., A. Martin, and M.D. Scharff, Induction of somatic hypermutation is
associated with modifications in immunoglobulin variable region chromatin.
Immunity, 2003. 19(4): p. 479-89.
254. Odegard, V.H., et al., Histone modifications associated with somatic hypermutation.
Immunity, 2005. 23(1): p. 101-10.
255. Delbos, F., et al., DNA polymerase eta is the sole contributor of A/T modifications
during immunoglobulin gene hypermutation in the mouse. J Exp Med, 2007. 204(1): p.
17-23.
256. Faili, A., et al., Induction of somatic hypermutation in immunoglobulin genes is
dependent on DNA polymerase iota. Nature, 2002. 419(6910): p. 944-7.
257. Fernandez-Capetillo, O., C.D. Allis, and A. Nussenzweig, Phosphorylation of histone
H2B at DNA double-strand breaks. J Exp Med, 2004. 199(12): p. 1671-7.
258. Petersen, S., et al., AID is required to initiate Nbs1/gamma-H2AX focus formation and
mutations at sites of class switching. Nature, 2001. 414(6864): p. 660-5.
259. Cattoretti, G., et al., Nuclear and cytoplasmic AID in extrafollicular and germinal
center B-cells. Blood, 2006. 107(10): p. 3967-75.
260. Yang, G., et al., Activation-induced deaminase cloning, localization, and protein
extraction from young VH-mutant rabbit appendix. Proc Natl Acad Sci U S A, 2005.
102(47): p. 17083-8.
261. Giusti, A.M. and T. Manser, Hypermutation is observed only in antibody H chain V
region transgenes that have recombined with endogenous immunoglobulin H DNA:
implications for the location of cis-acting elements required for somatic mutation. J
Exp Med, 1993. 177(3): p. 797-809.
262. Kosak, S.T., et al., Subnuclear compartmentalization of immunoglobulin loci during
lymphocyte development. Science, 2002. 296(5565): p. 158-62.
263. Osborne, C.S., et al., Myc dynamically and preferentially relocates to a transcription
factory occupied by Igh. PLoS Biol, 2007. 5(8): p. e192.
264. Minshull, J. and W.P. Stemmer, Protein evolution by molecular breeding. Curr Opin
Chem Biol, 1999. 3(3): p. 284-90.
265. Petrounia, I.P. and F.H. Arnold, Designed evolution of enzymatic properties. Curr
Opin Biotechnol, 2000. 11(4): p. 325-30.
266. Matsuura, T. and T. Yomo, In vitro evolution of proteins. J Biosci Bioeng, 2006.
101(6): p. 449-56.
267. Dufner, P., L. Jermutus, and R.R. Minter, Harnessing phage and ribosome display for
antibody optimisation. Trends Biotechnol, 2006. 24(11): p. 523-9.
268. Greener, A., M. Callahan, and B. Jerpseth, An efficient random mutagenesis technique
using an E. coli mutator strain. Mol Biotechnol, 1997. 7(2): p. 189-95.
269. Chalfie, M., et al., Green fluorescent protein as a marker for gene expression.
Science, 1994. 263(5148): p. 802-5.
270. Prasher, D.C., et al., Primary structure of the Aequorea victoria green-fluorescent
protein. Gene, 1992. 111(2): p. 229-33.
271. Shimomura, O., F.H. Johnson, and Y. Saiga, Extraction, purification and properties of
aequorin, a bioluminescent protein from the luminous hydromedusan, Aequorea. J
Cell Comp Physiol, 1962. 59: p. 223-39.

100
272. Delagrave, S., et al., Red-shifted excitation mutants of the green fluorescent protein.
Biotechnology (N Y), 1995. 13(2): p. 151-4.
273. Zolotukhin, S., et al., A "humanized" green fluorescent protein cDNA adapted for
high-level expression in mammalian cells. J Virol, 1996. 70(7): p. 4646-54.
274. Muhlrad, D., R. Hunter, and R. Parker, A rapid method for localized mutagenesis of
yeast genes. Yeast, 1992. 8(2): p. 79-82.
275. Zacharias, D.A. and R.Y. Tsien, Molecular biology and mutation of green fluorescent
protein. Methods Biochem Anal, 2006. 47: p. 83-120.
276. Chudakov, D.M., S. Lukyanov, and K.A. Lukyanov, Fluorescent proteins as a toolkit
for in vivo imaging. Trends Biotechnol, 2005. 23(12): p. 605-13.
277. Patterson, G.H., et al., Use of the green fluorescent protein and its mutants in
quantitative fluorescence microscopy. Biophys J, 1997. 73(5): p. 2782-90.
278. Cubitt, A.B., L.A. Woollenweber, and R. Heim, Understanding structure-function
relationships in the Aequorea victoria green fluorescent protein. Methods Cell Biol,
1999. 58: p. 19-30.
279. Wang, C.L., D.C. Yang, and M. Wabl, Directed molecular evolution by somatic
hypermutation. Protein Eng Des Sel, 2004. 17(9): p. 659-64.
280. Fradkov, A.F., et al., Far-red fluorescent tag for protein labelling. Biochem J, 2002.
368(Pt 1): p. 17-21.
281. Shcherbo, D., et al., Bright far-red fluorescent protein for whole-body imaging. Nat
Methods, 2007. 4(9): p. 741-6.
282. Konig, K., Multiphoton microscopy in life sciences. J Microsc, 2000. 200(Pt 2): p. 83-
104.
283. Gurskaya, N.G., et al., GFP-like chromoproteins as a source of far-red fluorescent
proteins. FEBS Lett, 2001. 507(1): p. 16-20.
284. Shkrob, M.A., et al., Far-red fluorescent proteins evolved from a blue chromoprotein
from Actinia equina. Biochem J, 2005. 392(Pt 3): p. 649-54.
285. Wang, L., et al., Evolution of new nonantibody proteins via iterative somatic
hypermutation. Proc Natl Acad Sci U S A, 2004. 101(48): p. 16745-9.
286. Merzlyak, E.M., et al., Bright monomeric red fluorescent protein with an extended
fluorescence lifetime. Nat Methods, 2007. 4(7): p. 555-7.
287. Wiedenmann, J., et al., A far-red fluorescent protein with fast maturation and reduced
oligomerization tendency from Entacmaea quadricolor (Anthozoa, Actinaria). Proc
Natl Acad Sci U S A, 2002. 99(18): p. 11646-51.
288. Petersen, J., et al., The 2.0-A crystal structure of eqFP611, a far red fluorescent
protein from the sea anemone Entacmaea quadricolor. J Biol Chem, 2003. 278(45): p.
44626-31.
289. Pletnev, S., et al., A Crystallographic Study of Bright Far-Red Fluorescent Protein
mKate Reveals pH-induced cis-trans Isomerization of the Chromophore. J Biol Chem,
2008. 283(43): p. 28980-7.
290. Seo, H., et al., Rapid generation of specific antibodies by enhanced homologous
recombination. Nat Biotechnol, 2005. 23(6): p. 731-5.
291. Cumbers, S.J., et al., Generation and iterative affinity maturation of antibodies in vitro
using hypermutating B-cell lines. Nat Biotechnol, 2002. 20(11): p. 1129-34.
292. Kanayama, N., et al., Genetic manipulation of an exogenous non-immunoglobulin
protein by gene conversion machinery in a chicken B-cell line. Nucleic Acids Res,
2006. 34(2): p. e10.
293. Cormack, B.P., R.H. Valdivia, and S. Falkow, FACS-optimized mutants of the green
fluorescent protein (GFP). Gene, 1996. 173(1 Spec No): p. 33-8.
294. Arakawa, H., D. Lodygin, and J.M. Buerstedde, Mutant loxP vectors for selectable
marker recycle and conditional knock-outs. BMC Biotechnol, 2001. 1: p. 7.

101
295. Zhang, W., et al., Clonal instability of V region hypermutation in the Ramos Burkitt's
lymphoma cell line. Int Immunol, 2001. 13(9): p. 1175-84.
296. Tsien, R.Y., The green fluorescent protein. Annu Rev Biochem, 1998. 67: p. 509-44.
297. Fukuda, H., M. Arai, and K. Kuwajima, Folding of green fluorescent protein and the
cycle3 mutant. Biochemistry, 2000. 39(39): p. 12025-32.
298. Zapata-Hommer, O. and O. Griesbeck, Efficiently folding and circularly permuted
variants of the Sapphire mutant of GFP. BMC Biotechnol, 2003. 3: p. 5.
299. Nagai, T., et al., A variant of yellow fluorescent protein with fast and efficient
maturation for cell-biological applications. Nat Biotechnol, 2002. 20(1): p. 87-90.
300. Rekas, A., et al., Crystal structure of venus, a yellow fluorescent protein with
improved maturation and reduced environmental sensitivity. J Biol Chem, 2002.
277(52): p. 50573-8.
301. Heim, R. and R.Y. Tsien, Engineering green fluorescent protein for improved
brightness, longer wavelengths and fluorescence resonance energy transfer. Curr
Biol, 1996. 6(2): p. 178-82.
302. Ormo, M., et al., Crystal structure of the Aequorea victoria green fluorescent protein.
Science, 1996. 273(5280): p. 1392-5.
303. Arakawa, H., et al., Protein evolution by hypermutation and selection in the B-cell line
DT40. Nucleic Acids Res, 2008. 36(1): p. e1.
304. Evdokimov, A.G., et al., Structural basis for the fast maturation of Arthropoda green
fluorescent protein. EMBO Rep, 2006. 7(10): p. 1006-12.
305. Klotz, E.L. and U. Storb, Somatic hypermutation of a lambda 2 transgene under the
control of the lambda enhancer or the heavy chain intron enhancer. J Immunol, 1996.
157(10): p. 4458-63.
306. Kong, Q., et al., A lambda 3' enhancer drives active and untemplated somatic
hypermutation of a lambda 1 transgene. J Immunol, 1998. 161(1): p. 294-301.
307. Nagaoka, H., et al., Activation-induced deaminase (AID)-directed hypermutation in
the immunoglobulin Smu region: implication of AID involvement in a common step of
class switch recombination and somatic hypermutation. J Exp Med, 2002. 195(4): p.
529-34.
308. Milstein, C., Immunoglobulin kappa-chains. Comparative sequences in selected
stretches of Bence-Jones proteins. Biochem J, 1966. 101(2): p. 352-68.
309. Carter, D.R., C. Eskiw, and P.R. Cook, Transcription factories. Biochem Soc Trans,
2008. 36(Pt 4): p. 585-9.

102
PUBLICATION LIST
Batrak V, Blagodatski A, Schmidl S, Schoetz U, Caldwell RB,
Arakawa H, Buerstedde JM. 2009. A cis-acting diversification activator
both necessary and sufficient for AID-mediated hypermutation. PLoS
Genet. 5(1):e1000332.
Arakawa, H, Kudo H, Batrak V, Caldwell RB, Rieger MA, Ellwart
JW, and Buerstedde JM. 2008. Protein evolution by hypermutation and
selection in the B-cell line DT40. Nucleic Acids Res. 36:e1.

103
ACKNOWLEDGEMENTS
Einer ist keiner. One cannot conquer alone, PhD thesis particularly. Without a support
of many people working in the building #57 of the Helmholtz Centre of Munich, without a
care of my family and friends the present thesis would not exist.
First of all I would like to thank Prof. Jean-Marie Buerstedde for inviting me to work
on my PhD in his group, for providing me with the main ideas and supervising of my research
projects.
Particularly I would like to thank my dear supervisor Dr. Hiroshi Arakawa for his
great self-giving teaching, honest patient tutorage, and constant encouraging. It is his
supervision which gave me a possibility to become a Doctor of Philosophy in science and life.
I am not only grateful for his ideas, support in all of my projects but also for the great
friendship.
I thank Prof. Michael Atkinson for “saving a shot” of the first version of my thesis, for
careful reading and interesting discussions of my work.
I would like to thank all the present and previous workers of the Institute of Molecular
Radiobiology for attention, support and creating a nice working atmosphere. I thank Prof.
Horst Zitzelsberger for the help in many organization questions and reading of my thesis. I am
grateful to Hiroshi Arakawa, Claire Innerlohinger, Huseyin and Nesibe Saribasak, Ulrike
Schötz for help to become familiar with the methods of our research group and familiarization
in the laboratory; I thank those people together with Randy Caldwell and Jürgen Bachl for the
helpful discussions of my projects. I would like to thank Randy separately for the support
concerning organization questions and computers. I also thank him and Petra Fiedler for the
contribution to the idea of the vector pHypermut2. I am really grateful to all mentioned people
and also particularly to Stephan Meding, secretary Sonia Ehrt and posthumously to Britta
Klass for helping me in all the aspects of adaptation in Munich. I am also grateful to Sabine
Schmidl, Claudia Gärtner, Martina Heim and all temporal secretaries and students of our
laboratory for the friendship and support. I also thank Artem Blagodatski for the friendship
and help in struggling with the German language.
Separately I would like to thank the “Gray Eminences” of my projects. I thank
Michael Rieger from the Institute of Stem Cell Research for the kind exhausting assistance
with FACS Aria and interesting discussions. I am indebted to Tom Meindl from the Institute
of Toxicology for his responsive ever-lasting help with the FACS machine in the 57th
building. I would like to thank our technicians Margot Böttner and Anna Freno for their

104
constant support and kind friendship. Particular thank to Margot for her sunny everyday
“Morgen!”, a great start of a day. I thank also Herbert Braselmann for his kind help with the
computers administration.
In addition I would like to thank the organizers of the hikes for PhD students from
Helmholtz Centre. These were my brightest impressions of Alps, a great possibility to get
know and stay in touch with many students from our research centre.
I would like to thank Dr. K.Lukyanov, Prof. S. Lukyanov and Dr. V. Belousov (Seva)
from the Laboratory of the Molecular Technologies in Moscow for the collaboration.
I thank my Diploma thesis supervisor Vera Ruda for keeping a friendship and a post-
diploma supervising of my “foreign” life.
A special vielen Dank to Holger Pflicke for the friendship, organization of the Munich
International Hiking Club and contribution to the “Zusammenfassung” of the present thesis.
At last I would like to thank my dear family: my parents, grandparents, my sister‟s
family and my cousin for their enormous care and support. I am very grateful to my kind
friends from Moscow who managed to stay very close over a great distance. I also thank all
my friends from Munich and Richusha Neville. All these people helped me stay positive and
motivated despite any difficulties.

105
LEBENSLAUF
Vorname & Name: Vera Batrak
Geburstag & -ort: 05.05.1982, Vladimir, Russland
Nationalität: Russisch
Geschlecht: Weiblich
Anschrift: Schwere-Reiter Str. 35, Zi. 430, 80797 München, Deutschland
E-Mail: [email protected]
AUSBILDUNG
Promotion: Technische Universität München, Fakultät Wissenschaftszentrum
Weihenstephan für Ernährung, Landnutzung und Umwelt;
München, Deutschland.
Diplom: Moskauer Staatliche Lomonosov Universität, Fakultät für Biologie,
Spezialisierung: Bioorganische Chemie. Summa cum laude.
Gymnasium: Gymnasium mit dem Akzent auf Mathematik and Physik, Istra,
Moskauer Region, Russland. Summa cum laude.
PUBLIKATIONEN:
Batrak V, Blagodatski A, Schmidl S, Schoetz U, Caldwell RB, Arakawa H,
Buerstedde JM. 2009. A cis-acting diversification activator both necessary and
sufficient for AID-mediated hypermutation. PLoS Genet. 5(1):e1000332
Arakawa H, Kudo H, Batrak V, Caldwell RB, Rieger MA, Ellwart JW, and
Buerstedde JM. 2008. Protein evolution by hypermutation and selection in the B-cell
line DT40. Nucleic Acids Res. 36:e1.
Akopov SB, Ruda VM, Batrak V, Vetchinova AS, Chernov IP, Nikolaev LG,
Bode J, Sverdlov ED. 2006. Identification, genome mapping, and CTCF binding of
potential insulators within the FXYD5-COX7A1 locus of human chromosome
19q13.12. Mamm Genome. 17(10):1042-9.

106
WISSENSCHAFTLICHE BERUFSERFAHRUNG:
Helmholtz Zentrum München (früher GSF, Forschungszentrum für Umwelt und
Gesundheit), Institut für Molekulare Strahlenbiologie (IMS). Nov 2005-Nov 2008; München,
Deutschland.
WISSENSCHAFTLICHE PRAKTIKA:
Institute of Bioorganic Chemistry, Laboratory of Human Genes Structure and
Functions. Oct 2002 – Jul 2005; Moscow, Russia. Research: Identification of insulators
within the extended fragments of the human genome DNA. Supervisor: Dr. Sergey Akopov.
Top Related