


![BRAZILIAN EXPERIENCE IN USE OF GEORREFERENCING AND REMOTE SENSING IN … · [CONCAR, 2007a]. This means that IBGE is the producer of topographic mapping used as This means that IBGE](https://static.fdocuments.net/doc/165x107/5b6471007f8b9af84b8d36b0/brazilian-experience-in-use-of-georreferencing-and-remote-sensing-in-concar.jpg)

Languages
Pages
Legal

Disability in the Brazilian Census
Alicia Bercovich
Population Census Committee
IBGE, Brazil
8th Meeting of the Washington

Overview
• Legal aspects
• Census 2000
• Consultation Meetings
• Some Results
• Census 2010: Cognitive tests and Joint Pilot test
• Questions
• Remarks
Legal Aspects
• Law Nº 7.853, October 24, 1989
• ... Art. 17 - Serão incluídas no censo demográfico de 1990, e nos subseqüentes, questões concernentes à problemática da pessoa portadora de deficiência, objetivando o conhecimento atualizado do número de pessoas portadoras de deficiência no país ...
Planning for Census 2000
• Meetings with users
• Joint work IBGE/CORDE
• Evaluation of the data obtained from the Pilot Tests and Dress Rehearsal
• Questions and Concepts

IBGE/ CORDE Joint work
• From the beginning of Census Planning (1997) the Coordination for integration of disabled people from the Ministry of Human Rights, worked together with IBGE
• CORDE sent first proposal of contents
• IBGE tested the questions and modified during the planning period
Findings and Decisions
• Why to include this topic in a population census?
• Why it was considered necessary to have more than one question in the census form?
• Screening questions: problems when using them for disability topics
• False negatives and false positives
• Minimum number of questions in the census
• Domains Chosen
• Degrees of severity

Prevalence of Disability in Selected Countries by Source

Source: IBGE, 2000 Census.
Proportion of the population with at least one type of disability, by age groups
Brazil - 2000
4,3
15,6
54,0
0
10
20
30
40
50
60
70
80
90
100
0 to 14 years 15 to 64 years 65 years and over
Age Groups
(%)
Proportion of the population with at least one type of disability

Source: IBGE, 2000 Census.
Proportion of the population with at least one type of disability by single years of age
Brazil 2000
0 10 20 30 40 50 60 70 80 90 100048
1216202428323640444852566064687276
80 ou +Si
ngle
yea
rs
Values in percentage (%)
Proportion of the population with at least one type of disability

Source: IBGE, 2000 Census.
Age and sex structure of the population with at least one type of disability Brazil 2000
0
10
20
30
40
50
60
70
80
90
100
300.000 200.000 100.000 0 100.000 200.000 300.000
Males Females
Age and sex structure of the population with at least one type of disability

Source: IBGE, 2000 Census.
Proportion of literate people aged 5 years and over by type of disability and age groups - Brazil 2000
0
10
20
30
40
50
60
70
80
90
100
5 to 9
10 to
14
15 to
19
20 to
24
25 to
29
30 to
34
35 to
39
40 to
44
45 to
49
50 to
54
55 to
59
60 to
64
65 to
69
Age Groups
(%)
PermanentmentaldisabilityPhysicalimpairment
Seeingdisability
Hearingdisability
Motordisability
No disability
Proportion of literate people aged 5 years and over by type of disability and age groups

Brazil 94,5 88,6 74,9
North..................................................................................................88,8 86,8 71,5
Northeast.........................................................................................92,9 87,5 69,9
Southeast.........................................................................................96,3 89,7 78,2
South..................................................................................................96,5 89,7 78,7
Central West....................................................................................95,5 90,9 79,5
Source: IBGE, 2000 Census.
(1) People with more than one type of disability were counted only once. (2) Including people without answer to the questions on disability. (3) Excluding people with some permanent difficulty to see, hear, walk or climb stairs.
School attendance rate among children aged 7 to 14 years old with and without disability - Brazil and Regions, 2000
At least one type of disability
Regions
School attendance rate among children aged 7 to 14 years old (%)
Total (1)(2)
At least one type of severe disability
(3)
School attendance rate among children aged 7 to 14 years old with and without disability
Source: IBGE, 2000 Census.
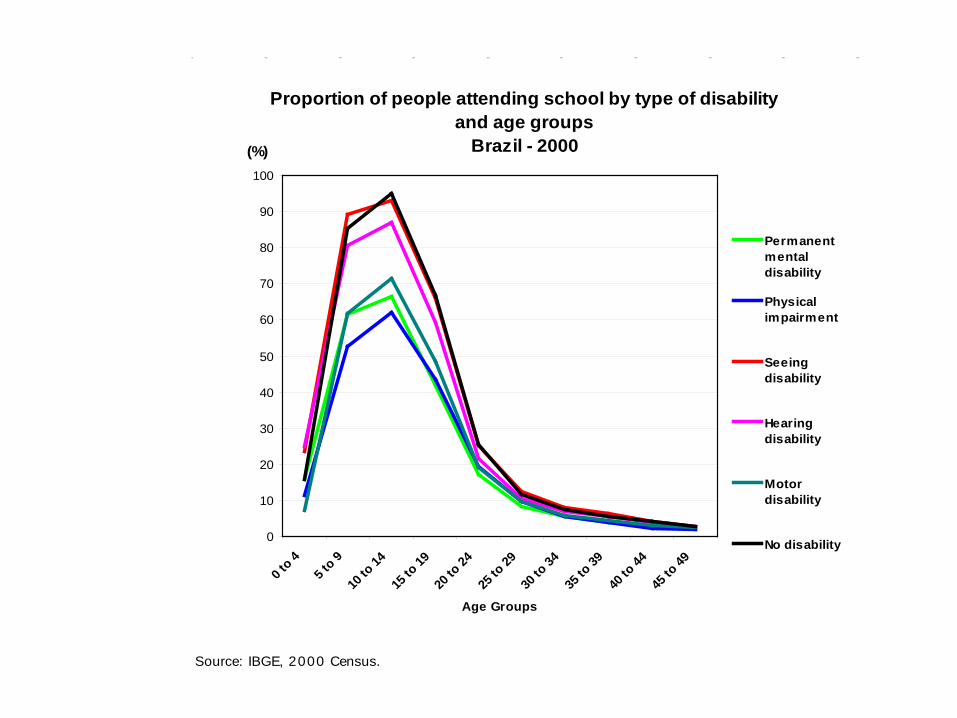
Proportion of people attending school by type of disability and age groups
Brazil - 2000
0
10
20
30
40
50
60
70
80
90
100
0 to 4
5 to 9
10 to
14
15 to
19
20 to
24
25 to
29
30 to
34
35 to
39
40 to
44
45 to
49
Age Groups
(%)
Permanentmentaldisability
Physicalimpairment
Seeingdisability
Hearingdisability
Motordisability
No disability
Proportion of people attending school by type of disability and age groups
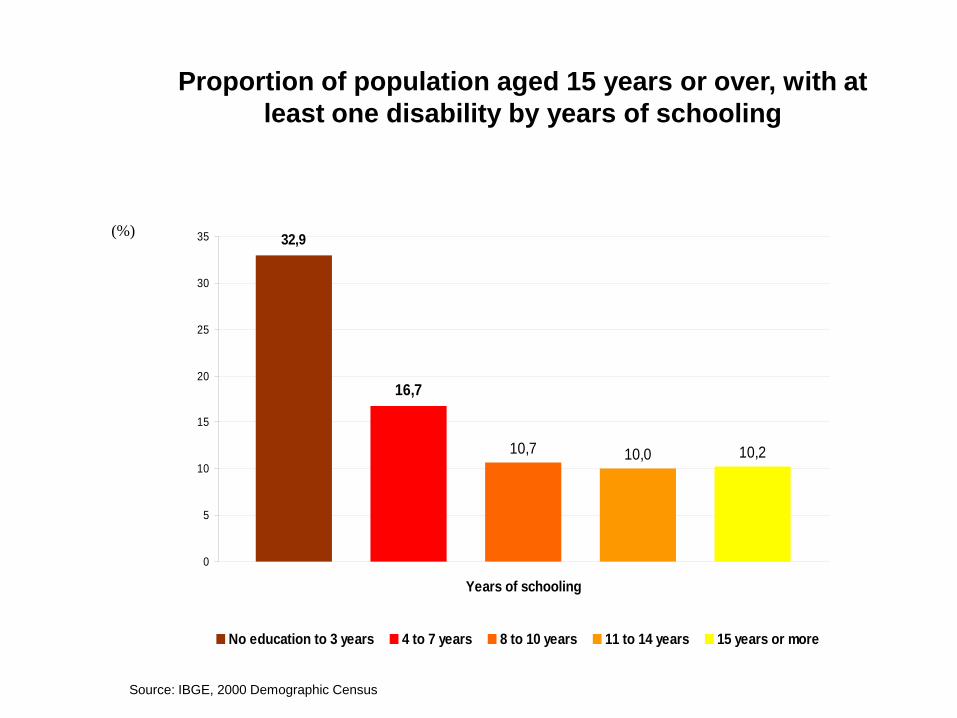
32,9
16,7
10,7 10,0 10,2
0
5
10
15
20
25
30
35
Years of schooling
No education to 3 years 4 to 7 years 8 to 10 years 11 to 14 years 15 years or more
Proportion of population aged 15 years or over, with at least one disability by years of schooling
Source: IBGE, 2000 Demographic Census
(%)
Proportion of population aged 15 years or over, with at least one disability by years of schooling

0
10
20
30
40
50
60
70
80
90
100
10 t
o 14
15 t
o 19
20 t
o 24
25 t
o 29
30 t
o 34
35 t
o 39
40 t
o 44
45 t
o 49
50 t
o 59
60 t
o 69
70 o
r mor
e
Age Groups
PermanentmentaldisabilityPhysical orMotordisabilityHearingdisability
Seeingdisability
None
Employment rate of people with eachkind of disability - Males
Source: IBGE, 2000 Demographic Census
(%)
Employment rate of people with each kind of disability - Males

0
10
20
30
40
50
60
70
80
90
100
10 t
o 14
15 t
o 19
20 t
o 24
25 t
o 29
30 t
o 34
35 t
o 39
40 t
o 44
45 t
o 49
50 t
o 59
60 t
o 69
70 o
r mor
e
Age Groups
Permanentmentaldisability
Physical ormotordisability
Hearingdisability
Seeingdisability
None
Employment rate of people with eachkind of disability - Females
Source: IBGE, 2000 Demographic Census
(%)
Employment rate of people with each kind of disability - Females

Life expectancy (LE) and disability-free life expectancy (DFLE), by gender and Regions, Brazil 2000
0
10
20
30
40
50
60
70
80
Brasil
Homen
sNorte
Nordes
te
Sudeste Sul
Centro
-Oes
te
Brasil
Mulheres Norte
Nordes
te
Sudeste Sul
Centro
-Oes
te
Year
s
LE-DFLE
DFLE
Life expectancy (LE) and disability-free expectancy (DFLE), by gender and Regions

Final Remarks
• Evaluation
• Lessons learnt
• Demand for Intercensal Estimates
• Harmonization with Mercosul, Bolivia and Chile
• Joint Pilot Tests methodology
• Washington Group collaboration

Thank you!

Proposal for 2010Census Long Form
• After the joint analysis of the pilot test and the evaluation with CORDE we elaborated a proposal for 2010 Census.
• The question tested by IBGE concerning mental disability had performance slightly better than the WG´s.
• The core questions proposed by the Washington Group were quite similar to the ones asked in 2000 census. The modifications tested were approved.

1. Do you have permanent difficulty seeing? (If you wear glasses or contact lenses, make your evaluation
while wearing them)
• Cannot do at all
• Yes, great difficulty
• Yes, some difficulty
• No, no difficulty
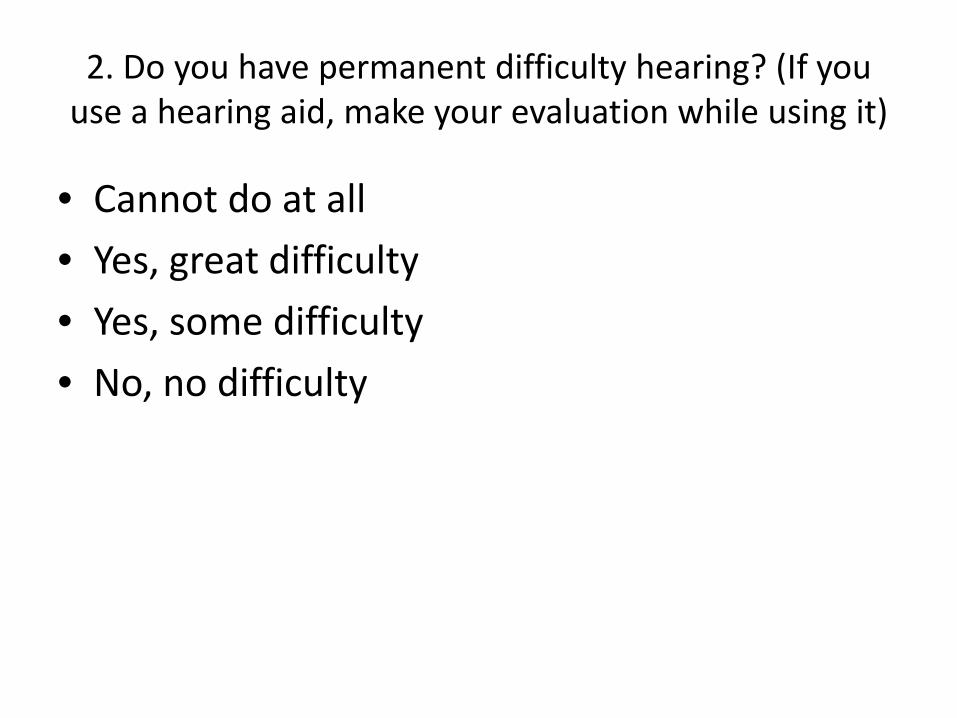
2. Do you have permanent difficulty hearing? (If you use a hearing aid, make your evaluation while using it)
• Cannot do at all
• Yes, great difficulty
• Yes, some difficulty
• No, no difficulty

3. Do you have difficulty walking or climbing stairs? (If you use a prosthesis, cane or auxiliary device, make
your evaluation while using it)
• Cannot do at all
• Yes, great difficulty
• Yes, some difficulty
• No, no difficulty

4. Do you have any permanent mental disability that limits you in your daily activities? (such as working,
going to school, playing, etc.)
• Yes
• No

5. Do you have difficulty taking care of yourself, such as dressing or bathing?
• Cannot do at all
• Yes, great difficulty
• Yes, some difficulty
• No, no difficulty
Brazil Cognitive Test
••
•
Carried out on April 2006;In three Brazilian municipalities:– Rio de Janeiro in the Southeast Region;– Curitiba in the South Region; and– Olinda in the Northeast Region.
Selection Process:– Used 2000 Census Information on Disabled People and visited
the selected households– Quota Sample of each domain tested– Selected Census Tracts with higher density of disabled people
Questionnaire
• Added four questions, called additional questions, which had been used in 2000 Census;
• By request of CORDE we included a question on Body Functions and Structure;
• The order of the categories of response of the additional questions have been modified considering the results of pilot tests preceding 2000 Census:
• The core questions and the categories of response were maintained

Response Patterns (%)Cognition
0,00
10,00
20,00
30,00
40,00
50,00
60,00
70,00
80,00
90,00
Consistent Possible Falsenegatives
Falsepositives
Self
Proxy
Response Patterns (%) Cognition
Remarks• The answers to the additional questions were
generally consistent with the core questions• When compared with the 2000 Census
questions were also compatible, but seemed to detect better some types of problems
• No problems to understand the core questions• Not so good for children with mental retardation
or other problems• Small proportion of false-negatives or false-
positives• Use for policy making?
Common Census for Mercosul, Bolivia and Chile: First Joint Pilot Test on Disability
• Brazilian Institute for Geography and Statistics – IBGE,• Instituto Nacional de Estadística y Censos – INDEC,
from Argentina• Dirección General de Estadística, Encuestas y Censos
– DGEEC, from Paraguay
• Carried out in November 2006 in the cities of Foz do Iguaçu, Puerto Iguazú and Ciudad del Este, respectively. This pilot test was planned based on the joint analysis of results from cognitive tests performed by the three countries during the first semester of 2006.
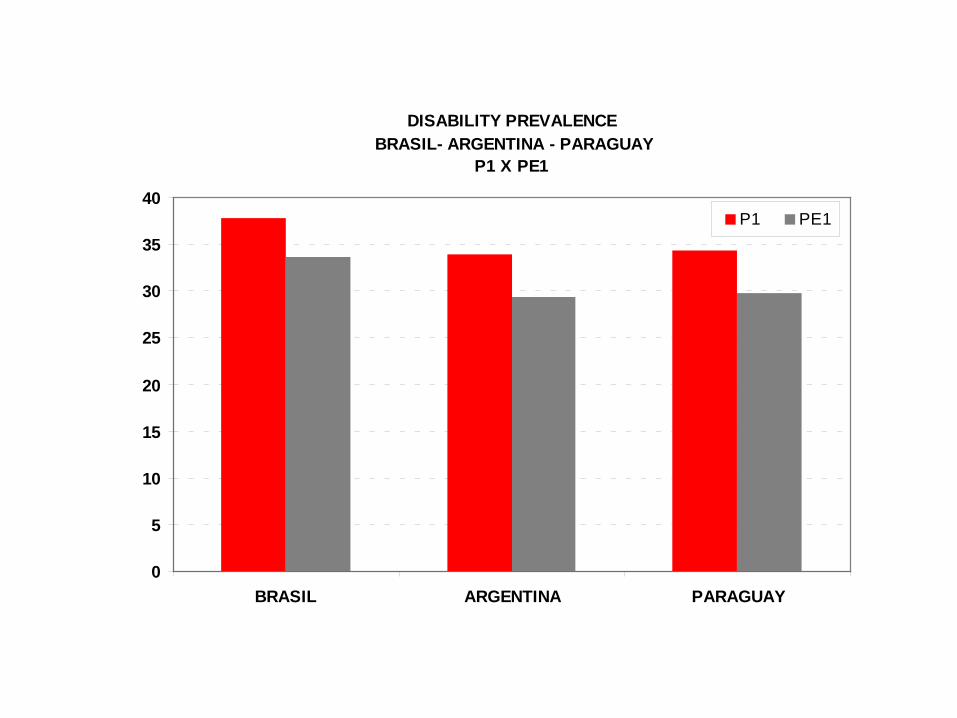
DISABILITY PREVALENCE BRASIL- ARGENTINA - PARAGUAY
P1 X PE1
0
5
10
15
20
25
30
35
40
BRASIL ARGENTINA PARAGUAY
P1 PE1
Disability Prevalence

DISABILITY PREVALENCE BRASIL- ARGENTINA - PARAGUAY
P2 X PE2
0
5
10
15
20
25
30
35
40
BRASIL ARGENTINA PARAGUAY
P2 PE2
Disability Prevalence

ED0 ED1 ED2 ED3 ED0 ED1 ED2 ED3 ED0 ED1 ED2 ED3
D0 0,82 -0,82 -0,75 -0,66 0,61 -0,61 -0,54 -0,49 0,57 -0,57 -0,56 -0,53D1 -0,82 0,82 0,75 0,66 -0,61 0,61 0,54 0,49 -0,57 0,57 0,56 0,53D2 -0,73 0,73 0,83 0,77 -0,64 0,64 0,70 0,64 -0,58 0,58 0,63 0,62D3 -0,60 0,60 0,73 0,85 -0,60 0,60 0,74 0,77 -0,55 0,55 0,62 0,66
Source: I Prova Piloto Conjunta sobre Deficiência, Brazil, Argentina and Paraguay, Nov. 2006.
Chart 11
CORE QUESTIONS
SELF CAREEXTENDED QUESTIONS
BRASIL ARGENTINA PARAGUAI
CORRELATION MATRIX BY COUNTRY AND DOMAIN I JOINT PILOT TEST: BRAZIL - ARGENTINA - PARAGUAY
Correlation Matrix by Country and Domain
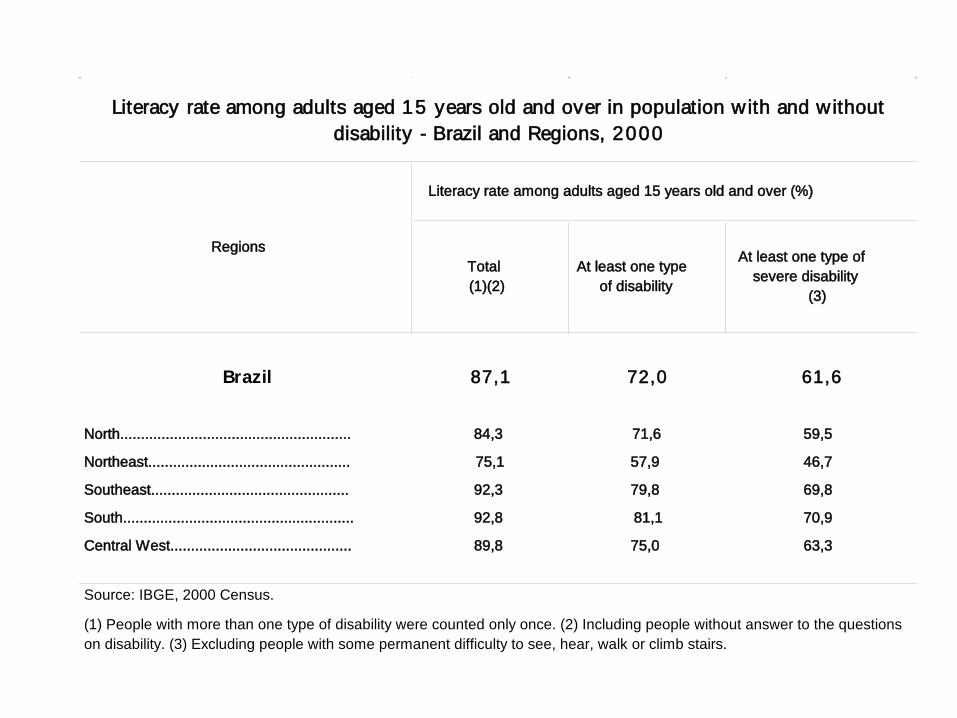
Brazil 87,1 72,0 61,6
North........................................................ 84,3 71,6 59,5
Northeast................................................. 75,1 57,9 46,7
Southeast................................................ 92,3 79,8 69,8
South........................................................ 92,8 81,1 70,9
Central West............................................ 89,8 75,0 63,3
Source: IBGE, 2000 Census.
Literacy rate among adults aged 15 years old and over in population with and without disability - Brazil and Regions, 2000
At least one type of disability
(1) People with more than one type of disability were counted only once. (2) Including people without answer to the questions on disability. (3) Excluding people with some permanent difficulty to see, hear, walk or climb stairs.
Regions
Literacy rate among adults aged 15 years old and over (%)
Total (1)(2)
At least one type of severe disability
(3)
Literacy rate among adults aged 15 years old and over in population with and without disability

Source: IBGE, 2000 Census.
Proportion of people attending school by type of disability and age groups
Brazil - 2000
0
10
20
30
40
50
60
70
80
90
100
0 to 4
5 to 9
10 to
14
15 to
19
20 to
24
25 to
29
30 to
34
35 to
39
40 to
44
45 to
49
Age Groups
(%)
Permanentmentaldisability
Physicalimpairment
Seeingdisability
Hearingdisability
Motordisability
No disability
Proportion of people attending school by type of disability and age groups

Interviewers from IBGE staff on household surveys 15
Men 6
Women 9
Qualification High SchoolCollege
Training 2 days
Forms, Handbook, CD2000 Address File, Maps
Observers 7
Respondents 406–Persons with at least one type of disability 227
–Persons with no disability 179
Implementation of the cognitive testImplementation of the cognitive test
ED0 ED1 ED2 ED3 ED0 ED1 ED2 ED3 ED0 ED1 ED2 ED3
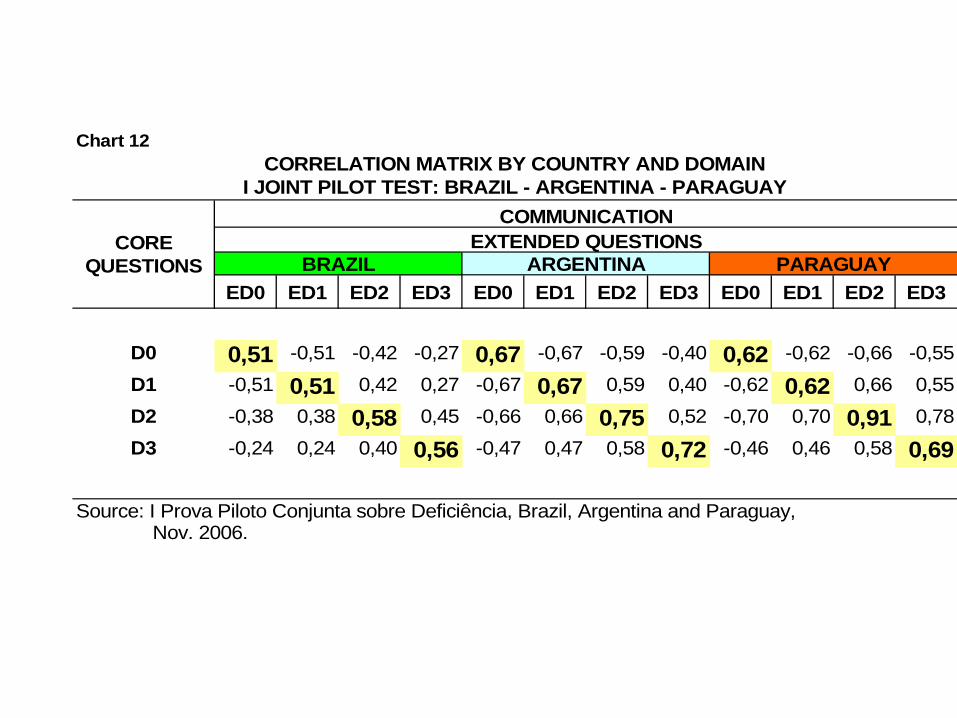
D0 0,51 -0,51 -0,42 -0,27 0,67 -0,67 -0,59 -0,40 0,62 -0,62 -0,66 -0,55D1 -0,51 0,51 0,42 0,27 -0,67 0,67 0,59 0,40 -0,62 0,62 0,66 0,55D2 -0,38 0,38 0,58 0,45 -0,66 0,66 0,75 0,52 -0,70 0,70 0,91 0,78D3 -0,24 0,24 0,40 0,56 -0,47 0,47 0,58 0,72 -0,46 0,46 0,58 0,69
Source: I Prova Piloto Conjunta sobre Deficiência, Brazil, Argentina and Paraguay, Nov. 2006.
Chart 12
CORE QUESTIONS
COMMUNICATIONEXTENDED QUESTIONS
BRAZIL ARGENTINA PARAGUAY
CORRELATION MATRIX BY COUNTRY AND DOMAIN I JOINT PILOT TEST: BRAZIL - ARGENTINA - PARAGUAY
Correlation Matrix by Country and Domain

1. Do you have any permanent mental disabilities that limit you in your daily activities? (As working, getting
school, playing, etc.)
• Yes / No

2. How do you evaluate your capacity to see? (Even with glasses or contact lenses, if used)
• Unable
• Severe permanent difficulty
• Some permanent difficulty
• No difficulty

3. How do you evaluate your capacity to hear? (Even with hearing aid, if used)
• Unable
• Severe permanent difficulty
• Some permanent difficulty
• No difficulty

• 4. How do you evaluate your capacity to walk / climb stairs?
• (Even with walking aids, if used)
• Unable
• Severe permanent difficulty
• Some permanent difficulty
• No difficulty

5. Do you have some of the following impairments?
• Permanent total paralysis
• Permanent paralysis of legs
• Permanent paralysis of one side of the body
• Loss of a member: leg, arm, hand, foot or thumb
• None of the preceding options
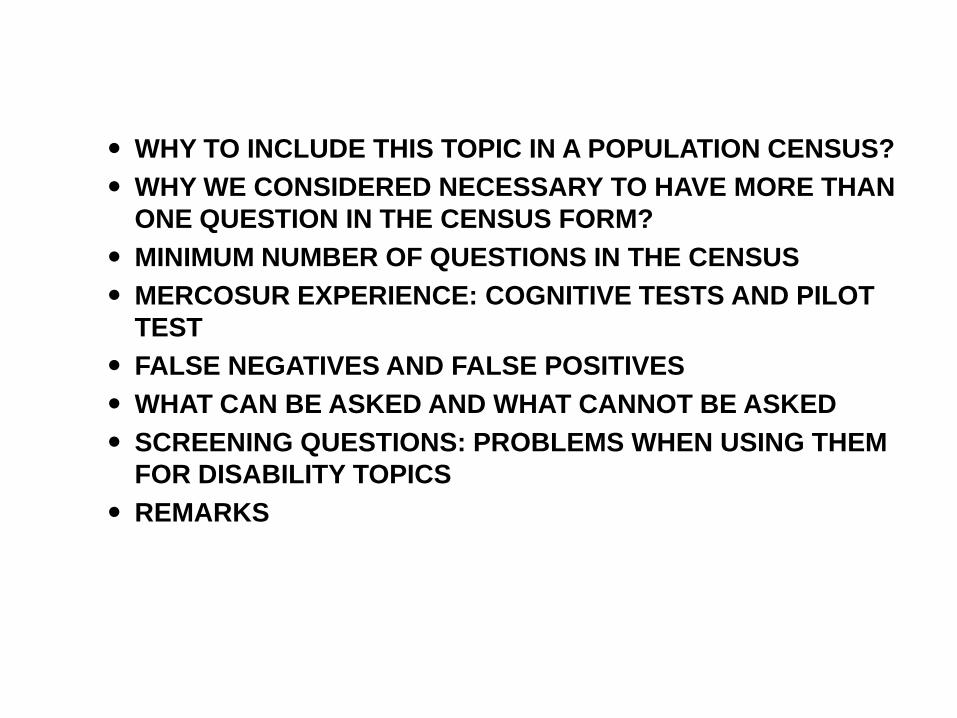
WHY TO INCLUDE THIS TOPIC IN A POPULATION CENSUS? WHY WE CONSIDERED NECESSARY TO HAVE MORE THAN
ONE QUESTION IN THE CENSUS FORM? MINIMUM NUMBER OF QUESTIONS IN THE CENSUS MERCOSUR EXPERIENCE: COGNITIVE TESTS AND PILOT
TEST FALSE NEGATIVES AND FALSE POSITIVES WHAT CAN BE ASKED AND WHAT CANNOT BE ASKED SCREENING QUESTIONS: PROBLEMS WHEN USING THEM
FOR DISABILITY TOPICS REMARKS
People with disability in Brazil: a look at 2000 Census results
Top Related