


Languages
Pages
Legal


“I regard the growth of cities as an evil thing, unfortunate for mankind and the world. ”

Per Capita GDP Growth 1960-2010(Poor Countries<$5000 PC GDP)
Congo, Dem. Rep.
Burundi
Liberia
Niger
Malawi
Sierra Leone
Central African Republic
AfghanistanUganda
Rwanda
Togo
Nepal
Zimbabwe
BangladeshBeninKenyaCambodia
Pakistan
Senegal
Cameroon
Cote d'Ivoire
Zambia
Ghana
Papua New Guinea
India
Nicaragua
Sudan
BoliviaHonduras
Philippines
Sri Lanka
Iraq
Egypt, Arab Rep.Morocco
Guatemala
Syrian Arab Republic
Congo, Rep.
El SalvadorEcuador
China
Algeria
Thailand
Jamaica
Dominican RepublicPeru
Colombia
South AfricaPanamaCosta Rica
Malaysia Mexico
Turkey
Brazil
UruguayChile
Korea, Rep.
PortugalGreece
Spain Hong Kong SAR, China
SingaporeJapan
-2-1
01
23
GD
P G
row
th 1
96
0-2
010
0 .2 .4 .6 .8 1Urbanization in 1960
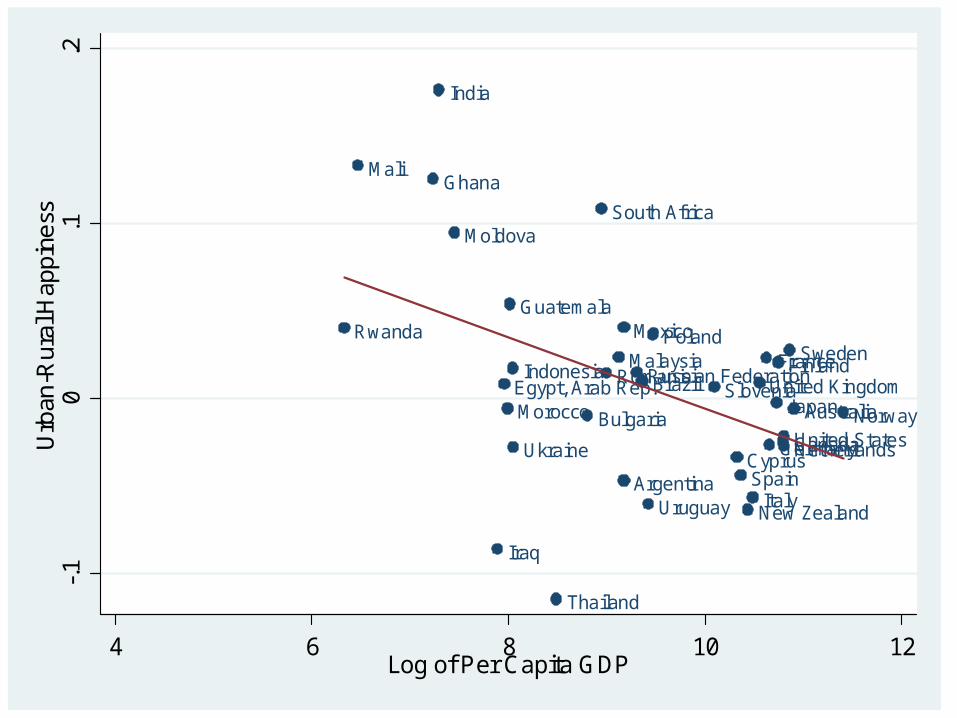
Rwanda
MaliGhana
India
Moldova
Iraq
Egypt, Arab Rep.Morocco
Guatemala
Indonesia
Ukraine
Thailand
Bulgaria
South Africa
RomaniaMalaysia
Argentina
Mexico
Russian FederationBrazil
Uruguay
Poland
Slovenia
CyprusSpain
New ZealandItaly
United KingdomFrance
Germany
Japan
Finland
CanadaUnited StatesNetherlands
Sweden
AustraliaNorway
-.1
0.1
.2U
rban
-Rur
al H
appi
ness
4 6 8 10 12Log of Per Capita GDP

The Urban Triad
The Physical City by rultoGovernment battling the Demons of Density
The Economic Magic of Human Interaction by חדוה שנדרוביץ

Share of Adults with B.A.s 2000
Per Capita GDP 2010 .
.1 .2 .3 .4 .5
20000
40000
60000
80000
100000
o
Bakersfi
o oo
Las Vega
oo
o
o
oo
o
ooo
o
o
o
o
o
oDetroit
oo
oo
o
o
oo
ooo
oo
o
o
o
oo
o
o
ooo
o
o
o
o
o
o
o
o
o
o
oo
o
o
o
o
o
o
New York
o
oo
o
o
o
o
Atlanta
o
Boston
o
o
o
ooo
San Jose
oSan Fran

Chinitz: Contrasts in Agglomeration: New York and Pittsburgh

0.5
11.
52
Ave
rage
Pe
rcen
t Gro
wth
in E
mpl
oym
ent
, 197
7-2
010
1 2 3 4 5Smallest firms are in Quintile 1
MSA Employment Growth (1977-2010)by Average Firm Size (1977) Quintiles
Economic Growth and Firm Size


Engineering vs. Economics

Bus Good, Train Bad (Curitiba)
Picture by Mariordo
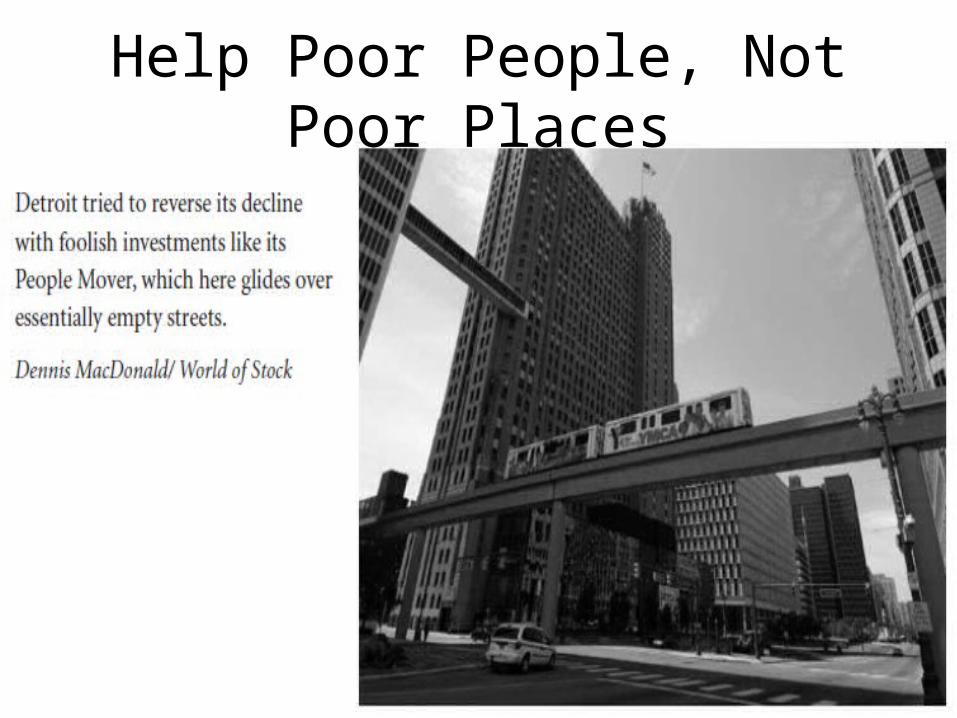
Help Poor People, Not Poor Places

NYC: Rule of Law as both Social Justice and Economic Development

NYC vs. Boston: The Case for Local Control and Experimentation
Ed Davis by Michael CummoRayKelly by David Shankbone

The Physical City: NIMBYism vs. Monumentalism
Astana by ChelseaFunNumberOne -

Image by QuarterCircleS

Top Related