


Languages
Pages
Legal


National 5 Unit 1 Cell Biology Homework Booklet 03/02/2014
Hyndland Secondary School 1 Biology Department
Hyndland Secondary School
Biology Department
National 5 Unit 1 Cell Biology
Problem Solving & Homework Booklet1 Hints on Completion of Homework ........................................................................ 2
Written Homework ................................................................................... 2
Online Homework .................................................................................... 2
QR codes ................................................................................................. 3
Cell Structure ............................................................................................................ 4
Animal and Plant Cells ............................................................................. 4
Bacteria and Fungi ................................................................................... 7
Transport Processes in Cells ................................................................................ 12
Homework Revision Exercise 1 ............................................................................ 17
Producing New Cells ............................................................................................... 21
Mitosis .................................................................................................... 21
DNA, Proteins & Genetic Engineering ............................................................... 23
DNA structure & function, Protein Synthesis .......................................... 23
Proteins Structure & Function ................................................................ 27
Genetic engineering ............................................................................... 32
Homework Revision Exercise 2 ........................................................................... 39
Respiration .............................................................................................................. 50
Homework Revision Exercise 3 ........................................................................... 54
Homework Revision Exercise 4 ........................................................................... 57
1 This booklet is available for download from the Hyndland Secondary School website in the Biology/
National 5/ Homework section of the subject support section http://www.hyndland-sec.glasgow.sch.uk

National 5 Unit 1 Cell Biology Homework Booklet 03/02/2014
Hyndland Secondary School 2 Biology Department
Hints on Completion of Homework
Written Homework
Homework is an important part of your learning. The exercises in this booklet are
designed to help improve your understanding of experimental procedures,
calculations, graphs, knowledge and understanding and gain experience in dealing with
the types of questions you may encounter in an exam or test.
You should make a fair attempt at all questions in the exercise. Homework exercises
should be completed in your jotter. This booklet is not to be written on. Should you
lose the booklet, it is your responsibility to replace it. A copy can be downloaded
from the Hyndland Secondary School website.
To ensure that sufficient graph paper is available in the jotter, any graphs should
occupy half the graph paper page, so scales need to be designed to allow this (in
exams you should use all the graph paper given). Each exercise should be started on
a new page, with a date and title at the top of the page.
These homework exercises provide an opportunity for you to practice the work you
have covered in class. Under normal circumstances, you will have a week to complete
each written exercise. If you are having difficulties, you should ask your teacher for
help. You should expect around 1 written homework exercise per week. You can
expect the exercises to be either self-marked, peer marked or marked by your
teacher. A record of completion will be kept by your teacher.
Online Homework
Online homework is designed to help you test your knowledge and understanding of
the work you are covering in class. It will help you develop a “little and often study habit”. You should use any resources available to help you get the correct answer
including your class notes, printed notes, available textbooks and internet resources.
Online homework is accessed from a link (quizstar.4teachers.org/indexs.jsp) on the
school’s website. You must record your scores in the table in your homework jotter.
Only record your highest score.
Under normal circumstances, it is expected that you should achieve more than 75%
in your online homework. Your score is given to you at the top of the screen after
completion. Clicking the review quiz button allows you to see which questions you
went wrong in. If you have not achieved 75%, you can take the quiz again accessing it
from the “started quizzes” option. After the second attempt, the correct answers
for all questions are visible and you should use this to help you improve your
knowledge. It should be noted that the questions are always presented in a random
order, and therefore you need to know or understand how to get the correct answer
the second time; it’s no good to simply remember Q6 is A – because Q6 will be a
different question, second time around.
Homework forms an integral part of your National 5 Biology course. Fully
engaging with homework will increase your success in National 5 Biology.

National 5 Unit 1 Cell Biology Homework Booklet 03/02/2014
Hyndland Secondary School 3 Biology Department
QR codes
At points throughout this booklet you will encounter funny looking
squares (like the one opposite). These are called QR codes and
are like the bar codes on tins of beans. A mobile phone with a
camera can be used to scan them and they then take you to a web
page, typically a Youtube video that might help you understand
the part of science you are trying to learn about. They also
appear throughout your summary notes and class booklet and refer to more videos or
other features to help explain the Biological concepts or remind you of an experiment
or practical technique you carried out in class.
To make use of them you need a little app, a phone, tablet or the like with a camera
and access to the internet. The system has been tested using an Android phone with
the app Quick Barcode scanner – which is free to download; Blackberry offers the
free, QR Code Scanner Pro-Free, which hasn’t been tested; the Appstore also offers
free QR code scanners, QR reader or Bakodo – again not tested.
Please ask your parents’ permission to use this feature and as always ensure your
security when downloading any app from the internet. In particular ensure you have
disabled in app purchases before downloading any of the apps.
The links have been carefully selected by your teachers, however if you find any link
that you think explains it better, please let us know and we will add it in for next
session. Enjoy your learning.

National 5 Unit 1 Cell Biology Homework Booklet 03/02/2014
Hyndland Secondary School 4 Biology Department
2. The diagram below shows some of the structures of a typical plant cell
Cell Structure
Animal and Plant Cells
HWrkSht 1_1
1. The diagrams below show some human cheek cells as they appeared under the
microscope, at two different magnifications.
Describe the effect that increasing the magnification had on:
a) the apparent size of the cells.
b) the area of the slide seen.
c) Why do we use stains when looking at cells under the microscope?
2. The diagram opposite shows some human cheek cells as they appear
when viewed through a microscope.
The diameter of the field of view of the microscope is 120
micrometres.
Calculate the average width of a human cheek cell.
3. Name the features found in both plant and animal cells.
4. What additional features are found only in plant cells ?
5. The diagrams below show sections of three different cell types. They are not drawn to the same
scale.
(a) In your jotter, draw a table to show the names and functions of structures labelled X, Y and
Z.
(b) Cells A and B are plant cells and cell C is an animal cell. Describe two features, shown in the
diagrams, that support this statement.
/contd
.

National 5 Unit 1 Cell Biology Homework Booklet 03/02/2014
Hyndland Secondary School 5 Biology Department
/contd.
4. Use the information in the table below to answer the following questions about simple aquatic
organisms.
Each organism consists of a single cell
Appearance
(not drawn to scale)
Average Cell
length (mm)
Features
1
Move by making the cytoplasm
flow in any direction.
Feed by flowing around smaller
organisms.
0.1
Move by a whipping action of the
long flagellum.
Make food by photosynthesis
0.2
Move by rhythmical beating of
rows of cilia.
Feed by taking food particles into
the gullet and then into the
cytoplasm
a) Which organism has the smallest cells?
b) Which organism does not contain food vacuoles?
c) Which organism moves using cilia?
d) Euglena carries out photosynthesis. Describe one way in which Euglena differs from
typical green plant cells
e) How many times longer is Amoeba compared to Paramecium?

National 5 Unit 1 Cell Biology Homework Booklet 03/02/2014
Hyndland Secondary School 6 Biology Department
HWrkSht 1_2
1. The table below gives some information about the size of different cell types.
Cell type Cell length or diameter (in micrometres)
Onion epidermis 150 Human egg 100 Sea urchin egg 70 Paramecium 50 Human liver 20 Yeast 8 Human red blood cell 7 Bacillus bacterium 3
a) Present the data in the table as a bar chart
b) How many times greater is the size of a human egg cell compared to a human liver cell?
c) Express as a simple whole number ratio the sizes of the Paramecium: human liver: yeast cells.
d) How could you distinguish which of the cells were animal or fungal cells using the microscope?
e) Give one similarity and one difference in the cells of the yeast, Paramecium and bacterial cells.
Construct a table in your jotter to show your results.
2. The oxygen concentration of the air decreases as the height above sea level increase. The
table below shows the red blood cell count of a mountaineer taken at different heights above sea
level.
a) Describe the relationship between the height above sea level and
the red blood cell count.
b) Find out the name and function of the protein red blood cells
contain.
c) Suggest a reason why this relationship might exist?
e) Red blood cells don’t contain a nucleus. In the body, they are replaced every 120 days.
Suggest a reason why red blood cells need to be replaced so often.

National 5 Unit 1 Cell Biology Homework Booklet 03/02/2014
Hyndland Secondary School 7 Biology Department
Bacteria and Fungi
HWrkSht 1_3
1. The diagram below shows a cell.
The function of structure X is to
A. control cell activities
B. keep the cell turgid
C. control entry and exit of material
D. release energy from glucose
2. The diagrams below show four cells. Which cell is most likely a cell from a leaf?
3. If the eyepiece lens magnifies 10 times, what
objective lens will give X400 magnification?
A. x0.4 B. x4 C. x40 D. x400
4. Which part of a plant cell contains
chlorophyll?
A. nucleus
B. cell membrane
C. cytoplasm
D. chloroplasts
5. What is the average length of the cells in the
diagram below?
A. 12 micrometers
B. 120 micrometers
C. 55 micrometers
D. 1.2 micrometers
6. The cell organelle shown below is magnified
ten thousand times.
What is the actual size of the organelle?
A. 0.04 μm
B. 0.4 μm
C. 4μm
D. 40μm

National 5 Unit 1 Cell Biology Homework Booklet 03/02/2014
Hyndland Secondary School 8 Biology Department
7. Which of the following cell types has a cell
wall made from cellulose A. Bacteria
B. Yeast
C. Animal
D. Plant
8. Which of the following cell types contains the structure below
A. Bacteria
B. Yeast
C. Animal
D. Plant
9. The diagram below shows parts of an animal cell.
Which letter identifies the ribosomes?
10. Which of the following cell types has no
organelles?
A. Bacteria
B. Yeast
C. Animal
D. Plant
11. The diagram below shows Paramecium, a unicellular organism found in fresh water
a) Identify organelles A and B b) Is Paramecium a plant or animal cell? Give a reason for your answer.
A
GOLGI APPARATUS
B

National 5 Unit 1 Cell Biology Homework Booklet 03/02/2014
Hyndland Secondary School 9 Biology Department
12. A pupil prepared a microscope slide of onion cells using water.
Diagram A shows how the cells looked when first seen with the microscope.
Diagram B shows their appearance after the addition of another liquid.
a) What name is given to a liquid used to make cell structures easier to see?
b) State the difference between the cell wall of a plant and a bacterial cell
c) Name an organelle you would find in an animal cell but not in a bacterial cell
13. Below are four different types of cells
a) Identify the four cells shown
b) Name a structure present in cell type D but is absent from the others

National 5 Unit 1 Cell Biology Homework Booklet 03/02/2014
Hyndland Secondary School 10 Biology Department
HWrkSht 1_4
1. In a commercial process, a bacterial species is provided with glucose and produces a hormone.
The bacteria release the hormone into the surrounding liquid. The graph shows changes in the
glucose concentration and the hormone concentration during a 60 hour period.
a) How many hours did it take for 50% of the glucose to be used up by the bacteria?
b) During which 10 hour period was secretion of the hormone greatest?
20-30h; 30-40h; 40-50h; 50-60h
c) Calculate the decrease in glucose concentration over the 60 hour period.
d) After 60 hours what percentage of the glucose remains? (Show your working in your jotter)
e) If the glucose concentration continues to be used up at the same rate as between 50 and 60
hours, predict how many more hours it would be before all the glucose was used. (Show your working
in your jotter).
f) During the first 10 hours of the process energy was being used for functions other than the
synthesis of the hormone. What two pieces of evidence from the graph support this statement?,
/contd.

National 5 Unit 1 Cell Biology Homework Booklet 03/02/2014
Hyndland Secondary School 11 Biology Department
/contd. 2. The diagram shows two cells, a bacterial cell and a plant cell.
a) Both the bacterial cell and the plant cell contain ribosomes. What is the function of a
ribosome?
b) The plant cell contains mitochondria but the bacterial cell does not contain mitochondria.
i) Give one other way in which the plant cell is different from the bacterial cell.
ii) Most mitochondria are about 3 micrometres in length. Use your answer to part (b)(i) and
the information in the diagram to suggest why.
c) Which part of a plant cell contains chlorophyll?
d) Both cells are drawn the same length, but the magnification of each cell is different.
The real length of the bacterial cell is 2 micrometres.
Calculate the real length, X, of the plant cell. Give your answer in micrometres.
In your jotter, show clearly how you worked out your answer.
3.
a) ?

National 5 Unit 1 Cell Biology Homework Booklet 03/02/2014
Hyndland Secondary School 12 Biology Department
Transport Processes in Cells HWrkSht 1_5
1. An investigation was carried out in the effect of water concentration on the rate of osmosis.
Details of the apparatus and the method used are given below.
a) Plot the data as a line graph, and complete it by joining the points.
b) Identify two variables not already mentioned that should be kept constant when setting up
the investigation.
c) Explain the movement of the sugar in terms of water concentrations.
d) From the results, predict the distance moved by a 3.5% sugar solution in 30 minutes and
justify your prediction.
/contd.

National 5 Unit 1 Cell Biology Homework Booklet 03/02/2014
Hyndland Secondary School 13 Biology Department
/contd. 2. An investigation was carried out to find the effect of salt solutions of different
concentrations on the mass of potato tissue. Five test tubes were set up as shown
below, each containing a different concentration of salt solution.
Each potato cylinder was weighed, placed in the solution and left for an hour. Each
cylinder was then reweighed and the percentage (%) change in mass was calculated.
The table below shows the results of the investigation.
a) Construct a line graph using the results given in the table.
b) Time was kept constant in this investigation. Name two other
variables which must be kept constant.
c) Using the results given, state the salt concentration which is isotonic to the potato tissue.
Explain your answer.
d) Predict the salt concentration that would produce a 10% decrease in mass.
3. A single celled organism is found in the water of an estuary where the salt concentration of the
water is constantly changing; as the tide rises, the salt concentration increases, as the tide falls,
the salt concentration decreases. The volume of the organism is observed to change with the
tide.
The volume changes are due to the movement of water in and out of the organisms by osmosis.
a) When the volume of the organism was increasing was the tide rising or falling in the estuary?
b) Explain your answer.

National 5 Unit 1 Cell Biology Homework Booklet 03/02/2014
Hyndland Secondary School 14 Biology Department
HWrkSht 1_6
1. A flower petal was examined under the microscope and then placed in a concentrated salt
solution for 30 minutes. It was then re-examined under the microscope.
The diagrams below show a cell from the petal before and after being in the solution.
a) The movement of water caused the change in the appearance of the cell. What name is
given to this movement of water?
b) In terms of water concentration, explain why this movement of water took place.
c) Name one substance, other than water that must be able to pass into a cell for its
survival.
2) The concentration of some substances inside and outside three cells is shown in the diagrams
below.
a) Identify the cell(s) in which diffusion of the substance into the cell would occur.
b) Identify the cell(s) in which osmosis would occur
3) Tissue from an onion root was placed in water. The diagram below represents a cell from the
tissue.
The tissue was then transferred into a very concentrated salt solution for one hour.
a) Copy and complete the diagram below to show the appearance of the onion cell contents after
this time.
/contd.

National 5 Unit 1 Cell Biology Homework Booklet 03/02/2014
Hyndland Secondary School 15 Biology Department
/contd.
4. A student cut five similar cylinders from the same potato, dried them with a paper
towel and weighed them.
Each cylinder was placed in a different concentration of sugar solution as shown in
the diagram below:
After three hours, the student removed the cylinders from the solutions, dried and
weighed them as before.
The results are shown in the table below.
a) Calculate the percentage change in mass of the potato cylinder in 0.4M sugar solution.
b) Name the variable altered in this investigation.
c) Suggest one way in which the reliability of the results could be improved.
d) Would the results be valid if the cylinders were not dried before being weighed? Explain
your answer.
e) State the letter of one test tube containing a potato cylinder in a hypertonic solution.
f) Predict the appearance of the potato cylinder in test tube E after three hours
5. The diagram below shows a model of a cell using Visking tubing.
Copy and complete the sentence below, choosing the correct word to make the statement correct.
There is an overall movement of sugar INTO/ OUT OF the bag by DIFFUSION/ OSMOSIS.

National 5 Unit 1 Cell Biology Homework Booklet 03/02/2014
Hyndland Secondary School 16 Biology Department
HWrkSht 1_7
1. Euglena is a free moving freshwater unicellular
organism that lives freshwater ponds. In its natural
habitat, Euglena gains water by osmosis. Unwanted water
is removed by the contractile vacuoles. Each filling and
emptying of a contractile vacuole is called a pulsation.
In an experiment, specimens of Euglena were placed in
solutions of different concentrations of salt and viewed
under the microscope. The table gives the results from
the observations of 7 animals.
a) Plot the data on a line graph in your
jotter.
b) What is the relationship between the salt concentration of the solution and their water
concentration?
c) Describe the relationship between the water concentration of the salt solution and the time
taken for one pulsation? Explain why this relationship would exist.
d) Name the process that the contractile vacuoles are carrying out.
e) The experiment was repeated using solutions of pure water and 1% salt solutions. In one of
these solutions the contractile vacuoles stopped working.
i. Which liquid would the contractile vacuole stop working? Explain your choice.
ii. Suggest how the contractile vacuole would respond to the other solution.
iii. What effect would this second solution have on human cheek epithelium cells?
f) Identify the variable factor in this experiment involving Euglena.
g) Name two other factors that must be kept constant in order to make the procedure valid.
h) In the experiment, why was the average value calculated for each salt concentration?
2. The table below shows the concentrations of certain ions in the cells of a type of alga and the
concentrations of the same ions in the pond water in which it lives.
Substance
analysed Calcium (Ca2+) Chloride (Cl-) Potassium(K+) Sodium (Na+)
Cell sap 380 3600 2600 1450
Pond water 38 72 13 58
a) What can be said about the concentrations of the ions in the cells compared with that in the
pond water?
b) What cell process has lead to the concentrations of ions in the cells?
c) Calculate the ratio of sodium ions in cell sap to that in pond water.
d) Calculate the ratio of potassium ions in cell sap to that in pond water.
Salt concentration (%) Average time for
one pulsation (s)
0.1 95
0.3 156
0.5 201
0.7 378
Ion concentration (mg/l)

National 5 Unit 1 Cell Biology Homework Booklet 03/02/2014
Hyndland Secondary School 17 Biology Department
HWrkSht 1_8 1. Four thin sections of onion tissue were
immersed in 5% sugar solution. The sections were left for 15 minutes then viewed
under a microscope.
The table below shows the percentage of cells
plasmolysed in each section.
Section Cells plasmolysed (%)
1 44
2 44
3 54
4 58
The average percentage of cells plasmolysed is
a. 44 b. 50 c. 54 d. 200
2. Which of the following molecules can both
diffuse through a cell membrane?
a. Amino acids and starch
b. Amino acids and water
c. Starch and protein
d. Protein and water
3. The diagram below shows the initial diameter
of a potato disc.
The potato disc was placed in a high water
concentration for one hour.
Which of the diagrams shows correctly the change
in the diameter of the potato disc?
4. Which line in the table below identifies correctly the importance of diffusion to an animal cell
Raw material gained Waste product removed
A Oxygen Glucose
B Carbon dioxide Oxygen
C Oxygen Carbon dioxide
D Glucose Oxygen
5. Four cylinders of potato tissue were weighed
and each was placed into a salt solution of
different concentration. The cylinders were
reweighed after one hour.
The results are shown in the following table.
Mass of potato cylinder (g)
Salt solution Initial mass Final mass
A 10.0 12.6
B 10.0 11.2
C 10.0 9.4
D 10.0 7.0
In which salt solution would most potato cells be
plasmolysed?
National 5 Unit 1 Cell Biology Homework Booklet 03/02/2014
Hyndland Secondary School 18 Biology Department
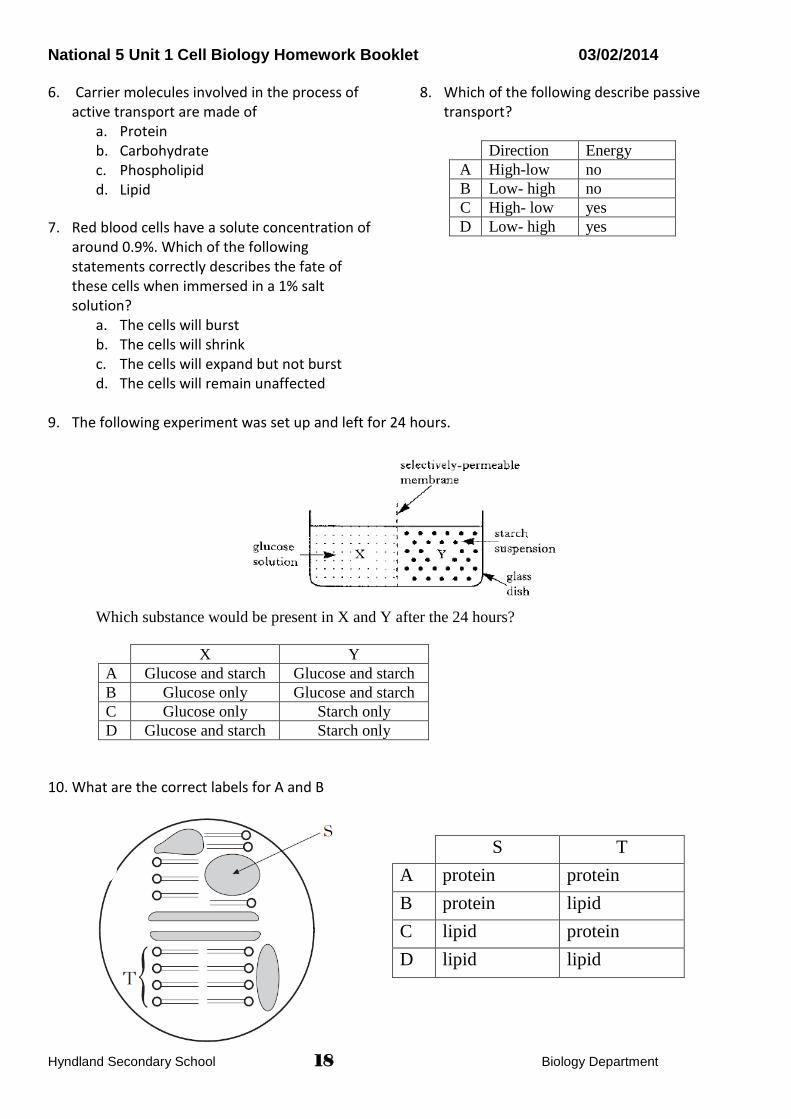
6. Carrier molecules involved in the process of active transport are made of
a. Protein b. Carbohydrate c. Phospholipid d. Lipid
7. Red blood cells have a solute concentration of around 0.9%. Which of the following statements correctly describes the fate of these cells when immersed in a 1% salt solution?
a. The cells will burst b. The cells will shrink c. The cells will expand but not burst d. The cells will remain unaffected
8. Which of the following describe passive transport?
Direction Energy
A High-low no
B Low- high no
C High- low yes
D Low- high yes
9. The following experiment was set up and left for 24 hours.
Which substance would be present in X and Y after the 24 hours?
X Y
A Glucose and starch Glucose and starch
B Glucose only Glucose and starch
C Glucose only Starch only
D Glucose and starch Starch only
10. What are the correct labels for A and B
S T
A protein protein
B protein lipid
C lipid protein
D lipid lipid

National 5 Unit 1 Cell Biology Homework Booklet 03/02/2014
Hyndland Secondary School 19 Biology Department
11. The diagram below shows Paramecium, a single-celled organism which lives in water.
a) The water concentration outside the cell is higher than the water concentration of the
cytoplasm. This causes water to enter the cell constantly.
i. What is the name for this movement of water? ii. From the information given, state whether Paramecium is likely to live in fresh
water or salt water.
b) Paramecium must get rid of excess water. Pure water is collected in the vacuoles by removing it from the cytoplasm. The vacuoles are emptied to the surrounding water as soon as they are full.
i. What would happen to the Paramecium cell if the vacuoles stopped working properly?
ii. The vacuoles are not filled by the diffusion of water. What evidence is there to support this statement?
12. The diagram below shows a magnified section of the cell membrane of a red blood cell. The numbers show the relative concentrations of potassium ions that are maintained on either side of the membrane.
a) Name molecule X. b) Express, as a simple whole number ratio, the concentration of potassium ions inside and
outside the cell. __________ : __________
inside outside
c) Use the information in the diagram to name the process by which potassium ions would leave the cell.
d) Name a factor which could limit the rate the potassium ions can leave the cell.
National 5 Unit 1 Cell Biology Homework Booklet 03/02/2014
Hyndland Secondary School 20 Biology Department
Homework Revision Exercise 1 This exercise is designed to help you prepare for your interim assessment. It covers most of the
areas which will be tested. The Online Revision exercise will cover any remaining parts of the course.
1. Name the features found in both plant and animal cells.
2. What additional features are found only in plant cells ?
3. What is the function of the nucleus ?
4. What is the function of the ribosome?
5. Describe one difference and one similarity between plant cells and fungal cells.
6. Draw a typical plant cell and label it.
7. Bacteria differ from all other cell types; describe two ways in which bacteria differ.
8. Describe two similarities in the structure of bacterial cells and plant cells.
9. Give a definition of diffusion.
10. Give two examples of substances that enter a cell by diffusion.
11. For your answer to Q10, explain how the cell benefits from each substance absorbed.
12. Give two examples of substances that leave a cell by diffusion.
13. In terms of diffusion, how would a green plant cell differ in the light and dark.
14. Why is diffusion important to us?
15. What does the fluid mosaic model describe. Explain what is meant by this term
16. What is Osmosis?
17. Why are cell membranes called 'selectively permeable'?
18. Give two examples of two molecules that can’t cross the cell membrane. Explain why.
19. Explain what happens to animal cells when placed in pure water.
20. Describe what happens to animal cells placed in pure water. Explain why.
21. Describe what happens to plant cells placed in pure water. Explain why. What term is
used to describe plant cells in this condition?
22. Draw diagrams to show what happens to animal cells when placed in 10% salt solution.
23. Draw diagrams to show what happens to plant cells when placed in 15% sucrose solution.
24. Explain how the principles of osmosis can be used in the generation of electricity. What
advantage does electricity generated in this way offer.
25. Five cylinders of potato tissue were weighed and each was placed into a salt solution of a
different concentration. The cylinders were reweighed after one hour and the results
are shown in the following table.
Salt Solution A B C D E
Initial Mass of potato cylinder (g) 10 10 10 10 10
Final mass of potato cylinder (g) 12.6 11.2 10.1 9.4 7.0
a) The potato cylinders were blotted dry before each weighing. Suggest why.
b) Which salt solution had the highest water concentration?
c) Calculate the percentage decrease in the mass of the potato cylinder in solution D. Web based revision:
Cells Osmosis & Diffusion Ratios Percentages

National 5 Unit 1 Cell Biology Homework Booklet 03/02/2014
Hyndland Secondary School 21 Biology Department
Producing New Cells
Mitosis
HWrkSht 1_9
1. What is the importance of cell division in a multi-cellular organism?
2. Which part of the cell controls cell division?
3. The photograph shows some cells in the root of an onion plant.
Cells X and Y have just been produced by cell division.
a) What process produced cells X and Y.
b) What happens to the genetic material before a cell divides?
4. The stages of cell division are shown in their correct order in the diagrams below.
a) Stage C would be followed by stage D. Describe what would happen in stage D.
Typical timings of the stages of a cell division process are shown in the table below.
b) What percentage of the total time for cell division is taken by stage C?
c) Use the data from the table to produce a bar chart showing the time spent in each
stage of cell division.
d) Scientists can grow liver tissue in the laboratory. This is done by making a few liver
cells divide to form a large mass of cells. Why is it important that the daughter cells
contain the same number of chromosomes as the original mother cells?
/contd

National 5 Unit 1 Cell Biology Homework Booklet 03/02/2014
Hyndland Secondary School 22 Biology Department
1. The diagram below shows a cell dividing.
a) Which of the following diagrams, A, B, C or D shows the cell during the next stage of
the process?
A B C D
b) How many chromosomes would be found in the body cells of the organism from which
these cells were taken?
c) In your jotters describe what is happening in Stages B and D.
./contd.

National 5 Unit 1 Cell Biology Homework Booklet 03/02/2014
Hyndland Secondary School 23 Biology Department
DNA, Proteins & Genetic Engineering
DNA structure & function, Protein Synthesis
HWrkSht 1_10
1. The diagram below shows part of a DNA molecule during replication
a) Identify parts X and Y.
b) Name bases 1 and 2.
c) Name a cellular process for which DNA replication would be essential.
2. a) What name is given to each of the repeating units that make up a strand of DNA?
b) What phrase is used to describe the shape that a DNA molecule has.
3. The diagram opposite illustrates
one of the stages of protein synthesis.
a) Name bases 10, 11 and 12.
b) Where in the cytoplasm does the
mRNA move to next?
c) Describe the part played by an
mRNA molecule in the
manufacture of a cell protein.
d) Apart from mRNA, what other
molecule will be needed for the
synthesis of proteins?

National 5 Unit 1 Cell Biology Homework Booklet 03/02/2014
Hyndland Secondary School 24 Biology Department
X
HWrkSht 1_11 1. Which part of a cell controls cell division?
a. Membrane b. Nucleus c. Cell wall d. Cytoplasm
2. How many chromosomes are found in a human diploid cell?
a. 23 b. 46 c. 69 d. 92
3. After fertilisation an egg cell divides many times. The table shows the increase in cell number after each division.
Number of divisions 0 1 2 3 4 5 6
Number of cells 1 2 4
What would be the number of cells after 6 divisions?
a. 12 b. 64 c. 32 d. 16
4. The diagram shows a cell during mitosis.
Which line in the table correctly identifies X and Y
5. An onion cell has a chromosome compliment
of 16. It divides to form daughter cells, who divide again. How many chromosomes will these new cells have?
a. 2 b. 4 c. 8 d. 16
6. DNA is found in which part of the cell?
a. Cytoplasm
b. Ribosomes
c. Nucleus
d. Cell membrane
X Y
A spindle fibre chromosome
B chromatid chromosome
C spindle fibre centromere
D cytoplasm chromatid
Y
National 5 Unit 1 Cell Biology Homework Booklet 03/02/2014
Hyndland Secondary School 25 Biology Department
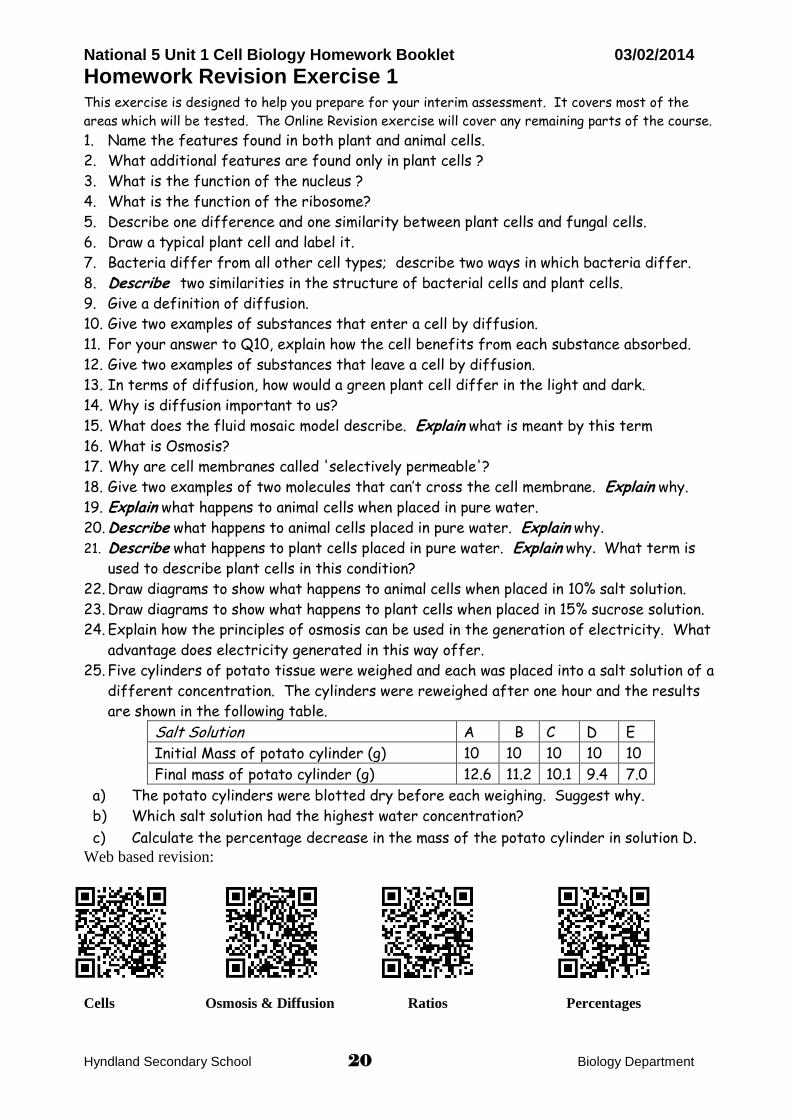
7. The DNA base, (A) adenine, pairs with what
other base?
a. (A) Adenine b. (T) Thymine c. (C) Cytosine d. (G) Guanine
8. The diagram shows DNA during replication.
Base H represents thymine (T) and base M represents guanine (G). Which letters represent the base cytosine (C)?
a. J and K b. J and L c. N and P d. N and R
9. A DNA molecule consists of 4000 nucleotides
of which 20% contain the base adenine (A). How many of the nucleotides in this DNA
molecule will contain guanine (G)?
a. 800 b. 1000 c. 1200 d. 1600
10. The diagram below shows parts of an animal
cell.
Where does synthesis of mRNA take place?

National 5 Unit 1 Cell Biology Homework Booklet 03/02/2014
Hyndland Secondary School 26 Biology Department
11. The following diagrams show four stages of cell division but not in the correct order.
a) Arrange the letters from the diagram to put the stages in the correct order. The first stage
is C b) Describe what is happen in stages B and C c) Daughter cells produced by mitosis each have the same chromosome complement as the
original cell. Why is this important? d) A cell divides every 20 minutes. How many cells would be produced from one original cell
at the end of two hours?
12. Below is a diagram of DNA. a) Identify the labels A-F on the diagram of DNA. b) Explain how this molecule controls cell activities
13. The sentence below describes the function of DNA.
Underline one option in each set of brackets to make the following sentence correct.
14. The diagram below shows the beginning of protein synthesis
a) Give the complimentary strand to the DNA strand shown a) From the diagram above, name the molecule being produced from DNA b) Where does the mRNA go when it leaves the nucleus?
A
B
C
D
E
F
A
B
C
D
E

National 5 Unit 1 Cell Biology Homework Booklet 03/02/2014
Hyndland Secondary School 27 Biology Department
Proteins Structure & Function
HWrkSht 1_12
1. Liver contains the enzyme catalase which carries out the following reaction.
hydrogen peroxide water + oxygen
The investigation shown below was carried out to demonstrate the effect of pH on
catalase activity in liver.
Hydrogen peroxide of different pH values was added to 1 g of roughly chopped raw
liver.
The time taken to collect 1cm3 of oxygen was recorded and the results are shown in
the table below.
(a) From the table, state the optimum pH for catalase in liver.
(b) Name the variable altered in this investigation.
(c) Explain why the experiment was repeated at each pH value and averages calculated.
(d) Construct a line graph of the average time taken to collect 1cm3 of oxygen against
pH of hydrogen peroxide solution.
(e) Predict the average time to collect 1 cm3 of oxygen at pH12.

National 5 Unit 1 Cell Biology Homework Booklet 03/02/2014
Hyndland Secondary School 28 Biology Department
HWrkSht 1_13
1. The following investigation was set up to examine the effects of stirring on the
digestion of protein.
Each piece of protein was weighed every two hours.
The results are shown in the table.
a) Use the data in the table to draw a line graph below
b) Which type of enzyme would produce the results shown? c) When the protein was completely digested, no solid material remained in the tube.
Explain why.
d) Name one factor, not already mentioned, which would need to be the same in each
tube at the start of the investigation.
e) Suggest how the investigation could be improved to provide a more reliable
measurement of the difference which stirring made.
f) Stirring increased the rate at which the protein was digested. Explain why this
happened.
2. The enzyme amylase breaks down starch to maltose. An investigation was carried out
to see how this reaction was affected by pH.
Nine test-tubes were set up with the contents as shown in the diagram. Each contained a
different buffer solution which controlled the pH.
The contents of the tubes were monitored to see what percentage of starch had been
converted to maltose in 20 minutes.
The results are shown in the table overleaf.
/contd.

National 5 Unit 1 Cell Biology Homework Booklet 03/02/2014
Hyndland Secondary School 29 Biology Department
/contd.
a) Plot a line graph o f the data.
b) Give all pH values used in this investigation at which the enzyme was found to be
inactive.
c) Describe the effect of increasing pH, from pH 3 to pH 10, on the activity of
amylase.
d) Name one factor, other than pH, which can affect the activity of an enzyme.
3. Enzymes are described as “biological catalysts”.
a) What is the meaning of the term “catalyst”?
b) Name an enzyme involved in a synthesis reaction.

National 5 Unit 1 Cell Biology Homework Booklet 03/02/2014
Hyndland Secondary School 30 Biology Department
HWrkSht 1_14
1. The apparatus shown below was used to study the effect of different temperatures
on the activity of the enzyme catalase.
The catalase was added and reacted with the hydrogen peroxide to release oxygen.
The increase in oxygen compared to the starting value was recorded as a percentage.
This was carried out at five different temperatures and the results are shown below.
a) Use the results to draw a line graph.
b) At which temperature was the catalase most active?
c) Why was it important that the catalase and the hydrogen peroxide were both at the
required temperature before the catalase was added?
d) Explain why there was no oxygen released when the experiments were repeated with
different enzymes.
e) Calculate the simple whole number ratio of percentage increase in oxygen at 34 °C, 40
°C and 50 °C. (Show your working in your jotter)
/contd.

National 5 Unit 1 Cell Biology Homework Booklet 03/02/2014
Hyndland Secondary School 31 Biology Department
/contd.
2. The following apparatus was used to investigate the effectiveness of washing
powders. Identical pieces of stained cloth were washed using different washing powders.
The cloths were dried and the degree of stain removal was measured by recording light
reflected from the cloth with a light meter. The meter was set to read 100% when the cloth
was perfectly clean. Any stain left on the cloth reduced the intensity of light recorded.
Various precautions were taken to ensure that the experimental procedure was valid.
a) From the following list, identify the point(s) which contributed to this.
i) The procedure used gave appropriate information about the effectiveness of
washing powders.
ii) All significant variables were controlled and were identical except the one being
investigated.
iii) Several results were collected and used to calculate an average.
b) Explain why it was necessary to carry out the investigation in a light-proof box.
The results obtained using two different washing powders at various temperatures are
shown below.
c) At which temperature was there the greatest difference between the effectiveness
of the two washing powders?
d) Each one degree Celsius reduction in the washing temperature saves 2p in the cost of
electricity used to heat the water for each wash.
Calculate the annual saving in the electricity costs to achieve 100% stain removal with
biological washing powder compared to a non-biological one, for a household which
does one wash per week
e) What type of biological substance gives biological washing powders their properties?
f) Explain why the effectiveness of the biological washing powder decreases between
40°C and 45°C.

National 5 Unit 1 Cell Biology Homework Booklet 03/02/2014
Hyndland Secondary School 32 Biology Department
HWrkSht 1_15 1. All proteins are composed of
a. Genes b. DNA c. Amino acids d. Bases
2. Enzymes act as catalyst because they
a. Are composed of protein b. Act on all substrates c. Raise the energy input d. Lower the energy input
3. The active site of an enzyme is
complementary to a. One type of substrate molecule b. All types of substrate molecule c. One type of product molecule d. All types of product molecule
4. The graph shows the effect of temperature on the enzyme pepsin.
Between which two temperatures is there the greatest increase in enzyme activity?
a. 0-10 ⁰C b. 10-20 ⁰C c. 20-30 ⁰C d. 30-40 ⁰C
5. Which of the following correctly describes amylase?
a. It breaks down starch into amino acids b. It builds up glucose-1-phosphate into starch c. It breaks down proteins into peptides d. It breaks down starch into maltose

National 5 Unit 1 Cell Biology Homework Booklet 03/02/2014
Hyndland Secondary School 33 Biology Department
Questions 6, 7 and 8 refer to the following information below. An investigation into the effect of pH on the digestion of milk by an enzyme was carried out. Five identical dishes were set up with wells cut out of the agar. To each well was added 5cm3 of the enzyme kept at a different pH as shown on the diagram below.
The dishes were kept at 35°C The diameter of the area cleared by the action of the enzyme was measured.
Diameter of clear zone (mm)
pH Dish 1 Dish 2 Dish 3 Dish 4 Dish 5
1 0 0 0 0 0
3 2 1 1 2 1
5 3 4 2 3 3
7 6 5 5 5 4
9 2 2 3 1 2
11 1 0 0 1 0
6. The average diameter cleared at pH 5 was
a. 3mm b. 4mm c. 5mm d. 6mm
7. The variable altered in this investigation was
a. Temperature b. Diameter of the well c. pH d. milk concentration
8. The pH at which the enzyme was most active
was a. 3 b. 5 c. 7 d. 9

National 5 Unit 1 Cell Biology Homework Booklet 03/02/2014
Hyndland Secondary School 34 Biology Department
9. Which of the graphs below shoes the effect of increasing temperature on enzyme activity?
10. Which line in the table below correctly shows the functions of an enzyme?
Energy input of the chemical reaction Rate of the chemical reaction
A Lowers Speeds up
B Raises Slows down
C Raises Speeds up
D Lowers Slows down
11. The diagram below shows three stages X, Y and Z that occur when an enzyme converts its
substrate to a product.
a. This enzyme promotes the breakdown of a complex molecule into simpler molecules. Put the stages into the correct order to show this degradation reaction
b. Which number in the diagram represents the active site c. Describe what happens when an enzyme is denatured

National 5 Unit 1 Cell Biology Homework Booklet 03/02/2014
Hyndland Secondary School 35 Biology Department
12. The diagram below shows the action of the enzyme phosphorylase in a potato cell
a. Copy the sentence below, choosing the correct option in the bracket to make the
sentence correct. The action of the enzyme phosphorylase catalyses the of starch.
b. State the effect of phosphorylase on the rate of this reaction.
c. Explain why lipase could not produce starch in this reaction.
degradation
synthesis

National 5 Unit 1 Cell Biology Homework Booklet 03/02/2014
Hyndland Secondary School 36 Biology Department
Genetic engineering
HWrkSht 1_16
1. In an investigation into the effectiveness of different detergents, six pieces of cloth
were washed. Each of the cloths had identical stains and all variables other than the
detergent were kept the same. After washing, the percentage of the stain which had been
removed was calculated.
The results are shown in the table.
i. Use the information from the table to draw a bar chart showing the
detergents and the percentage of stain removed.
ii. Give two conclusions which can be drawn from the results
iii. Copy and complete the following sentence by underlining the correct
word in each bracket.
2. A manufacturer uses genetic engineering techniques to make a variety of products.
The table below shows each product as a percentage of their total production in 2010.
d) Present the information in the table in the form of a pie chart.
e) What is transferred into bacterial cells during genetic engineering?
/contd.

National 5 Unit 1 Cell Biology Homework Booklet 03/02/2014
Hyndland Secondary School 37 Biology Department
/contd. 3. Read the following passage and answer the questions based on it.
a) What role does the bacterium Agrobacterium play in the genetic modification
of crops?
b) Crops can be genetically modified to make them resistant to pests, diseases
and weedkillers. Give another example of genetic modification that has been
applied to potatoes
c) Explain why a plant, which is modified to be weedkiller resistant could be:
(i) useful to farmers.
(ii) a problem for farmers.
d) Give one example of a potential threat to health by the use of GM crops.

National 5 Unit 1 Cell Biology Homework Booklet 03/02/2014
Hyndland Secondary School 38 Biology Department
HWrkSht 1_17
1. Boll weevil insects, shown in the picture below, feed on cotton plants. There are two
varieties of cotton plant, original variety (V) and a genetically engineered boll weevil
resistant variety (R).
Three farms were used to compare the yield of the two varieties. Each farmer
planted two fields, one of each variety. All fields were treated identically. The yield
of cotton from each field was weighed. The results are shown in the bar graph
below.
a) In your jotter construct a table with appropriate headings to show the results
b) Calculate the average yield of V cotton
c) Calculate the percentage difference in yield between the two varieties of cotton
grown at Farm X.
d) Name the variable altered in this investigation.
e) The fields planted with V cotton were used as a control.
f) Give a reason for using this control.
g) Explain why using ten farms instead of three would have improved this investigation.
h) What conclusion can be drawn from these results?
i) In the production of the R variety of cotton, a molecule was transferred into the
cotton cells. What type of molecule was this?
j) The farmers use pesticides to kill insects which damage their crops. Explain why less
pesticide is needed when growing R cotton.
k) Suggest two potential benefits of using the genetically engineered variety of cotton
plant

National 5 Unit 1 Cell Biology Homework Booklet 03/02/2014
Hyndland Secondary School 39 Biology Department
HWrkSht 1_18 1. Name a human hormone that can be produced by genetic engineering
2. In the boxes below, describe each of the steps carried out to transfer successfully a
human gene into a bacterial cell
3. A manufacturer uses genetic engineering techniques to make a variety of products. The
table below shows each product as a percentage of their total production in 2010.
Product Percentage of total production
Antibiotics 30
Insulin 40
Detergents 20
Antifreeze 10
National 5 Unit 1 Cell Biology Homework Booklet 03/02/2014
Hyndland Secondary School 40 Biology Department
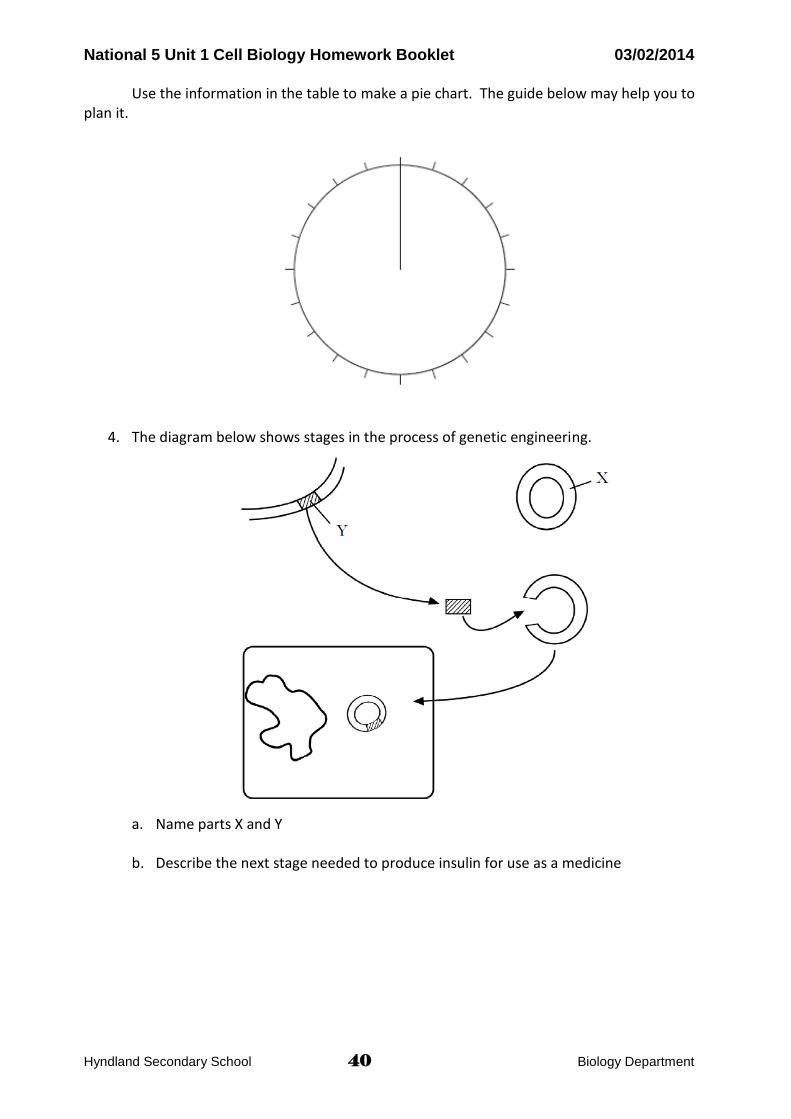
Use the information in the table to make a pie chart. The guide below may help you to
plan it.
4. The diagram below shows stages in the process of genetic engineering.
a. Name parts X and Y b. Describe the next stage needed to produce insulin for use as a medicine
National 5 Unit 1 Cell Biology Homework Booklet 03/02/2014
Hyndland Secondary School 41 Biology Department
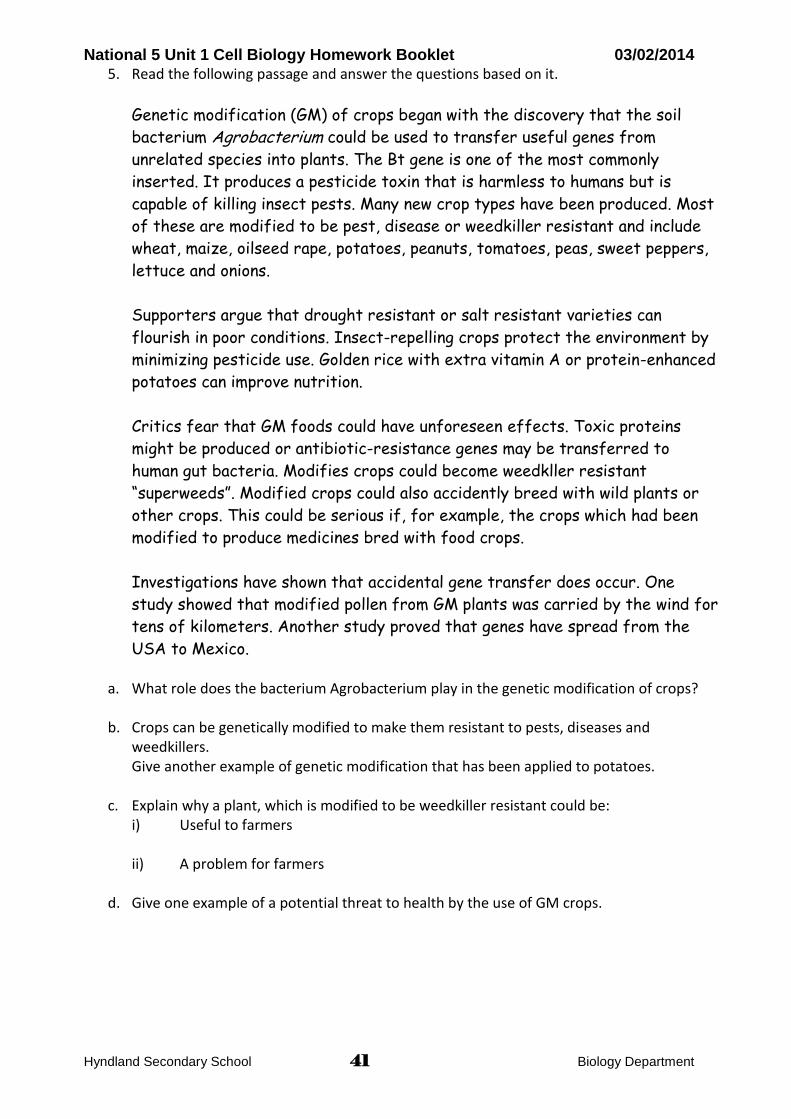
5. Read the following passage and answer the questions based on it.
Genetic modification (GM) of crops began with the discovery that the soil
bacterium Agrobacterium could be used to transfer useful genes from
unrelated species into plants. The Bt gene is one of the most commonly
inserted. It produces a pesticide toxin that is harmless to humans but is
capable of killing insect pests. Many new crop types have been produced. Most
of these are modified to be pest, disease or weedkiller resistant and include
wheat, maize, oilseed rape, potatoes, peanuts, tomatoes, peas, sweet peppers,
lettuce and onions.
Supporters argue that drought resistant or salt resistant varieties can
flourish in poor conditions. Insect-repelling crops protect the environment by
minimizing pesticide use. Golden rice with extra vitamin A or protein-enhanced
potatoes can improve nutrition.
Critics fear that GM foods could have unforeseen effects. Toxic proteins
might be produced or antibiotic-resistance genes may be transferred to
human gut bacteria. Modifies crops could become weedkller resistant
“superweeds”. Modified crops could also accidently breed with wild plants or
other crops. This could be serious if, for example, the crops which had been
modified to produce medicines bred with food crops.
Investigations have shown that accidental gene transfer does occur. One
study showed that modified pollen from GM plants was carried by the wind for
tens of kilometers. Another study proved that genes have spread from the
USA to Mexico.
a. What role does the bacterium Agrobacterium play in the genetic modification of crops?
b. Crops can be genetically modified to make them resistant to pests, diseases and weedkillers. Give another example of genetic modification that has been applied to potatoes.
c. Explain why a plant, which is modified to be weedkiller resistant could be: i) Useful to farmers
ii) A problem for farmers
d. Give one example of a potential threat to health by the use of GM crops.

National 5 Unit 1 Cell Biology Homework Booklet 03/02/2014
Hyndland Secondary School 42 Biology Department
Homework Revision Exercise 2 This exercise is designed to help you prepare for your interim assessment. It covers the new areas
since the previous test, the Online Revision exercise will also help. The test also includes material
from earlier sections (cell structure, diffusion & osmosis).
1. What other term describes cell division ?
2. What do the terms chromatid and centromere mean ?
3. Describe cell division by writing 5 key stages.
4. What is the role of the spindle fibres in cell division
5. From where in the cell do the spindle fibres form?
6. How many chromosomes would a human body cell contain?
7. If a cell divides every 12 hours, how many cells would a single cell produce after 6 days?
8. Why is it important that every cell receives the same number of chromosomes?
9. What is aseptic technique?
10. For cell or tissue culture a medium is used, what two components are included in this?
11. Explain the purpose of each component.
12. Name two factors which need to be controlled in cell culture.
13. Describe the difference between a chromosome and a gene?
14. State the base pairing rules for DNA.
15. Draw the structure of DNA nucleotide and name the three parts.
16. What job does mRNA do?
17. Where, precisely in the cell are proteins assembled?
18. What determines the function of a protein?
19. Name three different types of protein.
20. Give an example of a breakdown enzyme
21. Name a synthesis enzyme and write a word equation to describe its action.
22. What does the term specific mean ?
23. What is the optimum temperature for the activity of amylase in our body ?
24. What is the optimum pH for catalase in our body ?
25. Sketch a graph that illustrates how enzyme activity changes with temperature.
26. Describe the changes that occur if enzymes are heated above the optimum temperature.
27. What term is used to describe this change?
28. Explain why enzymes no longer work when heated above their optimum temperature.
29. Explain why enzymes have an optimum pH.
30. .What is genetic engineering and how are plasmids involved?
31. Give an example of a product made by genetic engineering.
32. Why do we often use Biological washing powders ? What two benefits do they offer.
33. In genetic engineering, how is the gene cut from the chromosome?
Web based revision:
34. 35. 36. 37. 38.
Cells Mitosis/Protein Synth. Enzymes Genetic Eng. Percentages

National 5 Unit 1 Cell Biology Homework Booklet 03/02/2014
Hyndland Secondary School 43 Biology Department
Photosynthesis
HWrkSht 1_19
1. An experiment was set up to measure the effect of light intensity on the rate of
photosynthesis in the water plant, Elodea. The light intensity was varied using a dimmer
switch on the bulb.
The rate of photosynthesis was measured by counting the number of bubbles released per
minute.
a) Name the gas collected.
The results of the experiment are shown in the table below.
b) Plot a line graph to show rate of photosynthesis against light intensity.
c) Using the data in the table, explain the results obtained at light intensities
greater than 8 units.
d) There are two reactions in photosynthesis. The first reaction is photolysis.
(i) Name the two substances produced by photolysis that are required for the
second reaction.
(ii) Name the second reaction.
e) Write the word equation for photosynthesis and underline the raw materials.
f) What do green parts store glucose as?
g) Glucose is converted into what structural carbohydrate?
/contd.

National 5 Unit 1 Cell Biology Homework Booklet 03/02/2014
Hyndland Secondary School 44 Biology Department
/contd.
2. The diagram shows a second investigation into the effect of carbon dioxide on
photosynthesis,
Destarched leaves were placed in flasks containing liquids as shown.
After 24 hours in well lit conditions, the leaves were tested for starch.
a) State in which flask(s) starch was present.
b) Name two factors which must be kept the same for A and B.
c) How should the apparatus shown in the diagram be improved to make sure the
experiment is valid?
d) A further experiment on photosynthesis was carried out.
After some time, the leaf disc floated to the surface. The disc floats up because
bubbles of a gas are produced in the leaf.
The time taken for this was measured.
The experiment was repeated five times.
e) Calculate the average time for the leaf disc to float.
f) Why was it good experimental technique to repeat the experiment 5 times?
g) Name the gas that caused the leaves to float.
h) Name the green chemical, found in leaves which converts light energy to chemical
energy

National 5 Unit 1 Cell Biology Homework Booklet 03/02/2014
Hyndland Secondary School 45 Biology Department
HWrkSht 1_20
1. The rates of photosynthesis and respiration in a green plant were measured over
a period of 24 hours.
The results are shown in the graph below.
(a) (i) At what time was the production of glucose at its maximum?
(ii) Between what two times was the plant producing more oxygen than it
was using?
(b) What substance traps the light energy required for photosynthesis?
(c) The diagram below represents a summary of part of the process of
photosynthesis.
Reaction
X
Name the following:
Reaction X; Substance Y; Substance Z
/contd.
Key
photosynthesis
respiration
ATP + hydrogen
Substance Y glucose
Substance Z
(structural
component of
cell walls?

National 5 Unit 1 Cell Biology Homework Booklet 03/02/2014
Hyndland Secondary School 46 Biology Department
/contd. 2. The diagrams below show the movement of carbon dioxide between green leaves of a
certain plant and the atmosphere in different light conditions over a 24 hour period.
Each arrow represents the direction of carbon dioxide movement between the leaf and the
atmosphere. The thicker the arrow, the greater the volume of carbon dioxide moving. The
carbon dioxide indicator has the colour changes shown below
a) What would the final colour of the indicator for each of the three tubes, A, B & C.
Show your answers in a table.
b) Describe the control tubes which would be needed before a valid conclusion could be
drawn.
c) When setting up the containers to investigate the movement of carbon dioxide, it was
decided that each container should be at the same temperature. The room
temperature varied between 9ºC and 22ºC. Describe how each container could be
kept at 25ºC.

National 5 Unit 1 Cell Biology Homework Booklet 03/02/2014
Hyndland Secondary School 47 Biology Department
HWrkSht 1_21
1. C
The apparatus above was used by a student in an experiment. The Elodea was exposed to
different light intensities and the rate of photosynthesis was estimated by counting the
number of bubbles of gas produced per minute.
Light Intensity (units) 0 1 2 3 4 5 6 7
Average number of bubbles produced per minute
0 7 14 20 25 27 27 27
a) Construct a line graph of the results.
b) Describe the effect on the rate of bubbling of increasing the light intensity from 5
to 7 units.
c) Suggest a method of changing the light intensity in this experiment.
d) The number of bubbles per minute at each light intensity was counted four times and
an average calculated.
Explain why this was good experimental technique?
e) Name the gas that forms the bubbles in this experiment.
/contd.
National 5 Unit 1 Cell Biology Homework Booklet 03/02/2014
Hyndland Secondary School 48 Biology Department
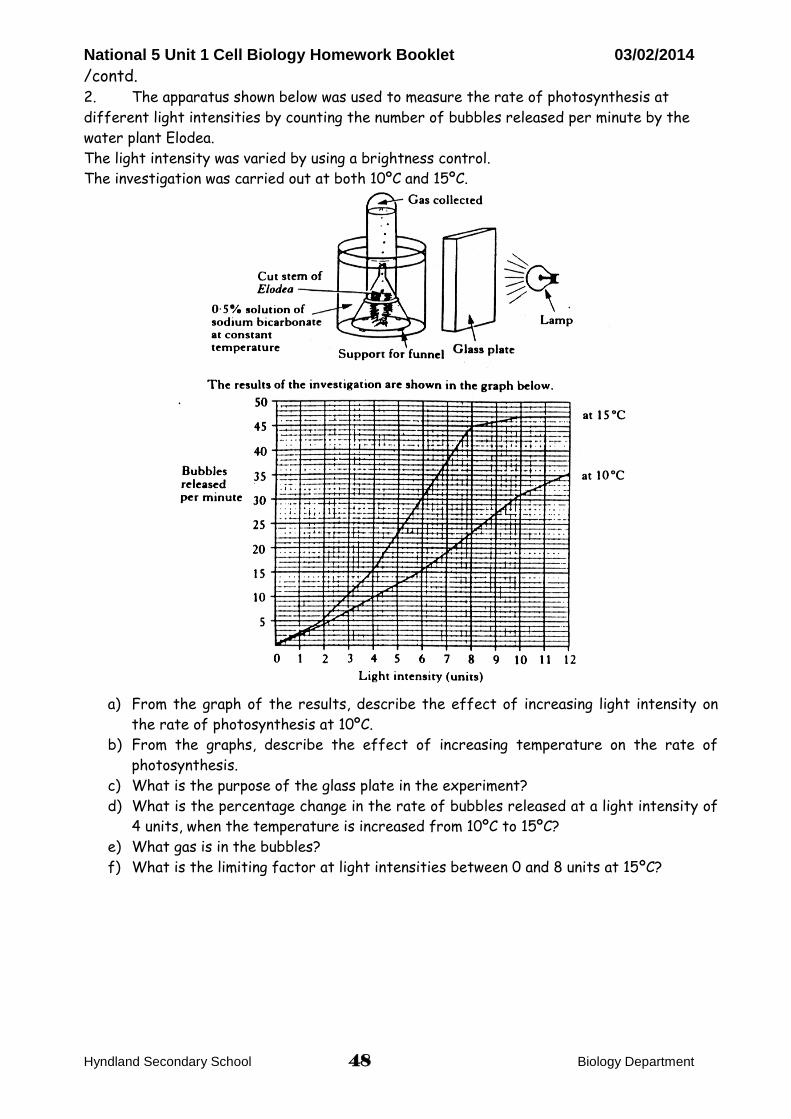
/contd. 2. The apparatus shown below was used to measure the rate of photosynthesis at
different light intensities by counting the number of bubbles released per minute by the
water plant Elodea.
The light intensity was varied by using a brightness control.
The investigation was carried out at both 10ºC and 15ºC.
a) From the graph of the results, describe the effect of increasing light intensity on
the rate of photosynthesis at 10ºC.
b) From the graphs, describe the effect of increasing temperature on the rate of
photosynthesis.
c) What is the purpose of the glass plate in the experiment?
d) What is the percentage change in the rate of bubbles released at a light intensity of
4 units, when the temperature is increased from 10ºC to 15ºC?
e) What gas is in the bubbles?
f) What is the limiting factor at light intensities between 0 and 8 units at 15ºC?

National 5 Unit 1 Cell Biology Homework Booklet 03/02/2014
Hyndland Secondary School 49 Biology Department
HWrkSht 1_22
1. A gardener grew a crop of peas in a polythene tunnel.
a) State two conditions that could limit the rate of photosynthesis in the pea
plants.
b) The graph below shows the mass of sugar in the leaves and the concentration
of carbon dioxide just above the pea plants at different times of the day.
concentration of carbon dioxide above the leaves
mass of sugar in the leaves
(i) For how many hours did the carbon dioxide concentration decrease?
(ii) Explain this decrease in carbon dioxide concentration.
(iii) Explain why the mass of sugar in the leaves is as its maximum at 1600.
(iv) Calculate the percentage increase in sugar in the leaves between 0400 and
1600.
(v) Give two reasons why the mass of sugar decreases between 2000 and 0000.

National 5 Unit 1 Cell Biology Homework Booklet 03/02/2014
Hyndland Secondary School 50 Biology Department
Respiration HWrkSht 1_23
The diagram shows a method used to investigate the energy content of a variety of foods.
The rise in temperature can be used to calculate the energy content of each food in
kilojoules.
The results are shown in the table.
a) Draw a bar chart using the data in the table
b) State two factors, not already mentioned, that should be kept constant for a valid
comparison to be made between the foods.
c) Suggest why the energy contents found in the investigation might not have been as
high as expected.
d) Express as a simple whole number ratio the energy content of apple to fish.
The energy content of each food was calculated using the following formula.
Energy content (kilojoules) = temperature rise × 0.21
e) Calculate the energy content of 1g of chicken, if it raised the temperature of the
water by 30 °C.
f) Give one reason, other than providing heat, why cells need energy from food.
g) Which component of food provides most energy per gram?
/contd.

National 5 Unit 1 Cell Biology Homework Booklet 03/02/2014
Hyndland Secondary School 51 Biology Department
/contd.
2. The diagram below shows part of an investigation into the effect of adding three
different concentrations of ATP solution to three pieces of muscle.
Equal volumes of the ATP solutions were added to the pieces of muscle.
a) The results are shown in the following table.
(i) Calculate the percentage decrease in length of the muscle with 10 g per litre
ATP solution.
(ii) In this experiment why it is necessary to use percentage decrease in length in
the comparison of the results?
(iii) Explain why three different syringes should be used in this investigation.
(b) Muscle cells use a lot of energy for contraction. What would be present in great
numbers in the muscle cells?
Concentration of ATP solution
(g per litre)
Length of muscle
At start (mm)
After 10 minutes
(mm)
Decrease (mm)
Percentage decrease
1 35 34.3 0.7 2
5 50 46 4 8
10 40 33 7

National 5 Unit 1 Cell Biology Homework Booklet 03/02/2014
Hyndland Secondary School 52 Biology Department
HWrkSht 1_24
1. An investigation was carried out into the effect of temperature on the rate of
respiration by yeast.
Details of the apparatus, method used and results are given below.
Apparatus
Method
1 Water baths were set up over a range of temperatures.
2 100cm3 of glucose solution and 50cm3 of yeast suspension were allowed to reach the same
temperature as the water bath.
3 The glucose solution and the yeast suspension were mixed in the reaction flask.
4 After 1 hour, the volume of gas in the measuring cylinder was measured.
Results
a) Ethanol was formed in the reaction flask. What cell process produced this?
b) A layer of oil was placed over the surface of the liquid in the reaction flask. What
was the purpose of this layer of oil?
c) Describe the relationship between the temperature and the volume of gas produced
in one hour.
d) Predict the volume of gas which would be collected in one hour if the investigation
was repeated at 60 °C. Give an explanation for your answer.
e) Describe the control flasks that would be set up to show that the gas was produced
due to activity of the yeast and to no other factor.
f) What was the percentage increase in the volume of gas produced as the temperature
was increased from 10°C to 30°C?
g) What was the percentage decrease in the volume of gas produced as the temperature
was increased from 40°C to 50°C?
h) Use the results to draw a line graph to show the volumes of gas produced in one hour
over the range of temperatures.
/contd.

National 5 Unit 1 Cell Biology Homework Booklet 03/02/2014
Hyndland Secondary School 53 Biology Department
/contd.
2. Read the following passage and answer the questions below, based on it.
a) From the passage identify three factors which contribute to the risk of heart
disease.
b) According to Dr. Ford, why is it important that “good habits should start early?
c) What cellular process is being referred to in the phrase “you must burn more
energy”?
d) Copy and complete the table below to show the changes in death rates for the whole
population and for the 35-54 age group.

National 5 Unit 1 Cell Biology Homework Booklet 03/02/2014
Hyndland Secondary School 54 Biology Department
Homework Revision Exercise 3 This exercise is designed to help you prepare for your interim assessment. It covers most of the new
areas covered since the previous test. The Online Revision exercise will cover any remaining parts of
the course not previously tested. The test will also include material from earlier sections.
1. What is the first stage in photosynthesis called?
2. What two products are made in this process?
3. What function does each of these have in the second stage of photosynthesis?
4. Draw a summary diagram showing the reactions of the first stage of photosynthesis.
5. In photolysis, what substance is split to release oxygen?
6. Why do root cells in plants have no chloroplasts?
7. What is the second stage of photosynthesis called?
8. What is produced in the second stage of photosynthesis?
9. How do plants store this substance?
10. Name the substance found in chloroplasts that traps light energy.
11. Name the substance produced by plants that is a structural carbohydrate.
12. Name 3 limiting factors in photosynthesis.
13. Does oxygen diffuse in to, or out of cells?
14. When do plants respire?
15. How could you tell if the rate of photosynthesis was equal to respiration?
16. What is the main difference between osmosis and diffusion ?
17. If you put a potato cylinder in very salty water, would the potato gain or lose water?
18. If you put the same potato into distilled water, would the potato gain or lose water?
19. What do you call a plant cell that has gained water?
20. What happens to an animal cell when it is placed in distilled water?
21. Is distilled water hypotonic, or hypertonic to a red blood cell?
22. What happens to a red blood cell in a high salt (hypertonic) solution?
23. Why would you dry a potato cylinder before weighing it in the osmosis experiment?
24. How can you increase the reliability of experimental results?
25. What effect would amylase have on hydrogen peroxide?
26. What is the substrate for an enzyme?
27. What is the product of the action of the enzyme phosphorylase?
28. What substrate does pepsin work on?
29. A cell has a lot of mitochondria, what does this indicate?
30. Each enzyme works best at a specific pH. What do you call this pH?
31. What enzyme works in the stomach at an optimum pH of around pH3?
32. What is the optimum temperature for ALL human enzymes?
33. What happens to an enzyme if heated to too high a temperature?
Web based revision:
Photosynthesis All other Sections Ratios Percentages

National 5 Unit 1 Cell Biology Homework Booklet 03/02/2014
Hyndland Secondary School 55 Biology Department
HWrkSht 1_25
1. The experiment shown below was set up to demonstrate aerobic respiration in peas
that are germinating (starting to grow).
After two days, the level of liquid had risen in tube Y but had not risen in tube X.
a) Explain the purpose of A as a control in this experiment.
b) Predict the effect on the level of the liquid in tube Y if a greater mass of peas is
used.
c) What happens to the volume of gas in test tube B? Explain why this change occurs.
d) Explain why the liquid in tube Y rises in this experiment.
e) The following list contains some features of aerobic and anaerobic respiration
in germinating peas.
List
W Does not use oxygen
X Produces carbon dioxide
Y Yields 38 molecules of ATP per glucose molecule
Z Produces ethanol
Copy and complete the table below by writing the letters from the list in the correct
columns.
Each letter may be used once or more than once.

National 5 Unit 1 Cell Biology Homework Booklet 03/02/2014
Hyndland Secondary School 56 Biology Department
2. The diagram shows an industrial fermenter. It is fitted with a number of taps which
allow substances to be added or removed.
(a) Which of the taps, A, B, C, D or E, would open to
(i) add nutrients to the mixture?
(ii) remove waste gases?
(iii) drain off the products?
b) The fermenter should be kept at 35 °C. Explain why the water jacket around the
fermenter needs to be cold.
Barley malt extract, water and yeast were placed in the fermenter and left for several days.
The rate of fermentation was measured and the results are shown in the graph below.
c) Describe the changes in the rate of fermentation over the ten days.
d) Suggest a reason for the change in the rate of fermentation between points A and B.
e) A temperature probe in the fermenter malfunctioned and the temperature exceeded
70°C. The yeast died and fermentation stopped. Explain why fermentation stopped.

National 5 Unit 1 Cell Biology Homework Booklet 03/02/2014
Hyndland Secondary School 57 Biology Department
Homework Revision Exercise 4
This exercise is designed to help you prepare for your Unit assessment. The Online Revision exercise
will also help. The test will also include material from all sections covered to date.
1. What is this ? Sugar (glucose) + Oxygen ENERGY + carbon dioxide + water.
2. Name 3 things that humans need energy for.
3. What 3 things can be measured to show that respiration has occurred?
4. What does the word “aerobic” mean?
5. What does the word “anaerobic” mean?
6. Where does the energy released in respiration end up?
7. What is the first pathway in respiration called?
8. What substance is produced by one glucose molecule in glycolysis?
9. How many ATP are produced in glycolysis?
10. How many ATP are produced in the complete aerobic breakdown of one molecule of
glucose?
11. What does ATP break down into?
12. How many ATP are produced in anaerobic respiration?
13. Anaerobic respiration in muscle cells produces what?
14. Anaerobic respiration in plant cells produces what?
15. In which of these organisms is the processes reversible, animals or plants?
16. Name 5 structures that all plant and animal cells contain?
17. What are the 3 structures that are also found in green plant cells?
18. What is the function of the cell wall in a plant cell?
19. How do the cell walls of a bacteria and plant cell differ?
20. What do you call the jelly-like substance where chemical reactions take place?
21. What is the function of the nucleus in a cell?
22. What is the function of the cell membrane?
23. What is contained in the vacuole in plant cells?
24. What type of organism is yeast?
25. How do bacteria and yeast differ?
26. Which kind of micro-organism is involved in yoghurt making?
27. Which type of micro-organism is involved in brewing and baking?
28. What one word is given to a plant cell that has lost water and shrunk?
29. Enzymes are biological catalysts. What do catalysts do?
30. What effect would catalase have on hydrogen peroxide?
31. What is the enzyme that breaks down starch called?
32. What does phosphorylase do to glucose-1-phosphate?
33. Enzymes are substrate specific. What does this mean?
Web based revision:
Respiration Industry All other Sections Ratios Percentages
Top Related