


Languages
Pages
Legal

Hydro-meteorological Analysis of Langtang Khola Catchment, Nepal
Tirtha R. Adhikari1, Lochan P. Devkota1, Suresh .C Pradhan2, Pradeep K. Mool3
1Central Department of Hydrology and Meteorology TribhuvanUniversity2Department of Hydrology and Meteorology, Nagpokhari, Nepal3International Centre for Integrated Mountain Development, Lalitpur, Nepal

Contents
• Introduction and Background
• Objective of the study
• Study area
• Meteorological information
• Hydrological information
• Old snow survey information
• Methodology for flow simulation by SRM
• Future work

Introduction and Background
• Water is main natural resource of Nepal, socio-economy of the country through hydro-electricity and irrigation depends on it
• The current global mean temperature is projected to riseby 0.3 to 4.8 °C by the late-21st century ( IPCC, 2013)
• Due to increase of temperature water cycle is intensifiedcausing an increase in global mean precipitation (IPCC,2013)
• At the same time, there is redistribution causing someareas to receive more or less precipitation depending onthe season (IPCC, 2013)
9/11/2015 3
contd …
• High variability in climate, lack of data, large uncertainties inclimate change projection by models and uncertainty aboutthe response of snow and glaciers
9/11/2015 4

Objective
• The main objective: Impact of climate change on flow simulation specially to understand the contribution of snow melt at Langtang Khola Hydrological Station

Data collection
Hydro-meteorological data are collection from DHM, government of Nepal, DHM is initiated snow and glacier hydrological activities in the year 1987 with the GTZ, Germany as a pilot project for 2 years. Full fledge project was started in the year 1990 and completed in 1997.
Introduced tracer technology for determination of river discharge andEstablished a tracer laboratory
6 hydroclimatic stations were established in high Himalayas of Nepal
During the project period:
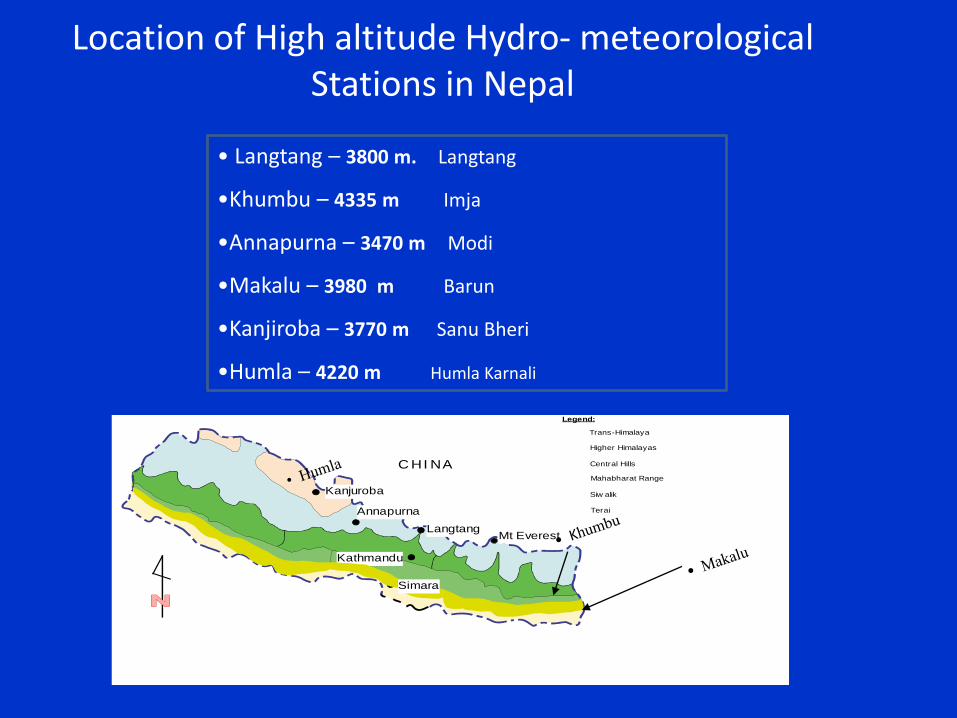
Location of High altitude Hydro- meteorological Stations in Nepal
0 100 200
Kilometers
Trans-Himalaya
Higher Himalayas
Mahabharat Range
Siw alik
Terai
Central Hills
Legend:
Kathmandu
C HI NA
Langtang
Annapurna
Kanjuroba
Simara
Mt Everest
• Langtang – 3800 m. Langtang
•Khumbu – 4335 m Imja
•Annapurna – 3470 m Modi
•Makalu – 3980 m Barun
•Kanjiroba – 3770 m Sanu Bheri
•Humla – 4220 m Humla Karnali
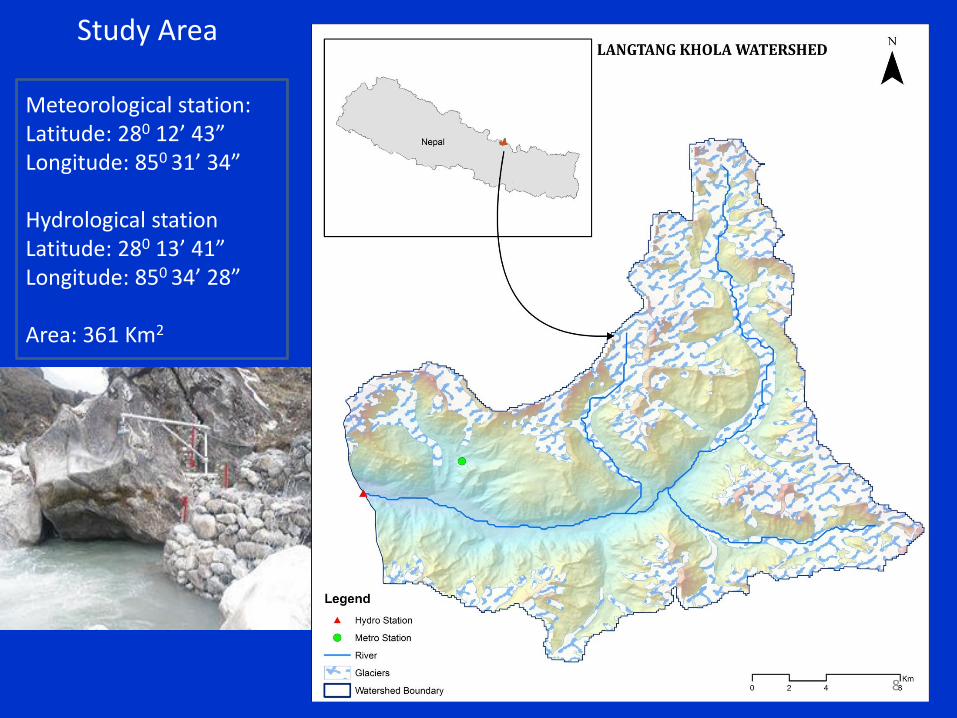
Study Area
Meteorological station:Latitude: 280 12’ 43”Longitude: 850 31’ 34”
Hydrological stationLatitude: 280 13’ 41”Longitude: 850 34’ 28”
Area: 361 Km2
8

Meteorology of Langtang Khola Kyangjing

Precipitation data information
166
30
20
40
60
80
100
120
140
160
180
200
0
20
40
60
80
100
120
140
160
180
200
Jan Feb Mar Apr May Jun Jul Aug Sep Oct Nov Dec
Co
effe
. of
vari
atio
n
PP
T (m
m)
Month
Kyangjing Average Monthly PPT and its Variations (1988-2014)
Avarage PPT (mm) Coeff of Vearation

Percentage of Seasonal PPT (1988-2014)
76 % of PPT occurs in monsoon season
5% of PPT occurs in winter season
11
4 %
15 %
76 %
5 %
DJF
MAM
JJAS
ON
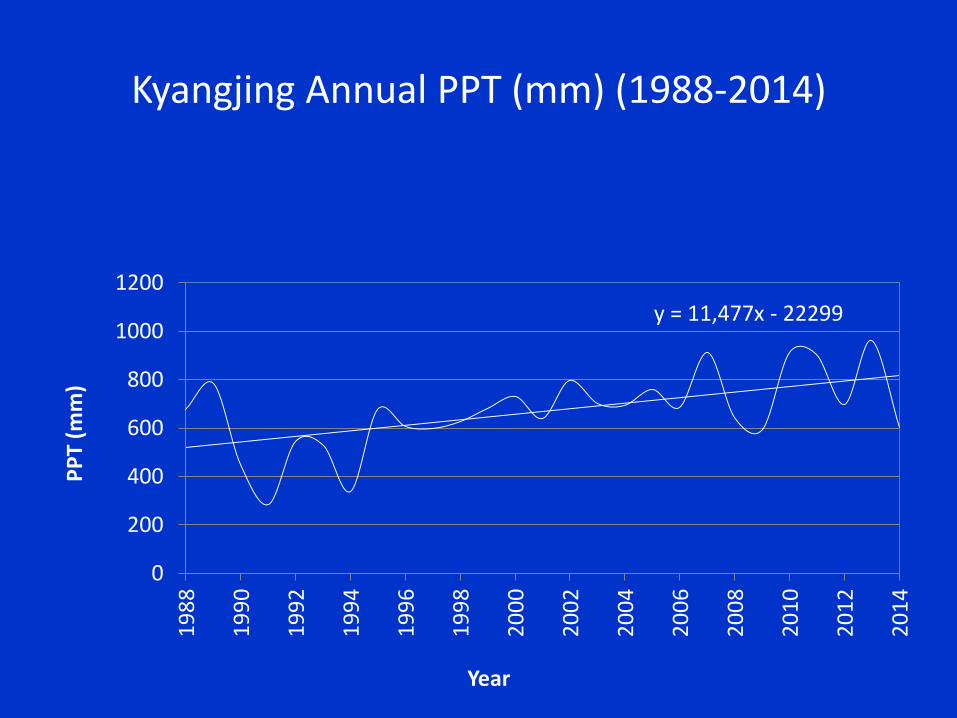
y = 11,477x - 22299
0
200
400
600
800
1000
1200
19
88
19
90
19
92
19
94
19
96
19
98
20
00
20
02
20
04
20
06
20
08
20
10
20
12
20
14
PP
T (m
m)
Year
Kyangjing Annual PPT (mm) (1988-2014)

Monthly Average Rainy Days (1988-2014)
26
1
0
5
10
15
20
25
30
Jan Feb Mar Apr May Jun Jul Aug Sep Oct Nov Dec
Rai
ny
Day
s
Month

Kyagjing Annual Rainy Days (1988-2014)
0
20
40
60
80
100
120
140
160
19
88
19
90
19
92
19
94
19
96
19
98
20
00
20
02
20
04
20
06
20
08
20
10
20
12
20
14
Rai
ny
Day
s
Year

Monthly Average Temperature (1988-2008)
Warmest is July, the average TMAX is 12.3 0C
Coldest is Feb, the average TMIN is 7.2 0C
Jan Feb Mar Apr May Jun Jul Aug Sep Oct Nov Dec
Mean Temp. 0C -1,9 -2,4 0,5 3,4 6,0 8,3 9,9 9,4 7,9 4,5 1,8 0,2
Maximum Temp. 0C 3,1 2,4 5,2 8,0 10,0 11,4 12,3 11,9 10,7 8,5 6,4 5,2
Minimum Temp. 0C -7,0 -7,2 -4,2 -1,3 1,9 5,2 7,5 6,9 5,0 0,5 -2,8 -4,8
-10,0
-5,0
0,0
5,0
10,0
15,0
Tem
pre
atu
re(
0C
)
15
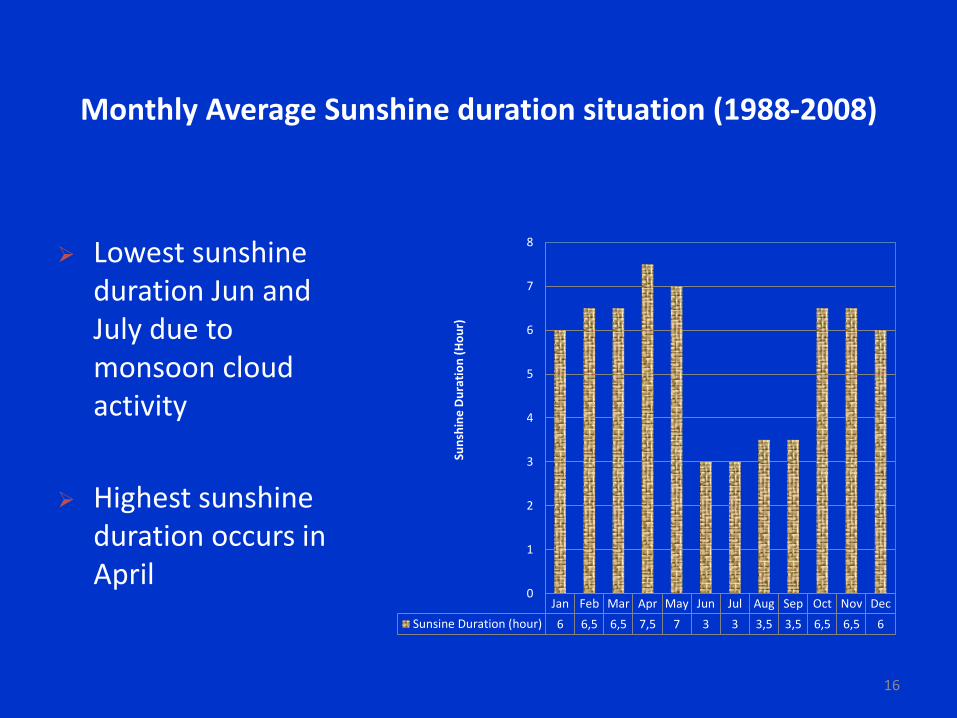
Monthly Average Sunshine duration situation (1988-2008)
Lowest sunshine duration Jun and July due to monsoon cloud activity
Highest sunshine duration occurs in April
Jan Feb Mar Apr May Jun Jul Aug Sep Oct Nov Dec
Sunsine Duration (hour) 6 6,5 6,5 7,5 7 3 3 3,5 3,5 6,5 6,5 6
0
1
2
3
4
5
6
7
8
Sun
shin
e D
ura
tio
n (
Ho
ur)
16

Historical Snow Measurements in Langtang valley
Snow measurements work in Feb,1991Department of Hydrology and Meteorology, Governments of Nepal

Historical Snow Measurement Data
Date: 25 Feb 1991 Plce Tsergo-Ri Langtang
Height 4980 m Time15 PM
Exposition SE Air Temperature -80C
Slope Gentile Weather Cloudy
Level 1 Height cm 1 WE (mm) 2 Height (cm) 2 WE (mm) 2 Height (cm) 3 WE (mm)4 Mean density
(g/cm3 )
1 28 59 29 62 29 60 0.21
2 47 198 47 202 47 194 0.42
3 40 170 42 180 40 172 0.42
Sum 115 427 118 444 116 426 0.37
WE = D* h* 10 Density = WE/(h*10)
Hydrology of Langtang Khola

Validity
Rating Curve No. From To
1 01.01.1991 13.06.1993
2 14.06.1993 08.10.1993
1 09.10.1993 29.04.1997
2 30.04.1997 05.04.1999
1 06.04.1999 04.06.2002
3 05.06.2002 13.09.2002
2 14.09.2002 31.12.2006
0
0,5
1
1,5
2
2,5
3
0 5 10 15 20 25 30 35
Ga
ug
e H
eig
ht
(m)
Discharge (cumec)
Rating Curve of Langtang Khola
Rating Curve - 1:
Q = 2.429(H+0.568)2.126
Rating Curve - 3:
Q = 0.654(H+1.889)2.530
Rating Curve - 2:
Q = 0.632(H+1.562)2.716

0,00
0,25
0,50
0,75
1,00
1,25
1,50
1,75
2,00
2,25
2,50
2,75
3,00
2,50 5,00 7,50 10,00 12,50 15,00 17,50 20,00 22,50 25,00
Stag
e H
eig
ht
(m)
Discharge (m3/s)
Rating Curve of Langtang Khola (2006 - 2013)
Q = 1.943(H + 0.501)^2.188

0,00
0,50
1,00
1,50
2,00
2,50
1-J
an-1
31
1-J
an-1
32
1-J
an-1
33
1-J
an-1
31
0-F
eb-1
32
0-F
eb-1
32
-Mar
-13
12
-Mar
-13
22
-Mar
-13
1-A
pr-
13
11
-Ap
r-1
32
1-A
pr-
13
1-M
ay-1
31
1-M
ay-1
32
1-M
ay-1
33
1-M
ay-1
31
0-J
un
-13
20
-Ju
n-1
33
0-J
un
-13
10
-Ju
l-1
32
0-J
ul-
13
30
-Ju
l-1
39
-Au
g-1
31
9-A
ug-
13
29
-Au
g-1
38
-Se
p-1
31
8-S
ep-1
32
8-S
ep-1
38
-Oct
-13
18
-Oct
-13
28
-Oct
-13
7-N
ov-
13
17
-No
v-1
32
7-N
ov-
13
7-D
ec-1
31
7-D
ec-1
32
7-D
ec-1
3
Wat
er
leve
l (m
)
Langtang Khola Stage Height (m)_2013
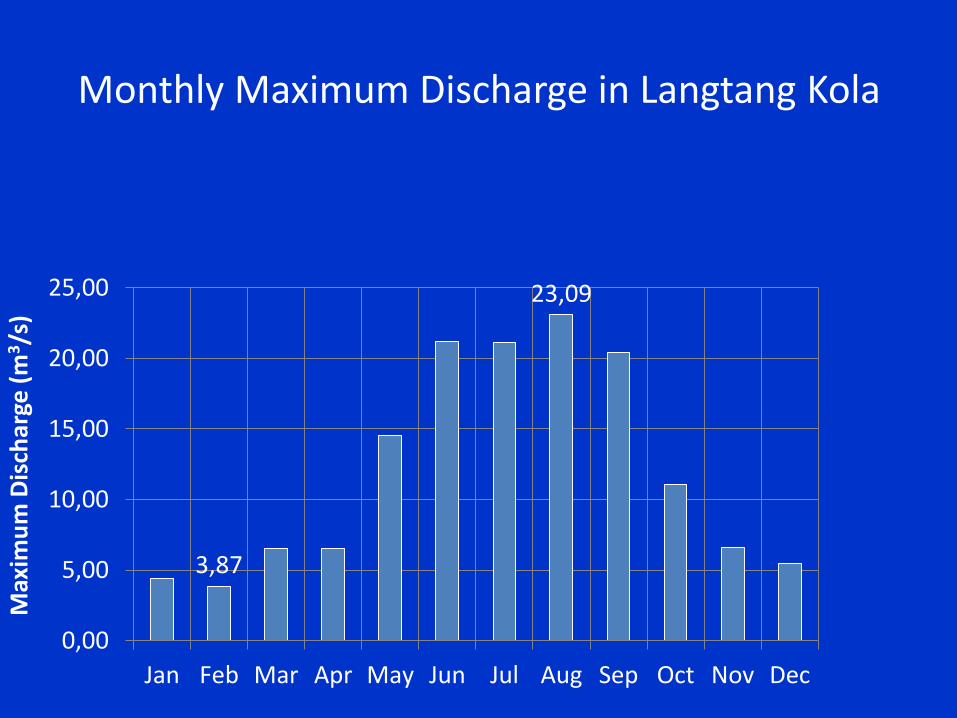
Monthly Maximum Discharge in Langtang Kola
3,87
23,09
0,00
5,00
10,00
15,00
20,00
25,00
Jan Feb Mar Apr May Jun Jul Aug Sep Oct Nov Dec
Max
imu
m D
isch
arge
(m
3/s
)
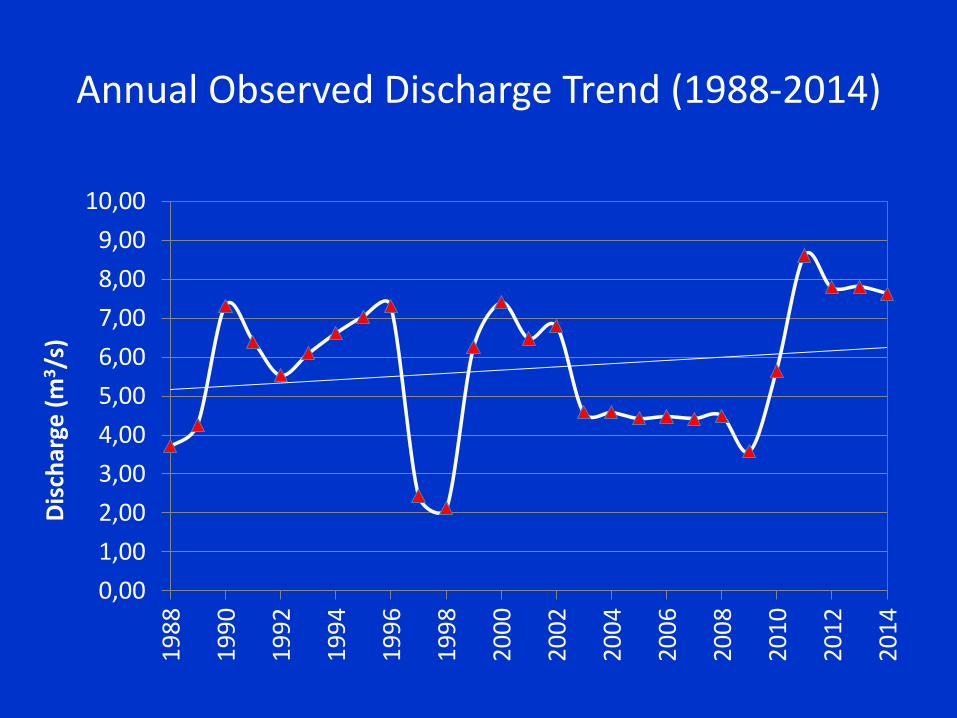
Annual Observed Discharge Trend (1988-2014)
0,00
1,00
2,00
3,00
4,00
5,00
6,00
7,00
8,00
9,00
10,001
98
8
19
90
19
92
19
94
19
96
19
98
20
00
20
02
20
04
20
06
20
08
20
10
20
12
20
14
Dis
char
ge (
m3/s
)

Methodology for flow simulation by Snowmelt Runoff Model (SRM)
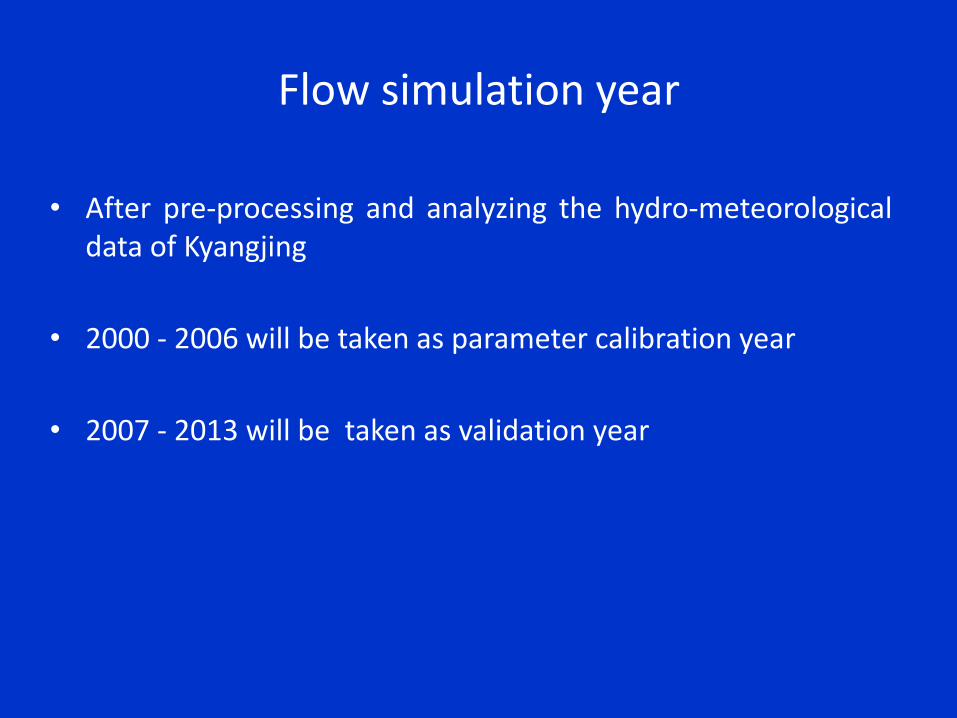
Flow simulation year
• After pre-processing and analyzing the hydro-meteorologicaldata of Kyangjing
• 2000 - 2006 will be taken as parameter calibration year
• 2007 - 2013 will be taken as validation year

Introduction to Snowmelt Runoff Model (SRM)
Developed by Martinec in 1975 in Swiss Snow and AvalancheResearch Institute
Estimation of daily stream flow in Mountain basins
Based on degree day method, can be used tosimulate/forecast
Simple and Efficient
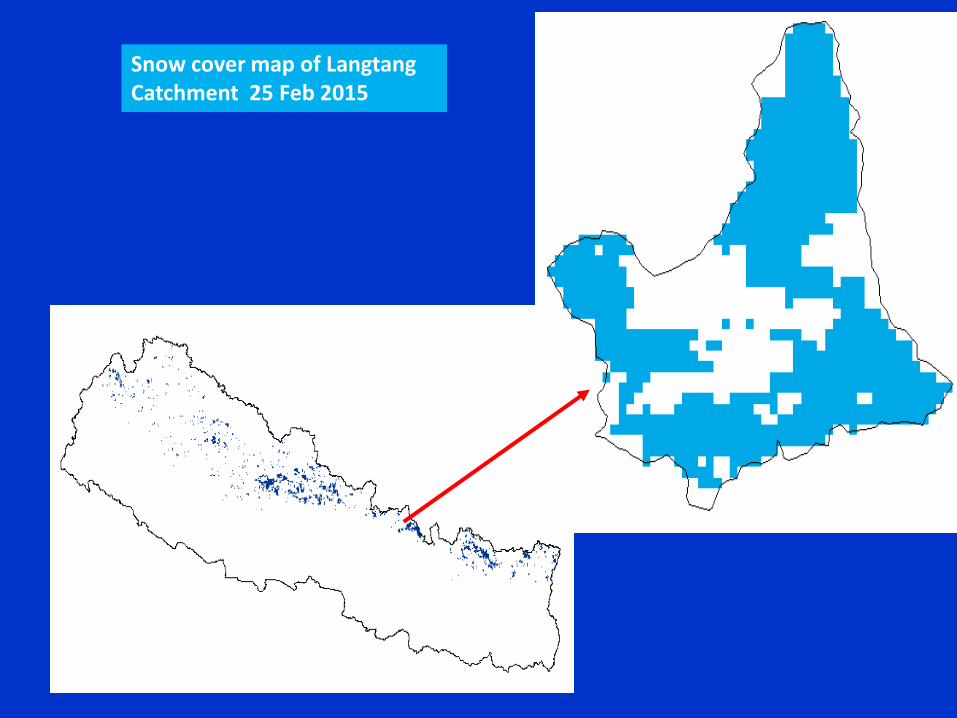
Snow cover map of Langtang Catchment 25 Feb 2015

Snow Cover Mapping of Langtang
•MODIS Daily Snow products
•Preprocessing and processing of MODISsnow products using : MODIS Reprojectiontool
•Which includes;
Mosaicking
Spatial and temporal filtering
Generation of daily snow cover area ofLangtang Catchment

Basic snowmelt runoff model
Qn+1 = [cSn . an (Tn + Tn) Sn + cRn . Pn] (A.10000/86400) (1-kn+1) + Qn kn+1
Snow melt Rainfall Flow Recession
Q : Basin discharge
n : Day indicator
T : Air temperature
P : Precipitation falling as rain
S : Snow covered area
A : Zonal area
kn+1: Recession coefficient
an : Degree day factor
csn,crn : correction for losses due to snowmelt and rainfall

Variables (Inputs)
Temperature PrecipitationSnow Covered
Area %
Cont….
Meteorological Stations
Measured Forecasted
MODIS Snow product
Cont…
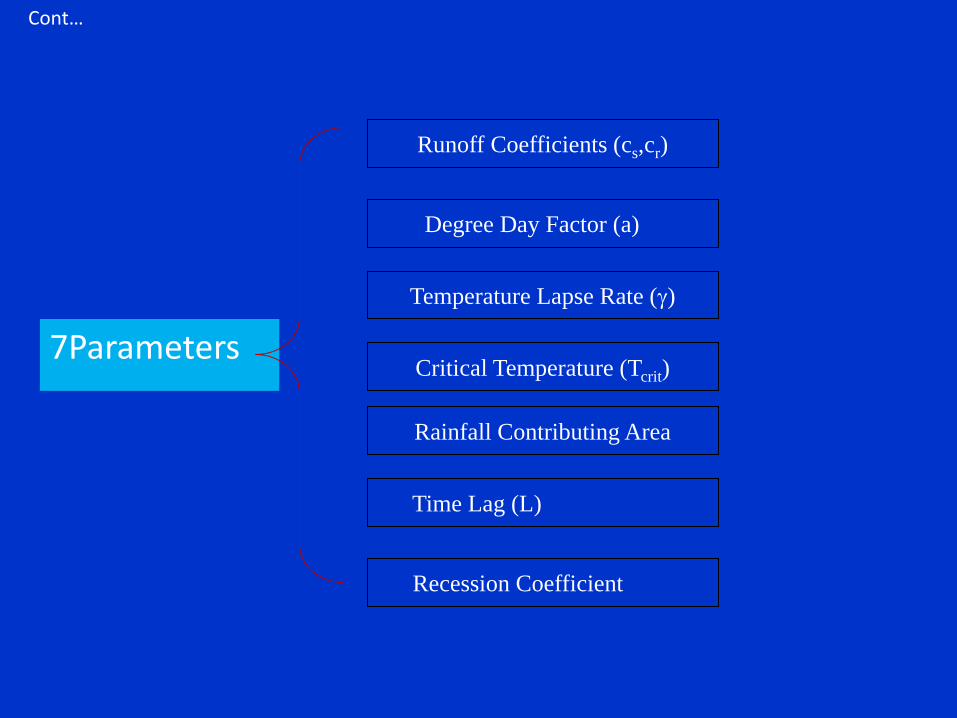
7Parameters
Runoff Coefficients (cs,cr)
Degree Day Factor (a)
Temperature Lapse Rate ()
Critical Temperature (Tcrit)
Rainfall Contributing Area
Time Lag (L)
Recession Coefficient

Future work
• Calibration and Validation of SRM
• Simulate daily discharge
• Calculating runoff components in Langtang Catchment
• The research is still going on

Thank You
Top Related