


Languages
Pages
Legal


1612?
Human Capital Development
HCDWorking Papers
The Disability-Adjusted Life Year (DALY)Definition, Measurement and Potential Use
Nura Homedes.
July 1996
HCDWP 68
Pub
lic D
iscl
osur
e A
utho
rized
Pub
lic D
iscl
osur
e A
utho
rized
Pub
lic D
iscl
osur
e A
utho
rized
Pub
lic D
iscl
osur
e A
utho
rized
Pub
lic D
iscl
osur
e A
utho
rized
Pub
lic D
iscl
osur
e A
utho
rized
Pub
lic D
iscl
osur
e A
utho
rized
Pub
lic D
iscl
osur
e A
utho
rized

Papers in this series are not formal publications of the World Bank. They present preliminary and unpolished results ofanalysis that are circulated to encourage discussion and comment; citation and the use of such a paper should take account of itsprovisional character. The findings, interpretations, and conclusions expressed in this paper are entirely those of the author(s)and should not be attributed in any manner to the World Bank, to its affiliated organizations, or to members of its Board ofExecutive Directors or the countries they represent.

The Disability-Adjusted Life Year (DALY)Definition, Measurement and Potential Use*
byNulia Homedes

* This paper is based on a presentation made at the European Bioethics conference that took place in
October 1995 at the "Institut Borja de Bioetica" in Sant Cugat del Valles, Spain. The examples have
been written by Cesar Revoredo.

Abstract
The 1993 World Development Report (WDR), "Investing in Health," used the DisabilityAdjusted Life Year (DALY) to measure the state of health of a population and, together with theconcept of cost-effectiveness, to judge which interventions to improve health deserve the highestpriority for action. The Disability Adjusted Life Year is the only quantitative indicator of burden ofdisease that reflects the total amount of healthy life lost, to all causes, whether from prematuremortality or from some degree of disability during a period of time. This paper describes themethodology used in the WDR to calculate DALYs and how they can be used for setting healthservice priorities.


Contents
Values Incorporated in the DALY Indicator ..................................................... 2
Procedure to Calculate DALYs..4
Case 1: DALYs Lost Due to Immediate Death ................................................... 5
Case 2: DALYs Lost Due to Death Following Disability ................................................... 6
Case 3: DALYs Lost Due to Permanent Disability .................................................... 8
Case 4: DALYs Lost Due to Disability Followed by Complete Recovery ........................................8
Data Needed to Estimate the Burden of Disease ..................................................... 9
Cost-Effectiveness ..................................................... 10
Data Needed to Estimate Cost-Effectiveness ..................................................... 12
Conclusion ..................................................... 13
References .................................................... 16


The principal suggestion of the 1993 World Development Report (WDR) "Investing in Health'
(World Bank, 1993) is to define a package of essential health services, where everything not specified
in the package is considered discretionary. The package should never include a less cost-effective
intervention if a more cost-effective one is not financed. The line between the essential and
discretionary interventions is drawn primarily on the basis of their cost-effectiveness. Exactly where
the line is drawn can not be derived from the methodology, it must depend, among other things, on the
country's epidemiological situation and on the willingness and ability to pay for health care.
To measure the state of health of a population and, together with the related concept of cost-
effectiveness, to judge which interventions to improve health deserve the highest priority for public
action, "Investing in Health" makes extensive use of the concept of the Disability-Adjusted Life Year
(DALY). The DALY has emerged as a measure of the burden of disease and it reflects the total
amount of healthy life lost, to all causes, whether from premature mortality or from some degree of
disability during a period of time. These disabilities can be physical or mental. The intended use of the
DALY is to assist (i) in setting health service priorities; (ii) in identifying disadvantaged groups and
targeting of health interventions; and (iii) in providing a comparable measure of output for intervention,
program and sector evaluation and planning.
The number of DALYs estimated at any moment reflect the amount of health care already
being provided to the population, as well as the effects of all other actions which protect or damage
health. Where treatment is possible---whether preventive, curative or palliative-the effectiveness of
the intervention is the reduction in disease burden which the treatment produces. Effectiveness is
measured in the same units (DALYs) as disease burden, and so can be compared across interventions
which treat different problems and produce different outcomes. In other words, the DALY can be
used to measure the gains in health attributable to different actions and add them up.
The proponents of the DALY use this measure for two purposes: (i) to measure the burden of
disease, and (ii) to increase the allocative efficiency of the sector by identifying health interventions that,
for a given budget, will purchase the largest improvement in health, as measured by the burden of
disease indicator (DALY).

2
Values Incorporated in the DALY Indicator
The five key social preferences or values that are incorporated into the indicator of burden of
disease "DALY" are the following:
* Duration of time lost due to a death at each age, which is used to measure years of life
lost due to premature mortality (or the number of years of life gained by averting death).
This measurement requires defining the potential limit of life; in the case of DALYs,
standard years of life lost are used. The standard has been chosen to match the highest
national life expectancy observed, which is that of Japanese women (82 years). For a
specific standard, the expectations are based on model life-table West Level 26, which has
a life expectancy at birth for females of 82.5. The potential life expectancy at birth for
males has been set at 80.1
• Disability weights or degrees of incapacity or suffering associated with different non-fatal
conditions, which are necessary to make comparisons across diseases, as well as for
comparing time lived with a disability with time lost due to premature mortality. Six
disability classes measuring the extent of loss of physical functioning associated with a
certain condition were defined. Subsequently, a group of independent experts established a
weight, ranging from 0 (perfect health) to 1 (death), for each of the six disability classes.2
* Age-weights, which indicate the relative importance of healthy life at different ages. The
age weights used in the World Bank report rise from birth until age 25 and decline slowly
1 The average gender differences in life expectancy at birth in low mortality populations is 7.2 years. Not all of thisdifference is biological; a large share is due to injuy deaths among young males and higher levels of risk factors such assmoking In high income groups in low-mortality population this gap narrows. Projecting this forward, the ultimnate gapin the life expectancy at birh between the sexes is likely to approach 2 or 3 years; that is, life expectancy for men would bearound 80 years.
2 Note that the disability weights do not take account of the way in which individual and social resources compensate forthe level of disability experienced.

3
thereafter. According to the World Health Organization (1994), the formula to calculate
those weights is:
Age - Weighting Function = Cx e1 *
Where:
C = Constant equal to 0.16243.B Constant equal to 0.04.x Age.e Constant equal to 2.71
Tinme preference, which is the value of health gains today compared to the value attached
to health gains in the future (in standard economic theory, the latter is assumed to be lower
than the former). It is standard practice in economic appraisal of projects to use the
discount rate to discount benefits in the future. The process of discounting future benefits
converts them into net present-value terms; these benefits can then be compared with
project costs (also discounted if they are spread over more than one year) to determine
cost-effectiveness.
The discount rate used in the DALY formula is 3 percent.3 The formula to discount for
time preference is:
Discounting Function = e<xa)
Where:
r = Discount rate, fixed at 0.03x = Age.e = Constant equal to 2.71a = Onset year.
* Health is simply aded across individuals That is, two people each losing 10 years of
disability-free life are treated as the same loss as one person losing 20 years. One could
3 Choices of age distinctions and discount rates express people's feelings about the value of time lived at different ages(age weghts) and time periods, that is in the future versus today (discounting). These value weights are as subjective astreating all ages and all future years equaly and have been criticised.

4
also weight duration non-linearly, so as to give priority to fewer people suffering for long
intervals over more people suffering for shorter intervals.4
In summary, the disabilit-adjusted life year is an indicator of the time lived with a disability
and the time lost due to premature mortality. The duration of time lost due to premature mortality is
calculated using standard expected years of life lost with model life-tables. The reduction in physical
capacity due to morbidity is measured using disability weights. The value of time lived at different ages
has been calculated using an exponential function which reflects the dependence of the young and the
elderly on the adults. Streams of time have been discounted at 3 percent. Accordingly the number of
DALYs lost due to disability at age "x" can be calculated using the following formula:
DALYs(x) = (D)(Cxe-fi)(e-r(x-a))
If the person lives up to the maximum of his life expectancy with disability, we need to add up
the total number of DALYs lost from the onset of disability (a) to the age of death (a+L). The
following formula can be used:
DxO. 1 6243x2. 7J(O. 04Xa)IDALY~_[ ( + 0.03x )2 ]x[(2. 71 )(0 04+0. 03)xL x(l + (0.04 + 0.03)x(L + a))- (1 + (0. 03 + 0. 04)xa]
- (0.04+ 0.03)
Where:
L = Years of life left at age "a"D = Disability weight (ranging from 1 death to 0 for perfect health).
Procedure to Calculate DALYs
The following examples illustrate how the formula to calculate DALYs is applied. This section
is based on the examples presented in the manual "Selecting an Essential Packages of Health Services
Using Cost-Effectiveness Analysis" (Data for Decision Making, 1993: pages 16 - 20). Taking into
account that each health problem results in four possible outcomes (death, disability before death,
permanent disability, or full recovery), we will calculate the number of DALYs lost for each one of
these four scenarios.
4 This judgement is reflected in the "Oregon plan" for reforming the state's Medicaid systenL

5
Case of Disease
Death DisabifityhBefore Permanent Disability Recovery
We will represent each outcome in an hypothetical life horizon between the onset of disease
and the resulting health outcome. The axis indicates the number of years an individual is expected to
live.
The exarnple corresponds to a female child who contracts poliomyelitis at age five. As a result
she can die; she can live for a period of 5 years and then die; she can be permanently disabled; or she
can recover after a period of disability. Lets assume that the horizon of life (total) is 82.95 years, when
she got sick at 5 she still had 77.95 years of life left. We will assume that the disability weight in her
case is 0.5.
Case 1: DAL Ys Lost Due to Immediate Death
The horizon for this case is:
Death… I…--------------------------------------------------------…
0 5 77.95
We have the following information:
C = 0. 16243.D = 1 (This is because the person dies, in case of disability it is 0.5).r = 0.03 (Discount rate of 3 percent).13 0.04 (Value fixed by experts, see World Health Organization, 1994).a =5 (Year of death).
6
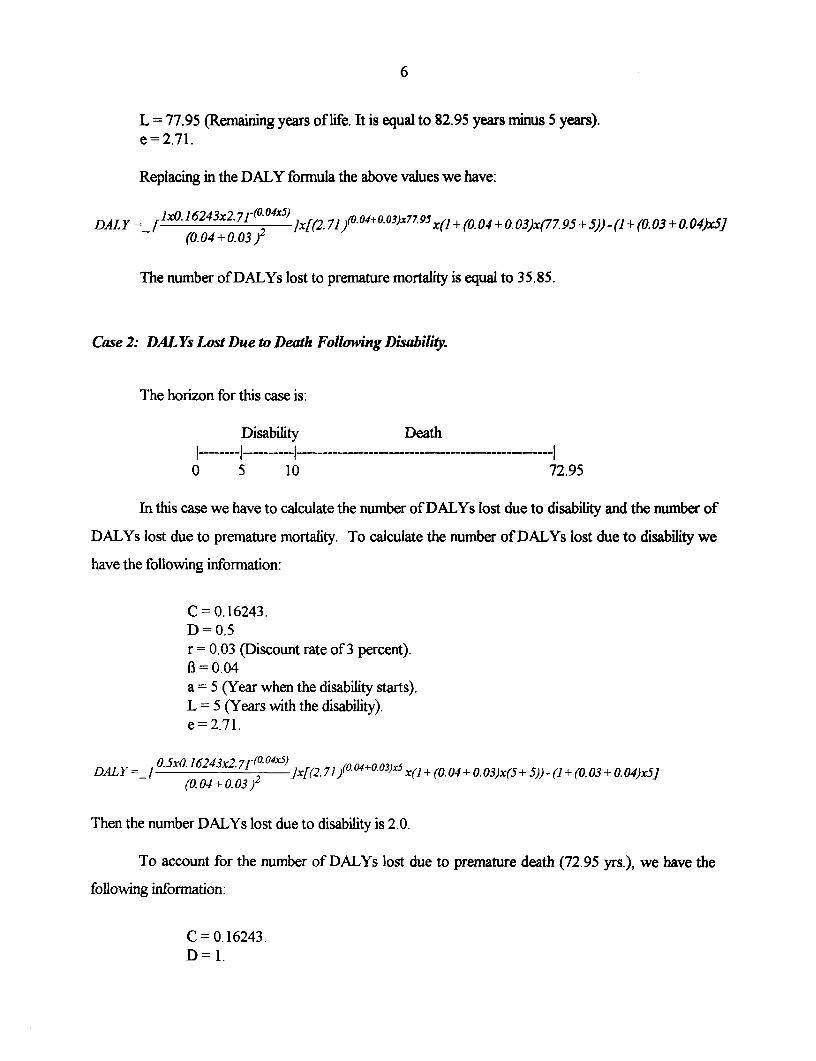
L = 77.95 (Remaining years of life. It is equal to 82.95 years minus 5 years).e=2.71.
Replacing in the DALY formula the above values we have:
DALY ~ixO. 1 6243x2. 7J40.044 xS) .1(.4+00)7 9 ( lxO(0.043+0.03)2 ]x(2 7])O 04+0 03)x7 9 x(J + (0. 04 + 0.03)x(77.95 + 5)) -(1 + (0.03 + 0.04)x5]
The number of DALYs lost to premature mortality is equal to 35.85.
Case 2: DAL Ys Lost Due to Death Following Disability.
The horizon for this case is:
Disability Death… I… I…----…------I--------------------------------------------------…
0 5 10 72.95
In this case we have to calculate the number of DALYs lost due to disability and the number of
DALYs lost due to premature mortality. To calculate the number of DALYs lost due to disability we
have the following information:
C = 0.16243.D =0.5r = 0.03 (Discount rate of 3 percent).13=0.04a = 5 (Year when the disability starts).L =5 (Years with the disability).e=2.71.
DALY=[ 0.5xO. 16243r2. 7l-(. 4x5)]x[(2. 71 )(O 4+0.03)x5 x(l + (0.04 + 0. 03)x(5 + 5))- (I + (0.03 + 0. 04)x5I
Then the number DALYs lost due to disability is 2.0.
To account for the number of DALYs lost due to premature death (72.95 yrs.), we have the
following information:
C = 0. 16243.D =1.

7
r=0.03B=0.04a 10 (Year when the person dies).L = 72.95 (Potential years of life left at time of death).e =2.71.
DAY=rx0.16243x2. 7r(o. 0 4x1 0) 0+.3x29 ( 0DA1Y=_ (0. 04 + 0.03)2 ]4x(2 71)(0"+0. 3)X72.95 X+ (0.04 + 0.03)x(72.95 + 10)) - (I + (0.03 + 0.04)xl 0]
The number of DALYs lost due to premature death are 36.85 years. Here there is an important
point to take into account. Those 36.85 years are the DALYs calculated at the age of 10; to add them
up with the DALYs lost due to disability calculated at age of onset (5 years), we have to convert the
36.85 DALYs calculated at age 10 to their value at the age of onset of the disease, that is at age 5. This
can be done using the following formula:
DALY at age of x = DALY(J0) e-rs
The variables in the formula have been defined previously, except for "s" which is the number
of years we have to discount (age of 10 minus age of 5). Applying the formula we have:
DALYat the age of 5= 3685 x(2. 71)(-003x(10-5)) = 31.7
That is, at the time of the onset of the disease (5), the number of DALYs lost due to premature
mortality at age 10 equals the number of DALYs lost at age 10 (36.85) times 0.86, which is 31.7 years.
In summary, the total number of DALYs lost due to a period of disability followed by death
equals the number of DALYs lost to disability (ii) plus the number of DALYs lost to premature death
(31.7), that is 33.7 DALYs.

8
Case 3: DALYs Lost Due to Permanent Disability.
The horizon for this case is:
Disability
…---------…--------------------------------------…- --0 5 77.95
We have the following information:
C = 0. 16243.D =0.5r 0.03 (Discount rate of 3 percent).13= 0.04a =5 (Year of onset).L 77.95 (Remaining years of life. It is equal to 82.95 years minus 5 years).e 2.71.
Replacing in the formula the above values we have:
DALY 0. xO.. 16243x2 7 (0 045]x[( 2 71 (o4+O.O3)x779S x(1 + (0. 04 + 0.03)x(77.95 + 5)) -(1 + (0.03 + 0.04)x5](0.04+ 0.03)2
The total number of DALYs lost due to permanent disability equals to 17.92.
Case 4: DAL Ys Lost Due to Disability Followed by Complete Recovery.
The horizon for this case is:
Disability Healthyl---------I--------I------------------------------------------l
0 5 10 77.95
We have the following data:
C = 0. 16243.D=0.5r=0.03

9
B =0.04
a=5.L =5 (number of years with disability).e=2.71.
Replacing the above values in the DALY formula we have:
DALY=_[ 0.5x0.16243x2-7r-(0° 04X5) jx[(2. 71J)(0 4+003)x5x(1 + (0. 04 + 0.03)x(5+ 5)) - ( + (0.03 + 0.04)xS]DAL-=[ (0.04+ 0.03)2
The number of DALYs lost to disability equal to 2.0 years.
To calculate the total number of DALYs lost due to poliomyelitis in a community we have to
add the number of DALYs lost by each individual. Lets imagine that in a particular community there is
a total of 20 female children who contract poliomyelitis, all of them at age 5, and that 4 of them die
immediately, 4 die at age 10 after a 5-year period of disability, 4 of them are permanently disabled, and
4 recover completely after a disability period of 5 years. In this case the total number of DALYs lost in
that community due to poliomyelitis equals to:
TotalDALYslost = 5x(35.85) + Sx(33.7) + Sx17.92 + Sx2 = 447.4
Data Needed to Estimate the Burden of Disease
* Cause of death patterns by age and gender are needed to calculate the years of life lost to
premature death. Worldwide, only about 30-35 percent of all deaths are captured by vital
registration. For the remainder, cause of death structure as a function of the level of
mortality can provide broad cause-of-death groups. Such methods are generally unreliable
for more specific causes.
* To measure the time lived with a disability in a manner that can be meaningfUlly compared
with the time lost due to premature mortality, there is a need for the following data: (i) age
and gender specific information on the incidence of disease, (i) the proportion of
disease incidence leading to a disabling outcome, (Iii) the average age of disability

10
onset the duration of disability, and (iv) the distribution of disability across the six
classes of disability severity. In most cases this data is unavailable and researchers are
forced to rely on estimates, many of which are uncertain. There are two important sources
of error: (i) some disabilities might have been omitted, which would give a downward bias
to our estimates of the years lived with disability, and (ii) the computations do not take into
account comorbidity (an individual experiencing multiple illnesses) and biases the results
upwards. The fact that individuals can have more than one disability of the same or
different classes at the same time can not be ignored. Presumably, several class 1
disabilities may combine to raise someone's total disability severity to a higher class.
However, the effect of three distinct class 1 disability will not be to triple the disability
severity weight for the individual.5 In addition, the magnitude of the overestimation due to
comorbidity will be greater if the probabilities of getting different disabilities are dependent
on each other (for example, a diabetic has an increased risk of blindness, angina pectoris,
amputation, neuropathy and renal failure).
Cost-Effectiveness
Because cost-effectiveness analysis is based on gains associated with health interventions, the
next step is to identify appropriate health services and to estimate their effectiveness in reducing disease
burden. Cost-effectiveness shifts the focus decisively from individuals, or groups, to interventions. For
each disease category, a range of possible interventions needs to be identified. The WDR reported on
26 major health problems and 57 interventions. To select a set of interventions to be evaluated using
cost-effectiveness analysis, the following factors need to be considered: (i) standard of best practice; (ii)
health care infrastructure and organization; (iii) focus on prevention or treatment; (iv) potential for
clustering interventions, some health interventions give rise to multiple health benefits; (v) feasibility
and acceptability of interventions; (vi) potential cost of interventions and alternative strategies; and
(vii) the effectiveness of the strategy in reducing the disease burden.
5 Anand and Janson (1995)argue that because of the disease, and not the individual, specific esimation of the diseaseburden, an individual can turn out to have a cumulative disability weight greater than 1. This would represent a level offunctioning even more limited than that assocated with death.

11
Where treatment is possible-whether preventive, curative or palliative-the effectiveness of
the intervention is the reduction in disease burden which the treatment produces. An intervention can
reduce the burden through any of the following mechanisms: (i) changing the disease incidence, (ii) the
probability of developing disabling sequelae; (iii) the duration of the disability, and (iv) the severity of
the disability (including death). The first three treatment effects are already included in the formula.
Changes in the severity of disability or the distribution of disabilities across the six classes owing to
treatment has not so far been captured.
The DALY indicator allows one to measure the effectiveness of different interventions at
reducing the disease burden due to a particular condition, as well as permits one to compare the
effectiveness across interventions which treat different problems and produce different outcomes.
These comparisons show that interventions differ enormously in how much they cost and how much
they can improve health. Individual interventions can differ in cost from less than one dollar to more
than $10,000. There is little correlation between what an intervention costs and how much additional
health it provides. An intervention which saves one person's life and prevents infection of others can
gain between ten and 100 years of healthy life, whereas the improvement from some other
interventions may amount to only a few hours or days of complete health. The ratio of cost to health
gain is the cost-effectiveness of the intervention, expressed as dollars per DALY.
This criterion does not coincide with any of several criteria which are sometimes applied to
determine priorities, such as: (i) the incidence or number of people affected; (ii) the individual
suffering, or disease burden per person affected; (iii) the amount of total good that an intervention can
do, or the redu.ction in burden possible; (iv) the cost per case of the intervention; or (v) the total cost of
helping everyone affected by the problem. It might be the case that only part of the disease burden can
be eliminated by the intervention in question, either because only some of the victims are appropriate
candidates for the intervention, or because the intervention is only partly effective. The cost-
effectiveness of the intervention should be calculated on the basis of the actual health gain (not the total
burden, which includes the uncorrectable part) and the actual costs.
12
Once cost-effectiveness ratios are calculated for each intervention, they can be ranked from the
most to the least cost-effective (largest ratios).6 One additional step is to cluster cost-effective
interventions into a package of services. The principal argument for clustering interventions is that it
improves cost-effectiveness through at least three mechanisms: (i) synergism between treatment and
prevention activities; (ii) joint production costs; and (iii) improved use of specialized resources.
The overall efficiency of a health system, the degree to which it produces value for money,
depends greatly on which interventions it delivers. However, it is important to take into account that
the inefficiencies in the health sector of most developing countries are not limited to the misallocation
of resources (allocative inefficiencies). The combination of inputs used in the delivery of service
(technical efficiency) is also very important. Finally, other aspects of sector management such as
inappropriate management of human and physical resources, personnel attitudes, absence of quality
assurance programs, absence of accreditation systems, inappropriate information systems, etc., have a
tremendous impact on sector efficiency.
Data Needed to Estimate Cost-Effectiveness
The cost of an intervention is a function of: (i) the quantity, type, and quality of inputs used;7
and (ii) the price of those inputs.8 Because personnel and equipment are frequently shared among
health services within the same facility, it is necessary to derive rules-of-thumb for allocating a portion
of input cost to specific health interventions. Unfortunately, there is no universally used framework to
evaluate the costs of health services.
6 The decision rule which needs to be employed for selecting the essential package of semvices is based on the marginalcost per DALY gained.
7 The type and amount of inputs needed for an intervention can be gathered from a survey in a sample of facilities whichprovide a model for best possible practice of the intervention in a region. Another alternative is to use infonnation fromneighbouring countries. Using expert opinions tends to be very imprecise. Since the quality of inputs may be related toprices, it is important to ensure that a constant level of quality is compared across interventions.
8 The price of the inputs has to be based on market prices. Market prices can be based on the original purchase price(historical value) or the replacement price based on market surveys. The latter alternative is preferred.

13
As mentioned earlier, in order to calculate the number of DALYs gained from health
interventions, the impact of each intervention in reducing disease burden must be estimated. The
effectiveness of a health intervention depends on: (i) efficacy of the technology used; (ii) diagnostic
accuracy; (iii) compliance of health care providers; and, (iv) compliance of patients. Since few empirical
studies have evaluated the effectiveness of interventions in various settings, this aspect of the cost-
effectiveness exercise is very subjective, most effectiveness estimates are based on opinions and
judgments of health professionals.
Conclusion
Estimating the costs and impact, in terms of reducing the burden of disease, of health
interventions has a tremendous potential for amp1ifying and diversifying the health policy debate, and
can advance thinking on how to maximize the use of available health resources.
Burden of disease and cost-effectiveness can assist governments in deciding (i) which
interventions to finance, priority to cheap DALYs; (ii) how much to subsidize different interventions
(full versus partial subsidy); and (iii) whom to buy the interventions for (never finance interventions for
the non-poor if they are not being financed for the poor). Another major role for government is to
assist private purchasers (whether individuals, medical professionals or insurers) in improving allocative
decisions, even where no public funds are involved.
However, it is important to recognize that the methods currently available to conduct cost-
effectiveness studies are far from perfect, they require large amounts of resources, and incorporate
value choices that have political, economical and ethical implications. Another aspect worth
mentioning is that while cost-effectiveness is a criterion for allocating resources, it is not a complete
system for enforcing allocative efficiency. Both health professionals and consumers should remain free
to spend their own resources to purchase non cost-effective interventions.

14
The problems that researchers have identified with the WRD methodology, some of which are
being addressed, include:
* The need to expand and improve the list of diseases included in the burden of disease
exercises.
* The need to improve and validate the method to measure the time lived with
disabilities of different severity's.
* The lack of methods to adjust for both dependent and independent comorbidity.
* The inability to quantify the contribution of risk factors in total burden of disease.
* The lack of unit cost production functions to be used widely by researchers doing
cost-effectiveness studies.
- The need for more accurate monitoring systems to be able to generate real estimates
of mortality and disability by cause.
- The need of projection methods that incorporate known levels and trends of major
risk factors such as smoking and trends in other diseases.
The criticisms that have been made to the methodology include the following:
* Requires a lot of data that is not readily available;
* It is an expensive exercise;
e Decisions are made by a group of experts with little involvement of health care
providers, interest groups or beneficiaries;
* The methodology is very complicated and does not add much information to what
public health specialists already know;
* It discriminates against the elderly;
* The manner in which the information is manipulated is subjective;
* It is difficult to create demand for services that are cost-effective;
* The value choices that underlie the definition of the DALY are not universally
accepted;

15
* Political resistance to reallocation of resources is greater when the package is explicit
and published;
* The DALY does not reflect individuals' differential abilities to cope with their
functional limitations;
* The maxmization of the number of DALYS gained might not be the goal of the health
sector,
* Health interventions alone are not capable of raising the life expectancy of developing
countries to the level used in the DALY calculations; and
* Cost-effectiveness might not be the criteria to guide the type of services provided.

16
References
Anand, Sudhir and Kara Jonson. 1995. "Disability Adjusted Life Year: A Critical Review." HarvardCenter for Population and Development Studies Working Paper Series (95. 06). Harvard:Boston.
Bobadilla, J.L., P. Cowley, P. Musgrove, H. Saxenian. 1994. "The Essential Package of Services inDeveloping Countries." Population Health and Nutrition Background Paper Series (i).Washington: World Bank: Washington d.C.
Data for Decision Making. 1993. Selecting an Essential Package of Health Services Using Cost-Effectiveness Analysis: A Manual for Professionals in Developing Countries. HarvardUniversity in Consortium with Research Triangle Institute. Department of Population andInternational Health: Boston.
Musgrove, Philip. 1995. "Cost-Effectiveness and Health Reform." Human Resources Developmentand OperationsPolicyWorkingPaper(HROWP48).WorldBank: WashingtonD.C.
World Bank. 1993. World Development Report: Investing in Health. Washington: World Bank.
World Health Organization 1994. Global Comparative Assessments in the Health Sector. DiseaseBurden. Expenditures and Intervention Packages. in C.J.L. Murray and A. D. Lopez., eds.,World Health Organization: Switzerland.

Human Capital Development Working Paper Series
Contact forTitle Author Date paper
HROWP36 Poverty, Human Development Harsha Aturupane August 1994 P. Cookand Growth: An Emerging Paul Glewwe 30864Consensus? Paul Isenman
HROWP37 Getting the Most out of Helen Saxenian September 1994 0. ShoffnerPharmaceutical Expenditures 37023
HROWP38 Procurement of Denis Broun September 1994 0. ShoffnerPharmaceuticals in World 37023Bank Projects
HROWP39 Notes on Education and Harry Anthony Patrinos September 1994 I. ConachyEconomic Growth: Theory and 33669Evidence
HROWP40 Integrated Early Child Mary Eming Young October 1994 0. ShoffnerDevelopment: Challenges and 37023Opportunities
HROWP41 Labor Market Insurance and Deepak Lal October 1994 M. EspinosaSocial Safety Nets 37599
HROWP42 Institutional Development in Alberto de Capitani October 1994 S. HowardThird World Countries: The Douglass C. North 30877Role of the World Bank
HROWP43 Public and Private Secondary Marlaine E. Lockheed November 1994 M. VerbeeckSchools in Developing Emmanuel Jimenez 34821Countries
HROWP44 Integrated Approaches to T. Paul Schultz November 1994 M. EspinosaHuman Resource Development 37599
HROWP45 The Costs of Discrimination in Harry Anthony Patrinos November 1994 I. ConachyLatin America 33669
HROWP46 Physician Behavioral Nguyen X. Nguyen December 1994 M. EspinosaResponse to Price Control 37599
HROWP47 Evaluation of Integrated T. Paul Schultz January 1995 M. EspinosaHuman Resource Programs 37599
HROWP48 Cost-Effectiveness and Health Philip Musgrove January 1995 0. ShoffnerSector Reform 37023
HROWP49 Egypt: Recent Changes in Susan H. Cochrane February 1995 0. ShoffnerPopulation Growth Ernest E. Massiah 37023
HROWP50 Literacy and Primary Kowsar P. Chowdhury February 1995 M. EspinosaEducation 37599
HROWP51 Incentives and Provider Howard Barnum March 1995 0. ShoffnerPayment Methods Joseph Kutzin 37023
Helen Saxenian
HROWP52 Human Capital and Poverty Gary S. Becker March 1995 M. EspinosaAlleviation 37599
HROWP53 Technology, Development, and Carl Dahlman April 1995 M. Espinosathe Role of the World Bank 37599

Human Capital Development Working Paper Series
Contact forTitle Author Date paper
HROWP54 Intemational Migration: Sharon Stanton Russell May 1995 0. ShoffnerImplications for the World 37023Bank
HROWP55 Swimming Against the Tide: Nancy Birdsall May 1995 A. ColbertStrategies for Improving Equity Robert Hecht 34479in Health
HROWP56 Child Labor: Issues, Causes Faraaz Siddiqi June 1995 I Conachyand Interventions Harry Anthony Patrinos 33669
HCOWP57 A Successful Approach to Roberto Gonzales July 1995 K. SchraderPartcipation: The World Bank's Cofino 82736Relationship with South Africa
HCOWP58 Protecting the Poor During K. Subbarao July 1995 K. LabrieAdjustment and Transitions Jeanine Braithwaite 31001
Jyotsna Jalan
HCOWP59 Mismatch of Need, Demand Philip Musgrove August 1995 Y. Attkinsand Supply of Services: 35558Picturing Different WaysHealth Systems can go Wrong
HCOWP60 An Incomplete Educational Armando Montenegro August 1995 M. BennetReform: The Case of 80086Colombia
HCOWP61 Education with and with out the Edwin G. West September, 1995 M. EspinosaState. 37599
HCOWP62 Interactive Technology and Michael Crawford October 1995 P. WarrickElectronic Networks in Higher Thomas Eisemon 34181Education and Research: Lauritz Holm-NielsenIssues & Innovations
HCOWP63 The Profitability of Investment George Psacharopoulos December 1995 M. Espinosain Education: Concepts and 37599Methods
HCDWP64 Education Vouchers in Practice Edwin G. West February 1996 M. Espinosaand Principle: A World Survey 37599
HCDWP65 Is There a Case for Antonio Zabalza March 1996 M. EspinosaGovernment Intervention in 37599Training?
HCDWP66 Voucher Program for Alberto Calder6n Z. May 1996 M. EspinosaSecondary Schools: The 37599Colombian Experience
HCDWP67 NGO-World Bank Toshiko Hino June 1996 A. ThomasPartnerships: A Tale of Two 31151Projects
HCDWP68 The Disability-Adjusted Life Nuria Homedes July 1996 L. AriasYear (DALY): Definition, 35743Measurement and PotentialUse
Top Related